KFF designs, conducts and analyzes original public opinion and survey research on Americans’ attitudes, knowledge, and experiences with the health care system to help amplify the public’s voice in major national debates.
SAN FRANCISCO, Calif. & CHICAGO, Il. — KFF (Kaiser Family Foundation) and Public Road Productions announce that Season 2 of An Arm and A Leg podcast will be co-produced in partnership with Kaiser Health News (KHN), KFF’s editorially independent national health and health policy newsroom.
KHN will co-produce the second season of An Arm and A Leg, which debuts June 4. In the first season of the podcast, Dan Weissmann, creator and host of the health care podcast, dug up revealing and surprising stories that helped consumers learn more about the complicated world of health care costs. In season two, Weissmann digs into how we’ve ended up with such crazy prices— starting with hospital services like an MRI, prescription drugs in general, and the deep story behind the insane price of insulin, starting with its discovery almost 100 years ago. This season is a public conversation, starting with stories, tips and questions from listeners.
Weissmann is a veteran reporter for outlets like Marketplace, 99% Invisible, Planet Money, and Chicago’s WBEZ. His work reflects sophisticated reporting, an engaging narrative voice, and a knack for accurate breakdowns of complex subjects.
Through this partnership, KHN and Weissmann will share expertise and resources to explore and explain our often puzzling health care system in season 2. KHN will also produce stories and other multimedia content building on the themes and stories featured in the season’s episodes. An Arm and A Leg episodes are available for free on Apple Podcasts, Google Podcasts, Pocket Casts, and Spotify, as well as at KHN.org. Check out the trailer for Season 2, and follow the show on social at @armandalegshow.
“I’m delighted and proud to get the chance to partner with these journalists whose work I admire, and from whom I’ve already learned so much,” said Weissmann.
“We’re excited to pair KHN’s health reporting expertise with An Arm and a Leg’s creative and powerful storytelling capacity,” said Drew Altman, KFF’s CEO and KHN’s founding publisher. “This new partnership plays to both our and Public Road’s strengths and will help us each produce more impactful journalism that reaches a wider audience than either of us could alone.”
About An Arm and A Leg:
Dan Weissmann designed An Arm and A Leg to be entertaining, empowering and even useful — to help us all get a bit less scared and confused by the crazy cost of health care. The second season is a public conversation, starting with stories, tips and questions from listeners. Follow the show on social at @armandalegshow.
About The Henry J. Kaiser Family Foundation and Kaiser Health News:
Filling the need for trusted information on national health issues, KFF (the Kaiser Family Foundation) is a nonprofit organization based in San Francisco, California. KHN is an editorially independent program of KFF and is the nation’s leading and largest health and health policy newsroom, producing stories that run on kffhealthnews.org and are published by hundreds of news organizations across the country.
Many Democratic presidential candidates are voicing support for Medicare-for-all, a national health plan that would cover all U.S. residents. At the same time, other candidates support proposals that sound like Medicare-for-all but are actually quite different and more incremental.
In this May 2019 post for The JAMA forum, Larry Levitt examines how the early discussion and positioning among the presidential candidates offers a glimpse into how a debate about Medicare-for-all might play out.
Other contributions to The JAMA Forum are also available.
Note: A Spanish-language version of this document is available here.
This brief provides an overview of the status of the health care systems and Medicaid programs in Puerto Rico and the U.S. Virgin Islands (USVI) about one and a half years after Hurricanes Irma and Maria struck the islands in September 2017. The hurricanes exacerbated the territories’ existing economic and health care challenges by accelerating outmigration of residents and health care providers and destroying homes, schools, health care facilities, and other infrastructure. After the storms, the territories’ Medicaid programs have served as important resources for addressing residents’ health care needs, but they have operated under longstanding financing challenges. This brief focuses on these challenges and includes KFF analysis of the implications for the territories’ Medicaid program finances, as most of the temporary federal Medicaid funds provided through the Affordable Care Act (ACA) and disaster relief are set to expire at the end of September 2019. The other U.S. territories (American Samoa, the Commonwealth of the Northern Mariana Islands, and Guam) also face challenges tied to the scheduled expiration of ACA funds. This brief draws on earlier work as well as recent public reports and on-the-ground interviews with territory officials, providers, Puerto Rico health plans, and enrollees.
Key Highlights: Medicaid Financing Cliff Implications for Puerto Rico and USVI
Temporary Medicaid funds from the ACA and the Bipartisan Budget Act of 2018 (BBA) have provided critical health care support to Puerto Rico and USVI, but the vast majority of these funds expire at the end of September 2019.
Despite an increase in temporary federal Medicaid funds, the Puerto Rico and USVI health care systems are fragile and in transition, while residents struggle with substantial mental health and other health needs.
The expiration of temporary federal Medicaid funds without legislation to provide additional funds would result in significant funding shortfalls and have severe consequences for territory budgets, coverage, and health care systems more broadly.
Options for Congress to address the Medicaid financing issues in Puerto Rico and USVI include raising or eliminating the cap on financing and maintaining or increasing the federal matching rate (federal medical assistance percentage, or FMAP).
Key Findings
Temporary federal Medicaid funds from the ACA and the BBA have provided critical health care support to Puerto Rico and USVI, but the vast majority of these funds expire at the end of September 2019. Unlike states, Puerto Rico and USVI receive capped federal Medicaid funds and a fixed FMAP (55%) that is substantially lower than the 83% rate based on per capita income that they would receive if they were states. ACA funds have comprised a significant share of the two territories’ overall Medicaid funding since 2011, and the post-hurricane BBA provided additional Medicaid support and temporarily eliminated Puerto Rico and USVI’s local shares of Medicaid expenditures. Longstanding economic and health care challenges that predated the hurricanes worsened post-storms. The territories have used the ACA and BBA funds to relieve pressure on local budgets for Medicaid, to expand and support coverage, and to address health system deficiencies through enhanced reimbursement rates for providers, expanded clinic capacity, and infrastructure improvements.
Despite an increase in temporary federal Medicaid funds, the Puerto Rico and USVI health care systems are fragile and in transition, while residents struggle with substantial mental health and other health needs. Some health care infrastructure, particularly USVI’s hospitals and Department of Health clinics and the facilities on Puerto Rico’s offshore islands, still have not recovered fully from the hurricanes. In addition to physical health care facilities, the storms exacerbated long-standing issues with provider recruitment and retention. Both territories struggle to address residents’ mental health needs, which worsened and remain elevated after the hurricanes. While still working on hurricane recovery, the territories are also moving ahead with delivery system reforms. Puerto Rico is engaged in major managed care and delivery system reforms, which have caused challenges for managed care organizations (MCOs), providers, and enrollees in their rollout period. Initiatives to focus on “high-need, high-cost” populations typically require upfront investments and greater standardization by plans and providers to generate long-term results. In USVI, territory leaders are engaged in ongoing efforts to improve care, particularly behavioral health services and care coordination.
If Puerto Rico reverted to pre-ACA Medicaid financing after most temporary Medicaid funds expire at the end of Sept. 2019, available funds would fall short of projected costs by $1B in FY 2020 and $1.5B in FY 2021.
The expiration of temporary federal Medicaid funds without legislation to provide additional funds would result in significant funding shortfalls and have severe consequences for territory budgets, coverage, and health care systems more broadly. The local governments in Puerto Rico and USVI would not be able to make up for lost federal funds and therefore would not be able to sustain current service levels. Some territory officials and providers described the potential effects of the funding expiration as “devastating,” “catastrophic,” and “scary.” Assuming a return to federal funding limited to the statutory cap and a 55% FMAP after remaining ACA funds expire, Puerto Rico could experience a shortfall of $1 billion in FY 2020 and $1.5 billion in FY 2021 (representing 36% and 52% of projected total spending, respectively). Estimates prepared by the Medicaid and CHIP Payment and Access Commission (MACPAC) show that such funding shortfalls could trigger coverage losses of one-third to one-half of current enrollment levels in Puerto Rico of about 1.2 million people. Federal shortfalls could reach $31.3 million in USVI, or 40% of program spending. USVI Medicaid officials assert that such shortfalls could put the 18,000 enrollees added under the ACA expansion at risk for loss of coverage (out of nearly 28,000 total enrollees).1 In both territories, lack of additional funds would exacerbate challenges with provider recruitment and retention, and uncertainty around the availability and amount of federal support has already hampered the territories’ ability to move forward with health care reforms.
Congress could consider options to address the funding shortfall under current projections as well as to provide additional funds by raising the FMAP or the cap (or both). Estimates of the funding shortfall reflect current projections for program and territory spending at the 55% FMAP. KFF analysis shows that, for Puerto Rico, additional federal funding of $2.8 billion in FY 2021 could help address the projected shortfall ($1.5 billion), increase the FMAP to 83%, and increase per member per month (PMPM) rates by 50% (an additional $1.3 billion for the FMAP and PMPM increases). For USVI, KFF analysis shows that addressing the shortfall and raising the FMAP to 83% could provide $45.9 million in federal funds, while additional funds could support an increase in the statutory cap. Raising the FMAP could reduce the share required by the territories to access federal funds, while increasing the cap beyond projected program levels could help address gaps in benefits and increase provider reimbursement rates. Options that would address funding for a longer period (or a permanent solution) could provide longer-term stability for the territories’ health care systems and avoid year-to-year solutions that result in funding cliffs and uncertainty.
Next steps for Congress may include consideration of near-term fiscal support to Medicaid programs in the territories while continuing exploration of long-term, more permanent financing changes. On May 1, 2019, Puerto Rico Governor Ricardo Rosselló submitted a letter to Congress requesting $15.1 billion in federal Medicaid funds at an 83% FMAP over the next five years. The request states that the funds would provide stability for Puerto Rico to move forward with delivery system reforms and measures intended to stem provider outmigration and improve access to services while policymakers work on longer-term financing reforms. Uncertainty over funding contributes to instability in the territories’ health care systems by requiring administrative resources to establish contingency plans, creating confusion for providers and enrollees, and limiting the territories’ abilities to move forward with complex delivery system reforms. Governors across the territories have called for more adequate and permanent federal Medicaid support, and the territories’ nonvoting elected delegates to Congress have introduced legislation that would allow the territories to receive similar treatment for Medicaid as the states without a statutory Medicaid financing cap and with an FMAP calculation based on per capita income as in the states.
Issue Brief
Introduction
This brief provides an overview of the status of the health care systems and Medicaid programs in Puerto Rico and the U.S. Virgin Islands (USVI) about one and a half years after the storms. The brief focuses on these challenges and includes KFF analysis of the implications for the territories’ Medicaid program finances, as most of the temporary federal Medicaid funds provided through the Affordable Care Act (ACA) and disaster relief are set to expire at the end of September 2019. The brief draws on earlier work as well as recent public reports and on-the-ground interviews with territory officials, providers, Puerto Rico health plans, and enrollees.2
Background
Puerto Rico and USVI have historically experienced a range of health, health coverage, and health care infrastructure disparities compared to the states. In Puerto Rico, the population of 3.3 million3 has higher rates of fair/poor health, heart attack/heart disease, diabetes, and infant mortality than the United States overall. The USVI population of 107,0004 has higher rates of diabetes and infant mortality compared to the United States overall. In addition, 47% of Puerto Rico’s total population is enrolled in Medicaid, 13 percentage points higher than the rate of the highest state (New Mexico at 34%). In USVI, more than half of the population is uninsured (30%) or enrolled in Medicaid (22%), compared to the uninsured rates of Puerto Rico (7%) and the rest of the United States (12%). Furthermore, Puerto Rico and USVI suffer from health care infrastructure that is still in recovery following the hurricanes as well as ongoing provider outmigration, which has worsened after the storms.
Prior to the 2017 hurricanes, Puerto Rico and USVI faced longstanding economic challenges, including high rates of debt, poverty, and unemployment. In response to the debt crisis in Puerto Rico, Congress passed the Puerto Rico Oversight, Management and Economic Stability Act (PROMESA) in June 2016 to allow Puerto Rico to restructure its debts and manage its revenues and expenditures. PROMESA created the Financial Oversight and Management Board (FOMB), which in part requires Puerto Rico’s government to submit a fiscal plan that gains the FOMB’s approval. USVI has also faced financial challenges, as its economy declined by over 30% between 2008 and 2016, accompanied by population loss and job loss in certain industries.5 The September 2017 hurricanes exacerbated these challenges by accelerating outmigration of residents and health care providers and destroying homes, schools, businesses, and other infrastructure.
Unlike states, Puerto Rico and USVI receive capped federal Medicaid funds and a fixed federal Medicaid matching rate that is lower than the rate they would receive if they were states.The 50 states and D.C. receive federal Medicaid funding on an open-ended basis, with a federal matching rate (federal medical assistance percentage, or FMAP) that varies based on state per capita income. In contrast, annual federal Medicaid funding for the territories is subject to a statutory cap with a fixed FMAP of 55%. If Puerto Rico and USVI were treated as states, their FMAPs would be the maximum allowable rate of 83%.6 The funding caps leave the territories with significantly less funding than they need to operate their Medicaid programs. For example, if not for the temporary funds, Puerto Rico’s capped federal funds in fiscal year 2018 would have covered approximately 13% of the cost of its program.7 Puerto Rico and USVI also base Medicaid eligibility on local poverty levels rather than the federal poverty level, leading to lower income eligibility thresholds than exist in the states. In Puerto Rico, recent transition to modified adjusted gross income (MAGI) Medicaid eligibility determination methods mandated by the ACA have affected some individuals’ eligibility for Medicaid and caused them to lose coverage.
The federal government made additional Medicaid funds available for all territories under the Affordable Care Act (ACA) and for Puerto Rico and USVI after the hurricanes under the Bipartisan Budget Act of 2018 (BBA), but most of these funds are scheduled to expire at the end of September 2019. The ACA allotment consists of $6.3 billion available between July 2011 and September 2019 and another $1 billion, provided in lieu of the territories creating their own health insurance exchanges, which expires at the end of December 2019. Of these combined $7.3 billion, Puerto Rico received the large majority ($6.3 billion), and USVI received approximately $300 million. The BBA’s hurricane relief funds included $4.8 billion for Puerto Rico and $142.5 million for USVI. These BBA funds do not require a local match and will also expire at the end of September 2019. The expiration of ACA and BBA funds would return the territories to their pre-ACA funding levels with the 55% FMAP up to the statutory cap, beyond which point territories are fully responsible for program costs.
Key Findings
What is the role of federal Medicaid funds in the territories’ health care systems?
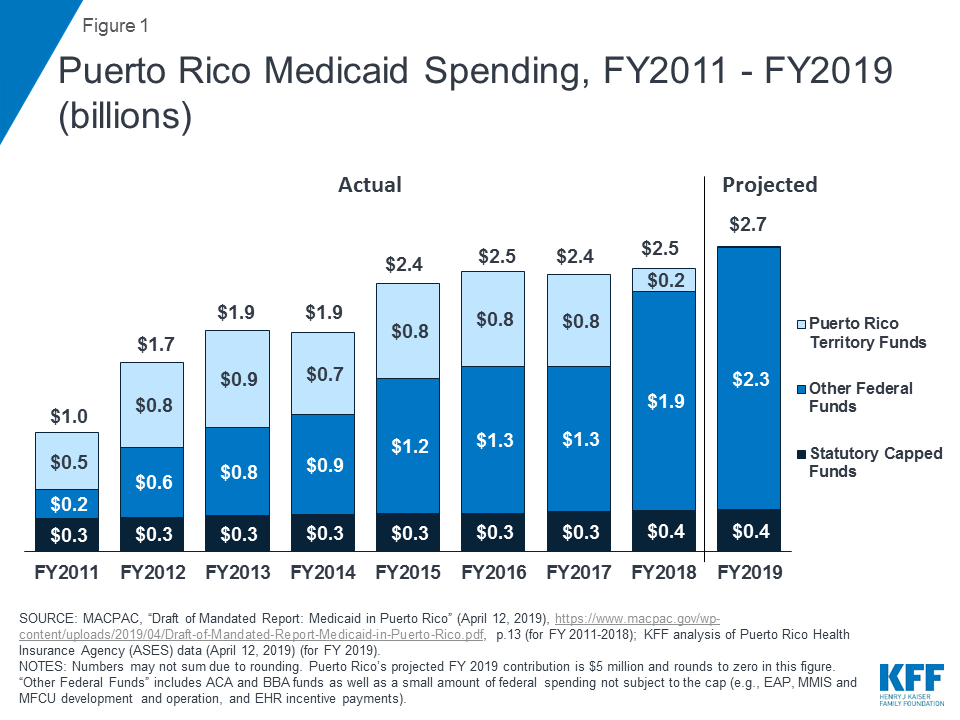
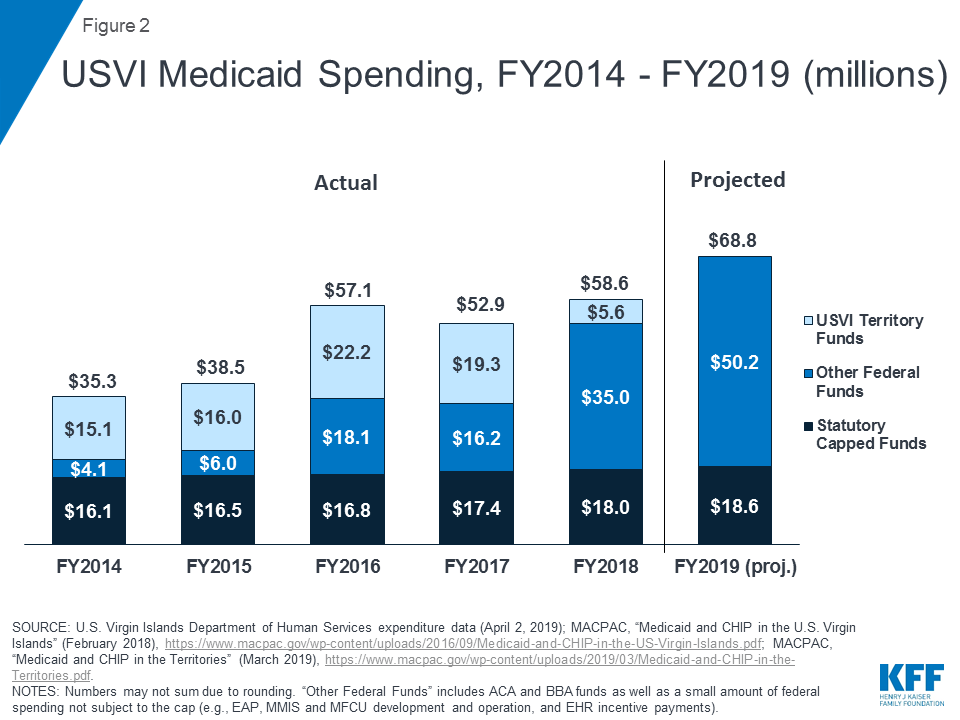
For both Puerto Rico and USVI, the ACA and BBA funds have been critical to supporting health care services and relieving pressure on local financing for Medicaid. Before receiving the federal funds, both territories had historically expended territory resources beyond the statutory cap to support their programs, placing strain on the local economies. Once ACA funds became available, the territories relied on these funds as a significant part of the federal support for their Medicaid programs (Figure 1; Figure 2). After the hurricanes hit in September 2017, the territories faced a spike in resident health care needs, loss of revenue with reduced tourism and economic activity, and damaged health care infrastructure. The BBA funds and temporary 100% FMAP thus provided crucial support for the territories’ Medicaid programs and health care systems, as constrained local resources made it difficult to finance the state share to access federal Medicaid dollars.
The territories have used temporary federal Medicaid funds from the ACA and BBA to expand and support coverage. Both Puerto Rico and USVI expanded Medicaid eligibility under the ACA, and enrollment increased further in the immediate aftermath of the hurricanes.8 In USVI, expanded Medicaid eligibility and outreach have more than doubled enrollment since 2013, to nearly 28,000 individuals as of March 2019.9 An estimated 20,000 individuals remain eligible but not enrolled in coverage.10 USVI has been conducting outreach to these individuals and trying to expand the use of presumptive eligibility to increase enrollment. While presumptive eligibility is effective in the short term, territory Medicaid officials and providers emphasized the need to ensure that individuals complete the full determination process to remain in the program and not lose coverage. Uninsured rates and uncompensated care burdens remain much higher in USVI compared to Puerto Rico, where Medicaid covers a larger share of the population.
Territory officials have also drawn on additional funds to support enhanced provider reimbursement rates, clinic capacity, and infrastructure improvements. Clinics in Puerto Rico rely heavily on Medicaid revenues, as do the safety net hospitals in USVI due to the territory’s high share of uninsured residents and corresponding high levels of uncompensated care. Medicaid makes up 51% of community health center revenues in Puerto Rico (compared to 45% in the United States overall), while federal Section 330 grants make up 31% (compared to 18%). With the additional federal funds, Puerto Rico officials have temporarily adjusted capitation rates to align more closely with Medicare rates, and USVI similarly increased provider reimbursement rates and improved recruitment activities, particularly for nurses. Higher reimbursement levels help to support salaries, additional clinic services, and infrastructure expansions. As a result, these increases also support the broader economy.
What is the status of the territories’ health care systems and delivery system reforms?
Even with additional federal Medicaid funding, territory health care infrastructure has still not fully recovered from the hurricanes, particularly in USVI. In Puerto Rico, infrastructure recovery issues are largely geographic, with the central island region and offshore islands of Vieques and Culebra facing the greatest challenges with provider availability and adequate facilities for dialysis and other services. In USVI, the hospitals have not returned to pre-storm capacity and are just beginning to rebuild. See Box 1 for more detail on the hospitals in USVI.
Box 1: Hospital Infrastructure Update in USVI
The main hospital on St. Thomas, Schneider Regional Medical Center, is operational for most services except for radiation oncology, as its damaged cancer center remains closed. However, Schneider’s average patient census has decreased by about 30% (from 65,000 to 45,000), and revenues are down by about 45% after the storms. The hospital still needs to transfer about 15-20 patients off-island daily to receive trauma, cancer, and cardiology services. After many delays, the hospital has received approval to move forward with a major long-term rebuilding of the hospital in its current location, which will occur in phases and is currently in its design phase.
Juan F. Luis Hospital on St. Croix suffered more extensive damage and is still awaiting a determination from FEMA about rebuilding. As of late February 2019, modular units designed to provide temporary emergency services and dialysis were nearing operational status after many delays. The modular units required expensive retrofitting and adjustments to receive certification that were difficult to complete with limited on-island resources. While dialysis units are operational and most patients have returned to St. Croix, dialysis patients still need other wrap-around services, including housing and transportation, for treatment to be successful.
Provider capacity remains a challenge in both Puerto Rico and USVI. The storms exacerbated long-standing issues with provider capacity in Puerto Rico and USVI. Due to the debt crisis and limited reimbursement before the hurricanes, provider outmigration has caused shortages in certain specialties as well as with nursing staff. The territories have tried to address these challenges by contracting with temporary staff, increasing reimbursement rates, improving local recruiting, maximizing use of certified medical assistants (in place of more expensive registered nurses and licensed practical nurses), and reforming licensing procedures. However, the territories’ inability to compete with the states on salary, limited availability of housing and schools, limited access to state-of-the-art health care infrastructure and technology, and uncertainty about the availability of federal funding support make it difficult to recruit and retain providers.
Mental health remains a critical area of need in Puerto Rico and USVI. Mental health in both territories remains a challenge, as increased post-storm needs put additional pressure on already-limited service capacity. In Puerto Rico, Medicaid enrollees described persistent post-hurricane anxiety and trauma along with long wait times for mental health referrals and appointments. USVI has limited psychiatric providers, with only one psychiatrist each on St. Thomas and St. Croix, no inpatient capacity for long-term mental health care, and limited outpatient services. A shortage of outpatient services makes it challenging to discharge patients with acute psychiatric episodes to a continuum of care in the community. In this environment, USVI behavioral health and substance use disorder services are operating under a governor’s consent decree. An advisory group meets weekly and includes providers and agencies such as the Departments of Health, Corrections, and Education. Improvement efforts include plans to find options for long-term services and to build a hospital-based behavioral health unit for transitional care. Clinics are working to expand access to mental health services through telehealth and use of licensed clinical social workers or physician assistants. Due to the major storm damage to USVI Department of Health facilities, other clinics have stepped in to address behavioral health needs.
Beyond mental health, the territories are experiencing other elevated health needs as well as demographic changes that could affect the size and profile of their Medicaid populations. Clinics in Puerto Rico reported exacerbation of the most common conditions they treat, particularly diabetes, cardiovascular disease, hypertension, and obesity. In USVI, these conditions are also among the common, as well as dental care needs, which are widespread as patients face a shortage of dentists participating in the territory’s Medicaid program. In Puerto Rico, recent trends and projections show an expected decline in Medicaid enrollment from 1.5 million to 1.2 million from 2017 to 2020 due to expiration of a delayed redetermination period, outmigration, economic recovery that may increase residents’ incomes enough to make them ineligible for Medicaid, transition to MAGI Medicaid eligibility determination methods, and some confusion stemming from the managed care reforms.11 Puerto Rico’s birth rate has also declined, with one Puerto Rico hospital that used to deliver over 300 babies a month reporting that 190 births now constitute a good month. Puerto Rico’s clinics also reported serving an increasingly elderly population and efforts to recruit more geriatric providers.
Providers and officials in both Puerto Rico and USVI described the need for broader health education. Providers indicated that many patients do not understand how to use preventive services and primary care or how to manage health conditions. Providers noted that more focus on health education could be necessary given the high prevalence of people suffering from obesity, diabetes, and dental caries. In Puerto Rico, the hospital that delivers the largest share of babies on the island reported working with the March of Dimes on patient education programs about prenatal and postnatal care. Some providers reported issues with patient compliance with treatment plans, due in part to limited capacity for case management activities as well as lack of patient education about need for follow-up. They described a focus on preventive and primary care and health literacy as some of the most important social determinants of health in their communities. In addition, some providers noted the high cost of fresh fruits and vegetables, contributing to preventable health conditions.
Against the backdrop of fiscal pressures and hurricane recovery efforts, both territories are engaged in delivery system reform efforts to address key access and financing issues. In Puerto Rico, managed care reforms, called Vital, rolled out in 2018 and aim to reduce health care spending and streamline administrative costs (Box 1). Reforms in USVI are broader than Medicaid and are designed to improve access and coordinated care. Many USVI reforms are occurring through various federal funding streams (e.g., grants from SAMHSA, CDC, and FEMA). These efforts include a new “Community Paramedicine Care” program for homebound patients, a Behavioral Health Steering Committee, and a care management working group. See Box 2 for more information on Puerto Rico’s managed care reforms.
Box 2: Managed Care Reforms in Puerto Rico
Managed care reforms in Puerto Rico include a transition from one in which one MCO operated in each of nine regions to the new system, called Vital. Under Vital, five MCOs compete for enrollees across the territory. Puerto Rico’s health insurance agency, ASES, promoted Vital as offering patients more plan options, improving access to providers through a territory-wide model, and lowering costs through competition and streamlined administration.
The managed care reforms are part of a larger set of reforms included in the fiscal plan that FOMB approved in October 2018, which imposes significant cuts to the Medicaid program. In March 2019, the FOMB revised the FY 2023 targets from $826 million to $671 million to avoid “undue hardship to the Medicaid population in the form of service reductions”; 12 however, the FOMB and Puerto Rico’s government continue discussions over the levels and implications of these targets. In addition to the transition to Vital, the fiscal plan calls for Medicaid cost containment measures such as reduced per member per month (PMPM) payments to MCOs; new care programs for high-cost, high-need (HCHN) enrollees; fraud and abuse reduction mechanisms; and provider fee reductions.13 Additional benefit cuts or increases in beneficiary copays could result if savings targets are not achieved.
Beginning with the start of open enrollment on November 1, 2018, Vital’s rollout in Puerto Rico has created challenges for MCOs. At the time of interviews for this report, patients were still able to move across plans after open enrollment ended on January 31, 2019. MCOs were uncertain of total capitation payments because they did not know which plans enrollees would choose and to which rate cells enrollees would be assigned. Because of this uncertainty, MCOs were unable to determine provider reimbursement rates. MCOs also described challenges with constructing territory-wide provider networks after having operated in one limited region for years and dedicating resources to build programs in new regions that may only have a handful of enrollees. MCOs reported feeling constrained by Vital’s 92% medical loss ratio (MLR) given requirements to expend resources on new care models for their HCHN enrollees; while the HCHN program may help to improve care and reduce costs over time, it requires upfront investments. More broadly, MCOs expressed concerns about goals to reduce costs, since PMPM rates are already low, and about meeting high patient expectations tied to the reforms.
Providers and enrollees have also experienced challenges with the rollout of Vital. For providers, these challenges included dealing with multiple MCOs, rates, and HCHN care models. Without knowing MCO reimbursement rates, it was difficult for clinics and hospitals to recruit clinicians. Providers also described uncertainty about their patients’ coverage status, and smaller providers, some without sophisticated IT systems, reported difficulty collecting patient encounter data (used by ASES to assign patients to the 37 new rate cells). Some smaller clinics banded together to address issues with contracting, reimbursement, and patient classifications. Enrollees expressed confusion related to auto-enrollment in new plans, ways to change plans to maintain existing providers, and new processes for obtaining referrals for specialist services or accessing prescriptions. Some enrollees may have lost their Medicaid benefits, thinking that choosing a new plan replaced the need to complete the redetermination process. ASES reported responding to these challenges by standardizing referral and prior authorization processes, streamlining eligibility redetermination processes, and making certain rate guarantees during the transition.
What are the potential consequences of no federal action to address the expiration of temporary federal Medicaid funds?
Expiration of temporary federal Medicaid funds is likely to result in fiscal pressures or substantial deficits for territories’ budgets. ACA and BBA funds have supported territory budgets and coverage, so expiration of these funds will result in significant fiscal gaps. Puerto Rico officials project that the return to traditional financing after September 2019 would mean that the territory’s federal funds for FY 2020 would run out by March or April 2020.14 Both territories have indicated that it would be impossible to use territory resources to make up for the lost federal funds. In anticipation of reduction in federal funds and the need to mitigate increases in local funding increases, the FOMB’s fiscal plan calls for spending reductions and reforms in Puerto Rico (see Box 2).
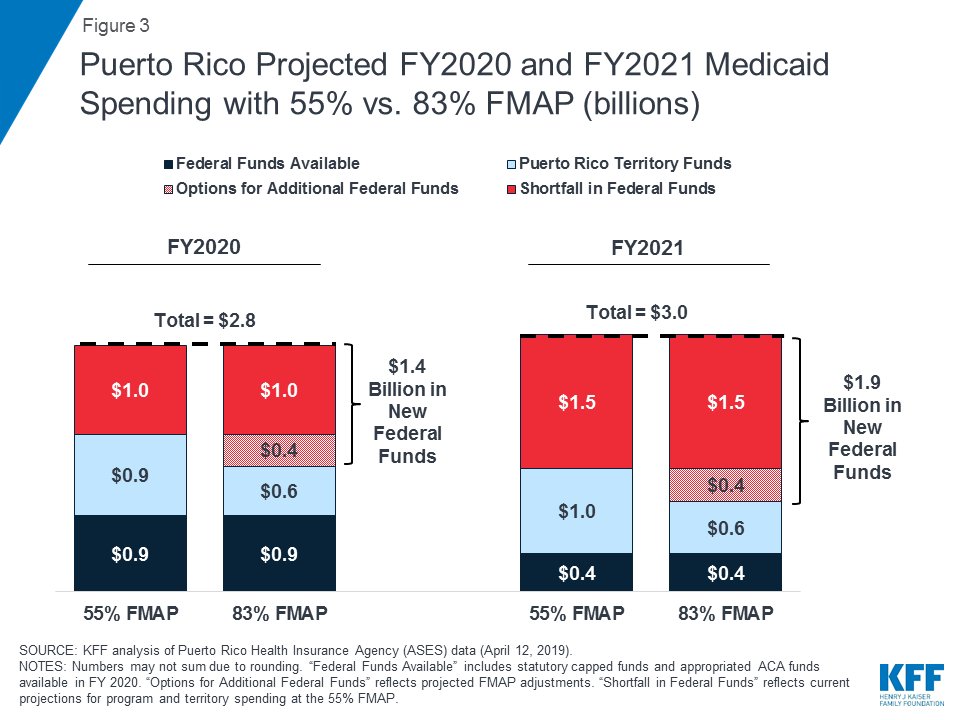
Projected FY 2020 and FY 2021 Medicaid expenditures show that, without additional federal funds, Puerto Rico and USVI would face funding shortfalls of one-third to one-half of program costs. For example, if Puerto Rico’s FMAP returned to 55% in October 2019 and the territory received no additional federal funds beyond the statutory cap and ACA funds remaining between September and December 2019, available funds would fall short of projected program costs by $1 billion in FY 2020 (Figure 3). In FY 2021, after all supplemental federal funds are set to expire, Puerto Rico would experience a shortfall of $1.5 billion, or half of projected program costs. In USVI, projected FY 2020 expenditures show that a return to traditional financing with the 55% FMAP would leave the territory with an approximately $31.3 million shortfall, about 40% of projected program costs (Figure 5).
Expiration of federal funds could lead to severe coverage losses, benefit cuts, and increases in uncompensated care. Territory officials expressed fear that they could not make up for the loss in expired federal funds with local funds, which would have severe implications for coverage, benefits, and providers. Some territory officials described the potential effects as “devastating,” “catastrophic,” and “scary.” MACPAC estimates project that, without additional federal funding, Puerto Rico would need to shrink total Medicaid enrollment of about 1.2 million by roughly one-third to one-half, depending on territory contributions,15 and territory officials predict large increases in the uninsured population. MACPAC estimates further show that even complete elimination of Puerto Rico’s coverage of dental services and prescription drugs (with drugs accounting for the largest share of the territory’s program costs) would not generate enough program savings to make up for the loss in federal funds.16 In USVI, the funding expiration could require the territory to cut up to 18,000 enrollees from a current member population of nearly 28,000.17 Across both territories, providers worry about loss of Medicaid revenues and increases in uncompensated care should the federal funds expire. For the safety net hospitals in USVI, funding expiration would be mean more uncompensated care and emergency room visits, straining their resources, threatening solvency, and risking potential hospital closure.
For Medicaid enrollees, loss of coverage would result in restricted access to health care services as well as financial instability. Medicaid enrollees in both territories described the importance of the program for their lives, health, and financial stability. Although some enrollees described challenges related to provider shortages, appointment wait times, and confusing referral procedures, they described Medicaid as “vital” and “the only option” for their health care coverage. Many enrollees in both Puerto Rico and USVI cited prescription drug access as one of their most critical needs and benefits of Medicaid coverage. Other services that enrollees cited as reasons for needing Medicaid coverage included mental health, screenings and preventative services, specialist and lab services, and emergency care. Some enrollees had heard rumors of potential funding cuts to the program and stated that, if they were to lose coverage as a result, they would be forced to take steps such as taking on a third job, paying health care costs out of pocket, or trying to use natural remedies. They noted that coverage loss would most seriously affect the elderly and people with health conditions, as those individuals often rely on Medicaid for management of chronic conditions.
Territory Medicaid agencies acknowledged the need for contingency plans in the event that federal funds expire, noting that these plans can lead to anxiety among enrollees and providers and divert focus from the implementation of new initiatives. Similar to the experience that many states encountered with the expiration of funds for CHIP in 2018, Medicaid agencies would need to expend administrative energy on developing notices to restrict benefits or coverage many months in advance of the funds expiring. These efforts could create confusion for enrollees, providers, and plans in Puerto Rico and increase outmigration, which would be unnecessary if Congress ultimately appropriates new funds. In the midst of this uncertainty, MCOs are still working to invest in their patient populations and implement programs for HCHN members. MCOs were working closely with Puerto Rico’s government to develop plans for the potential scenario in which they face insufficient funds to finance service delivery. In USVI, this planning for funding expiration runs counter to ongoing efforts to conduct enrollment outreach to those currently eligible but not participating in Medicaid.
What are the options for federal action?
Congress’s options for addressing the Medicaid financing issues in Puerto Rico and USVI (as well as the other territories) include raising or eliminating the funding cap and maintaining or increasing the FMAP. Raising the funding cap could include an option to add an additional allotment similar to the funding provided through the ACA or BBA. An increase in the FMAP could mean increasing the statutory FMAP or allowing the FMAP to be calculated based on per capita income as it is in the states. An 83% FMAP is the statutory maximum allowable FMAP and would reflect the lower per capita incomes in the territories. Congress would also decide whether additional federal financing is permanent or time-limited. The governors from the territories testified in front of the Senate Natural Resources Committee in February 2019 on the need for more adequate and permanent federal Medicaid support, describing the potentially “catastrophic damage” of the September 2019 fiscal cliff.
Specific options for Puerto Rico include proposed federal legislation as well as a request from the Governor. On May 1, 2019, Puerto Rico Governor Ricardo Rosselló sent a formal request to Congress for $15.1 billion in Medicaid funds over five years, subject to an 83% FMAP.18 In support of his request, Gov. Rosselló laid out five sustainability measures needed to stabilize Puerto Rico’s Medicaid program and health care system, noting that the requested funds would help implement these measures.19 These measures include provider retention, Hepatitis C medication therapy coverage, support for Puerto Rico’s hospitals, Medicare Part B premium coverage for dual eligible enrollees, and eligibility changes to address differences between local and federal poverty levels.20 Rosselló’s request emphasizes the need for multi-year funding to provide stability in Puerto Rico’s health care system, which would allow policymakers to work on longer-term financing reforms that could end the structural differences between state and territory Medicaid financing and reach parity in terms of uncapped funding. In addition, Rep. Jenniffer González-Colón of Puerto Rico introduced H.R. 2306, which would permanently eliminate the 55% FMAP starting in FY 2020 and increase the cap to $2.65 billion for both FY 2020 and FY 2021.
Other proposed legislation would address Medicaid financing for all five of the U.S. territories, including American Samoa, the Commonwealth of the Northern Mariana Islands, and Guam. For example, H.R. 1354, the Territories Health Equity Act of 2019, would provide a longer-term or permanent option to sunset the Medicaid financing cap and eliminate the 55% FMAP starting in FY 2020. Under H.R. 1354, the territories would receive uncapped federal Medicaid funds subject to an FMAP calculated as it is for states. Congress could also consider more narrow options to address the funding shortfall and/or FMAP, as well as other options to further increase federal support.
Estimates of federal options for puerto rico
Increasing federal funding to address the shortfall in program funding that would occur if financing returned to the statutory cap at a 55% FMAP, plus an increase in the FMAP to 83%, could provide $1.9 billion in additional federal funds to Puerto Rico in FY 2021. Projected FY 2020 and FY 2021 Medicaid expenditures show that, without additional federal funds, Puerto Rico would face funding shortfalls of $1 billion in FY 2020 and $1.5 billion in FY 2021, half of projected program costs. Estimates of these shortfalls reflect current projections for program and territory spending at the 55% FMAP. In addition to addressing the shortfalls with new federal funds, increasing the FMAP to 83%, the rate that Puerto Rico would receive if it were a state, would provide additional federal funds and reduce the required territory contributions. Addressing the shortfall in addition to increasing the FMAP to 83% would provide Puerto Rico with $1.4 billion in new federal dollars in FY 2020 and $1.9 billion in FY 2021 (Figure 3).
Figure 3: Puerto Rico Projected FY2020 and FY2021 Medicaid Spending with 55% vs. 83% FMAP (billions)
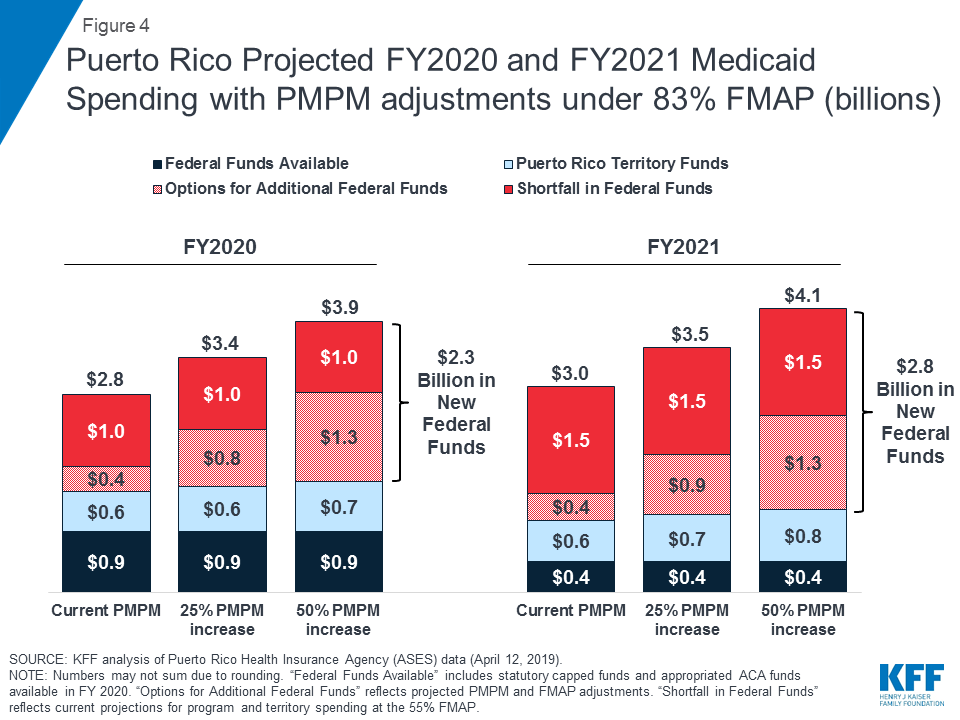
In addition to new federal funds to address the shortfalls and increase the FMAP, Congress could consider providing additional federal funds to enable Puerto Rico to address gaps in reimbursement or benefits. MACPAC analyses show that current per-enrollee spending in Puerto Rico is considerably lower than comparable spending in the states; Puerto Rico would need to increase its spending by 56% to match the per-enrollee spending of the lowest-spending state.21 With sufficient federal funding, Puerto Rico could increase its per-enrollee spending to improve low provider reimbursement rates and access to certain services or prescriptions such as drugs for treatment of Hepatitis C. Such changes would result in higher PMPM spending. KFF analysis of data from ASES and MACPAC shows that a 50% increase in the PMPM at an 83% FMAP would provide $2.8 billion in new federal funds in FY 2021 ($1.5 billion to address the shortfall in maintaining the current program at the 55% FMAP and an additional $1.3 billion to raise the FMAP and increase PMPM spending) (Figure 4). Addressing changes in eligibility or other program changes could require additional federal funding.
Figure 4: Puerto Rico Projected FY2020 and FY2021 Medicaid Spending with PMPM adjustments under 83% FMAP (billions)
Estimates of federal options for USVI
Similar options to increase federal financing and the FMAP are available for USVI. In USVI, projected FY 2020 expenditures show that a return to traditional financing with the 55% FMAP and the statutory cap would leave USVI with an approximately $31.3 million shortfall, about 40% of projected program costs. Increasing the FMAP to 83% could require $45.9 million in federal funds above currently appropriated levels ($14.6 million more than the baseline projected shortfall) (Figure 5). Similar to estimates in Puerto Rico, additional federal support beyond addressing the shortfall and the 83% FMAP could help the territory address provider reimbursement rates or expand Medicaid benefits.
Figure 5: USVI Projected FY2020 Medicaid Spending with 55% vs. 83% FMAP (millions)
What comes next?
As of early May 2019, territory elected officials were pursuing legislation to support disaster relief and the Puerto Rico Nutrition Assistance Program (NAP), for which federal funding expired at the end of March 2019. Like its Medicaid program, Puerto Rico’s NAP differs from states’ Supplemental Nutrition Assistance Programs (SNAP) in that NAP is a capped benefit and relies on congressional appropriations. Approximately one-third of Puerto Ricans are enrolled in NAP,22 and Puerto Rico started cutting benefits for these beneficiaries in early March as funding began to lapse.23 Funding for NAP has been included in the broad disaster relief House and Senate bills under consideration, but proposals have differed on the level of disaster recovery funds for Puerto Rico beyond NAP. When Congress returned from recess in May 2019, members continued debate over disaster relief, as a new Senate bill included $300 million in additional funds to Puerto Rico. The disaster relief bills do not include provisions on Medicaid financing.
If Congress does not address the Medicaid financing cliff, Puerto Rico and USVI will face severe funding shortfalls. Among Congress’s options for action is Governor Rosselló’s request for five years of increased federal funding with an 83% FMAP, as well as consideration of longer-term or permanent options such as H.R.1354, the Territories Health Equity Act of 2019. Congress could also consider more narrow options to address the funding shortfall and/or FMAP, as well as other options to further increase federal support.
Conclusion
As Puerto Rico and USVI continue to rebuild from the September 2017 hurricanes that devastated their economies and health care systems, the scheduled September 2019 expiration of the majority of temporary federal Medicaid funds could cause significant funding shortfalls that affect Medicaid coverage and residents’ access to health care services. Options for Congress to address the Medicaid financing issues in Puerto Rico and USVI include raising or eliminating the cap on financing and maintaining or increasing the FMAP. Territory elected officials and members of Congress are considering policy proposals to avert the Medicaid fiscal cliff and stabilize territory Medicaid programs in the short term while addressing longer-term permanent solutions to Medicaid financing issues. In the interim, however, uncertainty over funding contributes to instability in the health care system by requiring administrative resources to establish contingency plans, creating confusion for providers and enrollees, and limiting the territories’ abilities to move forward with complex delivery system reforms. While the expiration of the disaster funding is unique to Puerto Rico and USVI, the other U.S. territories (American Samoa, the Commonwealth of the Northern Mariana Islands, and Guam) are also facing the expiration of the ACA funds. As such, Medicaid financing reforms that examine issues around the cap and the FMAP could be considered for all of the territories.
Endnotes
KFF Interview with USVI Medicaid Director, Department of Human Services (Feb. 26, 2019). ↩︎
The Kaiser Family Foundation worked with PerryUndem Research/Communication to help organize and conduct the focus groups with enrollees and key on-the-ground interviews. ↩︎
After this initial increase, Puerto Rico’s Medicaid enrollment was trending downward beginning in mid-2018 due to expiration of a delayed redetermination period, outmigration, economic recovery that may increase residents’ incomes enough to make them ineligible for Medicaid, transition to MAGI Medicaid eligibility determination methods, and some confusion stemming from the managed care reforms. ↩︎
U.S. Virgin Islands Department of Human Services, “Medicaid & CHIP Programs in the U.S. Virgin Islands” (Feb. 26, 2019). ↩︎
Puerto Rico Gov. Ricardo Rosselló letter to Chairman and Ranking Member, Committee on Energy & Commerce, U.S. House of Representatives (Washington, DC: May 1, 2019); Puerto Rico Gov. Ricardo Rosselló letter to Chairman and Ranking Member, Committee on Finance, U.S. Senate (Washington, DC: May 1, 2019). ↩︎
KFF Interview with USVI Medicaid Director, Department of Human Services (Feb. 26, 2019). ↩︎
Puerto Rico Gov. Ricardo Rosselló letter to Chairman and Ranking Member, Committee on Energy & Commerce, U.S. House of Representatives (Washington, DC: May 1, 2019); Puerto Rico Gov. Ricardo Rosselló letter to Chairman and Ranking Member, Committee on Finance, U.S. Senate (Washington, DC: May 1, 2019). ↩︎
Puerto Rico Gov. Ricardo Rosselló, “Critical Sustainability Measures to Provide Essential Health Services to Puerto Rico’s Medicaid Recipients,” Enclosure with letters to U.S. Senate and U.S. House of Representatives (Washington, DC: May 2019). ↩︎
MACPAC, “Medicaid in Puerto Rico: Financing and Spending Data Analysis and Projections” (Washington, DC: March 2019 Public Meeting), https://www.macpac.gov/wp-content/uploads/2019/03/Medicaid-in-Puerto-Rico-Financing-and-Spending-Data-Analysis-and-Projections.pdf, p.11. The MACPAC per-enrollee spending calculations include both federal and state funds and exclude long-term services and supports, since those services are not covered in Puerto Rico’s Medicaid program. The MACPAC analyses also adjust for differences in enrollment mix. ↩︎
Updated on May 20, 2019. Originally published on Jan. 18, 2019.
The current Ebola outbreak in the Democratic Republic of Congo (DRC), which began in July 2018, is the largest in that country’s history and the second largest ever recorded. According to the country’s health ministry, as of May 19, 2019 there have been 1,816 cases and 1,209 deaths in the outbreak, which is centered in 2 northeastern provinces. No cases linked to the outbreak have yet been identified outside DRC, though cross-border transmission remains a risk as does concern about exposure for international travelers and responders.
Despite improvements in the global capacity to respond to Ebola that have come since the major 2014 West African Ebola epidemic (outlined in a previous brief), the current outbreak has proven especially difficult to contain because the virus is being transmitted amid conflict, in communities mistrustful of the government and of outside responders. Over the last few months an increasing number of violent incidents, including many direct attacks on response personnel, health care providers, and clinics involved in caring for Ebola patients, have made the response effort even more challenging.
In the 2014 West African outbreak, the US played a major leadership role, mobilizing an unprecedented amount of resources and personnel to support the Ebola response. In the current outbreak, though, the U.S. role has been more limited and mainly in support of other leading actors, providing fewer resources and with American personnel restricted from working directly in the hardest hit areas due to security concerns. Given the worsening nature of the epidemic, some have called for the U.S. to increase its engagement and to take on a more prominent, leading role in the response alongside the World Health Organization (WHO), the DRC government, and other key responders.
In this Issue Brief, we summarize available information about why the outbreak continues, describe the ongoing U.S. role in response, and discuss what might come next.
Conditions Have Become Much More Difficult and Risky for Responders and Affected Communities
Conflict in the Ebola-affected provinces predates the current outbreak, and has impeded the response from the start. Long-standing conflicts in the areas affected by Ebola were exacerbated by unrest and violence stemming from a contested national election late last year, the results of which were challenged as illegitimate and fraudulent. The new President, Felix Tshisekedi, is still in the process of forming a government and naming his cabinet. He visited the Ebola-affected regions in April and called for local communities to trust the health workers involved in the Ebola response, and for disarmament of warring factions in the region.
Even so, it appears community mistrust and violence remain powerful, mutually re-enforcing factors greatly impeding the Ebola response. People in the affected areas have suffered from years of instability and violent attacks, which has engendered widespread suspicion of the motives of external parties including Ebola responders, be they from the national government, international organizations like WHO, or non-governmental organizations. Studies find that many in the affected areas believe the Ebola outbreak is not real, that it is a hoax perpetrated by the government or other outside parties. Violence linked to armed group activity in these areas continues, frequently interrupting core response activities such as identifying and isolating contacts of infected individuals and vaccinating at-risk populations. Perhaps most troubling is the trend of armed groups increasingly focusing their attacks directly on Ebola responders and the clinics where patients are being cared for. Over 100 violent attacks have occurred in the region since the start of the outbreak, including the murder of a WHO epidemiologist in April, and 42 separate attacks on health care facilities. These risks to come on top of the risks that workers face from Ebola itself, as over 100 health care workers have been infected during this outbreak so far, and 34 have died. This unique combination of factors has made responding to this outbreak a much more difficult challenge compared with previous outbreaks in the DRC.
WHO and DRC Government Lead the Response; More Financial Support Needed from Donors
The WHO and the DRC Ministry of Health, with other partners including UNICEF, the International Red Cross/Red Crescent, and key international NGOs such as MSF (Doctors without Borders) and International Medical Corps (IMC), lead the current Ebola response in the country. In February, the DRC government launched the third iteration of its Ebola response plan, covering planned activities from February to July 2019. In February, WHO said fully implementing the new plan requires $148 million. While donors have provided some assistance, including $80 million from the World Bank, as of early May WHO reports there is still an urgent $54 million funding gap yet to be filled.
There have been notable successes in the response so far, including vaccinating over 110,000 individuals, which has likely saved hundreds if not thousands of lives. In fact, WHO is now recommending an expansion of the use of the vaccine in the response as a way to address the epidemic. A WHO International Health Regulations Emergency Committee has met three times during the course of the outbreak (most recently in April) and has so far decided against declaring the DRC outbreak a “public health emergency of international concern” given that it primarily remains a threat that is contained within the eastern Congo region. If the virus spreads across borders, or if there is a very large increase in cases in other areas within the country, however, the WHO decision may be revisited yet again and an emergency declared. While some experts have called for such a declaration given the challenging situation in eastern Congo, others believe that declaring an emergency would not make much difference or may actually even make the situation worse.
U.S. Support Continues, Though Limited and Restricted
The U.S., along with other countries, continues to contribute to the response, providing technical assistance and expertise along with funding and other support. Direct engagement in the response in affected communities by U.S. personnel has been curtailed due to the security situation. Citing safety concerns, U.S. officials have decided to keep Centers for Disease Control and Prevention (CDC) and other staff away from the front lines of the response. Currently, there are a number of US personnel in the country as part of a Disaster Assistance Response Team, including over a dozen CDC employees, most of whom are based in the capital Kinshasa – about 1,000 miles from the epicenter of the outbreak. Other CDC workers have deployed to WHO headquarters, and to neighboring countries such as Uganda to assist in preparedness and response activities should the virus cross borders.
Donor funding information is limited, but according to data from the United Nations, of the $70.6 million provided by donors for the DRC Ebola response in 2018, $11.7 million (16%) came from the United States. Comparable figures for 2019 donor flows are not available. The U.S. assistance for the Ebola response is part of a broader set of humanitarian and development efforts it supports in the country.
Given ongoing transmission, growing numbers of cases, and continued interruptions to the response, outside experts have maderepeatedcalls for increased U.S. engagement, including returning CDC staff to affected areas to assist more directly and ramping up political pressure to mount an effort to reduce the violence in the affected regions. So far though, there is little indication that the US government will deviate from its current policy of keeping U.S. personnel out of those regions. Little information is being provided by the U.S. government about its strategy for the Ebola response in DRC going forward, though there are indications that a new U.S. effort is being planned to address the affected communities’ mistrust in response. Some in Congress are concerned that expanding support for Ebola in DRC may be restricted by existing U.S. laws that place limits on assistance to countries linked to human trafficking, and have introduced legislation to clear the way on any such impediments.
Uncertainty Ahead
Earlier this year, WHO had stated it believed it could work effectively with its existing partners, even without the presence of the US in the affected provinces, to contain the outbreak. Most recently, though, WHO officials have sounded much more concerned about the state of the outbreak, with the WHO Director-General saying he is “profoundly worried” and asking for additional support from the U.S. and other donors. The security situation that has driven the spread of this outbreak shows no sign of abating and those leading the response estimate it will take many more months to contain it even under the best of circumstances. Despite an increased global capacity to address Ebola generally, the outbreak in DRC remains extremely concerning and has potential to get worse.
As policymakers debate how to address the high cost of prescription drugs, a new KFF analysis compares data on prescription drug spending and use across large employer plans, Medicare Part D and Medicaid, and provides context for policy discussions about different approaches to curb rising drug costs that would affect people covered by each of the three major payers.
The data show that private insurers, Medicare and Medicaid account for 82 percent of retail prescription drug spending, while patients paid 14 percent of the cost out-of-pocket. However, the types of individuals covered by these payers varies, from adults 65 and over and younger people with disabilities in Medicare, to low-income children and adults including seniors and people with disabilities in Medicaid, to a comparatively healthier working-age population covered in employer health plans.
Other highlights in the data include:
Across payers, a small number of drugs account for a disproportionate amount of total drug spending. The top 5 drugs with the highest total spending account for at least 10 percent of total prescription drug spending in large employer plans, Medicare Part D, and Medicaid.
While some of the same drugs appear in the lists of the top 10 drugs with the highest spending within each payer, there is variation in the ranking of drugs in common and variation in which drugs appear in the top 10 across payers that reflect the different populations covered and their health needs.
Out-of-pocket drug spending per user among people in large employer plans and Medicare Part D is highest for drugs to treat cancer, multiple sclerosis, and rheumatoid arthritis.
The analysis is based primarily on claims data by payer, which does not account for rebates paid by drug manufacturers to pharmacy benefit managers, insurers, and state Medicaid programs. Rebates differ by payer, and are estimated to be larger for Medicaid than Medicare Part D or private employers.
Prescription drug costs are a pressing concern for both consumers and policymakers. Rising drug prices affect patients’ out-of-pocket costs as well as the budgets of private and public payers, though the challenges vary by payer. This analysis compares prescription drug spending and use in large private employer plans, Medicare Part D, and Medicaid, based primarily on claims data by payer, which does not account for rebates. Rebates differ by payer, and are estimated to be larger for Medicaid than Medicare Part D or private employers.
Spending by private health insurers, Medicare, and Medicaid accounts for a majority of prescription drug spending in the U.S., but the types of individuals who receive prescription drug coverage from these three payers varies:
Medicare covers adults ages 65 and older and younger people with long-term disabilities. Medicare’s prescription drug benefit is provided through the Part D program to Medicare beneficiaries who enroll in private stand-alone drug plans or Medicare Advantage drug plans.
Medicaid is the nation’s health insurance program for people with low income and provides a wide array of medical and long-term care benefits to a diverse population of low-income children and adults, individuals with disabilities, and people ages 65 and older. People 65 and older and those with disabilities who also have Medicare coverage receive coverage of retail prescription drugs through Medicare Part D.
Employers cover a population that is healthier than either Medicare or Medicaid, and almost all covered workers have coverage for prescription drugs.
This variation in the types of individuals covered by each payer is reflected in some of the patterns of prescription drug spending and use presented below.
Highlights from this analysis include:
Private health insurance, Medicare, and Medicaid accounted for 82% of total retail prescription drug spending in the U.S. in 2017, while patients paid 14% of the total as out-of-pocket payments.
For spending on specific drug products, the top five drug products with the highest total spending alone account for at least 10% of total prescription drug spending in large employer plans, Medicare Part D, and Medicaid.
While some of the same drug products appear among the top 10 drug products with the highest total spending in large employer plans, Medicare Part D, and Medicaid, there is also variation that reflects differing covered populations.
Out-of-pocket drug spending per user among people in large employer plans and Medicare Part D is highest for drugs to treat cancer, multiple sclerosis and rheumatoid arthritis.
Antidiabetic agents, antivirals and psychotherapeutics are among the top therapeutic classes by total spending in large employer plans, Medicare Part D, and Medicaid.
Spending by private health insurance, Medicare, and Medicaid accounts for more than 80% of total retail prescription drug spending in the U.S.
Figure 1: Total U.S. Retail Prescription Drug Spending, 2017
In 2017, total U.S. retail prescription drug spending was $333 billion, after accounting for rebates, with the majority (82%) of spending incurred by the three major sources of payment in the U.S. health system: private health insurance, Medicare, and Medicaid. Among all payers, private health insurance accounted for the largest share of drug spending, at 42%, followed by Medicare at 30%, and Medicaid at 10%. Patient out-of-pocket costs represented 14% of total retail drug spending.
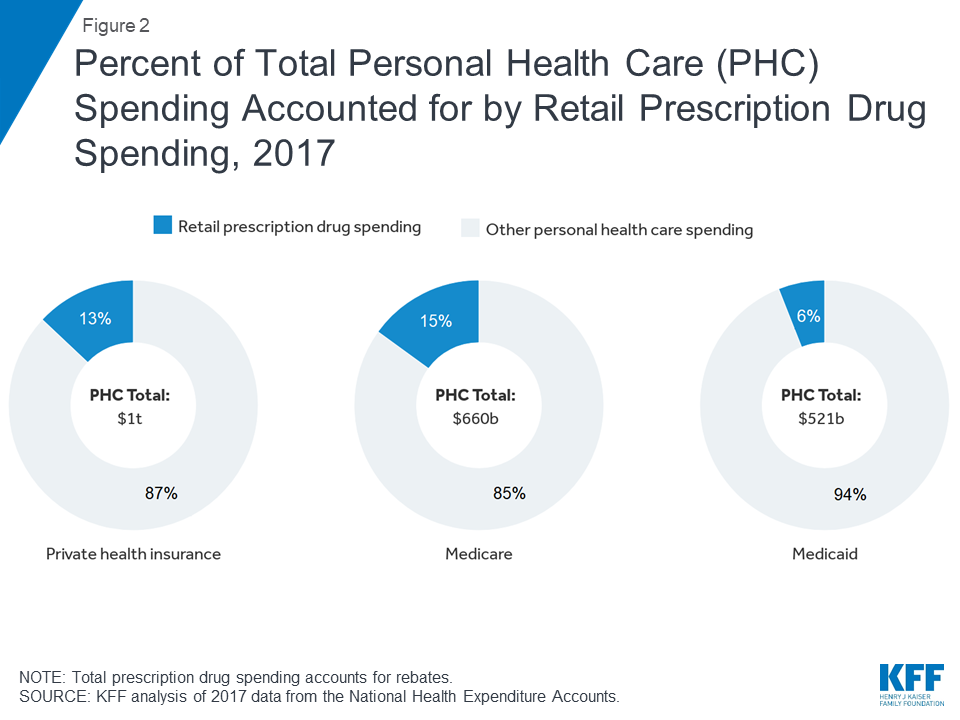
Spending on retail prescription drugs accounts for a larger share of total personal health care spending for private health insurance and Medicare than Medicaid
Percent of Total Personal Health Care (PHC) Spending Accounted for by Retail Prescription Drug Spending, 2017
In 2017, retail prescription drug spending accounted for 13% of total personal health care spending in private health insurance plans and 15% of personal health care spending in Medicare. Drug spending as a share of personal health care spending in Medicaid was lower (6%) because Medicaid also pays for more expensive services, including long-term services and supports that are not paid for by private insurance or Medicare.
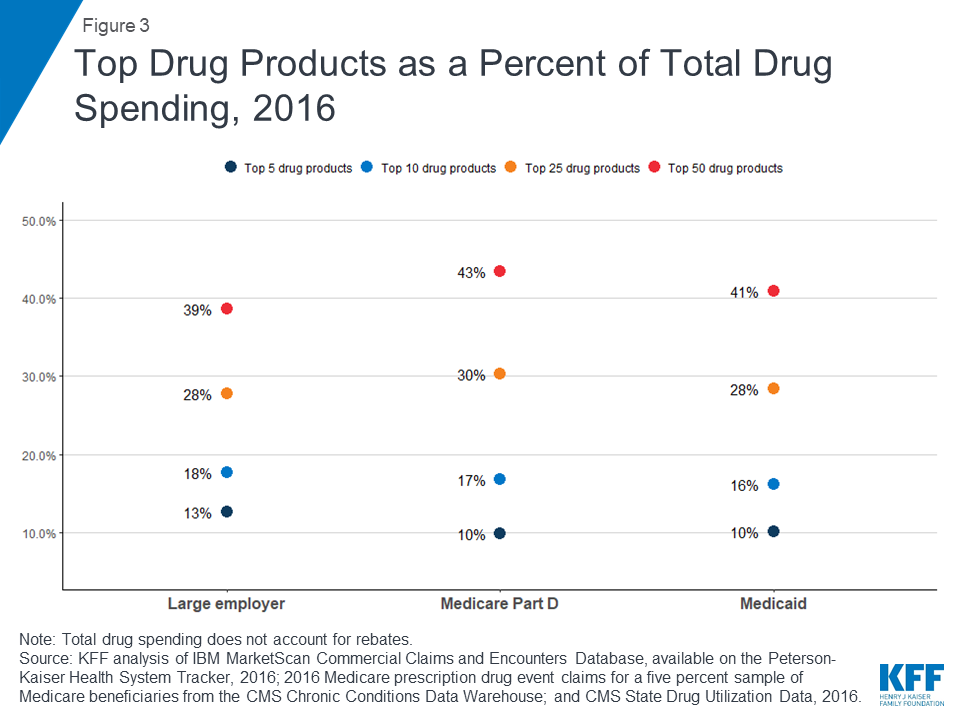
Across payers, a small number of drug products account for a disproportionate amount of total drug spending
Figure 3: Top Drug Products as a Percent of Total Drug Spending, 2016
For large employer plans, Medicare Part D, and Medicaid, the top five drug products with the highest total spending alone account for at least 10% of total prescription drug spending by each payer (13%, 10%, and 10%, respectively), while the top 50 drug products account for roughly 40% of total prescription drug spending (39%, 43%, and 41%, respectively). These estimates do not account for rebates.
The top 50 drug products by spending account for a large share of total drug spending but a relatively small share of total prescriptions in large employer plans, Medicare Part D, and Medicaid
Figure 4: Top 50 Drug Products as a Percent of Total Drug Spending and Total Prescriptions, 2016
While the top 50 drug products account for roughly 40% of total prescription drug spending for large employers, Medicare Part D, and Medicaid, the share of total prescriptions accounted for by the top 50 drug products is much smaller: only 8% for both large employer plans and Medicaid, and 15% for Medicare Part D.
In 2016, total drug spending in Medicare Part D and Medicaid was highest for Harvoni (for hepatitis C); in large employer plans, total drug spending was highest for Humira (for rheumatoid arthritis)
Figure 5: Top 3 Drug Products by Total Spending, 2016
In 2016, the drug product with the highest total spending in Medicare Part D and Medicaid was Harvoni, a curative treatment for hepatitis C that was approved by the FDA in October 2014; total spending on Harvoni was $4.4 billion in Medicare Part D and $2.2 billion in Medicaid (not accounting for rebates payers may have received). The number one drug product for large employers in 2016 was Humira, a treatment for rheumatoid arthritis, with $4.9 billion in total spending (also not accounting for rebates).
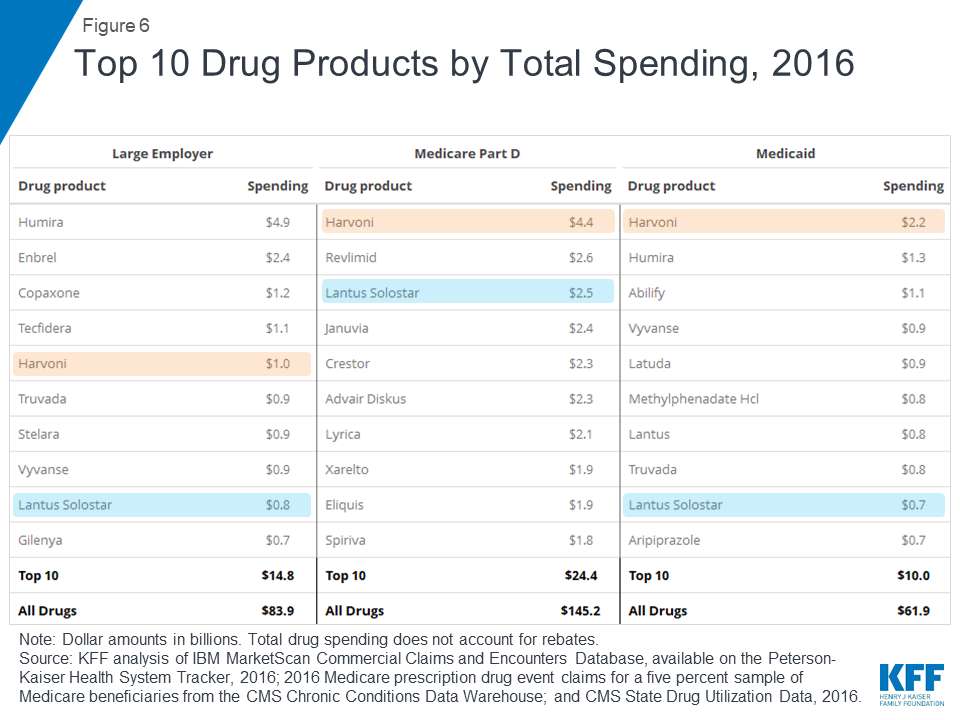
While some of the same drug products appear among the top 10 drug products with the highest total spending in large employer plans, Medicare Part D, and Medicaid, there is also variation that reflects differing covered populations
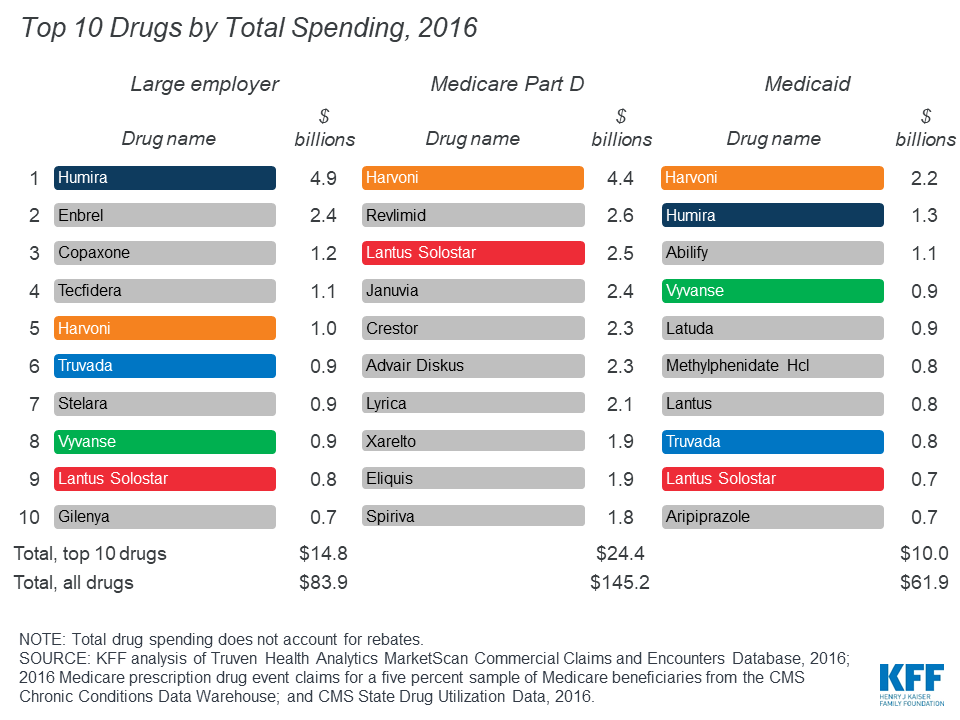
Figure 6: Top 10 Drug Products by Total Spending, 2016
Among the top 10 drug products with the highest total spending in large employer plans, Medicare Part D, and Medicaid, there are two products in common: Harvoni, a treatment for hepatitis C, and Lantus Solostar, an insulin therapy for diabetes. There is additional overlap in the top 10 lists for large employer plans and Medicaid, including treatments for attention-deficit/hyperactivity disorder (ADHD) and HIV. Despite the overlap, the ranking of these drug products generally differs across payers, and there is also variation in which products have the largest total spending for each payer, which reflects the different types of populations covered. In particular, for Medicare Part D, the top 10 list includes treatments for cancer, chronic obstructive pulmonary disease, and high cholesterol which are more commonly used by older adults. For Medicaid, the top 10 list includes several psychotherapeutic medications, reflecting the important role that Medicaid plays in meeting the needs of people with mental illness.
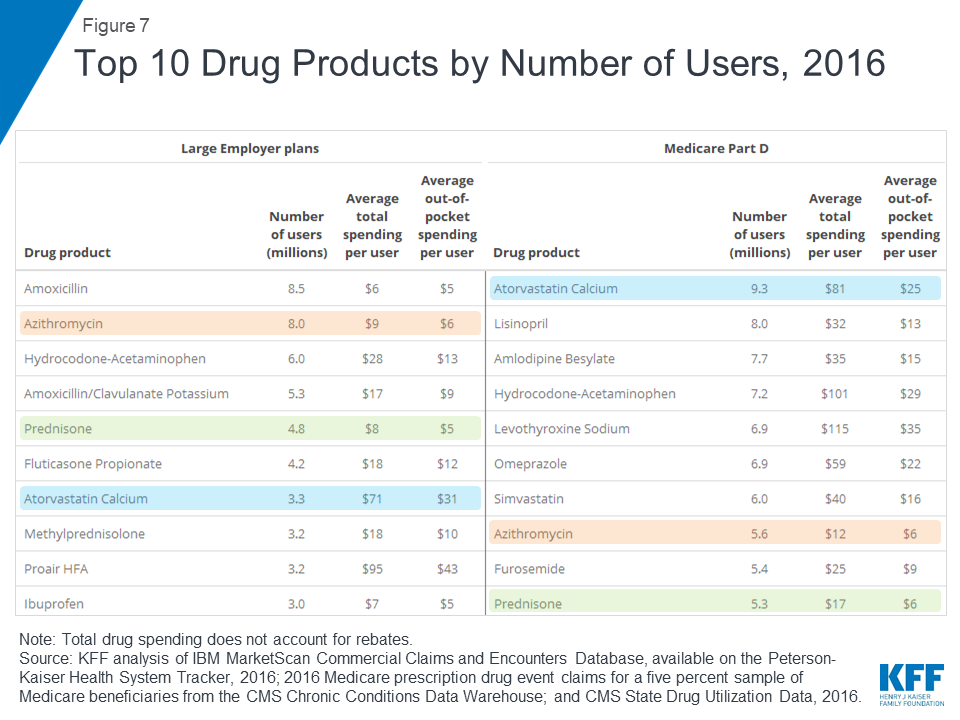
Antibiotics and asthma/allergy drugs are among the most commonly used drugs in large employer plans, while drugs for high blood pressure and high cholesterol are more commonly used in Medicare Part D
Figure 7: Top 10 Drug Products by Number of Users, 2016
Atorvastatin calcium (generic for Lipitor), a treatment for high cholesterol, was used by 9.3 million people in Medicare Part D plans, more users than any other drug product used by Part D enrollees in 2016. The antibiotic amoxicillin was used by 8.5 million people in large employer plans in 2016, more than any other drug product used by people in large employer plans in 2016. Because the most commonly used drug products are generics, average total and out-of-pocket spending per user is relatively low for these drugs.
Hepatitis C and cancer treatments have the highest average total spending per user in large employer plans and Medicare Part D
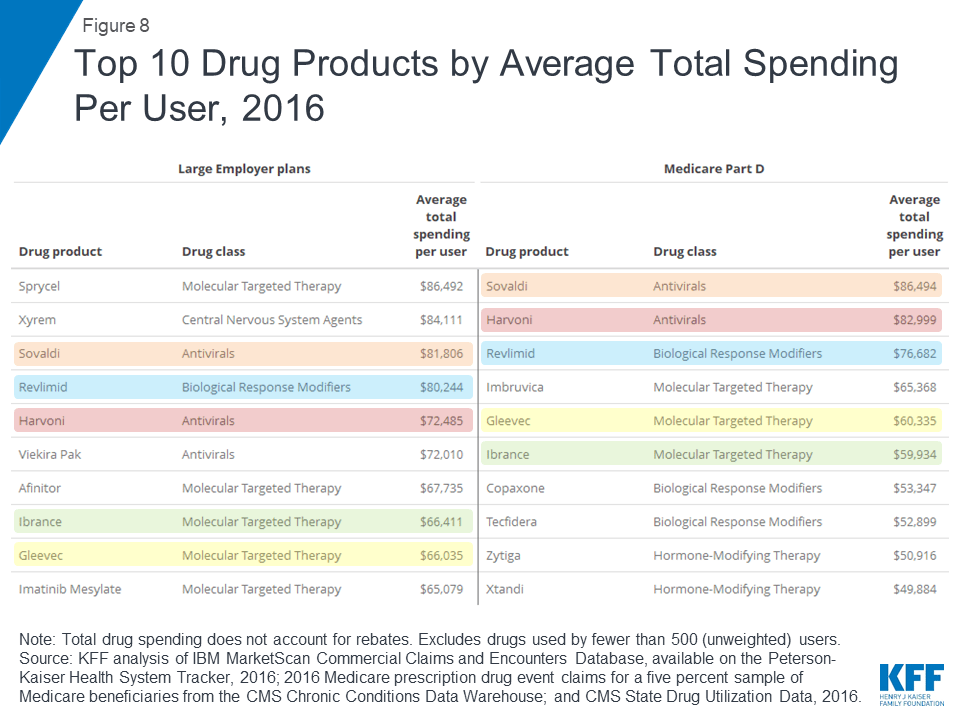
Figure 8: Top 10 Drug Products by Average Total Spending Per User, 2016
Two hepatitis C treatments, Sovaldi and Harvoni, are among the top 10 drug products by total spending per user in large employer plans and Medicare Part D, with total spending per user on both products of more than $70,000 in 2016. Cancer drugs are also among the drug products with the highest total spending per user for large employer plans and Medicare Part D, including Revlimid, Ibrance, and Gleevec, with annual costs of at least $60,000 per user.
Out-of-pocket drug spending per user among people in large employer plans and Medicare Part D is highest for medications to treat cancer, multiple sclerosis, and rheumatoid arthritis
Figure 9: Top 10 Drug Products by Average Out-of-Pocket Spending Per User, 2016
Although there is little overlap in the specific list of top 10 drug products used by people in large employer plans and Medicare Part D in terms of annual average out-of-pocket spending per user, the types of drugs with the highest out-of-pocket costs are similar, and include drug products to treat cancer, multiple sclerosis, and rheumatoid arthritis. In 2016, people in large employer plans paid more out of pocket for Xyrem, a treatment for narcolepsy, than for other drug products—$1,568 on average. In 2016, the hepatitis C treatment Harvoni was the most expensive drug product for Part D enrollees, with $5,235 in average annual out-of-pocket costs per user among those who did not receive low-income subsidies.
Antidiabetic agents, antivirals, and psychotherapeutics are among the top therapeutic classes by total spending in large employer plans, Medicare Part D, and Medicaid
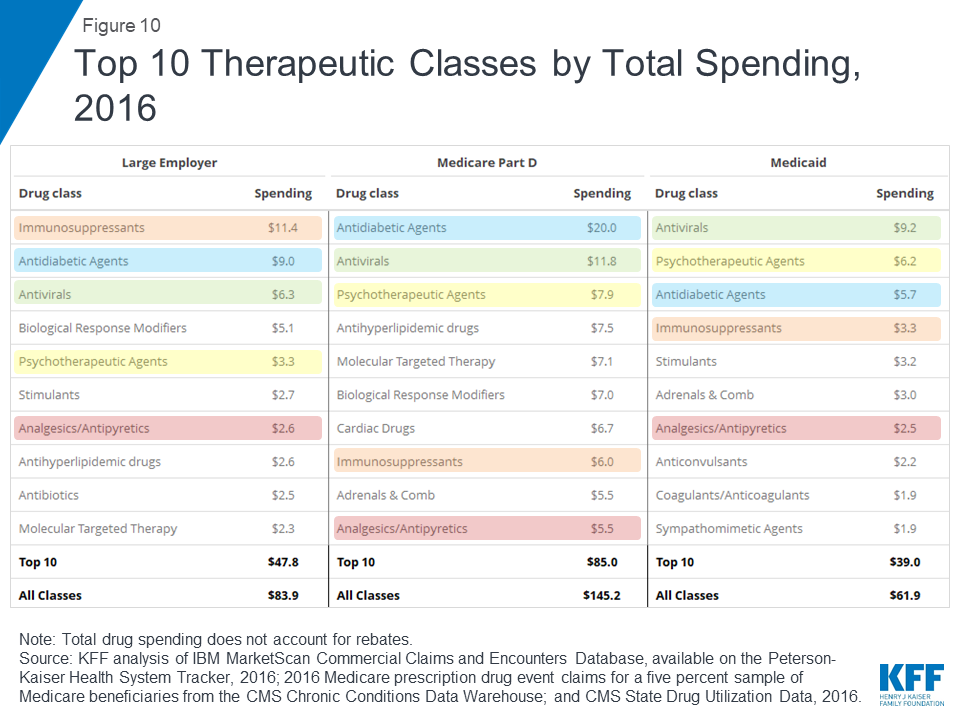
Figure 10: Top 10 Therapeutic Classes by Total Spending, 2016
In terms of total spending on prescription drugs by therapeutic class, antidiabetic agents and antivirals are among the top 3 classes for large employer plans, Medicare Part D, and Medicaid. Total spending on antidiabetic agents, the number one class for Medicare Part D, was $20.0 billion for Part D, $9.0 billion for large employers, and $5.7 billion for Medicaid (not accounting for rebates on drug products in these classes). Total spending on antivirals, the number one class for Medicaid, was $9.2 billion for Medicaid, $11.8 billion for Medicare Part D, and $6.3 billion for large employer plans. But as with total spending by drug product, the rankings of top drug classes by spending show variation across payers that reflects variation in covered populations; for example, psychotherapeutics rank higher for Medicaid and Medicare Part D than large employers, while molecular targeted therapy (cancer treatments) rank higher for Medicare Part D than large employers.
Cardiac drugs, psychotherapeutics, and pain medications are among the top therapeutic classes by volume in large employer plans, Medicare Part D, and Medicaid
Figure 11: Top 10 Therapeutic Classes by Number of Prescriptions, 2016
In terms of number of prescriptions filled, the most commonly used types of drugs in large employer plans, Medicare Part D, and Medicaid include cardiac drugs and psychotherapeutic agents. The number of prescriptions for cardiac drugs—the top drug class by volume in large employer plans and Medicare Part D—was 69.9 million in large employer plans, 246.6 million in Medicare Part D, and 52.8 million in Medicaid. The number of prescriptions for psychotherapeutic agents—the number two drug class by volume in Medicaid and Medicare Part D and number three in large employer plans—was 56.2 million in large employer plans, 118.4 million in Medicare Part D, and 68.3 million in Medicaid.
Annual average out-of-pocket spending is higher among people in Medicare Part D plans than those in large employer plans, but spending by both groups was lower in 2016 than in 2007
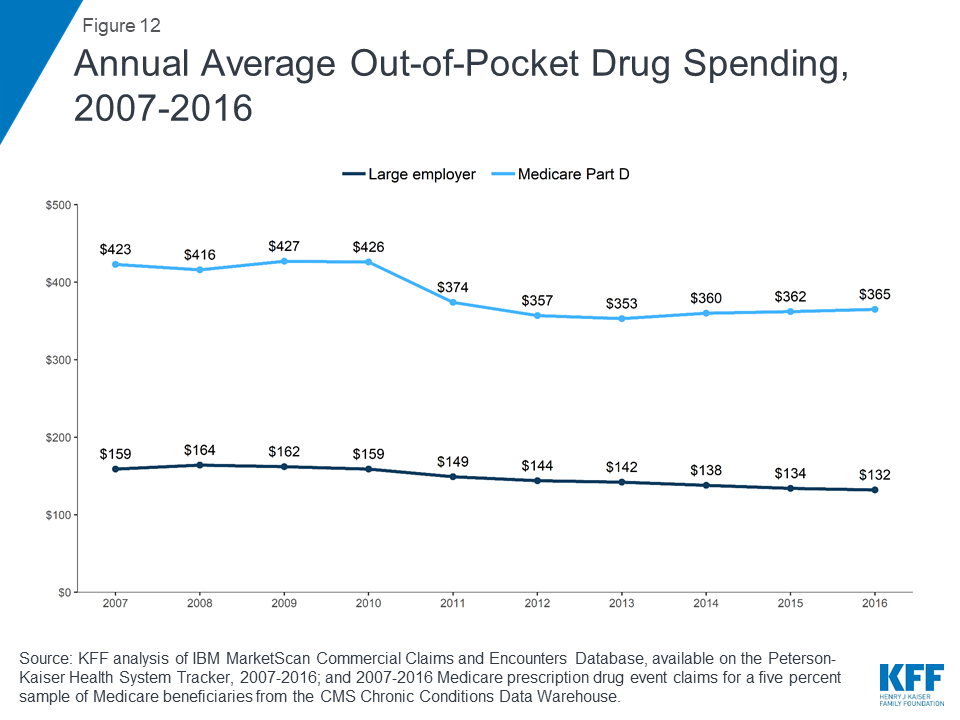
Figure 12: Annual Average Out-of-Pocket Drug Spending, 2007-2016
People in Medicare Part D plans spend more out of pocket on prescription drugs than people in large employer plans, on average. In 2016, people in Medicare Part D spent $365 out of pocket on drugs, more than 2.5 times the average out-of-pocket drug spending by people in large employer plans that year ($132). Between 2007 and 2016, average out-of-pocket drug spending by people in large employer plans decreased somewhat. Part D enrollees also spent less out of pocket in 2016 than in 2007, on average, but their out-of-pocket costs have been relatively flat since 2012, after decreasing between 2010 and 2012 due to a provision in the Affordable Care Act to phase out the coverage gap in the Part D benefit.
A larger share of people with Medicare Part D have high annual out-of-pocket drug costs compared to people with employer coverage
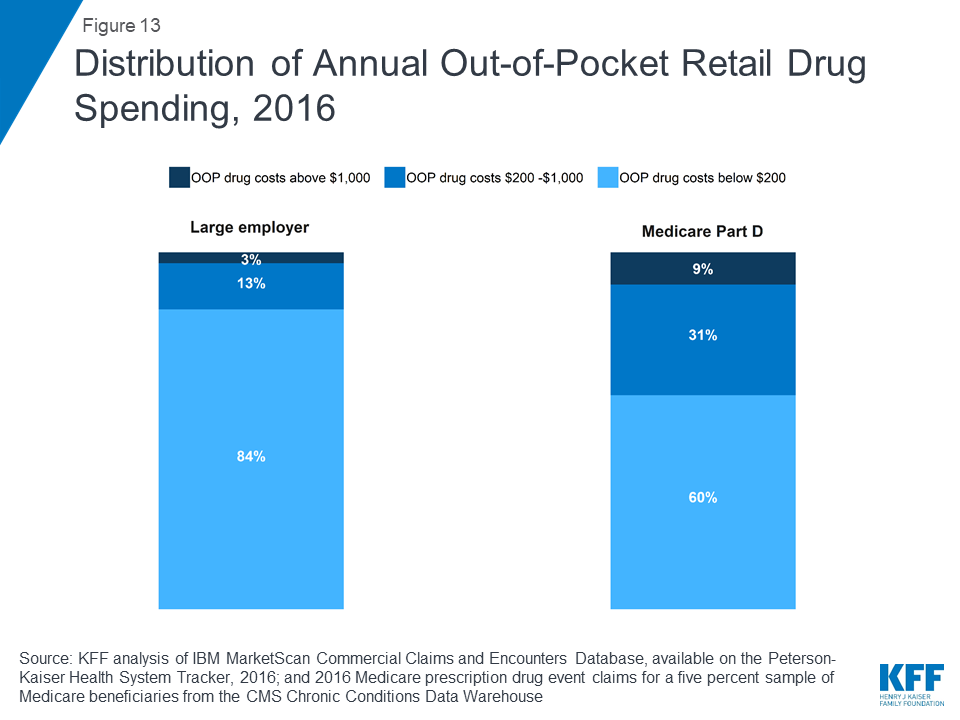
Figure 13: Distribution of Annual Out-of-Pocket Retail Drug Spending, 2016
In 2016, nearly 1 in 10 people in Medicare Part D plans (9%) had out-of-pocket drug spending above $1,000, compared to 3% of people in large employer plans. Conversely, more than 8 in 10 people in large employer plans (84%) had out-of-pocket drug costs below $200, compared to 60% of people in Medicare Part D plans.
Juliette Cubanski and Matthew Rae are with KFF; Katherine Young was with KFF when the analysis was conducted. Anthony Damico is an independent consultant.
Our analysis of total retail prescription drug spending by payer and as a share of personal health care spending in 2017 is based on analysis of data from the National Health Expenditure Accounts (NHEA). Personal health care includes all medical goods and services that are rendered to treat or prevent a specific disease or condition in a specific person. Prescription drug expenditures in the NHEA include the retail sales of human-use dosage-form drugs, biological drugs, and diagnostic products that are available only by a prescription. Drug spending in the NHEA is adjusted to account for manufacturers’ rebates that reduce payers’ net payments for prescription drugs.
Large employer plans
We analyzed a sample of medical claims obtained from the IBM MarketScan Commercial Claims and Encounters Database, which contains claims information provided by large employer plans. We used a subset of claims from the 2016 data. We only included claims for people under the age of 65 and people who were enrolled in a plan for more than half a year. Weights were applied to match counts in the Current Population Survey for enrollees at firms of a thousand or more by sex, age, state and whether the enrollee was a policy holder or dependent. This analysis used claims for almost 17 million people representing about 20% of the 86 million people in the large group market in 2016.
The MarketScan claims database contains information about health benefit claims and encounters for several million individuals each year provided by large employers. The advantage of using claims information to analyze out-of-pocket spending is that we can look beyond plan provisions and focus on actual payment liabilities incurred by enrollees. A limitation of these data is that they reflect cost sharing incurred under the benefit plan and do not include balance-billing payments that beneficiaries may make to health care providers for out-of-network services or out-of-pocket payments for non-covered services. Drug spending paid for by someone other than an enrollee’s insurer, drugs administered in an inpatient setting or not classified under the controlled substance act were excluded.
Each prescription drug claim was counted as a single prescription regardless of the quantity or strength of that prescription. Drugs with the same product name but separate entries in the MarketScan claims database corresponding to products with different delivery mechanisms and/or dosage forms are reported separately. Total spending does not include any rebates that may reduce the cost of the drug. MarketScan’s Red Book was used to classify drugs by the therapeutic/pharmacologic category of the drug product. Analysis of average total and out-of-pocket spending per user by drug (Figures 8 and 9) excludes drugs used by fewer than 500 (unweighted) enrollees.
Medicare Part D
We used data from the 2016 Medicare Part D prescription drug event (PDE) claims data from the Centers for Medicare & Medicaid Services (CMS) Chronic Conditions Data Warehouse (CCW) for a five percent sample of Medicare beneficiaries. Our five percent sample for 2016 includes 2,149,486 Part D enrollees (42,989,720 weighted) and 1.5 billion prescription drug events. The PDE claims data includes all prescription drug events reported by Part D plans for their enrollees in a given calendar year, and includes detailed data on spending for each event, corresponding to a single prescription drug fill, including how much was paid by plans, low-income subsidy amounts, and beneficiary out-of-pocket payments. The claims data includes spending for Part D covered drugs, but doesn’t include spending on Part D plan premiums, Part B covered drugs (which are typically administered in providers’ offices or hospital outpatient settings), or the cost of drugs purchased outside the Part D plan.
We calculated aggregate and per user average total and out-of-pocket drug spending for Part D enrollees overall, including beneficiaries with and without Part D low-income subsidies, and beneficiaries enrolled in both stand-alone prescription drug plans (PDPs) and Medicare Advantage prescription drug plans. Total spending reflects payments from all payers, including beneficiaries (out-of-pocket cost sharing amounts), but does not include rebates and discounts from pharmacies and manufacturers that are not reflected in prices at the pharmacies. Out-of-pocket costs are those paid directly by beneficiaries, not including amounts that other parties might pay on their behalf and not including the value of the manufacturer discount on brand-name drugs in the coverage gap. Drugs with the same product name but separate entries in the Part D claims data corresponding to products with different delivery mechanisms and/or dosage forms are reported separately. MarketScan’s Red Book was used to classify drugs by the therapeutic/pharmacologic category of the drug product. Analysis of average total and out-of-pocket spending per user by drug (Figures 8 and 9) excludes drugs used by fewer than 500 (unweighted) enrollees.
Medicaid
We used the CMS State Drug Utilization data, provided by states to CMS. These data reflect prescriptions provided through the Medicaid Drug Rebate Program. The data presents Medicaid spending, total spending, and units for each National Drug Code (NDC) in each quarter, for managed care or fee-for-service, at the state or national level. The spending data do not include any rebates, and do not include drugs purchased through 340B. Drugs with the same product name but separate entries in the Medicaid claims data corresponding to products with different delivery mechanisms and/or dosage forms are reported separately. MarketScan’s Red Book was used to classify drugs by the therapeutic/pharmacologic category of the drug product. We are unable to report average total spending per user for Medicaid prescription drug spending because the data do not include per user counts for each drug.
Selected Definitions for Red Book Drug Classes
‘Adrenals and comb’ includes medications for asthma and chronic obstructive pulmonary disease (COPD).
‘Biological response modifiers’ are immunotherapies used to treat certain types of cancer, multiple sclerosis, and other diseases.
‘Molecular targeted therapy’ drugs are cancer treatments that target specific molecules involved in the growth and spread of cancer cells.
‘Sympathomimetic agents’ are stimulant compounds used to treat asthma, allergies, and cough and cold symptoms.