How Much Do Medicare Beneficiaries Spend Out of Pocket on Health Care?

Authors: Juliette Cubanski, Wyatt Koma, Anthony Damico, and Tricia Neuman
Published: Nov 4, 2019

Issue Brief

Many policymakers and presidential candidates are discussing proposals to build on Medicare in order to expand insurance coverage and reduce health care costs, and improve financial protections and lower out-of-pocket costs for people currently covered by Medicare. More than 60 million people ages 65 and older and younger people with long-term disabilities currently rely on Medicare to help cover their costs for health care services, including hospitalizations, physician visits, prescription drugs, and post-acute care. However, Medicare beneficiaries face out-of-pocket costs for their insurance premiums, cost sharing for Medicare-covered services, and costs for services that are not covered by Medicare, such as dental care and long-term services and supports.

In 2016, the average person with Medicare coverage spent $5,460 out of their own pocket for health care (Figure 1). This average includes spending by community residents and beneficiaries residing in long-term care facilities (5% of all beneficiaries in traditional Medicare). Among community residents alone, average out-of-pocket spending on premiums and health care services was $4,519 in 2016. But some groups of beneficiaries spent substantially more than others. Current Medicare-for-all proposals in Congress and from presidential candidates would largely eliminate out-of-pocket costs for premiums and patient cost sharing, including for people now covered under Medicare.
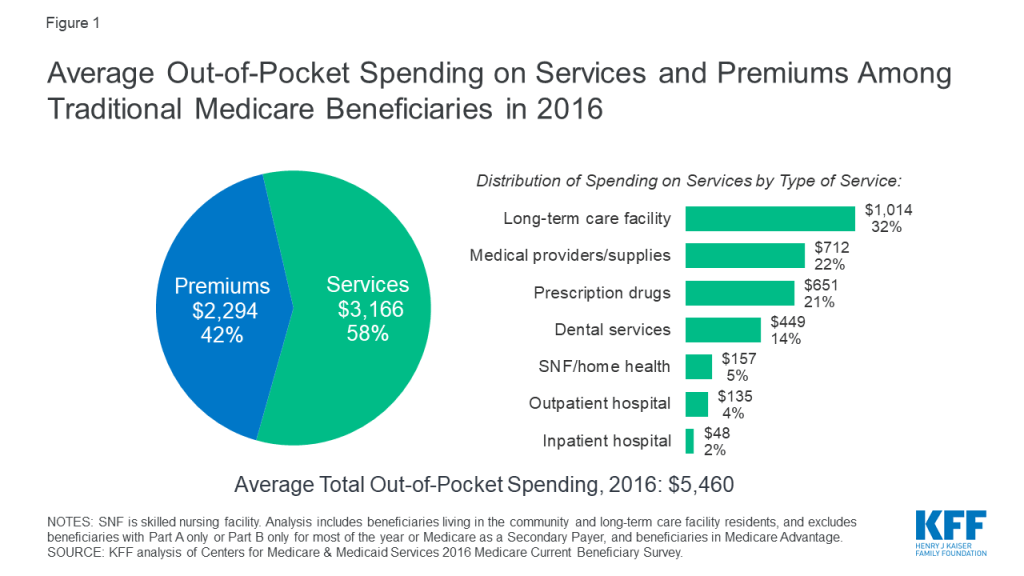
Figure 1: Average Out-of-Pocket Spending on Services and Premiums Among Traditional Medicare Beneficiaries in 2016

This analysis presents the most current data on out-of-pocket health care spending by Medicare beneficiaries, both overall and among different groups of beneficiaries. The analysis addresses three main questions:

The analysis is based on the most current year of out-of-pocket spending data available (2016) from the Medicare Current Beneficiary Survey (MCBS), a nationally representative survey of Medicare beneficiaries. The analysis includes beneficiaries living in the community and long-term care facility residents, and excludes beneficiaries enrolled in Medicare Advantage due to unverified reporting of events and spending for these beneficiaries in the MCBS. (See Methodology for details). All results presented in the text are statistically significant (see Appendix to access a downloadable table of results).

How much do Medicare beneficiaries spend out of pocket in total on premiums and services?

The graphic below shows how much the average person with traditional Medicare spent out of pocket for health care in 2016. Total out-of-pocket spending includes spending on medical and long-term care facility services and insurance premiums, with comparisons across different groups of beneficiaries.

Average Out-of-Pocket Health Care Spending by Traditional Medicare Beneficiaries in 2016

Our analysis shows that Medicare beneficiaries spent $5,460 out of their own pockets for health care in 2016, on average, with more than half (58%) spent on medical and long-term care services ($3,166), and the remainder (42%) spent on premiums for Medicare and other types of supplemental insurance ($2,294). This average includes spending by community residents and beneficiaries residing in long-term care facilities (5% of all beneficiaries in traditional Medicare). Among community residents alone, average out-of-pocket spending on premiums and health care services was $4,519 in 2016.

Average total out-of-pocket spending varies considerably across different groups of beneficiaries.

  • The oldest beneficiaries in traditional Medicare, people ages 85 and older, spent more than twice as much out of pocket as beneficiaries between the ages of 65 and 74 ($10,307 versus $5,021). This difference was primarily due to significantly higher spending on long-term care facility services among beneficiaries in the oldest age group.
  • Out-of-pocket spending by women in traditional Medicare was higher than out-of-pocket spending by men ($5,748 versus $5,104).
  • Beneficiaries in poorer self-reported health, those with multiple chronic conditions, and those with any inpatient hospital utilization faced higher out-of-pocket costs than the average traditional Medicare beneficiary. For instance, beneficiaries with at least one inpatient stay in 2016 spent $7,613 out of pocket, on average, compared to $5,044 among those without an inpatient stay.
  • Beneficiaries with no supplemental insurance spent more out of pocket than beneficiaries with some type of supplemental coverage. In 2016, nearly one in five (6.1 million) Medicare beneficiaries did not have any source of supplemental coverage, which placed them at greater risk of incurring high medical expenses. People without any source of supplemental coverage were also more likely to have modest incomes and be ages 85 or older. Out-of-pocket spending averaged $7,473 among beneficiaries with no supplemental coverage in 2016, compared to $5,202 among beneficiaries with employer-sponsored coverage, who also tend to have higher incomes, higher education levels, and are disproportionately white. Beneficiaries with Medicaid, however, incurred the lowest average out-of-pocket costs in 2016 ($2,665) compared to those with other coverage types or none whatsoever. Higher out-of-pocket spending among those with no supplemental coverage is due to higher spending on health-related services, because supplemental coverage helps Medicare beneficiaries pay their out-of-pocket costs for Medicare-covered services. For example, beneficiaries with employer-sponsored coverage spent $2,476 on health-related services in 2016, on average, while those with no supplemental coverage spent $5,776.

How much do Medicare beneficiaries spend out of pocket on different types of health-related services?

The graphic below shows average out-of-pocket spending for specific health and long-term care services by traditional Medicare beneficiaries in 2016, with comparisons across different groups of beneficiaries.

Average Out-of-Pocket Health Care Spending by Traditional Medicare Beneficiaries in 2016, by Type of Service

Of the total average per capita spending on health and long-term care services in 2016 ($3,166), Medicare beneficiaries spent the most on long-term care (LTC) facility services, which are not covered by Medicare ($1,014, or 32% of average out-of-pocket spending on services), followed by medical providers and supplies ($712; 22%), prescription drugs ($651; 21%), and dental services ($449; 14%). These estimates are averaged across all traditional Medicare beneficiaries including users and non-users of each service; average spending among users would be higher than the averages presented here.

Average out-of-pocket spending by service varies across different groups of beneficiaries. For example:

  • Not surprisingly, beneficiaries living in long-term care facilities (5% of traditional Medicare beneficiaries overall) spent significantly more on LTC services than the average beneficiary in traditional Medicare in 2016 ($19,632 versus $1,014). Out-of-pocket spending was much higher among LTC facility residents who did not have Medicaid ($41,782), which is the primary source of public support for long-term care. Out-of-pocket spending on long-term care facility services was also higher among beneficiaries with certain types of chronic conditions, in particular, Alzheimer’s disease or other dementia ($9,565 on average; $27,308 among LTC residents only) and Parkinson’s disease ($4,120 on average; $28,165 among LTC residents only)—as these beneficiaries are more likely to reside in a long-term care facility than those with other conditions. Notably, these estimates of out-of-pocket spending on long-term care facility services are lower than the median estimated annual cost of a private room in a long-term care facility, which was $92,000 in 2016. One reason for the discrepancy is that the average out-of-pocket spending estimates from the MCBS include beneficiaries who resided in a LTC facility for less than a full year.
  • Average spending on prescription drugs was higher for beneficiaries with multiple chronic conditions and those in relatively poor self-reported health status. In 2016, traditional Medicare beneficiaries with five or more chronic conditions spent $1,065 on prescription drugs, on average, compared to $416 among those with one or two chronic conditions; those in poor self-reported health spent $1,018 on drugs compared to $410 among those in excellent self-reported health. In a separate analysis of the out-of-pocket cost burden for specialty drugs, we found that out-of-pocket drug costs for Part D enrollees taking medications for selected conditions, including cancer, hepatitis C, multiple sclerosis, and rheumatoid arthritis, can exceed thousands of dollars annually on a single medication.
  • In 2016, traditional Medicare beneficiaries spent an average of $449 out of pocket on dental services, which are typically not covered by Medicare. Out-of-pocket spending on dental care increased with income, likely because higher-income beneficiaries are better able to afford dental services, while those with lower incomes are more likely to go without needed dental care due to costs.

What share of income do Medicare beneficiaries spend on out-of-pocket health care costs?

The graphic below shows out-of-pocket spending on health-related services as a share of total per capita income, at the median, with comparisons across different subgroups of beneficiaries.

Median Out-of-Pocket Spending as a Share of Income for Traditional Medicare Beneficiaries in 2016

Our analysis shows that half of all beneficiaries in traditional Medicare spent at least 12% of their income on out-of-pocket health care costs in 2016. One quarter of all beneficiaries spent at least 23% of their incomes on health-related services in 2016, while 10% spent nearly half of their income (data not shown).

The median out-of-pocket health care spending burden varies by beneficiary subgroups. For example:

  • The financial burden of health care as a share of income falls disproportionately on lower-income Medicare beneficiaries. Half of traditional Medicare beneficiaries with incomes below $10,000 spent at least 18% of their total per capita income on health care costs in 2016, compared to 7% for those with incomes of $40,000 or more. Having Medicaid coverage, however, significantly reduces the out-of-pocket spending burden among low-income beneficiaries. Beneficiaries with Medicaid spent just 5% of their total income on out-of-pocket health care costs in 2016.
  • Medicare beneficiaries in older age groups face a higher out-of-pocket spending burden than younger beneficiaries. Half of traditional Medicare beneficiaries ages 85 and older spent at least 16% of their total income on out-of-pocket health care costs in 2016, compared to 12% among those ages 65 to 74.
  • People with multiple chronic conditions or in poorer health spend more on health care out-of-pocket than those in better health. For example, beneficiaries with five or more chronic conditions spent 14% of their income on out-of-pocket health care costs in 2016, compared to 8% among those with zero conditions. Those with any inpatient hospital stay in 2016 spent 17% of their income on out-of-pocket health care costs, compared to 11% among those without a hospital stay that year.

Discussion

In 2016, people with traditional Medicare spent an average of $5,460 out of pocket for health care expenses, including premiums, cost sharing, and costs for services not covered by Medicare. Half of all traditional Medicare beneficiaries spent at least 12% of their total per capita income on health care. Although Medicare has helped make health care more affordable for people with Medicare, many beneficiaries face high out-of-pocket costs for care they receive, including costs for services that are not covered by Medicare—in particular, long-term care services. Some groups of beneficiaries face substantially higher out-of-pocket costs than others, including women, those ages 85 and over, those who are in poorer self-reported health and who have multiple chronic conditions, and those with no supplemental coverage.

The fact that traditional Medicare does not have an annual out-of-pocket limit and does not cover certain services that older adults are more likely to need may undermine the financial security that Medicare provides, especially for people with significant needs and limited incomes. Addressing these gaps would help to alleviate the financial burden of health care for people with Medicare, although doing so would also increase federal spending and taxes.

Juliette Cubanski, Wyatt Koma, and Tricia Neuman are with KFF.Anthony Damico is an independent consultant.

Methodology

Data Overview

This interactive analysis is based on data from the Centers for Medicare & Medicaid Services (CMS) Medicare Current Beneficiary Survey (MCBS) Cost Supplement for 2016, the most recent year available. The MCBS is a survey of a nationally-representative sample of the Medicare population, including both aged and disabled enrollees who are living in the community as well as facility residents. The dataset integrates survey information reported directly by beneficiaries with Medicare administrative data. Survey-reported data includes the demographics of respondents, such as sex, age, race, living arrangements, income, health status, and physical functioning, the use and costs of health care services, and supplementary health insurance arrangements.

The survey also collects information on inpatient and outpatient hospital care, physician and other medical provider services, home health services, durable medical equipment, long-term and skilled nursing facility services, hospice services, dental services, and prescription drugs. Survey-reported information is matched to and supplemented by administrative records and billing and claims-level data when possible. Extensive efforts are made to verify the accuracy of survey reports and to reconcile discrepancies using administrative bill data to produce a more complete and reliable dataset.

Beneficiary Population

Our analysis includes beneficiaries in traditional Medicare for most of their enrollment in 2016, and excludes beneficiaries enrolled in Part A or Part B only, those with Medicare as a Secondary Payer, and those enrolled in Medicare Advantage plans for most of their enrollment in 2016. For Medicare Advantage enrollees, it is not possible to verify survey-reported events in the MCBS with administrative claims data, as is done for beneficiaries in traditional Medicare. This has the effect of biasing downward survey-reported out-of-pocket spending amounts for Medicare Advantage enrollees compared to beneficiaries with traditional Medicare. It is not possible to determine whether observed differences are real or due to underlying differences in the data collection, verification, and imputation process for out-of-pocket spending by beneficiaries in traditional Medicare and Medicare Advantage. Therefore, we exclude Medicare Advantage enrollees (unweighted n=2,726) to avoid introducing bias associated with underreporting of events and spending for this population.

We also excluded beneficiaries who were enrolled in only Part A or Part B (unweighted n=298) and those with Medicare as a Secondary Payer (unweighted n=231) for most of their Medicare enrollment in 2016 Because Medicare is typically not the primary payer for those who are enrolled in only Part A or Part B but not both programs, beneficiaries with only Part A or Part B also have significantly lower average total out-of-pocket spending relative to those enrolled in both Part A and B, which is the rationale for excluding them from the analysis of out-of-pocket spending.

After excluding these groups of enrollees, our sample for the analysis of spending as a share of total income included 5,369 respondents in traditional Medicare (32.7 million weighted) in 2016. We analyze out-of-pocket spending among all traditional Medicare beneficiaries and by specific beneficiary subgroups, including age (under 65, 65-74, 75-84, 85 and over), gender (female, male), age by gender, race (white non-Hispanic, black non-Hispanic, Hispanic), race by gender, race by age, marital status (married, divorced/separated, widowed, single (never married)), education level (less than high school, high school graduate, some college, college graduate), per capita income categories (increments of $10,000), self-reported health status (excellent, very good, good, fair, poor), number of chronic conditions (none, 1-2, 3-4, 5 or more), Census region (Northeast, Midwest, South, West), metropolitan area (metropolitan, rural micropolitan, rural adjacent or nonadjacent), type of residence (community, facility), supplemental coverage (employer-sponsored insurance (ESI), Medicaid, Medigap, none), hospital use (no inpatient stay, any inpatient stay, one inpatient stay, two or more inpatient stays), and specific chronic conditions.

Out-of-Pocket Health Care Spending

Out-of-pocket spending for medical and long-term care services reported in the MCBS is not the same as beneficiary liability or the Medicare cost-sharing amount for services used. Instead, out-of-pocket spending amounts are net of payments by any third-party payers, such as payments by Medicaid, Medigap, or employer-sponsored insurance. Survey-reported out-of-pocket payments are those payments made by the beneficiary or their family, including direct cash payments or in the form of Social Security or Supplemental Security Income (SSI) checks to a nursing home.

Out-of-pocket spending on premiums is derived from administrative data on Medicare Part A, Part B, and Part D premiums for each sample person along with survey-reported estimates of premium spending for other types of health insurance beneficiaries may have (including Medigap, employer-sponsored insurance, and other public and private sources). Part B premium amounts reported in the MCBS include income-related premiums paid by beneficiaries with higher incomes (more than $85,000 per individual/$170,000 per married couple). The administrative data reflect liability, not the actual payments made by beneficiaries for their premiums, which overstates actual premiums paid for certain groups of beneficiaries who are not responsible for paying their Medicare premiums. People who are dually-eligible for Medicaid are generally not liable for their Part A, Part B, or Part D premiums; those who receive the Part D low-income subsidy are eligible for full or partial coverage of their Part D premium. For these groups of beneficiaries, we adjusted the premium estimates reported in the MCBS to reflect the premium subsidies they receive. For beneficiaries reported as receiving the Part D low-income subsidy but who were not enrolled in benchmark plans (based on Part D contract IDs in the MCBS), we assigned premiums based on plan-specific data from the 2016 Part D landscape file.

The medical and long-term care services included in this analysis are:

  • Dental services: Includes cleaning, x-rays, repair, purchase or repair of dentures, and orthodontic procedures. The basic unit measuring use of these services is a single visit to the dentist, where a variety of services might be rendered.
  • Inpatient hospital services: Includes inpatient hospital stays, including emergency room visits which result in an inpatient admission. The basic unit measuring use of inpatient hospital services is a single admission.
  • Long-term care facility services: Includes individual long-term care facility events; a long-term care facility is defined as having three or more beds and providing long-term care services throughout the facility or in a separately identifiable unit. The basic unit measuring use of long-term care facility services is a “stay” in a nursing home or other long-term care facility. Stays are measured in terms of days of residence in that facility.
  • Medical providers/supplies: Includes medical doctor and practitioner visits; diagnostic laboratory and radiology; medical and surgical services; and durable medical equipment and non-durable supplies, such as eyeglasses or contact lenses and hearing aids, orthopedic items such as canes, walkers, wheelchairs and corrective shoes, diabetic supplies, oxygen supplies and equipment. The basic unit measuring use of these services is a separate visit, procedure, service, or a supplied item for a survey reported event.
  • Outpatient hospital services: Includes outpatient visits to the outpatient department or outpatient clinic of a hospital, as well as emergency room visits that do not result in a hospital admission. The basic unit measuring use of outpatient services is a separate visit to any part of the outpatient department for a survey-reported event.
  • Prescription drugs: Includes individual outpatient prescribed medicine events, including drugs provided to enrollees in Medicare Part D drug plans; excludes prescription medicines provided by the doctor or practitioner as samples and those provided in an inpatient setting. A small number of Part B drugs (physician-administered) are collected as survey-reported data in the MCBS prescription medicines data file. However, the data added from claims is only from Part D. There are no survey-reported drugs administered by a physician matched from the Part B administrative claims data. The basic unit measuring use of prescription drugs is a single purchase of a single drug in a single container.
  • Skilled nursing facility services: Includes short-term institutional stays, such as skilled nursing home stays or rehabilitation hospital stays; excludes inpatient hospital admissions and long-term care facility stays. The basic unit measuring use of these services is an admission.

Income

The MCBS includes a measure of total income for individual respondents and their spouses, if applicable. However, the MCBS does not report all sources of income that some beneficiaries may have. As in many other surveys, income is self-reported, with beneficiaries asked to report total annual income for themselves and their spouses (where applicable) from all sources, including earnings, Social Security, pensions, and asset income. However, beneficiaries are not asked to report specific income amounts by source, and some types of income may go unreported or may be underestimated. Therefore, this measure results in an overall underreporting of income, particularly for those with relatively high incomes. This conclusion is based on a comparison of MCBS income estimates to income estimates from DYNASIM3, in which we measured the divergence of MCBS and DYNASIM income estimates at each percentile of per capita income.

We used the results of this comparison to derive adjustment factors for each percentile with which to rescale each MCBS respondent’s income. In general, this produced estimates of MCBS respondents’ income that are higher than self-reported values and that we believe are a more accurate representation of income among people on Medicare. We then combined this adjusted income estimate with per capita out-of-pocket spending estimates in the MCBS to derive a more reliable estimate of Medicare beneficiaries’ per capita out-of-pocket health care spending as a share of total income than one based on MCBS self-reported income data alone.

Overview of Methods

To estimate total out-of-pocket spending per beneficiary in traditional Medicare, we calculate for each sample person aggregate estimates of out-of-pocket spending on both insurance premiums for Medicare Parts A, B, and D and supplemental insurance coverage, and medical and long-term care services reported in the MCBS. These amounts are averaged across the entire sample of traditional Medicare beneficiaries and weighted to be representative of the traditional Medicare beneficiary population or specific subgroups of beneficiaries. Analysis of spending by type of service includes beneficiaries who did and did not use each type of service. References to “total out-of-pocket spending” in this analysis always include both premiums and service spending. We also often refer to the separate components of total spending (either out-of-pocket spending on services or premiums) in presenting results. For some beneficiary subgroups, estimates of out-of-pocket spending by service type may not add up to the total for all services due to missing data related to small sample size.

To measure per capita out-of-pocket health care spending as a share of per capita total income, we computed for each individual a ratio of out-of-pocket spending to total per capita income, arrayed the individual ratios of annual out-of-pocket spending to annual income from low to high and computed the median for the entire group of traditional Medicare beneficiaries, and by beneficiary subgroups.

Due to missing data related to small sample size, we are unable to show the median out-of-pocket spending as a share of income for beneficiaries who had Medicaid for part of the year and lived in the community. Similarly, we are unable to show the median out-of-pocket spending as a share of income for Medicare beneficiaries who are black and under the age of 65.
News Release

300+ FAQs Help Consumers Understand the ACA Marketplaces as Open Enrollment Begins

Published: Oct 28, 2019

Ahead of the annual Affordable Care Act (ACA) open enrollment period, the time during which consumers can shop for health plans or renew existing coverage, KFF has updated and expanded its searchable collection of more than 300 Frequently Asked Questions about open enrollment, the health insurance marketplaces and the ACA.

Designed to help consumers and the navigators, brokers and others who assist them, the FAQs cover a wide range of topics including eligibility for subsidies, requirements for health coverage and information about health plans offered through state ACA marketplaces.

The updated collection includes a new section addressing the sale of Marketplace plans on private websites, sometimes described as “direct enrollment” sites or “certified enrollment partner” sites, as well as new answers to questions about immigration status and enrollment options for those affected by Hurricane Dorian.

More than 180 of the FAQs in the collection are available in Spanish.

Open enrollment for the Federal and most state marketplaces begins Friday, Nov. 1, 2019 and ends on Sunday, Dec. 15, 2019. Organizations assisting consumers are encouraged to link to the FAQ web page. Each question and answer may be shared individually by direct link, via Twitter and Facebook.

In addition to the FAQs, KFF also offers short, printable fact sheets on four common scenarios for consumers shopping for health plans:

KFF’s Health Insurance Marketplace Calculator will soon be updated with 2020 premium data. Visit https://www.kff.org/understanding-health-insurance for KFF’s most current resources for consumers looking for answers about open enrollment, the marketplaces and health insurance in general.

Addressing Health and Social Needs of Immigrant Families: Lessons from Local Communities

Authors: Samantha Artiga and Olivia Pham
Published: Oct 28, 2019

Executive Summary

Executive Summary

Since taking office, the Trump Administration has implemented a range of policies to curb immigration and enhanced immigration enforcement efforts. Amid this policy and political climate, immigrant families are reporting growing fears and challenges which are affecting their and their children’s health and well-being and have implications for organizations serving immigrant families and their broader local communities. This brief presents findings from discussions with service providers across sectors (including health, legal, and education), local officials, and parents in immigrant families in the San Francisco Bay Area and San Diego about issues facing immigrant families and providers in the current environment, how the local communities have responded to growing needs, and key priorities and opportunities identified for serving immigrant communities. It is based on roundtable discussions and interviews with service providers and local officials (referred to as providers throughout this brief) and focus groups with parents in immigrant families that were conducted by the Kaiser Family Foundation in Summer 2019. It finds:

Providers and families reported that the shifting policy and political environment has substantially increased fear and uncertainty among immigrant families, leading to negative effects on families and growing pressures on local organizations and communities. They noted that families, including children, have increased mental health needs, such as anxiety and depression, and are facing growing economic pressures that are compounded by fears of accessing public programs and services. Providers expressed concerns about the long-term negative consequences of the current environment for families and the potential implications of worsened health conditions and unrealized potential among the youth for the broader community. They also pointed to growing pressures on service providers and local communities, including stress and secondary trauma among staff serving families and increased challenges providing services, particularly legal support, to families in light of ongoing and uncertain policy changes. Providers and families noted that organizations and communities have shifted some resources and efforts away from longstanding immigrant populations to address needs of new migrants, who are often in crisis and need immediate support.

“I don’t understand how they get by day-by-day. Being traumatized and re-traumatized over and over….I mean these kids are always fearful, always thinking their parents are going to be deported, constantly in trauma.” Legal Services Provider, San Diego

“The crisis today—we’re going to see the effects from it ten years from now, five years from now.” Health Provider, San Francisco Bay Area

“It’s a lot of just having to be in crisis mode and reactionary mode that is really not sustainable. Unhealthy for the people affected, unhealthy for the staff…” Community-based Organization, San Diego

Families are decreasing use of programs and services due to fears. Families and providers pointed to a range of concerns among families about using programs and services, including increased risk of deportation, potential negative impacts on ability to adjust status and/or sponsor relatives, and being required to pay back benefits. Providers indicated that the administration’s changes to public charge and housing assistance policies have amplified fears. Providers and families reported that families are disenrolling themselves and their children from Medi-Cal (the Medicaid program in California) and other programs, and declining to renew or enroll themselves or their children in programs despite being eligible.

“…they’re scared to apply for certain much needed funding whether it’s Calfresh [food assistance] or it’s Medi-Cal, to get them the health insurance.” Family Services Provider, San Francisco San Francisco Bay Area

“…what we’re seeing is a lot of women are very hesitant to now enroll in medical services…They’re getting care here in the very last stages of their pregnancy and…the health of the mom and the child are impacted.” Health Provider, San Diego

Providers described how the San Francisco Bay Area and San Diego communities have responded to growing needs among immigrant families by strengthening cross-sector relationships and enhancing services and supports. They highlighted a range of strategies including strengthening existing or developing new cross-sector relationships, expanding capacity in other sectors to provide mental health screenings and services, increasing services and supports in schools, identifying trusted individuals and organizations to communicate with and assist families, and providing support for staff in service organizations. Providers and families indicated that actions by state and local leaders and certain state and local policies have underpinned the community response.

“I do think that if it wasn’t for building this cross-sector, multi-disciplinary, multi-agency network…we wouldn’t have been able to do some of the good things that we’ve been able to do.” Legal Services Provider, San Diego

“The other component that we are working with…is really building out mental health services and supports to our schools. …how do we provide trainings to teachers to identify depression, identify anxiety and how do we react and what resources do we have in place?” Educator, San Diego

“I live in California. I can go wherever here, and I feel protected because, thank God, we have people who support us and we are a sanctuary city, and that comforts me.” Parent, San Francisco Bay Area

Looking ahead, providers identified a range of priorities, including continuing to integrate and coordinate services and filling gaps in mental health care and legal support. They suggested continuing to strengthen cross-sector partnerships so they are sustainable over time; addressing gaps in mental health and legal services by facilitating connections to existing services and increasing the supply of providers over the long-term; and providing resources to meet the increased demands on non-profit organizations and local governments. Other key priorities they identified included maintaining access to health care as people disenroll from Medi-Cal; addressing shifting demographics and growing needs in underserved areas; educating and informing families, service providers, and legislators about ongoing policy changes; increasing access to data; and developing philanthropic approaches that respond to evolving needs. Providers also pointed to the role state leaders can play in framing public discussion of immigration issues and supporting efforts to address family needs and fill service gaps moving forward.

“…the model of intervention has to be a wraparound model. It has to be a comprehensive set of services that wraps around rather than siloed service…” Family Services Provider, San Francisco Bay Area

“…funding for legal services is critical. Building up the…army of immigration attorneys. …it’s a most complex area of the law, and it’s changing by the minute.” Legal Services Provider, San Diego

“We have seen a great number of people disenrolled in programs for which they are eligible… This does translate to greater burdens on our nonprofit community and our CBOs [community-based organizations], but also on local government to cover all the gaps.” Local Official, San Francisco Bay Area

In sum, families and providers report that the shifting policy and political environment is leading to increased fears and uncertainty among immigrant families that have wide-ranging negative effects on families’ daily lives and health. The growing fears and challenges among families also are increasing pressures on service providers and local communities. The San Francisco Bay Area and San Diego communities have responded to growing family needs in many ways that center on strengthening cross-sector partnerships and relationships and enhancing services and supports for families and service providers. Looking ahead, providers view continuing to support cross-sector collaborations and addressing gaps in services, particularly mental health and legal services, as key priorities. Providers also highlighted an ongoing need for trusted information and education about policy changes for families and service providers. Providers pointed to varied ways state and local leaders and philanthropy can support efforts to address families and service organizations moving forward, and stressed that addressing these needs is key for preventing erosion of California’s progress advancing health.

Issue Brief

Introduction

Since taking office, the Trump Administration has implemented policies to curb immigration and enhanced immigration enforcement efforts. Amid this policy and political climate, immigrant families have reported increased levels of fear and anxiety and challenges affecting their and their children’s daily lives, health, and well-being. Families’ growing fears and needs also have implications for organizations serving immigrant families as well as their broader local communities. This brief presents findings from service providers across sectors (including health, legal, and education), local officials, and parents in immigrant families in the San Francisco Bay Area and San Diego about challenges facing families and providers in the current environment, how the local communities have responded to growing needs, and key priorities and opportunities identified for serving immigrant communities in the future. It is based on policy roundtable discussions and interviews with service providers and local officials (referred to as providers throughout this brief) and focus groups with parents in immigrant families conducted by the Kaiser Family Foundation in Summer 2019 (see Methods box for more information). Blue Shield of California Foundation supported this work.

Challenges Facing Families

Growing levels of fear and uncertainty. Providers and families reported that families are fearful of raids and deportation and being separated from their children. They noted that these fears extend to children who worry about being separated from their parents as well as to people of varied immigration statuses, including legal immigrants. Fears are leading some families to limit daily activities such as driving and social interaction. Some individuals also are fearful of interacting with the police, leading to concerns among providers and families that individuals may be less willing to report crimes, including incidences of domestic violence. Providers pointed out that the fears among families are not new, but have become more intense in the current environment. Families and providers also described how increased discrimination and bullying in schools is leading some children to feel isolated and disconnected from the local community and noted that Muslim communities have been particularly affected by these issues.

“If something happens…who am I going to leave them with? Is it very hard, and they get sad because in TV they show they separate the kids from the parents, they take the parents and leave the kids here.” Parent, San Francisco Bay Area

“I try not to talk as much with others…if someone greets me, I greet them back, but I try not to have a conversation with them. I am fearful.” Parent, San Diego

“As many of you have talked about the situations in the school districts or in the school sites—there definitely has been a higher rate of anxiety….Also what we see is the increase of bullying.” Educator, San Diego

“We have a lot of fear about deportation, not just from our undocumented population, but from our longtime immigrants.” Local Official, San Francisco Bay Area

Economic pressures. Providers and families described how many immigrant families have faced challenges paying their monthly expenses, especially as costs of basic needs continue to increase. They indicated that the current climate has exacerbated these economic challenges because it has led some individuals to lose jobs, resulted in more limited job options, and made some individuals scared to seek a job or go to work.

“I get anxious because we don’t have enough for the rent….We are making sacrifices to be better financially, but some things are affecting us.” Parent, San Diego

“Sometimes I work 12 hours, 4 days per week. I have to work….I am very worried about making enough for the rent and for my daughter– and food.” Parent, San Francisco Bay Area

“I tell my husband, ‘I rather only you go to work, and I stay home with the kids. I won’t go to work; the situation is not safe.’” Parent, San Diego

Housing challenges. Providers and families reported that continually rising housing costs in these communities are pushing families into crowded living situations and/or out of communities. Providers emphasized that families often have unequal housing relationships with landlords and landlords sometimes use threats of immigration enforcement to intimidate families, leaving them vulnerable to unfair and/or unsafe housing situations. They also stressed that the administration’s recent proposed changes to housing assistance policies would limit access to assistance for mixed immigration status families, further amplifying the housing challenges they face.

“…it’s no longer doubling up…it really is an acute health issue where families are living in garages, closets, single residency occupancy, hotels–and I’m not talking about one family, but multiple families.” Local Official, San Francisco Bay Area

“…the lack of affordable housing in San Diego is very much a driver of this. And some landlords believe that they need to get their current tenants out so that they can raise rents and have people come in that are not immigrants, and so they perform illegal evictions.” Legal Services Provider, San Diego

Increased mental health needs. Families, including children, are experiencing high levels of stress, anxiety, and depression due to increased fear and uncertainty, according to providers and families. Moreover, they described effects on behavior and health, such as problems sleeping or eating; psychosomatic symptoms, such as headaches and stomachaches; and worsened chronic conditions, such as asthma and diabetes. Providers noted that, for many individuals, these issues compound existing mental health needs stemming from histories of violence and trauma. Families recognized that they and their children might benefit from mental health care but pointed to stigma, cost, and lack of providers as barriers to care. Similarly, providers highlighted the large gap in available mental health services to meet growing needs, especially providers who can offer linguistically and culturally appropriate care.

“My 12-year-old daughter was affected the most; she has deep feelings about this. Every day she says she is praying for me so I can arrive safely home….sometimes I find her in her room reading and crying.” Parent, San Francisco Bay Area

“I don’t understand how they get by day-by-day. Being traumatized and re-traumatized over and over….I mean these kids are always fearful, always thinking their parents are going to be deported, constantly in trauma.” Legal Services Provider, San Diego

“…they went through a very traumatic journey to get here…And then, living here is traumatic for lots of reasons just because it’s a new place and you don’t speak the language and you’re afraid of the government, so the mental health needs are really very extreme and we are not good at serving those. That is our biggest gap by far.” Health Provider, San Francisco Bay Area

Potential long-term consequences. Providers expressed significant concerns about the long-term negative physical and behavioral health consequences of the fears and growing mental health needs among families. They are worried that the current environment will contribute to worsened physical and mental health outcomes and limit potential future contributions, particularly among youth. They noted that these consequences would not only affect immigrant families but also their broader communities.

“I’ve always wanted to finish my engineering career… but I also have the fear. My wife says, go and study, but there is also the fear that I am undocumented, how am I going to study?” Parent, San Diego

“…We have a mental health team at this school, but we’ve gotten a lot more referrals just in the past year…kids that are academically not doing well, they were doing well and they’re not. The kids have a lot of anxiety. They are losing sort of like ‘what’s my goal?’” Health Provider, San Diego

“The crisis today—we’re going to see the effects from it ten years from now, five years from now. Attachment issues…infant-parent attachment—but more important is community attachment—that’s been disrupted….” Health Provider, San Francisco Bay Area


Decreased Use of Programs and Services due to Fears

Fears of accessing programs and services. Providers said that proposed changes to housing assistance policies as well as proposed changes to public charge policy (which were finalized after the roundtables, interviews, and focus groups were conducted and recently halted under a court order) have made families increasingly wary of enrolling in programs or seeking services for themselves and their children. Families have a range of concerns about participating in programs stemming from confusion and uncertainty about the changes, including fear of increased risk of deportation, negative consequences on ability to adjust status or sponsor other family members, and being required to pay back benefits. Providers reported that an increasing number of families are disenrolling themselves and their children from programs, including Medi-Cal (California’s Medicaid program), and not renewing or not enrolling in programs even though they or their children are eligible and are not directly affected by the policy changes.

“In my case, when I got WIC some years ago, the situation was different, it wasn’t as intense as now. If I had to request WIC now, I wouldn’t do it.” Parent, San Diego

“…they’re scared to apply for certain much needed funding whether it’s Calfresh [food assistance] or it’s Medi-Cal, to get them the health insurance.” Family Services Provider, San Francisco Bay Area

“…when they do adjust and they are eligible for all these public benefits, a lot of them, they don’t even want to apply for it anymore. And they waited years, months to be eligible for these benefits, but they’re just so afraid that the public charge will hurt them…..” Legal Services Provider, San Francisco Bay Area

“…we had hundreds of calls from people, mostly in mixed families status who called and said, ‘Get my son off Medi-Cal right now.’ ‘Why? He’s a U.S. citizen and so are you.’ ‘Just do it. Just do it. I don’t want anybody looking at my family.’” Legal Services Provider, San Diego

“…a patient that needed to be discharged with dialysis in place…absolutely refused to accept Medi-Cal coverage because he was concerned about public charge and so the decision that he made instead was to go across the border to Mexico every day.” Health Provider, San Diego

Health and economic impacts of decreased program use. Providers noted that families’ decreased participation in programs further increases the economic challenges they face. The also pointed to negative effects on health resulting from decreased participation in Medi-Cal and other support programs, such as increased risk of food insecurity and worse health outcomes due to delayed prenatal care, lack of access to specialty care, and less continuity of care.

“…it feels like there’s two destabilizing factors, public charge and families’ willingness to enroll or rely on those systems…because it [moves] families into greater poverty and alienates them even more from the local safety net, including legal aid.” Legal Services Provider, San Francisco Bay Area

“…sometimes we screen and we find things that are wrong with them and we want to refer and do a lot of things and then it just stops there. So, our health outcomes are severely impacted by this sort of fear….” Health Provider, San Diego

“…we had a patient who had a breast mass. Our physician had told her to go see a specialist. And because she had heard about public charge, she did not want to go see the specialist….” Health Provider, San Francisco Bay Area

“…what we’re seeing is a lot of women are very hesitant to now enroll in medical services. …They’re getting care here in the very last stages of their pregnancy and…the health of the mom and the child are impacted.” Health Provider, San Diego


Impacts on Service Providers and Communities

Increased pressures on service providers. Providers noted that staff in service organizations often come from shared backgrounds and experiences of the families they serve and experience secondary or vicarious trauma working with families in the current environment. Moreover, addressing families’ growing needs has strained organizational capacity, especially since organizations were typically operating at full capacity before needs increased. Providers said they are operating in a reactive, crisis-response mode, leaving them little time or opportunity to strategize and plan. Moreover, they described how the constantly shifting legal and policy environment makes it difficult for staff to stay up-to-date on changes and leaves them feeling uncertain about how to advise families on some topics. Providers also pointed out that many staff in service organizations face their own economic challenges living in high-cost areas, making it difficult to retain staff.

“…I think we’re beyond secondary trauma and I think it’s been so intense that it’s now just primary trauma for the advocates, especially if they have lived experience…and the fact that people can’t keep up as attorneys and advocates with the shifts in the law…So it’s both the legal environment in which they’re trying to practice, and the face-to-face work with their clients.” Legal Services Provider, San Francisco Bay Area

“It’s a lot of just having to be in crisis mode and reactionary mode that is really not sustainable. Unhealthy for the people affected, unhealthy for the staff…” Community-based Organization, San Diego

“…we’re also losing a lot of the workforce in human services because they can’t afford to live here either.” Local Official, San Francisco Bay Area

Growing complexity and challenges associated with providing legal support. Legal services providers noted that they have experienced major increases in case volume over the last few years. At the same time, the length of time to process cases has increased, often extending beyond the duration of funding available to support the work. They also noted that the constantly shifting legal environment has made it increasingly difficult to stay up-to-date on policies and determine legal strategies, even for experts. Other challenges they pointed to included changes in fee waiver programs that have created new cost barriers to avenues of immigration relief and lack of sufficient mental health resources to conduct psychological assessments often required to support cases. Providers noted that, while there have been substantial increases in resources for direct legal support in recent years, many of these resources cannot be used to support operations or infrastructure development, making it difficult for organizations to expand capacity to address growing needs. They stressed that, overall, legal services capacity remains insufficient to meet current needs, and pointed to a particularly large gap in availability of bilingual providers.

“I think we’re all facing concerns about the increasing length of time on asylum cases.  …The funding no longer syncs up with the duration of the case. So you get funded to do asylum work and the cases now take so long that the funding is likely gone, but you’re continuing to work on the case…” Legal Services Provider, San Francisco Bay Area

“The other real destabilizing factor is…that it’s going to become harder for people to access fee waivers…very few people in the population that we’re working with can afford those fees.” Legal Services Provider, San Francisco Bay Area

“So there are many areas of relief for immigration services…where you have a psychological evaluation or a mental health screening to support the legal case. None of those areas are funded.” Legal Services Provider, San Diego

“But really having to adapt and educate ourselves as things are changing….we’re constantly having to shift and reeducate ourselves and then create a new legal strategy. So that’s been difficult.” Legal Services Provider, San Francisco Bay Area

Addressing needs of new migrants. Providers and families noted that organizations and communities have shifted some resources and efforts away from longstanding immigrant populations to address needs of new migrants, particularly in border regions. Because newcomer populations are in crisis, organizations have focused on providing protection and crisis management for these groups. In addition, legal services providers have redirected some support to newcomers because they may have pathways to legal status, for example, through asylum, while opportunities for longstanding immigrants to naturalize or adjust status have become more limited due to declines in fee waivers and other policy changes.

“…this newcomer population if we gain their asylum, if we win their asylum cases they will have a work permit and they will eventually qualify to become permanent residents and citizens. And so we feel that the social return on investment is critical in investing in this newcomer population.” Family Services Provider, San Francisco Bay Area

“…the whole emphasis of the work that we did was to get folks citizenship. And that’s pretty much gone away…the work has completely changed.” Legal Services Provider, San Diego

Immigration enforcement in border areas. San Diego providers noted that, because they are close to the border, deportation can happen rapidly leaving little time for intervention or defense. Moreover, they indicated that the presence of interior checkpoints and controls and visible presence of Immigration and Customs Enforcement (ICE) and Department of Homeland Security (DHS) agents in the community increases fears among families and leads some to limit their activity and travel within the region. They emphasized that when agents bring individuals in custody to hospitals for care it raises fears among other patients and creates challenges for health providers, who lack clarity on their and their patients’ rights and health privacy rules in these situations. Providers further noted that federal officials have enhanced authority in border regions, such as being able to enter private property and interrogate without a warrant. Providers also pointed to the unique needs and challenges of binational families in border areas and indicated that it has become increasingly stressful for these families to cross the border, including children who cross the border daily for school.

“It also means that the speed of deportation is fast. If you are a Mexican national, you are deported by sundown. That is fast.” Community-Based Organization, San Diego

“If there’s a border patrol out there, there is a lot of panic and distress it does trigger.” Health Provider, San Diego

“…families that cross the border…they have that set of stress about crossing every day–is there going to be a day where they close the borders? …that kind of like constant worry and threat…” Health Provider, San Diego


Successful Strategies and Lessons Learned

Strengthening cross-sector partnerships and collaborations. Providers described a range of new cross-sector partnerships and relationships that have developed in recent years to provide more coordinated and integrated services to meet families’ needs. Some examples they cited included health care and legal services partnerships, a legal services provider working with a social worker to enhance support for families, a dental health clinic adding an on-site mental health counselor, and a legal services provider hiring a psychologist. Providers stressed that building on existing organizational strengths and capacities and existing partnerships or collaborations helps prevent duplication of efforts. They noted that public-private partnerships can be particularly effective since supportive local agencies can facilitate access to funding and communicate needs to the state, and community-based organizations have strong connections with the community. In San Diego, providers pointed to development of the rapid response network—a coalition of human rights and service organizations, attorneys, and community leaders—as key to supporting the community response, which has included creating a new shelter and providing health care and other services to asylum-seekers. Providers further noted that the rapid response network has facilitated the ability of local legal services providers to coordinate and prioritize their legal support to families, which has contributed to more efficient and effective use of funds.

“I think that we clearly need more social workers on staff, but I think…the work of our attorneys is way more effective having me on staff there…I am the plan person who educates providers, guardians, parents…to help build bridges between the barriers that are ongoing related to whether it’s health or other immigration issues.” Legal Services Provider, San Francisco Bay Area

“I do think that if it wasn’t for building this cross-sector, multi-disciplinary, multi-agency network…we wouldn’t have been able to do some of the good things that we’ve been able to do, not just on the sheltering side but on the improving access to legal services side.” Legal Services Provider, San Diego

Expanding capacity in other sectors to screen for and address mental health needs. As noted, one of the key challenges identified by providers and families is lack of sufficient mental health services to meet family needs. To help address this gap, some providers in other sectors have expanded their focus on and capacity to address mental health needs. For example, one provider described participating in a training for health care providers, including primary care providers and pediatricians, to provide mental health screenings and basic mental health treatment as part of their scope of care. It was noted that expanding health care providers’ ability to provide mental health screenings and treatment increases access to care for families and frees up capacity of behavioral health providers to address more complex and severe cases. Providers also reported that a growing number of teachers and staff in schools are being trained to screen for and identify mental health needs and link families to services. Further, providers pointed to cross-sector training in how to provide trauma-informed care and recognizing a broad scope of services as mental health care, including indigenous forms of healing and community support groups, as strategies to help address mental health needs.

“…one opportunity would be for the medical community—primary care, pediatricians, family practice doctors—to think about broadening scope of practice to include basic mental health services. I think it unburdens our mental health pipeline so that the psychiatrists, psychologists can treat some of the more complicated conditions.” Health Provider, San Francisco Bay Area

“…a lot of our healing mechanisms are different and so we… we talk about herbal healing, we talk about history, storytelling—that’s how we heal. And, so how can we collaborate with Western and then indigenous forms of healing….” Family Services Provider, San Francisco Bay Area

“…we have provider training sessions where we bring in our legal advocacy units to help them to see and to maybe learn how to question or ask questions in a way that’s a little more culturally sensitive or impactful.” Health Provider, San Diego

Enhancing services and supports in schools. Providers described a number of ways schools have responded to growing fears and uncertainties among families. For example, some schools have added signage and messaging designed to create a safe and welcoming space and trained staff on how to respond if enforcement agents come on-site or if a student reports detention of a family member. Providers also indicated that teachers and staff in schools are increasingly recognizing stressors and factors that may be causing students to be late or tired and responding to these issues by linking students to mental health and other services rather than punishing them. Providers pointed to movement within some schools to offer more services “inside” (i.e. school-based clinics) rather than referring students out to services since having services available on-site reduces barriers to care. However, they recognized that schools face financial and resource constraints that limit their ability to expand their services.

“We have not been successful referring students offsite to mental health services. So, as a result, we keep bringing more mental health right into the [school] clinic because they will come to the clinic, but they won’t go offsite….” Health Provider, San Diego

“The other component that we are working with…is really building out mental health services and supports to our schools. …how do we provide trainings to teachers to identify depression, identify anxiety and how do we react and what resources do we have in place?” Educator, San Diego

“…we can’t educate our students if we’re not addressing the nonacademic barriers to their academic success. So our role has increasingly expanded to understanding what are those barriers to students being in school, staying in school, thriving in school, and making sure that we are partnering, if not directly resourcing our work to address their needs.” Educator, San Francisco Bay Area

“All of our schools have been trained and are prepared to respond to ICE activity at the school, which generally wouldn’t happen, but if a family member or a student comes and says that a family member has been detained, our schools are prepared in addressing that….” Educator, San Francisco Bay Area

Identifying trusted individuals and organizations. Amid growing fears and uncertainties, providers and families noted that families trust few individuals and organizations. They indicated that churches and schools remain key trusted resources and described how clergy and faith leaders have assumed new roles helping families respond to and navigate different experiences, including detention or deportation of a family member. They recognized that health care providers and schools also serve as trusted resources for families, although, in some cases, families feel wary about sharing information about their family’s immigration status with their health care provider or children’s school.

“…we have to be on school campuses, we have to be in community clinics, we have to have better partnerships with the churches. We have to do more home visiting because of people’s fears and also who we employ is very, very important.” Family Services Provider, San Francisco Bay Area

“…people come to congregations when they feel unsafe. They come not just wanting prayer and healing spaces, but wanting to be led and accompanied really through the navigation of whether to deportation, whether it’s a health scare, whatever is happening in their life.” Community-Based Organization, San Diego

Increasing support for staff in service organizations. Given the growing intensity and stress associated with serving immigrant families, providers reported it has become increasingly important to provide support to staff in service organizations. For example, some have implemented wellness initiatives and are providing counseling support for staff. Providers also described challenges retaining staff, particularly in high-cost areas, and some indicated they are focusing on increasing wages and enhancing equity in organizational leadership to increase retention.

“…the organization was no longer saying we give you permission to focus on self-care but we’re building self-care into the fabric of what it means to work here.” Legal Services Provider, San Francisco Bay Area

“We got a bilingual, bicultural therapist to…do some work with our staff around vicarious trauma and compassion burnout…” Legal Services, San Diego

“One thing that we’ve done is we created a wellness strategy internally. We’re sort of in the nascent stages of that, but we’re looking at equity across the organization, increasing to living wage for own staff.” Legal Services Provider, San Francisco Bay Area

State and local policies and leaders supporting families and providers. Providers and families described how certain state and local policies have underpinned the community response. For example, they noted that state and local sanctuary policies help families feel safe in their local communities and policies that protect people’s privacy and minimize requested information can facilitate access to services. Providers also explained how state and local leaders have taken supportive actions. For example, they noted that Governor Gavin Newsom has supported the community through symbolic actions, such as visiting the border, as well as through direct actions, by increasing state funding for services. Providers in San Diego described how leadership by a local council member was instrumental for establishing the new shelter for asylum-seeking families.

“I live in California. I can go wherever here, and I feel protected because, thank God, we have people who support us and we are a sanctuary city, and that comforts me.” Parent, San Francisco Bay Area

“…we have more protection and inclusion in funding…in local governments to send a message to migrants that their work is appreciated and that they’re equal members of our communities.” Local Official, San Francisco Bay Area

“…and noting that our city and county don’t have any funding for the legal services, the state has really been the government agency that has stepped up.” Legal Services Provider, San Diego


Future Priorities Identified by Providers Serving Immigrant Communities

Continued development of cross-sector partnerships and collaborations. Looking ahead, providers suggested building on networks and collaborations to expand integrated support for families. They noted that this entails identifying mechanisms and resources to make partnerships and collaborations sustainable over time and continuing to identify systems and structures to facilitate referrals and connections across sectors. For example, one provider suggested creating multi-sector resource centers that could serve as a central point to direct resources and for families to obtain a diverse range of services. Another suggestion was to expand training of community workers, such as promotoras and community health workers, to provide a broader array of multi-sector supports and linkages.

“…the model of intervention has to be a wraparound model. It has to be a comprehensive set of services that wraps around rather than siloed service…” Family Services Provider, San Francisco Bay Area

“…but my big dream is that we combine it…and we serve as a gateway to primary care…and a gateway to mental health care, to legal support for families that need it.” Health Provider, San Francisco Bay Area

“But being able to be armed to talk about food, mental health, immigration… I think it’s too fragmented. I would like to see funding to bring together a group of disseminators.” Legal Services Provider, San Diego

Addressing gaps in mental health and legal services. Providers highlighted the need to implement long-term strategies to expand the supply of mental health providers and immigration attorneys, particularly those that can provide linguistically and appropriate care. In the short-term, they pointed to strategies such as creating inventories of available services within a local area to assist with linking families to assistance, expanding capacity in other sectors to conduct basic mental health screenings and treatment, and incorporating more mental health services into schools. Providers also noted that, as border policies continue to evolve, they are examining how to provide legal representation to people being required to wait on the other side of the border.

“So I would say, as an immigration attorney, that funding for legal services is critical. Building up the…army of immigration attorneys. …it’s a most complex area of the law, and it’s changing by the minute.” Legal Services Provider, San Diego

“We’re having a hard time attracting bilingual immigration attorneys. We’re having a hard time attracting bilingual mental health providers, social workers, etc. …so how can we partner with universities to nurture those leaders of the future? How can we boost the sector so that it becomes attractive to future professionals and then how do we also sustain funding beyond one year cycles or two year cycles?” Family Services Provider, San Francisco Bay Area

“…we need an inventory of mental health care providers across the Bay Area so we can support families through system navigation and reaching and accessing those programs.” Family Services Provider, San Francisco Bay Area

“…it’s really important to start thinking creatively on how legal representation is going to look like for those who are waiting on the other side of the border for months. And how they’re going to be able to access those services before they get to court….” Legal Services Provider, San Diego

Meeting increased demands on non-profit organizations and local resources. As family needs have evolved and increased, providers noted that non-profits have stepped in to meet new challenges and fill gaps, often without readily available funding. They further noted that, although there have been increases in funding for some services, funding often is tied to direct services, leaving non-profits without resources to support infrastructure development or operating costs. They suggested that flexible funding that meets organizations’ evolving needs, including resources to support infrastructure development and operating costs, would help in sustaining their ability to serve families. Providers also emphasized that local government is facing new demands, including responding to needs of new migrants and increased use of local resources and services as families disenroll from public programs.

“…Our biggest challenge right now in this institution is space. We could get two million dollars tomorrow and I have nowhere to sit attorneys.” Family Services Provider, San Francisco Bay Area

“…it was all nonprofits and the two community clinics — responded right away [to meet the needs of migrant families] and they put their mobile units there and provided healthcare consistently. They did it without any funding.” Health Provider, San Diego

“We have seen a great number of people disenrolled in programs for which they are eligible… This does translate to greater burdens on our nonprofit community and our CBOs, but also on local government to cover all the gaps.” Local Official, San Francisco Bay Area

Maintaining access to health care to prevent erosion of progress advancing health. Providers described how families are increasingly turning to informal support services as they disenroll from public programs. They stressed that maintaining families’ access to health care despite their disenrollment from programs would help prevent erosion of progress achieved advancing health through the state’s earlier coverage initiatives, such as its Medi-Cal expansion to pregnant women and children regardless of immigration status. Providers also noted that the state will likely face challenges implementing its new Medi-Cal expansion to young undocumented immigrant adults due to families’ fears about participating in public programs. They suggested that continuing education and messaging in the community could help promote enrollment and minimize disenrollment due to fears, but recognized that overcoming fears is challenging in the current environment.

“Our main concern is always to mitigate any kind of further damage, like direct damage.  Like a child doesn’t have milk because their mom can’t afford when they could be getting it with WIC. Or a mom’s not taking her child who has a fever to General Hospital because she’s afraid that ICE is going to catch her….” Family Services Provider, San Francisco Bay Area

“…we’ve mobilized our informal food safety net, so when a family says they’re not as interested in CalFresh, I’ll move on to talking about our food bank…So really trying to talk about making it…two lanes instead of one…” Health Provider, San Francisco Bay Area

Addressing shifting demographics and growing needs in underserved areas. Providers indicated that communities have emerging language needs, for example among a growing Mayan community, for whom they do not have sufficient language resources to meet. They also discussed how the displacement of families due to continually increasing housing and living costs has resulted in a growing number of families living in areas with a dearth of services to meet their needs.

“Economically at baseline, it’s always been hard to live here. I’ve never known a time when our families haven’t been struggling, but I would say now many families have in our area have moved …we’ve had a huge exodus of families….” Health Provider, San Francisco Bay Area

“We have a multitude of different cultures coming in and at some point you know we’ve had families that were nodding their heads responding as yes, and we would ask another question and find out that’s a whole different dialect.” Health Provider, San Diego

“…the landscape and the picture of who we’re serving and what that means is very different than I think many of even our service providers and certainly our educators are accustomed to.” Educator, San Francisco Bay Area

Continuing to educate and inform families and service providers about policy changes. Families and providers said it is difficult to stay up-to-date on and understand continually evolving policies. They want more access to information about changing policies and their rights. Providers pointed to the ongoing need to educate staff in various organizations (e.g., health care providers, hospitals, schools, etc.) about their rights and how to respond if immigration agents come on site as well as to equip service providers with tools and information to communicate with families. In San Diego, providers stressed that legal analysis to provide increased clarity on how federal border enforcement authorities interact with state laws and health-related rules and rights would be helpful for health care providers.

“…there’s a lot of confusion and a lot of rumors around these things and we do a certain amount to try to convince them or to tell them that what is going to be safe or not; and the bottom line is we often don’t have a good answer for that. We have what we think is the current law today…but it is a little bit touch and go and things are changing….” Health Provider, San Francisco Bay Area

“What kind of resources, what kind of people do we bring in, what kind of training do we have to put in place so we can support the needs of our communities? It’s a challenging environment, internally as well as externally.” Health Provider, San Diego

Utilizing data to document needs and impacts of policy changes. Providers pointed to the need for more local and disaggregated data to understand different population needs and how the shifting legal and policy environment is affecting groups. They noted that non-profits generate data but often lack capacity to analyze it and suggested that community-based organizations can collaborate with universities or other research organizations to enhance analytic capacity. They emphasized that when community-based organizations engage in these types of partnerships, they have an opportunity to identify return benefits they might realize from engaging in the research—for example, one organization was able to increase screenings for patients through participation in a research project. They also emphasized the value of utilizing a community-based framework for research that allows community-based organizations to serve as equal partners in the research.

“…we have made a strategic decision that we will only engage in participatory research that has a return for us—to the community.” Family Services Provider, San Francisco Bay Area

Recognizing the role of philanthropy, state and local leaders, and communications strategies to address needs and frame public discussion. Providers suggested it is helpful for funders to recognize the full cost of projects by taking into account operations and administrative costs of grantees. They indicated that some funders are shifting toward multi-year operating grants to allow for more flexibility and responsiveness among grantees. Providers pointed to a number of areas where funding could be directed beyond direct services, including community building, communication strategies, data collection and research, and transnational work across the border. It was also noted that having a funding collaborative focused on issues affecting immigrant families facilitates a coordinated philanthropic response. Providers also pointed to the role state leaders can play in framing public discussion of immigration issues and supporting efforts to address family needs and fill service gaps moving forward. They also suggested that it will be important to continue to foster leadership development within the affected communities and discussed the value of focusing on the strengths and resiliency of immigrant families. They suggested incorporating voices from directly impacted groups into communications strategies and noted that funders could support these efforts through funding for ethnic and social media.

“There’s been a shift in the foundation world it seems to move towards multiple year funding…it means I don’t have to be reapplying every year for the same grant and I can focus more of my time on policy advocacy and strengthening our programs…” Family Services Provider, San Francisco Bay Area

“…So thinking about, how do you lift people up? …we have many needs and we have many things that we need help with, but you also have assets in the community. Don’t forget the assets and the voices and the stories, because data will inform planning, but it’s those human stories that will move people to action.” Local Official, San Francisco Bay Area


Conclusion

In sum, the findings from these roundtables, interviews, and focus groups illustrate that the shifting policy and political environment has substantially increased fears and uncertainty among immigrant families. As described by providers and families, these fears are having broad negative effects on families’ daily lives and health and well-being and increasing pressures on local organizations and communities. The San Francisco Bay Area and San Diego communities have responded to growing family needs in multiple ways, including developing cross-sector partnerships and relationships, expanding the focus on and capacity to provide mental health care in other sectors, enhancing services and supports in schools, identifying trusted individuals and organizations, and increasing support for staff in service organizations. Providers and families also indicated that state and local leaders and policies have underpinned the community response.

Providers identified a range of priorities to sustain and enhance support for families looking ahead, including continued development of cross-sector partnerships and collaborations; addressing gaps in mental health and legal services; meeting increased demands on non-profit organizations and local resources; maintaining access to health care; addressing shifting demographics and growing needs in underserved areas; educating and informing families and service providers about ongoing policy changes; increasing access to data; and developing philanthropic approaches that respond to evolving needs. They also pointed to the importance of messages that focuses on the strengths, resiliency, and benefits of immigrant families for their communities and the nation as priorities moving forward. As the ongoing national debate over immigration policy and enforcement continues, these discussions with service providers and families illustrate the effect it is having on immigrants themselves and the organizations that serve them.

Methods

The Kaiser Family Foundation, working with Donna Cohen Ross and PerryUndem Research/Communication, conducted policy roundtable discussions and structured individual interviews with individuals from organizations across various sectors serving immigrant families in the Bay Area and San Diego. We conducted two policy roundtable discussions in July 2019, one in San Francisco with 19 participants and one in San Diego with 16 participants, as well as 11 individual interviews in June 2019. Participants in the roundtable discussions and interviews included health and behavioral health providers, educators, legal services providers, community-based organizations, faith-based organizations, funders, and local officials who we identified as key service providers for immigrant families in the community.

In addition, we conducted two focus groups with Spanish-speaking parents in immigrant families in the Bay Area and San Diego in June 2019. Local focus group facilities recruited participants, and PerryUndem Research/Communication moderated the groups in Spanish. There were eight participants in each group. Participants included low-income adults with family incomes at or below 250% FPL who were parents or guardians of a minor in the household and who had at least one immediate family member in the household who was a noncitizen.

The authors thank Blue Shield of California Foundation for its support for this work. They also extend their deep appreciation to the families and organizations who shared their time and experiences to inform this brief.


ACA Open Enrollment: For Consumers Considering Short-Term Policies

Published: Oct 25, 2019

Some insurers and web brokers now actively promote the sale of short-term health insurance policies.  As the name implies, short-term policies offer health coverage for less than one year. Typically these policies offer fewer covered benefits and consumer protections compared to plans that meet all Affordable Care Act (ACA) standards.  As a result, short-term policies generally have lower premiums.  Short-term policies are never sold in the marketplace and differ from marketplace policies in other important respects.   This fact sheet identifies features of short-term policies consumers may wish to check carefully.

Eligibility based on health status

Except in states that prohibit their sale,[1] short term health insurance policies are medically underwritten.  That means consumers generally will be turned down if they have pre-existing health conditions.  Short-term policy applications ask questions about health – for example, if the applicant is pregnant or planning to get pregnant, of if the applicant has been diagnosed or treated for cancer, hepatitis, mental health or substance use disorders, HIV/AIDS, or other conditions.  Insurers generally refuse to sell short-term policies to people who answer “yes” to any of those questions.

Duration of coverage and “renewability”

Unless state rules limit the duration of short-term policies, they are allowed to provide coverage for up to 364 days.  Shorter-term policies – for example, lasting 3 or 6 months – are also for sale.  At the end of the policy term, coverage ends.  Some policies may include an option to extend or renew coverage at the end of the policy term.  However, it is up to the insurer to decide.  People who buy a short-term policy and then get sick most likely will not be able to extend or renew coverage.

Importantly, loss of coverage under a short-term policy during the year does not make people eligible for a special enrollment period (SEP) to switch to an ACA-compliant marketplace policy.  They will have to wait until the next Open Enrollment period to buy a plan that cannot turn them down.

Limits on covered benefits

Short-term policies can seem similar to major-medical coverage, though limits often apply.  For example:

  • Limits on covered doctor visits – Check to see if the short-term policy limits the number of covered doctor visits, for example, to no more than 3 visits.
  • Dollar limits on covered benefits – Check to see if dollar limits on specific covered benefits apply – such as $1,000 per day in the hospital. If a policy applies dollar limits, actual charges above the limit will not be covered.  (For example, according to healthcare.gov, the average cost of a 3-day hospital stay is around $30,000.)  Virtually all short-term policies apply a dollar cap to all covered benefits, e.g., ranging from $100,000 to $2 million.
  • Limits on prescription drug coverage – If prescription drugs are covered, check to see if other limits apply, for example, whether drugs are covered only during an inpatient hospital stay. Some short-term policies might not cover drugs at all but offer a drug discount card instead. A discount card is not the same as insurance coverage; the patient will have to pay the entire discounted price without any insurance reimbursement.
  • Excluded benefits – Carefully read information about policy exclusions. Short-term policies typically do not cover maternity care; many will not cover substance use treatment or mental health services.
  • Short-term policies exclude pre-existing conditions. If you make a claim under a short-term policy, the insurer can investigate whether your condition existed before you bought the policy.    Depending on the policy and state laws where you live, the insurer might also refuse to cover a condition that existed, even if not-yet diagnosed, before you bought the policy.  Some short-term policies offer limited coverage for certain pre-existing conditions, such as allergies, if you are otherwise healthy enough to buy the policy.

Cost sharing for covered benefits

Most short-term policies have an out-of-pocket limit on cost sharing; however, that limit might not include what you pay in deductibles or copays.  By contrast, in ACA-compliant policies, the out-of-pocket limit caps what consumers pay in a year for all types of cost sharing—deductibles, co-pays, and coinsurance.  For 2020, that limit is $8,150 per year for a single person.

Provider networks

Be sure to check whether the short-term policy offers a network of providers.  If so, you will need to seek care in-network to be covered (or, in case of “PPO” plans – to get the highest level of coverage.)  Some short-term policies are described as “Indemnity” policies.  That means the insurer does not limit coverage to a network of doctors and hospitals.  It also means the insurer has not negotiated any limits on what doctors and hospitals can charge you.  An indemnity policy will reimburse you up to an amount the insurer allows, and you will be responsible for the difference between that amount and the actual billed amount.  This difference is called “balance billing” and can be very expensive.

Other differences from ACA-compliant plans

Short-term policies cannot be sold on HealthCare.gov or state marketplace websites.  Consumers eligible for marketplace subsidies cannot use them to buy short-term policies.  When comparing premiums for short-term plans and marketplace plans, be sure to take into account marketplace premium and cost sharing subsidies that may apply to you.  Most people who buy marketplace plans qualify for these subsidies.


[1] So far, California, Massachusetts, New Jersey, and New York prohibit the sale of short-term health insurance policies that lack protections for people with pre-existing conditions. Additionally, Colorado, Connecticut, New Mexico, and Rhode Island impose tighter rules on short-term plans, and as a result, no short-term plans are currently sold in these states.  Some other states that apply much stricter limits to short-term policies are Delaware, District of Columbia, Hawaii, Illinois, Maine, Maryland, Vermont, and Washington.

ACA Open Enrollment: If You Are Low-Income

Published: Oct 25, 2019

If You Are Low-Income…

You can learn about your options by filling out a single application. It will tell you whether you qualify for coverage through the Medicaid program or for financial assistance to help pay for private insurance offered through your state’s marketplace. You can apply for coverage even if you have been unable to get it in the past.

States With Medicaid Expansion

Under the Affordable Care Act, 35 states including Washington, D.C. expanded  Medicaid eligibility to many low-income adults, including adults without dependent children, while 14 other states have chosen not to expand Medicaid under the law. Another two states, Nebraska and Utah, will be expanding Medicaid eligibility later in 2020. In states that expanded Medicaid, you may qualify for Medicaid if you earn $17,236 a year as a single individual or $29,435 for a family of three, while other family sizes can qualify at higher incomes. In states that did not expand, non-disabled adults who are parents with very low income will qualify (the eligibility levels vary by state). Regardless of your state’s decision on expanding Medicaid, children are eligible for Medicaid or the Children’s Health Insurance Program (CHIP) if their family  income is about $42,000 (for a family of three), or more in some states.

State Insurance Marketplaces

Whether or not your state expanded Medicaid, you may be eligible for federal assistance when you buy a health plan through your state’s marketplace. This assistance could lower the premiums you pay and reduce how much money you must pay out of your own pocket when you seek medical care. Although premiums for marketplace plans generally increase each year, if you qualify for premium tax credits, the tax credit should cover most or nearly all of the cost increase.  In general, you may be eligible for tax credits to lower your premium if you are single and your annual 2020 income is between $12,490 to $49,960 or if your household income is between $21,330 to $85,320 for a family of three (the lower income limits are higher in states that expanded Medicaid). The range differs for families of different sizes. If you buy a plan through the marketplace and your income is between $12,490 and $31,225 for a single person ($21,330 to $53,325 for a family of three), you can also qualify for help with cost sharing. Special modified silver plans are available with lower deductibles, copays, and annual out-of-pocket limits on cost sharing.

How to Apply

You can apply for coverage during the open enrollment period that runs from Nov. 1 through Dec. 15 in most states, including those using healthcare.gov. Coverage through a marketplace plan takes effect on Jan. 1, 2020. After Dec. 15, you may only sign up for a plan under special circumstances. Open enrollment in states that run their own marketplaces depends on the state. Seven states—California, Colorado, DC, Massachusetts, Minnesota, New York, and Rhode Island—have extended open enrollment beyond Dec. 15, 2019. Check with your state marketplace for details.

If you qualify for Medicaid, you can enroll at any time, not just during open enrollment. You can apply through healthcare.gov or your state’s marketplace website or directly with your state’s Medicaid agency. Once you have enrolled in Medicaid, you will receive a notice from your state’s Medicaid agency when it is time to renew your coverage.

Questions

If you have questions, you can call the federal government’s toll-free 24-hour hotline at 1-800-318-2596. To find in-person help, go to https://localhelp.healthcare.gov. Further information is available at www.healthcare.gov and at http://www.kff.org/health-reform/faq/health-reform-frequently-asked-questions/

News Release

U.S. Leads All Donors in First Comprehensive Assessment of Funding for Ebola Outbreak in DRC

Published: Oct 25, 2019

A new KFF analysis is the first comprehensive summary of donor funding for the response to the Ebola outbreak in the Democratic Republic of Congo (DRC). The analysis estimates that at least $546 million was provided by donors from August 2018, when the outbreak started, through September 2019. This includes bilateral support earmarked for Ebola from donor governments as well as contributions by multilateral organizations.

The United States provided the largest amount of support, estimated at no less than $148 million, followed by the World Bank ($130 million) and WHO Contingency Fund for Emergencies ($73.1 million). Only half of the total funding, including about one third of U.S. funding, was provided in direct support of the official DRC Response plans. This could have implications for the coordination of donor efforts and whether funding is being directed to the most critical or pressing activities.

Top-10-Donors-to-Ebola-Response-in-the-DRC

Overall funding amounts could be higher, as donor financing information is limited and fragmented. The analysis suggests coordination with national response plans is at times unclear, and the status of U.S. funding going forward is uncertain.

News Release

Analysis Finds Record 3,148 Medicare Advantage Plans Will be Available in 2020

Most Offer Additional Benefits, Including Some Fitness, Dental and Vision, though Few Offer Telemonitoring, In-Home and Caregiver Support

Published: Oct 24, 2019

A record 3,148 Medicare Advantage plans will be available across the country as alternatives to traditional Medicare, a new KFF analysis finds. That’s up 15% from last year’s 2,734 plans and results in a typical beneficiary having 28 plans available to them in their local market for the 2020 Medicare open enrollment period, which began Oct. 15 and runs until Dec. 7.

About 22 million Medicare beneficiaries – a third of all beneficiaries – are currently in Medicare Advantage plans, which are mostly HMOs and PPOs offered by private insurers that are paid to provide Medicare benefits to enrollees.

Most plans also offer benefits beyond what traditional Medicare covers, including fitness (93%), dental (88%), eye exams and glasses (87%), and hearing aids (83%). Nearly half (46%) provide a meal benefit, such as a cooking class, nutrition education or meal delivery, and one-third (33%) provide some transportation benefit. Far fewer offer other benefits related to social and residential needs that can affect health, such as bathroom safety devices, handrails (6%), telemonitoring (4%), in-home support (4%), and support for caregivers (2%).

The number of 2020 plans available varies greatly across the country, with 31 plans, on average, in metropolitan counties and 16 plans, on average, in non-metropolitan counties. Six counties in Ohio and Pennsylvania have more than 60 plans, while no plans will be available in 77 mostly rural counties nationwide.

Most Medicare Advantage plans (90%) include prescription drug coverage. Similar to last year, about 49% of these plans do not charge any additional premium beyond Medicare’s standard Part B premium.

KFF has also updated its collection of frequently asked questions about Medicare Open Enrollment to help beneficiaries understand their options during the annual open enrollment period, including the private stand-alone Part D plans that provide Medicare’s drug benefit and Medicare supplement (Medigap) plans, in addition to Medicare Advantage plans.

Medicare Advantage 2020 Spotlight: First Look

Authors: Gretchen Jacobson, Meredith Freed, Anthony Damico, and Tricia Neuman
Published: Oct 24, 2019

Executive Summary

Medicare Advantage plans have taken a large and growing role in the Medicare program over the past decade, with more than 22 million Medicare beneficiaries (34%) enrolled in Medicare Advantage plans in 2019, a private plan alternative to the traditional Medicare program. This brief provides an overview of the Medicare Advantage plans that will be available for 2020, based on an analysis of data from the Centers for Medicare and Medicaid Services (CMS). Findings include:

  • Number of Plans. Nationwide, 3,148 Medicare Advantage plans will be available for individual enrollment for the 2020 plan year – an increase of 414 plans since 2019. The average beneficiary will be able to choose among 28 plans in 2020, up from 24 in 2019 (ES Figure). The number of Special Needs Plans (SNPs) will also increase from 717 plans in 2019 to 855 plans in 2020.
Figure 1: The average Medicare beneficiary has access to 28 Medicare Advantage plans in 2020, an increase from prior years
  • Variation in Number of Plans. The number of Medicare Advantage plans will vary greatly across counties in 2020, from 31 plans, on average, in metropolitan counties to 16 plans, on average, in non-metropolitan counties. More than 60 plans will be available in six counties (in OH and PA), while no plans will be offered in 77 counties (accounting for less than 1% of beneficiaries) in 2020.
  • Number of Firms. The average beneficiary will be able to choose from plans offered by seven firms in 2020, similar to 2019. Four percent of all Medicare beneficiaries will have a choice of plans offered by two or fewer firms while 24 percent will be able to choose from plans offered by 10 or more firms.
  • Market Entrants and Exits. Thirteen insurers will be entering the Medicare Advantage market for the first time, and one insurer will be exiting in 2020. In all, well over 100 firms will offer Medicare Advantage plans in 2020.
  • Extra Benefits. Nearly all beneficiaries (97%) have access to a Medicare Advantage plan that provides dental, fitness, vision, and hearing benefits, which are not covered by traditional Medicare. Many beneficiaries also have access to some transportation assistance (92%) and a meal benefit (96%), but some benefits are less frequently available, such as in-home support (54%), bathroom safety (49%), telemonitoring services (29%), and support for caregivers of enrollees (12%).

Data Note

Plan Offerings in 2020

Number of Plans

Total Number of Plans. In total, 3,148 Medicare Advantage plans will be available nationwide for individual enrollment in 2020 – a 15 percent increase (414 more plans) from 2019 and the largest number of plans ever available (Figure 1; Appendix Table 1). These numbers exclude employer or union-sponsored group plans and Special Needs Plans, which are only available to select populations. Similar to prior years, HMOs continue to account for about two-thirds (64%) of all plans offered in 2020.

Figure 1: More Medicare Advantage plans are available in 2020 than in any other year

The growth in number of plans varies across states and counties, with the preponderance of the growth in plans occurring in California and Florida (61 more and 42 more plans, respectively; data not shown). Indiana and Puerto Rico will have 5 fewer plans available in 2020 than in 2019, while Utah will have 2 fewer plans, and Maryland and Hawaii will each have one fewer plan available in 2020 than in 2019.

While many employers and unions also offer Medicare Advantage plans to their retirees, no information about these plans is made available by CMS to the public during the Medicare open enrollment period because these plans are not available to the general Medicare population.

Special Needs Plans (SNPs). More SNPs will be available in 2020 than in any year since they were authorized, increasing from 717 plans in 2019 to 855 plans in 2019, a 19 percent increase (Figure 2). The SNP market may be an especially attractive market because potential overpayments to plans may be largest for those plans that are serving the sickest beneficiaries.

Figure 2: More than 850 Special Needs Plans will be offered in 2020

The rise in SNPs for people who require an institutional-level of care (I-SNPs) has been particularly notable, more than doubling from 69 plans in 2016 to 150 plans in 2020. I-SNPs may be attractive to insurers because they tend to have much lower marketing costs than other plan types since they are often the only available option for people to receive their Medicare benefits in certain retirement communities and nursing homes. The number of SNPs for people dually eligible for Medicare and

Medicaid (D-SNPs) has also greatly increased over the past five years (58% increase since 2016), suggesting insurers’ continue to be interested in managing the care of this high-need population.

Most SNPs for people with chronic conditions (C-SNPs) will continue to target people with diabetes, heart disease, or lung conditions in 2020, as has been the case since the inception of SNPs. In 2020, three firms will offer C-SNPs for people with dementia (up from two firms in 2019) and one firm will continue to offer a C-SNP for people with mental health conditions in California. Four firms will continue to offer C-SNPs for people with end-stage renal disease (similar to 2019) and two firms will offer C-SNPs for people with HIV/AIDS (similar to 2019).

Number of Plans Available to Beneficiaries. In 2020, the average Medicare beneficiary will have access to 28 Medicare Advantage plans available for individual enrollment, the highest number of plans available to the average beneficiary since 2011 (Figure 3). Among the 28 Medicare Advantage plans available to the average Medicare beneficiary, 24 of the plans will include prescription drug coverage (MA-PDs); 90 percent of all Medicare Advantage plans offered will include prescription drug coverage in 2020.

Figure 3: The average Medicare beneficiary has access to 28 Medicare Advantage plans in 2020, an increase from prior years

Variation in the Number of Plans, by Geographic Area. On average, beneficiaries in metropolitan areas will be able to choose from more than twice as many Medicare Advantage plans as beneficiaries in non-metropolitan areas (31 plans versus 16 plans, respectively). In ten percent of counties (accounting for 40% of beneficiaries), beneficiaries can choose from more than 30 plans in 2020, including four counties in Ohio (Mahoning, Medina, Trumbull, and Summit) and two counties in Pennsylvania (Bucks and Lancaster) where more than 60 plans will be available (Figure 4). In contrast, in 6 percent of counties (accounting for 1% of beneficiaries), beneficiaries can choose from two or fewer Medicare Advantage plans, including 59 counties in which only one plan will be available to beneficiaries. The number of counties with no Medicare Advantage plans will decline from 115 in 2019 to 77 in 2020. Additionally, no Medicare Advantage plans are available in territories other than Puerto Rico, similar to previous years.

Figure 4: In 131 counties, Medicare beneficiaries can choose from more than 40 Medicare Advantage plans, including 6 counties with more than 60 plans in 2020

Access to Medicare Advantage Plans, by Plan Type

As in recent years, virtually all Medicare beneficiaries (99%) will have access to a Medicare Advantage plan as an alternative to traditional Medicare, including almost all beneficiaries in metropolitan areas (99.9%) and the vast majority of beneficiaries in non-metropolitan areas (97%). In non-metropolitan counties, a smaller share of beneficiaries will have access to HMOs (81% in non-metropolitan versus 99% in metropolitan counties) or local PPOs (86% in non-metropolitan versus 95% in metropolitan counties), and a slightly larger share of beneficiaries will have access to regional PPOs (77% in non-metropolitan counties versus 72% in metropolitan counties).   

Number of Firms

The average Medicare beneficiary will be able to choose from plans offered by 7 firms, on average, in 2020, similar to 2019 (Figure 5). Almost one-quarter of beneficiaries (24%) will be able to choose from plans offered by 10 or more firms. Fourteen firms will offer Medicare Advantage plans in six counties: Los Angeles, Orange, Riverside, and San Bernardino counties in California, Cook County (Chicago) in Illinois, and Summit County (Akron) in Ohio. In each of these metropolitan counties, per capita spending for traditional Medicare and the share of beneficiaries enrolled in Medicare Advantage plans are much higher than the national average. In contrast, in 146 counties, most of which are rural counties with relatively few Medicare beneficiaries, only one firm will offer Medicare Advantage plans in 2020, a reduction from 194 such counties in 2019.

Figure 5: Almost one-quarter of beneficiaries can choose among Medicare Advantage plans offered by 10 or more firms

UnitedHealthcare and Humana, the two firms with the most Medicare Advantage enrollees, have large footprints across the country, offering plans in most counties. UnitedHealthcare is offering plans in 60 percent of counties, Humana is offering plans in 83 percent of counties, and both firms are offering plans in more than half of all counties (53%) in 2020 (Figure 6). More than 8 in 10 (85%) of Medicare beneficiaries have access to at least one Humana plan and 82 percent have access to at least one UnitedHealthcare plan.

Figure 6: Humana’s Medicare Advantage plans will be available in 83% of counties and UnitedHealthcare’s will be available in 60% of counties in 2020

New Market Entrants and Exits

Medicare Advantage continues to be an attractive market for insurers, with 13 firms entering the market for the first time in 2020, collectively accounting for about 7 percent of the growth in the number of plans available for general enrollment and about 5 percent of the growth in SNPs (Table 1). Ten new entrants will be offering HMOs available for individual enrollment. Five of the new entrants will be offering SNPs; three firms will be offering D-SNPs and two firms will be offering I-SNPs, including one firm (MoreCare) that will also be offering a C-SNP for people with HIV/AIDS. All of the new entrants are offering plans in one of ten states (FL, IL, LA, MI, NC, NY, SC, TN, TX, and VA).

Similar to prior years, some of the new entrants, such as Oscar and Troy Medicare, are funded by venture capital firms, joining about a dozen other venture capital-funded firms offering Medicare Advantage plans in 2020. While well over 100 insurers offered Medicare Advantage plans in 2019, only one insurer will be exiting the market in 2020, a sign that the vast majority of plans in the Medicare Advantage market are profitable. The exiting insurer had about 8,000 enrollees in Puerto Rico in 2019.  

Table 1. Entrants and Exiting Insurers in Medicare Advantage Markets, by Plan Type and Plan Locations, 2020
Company NameTotal Number of Plans OfferedPlans for Individual EnrollmentSpecial Needs Plans (SNPs)States in Which Plans Are Offered
HMOsOtherD-SNPsC-SNPsI-SNPs
New Entrants
ApexHealth, Inc.13X X  NC, SC, TN, and VA
Clarion Health1X     FL
Community Health Choice1  X  TX
Dignity Health Plan1    XLA
El Paso Health Advantage1  X  TX
Experience Health, Inc.1X    NC
Mary Washington Medicare Advantage2X    VA
MoreCare4X  XXIL
Oscar2X    NY and TX
PHP Medicare6X    MI
Reliance Medicare Advantage2X    MI
Troy Medicare1X    NC
Zing Health1X    IL
Exiting Insurers
Constellation Health8XXX  PR
Note: D-SNPs are plans for people dually eligible for Medicare and Medicaid; C-SNPs are plans for people with certain chronic conditions; and I-SNPs are plans for people that require an institutional level of care.

Source: Kaiser Family Foundation analysis of CMS Landscape Files for 2019 and 2020.

Premiums

The vast majority of Medicare Advantage plans for individual enrollment (90%) will include prescription drug coverage (MA-PDs), and 49 percent of these plans will charge no premium, other than the Part B premium, similar to 2019. More than nine out of ten beneficiaries (93%) will have access to a MA-PD with no monthly premium in 2020. However, in three rural states (AK, MT and WY), beneficiaries will not have access to a zero-premium MA-PD, and in four other states (MD, SD, ID, and ND), less than half of beneficiaries will have access to a zero-premium MA-PD. The average premium for MA-PDs (not weighted by enrollment) will be $36 per month in 2020, down from $40 per month in 2019. Medicare Advantage enrollees typically choose low premium plans, and enrollment-weighted premiums are often lower than the average premium across plans.

Extra Benefits

Medicare Advantage plans may provide extra benefits that are not offered in traditional Medicare, and can use rebate dollars (including bonus payments) to help cover the cost of these extra benefits. Beginning in 2020, Medicare Advantage plans can offer extra benefits that are not primarily health related. Plans may also restrict the availability of these extra benefits to certain subgroups of beneficiaries, making different benefits available to different enrollees. Further research is needed to assess the comprehensiveness of coverage for these extra benefits, and the extent to which the benefits are only available to certain subgroups of enrollees.

Availability of Extra Benefits in Plans for General Enrollment. More than 80 percent of plans provide some dental, vision, hearing, or fitness benefits (Figure 7); nearly 6 in 10 plans (58%) provide all of these four benefits in 2020. One-third of plans (33%) provide some transportation benefit in 2020, and almost half (46%) provide a meal benefit, such as a cooking class, nutrition education, or meal delivery. Less than 10 percent of plans provide bathroom safety devices (6%), in-home support (4%), telemonitoring (4%), or support for caregivers of enrollees (2%).

Figure 7: Most Medicare Advantage plans provide fitness and vision benefits but much fewer provide in-home or caregiver support

Availability of Extra Benefits in Special Needs Plans. SNPs are designed to serve a disproportionately high-need population, and a somewhat larger percentage of SNPs than plans for other Medicare beneficiaries provide their enrollees with transportation benefits (84%) and meal benefits (60%). Similar to plans available for general enrollment, a relatively small share of SNPs provide bathroom safety devices (7%), in-home support (13%), telemonitoring (10%), and support for caregivers (8%).

Access to Extra Benefits. Nearly all Medicare beneficiaries have access to a Medicare Advantage plan with some extra benefits not covered by traditional Medicare, with 97% having access to some dental, fitness, vision, and hearing benefits in 2020. The vast majority of beneficiaries also have access to transportation assistance (92%) and a meal benefit (96%), but far fewer have access to in-home support (54%), bathroom safety (49%), telemonitoring services (29%), and support for caregivers of enrollees (12%).

Discussion

More Medicare Advantage plans will be offered in 2020 than any other year. Thirteen insurers will be entering the Medicare Advantage market for the first time, and only one insurer will be exiting the market, suggesting that the Medicare Advantage market remains an attractive, profitable market for insurers. As in prior years, some (mostly non-metropolitan) counties are less attractive to insurers, with fewer firms and plans available. Overall, less than 1 percent of beneficiaries will not have access to a Medicare Advantage plan in 2020, similar to prior years. With more firms offering SNPs and the number of SNPs rapidly growing, there may be greater focus on how well high-need, vulnerable beneficiaries are being served by Medicare Advantage plans, including SNPs as well as plans for general enrollment. As Medicare Advantage enrollment continues to grow, insurers seem to be responding by offering more plans and choices to the people on Medicare.

Gretchen Jacobson, Meredith Freed, and Tricia Neuman are with KFF.

Anthony Damico is an independent consultant.

Appendix

Appendix Table 1. Availability of Medicare Advantage Plans and Insurers, by State, 2020
StateTotal Number of PlansAverage Number of Plans Available to BeneficiariesAverage Number of Insurers Offering Plans

Share of Beneficiaries with Access to at Least 1 Plan

All PlansHMOsLocal PPOs
Nationwide3,14828799%95%93%
Alabama55185100%95%100%
Alaska00N/A0%0%0%
Arizona77309100%97%97%
Arkansas50227100%99%89%
California281311098%97%66%
Colorado63267100%86%95%
Connecticut29266100%100%100%
Delaware11104100%100%100%
DC774100%100%100%
Florida296358100%99%99%
Georgia94277100%87%97%
Hawaii19126100%100%100%
Idaho5623593%93%93%
Illinois116329100%98%96%
Indiana84206100%100%100%
Iowa47124100%91%96%
Kansas60175100%70%82%
Kentucky66175100%99%100%
Louisiana53207100%100%100%
Maine40248100%100%100%
Maryland2594100%90%71%
Massachusetts58306100%99%97%
Michigan79366100%100%100%
Minnesota79317100%100%99%
Mississippi30124100%76%85%
Missouri79215100%90%97%
Montana1453100%79%86%
Nebraska3013594%82%82%
Nevada40217100%97%94%
New Hampshire34286100%100%100%
New Jersey58246100%100%100%
New Mexico29156100%68%100%
New York1784010100%100%100%
North Carolina82176100%94%95%
North Dakota22133100%0%51%
Ohio1404710100%100%100%
Oklahoma40174100%77%94%
Oregon85247100%93%100%
Pennsylvania160478100%100%100%
Rhode Island16164100%100%100%
South Carolina76288100%100%100%
South Dakota24144100%27%81%
Tennessee76247100%100%100%
Texas152279100%93%94%
Utah28156100%98%94%
Vermont13112100%100%100%
Virginia93175100%97%93%
Washington12728798%93%90%
West Virginia35205100%100%100%
Wisconsin101257100%99%92%
Wyoming521100%3%3%
Note: Excludes SNPs, EGHPs, HCPPs, and PACE plans.  Nationwide totals include Puerto Rico and other territories.

Source: Kaiser Family Foundation analysis of CMS Landscape File, 2020.

What Do We Know About Infant Mortality in the U.S. and Comparable Countries?

Published: Oct 18, 2019

An updated slideshow examines infant mortality rates in the United States, including variations by race and ethnicity and comparisons with similar countries. Overall, the U.S. and comparable countries have seen a decrease in infant mortality rates in recent years, but the U.S. has been slower to improve its consistently higher average rate of infant deaths, and significant disparities exist within the U.S. The analysis finds that high rates of infant mortality are concentrated in the South and parts of the Midwest, and infants born to non-Hispanic Black mothers have the highest infant mortality rate among all racial and ethnic groups.

The slideshow is part of the Peterson-Kaiser Health System Tracker, an online information hub dedicated to monitoring and assessing the performance of the U.S. health system.