Litigation Challenging Title X Regulations

Published: Nov 21, 2019

Issue Brief

Introduction

On March 4, 2019, the Trump Administration issued new regulations that makes significant changes to Title X, the federal family planning grant program. The new regulations effectively block the availability of Title X grants to family planning clinics that offer abortion services with other funds, curtail counseling, ban Title X projects from making referrals to abortion services, and require all pregnant patients served by Title X clinics to be referred for prenatal services, regardless of their pregnancy intention. Shortly after the regulations were finalized, the attorneys general from 23 states, major family planning organizations and the American Medical Association filed legal challenges in federal courts to block the implementation of the final Title X regulations.

Box 1: Key Facts – Title X Federal Family Planning Program

  • Title X, enacted in 1970, is the only federal program specifically dedicated to supporting the delivery of family planning care.
  • Administered by the HHS Office of Population Affairs (OPA), and funded at $286.5 million for Fiscal Year 2018, the program served over 4 million low-income, uninsured, and underserved clients that year.
  • In 2017, nearly 4,000 clinics nationwide relied on Title X funding to help serve 4 million people. The sites include specialized family planning clinics such as Planned Parenthood centers, community health centers, state health departments, as well as school-based, faith-based, and other nonprofit organizations.
  • Title X grants made up about 19% of revenue for family planning services for participating clinics in 2017, providing funds to not only cover the direct costs of family planning services, but also pay for general operating costs such as staff salaries, staff training, rent, and health information technology.

Although the district courts in Washington, Oregon, California and Maryland initially issued preliminary injunctions blocking the implementation of the new regulations, the Courts of Appeals have blocked these preliminary injunctions, and the regulations are currently in effect pending the outcome of the litigation. The Trump Administration Title X regulations are similar to rules issued by the Reagan Administration that were also challenged by provider groups, but were ultimately upheld in 1991 by the Supreme Court in Rust v Sullivan. Ultimately, one or more of these cases may be appealed to the Supreme Court, to decide whether the Trump Administration regulations violate the federal statutes or the Constitution or are within their agency rights. This brief provides an overview of the legal challenges to the Trump Administration final regulations and summarizes the key positions of the plaintiffs and HHS.

What provisions of the final regulations are being challenged?

On March 4, 2019, new final regulations for Title X grants were published in the Federal Register. The Office of Population Affairs, the federal agency that administers the program announced that the regulations would become effective on July 15, 2019 with a full phase in on March 4, 2020. The regulations make many changes to the requirements for Title X projects that are already reshaping the program and provider network available to low-income people through Title X.

Specifically, the regulations:

  • Prohibit federal Title X funds from going to any family planning site that also provides abortion services: The Title X statute specifies that no federal funds appropriated under the program “shall be used in programs where abortion is a method of family planning.” While HHS has changed its interpretation of this provision over time, throughout most of the history of the program, the ban has generally been understood to mean that Title X funds cannot be used to pay for or support abortion, as was the policy under the prior regulations.
  • Require that Title X funded activities have full physical and financial separation from abortion-related activities: In addition to separate accounting (as has been the requirement prior to the new regulations), providers must have separate electronic and paper health records, treatment, consultation, examination and waiting rooms, office entrances and exits, workstations, signs, phone numbers, email addresses, educational services, websites, and staff. This new requirement essentially disqualifies any provider from receiving Title X funds if they also offer or refer patients to abortion services.
  • Ban referrals for abortion services, and mandate referrals to prenatal services: Under the regulations in place from 2000 to 2019, Title X grantees were required to provide nondirective pregnancy options counseling and referrals upon request. This requirement meant that Title X grantees provided complete, medically accurate and unbiased information and resources for all pregnancy options without steering patients to one option. The new final regulations interpret referrals for abortion to be activities that are considered providing “abortion as a method of family planning” and prohibit Title X grantees and subrecipients from providing, promoting, referring for, supporting, or presenting abortion services to patients. Under the new regulations, a Title X project is permitted—but not required—to provide pregnant people with a list of health care providers that offer comprehensive primary health services (including providers of prenatal care). The rules also stipulate that some—but not the majority—of providers on the list may also provide abortion, but neither the list nor the project staff may indicate which of the listed providers also offer abortion services. The regulations specify that all pregnant clients must be referred to prenatal care, regardless of their stated wishes.
  • Eliminate the requirement for nondirective pregnancy options counseling that also includes discussion of abortion as an option: Under the previous regulations, Title X grantees were required to offer pregnant women the opportunity to be provided information and counseling regarding prenatal care and delivery; infant care, foster care, or adoption; and pregnancy termination. If asked for information and counseling, providers were required to provide nondirective counseling on each of the options. Each Title X site can now decide whether or not to offer nondirective pregnancy options counseling to patients, but only a medical doctor or advanced practice provider (defined as including physician assistants and advanced practice registered nurses) is permitted to provide this counseling.
  • Report age and partners for minor clients: Title X grantees and subrecipients are required to maintain and report records indicating the age of minor clients and the age of their sexual partners as specified under state notification laws.

Who is challenging the Trump Administration regulations?

The attorneys general from 23 states, major family planning organizations, individual providers and the American Medical Association (Figure 1) have filed legal challenges in federal courts to block the implementation of the Trump Administration’s final Title X regulations claiming the new rules violate the Constitution and federal laws.
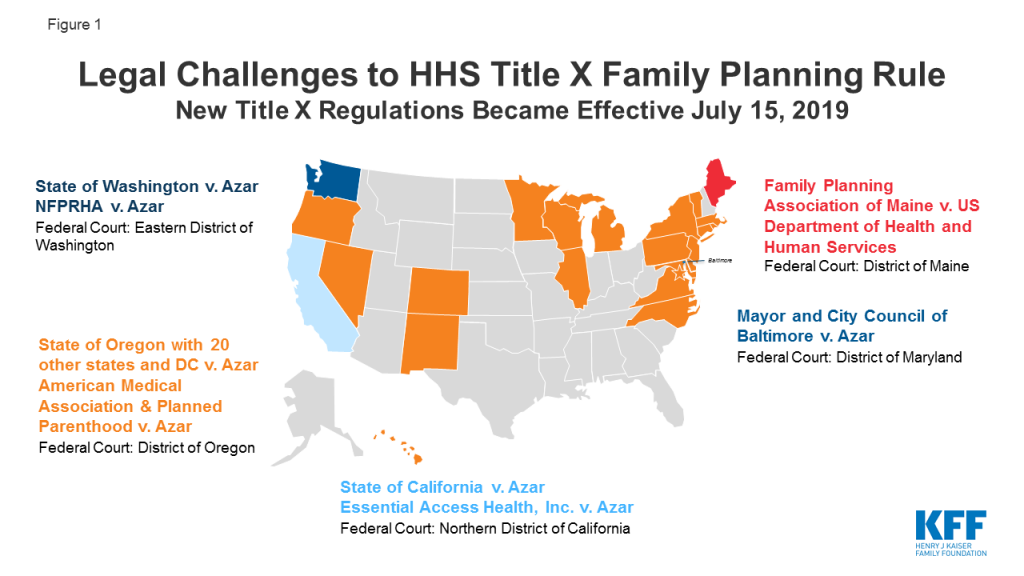
Figure 1: Legal Challenges to HHS Title X Family Planning RuleNew Title X Regulations Became Effective July 15, 2019

The plaintiffs in these lawsuits are challenging these regulations claiming that they would harm the four million low-income people who receive family planning services from Title X sites, would reduce the network of Title X sites, ban providing full medical information and referrals, and potentially decrease the provision of effective medically appropriate contraceptive services. In addition, the rules will create a financial strain on grantees and states that can longer accept the Title X funds, and potentially impact public health.

Although the district courts in Washington, Oregon, California and Maryland initially issued preliminary injunctions blocking the implementation of the new regulations, the Courts of Appeals have subsequently blocked these preliminary injunctions, and the regulations are currently in effect pending the outcome of the litigation. ­­­The plaintiffs in the Washington, Oregon and California cases appealed the 9th Circuit Court of Appeals decision (provided by a three Judge panel) staying the preliminary injunction, requesting an en banc hearing of a larger panel of Judges. This request was granted but the new regulations remain in effect pending the decision of the en banc hearing (which took place on September 23, 2019). The 4th Circuit Court of Appeals (in Maryland) also held a hearing on the appeal of the preliminary injunction issued by the district court on September 18, 2019.

Table 1: Plaintiffs Challenging the Legality of the Trump Administration’s Title X Regulations
PlaintiffsCourtJudgeStatus (as of Nov 1, 2019)
Essential Access Health Inc.; Melissa Marshall M.D.1 

State of California by and through Attorney General Xavier Becerra

United States District Court Northern District of CaliforniaJudge Edward M. Chen
  • District Court issued preliminary injunction for CA that was stayed by 9th Circuit Court of Appeals.
  • District Court has stayed current motions and hearings until after the decision from the 9/23/2019 en banc hearing
OR, NY, CO, CT, DE, DC, HI, IL, MD, MA, MI, MN, NV, NJ, NM, NC, PA, RI, VT, VA, & WI2 

American Medical Association, Oregon Medical Association, Planned Parenthood of Southwestern Oregon, Planned Parenthood Columbia Willamette, Thomas N. Ewing M.D,; Michele Megregian C.N.M.

United States District Court, District of Oregon, Eugene DivisionJudge Michael J. McShane
  • District Court issued nationwide preliminary injunction that was stayed by 9th Circuit Court of Appeals.
  • District Court has stayed hearing the case until the decision from the 9/23/2019 en banc hearing
State of Washington3 

National Family Planning & Reproductive Health Association, Feminist Women’s Health Center, Deborah Oyer, M.D.and Teresa Gall, F.N.P.

United States District Court For the Eastern District of Washington at YakimaJudge Stanley A. Bastian
  • District Court issued nationwide preliminary injunction that was stayed by 9th Circuit Court of Appeals.
  • District Court is holding hearing on litigation in February 2020
Family Planning Association of Maine and J.Doe, DO, MPHUnited States District Court for the District of MaineJudge Lance E. Walker
  • District Court denied the Plaintiff’s motion for a Preliminary Injunction.
  • Appeal to the 1st Circuit Court of Appeals was withdrawn.
  • District Court proceeding with the case.
Mayor and City Council of BaltimoreUnited States District Court for the District of MarylandJudge Richard D. Bennett
  • District Court issued a preliminary injunction for MD which was stayed by the 4th Circuit Court of Appeals pending appeal.
  • 4th Circuit Court of Appeals held hearing on September 18, 2019 on appeal of preliminary injunction.
  • District Court is continuing to consider the case, and hearing is scheduled for January 2020.

On what grounds are the plaintiffs suing the federal government?

The heart of the litigation is Section 1008 of Title X, which states that no federal funds appropriated under this program “shall be used in programs were abortion is a method of family planning.”

While the plaintiffs are claiming numerous violations of federal process and law, the interpretation of Section 1008 of the Title X statute is at the heart of this litigation. Section 1008 of specifies that no federal funds appropriated under the program “shall be used in programs where abortion is a method of family planning.” HHS has changed its interpretation of this provision over time, but throughout most of the history of the program, the ban has generally been understood to mean that Title X funds cannot be used to pay for or support abortion, as was the policy under the regulations in place before the Trump Administration issued new regulations. At that time, the program required that all clinics that also offered abortion services financially separate their operations but did not have a full physical separation requirement.

In the preamble to the regulation, HHS contends that these new regulations are necessary to enforce compliance with the statutory bar on the use of Title X funds for abortions. Many provisions in the Trump Administration’s regulation mirror those issued in 1988 by the Reagan Administration. Those regulations were challenged by Title X grantees and doctors in a lawsuit that ultimately reached the U.S. Supreme Court in Rust v. Sullivan. In 1991, the Supreme Court held that the regulations reflected one permissible interpretation of the statute and did not violate the First or Fifth Amendments. HHS believes that the Supreme Court ruling in Rust v. Sullivan is the controlling legal precedent and that Trump Administration regulations, like the Reagan Administration regulations, are an acceptable interpretation of the statute, and are constitutionally valid.

In Rust v Sullivan, the Supreme Court ruled that the government may favor childbirth over abortion and is within its rights to allocate funds consistent with this viewpoint—without violating a woman’s right to choose to terminate her pregnancy. After the Supreme Court’s decision, Congress voted to repeal the prohibitions on counseling and referring for abortion, but lacked the votes to override President George H.W. Bush’s veto.

The Reagan era regulations, however, were never fully implemented. The Clinton Administration issued regulations that have been in effect ever since, permitting Title X providers to refer for abortions and allow sites that also provide abortion services to participate in Title X, so long as there is financial separation between the Title X funds and funds used for abortion services.

While there are many plaintiffs represented in the cases against HHS, the cases present similar challenges. The plaintiffs contend that Title X funds have never been available for abortion services, and the defendant (HHS) fails to identify any evidence suggesting that any Title X funds are being used for abortion services.

The plaintiffs contend that the Administration violated the Administrative Procedures Act by not stating a valid reason for the rule or following proper notice and comment procedures. While Rust v. Sullivan held that the regulations were one acceptable interpretation of Section 1008 at that time, the plaintiffs argue that the applicable law has changed. Every year since 1996 (after Rust), Congress has passed an Appropriations Act for Title X requiring that all pregnancy counseling be nondirective. In particular, the plaintiffs contend that the requirement to refer all pregnant patients to pre-natal services and the ban on abortion referrals is violation of this section which requires all pregnancy counseling to be nondirective.

In addition, they are claiming that HHS has violated Section 1554 of the ACA (Box 2), which states that the agency shall not promulgate any regulations that creates any unreasonable barriers to the ability of individuals to obtain appropriate medical care or restricts communications between a doctor and a patient. They charge that these regulations create barriers to care by requiring physical and financial separation for clinics that provide abortion services with non-Title X funds, only permitting doctors and advanced practice providers to provide counseling, and requiring additional documentation for minors. They also claim that the regulations restrict the speech of doctors who work at Title X clinics by banning referrals to abortion services, and requiring referrals to pre-natal service even if that is not what the patient seeks.

Box 2: Section 1554 of the Affordable Care Act (ACA)

Section 1554 of the ACA provides that the Secretary “shall not promulgate any regulation that”

  1. Creates any unreasonable barriers to the ability of individuals to obtain appropriate medical care;
  2. Impedes timely access to health services;
  3. Interferes with communications regarding a full range of treatment options between the patient and the provider;
  4. Restricts the ability of health care providers to provide full disclosure of all relevant information to patients making health care decisions;
  5. Violates the principles of informed consent and the ethical standards of health care professionals; or
  6. Limits the availability of health care treatment for the full duration of a patient’s medical needs.

All of the lawsuits challenging the Title X final rule are based on similar legal arguments. Listed below are some of the common claims.

Table 2: Litigation Challenging Trump Administrations Final Title X Regulations:Summary of the Plaintiffs’ and Government’s Position
Claim: Violation of the Administrative Procedure Act (APA) which governs the process by which federal agencies develop and issue regulations. It includes requirements for notice, public comment, and standards for judicial review
Plaintiffs’ Position:
  • HHS exceeded the scope of its statutory authority and acted in a manner that is arbitrary and capricious
  • HHS did not comply with notice and comment requirements.
  • The final rule is significantly different from the proposed rule.
  • The final rule does not address any identified problem.
  • The final rule is contrary to law because it violates the Health and Human Services Appropriations Act Section 1554 of the Affordable Care Act (ACA), the First and Fifth Amendments of the U.S. Constitution. (See below for more on these claims.)
Government’s Position:
  • The regulations are necessary to enforce compliance with the statutory bar on the use of Title X funds for abortions.
  • Rust v. Sullivan confirmed that this rule is a valid exercise of HHS authority.
  • The final rule is a “logical outgrowth” of the proposed rule
Claim: Violation of Section 1554 of the Affordable Care Act (ACA) which states that the Secretary “shall not promulgate any regulation that”:
  • Creates any unreasonable barriers to the ability of individuals to obtain appropriate medical care;
  • Impedes timely access to health services;
  • Interferes with communications regarding a full range of treatment options between the patient and the provider;
  • Restricts the ability of health care providers to provide full disclosure of all relevant information to patients making health care decisions;
  • Violates the principles of informed consent and the ethical standards of health care professionals; or
  • Limits the availability of health care treatment for the full duration of a patient’s medical needs.
Plaintiffs’ Position:

The following provisions of the Final Rule violate Section 1554 of the ACA:

  • Prohibition on abortion counseling and referral
  • Requirement that nondirective counseling only be provided by a physician or advance practice provider
  • Physical and financial separation
  • Documentation for minors
Government’s Position:
  • The Plaintiffs have waived any argument based on Section 1554 because HHS did not receive any comments on the proposed rule about Section 1554 during the comment period.
  • Section 1554 does not apply to Title X; it only applies to provisions of the ACA.
  • Even if Section 1554 applies, the Title X regulations do not impede access to care.
Claim: Violation of Continuing Appropriations Act, 2019, Pub. L. 115–245, 132 Stat. 2981, 3070–71 (2018), “That amounts provided to said projects under such title shall not be expended for abortions, that all pregnancy counseling shall be nondirective. . .”  Congress has consistently included this language with respect to Title X appropriations funding every year since 1996.
Plaintiffs’ Position:
  • The Title X requirement to refer all pregnant women to prenatal services and the ban on abortion referrals violates the Appropriations Act.
  • Counseling and referral are inextricably linked.
Government’s Position:
  • The rule requires all counseling to be nondirective. “Referral” is different from, and not a part of, “counseling.”
Claim: Violation of First Amendment (freedom of speech)4  “Congress shall make no law… abridging the freedom of speech.” The First Amendment applies equally to the actions and regulations of Executive agencies
Plaintiffs’ Position:
  • The ban on abortion referrals and the requirement to refer all pregnant women to prenatal appointments violates doctors’ and patients’ First Amendment rights. The ban on abortion referrals and requirement to refer pregnant patients to prenatal appointments is an impermissible viewpoint-based restriction and forces providers to speak a view they do not hold (that prenatal care is appropriate). In addition, the regulations imposes a speaker-based ban, only allowing medical doctors and advanced practitioners to provide pregnancy options counseling. Recent Supreme Court decisions have confirmed that medical speech is deserving of First Amendment protection of the highest order.
  • The final rule requires grantee states and other Title X grantees to infringe on the free speech rights of health care providers as a condition of securing Title X funds.
Government’s Position:
  • The Supreme Court upheld similar provisions in Rust v. Sullivan. Doctors are free to tell patients that abortion is not a method of family planning supported by Title X. The government is permitted to fund some activities and not others. The Supreme Court ruled in Rust v. Sullivan, “The Government can, without violating the Constitution, selectively fund a program to encourage certain activities it believes to be in the public interest, without at the same time funding an alternate program… In doing, the Government has not discriminated on the basis of viewpoint; it has merely chosen to fund one activity to the exclusion of the other.”
Claim: Violation of Fifth Amendment: The Due Process Clause of the Fifth Amendment prohibits the federal government from denying equal protection of the laws. when “vagueness permeates the text” of a law it violates the due process clause of the Fifth Amendment
Plaintiffs’ Position:
  • The Rule specifically targets and harms women because it discriminates based on pregnancy and gender. The Rule is not substantially related to an important government interest or rationally related to a legitimate government interest.
  • The Rule does not give Title X grantees and sub-recipients sufficient guidance and invites inconsistent or biased enforcement.
  • The physical and financial separation requirement provides the Secretary with excessive latitude to determine whether a Title X project has met this provision.
  • The Final Rule is ambiguous on whether Title X providers may refer patients for abortion in case of medical necessity, and what a Title X provider may discuss with respect to abortion if she provides nondirective pregnancy options counseling.
  • The Final Rule’s prohibition on actions that “encourage, promote or advocate abortion as a method of family planning” is vague and invites arbitrary and discriminatory enforcement by the Secretary.
Government’s Position:
  • The Rule is perfectly clear and just as specific as the materially identical provisions sustained in Rust v. Sullivan. The Due Process Clause tolerates greater imprecision when government subsidies are involved.

Looking Forward

Grantees were required to submit action plans to show compliance with the new regulations on August 19, 2019, and a certificate of compliance on September 19, 2019. Some of the nonprofits and states (IL, ME, OR, WA) challenging the regulations have decided to withdraw from Title X or put a hold on drawing down funds as the cases move through the federal district courts. In addition, Planned Parenthood, also a litigant in the cases, formally withdrew from the program. In addition to the 400 Parenthood sites, over 600 additional clinics, composed of state health departments, federally qualified health centers, and nonprofit organizations are no longer using Title X funds to support services for low-income and uninsured individuals. These decisions affect all of the Title X clinics in Hawaii, Maine, Oregon, Utah, Vermont, and Washington and the majority of Title X clinics in Alaska, Connecticut, Illinois, Maryland, Massachusetts, Minnesota, New Hampshire and New York.

The new regulations are currently in effect and the plaintiffs are awaiting the rulings from the 9th Circuit and 4th Circuit Court of Appeals regarding whether the regulations can be blocked until the cases make their way through the federal district courts. On March 4, 2020, Title X sites are required to physically separate the abortion services they provide with non-Title X funds. If this part of the regulations is implemented as scheduled in March 2020, it is expected that many more Title X grantees and sites will withdraw from the Title X network. While Supreme Court may eventually hear these cases, the 2020 presidential election may take place before these cases reach the Supreme Court.

Endnotes

  1. Essential Access Health et al. and the State of California filed two separate lawsuits challenging the final regulations. These two cases have been related to one another at the district court. ↩︎
  2. State of Oregon et al. and the American Medical Association et al. filed two separate lawsuits challenging the final regulations. These two cases have been consolidated for pretrial purposes. ↩︎
  3. State of Washington and the National Family Planning & Reproductive Health et al. filed two separate lawsuits challenging the final regulations. These two cases have been consolidated for pretrial purposes. ↩︎
  4. California does not include a violation of the First Amendment it its legal challenge. ↩︎
News Release

Poll: On Health Care, Democrats and Democratic-Leaning Independents Trust Sen. Sanders the Most, but Significantly More People Support a Public Option than Medicare-for-All

Democrats Want to Hear More about How Candidates’ Plans Affect Seniors, How They Will Pay for Them, How Middle-Class Taxes Might Change, and How Will They Get Congress to Pass Them

Published: Nov 20, 2019

3 in 4 Americans Do Not Expect Congress to Take Action to Lower Drug Costs Before the 2020 Election

Ahead of tonight’s Democratic presidential debate, Sen. Bernie Sanders is the candidate most trusted on health care by Democrats and Democratic-leaning independents, though the Medicare-for-all plan he has championed is significantly less popular than the “public option” approach put forward by some other candidates, the latest KFF Health Tracking Poll finds.

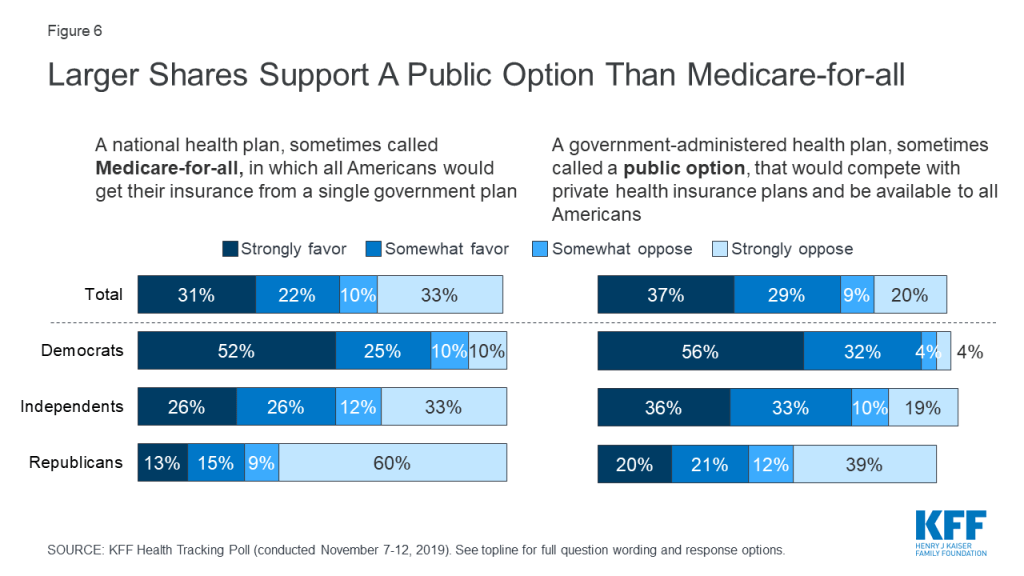
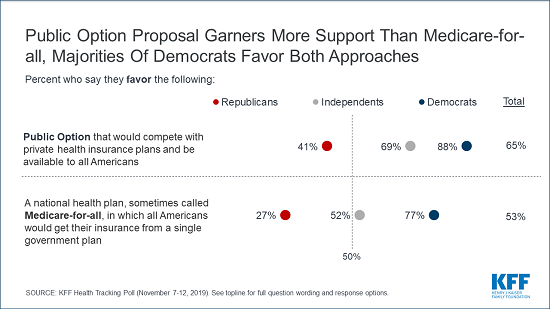
Among the overall public, a narrow majority (53%) support the idea of a Medicare-for-all plan that would cover all Americans through a single government plan. At the same time, two-thirds (65%) say they support a government-run health plan that would compete with private insurance, often called a public option. Large majorities of Democrats support both a public option (88%) and Medicare-for-all (77%).

Most Republicans oppose both approaches to expanding coverage, but more of them favor a public option (41%) than Medicare-for-all (27%). Majorities of independents support both options, though a larger share favors a public option.

The poll also examines the public’s views towards Medicare-for-all when they are provided descriptions that include the trade-offs under consideration.

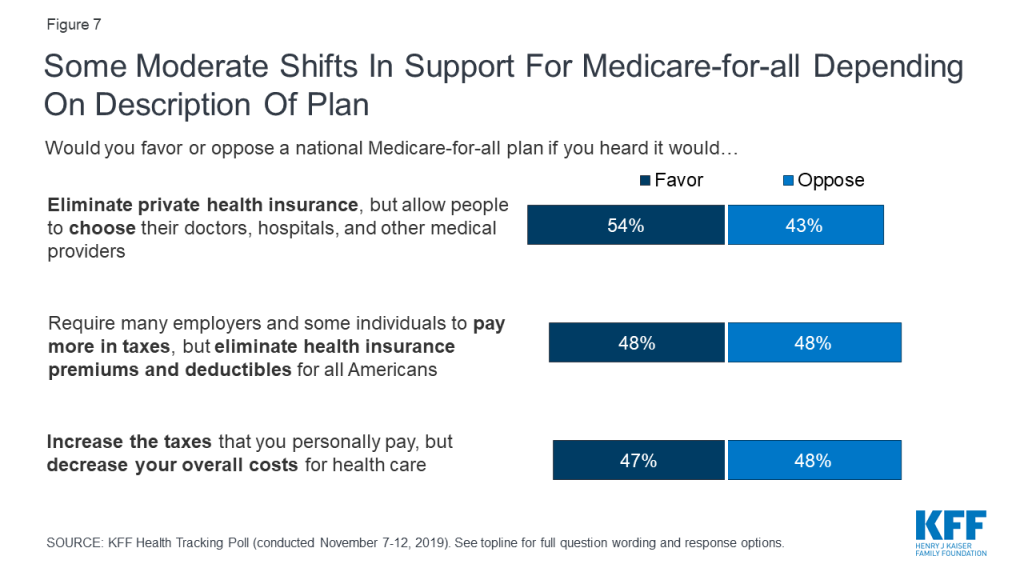
When a Medicare-for-all plan is described as requiring many employers and some individuals to pay more in taxes while eliminating both out-of-pocket costs and premiums for all Americans, the public is split with equal shares (48%) supporting and opposing it. The public is also divided when the plan is described as increasing taxes individuals will personally pay, but decreasing their overall costs for health care (47% in favor, 48% opposed).

In Primary Race, Sen. Sanders is Most Trusted by Younger Adults; VP Biden Leads among Seniors

The poll finds that Sen. Sanders, who has drawn national attention to his Medicare-for-all plan since his 2016 presidential run, has built a significant trust advantage among Democrats and Democratic-leaning independents.

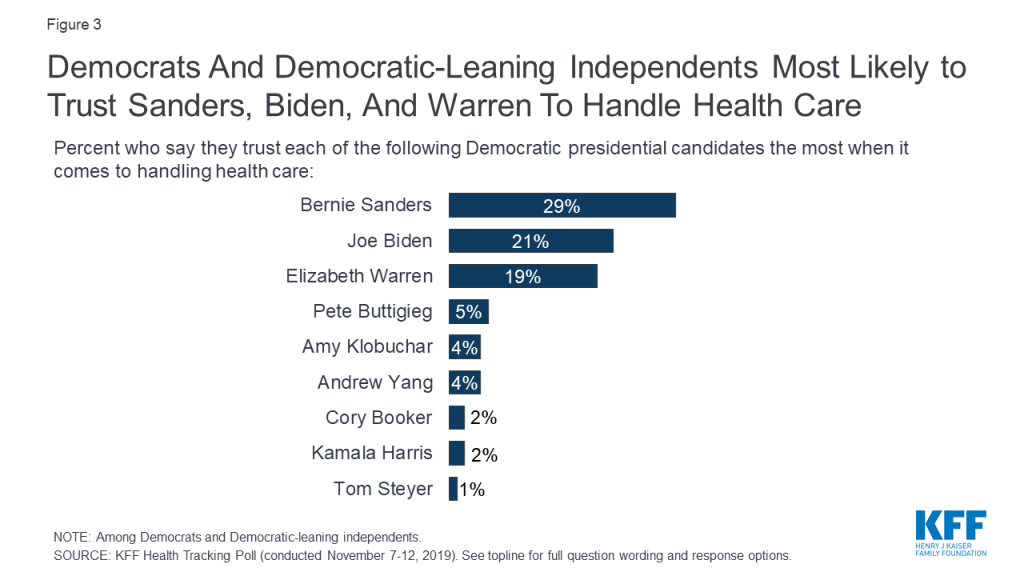
When asked which candidate they trust the most to handle health care, nearly three in 10 (29%) name Sen. Sanders, with former Vice President Joe Biden (21%) and Sen. Elizabeth Warren (19%) not far behind. No other presidential candidate comes close.

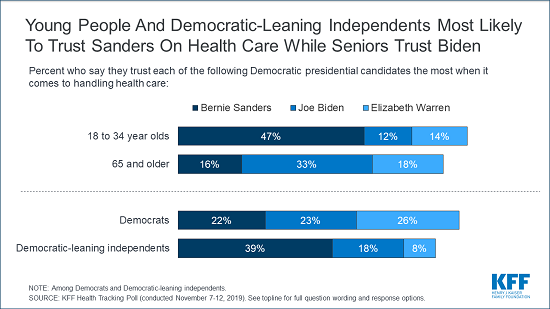
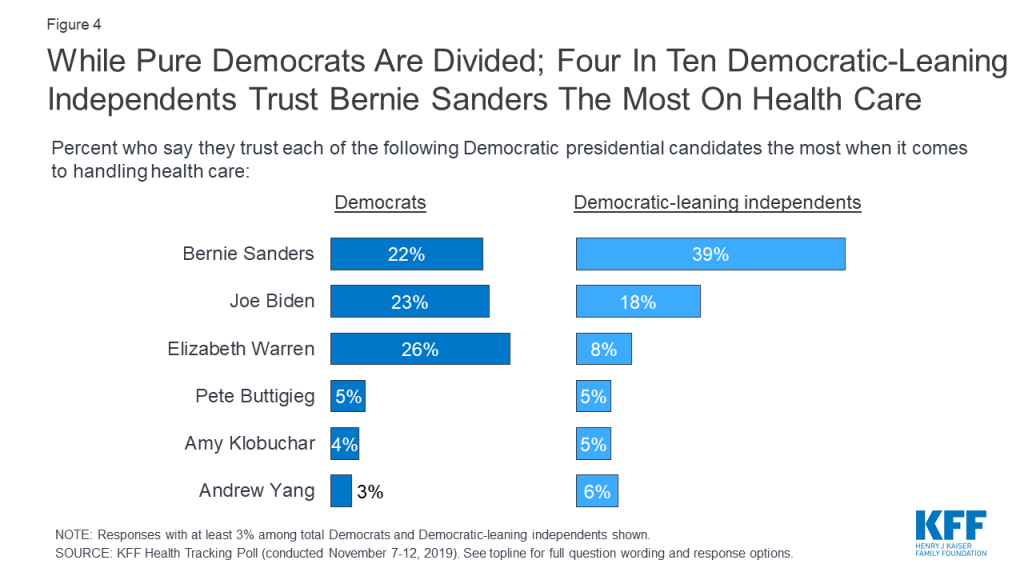
Sen. Sanders is by far the most trusted candidate among those ages 18-34, named by nearly half (47%) of this group. Vice President Biden is the most trusted among seniors by a wide margin (33%, with Warren next at 18%). Sen. Sanders holds a clear advantage among independents who lean Democratic, with four in 10 (39%) naming his as their most trusted candidate on health care while pure Democrats are divided, with similar shares saying they trust Sen. Warren (26%), Vice President Biden (23%) and Sen. Sanders (22%).

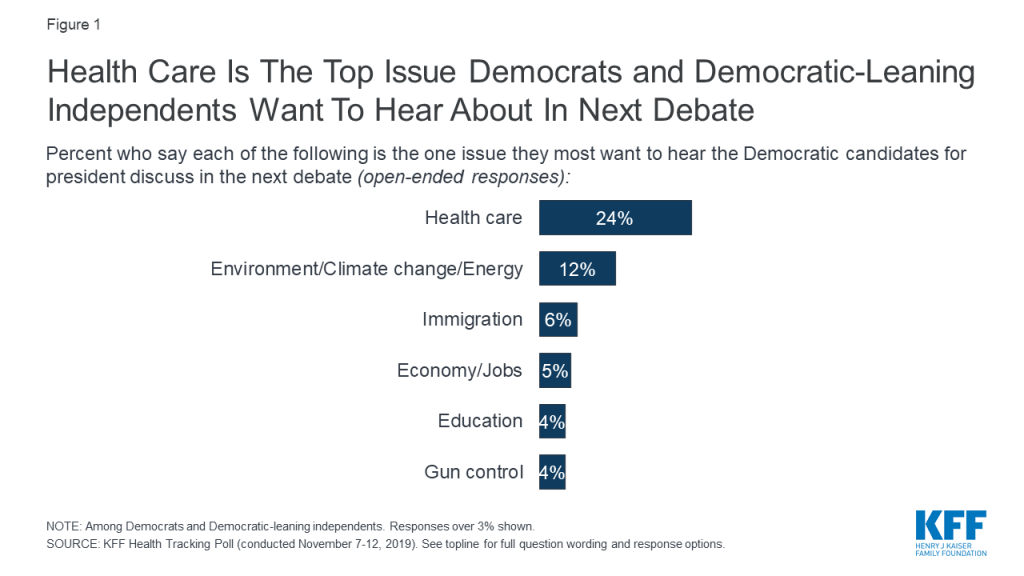
Health care remains Democrats’ top issue, with one in four (24%) Democrats and Democratic-leaning independents offering it as the issue they most want to hear candidates discuss in the next debate. Smaller shares name the environment/climate change/energy (12%), immigration (6%), the economy and jobs (5%), education (4%) or gun control (4%).

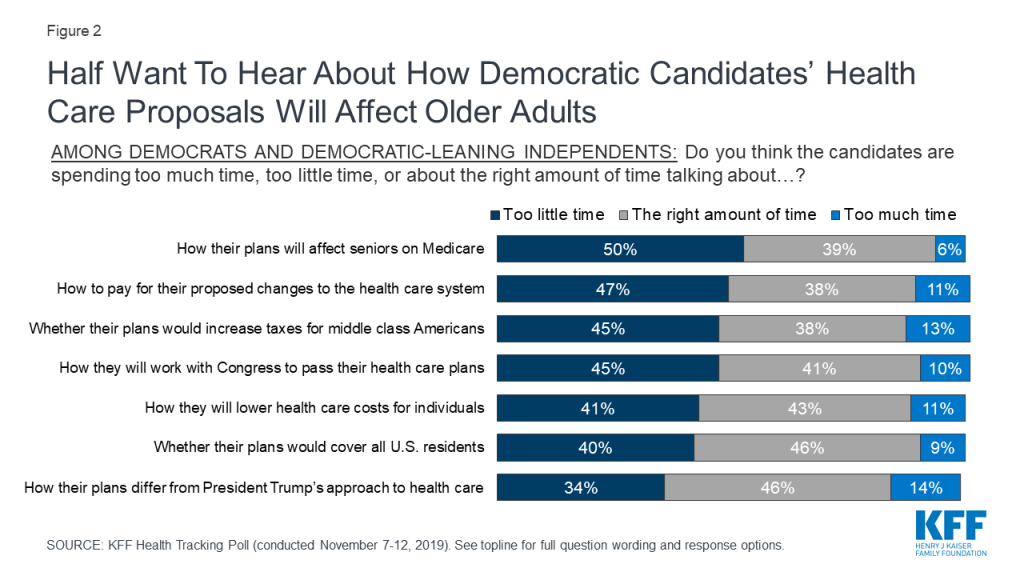
Large shares of Democrats and Democratic-leaning independents say the candidates are spending too little time talking about how their health care plans will affect seniors on Medicare (50%), how to pay for proposed changes (47%), whether their plans would increase taxes on the middle class (45%), and how they will work with Congress to enact their plans (45%).

Most Say Washington Isn’t Doing Enough to Lower Drug Costs and Doubt Congress Will Pass Anything

In spite of White House and Congressional proposals to lower what people pay for prescription, the poll finds that large majorities believe President Trump and his administration (70%), Democrats in Congress (75%) and Republicans in Congress (77%) are not doing enough to lower drug costs.

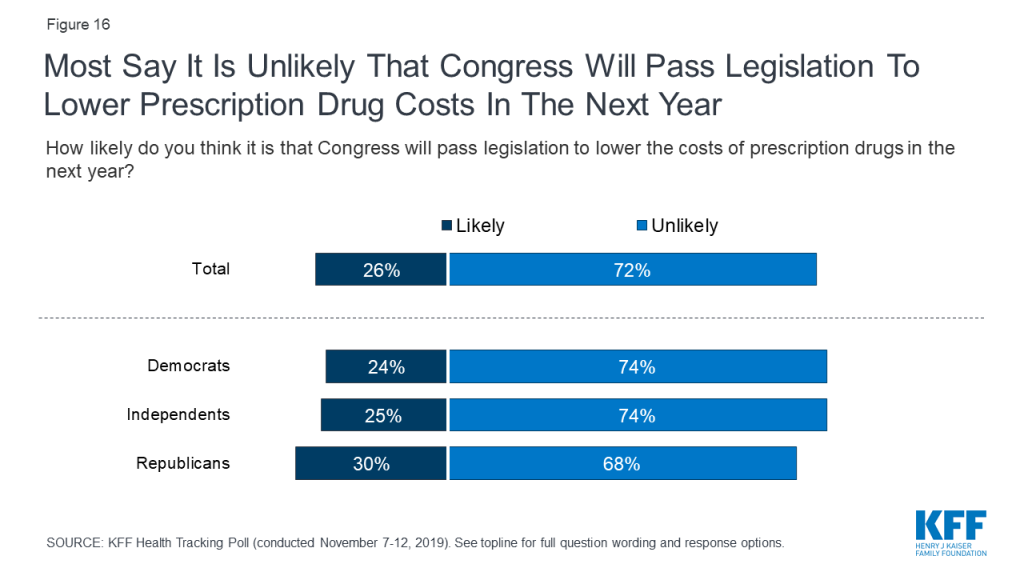
Seven in 10 Americans (72%) say it’s unlikely that Congress will pass legislation to lower drug costs in the next year.  Majorities of Democrats, Republicans and independents are pessimistic about the prospects for enacting drug-cost legislation.

Despite ACA Marketplace Premiums Falling, Few Think That Is the Case

The Affordable Care Act’s 2020 open enrollment period began this month, allowing people who buy their own coverage or are uninsured an opportunity to sign up for Marketplace coverage.

Premiums on average are somewhat lower this year than last year, though few people know it. The poll finds just 6% of the overall public believe premiums on average are lower this year, a fraction of the share (44%) who say premiums are up this year.

When assessing how well the health insurance marketplaces in the nation are working, the public is divided with similar shares saying they are working well (45%) as saying they are not working well (47%).

People are somewhat more positive about their state’s marketplace, with half (52%) saying it is working well. People living in states that run their own marketplaces are more likely to say their marketplace is working well (58%) than those living in states relying on the federal government’s HealthCare.gov marketplace (48%).

METHODOLOGY

Designed and analyzed by public opinion researchers at KFF, the poll was conducted November 7-12, 2019 among a nationally representative random digit dial telephone sample of 1,205 adults. Interviews were conducted in English and Spanish by landline (302) and cell phone (903). The margin of sampling error is plus or minus 3 percentage points for the full sample. For results based on subgroups, the margin of sampling error may be higher.

Filling the need for trusted information on national health issues, the Kaiser Family Foundation is a nonprofit organization based in San Francisco, California.

Poll Finding

KFF Health Tracking Poll – November 2019: Health Care In The 2020 Election, Medicare-for-all, And The State Of The ACA

Published: Nov 20, 2019

Findings

Key Findings:

  • Health care has been a dominant issue throughout the 2020 Democratic presidential primary and the latest KFF Health Tracking Poll finds Democrats continuing to prioritize health care over other issues. Ahead of tonight’s Democratic presidential debate, when asked to state in their own words the one issue they most want to hear the Democratic presidential candidates discuss, about one in four (24%) Democrats and Democratic-leaning independents offer health care. Fewer mention other issues such as the environment (12%), immigration (6%), jobs and the economy (5%), education (4%), and gun control (4%).
  • Senator Bernie Sanders is the candidate most trusted on health care by Democrats and Democratic-leaning independents, though the Medicare-for-all plan he’s championed is significantly less popular than the “public option” approach put forward by some other candidates. Among adults overall, a narrow majority (53%) support the idea of a Medicare-for-all plan while a larger majority (65%) say they support a government-run public option that would compete with private insurance. Large majorities of Democrats support both a public option (88%) and Medicare-for-all (77%), and while most Republicans oppose both approaches to expanding coverage, more favor the public option proposal (41%) than a Medicare-for-all plan (27%).
  • Attitudes towards a Medicare-for-all plan shift moderately depending on how such a proposal is described. For example, if the plan is described as requiring many employers and some individuals to pay more in taxes, but eliminating both out-of-pocket costs and premiums for all Americans, overall favorability drops to 48%. Similarly, overall favorability drops (47%) when the plan is described as increasing taxes individuals will personally pay, but decreasing their overall costs for health care.
  • Senator Bernie Sanders leads the field when Democrats and Democratic-leaning independents are asked which Democratic presidential candidate they trust the most on health care. About three in ten (29%) say they trust Sen. Sanders, followed by about one-fifth who say they trust Vice President Joe Biden (21%) or Senator Elizabeth Warren (19%). Overall trust of Sanders on health care is largely driven by younger Democrats and Democratic-leaning independents as well as those who are not as connected to the Democratic Party. Nearly half (47%) of Democrats and Democratic-leaning independents between the ages of 18 and 34 prefer Sanders when it comes to health care, while Biden holds a sizeable edge over other candidates among adults 65 and older (33%). Among independents who lean Democratic, Senator Sanders is the preferred candidate (39%), while self-identified Democrats are split on which candidate they most trust to handle health care: Warren (26%), Biden (23%) and Sanders (22%).
  • The 2020 open enrollment period for people who purchase their own insurance on the ACA marketplaces began in most states on November 1st. The law’s seventh open enrollment period began with the announcement that premiums in many areas of the U.S. are decreasing. Yet a plurality of the public (44%) thinks premiums are higher than they were last year. Though ACA marketplace premiums are now on average lower than they were last year, just 6% think this is the case.

Health Care and the 2020 Election

This month’s KFF Health Tracking Poll continues our analysis of the role health care may be playing in the 2020 election with a look at what issues Democrats want to hear about in the next debate as well as which of the Democratic primary candidates they trust the most when it comes to handling health care.

Democratic Presidential Primary Debates

Health care has been and remains a top issue for Democrats during the 2020 Democratic presidential primary. Recent KFF Health Tracking Polls have found that health care consistently emerges as a top issue that Democrats and Democratic-leaning independents want to hear the 2020 Democratic presidential candidates discuss, and this month’s poll finds this continues to be true. When asked to say in their own words what issue they would most like to hear the Democratic presidential candidates discuss in the upcoming debate, one in four Democrats and Democratic-leaning independents (24%) offer health care. This is twice as many as say they want to hear more about any other issue such as the environment (12%), immigration (6%), jobs and the economy (5%), education (4%), and gun control (4%).1 

Figure 1: Health Care Is The Top Issue Democrats and Democratic-Leaning Independents Want To Hear About In Next Debate

And while various Democratic candidates have put out their own health care proposals, Democrats are still wanting to know more. Large shares say Democratic candidates are spending too little time talking about how their health care plans will affect older adults on Medicare (50%), how they will pay for their plans (47%), whether they will require higher taxes on the middle class (45%), and how they will work with Congress to pass their health care proposals (45%). About four in ten say the candidates are spending too little time discussing how they will lower health care costs for individuals (41%) and whether their plans would cover all U.S. residents (40%); and about a third say the candidates are spending too little time talking about how their plans differ from President Trump’s approach to health care.

Figure 2: Half Want To Hear About How Democratic Candidates’ Health Care Proposals Will Affect Older Adults

Sanders, Biden, And Warren Are Most Trusted When It Comes To Health Care

When asked which candidate they trust the most when it comes to handling health care, nearly three in ten (29%) Democrats and Democratic-leaning independents say they are most trusting of Senator Bernie Sanders. About one in five say they are most trusting of former Vice President Joe Biden (21%) and Senator Elizabeth Warren (19%) when it comes to handling health care.

Figure 3: Democrats And Democratic-Leaning Independents Most Likely to Trust Sanders, Biden, And Warren To Handle Health Care

Notably, nearly half (47%) of younger Democrats and Democratic leaning independents, ages 18 to 34, say they have the most trust in Bernie Sanders when it comes to handling health care. However, among adults ages 65 and older, Joe Biden is the most trusted candidate to handle health care (33%).

Table 1: Candidate Trust On Health Care By Age
Percent who trust each of the following candidates the most when it comes to handling health care:18-34year olds35-54year olds55-64year olds65 andolder
Bernie Sanders47%26%9%16%
Joe Biden12203133
Elizabeth Warren14252118
Pete Buttigieg3479
Amy Klobuchar1773
Andrew Yang10112
Cory Booker3320
NOTE: Showing only candidates who received more than 2% among total Democrats and Democratic-leaning independents

When it comes to which candidate they most trust to handle health care, there are some notable differences between adults who identify as Democrats and those who identify as independents, but say they lean towards the Democratic party. Democrats are relatively divided with about one in four saying they most trust Elizabeth Warren (26%), Joe Biden (23%) and Bernie Sanders (22%). However, a larger share of Democratic-leaning independents (39%) choose Bernie Sanders as the most trusted candidate on health care than any of the other Democratic presidential candidates.

Figure 4: While Pure Democrats Are Divided; Four In Ten Democratic-Leaning Independents Trust Bernie Sanders The Most On Health Care

Medicare-for-all and Public Option

This month’s poll continues to find larger support for more incremental changes to the nation’s health care system than a major overhaul. Support for a “public option,” in which a government-administered plan would compete with private health insurance and be available to all Americans, has decreased slightly since last month. Two in three adults (65%) favor a public option, down from 73% in October. Levels of support for a public option were similar in July (65% support) and September (69%).

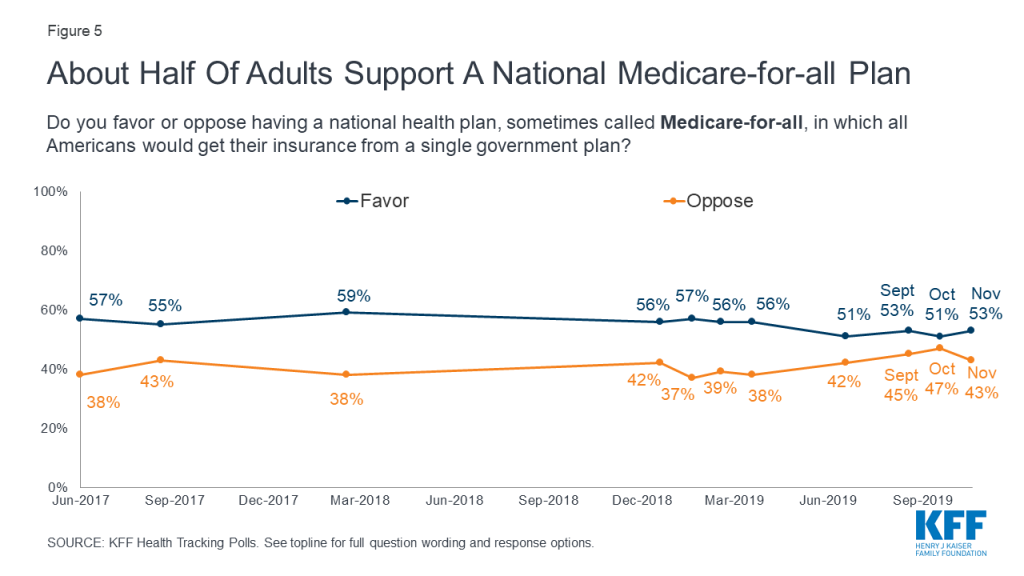
Following a narrowing of net support in recent months for Medicare-for-all, this month’s poll finds about half the public (53%) favors a national Medicare-for-all plan while 43% are opposed. Indeed, since July, support for Medicare-for-all has remained relatively steady with about half of adults in favor of the proposal.

Figure 5: About Half Of Adults Support A National Medicare-for-all Plan

Democrats and independents continue to be more likely than Republicans to favor both a public option and Medicare-for-all. Nonetheless, a public option that would compete with private health insurance plans garners more support among Republicans and independents than a proposed national Medicare-for-all plan. While large majorities of Democrats favor both proposals (77% Medicare-for-all, 88% public option), half of independents (52%) support a Medicare-for-all proposal compared to about seven in ten (69%) who support a public option. Among Republicans, 27% support a national Medicare-for-all plan while four in ten (41%) favor a public option.

Figure 6: Larger Shares Support A Public Option Than Medicare-for-all

Moderate Shifts in Support of a National Health Plan Depending On How The Plan Is Described

Previous KFF polling has found that attitudes towards a national Medicare-for-all plan are quite malleable when given counter-arguments. This month’s tracking poll finds more moderate shifts in the public’s views towards Medicare-for-all when they are provided descriptions that balance the trade-offs lawmakers are considering. When Medicare-for-all is described as eliminating private health insurance, but allowing people to choose their medical providers, support for Medicare-for-all remains relatively unchanged (54% favor v. 43% oppose). If the plan is described as requiring many employers and some individuals to pay more in taxes, but eliminating both out-of-pocket costs and premiums for all Americans, overall favorability drops and the public is equally divided (48% favor vs. 48% oppose) in their views. Similarly, the public is also divided when the plan is described as increasing taxes individuals will personally pay, but decreasing their overall costs for health care (47% favor vs. 48% oppose).

Figure 7: Some Moderate Shifts In Support For Medicare-for-all Depending On Description Of Plan

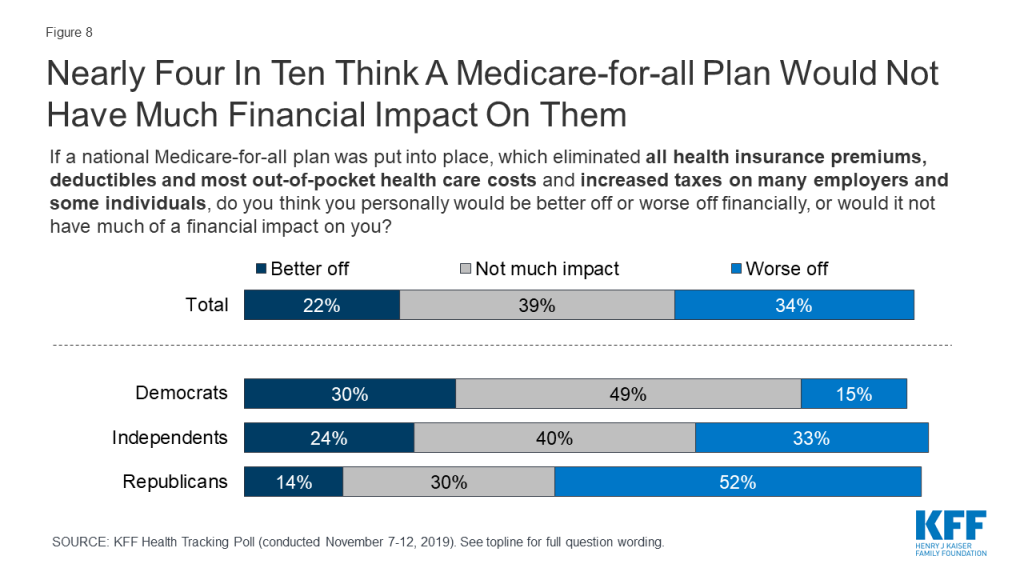
Additionally, about four in ten (39%) say a Medicare-for-all plan that would eliminate health insurance premiums, deductibles, and most out-of-pocket costs but would increase taxes on many employers and some individuals, will not have much financial impact on them. About a third of adults (34%) think they would be worse off under a Medicare-for-all plan while about one in five (22%) think they would be better off. Notably, half of adults 65 and older with Medicare coverage think they would not be financially impacted by a Medicare-for-all plan. Partisans have different expectations of how they would be financially impacted by a Medicare-for-all system which eliminated premiums and deductibles, but increased taxes on employers and some individuals. About half of Democrats (49%) and four in ten independents (40%) think they would not be impacted financially whereas half of Republicans (52%) think they would be worse off under a Medicare-for-all plan.

Figure 8: Nearly Four In Ten Think A Medicare-for-all Plan Would Not Have Much Financial Impact On Them

The Affordable Care Act’s Seventh Open Enrollment Period

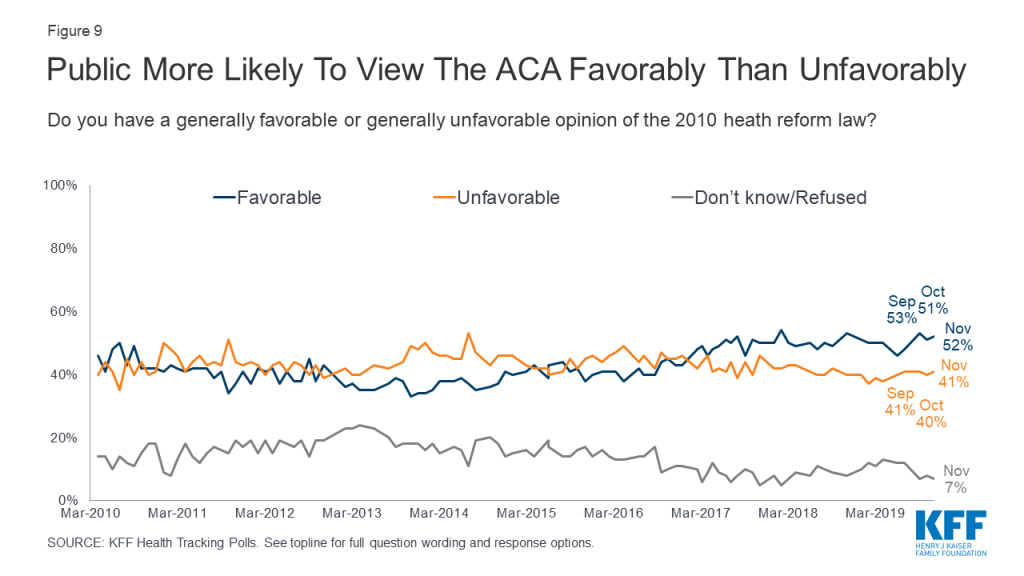
Overall opinions of the Affordable Care Act (ACA) have remained relatively unchanged for the past two years since the Republican efforts to repeal the 2010 health care law. Half of the public (52%) this month hold favorable opinions of the ACA while four in ten (41%) hold a negative opinion of the law. Partisans remain divided on the ACA as eight in ten Democrats (83%) have a favorable view of the ACA compared to half of independents (52%) and about one in five Republicans (22%).

Figure 9: Public More Likely To View The ACA Favorably Than Unfavorably

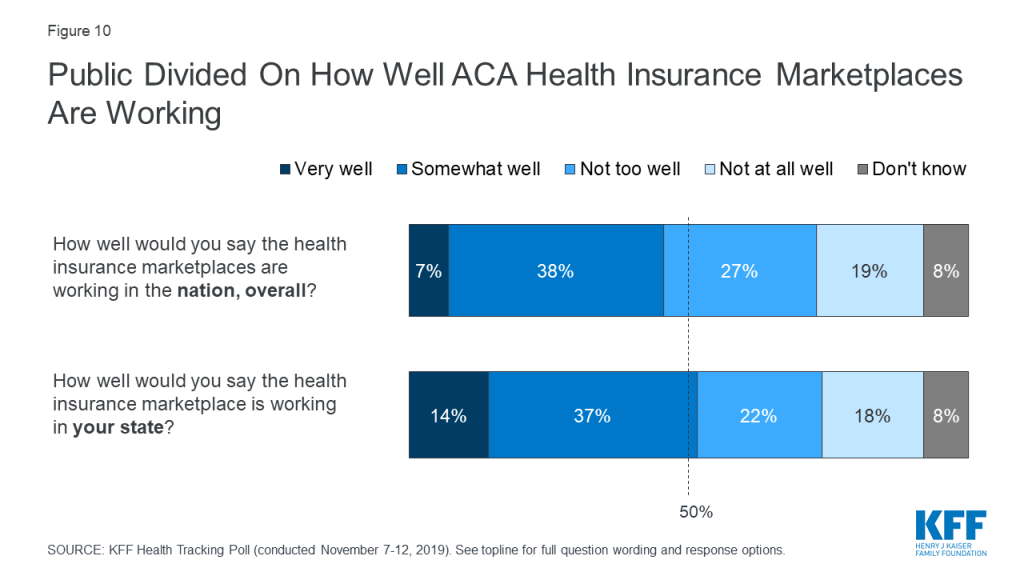
With the ACA open enrollment underway, millions of Americans will be using state and federal health insurance marketplaces, established by the 2010 health reform law, to shop for health insurance plans to cover them and their families in 2020. Americans are divided on how well they think the health insurance marketplaces are working in their own state and in the nation overall. When assessing how well the health insurance marketplaces in the nation are working, about four in ten (45%) say they are working “very well” (7%) or “somewhat well” (38%) while a similar proportion (47%) say they are working either “not too well” (27%) or “not at all well” (19%). The public is slightly more positive about how health insurance marketplaces are working in their state with half (52%) saying they are working either “very well” (14%) or “somewhat well” (37%).

Figure 10: Public Divided On How Well ACA Health Insurance Marketplaces Are Working

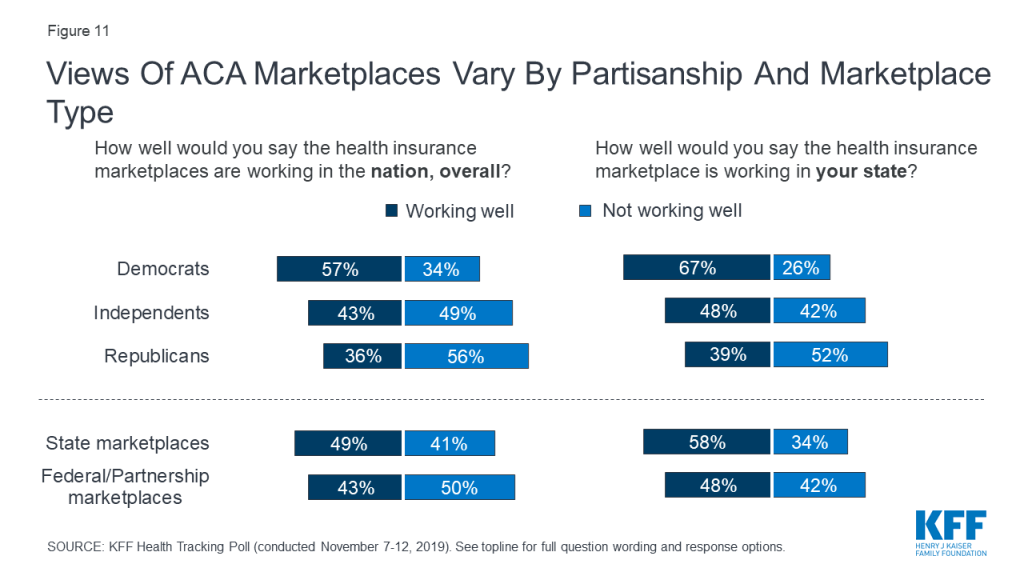
Partisans are split on their views of how well the ACA health insurance marketplaces are working. Nearly six in ten Democrats (57%) say the marketplaces in the nation overall are working well and two-thirds (67%) say marketplaces in their state are working well. On the other hand, a majority of Republicans (56%) say marketplaces in the nation overall are not working well while about half (52%) say the marketplace in their state is not working well.

Notably, adults living in states that have developed their own state-based marketplace are more likely to say the health insurance marketplace in their own state is working well. About six in ten adults (58%) living in states with state-based marketplaces say the health insurance marketplace in their state is working well compared to half of those living in states that are using the federal marketplace (48%).

Figure 11: Views Of ACA Marketplaces Vary By Partisanship And Marketplace Type

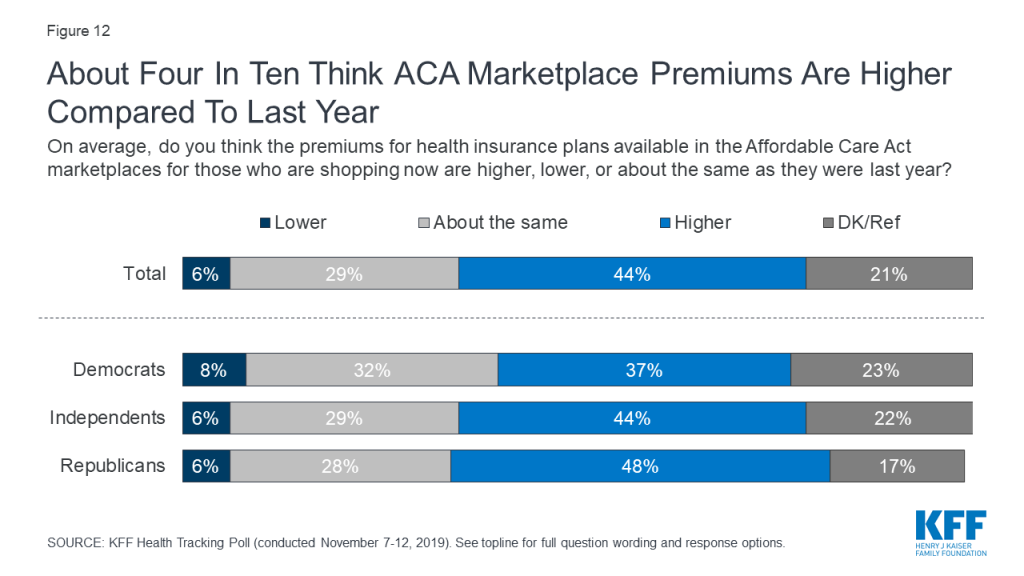
A recent KFF analysis of ACA marketplace premium data for 2020 has indicated that on average, premiums are decreasing across the U.S., though premium changes vary widely by location. Yet few adults think premiums for health insurance plans available in the ACA marketplaces are lower than they were last year. A plurality of the public (44%) think premiums are higher than they were last year while 6% think ACA marketplace premiums are now lower. About three in ten (29%) think the ACA premiums are about the same as last year.

While few partisans think the premiums for ACA plans are lower this year compared to last year, Republicans are more likely than Democrats to say the premiums are higher. Nearly half of Republicans (48%) say premiums in the ACA marketplaces are higher than they were last year compared to 37% of Democrats.

Figure 12: About Four In Ten Think ACA Marketplace Premiums Are Higher Compared To Last Year

The Trump Administration’s Continuing Health Care Efforts

In December 2018, a federal district court judge in Texas issued a ruling siding with Republican state attorneys general that declared the Affordable Care Act invalid since Congress zeroed out the penalty for not having health insurance. The case is now with a panel of judges in the 5th Circuit Court of Appeals. A ruling is expected in the coming months and many expect the case to make its way to the U.S. Supreme Court.

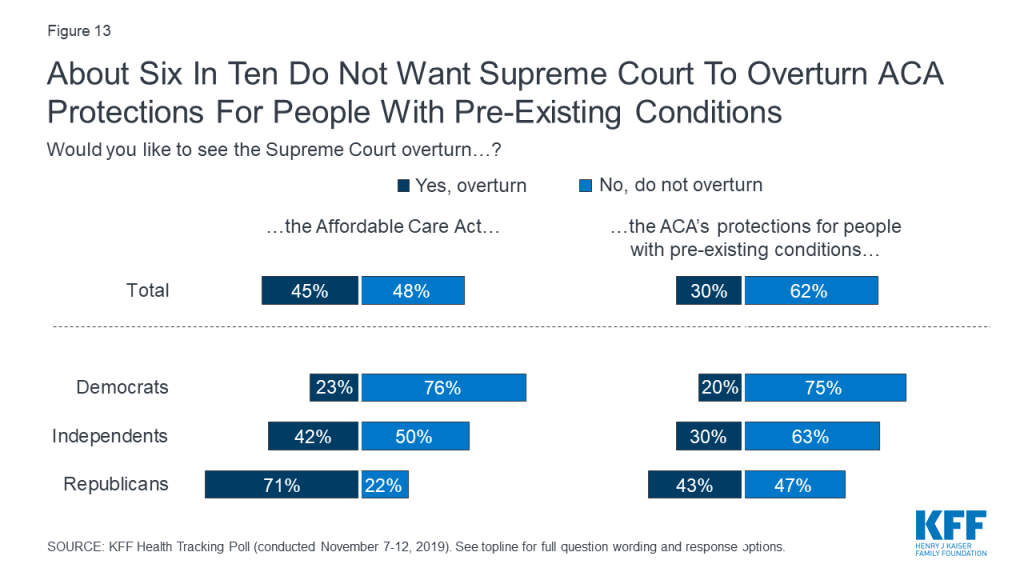
Overall, 62% of the public do not want to see the Supreme Court overturn the ACA’s pre-existing condition protections; yet the public is more divided on whether they want the Supreme Court to overturn the entire law (45% would like to see it overturned and 48% would not). While 76% of Democrats and half of independents do not want to see the 2010 health care law overturned, seven in ten Republicans (71%) say they would like to see the Supreme Court overturn the law. However, far fewer Republicans (43%) want to see the ACA’s protections for people with pre-existing conditions overturned.

Figure 13: About Six In Ten Do Not Want Supreme Court To Overturn ACA Protections For People With Pre-Existing Conditions

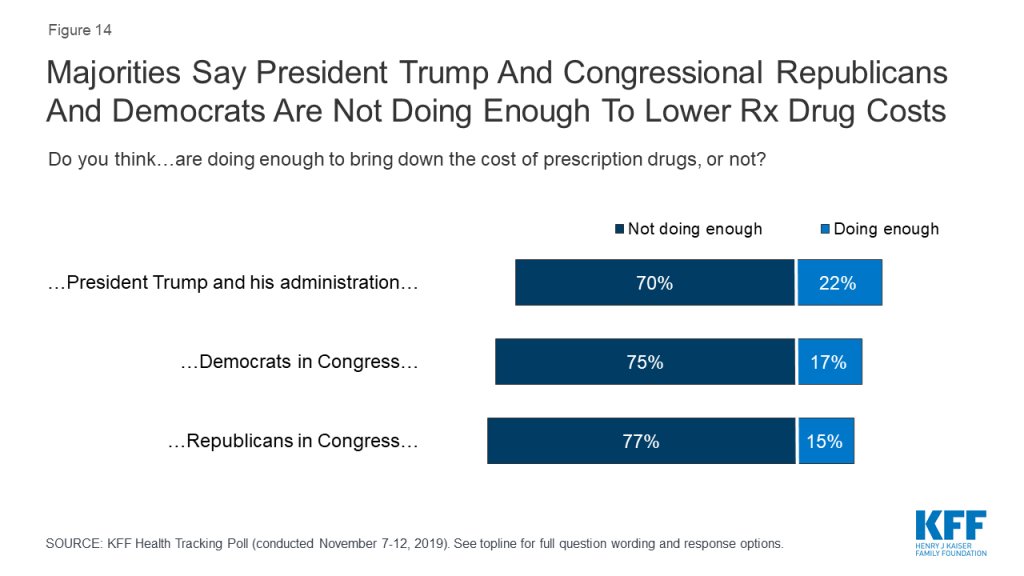
Throughout 2019 lawmakers on both sides of the aisle have been working to address the cost of prescription drugs. Both the U.S. House of Representatives and the U.S. Senate have held hearings on this issue and both the Trump administration and House Speaker Nancy Pelosi have put forward proposals to address prescription drug costs. Despite these efforts to address the issue, majorities say that President Trump and his administration (70%), Democrats in Congress (75%) and Republicans in Congress (77%) are “not doing enough” to bring down the costs of prescription drugs.

Figure 14: Majorities Say President Trump And Congressional Republicans And Democrats Are Not Doing Enough To Lower Rx Drug Costs

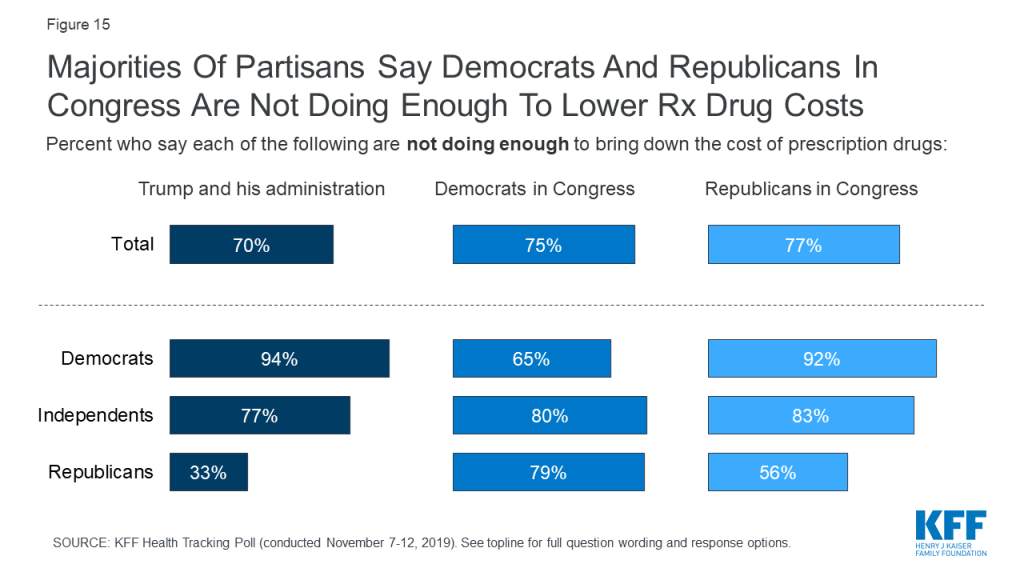
Notably, partisans appear to be critical of their own parties as a majority of Democrats (65%) say Congressional Democrats are “not doing enough” to bring down the costs of prescription drugs and a majority of Republicans (56%) say Congressional Republicans are “not doing enough.” Partisans are polarized on President Trump’s efforts to address prescription drugs costs with an overwhelming majority of Democrats (94%) and about eight in ten independents (77%) saying the Trump administration is “not doing enough,” compared to one-third of Republicans who say the same.

Figure 15: Majorities Of Partisans Say Democrats And Republicans In Congress Are Not Doing Enough To Lower Rx Drug Costs

Seven in ten adults (72%) —including majorities across partisans—think it is “not too likely” or “not at all likely” that Congress will pass legislation to lower the costs of prescription drugs in the next year.

If the public’s pessimism about the prospects of legislation to address prescription drug costs proves to be true, blame for the lack of results will be shared. Three in ten (30%) say they would blame Republicans if Congress does not pass legislation to lower the costs of prescription drugs, and a similar proportion (30%) would blame Democrats in Congress. One in four (25%) would place the blame on President Trump.

Figure 16: Most Say It Is Unlikely That Congress Will Pass Legislation To Lower Prescription Drug Costs In The Next Year

Methodology

This KFF Health Tracking Poll was designed and analyzed by public opinion researchers at the Kaiser Family Foundation (KFF). The survey was conducted November 7th–12th 2019, among a nationally representative random digit dial telephone sample of 1,205 adults ages 18 and older, living in the United States, including Alaska and Hawaii (note: persons without a telephone could not be included in the random selection process). The sample included 290 respondents reached by calling back respondents that had previously completed an interview on the KFF Tracking poll at least nine months ago. Computer-assisted telephone interviews conducted by landline (302) and cell phone (903, including 613 who had no landline telephone) were carried out in English and Spanish by SSRS of Glen Mills, PA. To efficiently obtain a sample of lower-income and non-White respondents, the sample also included an oversample of prepaid (pay-as-you-go) telephone numbers (25% of the cell phone sample consisted of prepaid numbers) as well as a subsample of respondents who had previously completed Spanish language interviews on the SSRS Omnibus poll (n=10). Both the random digit dial landline and cell phone samples were provided by Marketing Systems Group (MSG). For the landline sample, respondents were selected by asking for the youngest adult male or female currently at home based on a random rotation. If no one of that gender was available, interviewers asked to speak with the youngest adult of the opposite gender. For the cell phone sample, interviews were conducted with the adult who answered the phone. KFF paid for all costs associated with the survey.

The combined landline and cell phone sample was weighted to balance the sample demographics to match estimates for the national population using data from the Census Bureau’s 2017 American Community Survey (ACS) on sex, age, education, race, Hispanic origin, and region along with data from the 2010 Census on population density. The sample was also weighted to match current patterns of telephone use using data from the July-December 2018 National Health Interview Survey. The weight takes into account the fact that respondents with both a landline and cell phone have a higher probability of selection in the combined sample and also adjusts for the household size for the landline sample, and design modifications, namely, the oversampling of prepaid cell phones and likelihood of non-response for the re-contacted sample. All statistical tests of significance account for the effect of weighting.

The margin of sampling error including the design effect for the full sample is plus or minus 3 percentage points. Numbers of respondents and margins of sampling error for key subgroups are shown in the table below. For results based on other subgroups, the margin of sampling error may be higher. Sample sizes and margins of sampling error for other subgroups are available by request. Note that sampling error is only one of many potential sources of error in this or any other public opinion poll. Kaiser Family Foundation public opinion and survey research is a charter member of the Transparency Initiative of the American Association for Public Opinion Research.

GroupN (unweighted)M.O.S.E.
Total1,205±3 percentage points
Party Identification
Democrats353±6 percentage points
Republicans340±6 percentage points
Independents390±6 percentage points
Democrats/Democratic-leaning independents/Independents with no leaning643±5 percentage points
Democrats and Democratic-leaning independents550±5 percentage points

Endnotes

  1. Fieldwork for this poll was concluded prior to the November 14th shooting at Saugus High School in Santa Clarita, California. ↩︎

How Have Diabetes Costs and Outcomes Changed Over Time in the U.S.?

Published: Nov 15, 2019

An updated chart collection explores trends in health outcomes, quality of care, and spending on treatment for people with diabetes, the most common endocrine disease in the United States. The analysis finds that diagnosis rates and diabetes-related spending have continued to grow in the U.S., even as disease management has improved and the rate of associated complications has declined.

The slideshow is part of the Peterson-KFF Health System Tracker, an online information hub dedicated to monitoring and assessing the performance of the U.S. health system.

From Ballot Initiative to Waivers: What is the Status of Medicaid Expansion in Utah?

Authors: MaryBeth Musumeci, Madeline Guth, Robin Rudowitz, and Cornelia Hall
Published: Nov 15, 2019

Issue Brief

Summary

Since Utah voters approved a November 2018 ballot measure to adopt the Affordable Care Act (ACA) Medicaid expansion up to 138% of the federal poverty level (FPL), the state legislature has taken steps to roll back the full expansion. The state enacted a law in February 2019 that amended the voter-approved ballot measure, requiring the state to submit a series of Section 1115  waiver requests. This brief provides additional detail about the ballot measure, the state legislation, the status of the required waiver submissions, and the broader implications of Utah’s waivers for other states.

  • Bridge Plan. The first waiver, the “Bridge Plan,” was approved in March 2019, and allowed the state to implement a coverage expansion to 100% FPL beginning April 1, 2019, at the state’s regular matching rate. The approved waiver also included an enrollment cap and a work requirement.
  • Per Capita Cap. On July 31, 2019, Utah submitted to the Centers for Medicare and Medicaid Services (CMS) its “Per Capita Cap” proposal for a new waiver that would continue a number of provisions already approved as well as a request for the enhanced match for partial expansion to 100% FPL and a limit on enhanced federal funding. CMS issued a general statement in late July and a letter to the state in mid-August confirming that they would not approve the enhanced matching rate for an expansion that does not go to 138% FPL or that includes an enrollment cap.1  Given CMS guidance about partial expansion, it seems clear that some provisions of the Per Capita Cap waiver will not be approved, but CMS says it is reviewing the other provisions.
  • Fallback Plan. The state legislation requires the submission of a “Fallback Plan” waiver should CMS not approve the Per Capita Cap waiver. On November 4, 2019, Utah submitted to CMS its Fallback Plan waiver that would expand Medicaid to 138% FPL and would continue some other provisions in the earlier waivers, including an enrollment cap. In its submission letter, Utah says that CMS rejected its PCC waiver request, although the waiver is still listed as pending on CMS’ website as of November 14, 2019.
  • Ballot Approved Expansion. If CMS does not approve the Fallback Plan by July 1, 2020, Utah must adopt the full Medicaid expansion without restrictions as required by the ballot initiative.

Utah Ballot Initiative and Subsequent Legislation

As in Idaho and Nebraska, Utah voters supported a November 2018 ballot measure to adopt the full Medicaid expansion as set out in the ACA. Utah voters approved a full ACA expansion to cover nearly all adults with income up to 138% of the federal poverty level (FPL, $17,236/year for an individual in 2019), an April 1, 2019, implementation date, and a state sales tax increase as the funding mechanism for the state’s share of expansion costs. By implementing a full ACA expansion, Utah would qualify for the substantially enhanced (93% in 2019 and 90% in 2020 and thereafter) federal matching funds. The expansion population in Utah includes childless adults ages 19-64 with income from 0% to 138% FPL and parent/caretakers ages 19-64 with income from 60% to 138% FPL.2  The fiscal note from the ballot initiative estimated that approximately 150,000 newly eligible individuals would enroll in Medicaid in fiscal year 2020.

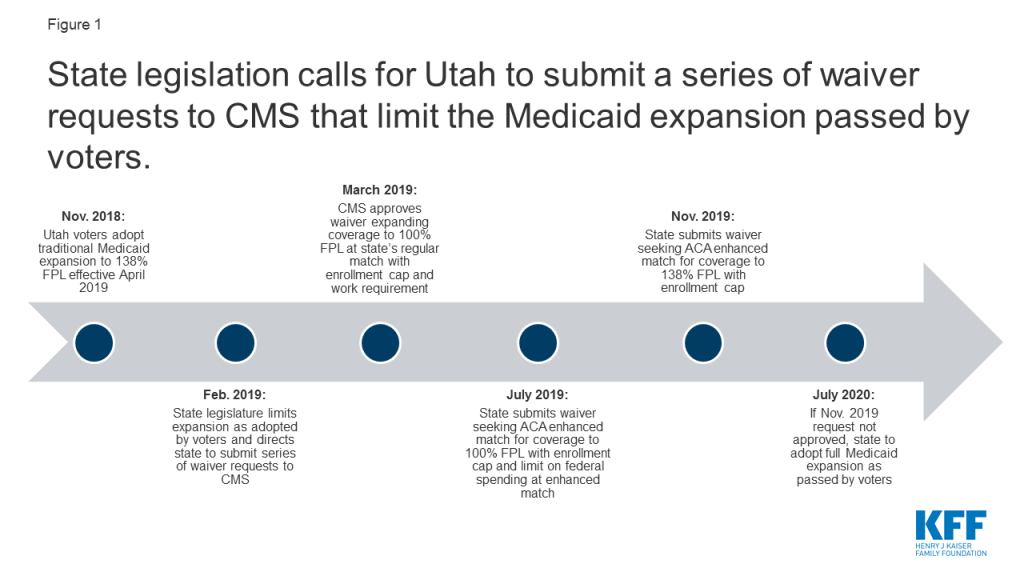
However, the Utah legislature significantly changed and limited the coverage expansion that the voters adopted. Utah is one of 11 states (out of the 21 states that allow state laws to be adopted via a ballot initiative) that have no restrictions on how soon or with what majority state legislators can repeal or amend voter-initiated statutes. Utah Governor Gary Herbert signed Senate Bill 96 into law on February 11, 2019. The state released an implementation toolkit that follows the legislation in calling for multiple steps to implement an expansion of Medicaid coverage to adults in ways that differ from a full ACA expansion (Figure 1).

Figure 1: State legislation calls for Utah to submit a series of waiver requests to CMS that limit the Medicaid expansion passed by voters.

Utah’s Amended Waiver Approved March 2019

On March 29, 2019, CMS approved an amendment to Utah’s existing Section 1115 demonstration waiver to expand Medicaid to a capped number of adults with income up to 100% FPL beginning on April 1, 2019, at the state’s regular Medicaid matching rate, not the enhanced ACA matching rate.3  The authority to cover this “Adult Expansion Population” expires on January 1, 2021. The Adult Expansion Population under the waiver includes childless adults ages 19-64 with income from 0 to 100% FPL4  and parent/caretakers ages 19-64 with income from 60% FPL to 100% FPL,5  a more limited coverage expansion than the 138% FPL approved by the voters (Figure 2). The state estimates that approximately 70,000 to 90,000 people will be covered under the waiver with financial eligibility limited to 100% FPL, about 40,000 fewer compared to a full ACA expansion to 138% FPL.6 

Figure 2: Medicaid eligibility limits for Utah adults under S.B. 96 are lower than under the voter-passed ballot initiative.

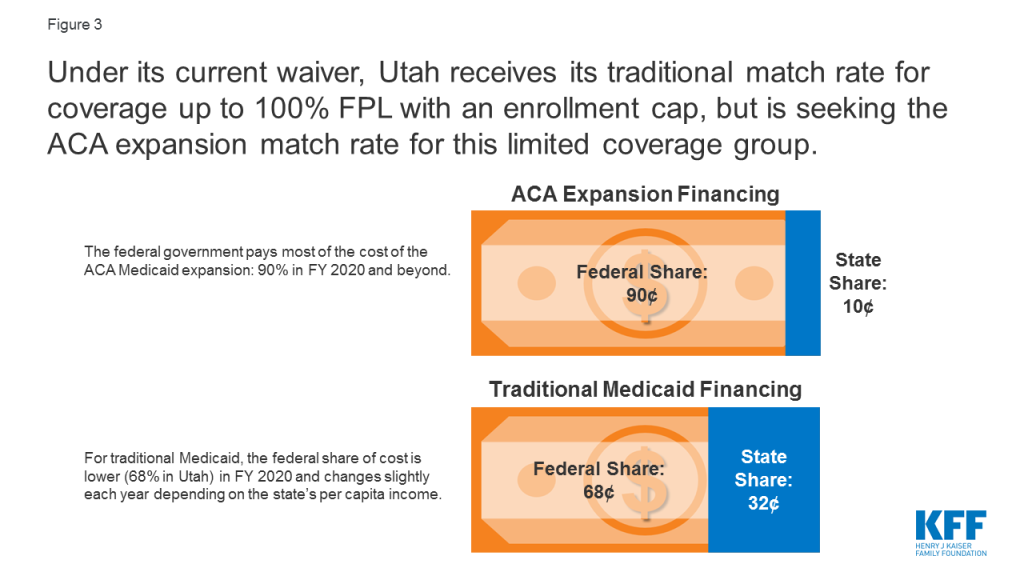
Instead of the 90% enhanced federal matching rate tied to newly eligible adults under a full ACA expansion, Utah is receiving its current, traditional federal matching rate of 68%. This lower matching rate will result in higher state costs for expanding coverage to 100% FPL than for a full expansion to 138% FPL (Figure 3).7  Utah refers to the March 2019 waiver amendment as the “Bridge Plan” because the state is seeking further waiver amendments as required by Senate Bill 96 and described in the text below. Utah’s pre-ACA coverage expansion, authorized by its waiver prior to the Bridge Plan amendment, provided limited benefits and preventive care (see Box 1 below).

Figure 3: Under its current waiver, Utah receives its traditional match rate for coverage up to 100% FPL with an enrollment cap, but is seeking the ACA expansion match rate for this limited coverage group.

Utah’s amended waiver includes an enrollment cap to be imposed at state option on the Adult Expansion Population, meaning that not all eligible people may be able to enroll in coverage. The waiver allows the state to close enrollment for the Adult Expansion Population, which could limit enrollment further than the coverage estimates noted above. The waiver does not specify a pre-determined maximum number of people to be covered but instead allows the state to stop enrolling eligible people “if projected costs exceed state appropriations.” If the enrollment cap is reached, the state will not maintain a waiting list; instead, eligible individuals will have their applications denied and will have to reapply for coverage when enrollment re-opens. Consequently, individuals who apply at the beginning of a state fiscal year could be more likely to gain coverage than those who apply later in the fiscal year, even though they are otherwise eligible, if the state imposes the enrollment cap. It is possible that individuals with lower incomes or higher needs, compared to those already enrolled, might be barred from enrolling in coverage as a result of the timing of their application due to the enrollment cap.

Utah’s amended waiver also includes a work requirement as a condition of eligibility for the Adult Expansion Population, beginning no sooner than January 1, 2020.8  In Utah, individuals subject to the work requirement must complete certain activities within the first three months of each 12-month eligibility period or qualify for an exemption. Possible exemptions include age of 60 or older, pregnancy, responsibility to care for a dependent under age six in the same household or a disabled person, and physical or mental inability to meet the work requirement as determined by a medical professional, among others. Those who fail to do so will lose coverage for the rest of the year or until they fulfill the requirement. Qualifying activities include registering for work through the state’s online system, completing an online employment training needs assessment, completing online job training modules identified through the assessment, and applying for work with at least 48 potential employers.

Utah’s Per Capita Cap Waiver Submitted July 2019

In accordance with SB 96, Utah submitted its “Per Capita Cap” (PCC) waiver application to CMS on July 31, 2019, which includes a request to receive the 90/10 ACA enhanced matching rate for expansion adult coverage up to 100% FPL; however, CMS guidance states that such a policy would not be approved.9  The waiver would move all expansion adults (parents 60-100% and childless 0-100%, including the Targeted Adult group) and the waiver services provided to these populations from the existing waiver to the new waiver. The Targeted Adult population includes adults ages 19-64 without dependent children with income up to 5% FPL who are chronically homeless or involved in the criminal justice system and in need of substance use or mental health treatment.

Days before Utah’s submission, a CMS statement indicated that it would not approve the 90/10 ACA enhanced matching rate for an expansion population smaller than the full group up to 138% FPL, arguing that such policies would “invite continued reliance on a broken and unsustainable Obamacare system.”10  Therefore, the result of no partial expansion is similar to the prior administration, but for different publicly-stated reasons.11  In its submission letter, the state provided several reasons for submitting the waiver as envisioned in SB 96, including the unknown outcome of the Texas vs U.S. litigation challenging the ACA, value in getting a formal response from CMS, and the state’s hopes for approval of other waiver provisions. CMS also indicated in an August 16, 2019 letter12  to Utah that it would not authorize an enrollment cap with enhanced ACA matching funds for the expansion group as Utah requested; see more on this guidance in the Fallback Plan section below.

The waiver also requests a limit on enhanced federal funding through what the state describes as a “per capita cap” funding mechanism. Under the waiver request, an aggregate annual per capita cap would be calculated based on the weighted total of separate per capita caps for three enrollment groups: targeted adults and enrollees receiving IMD services for substance use disorder (SUD), expansion parents, and expansion adults without children.13  Expenditures in excess of the total per capita cap but within budget neutrality would receive the State’s traditional FMAP rather than the enhanced matching rate.14  The state would establish per enrollee amounts for each group for a base year and apply a trend rate for future demonstration years.

Unlike federal legislative per capita cap proposals, the PCC waiver request would not impose a cap on all federal Medicaid dollars. The state request would apply only to the enhanced matching dollars and not all federal matching dollars, include a mechanism for automatic rebasing, and allow for adjustments for unforeseen events like a public health emergency, natural disaster, major economic event, new federal mandate, or any subsequent waivers approved by CMS that affect the populations under this waiver. The state assumes a “with waiver” per capita cap growth rate of 4.2%, lower than the anticipated “without waiver” per member per month cost growth rate of 5.3%.

Among other provisions, the PCC waiver proposal also includes a lockout period for “Intentional Program Violations” (IPV) committed when documenting Medicaid eligibility. The state seeks waiver authority to impose a six-month coverage lockout period if an individual commits an IPV. Utah defines an IPV as occurring when there is “clear and convincing evidence that the individual knowingly, willingly, or recklessly provided false or misleading information with an intent to receive benefits to which he or she was not eligible to receive” and may find the individual responsible to repay any medical assistance received for which he or she was not eligible. An IPV would include not reporting a change in eligibility within ten days with the intent to obtain benefits to which the enrollee is not entitled. Under Utah’s existing Medicaid policy, the state is currently determining IPVs using this definition and assessing overpayments using an administrative hearing process. The new authority that the PCC waiver seeks is to impose coverage lockouts when an IPV determination is made. Utah also has a separate process where certain cases are referred for potential criminal fraud prosecution in court.

The waiver request includes other eligibility, benefit, and process changes. The PCC waiver’s other new provisions include expenditure authority for housing-related services and supports and authority to provide up to 12-month continuous Medicaid eligibility. The state asks for waiver authority to limit these provisions to certain geographic areas or populations that are not specified in the waiver. The waiver also seeks authority to not allow hospitals to make presumptive eligibility determinations and to allow the state to continue a limited benefit package for expansion parents. Finally, the waiver seeks to waive some managed care rules, including advance CMS approval of actuarially sound rates, managed care contracts, and directed payments.

In addition to the new provisions, the PCC waiver seeks to maintain authority to implement provisions approved in March 2019, including the enrollment cap (currently approved at the regular federal matching rate) and the work requirement for the expansion population. As noted above, CMS has indicated that it would not approve the enhanced federal matching rate for the ACA expansion in the context of enrollment caps. Based on its experience with SNAP work requirements, the state estimates that approximately 70 percent of expansion adults (49,000-63,000 individuals) will meet an exemption to the work requirements. The state further projects that, among individuals who do not meet an exemption or good cause reason, approximately 75-80 percent will comply with the work requirements. Other provisions that were approved in March 2019 include dental benefits for Targeted Adults receiving SUD treatment, SUD treatment in institutions for mental disease (IMD), a targeted SUD residential withdrawal pilot in Salt Lake County, and a waiver of EPSDT for 19- and 20-year-olds.

Utah’s Fallback Plan Waiver Submitted November 2019

As directed by SB 96, Utah submitted its Fallback Plan waiver request on November 4, 2019, seeking authority for a coverage expansion up to 138% FPL with the 90/10 ACA enhanced matching funds and an enrollment cap.15  In its submission letter, Utah says that CMS rejected its PCC waiver request, although the waiver is still listed as pending on CMS’ website as of November 14, 2019. Like the PCC waiver, the Fallback Plan includes coverage lockouts for intentional program violations, elimination of hospital presumptive eligibility, expenditure authority for housing-related services and supports, and modifications for managed care rules; unlike the PCC waiver, it does not request the authority to provide 12-month continuous Medicaid eligibility for the expansion population. The Fallback Plan seeks to continue the work requirement and enrollment cap approved in March 2019 but does not seek a per capita cap on federal funds at the enhanced matching rate.

As noted above, CMS has indicated that it would not authorize an enrollment cap with enhanced ACA matching funds for the expansion group, as Utah requested in both the PCC and Fallback waivers. In addition to expanding coverage to 138% FPL and receiving the 90/10 ACA enhanced match rate, the Fallback Plan requests to continue the enrollment cap approved by CMS in March 2019. In an August 16, 2019, letter16  to Utah following the state’s PCC waiver submission, CMS noted that, if implemented, an enrollment cap would “have the effect of limiting enrollment to less than the full group otherwise eligible for Medicaid, which would be tantamount to ‘partial expansion.’” CMS noted that it would therefore not authorize the enhanced matching rate if the enrollment caps were implemented. In its submission letter, Utah provided two reasons for submitting the Fallback Plan waiver as envisioned in SB 96 despite this CMS guidance: the unknown outcome of the Texas vs U.S. litigation challenging the ACA and the state’s hopes for approval of other waiver provisions. As explained in Box 1, enrollment caps are no longer necessary to ensure federal budget neutrality because the ACA now allows states to access federal Medicaid funds for this coverage directly through the creation of the new adult eligibility pathway and the availability of federal matching funds.

Box 1: Coverage Expansion under Utah’s Waiver Prior to the ACA

In 2014, the ACA for the first time authorized federal Medicaid matching funds for coverage for nearly all nonelderly adults. Prior to 2014, federal Medicaid funds could only be used to cover pregnant women, parent/caretakers, children, seniors, and people with disabilities. Adults without dependent children were ineligible for Medicaid, no matter how poor they were. Before the ACA, some states used Section 1115 waivers to establish coverage expansions beyond the limits of federal law. Because federal Medicaid funds could not be accessed directly to cover these adults, these waivers included provisions to generate savings to fund coverage expansions, such as limited benefit packages, premiums, and/or mandatory managed care enrollment, and sometimes enrollment caps as a way to limit federal spending and ensure federal budget neutrality.17  However, budget neutrality is no longer a consideration for such coverage expansions under waivers now that federal Medicaid law, as amended by the ACA, includes an eligibility pathway and allows states to receive federal Medicaid matching funds to cover nearly all nonelderly adults, including those without dependent children, up to 138% FPL without the need for a waiver.

Utah’s existing Section 1115 waiver was first approved in 2002 and included a pre-ACA coverage expansion (called the Primary Care Network, PCN) to parents with income above the state plan limit (60% FPL) and childless adults (for whom no state plan coverage was available). As of March 2019, the PCN income limit was 100% FPL. The PCN coverage expansion provided a limited benefit package of primary and preventive services18  to a capped number of these adults and was funded by reduced benefits for traditional low-income (categorically and medically needy) parents. The March 2019 waiver amendment suspends authority for Utah’s pre-ACA PCN coverage expansion and moves the 17,500 parents and childless adults in the PCN group as of March 2019 to the new “Adult Expansion Population” (described in the section above on Utah’s Amended Waiver Approved Mach 2019) effective April 1, 2019.19 

The Fallback Plan waiver requests to expand the eligibility criteria for the Targeted Adult group and seeks authority to suspend enrollment for sub-populations of Targeted Adult populations. The Targeted Adult group is comprised of three populations and Utah currently has authority to suspend enrollment for the entire Targeted Adult group or separately for any of the three populations. In the Fallback Waiver, Utah seeks to expand the Targeted Adult Medicaid criteria to include three new sub-populations: homeless victims of domestic violence, individuals who are court ordered to receive substance abuse or mental health treatment, and individuals on probation or parole with serious mental illness and/or serious substance use disorder. Utah estimates that an additional 7000 individuals will be eligible for the Targeted Adult group due to the expanded criteria. Any suspension of enrollment of Targeted Adult populations or sub-populations would occur through the state’s administrative rule-making process. If enrollment is suspended for Targeted Adults, individuals could be eligible in the Expansion Adult group (provided that enrollment has not been suspended there); however, unlike the Expansion Adult group, Targeted Adults receive 12-month continuous eligibility and dental benefits (if receiving substance use disorder treatment services).

Under the Fallback Plan waiver, adults with incomes between 100% and 138% of the FPL would pay monthly premiums in order to maintain coverage under Medicaid expansion. Monthly premiums would be $20 for a single individual or $30 for a married couple. Utah requests the authority to raise these premiums to reflect annual increases in the FPL through the state administrative rulemaking process. Beneficiaries who fail to pay their premium in the month prior to the month of eligibility would be dis-enrolled from Medicaid and required to pay all past-due premiums to re-enroll, unless it had been more than six months from when coverage ended. Members of federally recognized tribes and those identified as medically frail would be exempt from paying premiums. The state estimates that 40,000 individuals would be required to pay these monthly premiums and that approximately 3% of these beneficiaries would lose eligibility due to failure to pay.

The Fallback Plan waiver would also add a premium surcharge for non-emergent use of the emergency department. The state seeks to require beneficiaries with incomes between 100% and 138% of the FPL to pay a $10 premium surcharge for any use of the emergency department considered non-emergent, up to a maximum of $30 per quarter. Individuals would receive one warning after the first occurrence of non-emergent emergency department use, and any subsequent non-emergent uses would result in the $10 surcharge to their monthly premium. An individual with five or more occurrences of non-emergent use within the most recent twelve months would be referred to the Medicaid Restriction Program, which could take additional action such as limitations on where the individual may receive services. Members of federally recognized tribes, individuals receiving employer-sponsored insurance reimbursement, and medically frail individuals would be exempt from this provision. The state estimates that between 1500 and 2000 beneficiaries would owe surcharges each month.

In addition to these provisions, the Fallback Plan waiver also seeks authority to make additional changes to the Medicaid expansion through the state administrative rulemaking process without requiring CMS approval. Utah expects that most of these changes, if enacted, would decrease total beneficiary months and demonstration expenditures. The changes include:

  • Making enrollment begin on the first of the month after application for beneficiaries with incomes above 100% FPL.
  • Eliminating retroactive eligibility for beneficiaries with incomes above 100% FPL.
  • Changing the benefit package for expansion beneficiaries and Targeted Adult groups to the state’s non-traditional package. This would restrict all Medicaid beneficiaries to this more limited plan except for those identified as medically frail.
  • Exempting certain income groups from the employer-sponsored insurance requirement.
  • Suspending housing supports.
  • Making enrollment in managed care mandatory or optional for different groups of expansion adults.
  • Opening or suspending enrollment for each population group within the Target Adult population.

What is Next?

The Fallback Plan waiver is currently under consideration at CMS. Given CMS guidance about partial expansion, it seems clear that the request for enhanced ACA matching funds with an enrollment cap on the expansion group will not be approved, but CMS says it is reviewing the other requests. In its submission letter, Utah requested that CMS approve the Fallback Plan waiver by December 31, 2019, for implementation on January 1, 2020.

If CMS does not approve the Fallback Plan by July 1, 2020, Utah will adopt the full Medicaid expansion plan with no restrictions as set out by the ACA and approved in the ballot initiative. This plan would include coverage of all eligible adults up to 138% FPL at the ACA enhanced matching rate and would use a state plan amendment instead of waiver authority. It would not include a work requirement, enrollment cap, or other eligibility and enrollment restrictions as proposed in the waiver proposals described above.20 

Endnotes

  1. CMS statement released July 29, 2019 and CMS letter to Governor Herbert on August 16, 2019:  https://www.cms.gov/newsroom/press-releases/cms-statement-partial-medicaid-expansion-policy, https://www.medicaid.gov/Medicaid-CHIP-Program-Information/By-Topics/Waivers/1115/downloads/ut/per-capita-cap/ut-per-capita-cap-correspondence-ltr-20190816.pdf ↩︎
  2. Under a full expansion, certain Targeted Adult populations currently covered through state waivers would transition to coverage under the expansion group. ↩︎
  3. The March 2019 waiver amendment was approved based on the state’s June 2018 pending amendment request, which sought to cover adults ages 19 to 64 up to 95% FPL (effectively 100% FPL with the 5 percentage point FPL disregard) at the ACA enhanced match with an enrollment cap and a work requirement. The June 2018 waiver amendment request also sought to waive EPSDT for 19 and 20 year olds and authority for mandatory Medicaid premium assistance for individuals with access to employer sponsored insurance. ↩︎
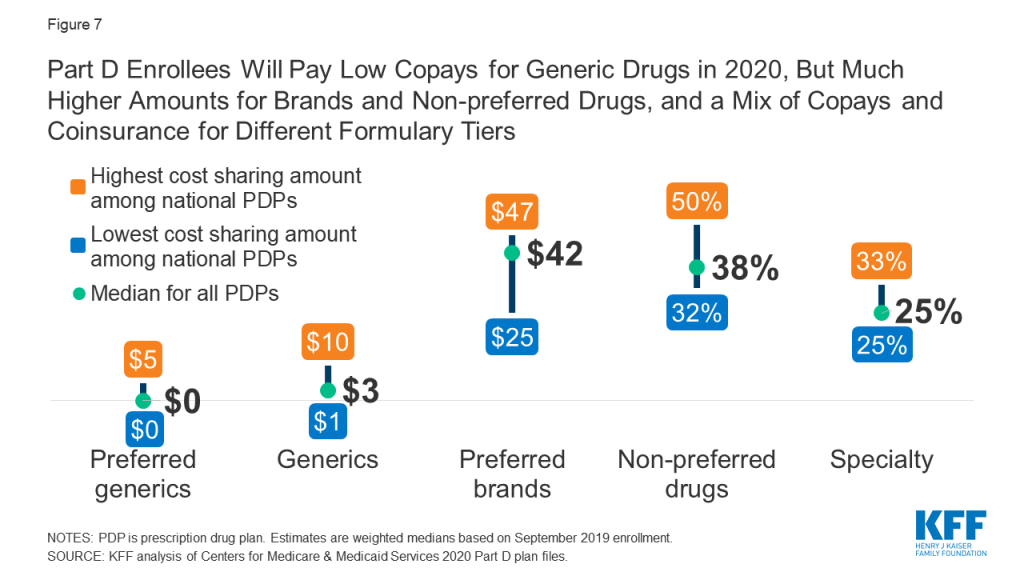
  4. Utah’s waiver continues to cover the Targeted Adult population, which was added in 2017, and includes adults ages 19-64 without dependent children with income up to 5% FPL who are chronically homeless or involved in the criminal justice system and in need of substance use or mental health treatment. The waiver provides that the Targeted Adult group or any subset may be closed to new enrollment at the state’s election. ↩︎
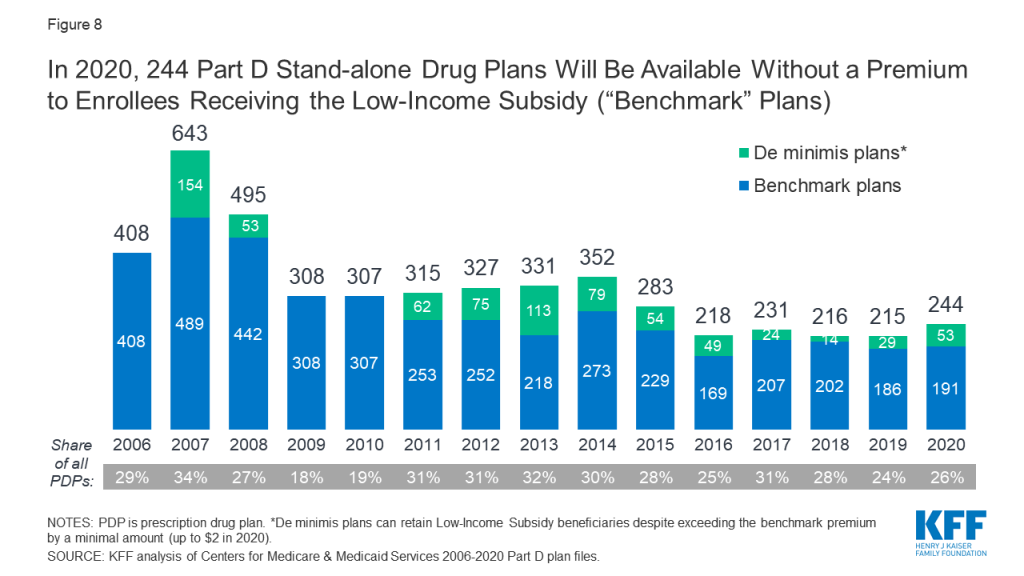
  5. Members of the Adult Expansion Population who are childless adults receive full state plan benefits. Members of the Adult Expansion Population who are parent/caretakers receive the same benefit package as traditional low-income parents under Utah’s waiver, which is more limited than Utah’s state plan benefit package. For example, private duty nursing, long-term care, eyeglasses, and non-emergency medical transportation are not covered, and dental services are generally covered only in emergencies. There also are additional surgical exclusions, a limit of 16 physical and occupational therapy visits per year, hearing aids only for congenital hearing loss, and some excluded medical supplies and equipment. Utah’s waiver continues to not provide EPSDT treatment services for 19 and 20 year olds. In addition, the March 2019 waiver amendment authorizes services for all Medicaid-eligible individuals who are primarily receiving substance use disorder treatment and withdrawal management services as short-term “institution for mental disease” residents. Individuals in the Adult Expansion Population with access to employer sponsored insurance must enroll in that coverage and receive Medicaid premium assistance as of January 1, 2020. If an individual misses the period to enroll in employer-sponsored insurance, they are ineligible for Medicaid. Individuals must pay employer-sponsored insurance premiums out-of-pocket and will be reimbursed by the state, minus the Medicaid premium applied to those from 101-138% FPL that the state is seeking in the Fallback waiver amendment. ↩︎
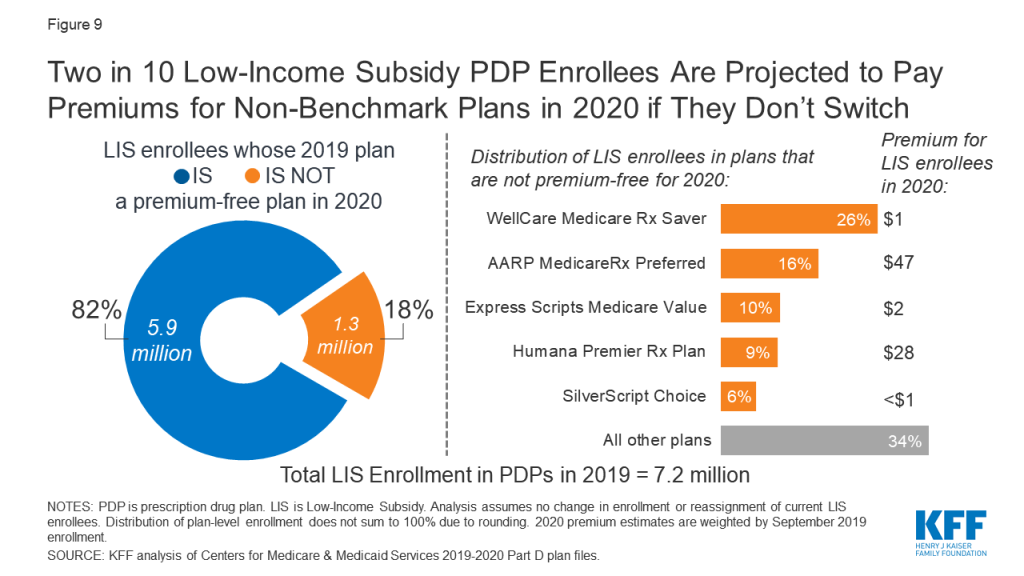
  6. UT Dep’t of Health, Utah’s Medicaid Expansion Implementation Toolkit at 2. ↩︎
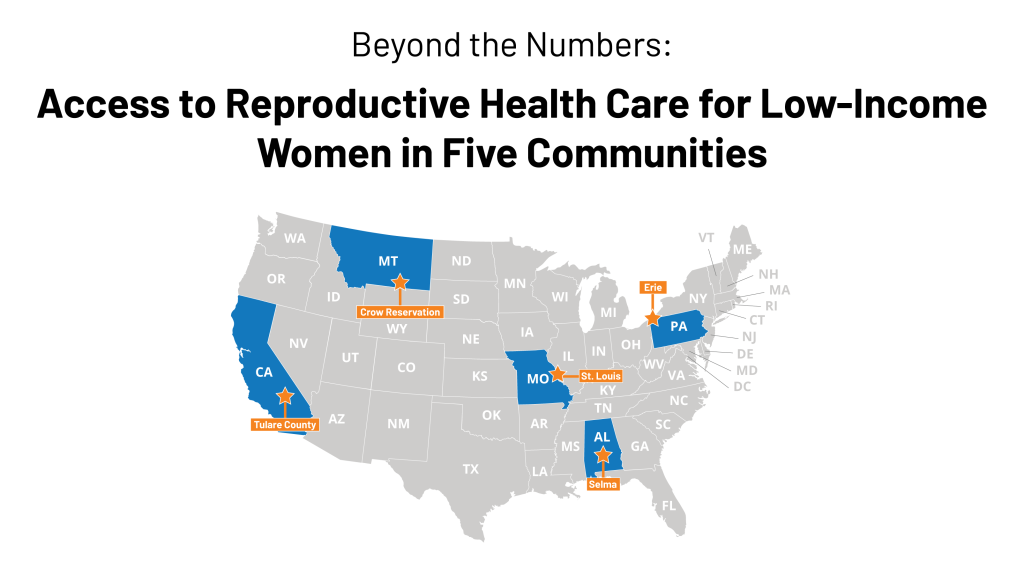
  7. Benjamin Wood, Salt Lake Tribune, “Lawmakers’ rejection of Proposition 3 is costing Utahns $2.5M each month, state Medicaid director says” (August 23, 2019), https://www.sltrib.com/news/politics/2019/08/23/lawmakers-rejection/. ↩︎
  8. The approval came two days after a federal district court set aside waivers in Arkansas and Kentucky that included work and reporting requirements. The case is now on appeal. ↩︎
  9. The request for the enhanced ACA match would also apply to the Targeted Adult population. ↩︎
  10. CMS statement released July 29, 2019, https://www.cms.gov/newsroom/press-releases/cms-statement-partial-medicaid-expansion-policy. ↩︎
  11. CMS guidance issued in 2012 concludes that “Congress directed that the enhanced matching rate be used to expand coverage to [138%] of FPL. The law does not provide for a phased-in or partial expansion.”, https://www.cms.gov/CCIIO/Resources/Files/Downloads/exchanges-faqs-12-10-2012.pdf ↩︎
  12. CMS letter to Utah Governor Gary Herbert on August 16, 2019, https://www.medicaid.gov/Medicaid-CHIP-Program-Information/By-Topics/Waivers/1115/downloads/ut/per-capita-cap/ut-per-capita-cap-correspondence-ltr-20190816.pdf. ↩︎
  13. Some expenditures would be excluded from the per capita caps including emergency only funding for non-citizens, expenditures for enrollees in federally recognized tribes and inpatient stays for incarcerated individuals. ↩︎
  14. A number of enrollment groups are included in the overall waiver and subject to budget neutrality calculations, but excluded from the per capita cap funding calculations. ↩︎
  15. Utah submitted the Fallback Plan waiver as an amendment to the state’s already-approved PCN waiver (unlike the PCC waiver, which it submitted as a new, separate waiver). ↩︎
  16. CMS letter to Utah Governor Gary Herbert on August 16, 2019, https://www.medicaid.gov/Medicaid-CHIP-Program-Information/By-Topics/Waivers/1115/downloads/ut/per-capita-cap/ut-per-capita-cap-correspondence-ltr-20190816.pdf. ↩︎
  17. Under long-standing federal policy, Section 1115 waivers must be budget neutral to the federal government, meaning that federal costs under the waiver cannot exceed what federal costs would have been without the waiver. ↩︎
  18. Covered services included primary care physician, lab, radiology, durable medical equipment, emergency room services, pharmacy, dental, and vision, often with different limitations than the state plan benefit package. Inpatient hospital, specialty care, and mental health services were not covered. ↩︎
  19. UT Dep’t of Health, Utah’s Medicaid Expansion Implementation Toolkit at 3. ↩︎
  20. The full expansion also would provide traditional Medicaid benefits under an alternative benefit plan as required under the ACA. It would not limit benefits for expansion parents as described in endnote 3 and would not waive EPSDT for 19 and 20 year olds. ↩︎

Opioid Use Disorder among Medicaid Enrollees: Snapshot of the Epidemic and State Responses

Authors: Julie Donohue, Peter Cunningham, Lauryn Walker, and Rachel Garfield
Published: Nov 15, 2019

Executive Summary

As the largest payer of substance use disorder services in the United States, Medicaid plays a central role in state efforts to address the opioid epidemic. In addition to increasing access to addiction treatment services through the expansion of Medicaid under the Affordable Care Act (ACA), states are expanding Medicaid addiction treatment services, increasing provider reimbursements, restricting opioid prescribing, and implementing delivery system reforms to improve the quality of treatment services. While many states have been tracking progress and challenges in these efforts, uniqueness of state systems can make it difficult to compare or benchmark across states. This brief draws on analyses provided by the Medicaid Outcomes Distributed Research Network (MODRN), a collaborative effort to analyze data across multiple states to facilitate learning among Medicaid agencies. It profiles the opioid epidemic among the Medicaid population in six states participating in MODRN that also have been hard hit by the opioid epidemic: Kentucky, Maryland, Ohio, Pennsylvania, Virginia, and West Virginia. The brief also draws on interviews with officials from the state Medicaid and other health agencies. Key findings include following:

  • The prevalence of opioid use disorder (OUD) among Medicaid enrollees in the study states (5% in 2016) is higher than the national average, reflecting regional concentration of the opioid epidemic within the country. In states that expanded Medicaid under the ACA, more than half of Medicaid enrollees with opioid use disorder (56%) qualified through the expansion. However, prevalence of OUD among the expansion population (6.9%) is similar to other Medicaid eligibility groups.
  • State officials indicated that the ACA Medicaid expansion allowed previously uninsured people with undiagnosed or untreated substance use disorders to receive treatment. To prevent opioid addiction among Medicaid enrollees, states are reducing opioid prescribing to Medicaid enrollees through greater monitoring, use of prior authorization, and other limits on opioid prescribing. In addition, all six states have taken steps to cover the full continuum of treatment services, and five of the six states have received Section 1115 IMD waivers to help provide the full continuum of treatment services.
  • All six states cover evidence-based medication-assisted treatment (MAT). Despite these efforts, less than half of Medicaid enrollees with opioid use disorder in the six states receive any MAT. Among those receiving pharmacotherapy, 52% received at least six months of treatment.

The six states are taking other actions to improve access to and quality of addiction treatment services, such as recruiting and training more providers to prescribe buprenorphine, eliminating prior authorization requirements for buprenorphine, improving transitions between hospital settings and community-based care, and adopting new models of care delivery that emphasize greater coordination of MAT with other physical and behavioral health services. Most are also leveraging new federal funding through SAMHSA to work in concert with Medicaid reforms.

Issue Brief

Introduction

In the United States, Medicaid covers 38 percent of non-elderly adults with an opioid use disorder.1  As the largest payer of substance use disorder services in the United States, Medicaid plays a central role in state efforts to address the opioid epidemic, largely driving policy on improving delivery of treatment services.2  States may adopt several policy options to increase access to opioid use disorder treatment, improve quality of care and reduce overdose deaths among Medicaid enrollees, including expanding benefits to include a broader range of addiction treatments, increasing provider reimbursements, restricting opioid prescribing, and implementing delivery system reforms. While many states have been tracking progress and challenges in these efforts, uniqueness of state systems can make it difficult to compare or benchmark across states, and there is limited data to measure quality or outcomes of opioid treatment efforts. In addition, the expansion of Medicaid under the ACA extended eligibility to many people with substance use disorder who previously lacked access to affordable insurance coverage, but there is limited data on how expansion increased coverage and access to treatment services for opioid use disorder (OUD).

This brief draws on analyses provided by the Medicaid Outcomes Distributed Research Network (MODRN),3  a collaborative effort to analyze data across multiple states to facilitate learning among Medicaid agencies, to profile the opioid epidemic among the Medicaid population in six states – Kentucky, Maryland, Ohio, Pennsylvania, Virginia, and West Virginia. All of these states participate in MODRN and include parts of Appalachia, a region hard hit by the opioid epidemic. MODRN data provides a snapshot of the opioid epidemic along several measures not available in public data. The brief focuses on adolescent and non-elderly adult Medicaid enrollees (ages 12-64) who are not dually eligible for Medicare. As of the time of data collection, Virginia was the only state that had not expanded Medicaid under the ACA, though it has since done so. The brief also draws on interviews with officials from the state Medicaid and other health agencies and describes the major strategies and initiatives these six states are using to address the opioid epidemic among their Medicaid populations.

Which Medicaid enrollees have opioid use disorder?

The prevalence of OUD among Medicaid enrollees in the study states is higher than the national average, reflecting regional concentration of the opioid epidemic within the United States. Among Medicaid enrollees ages 12-64 who are not dual Medicare/Medicaid eligible, the percent with a diagnosis of opioid use disorder increased from 3.8 percent in 2014 to 5.0 percent in 2016 in the six study states (Figure 1). This trend could reflect a true increase in prevalence, increased screening and diagnosis, or both. This prevalence compares to an estimated national average of <1% for people age 12-64 overall and 2% for Medicaid enrollees age 12-644  and reflects the fact that the study states include areas hardest hit by the opioid epidemic. States also noted that Medicaid covers a disproportionately large share of people with OUD in their states.

Figure 1: Prevalence of Opioid Use Disorder Among Medicaid Population in Study States, 2014-16

Across the study states, OUD prevalence is higher among working-age adults, males, and whites compared to other demographic groups. Among different age groups, enrollees aged 35-44 have the highest OUD prevalence at 7.7 percent, with children ages 12-17 having the lowest prevalence at less than 1 percent (Figure 2). Prevalence of OUD is higher among males compared to females (5.7 percent compared to 4.4 percent) and among Whites compared to African-Americans and Hispanics (6.6 percent compared to 2.7 percent and 2.4 percent) (Figure 3).

Figure 2: Prevalence of Opioid Use Disorder Among Medicaid Population in Study States by Age, 2016
Figure 3: Prevalence of Opioid Use Disorder Among Medicaid Population in Study States by Key Demographics, 2016

Though OUD prevalence is higher among Medicaid enrollees in rural areas, states report a growing problem in urban areas. A greater share of enrollees in rural areas have OUD compared to urban areas (5.4 percent compared to 4.8 percent, Figure 3). State respondents noted the social and economic distress in many rural communities and small towns in their state as one of the key drivers of the opioid epidemic, which may explain in part the higher prevalence among white, working age adults noted above. National data also show higher prevalence of OUD among low income, unemployed adults suffering from other psychosocial distress.5  However, respondents also stressed that OUD is also a growing problem for their urban populations. In fact, despite the higher prevalence in rural areas, in 2016, 74 percent of Medicaid enrollees with OUD lived in urban areas across the six states (findings not shown). Respondents in one state also noted differences in the nature of the opioid epidemic between urban and rural areas, with urban areas experiencing more of a problem with addiction to heroin, fentanyl, and other synthetic opioids, while prescription opioids were a greater contributor to the problem in rural areas.

Medicaid Expansion and OUD

Though many Medicaid enrollees with OUD qualify through the ACA Medicaid expansion, prevalence of OUD among the Medicaid expansion population is similar to that for other eligibility groups. For the five out of six states that had expanded Medicaid prior to January 1, 2019, 6.9 percent of enrollees who qualified through Medicaid expansion had an OUD (Figure 4),6  and among all Medicaid enrollees with an OUD, 56 percent qualified through Medicaid expansion in 2016 (findings not shown). OUD prevalence among the Medicaid expansion population in the study states is slightly higher than other adults without disabilities (4.7%) and pregnant women (5.9%) and lower than prevalence among adults with disabilities (7.4%).

Figure 4: Prevalence of Opioid Use Disorder Among Medicaid Population in Study States by Eligibility Category, 2016

Reflecting eligibility criteria, the characteristics of enrollees with OUD who qualify through the ACA expansion differ from those who qualify for Medicaid through traditional eligibility pathways. Compared to enrollees with OUD who are eligible through pre-expansion criteria in the states that expanded Medicaid, the expansion population with OUD is disproportionately likely to be age 21-34 and male (Table 1), likely reflecting characteristics of adults who were ineligible for Medicaid under traditional pathways but gained eligibility under the ACA. State Medicaid officials also cite being a military veteran and having a history of employment in high-risk occupations (e.g. manufacturing, mining) as additional risk factors for OUD among the expansion population.7 

Table 1: Characteristics of Medicaid Enrollees with OUD in Study States by Eligibility Pathway, 2016
Enrollees with OUD eligible through ACA expansionEnrollees with OUD eligible through non-ACA pathway
Age
   % 12-17N/A1.5
   % 18-2004.0
   % 21-3451.143.8
   % 35-4428.425.2
   % 45-5415.314.9
   % 55-645.210.6
Gender
     % Female37.765.9
     % Male62.334.1
Race/ethnicity
   % White81.379.3
   % African-American6.910.7
   % Hispanic3.13.3
   % Other8.76.7
Living area
   % Urban70.969.7
   % Rural28.630.0
   Living area missing/unknown0.50.3
NOTES: Includes enrollees age 12-64. Estimates are pooled across four study states that had implemented ACA Medicaid expansion as of 2016 (KY, OH, PA, WV).SOURCE: Medicaid Outcomes Distributed Research Network

State policymakers view Medicaid expansion as an important tool for expanding access to OUD treatment by increasing coverage among populations with a high prevalence of OUD. Respondents in some states acknowledged concerns raised by some stakeholders about whether Medicaid expansion may have exacerbated the opioid addiction crisis by increasing access to opioid prescriptions, although it did not appear to be a major concern in any of the six states. Consistent with recent research, state officials maintain that not only have they not seen any evidence that Medicaid expansion exacerbated opioid addiction, but that in fact Medicaid was providing addiction treatment services for enrollees who previously had undiagnosed or unmet needs for these services or who were on high-dose opioids before they enrolled in Medicaid.8  States also reported that Medicaid expansion enabled them to expand the scope of services available to people with OUD, as Medicaid-covered benefits are broader than those available through state-funded programs for uninsured people.

Initiatives to Focus on OUD among Special Populations

In addition to increasing access to treatment through Medicaid expansion, most state Medicaid programs have also focused special attention on certain populations who are vulnerable to the effects of opioid addiction, such as pregnant women and newborns. For example, West Virginia established the first center in the United States to provide support services to newborns with Neonatal Abstinence Syndrome and their families. West Virginia’s Medicaid agency has established special rates to accommodate the specialized services provided by the center. Creating new data systems that can match a mother to her child within the Medicaid system has also been a priority as states frequently report lack of data as a barrier to measuring quality of care for pregnant women and infants.

All study states also report efforts to connect people in the criminal justice system to care. As studies show that more than half of the incarcerated population meet the criteria for drug dependence or abuse, state Medicaid agencies have also focused special attention on individuals released back to the community.9  All six states report taking measures to identify incarcerated individuals likely to be eligible for Medicaid and to get them started on treatment before or shortly after their release. For instance, Ohio’s pre-release program uses peer educators to enroll likely eligible prisoners into Medicaid prior to release.10  The program is intended to reduce the amount of time between release and accessing treatment, thereby reducing accidental overdoses.

What are states doing to limit access to opioids?

Reflecting nationwide trends, all study states have efforts underway to limit access to prescribed opioids. In 2019, all states report using pharmacy benefit management strategies to prevent opioid-related harms.11  Similarly, all six states have taken steps to limit the quantity and dose of opioids prescribed to Medicaid enrollees, as well as requiring prior authorization for opioid prescribing for Medicaid patients.12  These steps include such actions as limiting days supplied and dosages (KY, PA, WV) and reducing the number of refills (OH). Ohio, Virginia and Pennsylvania have implemented the CDC guidelines for opioid prescribing in their Medicaid programs, which require prior authorizations to provide oversight of high dosage prescriptions and limit the number of days supplied. All states also report actions to more aggressively use Prescription Drug Monitoring Programs (PDMPs), which track all prescriptions for opioids and other controlled substances in the state. Ohio and West Virginia are using PDMPs to identify clinics and other providers with excessive prescribing practices. States report that such measures have decreased opioid prescribing among Medicaid enrollees. In Virginia, for example, average days supplied for opioid prescriptions decreased 45 percent between 2016 and 2018, while the number of Medicaid enrollees receiving opioid prescriptions dropped by almost 30 percent.13 

What are states doing to facilitate access to treatment for OUD?

All six states now cover the full continuum of treatment services, based on the American Society of Addiction Medicine (ASAM) guidelines.14  Historically, coverage of addiction treatment services by Medicaid has varied considerably across the study states. Ohio and Pennsylvania provided the full continuum of outpatient, intensive outpatient, and residential treatment services based on ASAM guidelines since before 2016. Similarly, Maryland has covered most ASAM services, with exclusions for some Medicaid populations. While Kentucky, West Virginia, and Virginia have not been as comprehensive in their benefits historically, they have been closing the gap through recent expansions in services. In 2017, Virginia implemented the Addiction and Recovery Treatment Services (ARTS) program, which greatly expanded access to the full continuum of addiction treatment services, increased reimbursement rates for some existing services, and “carved” behavioral health services back into managed care plans in order to increase coordination with physical health services, and established a preferred provider model for OUD treatment. Kentucky and West Virginia have added coverage for methadone treatment and other services, such as Screening, Brief Intervention and Referral to Treatment (SBIRT), peer recovery services (WV), short-term residential services, and withdrawal management.

To facilitate expansion of residential treatment and inpatient detoxification services, five of the six states have received Section 1115 waivers and report that these waivers are crucial in allowing them to provide the full continuum of treatment services. As of October 2019, 26 states have Section 1115 waivers to use federal Medicaid funds for residential facilities of 16 beds or greater, otherwise prohibited through Medicaid’s Institutions for Mental Diseases (IMD) exclusion.15  Waivers have enabled states to provide treatment services based on ASAM treatment guidelines, specifically for short-term residential treatment services (ASAM Level 3) and medically managed intensive inpatient services (ASAM Level 4). However, there is some concern that reversing the IMD exclusion through waivers could lead to greater reliance on more costly institutional care for the treatment of substance use disorders and possibly prolonged institutional stays for people who could be adequately served in the community. Further, some note that the focus on institutional care without commensurate focus on community-based care may interfere with states’ ability to meet community integration requirements under the Americans with Disabilities Act. For states that had implemented waivers at the time of the study, it was too soon to assess impact. However, analysis of the first year of Virginia’s ARTS program showed that most treatment was provided in outpatient settings. Of the 9,700 Medicaid members who used any ASAM service, only about 200 used residential treatment services (ASAM level 3), while more than 500 used medically managed intensive inpatient services (ASAM 4). By contrast, almost 7,000 members with OUD used outpatient services (ASAM Level 1).16 

Medication-Assisted Treatment

Reflecting nationwide trends, all six study states cover medication-assisted treatment (MAT) for OUD, which is considered the “gold standard” for opioid use disorder treatment.17  MAT includes pharmacotherapy along with psychotherapy and social support. The most common medications used in MAT are methadone and buprenorphine, which is sold either alone or in combination with naloxone (as Suboxone).18  Extended-release injectable naltrexone is also approved by the FDA for treatment of opioid use disorder. Nationally, 44 states cover MAT.19  All six study states have elected to cover buprenorphine, as well as naltrexone and methadone treatment (Kentucky will add methadone coverage when its Section 1115 waiver is implemented).

Less than half of Medicaid enrollees with OUD receive any MAT. All six states have implemented measures to support use of MAT within the Medicaid program and have experienced increased rates of MAT use since 2014. However, use of MAT among individuals diagnosed with an OUD remains low at only 48 percent across the six states in this study (Table 2). Even these estimates of treatment among those diagnosed with OUD may overstate treatment rates, since many individuals with OUD go undiagnosed. For example, based on national survey data among those with prescription opioid use disorder, only 17.5 percent report receiving any treatment for it.20 

Treatment rates vary by demographic and eligibility group. Among those with diagnosed OUD in the six states in 2016, MAT rates are highest among those in the 21-44 age group, among women, among whites, and slightly higher among those living in urban compared to rural areas (Table 2). Comparing enrollees based on eligibility pathway, MAT rates are highest for traditionally eligible, non-disabled adults (56.2 percent) and pregnant women with OUD (53.6 percent), lower for Medicaid expansion adults (48.1 percent) and people qualifying based on a disability (40.0 percent) and significantly lower for people qualifying as children (including adolescents or young adults) (19.2 percent).

Table 2: Medication-assisted treatment (in 2016) and continuity of pharmacotherapy for OUD (in 2015-2016) by demographic group
Percent with OUD who receive Medication-Assisted TreatmentPercent who had continuity of pharmacotherapy treatment
Overall 48.2%52.4%
Age
    12-1712.9N/A
    18-2026.131.1
    21-3451.548.4
    35-4452.154.4
    45-5443.461.4
    55-6434.966.7
Gender
     Female49.755.0
     Male46.749.6
Race/ethnicity
   White50.451.4
   African-American40.762.2
   Hispanic39.354.8
   Other42.146.8
Living area
   Urban48.554.0
   Rural47.247.8
Eligibility status
   Pregnant women53.652.9
   Adolescents/young adults119.226.8
   Adults with disabilities40.060.3
   Adults without disabilities56.257.2
   Medicaid expansion adults48.147.5
NOTES: Includes enrollees age 12-64. Estimates pooled across six study states.1 Percent with medication-assisted treatment measure includes adolescents and young adults aged 12-20 in 2016. The percent who had continuity of pharmacotherapy only includes young adults aged 18-20 per the NQF specifications and the time period is 2015-2016.SOURCE: Medicaid Outcomes Distributed Research Network

In addition, many enrollees receiving MAT are not retained in continuous treatment. The duration of MAT is associated with health outcomes including recovery. Although the amount of time on MAT needed for recovery varies from patient to patient, in general, longer treatment periods result in better outcomes and reduce the risk of relapse. Among Medicaid enrollees in the six states receiving pharmacotherapy for OUD, 52% received at least six months of treatment (Figure 5). Among those receiving pharmacotherapy, enrollees in the 55-64 age group were more likely to have continuous treatment for six months compared to younger age groups (Table 2). Females, African-Americans, and those living in urban areas also had greater continuity of treatment compared to other subpopulations. Continuity was highest among people qualifying based on a disability (61 percent) and lowest among the child/young adult population (18-20 years) (26 percent) (Table 2).

Figure 5: Emergency and Inpatient Visits for Opioid Use Disorder Among Medicaid Population in Study States, 2014-2016

Most (five of six) states report an under-supply of prescribers as a major barrier to increasing MAT for Medicaid enrollees. Historically, pharmacotherapy for treatment of OUD was restricted to methadone delivered by opioid treatment programs (OTPs) accredited by SAMHSA or other approved accrediting bodies. To increase access to MAT, the Drug Addiction Treatment Act of 2000 (DATA 2000) allowed qualified physicians to dispense or prescribe buprenorphine if they completed eight hours of training and applied for and received a waiver from SAMHSA. The Comprehensive Addiction and Recovery Act of 2016 allows nurse practitioners and physician assistants to also receive waivers and prescribe buprenorphine, which Maryland officials cited as significantly increasing the supply of prescribers in that state. While the number of buprenorphine waivered prescribers has increased nationally and across the six states, all states except West Virginia reported provider supply issues. As with other health services, some states reported challenges in enlisting prescribers to accept Medicaid patients. Rates of buprenorphine prescriber participation in Medicaid are likely to be comparable to Medicaid provider participation more broadly, in which acceptance of new Medicaid patients is much higher among primary care physicians (70 percent) compared to psychiatrists (36 percent).21 

Recruiting and training more providers to become buprenorphine prescribers and to increase their patient capacity is a high priority in most of the states. For example, Ohio has taken advantage of grant funding through the 21st Century Cures Act to train physicians, nurse practitioners, and physician assistants to apply for waivers and provide MAT. While much of the focus is on recruiting primary care providers to become prescribers, some states are also focusing on recruiting more OB/GYNs to become prescribers to increase treatment for pregnant women. Most of the states have also implemented or are planning to increase use of telemedicine in MAT, such as through Project ECHO programs that link primary care practices to specialists in academic settings who provide mentoring and feedback in order to increase access in rural or other underserved areas.22 

Other barriers to MAT access and continuity cited by state officials include challenges in transitioning patients from one level of care to another and stigma or resistance to MAT. States are focusing on transitioning patients into treatment after acute care hospital stays and emergency departments. Both Kentucky and Pennsylvania have initiatives to encourage health systems to initiate treatment in the hospital setting and connect patients to community providers for ongoing treatment and support. In addition, policymakers noted stigma or resistance not only among patients, but also among some providers, policymakers, law enforcement, and others in the recovery community who object to using opioid-based medications to treat OUD, and prefer abstinence-only and counseling approaches to treatment that have been shown to be less effective than MAT.

States are developing policies to balance increased access to MAT and prevention of misuse. Because MAT treatments are opioid-based, they can be diverted, misused, and sold illegally. Respondents in all six states report current or past problems with “cash clinics,” in which patients pay physicians out-of-pocket for the cost of the visit to receive buprenorphine prescriptions, with little assurance that appropriate care guidelines are followed or that individuals are prevented from diverting prescriptions into the community. At the same time, most state respondents noted that overly restrictive policies on buprenorphine prescribing – such as stringent prior authorization requirements – can inhibit access to these effective medications for patients. Ohio, Pennsylvania, and Virginia have recently loosened prior authorization programs to encourage providers to deliver buprenorphine and reduce provider supply-related barriers to treatment access. For example, Virginia has eliminated prior authorizations for certain “preferred” providers, and Pennsylvania has required its managed care organizations to make at least one OUD medication be available on a preferred drug list without prior authorization. In contrast, West Virginia continues to carefully regulate providers authorized to prescribe buprenorphine, such as requiring additional documentation of past disciplinary actions and monitoring of compliance with requirements for urine drug screens and counseling.

What are states doing to improve care quality and treatment outcomes for OUD?

Most study states are adopting new models of care delivery for OUD. Realizing that navigating the continuum of addiction treatment services is complex, and merely covering MAT treatment will not necessarily lead to improved outcomes, most of the states are adopting new models of care delivery that emphasize evidence-based MAT treatment, coordination with the different levels of treatment, and integration with other physical and behavioral health services. For example, Pennsylvania established a Centers of Excellence program based on a “hub and spoke” model of treatment in 2016, in which the centers serve as the “hub” that provide the most intensive treatment services, while connecting patients with other services necessary for maintaining and managing their treatment over the longer term. State officials attribute a substantial increase in treatment rates to the Centers of Excellence. West Virginia is in the process of establishing a similar model, the Comprehensive Opioid Addiction Treatment (COAT) clinic. A second model is the preferred provider, as seen in Virginia’s Preferred Opioid-Based Opioid Treatment (OBOT) program. These providers, credentialed by the Medicaid program, have co-located buprenorphine-certified providers and behavioral health specialists. As preferred providers, they receive increased reimbursement to conduct care coordination activities and comprehensive services. A third model, used by Maryland and Ohio, is the medical home. While not OUD-specific, these medical homes are intended to provide or coordinate all physical health and behavioral health needs.

Most states have not yet adopted alternative payment models for OUD treatment services. While some of these new care delivery models include incentivizing providers to achieve better outcomes, use of alternative payment approaches for addiction treatment is still in the discussion phase for most states. Pennsylvania may be furthest along the path, having used bundled payment arrangements for methadone treatment for many years.

All six states are working to build the long-term infrastructure for collecting data and developing measures of quality to monitor outcomes. In some states, these include data linkages between Medicaid, Department of Corrections, Emergency Medical Services, prescription drug monitoring programs, mortality, and birth records to provide more timely and comprehensive monitoring of the opioid epidemic.

Most states were still seeing indications of a growing opioid epidemic through 2016. States use a variety of methods to measure treatment outcomes and the effects of treatment and state policies designed to increase access to and quality of treatment. While a widely-cited measure is overdose fatalities, this outcome represents only a small fraction of those afflicted with opioid use disorders. Other measures, such as opioid-related emergency department visits and acute inpatient stays, may reflect broader prevalence and access trends. As shown in Figure 5, the rate of ED visits for OUD nearly doubled between 2014 and 2016 among enrollees in the six states from 0.67 to 1.21 per 1,000 member months. The rate of inpatient admissions for OUD increased less sharply from 0.83 to 1.00 between 2014 and 2016. Among Medicaid enrollees, rates of ED and acute inpatient use for OUD tend to be higher among adults ages 21-44, males, whites, and residents of urban areas compared to other subpopulations (Table 3). Among Medicaid eligibility categories, OUD-related ED and inpatient use is highest among Medicaid expansion enrollees, pregnant women, and adults with disabilities and lowest among adolescents and young adults and traditionally eligible, non-disabled adults.

Table 3: Rates of OUD-related ED visits and inpatient stays among Medicaid enrollees, by demographic characteristics, 2016
OUD-related ED visits per 1,000 member monthsOUD-related inpatient admissions per 1,000 member months
Total 1.21.0
Age
   12-170.1<0.05
   18-200.30.2
   21-342.01.4
   35-441.81.4
   45-541.11.2
   55-640.70.9
Gender
     Female1.00.9
     Male1.51.1
Race/ethnicity
   White1.61.3
    African-American0.50.6
   Hispanic0.70.7
   Other1.00.7
Eligibility group
   Pregnant women1.52.7
   Adolescents and young adults (12-20)0.10.1
   Adults with disabilities1.52.0
   Adults without disabilities1.10.6
   Medicaid expansion adults1.81.2
Living area
   Urban1.31.1
   Rural0.90.8
SOURCE: Medicaid Outcomes Distributed Research Network

Looking Ahead

Medicaid programs are central to state efforts to address the opioid epidemic, in part due to the high prevalence of OUD among low-income populations eligible for Medicaid. Leaders in Medicaid agencies in all six study states viewed Medicaid expansion as important in expanding coverage to individuals with OUD to reduce financial barriers to treatment. State Medicaid programs also have a number of tools that can be used to leverage state and federal resources, such as by expanding coverage for the full range of treatment options, increasing reimbursement to attract more providers, developing new care delivery models, and seeking Section 1115 Demonstration Waivers that allow federal Medicaid payments for residential treatment. In addition, the federal SUPPORT Act allows for or mandates Medicaid services to treat OUD, puts in place protections for some eligibility groups to maintain Medicaid coverage, requires prescription drug oversight and quality reporting related to Medicaid and OUD, and authorizes new demonstrations to address provider capacity constraints and transitions from the criminal justice system, among other provisions.23  This new federal law will likely expand Medicaid’s role in addressing OUD as states take up new options, implement demonstrations, or comply with federal requirements.

State Medicaid reforms are also integral to coordinated state strategies to address the opioid addiction crisis, especially in terms of aligning Medicaid restrictions on opioid prescribing with more general state and restrictions. Because effectively addressing opioid addiction overlaps with medical, public health, criminal justice, and social welfare sectors, state agencies are actively working with other state agencies on a coordinated response to the epidemic. The Kentucky Opioid Response Effort (KORE) is an example of a multi-agency effort to provide a comprehensive response to the opioid epidemic in the state, and provide grants to expand services. Other states have set up inter-agency task forces – a few of which are led by the state’s Medicaid agency — that meet on a regular basis to coordinate strategies and address issues related to treatment, housing, employment, and other social needs.

Many of these states have also leveraged new funding through SAMHSA, such as State Targeted Response (STR) and the newer State Opioid Response (SOR) grants to work in concert with Medicaid reforms to increase supply and availability of treatment providers, encourage and train more providers to become MAT prescribers, build crisis stabilization centers as an alternative to ERs and jails, conducting patient outreach and education to encourage them to begin and stay in treatment, and to reduce the stigma associated with MAT. State Medicaid agencies pointed to the need for long-term, coordinated strategies to improve systems of care to address not only the opioid crisis but other behavioral health needs among low-income, vulnerable populations.

Julie Donohue is Professor, Health Policy and Management, University of Pittsburgh Graduate School of Public Health. Peter Cunningham is Professor, Department of Health Behavior and Policy, Virginia Commonwealth University. Lauryn Walker was a Research Assistant at the Department of Health Behavior and Policy, Virginia Commonwealth University at the time of this project. Rachel Garfield is a Vice President at KFF and Co-Director of its Program on Medicaid and the Uninsured.

Appendix

Methods

Data Source

Data in this brief is from the Medicaid Outcomes Distributed Research Network (MODRN), an initiative of AcademyHealth.24  MODRN is a collaborative effort to analyze data across multiple states to facilitate learning among Medicaid agencies. Participants from AcademyHealth’s State-University Partnership Learning Network (SUPLN) and the Medicaid Medical Director Network (MMDN) developed MODRN to allow states to participate in multi-state data analyses while retaining their own data and analytic capacity.

MODRN is composed of multiple organizations using a common data model to support centralized development, but local execution, of analytic programs. Under MODRN, each state-university partnership adopts the Medicaid Common Data Model, contributes to a common analytic plan, and conducts analyses locally on their own Medicaid data using standardized code developed by the data coordinating center. Finally, the state-university partners provide aggregate results, not data, to the data coordinating center, which synthesizes the aggregate findings from multiple states for reporting. The Medicaid Common Data Model will be continually updated and expanded for future Medicaid research projects.

Eleven university-state partnerships now participate in an effort to provide a comprehensive assessment of opioid use disorder treatment quality in Medicaid. The findings presented in this report resulted from that project that at the time of this writing had been implemented by six university participants include the University of Kentucky, University of Maryland Baltimore County, The Ohio State University, University of Pittsburgh, Virginia Commonwealth University, and West Virginia University.

Analytic Methods

Below we detail the construction of the variables used in the data analysis across the six study states.

Years Included

The data analysis covered years 2014 through 2016. Some measures pool data across two-year period per National Quality Forum Specifications.

Population Included

This analysis includes non-dual, full-benefit Medicaid enrollees age 12-6425  with at least one month of Medicaid eligibility in the calendar year.

For analysis by eligibility category, we group enrollees into categories using the following hierarchy:

  • Pregnant women, which includes any adolescents or women who are pregnant at any time in the calendar year. We identify women as pregnant during the year either by measuring the gestational period prior a claim for giving birth or by identifying a claim for prenatal care.
  • Children, which includes those under the age of 21. In states using Medicaid as the basis of their Children’s Health Insurance Program, this group also includes children qualifying for Medicaid through Title XXI
  • Adults age 21-64 qualifying due to receipt of Supplemental Security Income (SSI)
  • Adults not qualifying on the basis of disability through a traditional (non-ACA expansion) category
  • Adults qualifying through the ACA expansion category
Prevalence of Opioid Use Disorder (OUD)

We identify people with OUD based on diagnosis codes in claims. Specifically, we identify those who had at least one encounter with any diagnosis (counting all diagnosis fields) of OUD in inpatient, outpatient, or professional claims at any time during the measurement period. We used National Quality Forum code sets to identify diagnosis codes for measuring OUD.26 

Rates of Medication-Assisted Treatment (MAT) among Enrollees with OUD

After identifying the population with OUD as detailed above, we calculate utilization rates for MAT by identifying individuals with OUD who have at least one claim for medication-assisted treatment for OUD. Specifically, we include those who have at least one claim with a National Drug Code (NDC) or a HCPCS code for any of the following OUD medications during the measurement period:

  • Buprenorphine
  • Naltrexone (oral or injectable)
  • Buprenorphine/Naloxone
  • Methadone administration

We excluded claims for oral medications with negative, missing, or zero days’ supply.

Continuity of Pharmacotherapy for OUD

This measure is calculated for three rolling two-year periods from 2014 to 2016: 2014-2015, and 2015-2016, to allow for 180-day measurement of pharmacotherapy for enrollees whose treatment episodes span calendar years. For each two-year period, we limit the analysis to individuals who (1) had a diagnosis of OUD, as described above27  (2) had at least one claim for an OUD medication, as described above, and (3) who are 18-63 years of age28  for the duration of the first year during which they appear in the period. We only include individuals who received oral OUD medications during the two-year period with a date at least 180 days before the end of the final calendar year of the measurement period. Further, we only include individuals who were continuously enrolled in Medicaid for at least 6 months after the month with the first OUD medication claim in the measurement period, with no gap in enrollment. Individuals who are not enrolled for 6 months, including those who die during the period, are not eligible and are not included in this part of the analysis.

Within this group, we measure continuity of treatment by identifying individuals who have at least 180 days of continuous pharmacotherapy with a medication prescribed for OUD without a gap of more than seven days. We developed a set of decision rules for counting surplus for overlaps among prescription claims and for counting length of days for medications with different administration (e.g., prescription OUD medications, Naltrexone injections, and for licensed treatment center-dispensed methadone and office-dispensed buprenorphine/naloxone).29 

Emergency department use and inpatient hospitalizations for OUD

We measure emergency department (ED) visits for OUD as distinct ED visits with OUD diagnosis in any diagnosis field. For each enrollee, we consider a distinct combination of billing provider ID and date of service as a distinct ED visit. Similarly, we measure distinct inpatient hospitalization episodes with OUD diagnosis in any diagnosis field. We exclude detoxification and partial hospitalization and count direct transfers from one facility to another (discharge from one inpatient setting and admission to a second inpatient setting within one calendar day or less) as a single hospitalization.

To facilitate comparison of ED visit and inpatient hospitalization rates, we calculate visits/admissions per 1,000 member-months in the time period.

Endnotes

  1. Kendal Orgera and Jennifer Tolbert. The Opioid Epidemic and Medicaid’s Role in Facilitating Access to Treatment. (Washington, DC: KFF), 2019. https://modern.kff.org/medicaid/issue-brief/the-opioid-epidemic-and-medicaids-role-in-facilitating-access-to-treatment/ ↩︎
  2. Medicaid and CHIP Payment and Access Commission (MACPAC). Report to Congress on Medicaid and CHIP June 2017: Chapter 2- Medicaid and the Opioid Epidemic.; 2017. https://www.macpac.gov/wp-content/uploads/2017/06/Medicaid-and-the-Opioid-Epidemic.pdf. ↩︎
  3. The brief includes the first findings from MODRN, a new initiative involving partnerships between state Medicaid agencies and universities conducting research and evaluation on the opioid epidemic and other public health issues facing their state’s Medicaid population (see Appendix for more detailed description of MODRN). To facilitate cross-state comparisons, MODRN employs a common data model to standardize estimates of OUD prevalence, treatment, and quality of care derived from state Medicaid claims and enrollment data. ↩︎
  4. KFF analysis of 2017 National Survey of Drug Use and Health. ↩︎
  5. Beth Han, Wilson M. Compton, Carlos Blanco, et al. “Prescription Opioid Use, Misuse, and Use Disorders in U.S. Adults: 2015 National Survey on Drug Use and Health.” Annals of Internal Medicine. 2017;167(5):293-301.  https://annals.org/aim/article-abstract/2646632/prescription-opioid-use-misuse-use-disorders-u-s-adults-2015?doi=10.7326%2fM17-0865 ↩︎
  6. Virginia expanded Medicaid on January 1, 2019. ↩︎
  7. Samantha Artiga, Barbara Dipietro, and Petry Ubri. The Role of Medicaid and Impact of the Medicaid Expansion for Veterans Experiencing Homelessness. (Washington, DC: KFF), 2017. http://files.kff.org/attachment/Issue-Brief-The-Role-of-Medicaid-and-Impact-of-the-Medicaid-Expansion-for-Veterans-Experiencing-Homelessness ↩︎
  8. Brendan Saloner, Jonathan Levin, Hsien-Yen Change et al. “Changes in buprenorphine, naloxone, and opioid pain reliever prescriptions after the Affordable Care Act Medicaid Expansion.” JAMA Network Open 2018; 1(4). ↩︎
  9. Michael Linden, Sam Marullo, Curtis Bone et al. “Prisoners as Patients: The Opioid Epidemic, Medication-Assisted Treatment, and the Eighth Amendment.” J Law, Med Ethics. 2018;46:252-267. ↩︎
  10. Jesse Jannetta, Jane B, Wishner, and Rebecca Peters. Medicaid Areas of Flexibility to Provide Coverage and Care to Justice-Involved Populations. (Washington, DC: The Urban Institute): 2017. https://www.urban.org/sites/default/files/publication/88051/ohio_medicaid_1.pdf ↩︎
  11. Kathleen Gifford, Eileen Ellis, Aimee Lashbrook, et al. A View from the States: Key Medicaid Policy Changes: Results from a 50-State Medicaid Budget Survey for State Fiscal Years 2019 and 2020. (Washington, DC: KFF), October 2019. https://modern.kff.org/medicaid/report/a-view-from-the-states-key-medicaid-policy-changes-results-from-a-50-state-medicaid-budget-survey-for-state-fiscal-years-2019-and-2020/ ↩︎
  12. ibid. ↩︎
  13. Yaou Sheng, Peter Cunningham, Augustus White, et al. Opioid Prescribing for Medicaid Members Drops Sharply After 2016. VCU Health Behavior and Policy ARTS Evaluation, January 2019. https://hbp.vcu.edu/media/hbp/policybriefs/pdfs/HBP_ARTSIssue03_012919.pdf ↩︎
  14. These services range from outpatient treatment and counseling (ASAM 1.0), intensive outpatient treatment (ASAM 2.0), short-term residential treatment (ASAM 3.0) and inpatient detoxification (ASAM 4.0). American Society of Addiction Medicine. https://www.asam.org/resources/guidelines-and-consensus-documents/npg/complete-guideline. ↩︎
  15. MaryBeth Musumeci, Priya Chidambaram, and Kendal Orgera. State Options for Medicaid Coverage of Inpatient Behavioral Health Services. (Washington, DC: KFF), November 2019. https://modern.kff.org/report-section/state-options-for-medicaid-coverage-of-inpatient-behavioral-health-services-report/ ↩︎
  16. Peter Cunningham, Andrew Barnes, Yaou Sheng, et. al. Addiction and Recovery Treatment Services Access and Utilization during the First Year (April 2017 – March 2018). VCU Health Behavior and Policy ARTS Evaluation, August 2018. https://hbp.vcu.edu/media/hbp/policybriefs/pdfs/ARTSone-yearreport_8.9.18_Final.pdf ↩︎
  17. Substance Abuse and Mental Health Services Administration. Medication-Assisted Treatment (MAT) September, 2019. https://www.samhsa.gov/medication-assisted-treatment ↩︎
  18. National Institute on Drug Abuse, Medications to Treat Opioid Use Disorder. June 2018. https://www.drugabuse.gov/publications/research-reports/medications-to-treat-opioid-addiction/efficacy-medications-opioid-use-disorder ↩︎
  19. Gifford, Ellis, Lashbrook, et al, op. cit. ↩︎
  20. Substance Abuse Center for Behavioral Health Statistics and Quality. Results from the 2016 National Survey on Drug Use and Health: Detailed Tables. SAMHSA. https://www.samhsa.gov/data/sites/default/files/NSDUH-DetTabs-2016/NSDUH-DetTabs-2016.htm. Published September 7, 2017. ↩︎
  21. Kayla Holgash and Martha Heberlein. “Physician Acceptance of New Medicaid Patients: What Matters and What Doesn’t.” Health Affairs Blog. April 10, 2019. https://www.healthaffairs.org/do/10.1377/hblog20190401.678690/full/ ↩︎
  22. For more information on ECHO, see: https://echo.unm.edu/ ↩︎
  23. MaryBeth Musumeci and Jennifer Tolbert. Federal Legislation to Address the Opioid Crisis: Medicaid Provisions in the SUPPORT Act. (Washington, DC: KFF), October 2018. https://modern.kff.org/medicaid/issue-brief/federal-legislation-to-address-the-opioid-crisis-medicaid-provisions-in-the-support-act/ ↩︎
  24. For more information on MODRN, see: https://www.academyhealth.org/MODRN ↩︎
  25. Enrollees who age in (i.e., turn 12 at some point during the year) or age out (i.e., turn 65 at some point in the calendar year) of the age range included in the analysis are not included in the analysis for that year. ↩︎
  26. These codes included: ICD-9: 304.0x, 305.5x and ICD-10: F11.xxx. ↩︎
  27. Instead of identifying and limiting to outpatient setting, acute inpatient setting, or emergency department setting as in NQF’s specification, we use all inpatient, outpatient, and professional files in MCDM to identify beneficiaries with an OUD diagnosis. ↩︎
  28. NQF’s age criteria is 18-64 years of age for the duration of the first year during which they appear in the period. We modified the age criteria to ≥18 years of age in the beginning of the first year, and <64 at the end of the first year. In other words, we would only include beneficiaries who would be <65 years of age by the end of the second year. ↩︎
  29. Decision rules and details are available upon request. ↩︎
News Release

Millions of Medicare Part D Enrollees Face Increases in Premiums and Other Costs in 2020 if They Do Not Switch Plans During Open Enrollment 

Published: Nov 14, 2019

Millions of current enrollees in stand-alone Medicare Part D prescription drug plans will face premium and other cost increases next year unless they switch to lower-cost plans during the open enrollment period that began Oct. 15 and ends on Dec. 7, a new KFF analysis finds.

This includes two-thirds of Part D stand-alone drug plan enrollees not receiving low-income subsidies—nine million enrollees—who will face higher monthly premiums if they keep their current plan in 2020.

For instance, the 1.9 million enrollees without low-income subsidies in the Humana Walmart Rx plan—the third most popular stand-alone plan in 2019—will see their monthly premium more than double, on average, if they do not switch plans for 2020. That is because Humana is consolidating this plan and the Humana Enhanced plan into a new offering named Humana Premier Rx. Current Humana Walmart Rx enrollees will be automatically enrolled in the new plan, and, unless they switch, will see their monthly premium rise from $28 to $57.

While premiums for some other national plans are decreasing, enrollees in those plans may face other cost increases. For example, the 2.1 million enrollees without low-income subsidies in the nation’s largest stand-alone Part D plan, CVS Health’s SilverScript Choice, will see a modest $2 decrease in their average monthly premium, from $31 in 2019 to $29 in 2020. But the annual deductible in this plan will increase from $0 in most areas in 2019 to $215 to $435 in 2020—an increase that will more than offset the modest $2 monthly premium reduction.

Overall, the analysis finds that premiums will vary widely across plans in 2020, as in previous years. Among the 20 stand-alone Part D plans available nationwide, average premiums will range sixfold, with the two lowest-premium plans charging $13 per month (Humana Walmart Value Rx) and $14 per month (WellCare Wellness Rx) and the two highest-premium plans charging $79 per month (AARP MedicareRx Preferred) and $83 per month (Express Scripts Medicare Choice). The estimated national average monthly PDP premium for 2020 is projected to increase by 7% to $42, based on current enrollment patterns. The actual national average premium in 2020 may be lower if current enrollees switch to, and new enrollees choose, lower-premium plans during open enrollment.

Among other key findings in Medicare Part D: A First Look at Prescription Drug Plans in 2020:

  • The typical Medicare beneficiary will have a choice of 28 stand-alone drug plans next year, one more option than in 2019, and six more than in 2017.
  • In 2020, nearly nine in 10 stand-alone drug plan enrollees are projected to be in plans operated by five firms: UnitedHealth, Humana, WellCare, CVS Health, and Cigna.
  • There is a wide difference in cost sharing for generic and brand-name drugs, and most plans are charging the standard deductible of $435, unlike previous years. Among all stand-alone plans, median cost sharing is $0 for preferred generics and just $3 for generics, but $42 for preferred brands and 38 percent coinsurance for non-preferred drugs (the maximum allowed is 50%), plus 25 percent coinsurance for specialty drugs (the maximum allowed is 33%).
  • Medicare beneficiaries receiving the Low-Income Subsidy (LIS) will have a choice of seven premium-free PDPs in 2020, on average, one more than in 2019. In 2020, nearly 20% of all LIS PDP enrollees who are eligible for premium-free Part D coverage (1.3 million LIS enrollees) will pay Part D premiums averaging $18 per month unless they switch or are reassigned by CMS to premium-free plans.

Forty-five million beneficiaries have prescription drug coverage through Medicare, including 20.6 million who are in stand-alone Part D plans as a supplement to traditional Medicare. The analysis provides an overview of stand-alone plans that will be available in 2020 and highlights key changes from prior years.

The analysis does not cover the 17.4 million people enrolled in Medicare Advantage prescription drug plans (non-employer) and another 4.6 million enrollees in employer-group only stand-alone plans and 2.3 million in employer-group only Medicare Advantage drug plans. Premiums and benefits data for these employer-group plans are not publicly available.

Also available are KFF’s newly updated basic resource, An Overview of the Medicare Part D Prescription Drug Benefit, and the recently released How Will The Medicare Part D Benefit Change Under Current Law and Leading Proposals?, which shows that some Part D enrollees can expect to see their out-of-pocket drug expenses rise in 2020.

Medicare Part D: A First Look at Prescription Drug Plans in 2020

Authors: Juliette Cubanski and Anthony Damico
Published: Nov 14, 2019

Key Findings

During the Medicare open enrollment period from October 15 to December 7 each year, beneficiaries can enroll in a plan that provides Part D drug coverage, either a stand-alone prescription drug plan (PDP) as a supplement to traditional Medicare, or a Medicare Advantage prescription drug plan (MA-PD), which covers all Medicare benefits, including drugs. Among the 45 million Part D enrollees in 2019, 20.6 million (46%) are in PDPs (excluding employer-only group PDPs). This issue brief provides an overview of PDPs that will be available in 2020 and highlights key changes from prior years.

Key Findings

  • The average Medicare beneficiary will have a choice of 28 PDPs in 2020, one more PDP option than in 2019, and six more than in 2017, a 29% increase. A total of 948 PDPs will be offered in the 34 PDP regions in 2020 (plus another 11 PDPs in the territories), an increase of 202 PDPs since 2017.
  • PDP premiums will vary widely across plans in 2020, as in previous years (Figure 1). Among the 20 PDPs available nationwide, average premiums will range sixfold from a low of $13 per month for Humana Walmart Value Rx Plan to a high of $83 per month for Express Scripts Medicare Choice.
Figure 1: Average Monthly Premiums for the 20 National Part D Stand-alone PDPs Are Projected to Range Sixfold from $13 to $83 in 2020
  • Two-thirds of Part D enrollees without low-income subsidies (9.0 million enrollees) will see their monthly premium increase in 2020 if they stay in their same plan, while one-third (4.3 million) face premium decreases. As an example, the 1.9 million enrollees without low-income subsidies in the Humana Walmart Rx Plan, the third most popular PDP in 2019, will see their monthly premium double in 2020, from $28 to $57, unless they switch plans. This is due to plan changes and consolidations, with Humana consolidating two of its PDPs (Humana Walmart Rx and Humana Enhanced) into one PDP for 2020 and renaming it Humana Premier Rx, with a $57 monthly premium.
  • The estimated national average monthly PDP premium for 2020 is projected to increase by 7% to $42.05, weighted by September 2019 enrollment. The actual average premium in 2020 may be lower if current enrollees switch to, and new enrollees choose, lower-premium plans during open enrollment.
  • In 2020, all PDPs will have a benefit design with five or six tiers for covered generic, brand-name, and specialty drugs, and cost sharing other than the standard 25% coinsurance, similar to 2019. More than eight in 10 PDPs (86%) will charge a deductible, with most PDPs charging the standard deductible of $435 in 2020.
  • Among all PDPs, median cost sharing is $0 for preferred generics and just $3 for generics, but $42 for preferred brands and 38% coinsurance for non-preferred drugs (the maximum allowed is 50%), plus 25% for specialty drugs (the maximum allowed is 33%).
  • Medicare beneficiaries receiving the Low-Income Subsidy (LIS) will have a choice of seven premium-free PDPs in 2020, on average, one more than in 2019. In 2020, nearly 20% of all LIS PDP enrollees who are eligible for premium-free Part D coverage (1.3 million LIS enrollees) will pay Part D premiums averaging $18 per month unless they switch or are reassigned by CMS to premium-free plans.

Issue Brief

Findings

Part D Plan Availability

A larger number of Part D plans will be offered in 2020 than in recent years.

  • The average beneficiary will have a choice of 28 PDPs in 2020, one more PDP option than in 2019 and six more than in 2017 (a 29% increase) (Figure 2). Although the number of PDP options in 2020 is half of what it was at the peak in 2007 (when there were 56 PDP options, on average), this is the third year in a row with an increase in the average number of stand-alone drug plan options. In 2020, beneficiaries will also have access to 24 MA-PDs, on average, a 44% increase in MA-PD options since 2017 (excluding MA plans that do not offer the drug benefit; overall, an average of 28 MA plan options will be available in 2020).
Figure 2: The Average Medicare Beneficiary Has a Choice of 28 Stand-alone Drug Plans and 24 Medicare Advantage Drug Plans in 2020
  • A total of 948 PDPs will be offered in the 34 PDP regions in 2020 (plus another 11 PDPs in the territories), an increase of 47 PDPs (5%) over 2019, and 202 more PDPs (a 27% increase) since 2017 (Figure 3). This increase is primarily due to the elimination of the “meaningful difference” requirement for enhanced benefit PDPs offered by the same organization in the same region. Eliminating this requirement means that PDP sponsors no longer have to demonstrate that their enhanced PDPs offered in the same region are meaningfully different in terms of enrollee out-of-pocket costs. In 2020, 60% of PDPs (566 plans) will offer enhanced Part D benefits—a 46% increase in the availability of enhanced-benefit PDPs since 2017, when just over half of PDPs (387 plans) offered enhanced benefits.
  • The number of PDPs per region in 2020 will range from 24 PDPs in Alaska to 32 PDPs in California, and will be the same or higher in 32 of the 34 PDP regions compared to 2019 (see map; Table 1).
  • In 2020, nearly nine out of 10 PDP enrollees (88%) are projected to be in PDPs operated by five firms: UnitedHealth, Humana, WellCare, CVS Health, and Cigna (based on PDP enrollment as of September 2019). All five firms offer PDPs in all 34 PDP regions in 2020.
Figure 3: A Total of 948 Medicare Part D Stand-alone Drug Plans Will Be Offered in 2020, a 27% Increase in Plan Availability Since 2017


.Premiums

The estimated national average monthly PDP premium is expected to increase by 7% to $42 in 2020.

  • The estimated average monthly PDP premium for 2020 is projected to be $42.05, weighted by September 2019 enrollment (Figure 4). The 2020 premium estimate represents a 7% increase ($2.92) from the weighted average monthly premium of $39.13 in 2019. It is likely that the actual average weighted premium for 2020, after taking into account enrollment choices by new enrollees and plan changes by current enrollees, will be somewhat lower than the estimated average.
Figure 4: The Estimated Average Monthly Premium for Medicare PDPs Is Projected to Increase by 7% to $42 in 2020, Based on Current Enrollment
  • Since 2006, the first year of the Medicare Part D drug benefit, the weighted average monthly premium for PDPs has increased by 62%, but much of the increase occurred between 2006 and 2011; since then, the average monthly premium has been relatively stable, between $37 and $41.
  • Two-thirds of the 13.3 millionPart D PDP enrollees who are responsible for paying the entire premium (which excludes Low-Income Subsidy (LIS) recipients) (67%, or 9.0 million enrollees) will see their monthly premium increase if they remain in their current plan in 2020, while one-third (32%, or 4.3 million enrollees) will see a premium reduction if they stay in the same plan (Figure 5). Twenty percent of non-LIS enrollees, or 2.7 million enrollees, will see a premium increase of $10 or more per month; 0.9 million non-LIS enrollees (7%) will see a premium reduction of the same magnitude.
Figure 5: Two-thirds of Part D Stand-alone Drug Plan Enrollees Without Low-income Subsidies Face Premium Increases If They Stay in Their Current Plan in 2020
  • About three in 10 (29%) non-LIS enrollees (3.8 million) are projected to pay monthly premiums of at least $60 if they stay in their current plans. More than 215,000 (2% of non-LIS enrollees) are projected to pay monthly premiums of at least $100.
  • CMS reported that the average premium for basic Part D coverage offered by PDPs and MA-PDs will be an estimated $30 in 2020. Our premium estimate is higher because it is based on PDPs only and includes PDPs offering both basic and enhanced coverage (enhanced plans have higher premiums than basic plans, on average). In contrast, the CMS estimate includes MA-PDs and excludes plans offering enhanced coverage. In addition, our premium estimates are weighted based on current enrollment and do not incorporate any assumptions about plan changes by current enrollees, reassignment of Low-Income Subsidy enrollees by CMS, or plan choices by new enrollees.
  • In prior years, the average premium that we have calculated after taking into account enrollment changes made during the open enrollment period and subsequent months has been somewhat lower than our projection based on current enrollment. For example, the weighted average premium calculated in September 2019 was $39.13, 5% ($2.08) below the projected premium for 2019 of $41.21 calculated prior to enrollment changes. The reduction is due to current enrollees switching to lower premium plans, new enrollees choosing low-premium plans, and reassignment of some LIS beneficiaries to lower-premium plans.
Premium Variation and Changes for National PDPs

PDP premiums will continue to vary widely across plans in 2020, as in previous years.

  • Among the 20 PDPs available nationwide in 2020, average premiums will range sixfold, from a low of $13 per month for Humana Walmart Value Rx Plan to a high of $83 per month for Express Scripts Medicare Choice (Figure 1; Table 2).

Changes to premiums from 2019 to 2020, averaged across regions and weighted by September 2019 enrollment, also vary widely across PDPs, as do the absolute amounts of monthly premiums for 2020.

  • The 2.1 million non-LIS enrollees in the largest PDP, CVS Health’s SilverScript Choice (which had a total of 4.4 million enrollees in 2019, including those receiving low-income subsidies) will face a $2 (7%) decrease in their average monthly premium, from $31 in 2019 to $29 in 2020.
  • In contrast, the 2.0 million non-LIS enrollees in the second largest PDP, AARP MedicareRx Preferred, will face a $4 (6%) increase in their average monthly premium between 2019 and 2020, from $75 to $79. This is the second highest monthly premium among the national PDPs in 2020.
  • Plan changes and consolidations will affect the premiums paid by many current enrollees in Humana’s PDPs. For 2020, Humana is consolidating two of its PDPs (Humana Walmart Rx and Humana Enhanced) into one PDP and renaming it Humana Premier Rx. It is also renaming Humana Preferred Rx to Humana Basic Rx, and introducing an entirely new PDP, Humana Walmart Value Rx Plan.
    • The weighted average monthly premium for Humana Premier Rx will be $57 in 2020. For the 1.9 million non-LIS enrollees in the Humana Walmart Rx plan (the third most popular PDP in 2019) who will be automatically enrolled in Humana Premier Rx, the monthly premium will more than double, from $28 to $57, if they do not switch plans for 2020 (Figure 6). Beneficiaries enrolled in Humana Walmart Rx in 2019 will not be automatically enrolled in the new Humana Walmart Value Rx plan, which has a substantially lower premium ($13 per month); they will have to switch during the open enrollment period if they want this lower-premium plan option.
    • Conversely, the 0.6 million non-LIS enrollees in Humana Enhanced who will also be enrolled automatically in the consolidated plan, will see a 25% reduction in their monthly premium, from $76 to $57, if they remain enrolled in the Humana Premier Rx Plan for 2020.
Figure 6: More Than 2.6 Million Humana PDP Enrollees Will Be Affected by Plan Changes for 2020, with a Large Premium Increase for Many Unless They Switch Plans
Premium Variation by Region

Average PDP monthly premiums for 2020 will vary across the 34 PDP regions, from $33 in Hawaii to $49 in New Jersey (see map; Table 1).

.

  • All 34 PDP regions have at least one PDP with a premium under $20. For example, the new Humana Walmart Value Rx Plan is available in all regions with a monthly premium of $13.20, while the new WellCare Wellness Rx PDP is available nationwide with premiums ranging from $13.10 to $15.70. At the high end, seven PDPs, with a total of 100,000 enrollees in 2019 (less than 1% of total PDP enrollment), have monthly premiums of at least $125. The highest is $191.40 for BlueCross Rx Plus PDP, which is offered in the South Carolina region.
  • Average premiums are projected to be higher in 33 out of 34 regions, increasing by between $1 and $6 in 32 out of 34 regions. In California, the average premium will decrease by less than $1 from the 2019 average, while in Virginia, the average premium will increase by less than $1 from the 2019 average.

Benefit Design and Cost Sharing

In 2020, all PDPs will offer an alternative benefit design, different from the defined standard benefit, which has a $435 deductible (an increase from $415 in 2019) and 25% coinsurance for all covered drugs between the deductible and the initial coverage limit. Part D plans can also provide enhanced benefits, including a lower (or no) deductible, reduced cost sharing, and/or a higher initial coverage limit than under the standard benefit design.

In 2020, all PDPs will have a benefit design with five or six tiers for covered generic, brand-name, and specialty drugs and cost sharing other than the standard 25% coinsurance. As of 2020, Part D enrollees will no longer be exposed to a coverage gap, sometimes called the “doughnut hole,” when they fill their prescriptions; coinsurance in the coverage gap phase will be 25% for both brands and generics.

Basic versus Enhanced Benefits

  • In 2020, 60% of PDPs, or 566 plans (excluding plans in the territories), will offer enhanced benefits, an increase in the number of enhanced-benefit PDPs compared to prior years (Table 3). As noted earlier, this increase is a response by Part D plan sponsors to the elimination of the requirement to demonstrate a “meaningful difference” (measured by enrollee out-of-pocket costs) between enhanced plans offered by the same firm in the same region. The overall share of PDPs offering basic Part D benefits in 2020 is roughly the same as in 2019 (40%), but the number of basic-benefit plans in 2020 will be higher than in 2019 (382 vs. 348). As in recent years, no plans will offer the defined standard benefit.
  • The average premium in 2020 for enhanced benefit PDPs ($57) is 85% higher than the monthly premium for PDPs offering the basic benefit ($31) (weighted by September 2019 enrollment).

Deductibles

  • The number and share of PDPs that charge a deductible is increasing, from 71% in 2019 to 86% in 2020 (Table 3). A larger share of PDPs (69%) will charge the standard deductible in 2020 than in 2019 (52%). The standard deductible amount is $435 in 2020; the average deductible is increasing by nearly $100 between 2019 and 2020, from $238 to $335 (weighted by September 2019 enrollment).
  • There are some notable changes in deductibles among the national PDPs for 2020.
    • In 2020, only two of the 20 national plans will charge no deductible in all regions (AARP MedicareRx Preferred and WellCare Medicare Rx Value Plus), down from five national PDPs that charged no deductible in all or most regions in 2019.
    • Enrollees in SilverScript Choice paid no deductible in 28 out of 34 regions in 2019, but in 2020, enrollees in this plan will pay deductibles ranging by region from $215 to $435 (the maximum deductible amount).
    • Enrollees in Humana Enhanced paid no deductible in 2019, but those who remain in the new Humana Premier Rx plan in 2020 will be charged the standard $435 deductible in 33 out of 34 regions.
    • In contrast to these increases, enrollees in Express Scripts Medicare Choice will see a reduction in their deductible, from $350 in 2019 to $250 in 2020.
  • The average premium in 2020 for PDPs that charge no deductible ($81) is more than double the monthly premium for PDPs that charge the standard deductible ($36) or a partial deductible ($32) (weighted by September 2019 enrollment).

Cost Sharing

  • As in recent years, all PDPs in 2020 will use tiered cost sharing. The typical five-tier design includes tiers for preferred generics, generics, preferred brands, non-preferred drugs (which includes both brands and generics), and specialty drugs. Five-tier formularies have been the most common type since 2013. Part D enrollees will face modest cost-sharing amounts for generic drugs in 2020 but much higher cost sharing for brands and non-preferred drugs, and a mix of copayments and coinsurance for different formulary tiers (Figure 7).
Figure 7: Part D Enrollees Will Pay Low Copays for Generic Drugs in 2020, But Much Higher Amounts for Brands and Non-preferred Drugs, and a Mix of Copays and Coinsurance for Different Formulary Tiers
  • Overall, PDP cost-sharing amounts in 2020 are relatively similar to 2019 levels (Table 4). For generic tiers, median copayments across all PDPs are $0 for the preferred generic tier and $3 for the generic tier in 2020.
    • Nine of the 20 national PDPs, including the largest PDP (SilverScript Choice), have a $0 copayment for preferred generic drugs in 2020. Median copayments for generics range from $1 to $10 among the 20 national PDPs; most charge $5 or less for generics.
  • Most PDPs charge copayments for preferred brand tiers, but nearly one in 10 PDP enrollees (9%) will be in plans that charge coinsurance in 2020 (based on September 2019 enrollment). For preferred brand tiers, the median copayment in 2020 is $42; the median coinsurance rate is 25%.
    • Of the 18 national PDPs that charge copayments for preferred brands, the amounts range from $25 to $47; 11 of these 18 PDPs charge $40 or more, including four that charge $47 (Humana Walmart Value Rx Plan. SilverScript Choice, WellCare Medicare Rx Select, and WellCare Medicare Rx Value Plus).
  • Virtually all PDPs are using coinsurance for the non-preferred drug tier in 2020. The median coinsurance PDPs charge for non-preferred drugs in 2020 is 38%.
    • Among the 20 national PDPs, coinsurance for non-preferred drugs in 2020 varies from 32% (AARP MedicareRx Walgreens) to 50% (Cigna-HealthSpring Rx Secure-Extra), the maximum allowed for this tier by CMS guidelines (which is higher than the maximum coinsurance allowed for specialty drugs). Half of the national PDPs (10) charge 40% or more for non-preferred drugs.
  • Specialty tier coinsurance ranges from 25% to 33% for all PDPs, the maximum allowed by CMS guidelines. Most (15) of the national PDPs charge 25% for specialty tier drugs in 2020; two charge 33%. In 2020, the threshold for drugs to qualify for placement on a specialty tier is $670 for a one-month supply of the drug, the same amount since 2017.

Low-income Subsidy (Benchmark) Plans

In 2020, a larger number of PDPs will be premium-free benchmark plans—that is, PDPs available for no monthly premium to beneficiaries receiving the Low-Income Subsidy (LIS)—than in recent years.

  • On average (weighted by Medicare enrollment), LIS beneficiaries have seven benchmark plans available to them for 2020, or one-fourth the average number of PDP choices available overall. All LIS enrollees can select any plan offered in their area, but if they enroll in a non-benchmark plan, they must pay some portion of their chosen plan’s monthly premium.
  • In 2020, a total of 244 PDPs will be premium-free benchmark plans. This number represents roughly a quarter of all PDPs in 2020. The number of benchmark plans in 2020 is 29 more than in 2019 (a 13% increase) and the largest number of benchmark plans available to LIS enrollees since 2015 (Figure 8, Table 1).
  • Of the 244 benchmark plans in 2020, 53 plans qualify through the “de minimis” policy, close to twice the number in 2019 (29). The de minimis policy makes it easier for plans to qualify as benchmark plans and retain their current LIS enrollees by allowing them to waive a premium amount of up to $2 above the regional LIS benchmark. Although benchmark plans that qualify through the de minimis policy can keep their existing LIS enrollees, they cannot receive auto-assigned enrollees. This means that only 191 PDPs in 2020 (20% of all PDPs, or 78% of all benchmark plans) are eligible for auto-assignment.
Figure 8: In 2020, 244 Part D Stand-alone Drug Plans Will Be Available Without a Premium to Enrollees Receiving the Low-Income Subsidy (“Benchmark” Plans)

Benchmark Plans by Region

  • The number of benchmark plans available in 2020 will vary by region, from just two benchmark PDPs in Ohio (out of 28 PDPs overall) to 12 benchmark PDPs in Arizona (out of 31 PDPs) (see map; Table 1). Benchmark plan availability will be the same or higher in 32 of 34 regions between 2019 and 2020.

.

  • In 2020, 95% of LIS PDP enrollees are projected to be in PDPs operated by five firms: CVS Health, WellCare, Humana, UnitedHealth, and Cigna (based on enrollment as of September 2019). All five sponsors offer PDPs that qualify as benchmark plans in all 34 PDP regions in 2020.

Impact of Benchmark Plan Changes for Low-Income Subsidy Enrollees

  • More than one million LIS beneficiaries—1.3 million, or nearly 20% of LIS enrollees in PDPs—are enrolled in PDPs in 2019 that will not qualify as benchmark plans in 2020 (Figure 9). CMS will reassign these LIS beneficiaries to another plan if they were randomly assigned to their current plan, but those who have chosen their current plan must switch on their own to avoid paying a premium if they remain in their 2019 plan.
Figure 9: Two in 10 Low-Income Subsidy PDP Enrollees Are Projected to Pay Premiums for Non-Benchmark Plans in 2020 if They Don’t Switch
  • These 1.3 million LIS beneficiaries face monthly PDP premiums that average $18 if they remain in their current plan for 2020. More than 200,000 of these LIS beneficiaries are enrolled in the AARP MedicareRx Preferred PDP, and they will pay a monthly premium of more than $47, on average, if they stay in this PDP for 2020.

Discussion

Our analysis of the Medicare Part D stand-alone drug plan landscape for 2020 shows that millions of Part D enrollees without low-income subsidies will face premium and other cost increases in 2020 if they stay in their current stand-alone drug plan. There are more plans available nationwide in 2020, with Medicare beneficiaries having nearly 30 PDP choices during this year’s open enrollment period. Most Part D enrollees will be in a plan with the standard $435 deductible and will face low copayments for generic drugs but substantially higher costs for brands, including as much as 50% coinsurance for non-preferred drugs.

Some Part D enrollees who choose to stay in their current plans may see lower premiums and other costs for their drug coverage, but two-thirds of non-LIS enrollees will face higher premiums if they remain in their current plan, and many will also face higher deductibles and cost sharing. As in prior years, all Part D enrollees could benefit from the opportunity to compare plans during open enrollment, since plans vary in a number of ways that can have a significant effect on an enrollee’s out-of-pocket spending.

Juliette Cubanski and Tricia Neuman are with KFF.Anthony Damico is an independent consultant.

Methods

This analysis focuses on the Medicare Part D stand-alone prescription drug plan marketplace in 2020 and trends over time. The analysis includes 20.5 million enrollees in stand-alone PDPs, as of September 2019. The analysis excludes 17.4 million MA-PD enrollees (non-employer), and another 4.6 million enrollees in employer-group only PDPs and 2.3 million in employer-group only MA-PDs for whom plan premium and benefits data are unavailable (as of March 2019).

Data on Part D plan availability, enrollment, and premiums were collected from a set of data files released by the Centers for Medicare & Medicaid Services (CMS):

– Part D plan landscape files, released each fall prior to the annual enrollment period

– Part D plan and premium files, released each fall

– Part D plan crosswalk files, released each fall

– Part D contract/plan/state/county level enrollment files, released on a monthly basis

– Part D Low-Income Subsidy enrollment files, released once annually

– Medicare plan benefit package files, released each fall

– Medicare penetration files, released on a monthly basis

In this analysis, premium estimates are weighted by September 2019 enrollment unless otherwise noted. Percentage increases are calculated based on non-rounded estimates and in some cases differ from percentage calculations calculated based on rounded estimates presented in the text.

Tables

Table 1: Medicare Part D Stand-alone Prescription Drug Plans, Benchmark Plans, and Monthly Premiums, 2019 and 2020
Number of PDPsNumber of Benchmark PDPsWeighted Average PDP Monthly Premium
State/territory201920202019202020192020
U.S. Total901948215244$39.13$42.05
Alabama293067$41.65$44.55
Alaska222477$36.94$38.93
Arizona28311012$38.29$42.77
Arkansas262746$34.30$37.49
California303278$43.50$43.20
Colorado262677$38.38$42.36
Connecticut262577$42.27$44.78
Delaware2527910$39.33$43.32
District of Columbia2527910$35.09$36.37
Florida272724$42.45$45.72
Georgia262846$36.77$38.59
Hawaii242545$32.15$33.97
Idaho262888$37.92$42.37
Illinois272878$39.01$42.30
Indiana262877$37.17$40.33
Iowa282968$34.36$39.49
Kansas262846$38.33$39.51
Kentucky262877$37.32$39.33
Louisiana262689$37.26$39.50
Maine262676$39.46$40.12
Maryland2527910$37.75$40.96
Massachusetts262577$39.95$42.37
Michigan293099$37.18$39.93
Minnesota282968$34.98$39.75
Mississippi242557$34.46$36.05
Missouri262845$38.30$41.33
Montana282968$35.73$40.50
Nebraska282968$34.08$38.76
Nevada262835$36.63$40.38
New Hampshire262676$38.56$40.76
New Jersey262868$43.82$49.10
New Mexico272677$33.15$36.15
New York232789$44.13$47.84
North Carolina282879$38.97$41.82
North Dakota282968$34.37$37.84
Ohio262872$37.68$41.43
Oklahoma282978$40.43$41.58
Oregon262878$35.64$38.80
Pennsylvania3031910$38.94$42.23
Rhode Island262577$39.21$42.57
South Carolina262835$36.63$42.85
South Dakota282968$33.70$39.65
Tennessee293067$38.36$41.83
Texas273055$36.34$39.68
Utah262888$39.91$44.54
Vermont262577$38.58$42.25
Virginia272967$40.00$40.36
Washington262878$37.36$40.52
West Virginia3031910$40.04$42.91
Wisconsin283089$40.31$45.53
Wyoming282968$38.95$43.21
Puerto Rico66$42.40$52.03
American Samoa11$34.70$43.40
Guam22$39.88$45.38
Northern Mariana Islands11$37.20$30.20
U.S. Virgin Islands11$42.60$47.40
NOTES: PDP is prescription drug plan. U.S. total count excludes PDPs in the territories. Totals include sanctioned plans closed to new enrollees as of September of prior year. Average monthly premium is weighted by September 2019 enrollment. Benchmark plan counts include “de minimis” plans, which can retain Low-Income Subsidy beneficiaries despite exceeding the benchmark premium by a minimal amount (up to $2 in 2020). Benchmark plans are not shown for the territories because the LIS is not available to residents of the territories.

SOURCE: KFF analysis of Centers for Medicare & Medicaid Services 2019-2020 Part D plan files.

Table 2: National Medicare Part D Stand-alone Prescription Drug Plans in 2020

PDP name

Type of plan

Benchmark PDP

Enrollment1

Weighted average monthly premium2

Number (in millions)

% of total

Top 10 in 2019

2019

2020

% change

ALL PDPs

20.49

100.00%

$39

$42

7%

AARP MedicareRx Preferred

Enhanced3

No

2.21

10.8

2

$75

$79

6%

AARP MedicareRx Saver Plus

Basic

Yes

1.25

6.1

5

$34

$32-4%

AARP MedicareRx Walgreens

Enhanced

No

0.74

3.6

8

$28

$3423%

Cigna-HealthSpring Rx Secure

Basic

Yes4

0.51

2.5

$32$30-5%

Cigna-HealthSpring Rx Secure-Essential

Enhanced

No

0.07

0.3

$22$221%

Cigna-HealthSpring Rx Secure-Extra

Enhanced

No

0.15

0.7

$57$57<1%

EnvisionRxPlus

Basic4

Yes4

0.54

2.6

$17$16-3%

Express Scripts Medicare – Choice

Enhanced

No

0.05

0.2

$93$83-11%

Express Scripts Medicare – Saver

Enhanced

No

0.21

1.0

$24$251%

Express Scripts Medicare – Value

Basic

Yes5

0.45

2.2

$35$362%

Humana Basic Rx Plan

Basic

Yes4

1.57

7.7

$31

Humana Preferred Rx Plan

Crosswalked to Humana Basic Rx Plan

4

$31-1%

Humana Premier Rx Plan

Enhanced

No

2.62

12.8

$57

Humana Walmart Rx Plan

Crosswalked to Humana Premier Rx Plan

3

$28107%

Humana Enhanced

Crosswalked to Humana Premier Rx Plan

9

$76-25%

Humana Walmart Value Rx Plan

Enhanced

No

New in 2020

$136

SilverScript Choice

Basic

Yes4

4.40

21.5

1

$31$29-7%

WellCare Classic

Basic

Yes4

0.89

4.3

7

$32$29-9%

WellCare Medicare Rx Saver

Basic

Yes4

1.17

5.7

$31

Aetna Medicare Rx Saver

Crosswalked to WellCare Medicare Rx Saver

6

$296%

WellCare Medicare Rx Select

Enhanced

No

0.70

3.4

$21

Aetna Medicare Rx Select

Crosswalked to WellCare Medicare Rx Select

10

$1723%

WellCare Medicare Rx Value Plus

Enhanced

No

0.52

2.5%

$72

Aetna Medicare Rx Value Plus

Crosswalked to WellCare Medicare Rx Value Plus

$6020%

WellCare Extra

Crosswalked to WellCare Medicare Rx Value Plus

$711%

WellCare Value Script

Enhanced

No

0.74

3.6%

$15$1714%

WellCare Wellness Rx

Enhanced

No

New in 2020

$146
NOTES: PDP is prescription drug plan. Analysis excludes enrollees in employer group plans. 1Enrollment as of September 2019, includes enrollees with and without low-income subsidies; for enrollees being crosswalked into new plan for 2020, enrollment is shown in the crosswalked plan. Top 10 in 2019 based on March 2019 enrollment. 2Weighted by September 2019 enrollment. 3In all regions except territories. 4In most regions. 5In some regions. 6Unweighted median because PDP is new for 2020.SOURCE: KFF analysis of Centers for Medicare & Medicaid Services 2019-2020 Part D plan files.
Table 3: Benefit Designs and Deductibles in Medicare Part D Stand-alone Prescription Drugs Plans, 2019 and 2020
20192020
Share of PDPs offering (number of plans1)
Basic benefits39% (348)40% (382)
Enhanced benefits61% (553)60% (566)
Standard deductible52% (468)69% (654)
Lower deductible19% (170)17% (161)
No deductible29% (263)14% (133)
Weighted average monthly PDP premium2
Basic benefits$31.97$30.90
Enhanced benefits$48.76$57.03
Standard deductible$31.54$36.03
Lower deductible$33.93$31.78
No deductible$75.37$80.60
NOTES: PDP is prescription drug plan. 1Excludes plans in the territories. 2Weighted by September 2019 enrollment.SOURCE: KFF analysis of Centers for Medicare & Medicaid Services 2019-2020 Part D plan files.
Table 4: Median Cost Sharing for National Medicare Part D Stand-alone Prescription Drug Plans, 2019 and 2020
Plan nameFormulary tier cost-sharing amounts
Preferred generics ($)Generics ($)Preferred brands1Non-preferred drugs (%)Specialty tier drugs (%)
2019202020192020201920202019202020192020
ALL PDPs$1$0$5$3$40/ 20%$42/ 25%40%38%25%25%
AARP MedicareRx Preferred551010$40$4540%40%3333
AARP MedicareRx Saver Plus1166$25$2633352525
AARP MedicareRx Walgreens0055$30$4032322525
Cigna-HealthSpring Rx Secure-Essential103220%18%49432525
Cigna-HealthSpring Rx Secure-Extra441010$42$4250503131
Cigna-HealthSpring Rx Secure1132$30$3036362525
EnvisionRxPlus1167$34$35236332525
Express Scripts Medicare Choice2277$42$4248482628
Express Scripts Medicare Saver114418%$3032472525
Express Scripts Medicare Value1133$25$2539352525
Humana Basic Rx Plan001125%25%37382525
Humana Premier Rx Plan1144$47$4235442525
Humana Walmart Value Rx Plann/a1n/a4n/a$47n/a35n/a25
SilverScript Choice30131$42$4745383327
WellCare Classic0022$37$3241342525
WellCare Medicare Rx Saver1022$30$2835382725
WellCare Medicare Rx Select0023$47$4740422525
WellCare Medicare Rx Value Plus1124$47$4747473333
WellCare Value Script0067$40$4346472525
WellCare Wellness Value Rxn/a0n/a5n/a$40n/a46n/a25
NOTES: PDP is prescription drug plan. Estimates are weighted medians for those plans that vary cost sharing by region (weighted by September 2019 enrollment). n/a is not applicable because plan is new for 2020. 1Approximately 91% of September 2019 enrollees are in plans with a preferred brand copay and 9% are in plans with a preferred brand coinsurance. 211% of EnvisionRxPlus enrollees will pay coinsurance of 15% for the preferred brand tier.

SOURCE: KFF analysis of Centers for Medicare & Medicaid Services 2019-2020 Part D plan files.

News Release

Report Examines How State and National Policies Affect Access to Reproductive Health Care for Low-Income Women in Five Communities

Published: Nov 14, 2019

As policy debates over the future of access to reproductive and sexual health services heat up at the national and state levels, a new KFF report examines how these policies have played out in five communities across the United States.

Earlier this year KFF, working with Health Management Associates, conducted interviews with local clinicians, social service providers, community-based organizations, researchers, and health care advocates as well as a focus group with low-income women in five different communities: Selma and Dallas County, AL; Tulare County, CA; St. Louis, MO; Crow Tribal Reservation, MT; and Erie County, PA. Based on the interviews and the focus groups, the study identifies themes that cut across all five “medically underserved” communities, but play out in different ways depending on the policy, political, and social environments in each place:

  • Cultural and Social Determinants of Health: In each of the communities, poverty, cultural factors, and social determinants were identified as having a considerable impact on women’s ability to prioritize, afford, and get to family planning or abortion services. In addition, the residual effects of historical abuses by the medical establishment result in persistent mistrust of providers in some communities.
  • Coverage: Interviewees identified lack of coverage options for basic health care services as a prominent challenge in states that did not adopt the ACA’s Medicaid expansion. They also identified ways to strengthen Medicaid to improve services available to enrollees, such as elimination of pre-authorization for certain contraceptive methods, increasing provider participation in the program, and improving systems to connect uninsured women to Medicaid-funded family planning programs.
  • Provider Supply and Distribution: There are provider shortages in many communities, especially in large, rural areas. Interviewees said that challenges with recruitment and retention of clinical staff create access barriers for women. Many interviewees identified gaps in consistent language translation services, the need for cultural concordance, and a shortage of female clinicians.
  • Sex Education: The importance of comprehensive sex and STI education was raised across communities. A lack of information was said to leave many girls and women uninformed or misinformed about their reproductive health care, contraceptive options, and how to access services.
  • Abortion Environment: Abortion was difficult to access in all of the communities. Stigma, anti-abortion beliefs, and policy restrictions at the state and/or community level shape the availability of legal abortion services and women’s ability to access them.  

In addition to an executive summary report, KFF has also published case study briefs that detail the findings in each of the five communities. A briefing will be held today featuring a panel discussion with health leaders from each of the communities. A recording of the briefing will be posted on kff.org.