February State Data for Medicaid Work Requirements in Arkansas

Authors: Robin Rudowitz, MaryBeth Musumeci, and Cornelia Hall
Published: Mar 25, 2019

Issue Brief

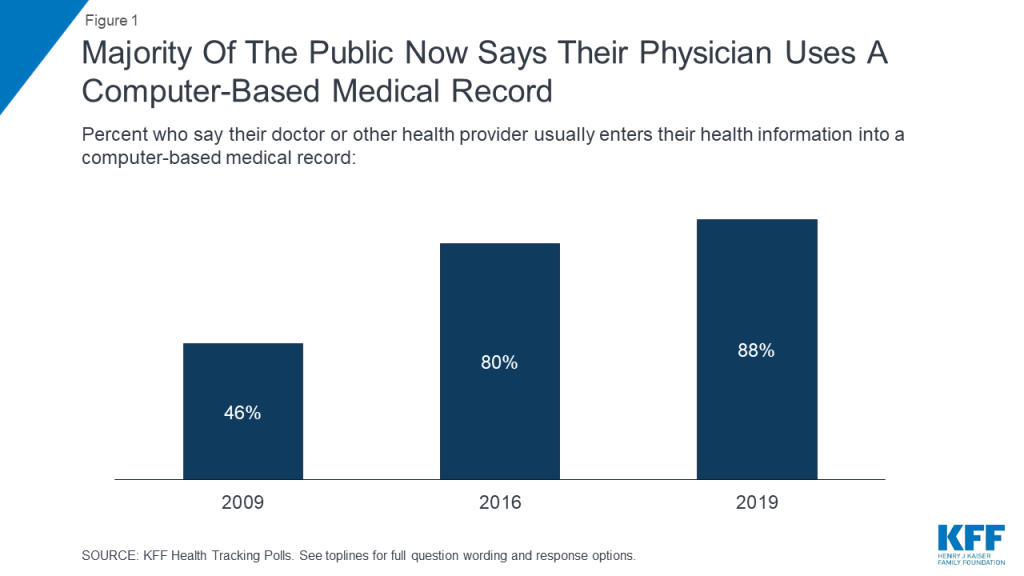
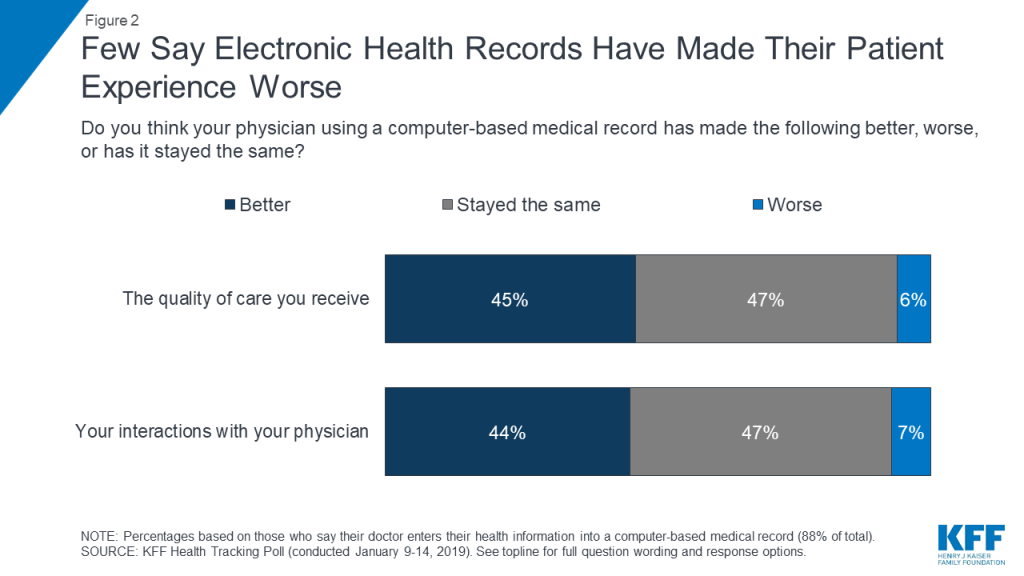
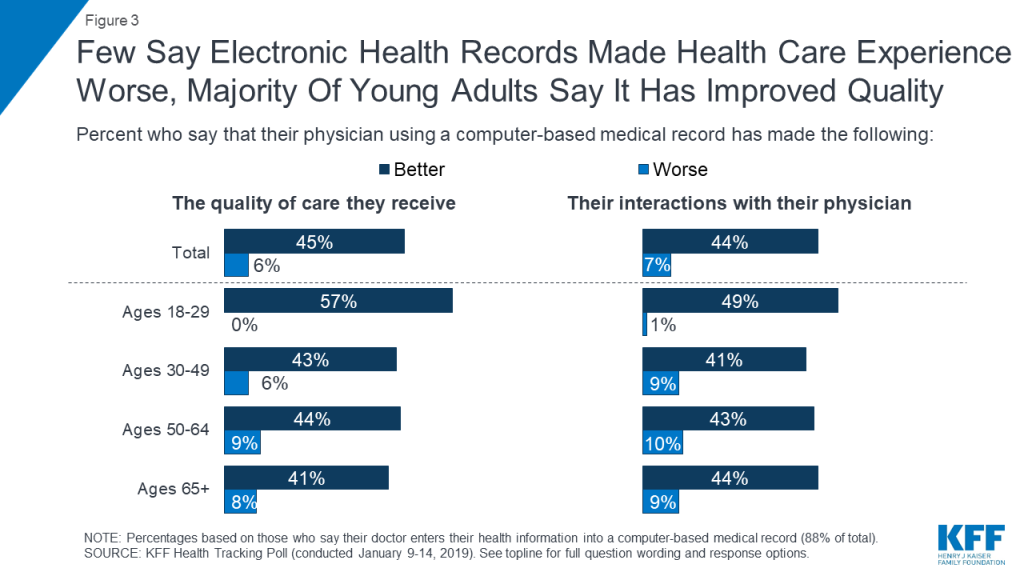
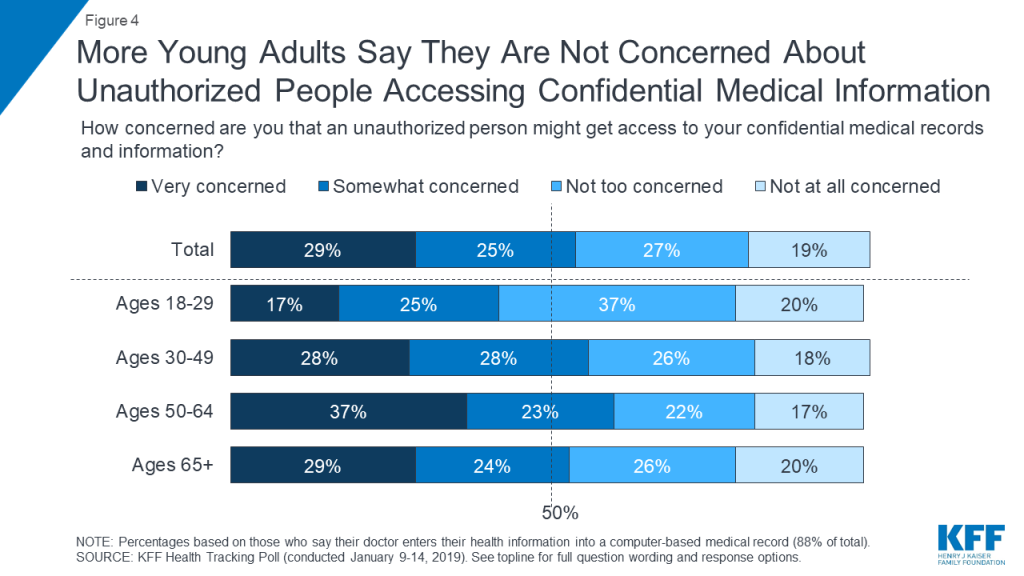
Arkansas is one of eight states for which CMS has approved a Section 1115 waiver to condition Medicaid eligibility on meeting work and reporting requirements and the first state to implement this type of waiver.1  The new requirements were phased in for most enrollees ages 30-492  beginning in June 2018 and for individuals ages 19-29 starting in January 2019. Unless exempt, enrollees must engage in 80 hours of work or other qualifying activities each month and must report their work or exemption status by the 5th of the following month using an online portal; as of mid-December 2018, they also may report by phone.3  Monthly data related to the new requirements released by the Arkansas Department of Human Services show that over 18,000 people were disenrolled from Medicaid for failure to comply with the new requirements in 2018. Those who fail to comply with the requirements for any three months in 2019 can lose coverage beginning in April 2019,4  unless a federal district court ruling prevents new coverage losses from going into effect.5  This brief looks at data for February 2019. Separate reports look at early implementation of the new requirements and enrollee experiences.

How many people have lost or are at risk of losing coverage due to the work and reporting requirements?

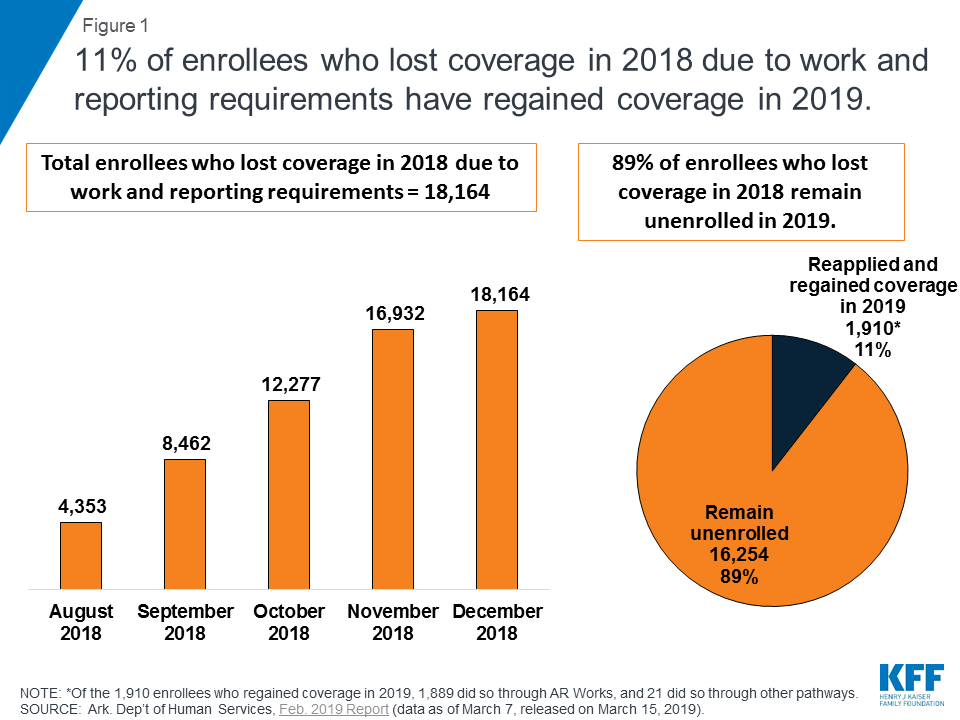
A total of 18,164 individuals lost coverage in 2018 due to failure to meet the work and reporting requirements, and few have regained coverage in 2019 (Figure 1). Under the waiver, enrollees lose coverage for the rest of the calendar year after not meeting the requirements for any three months and are barred from regaining coverage until the following January. Of the 18,164 individuals who lost coverage in 2018, 11%, or 1,910, have reapplied for and regained coverage in 2019.6  The data do not indicate whether those who remain unenrolled have obtained other coverage or are uninsured. Other research shows that additional administrative burdens on eligibility and enrollment processes, such as having to re-apply to regain coverage, result in some eligible people remaining unenrolled.

Figure 1: 11% of enrollees who lost coverage in 2018 due to work and reporting requirements have regained coverage in 2019.

As of March 7, 2019, 7,066 enrollees had one month of non-compliance with the requirements, and 6,472 enrollees had two months of non-compliance in the new calendar year. Each enrollee’s count of noncompliance months reset to zero at the beginning of 2019. Those with two months of non-compliance in 2019 are at risk of losing coverage in April if they fail to meet the work or reporting requirements in March, or later in 2019 if they fail to meet the requirements in another subsequent month.

In February 2019, almost 5% (10,854) of all Arkansas Works enrollees had their cases closed for reasons other than failure to meet the work and reporting requirements. Nearly half (49%) of total case closures were due to problems with communication (i.e., 19% due to inability to locate client or client moved out of state, and 30% due to failure to return requested information).7  Some of these statistics can be explained from information learned from enrollee focus groups, which revealed that some individuals (especially college students or individuals who move in and out of homelessness) did not receive notices due to address changes; some enrollees were not receiving notices at their correct address, despite having reported an address change to the state. Focus group participants also described confusion when monthly reporting for the work requirement coincided with the need to separately provide similar information to the state for their annual eligibility renewal. Other research shows that any additional administrative burdens on eligibility and enrollment processes result in loss of coverage among those who remain eligible.

How many enrollees are subject to the work and reporting requirements?

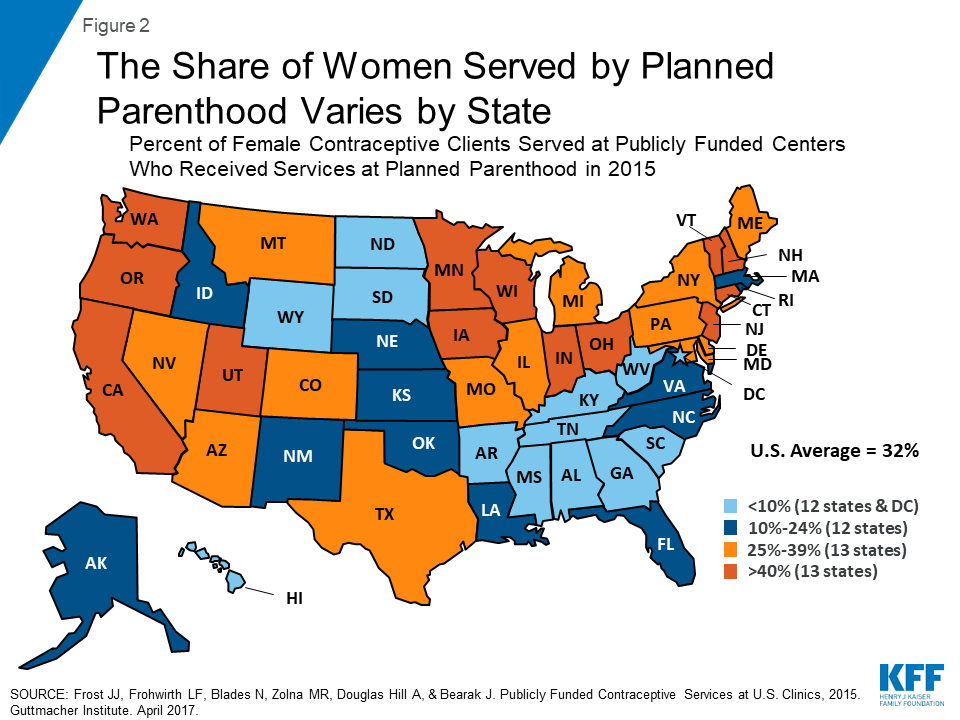
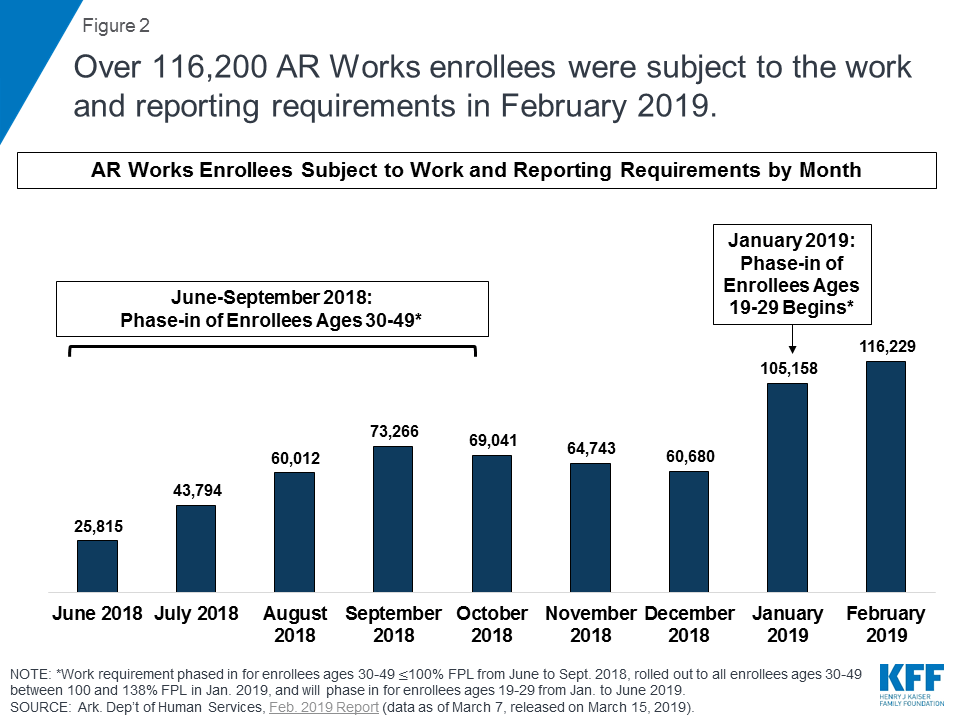
A total of 116,229 individuals were subject to the work and reporting requirements in February 2019, an 11% increase over January as more enrollees continued to be phased in. The work and reporting requirements were phased in for enrollees ages 30-49 at or below 100% FPL from June to September 2018, rolled out to all enrollees ages 30-49 between 101 and 138% FPL in January 2019, and are phasing in for all enrollees ages 19-29 from January to June 2019. (Figure 2). Those subject to the new requirements account for half of the 238,870 Arkansas Works enrollees as of February 2, 2019. Those ages 50 and older are not subject to the requirements.

Figure 2: Over 116,200 AR Works enrollees were subject to the work and reporting requirements in February 2019.

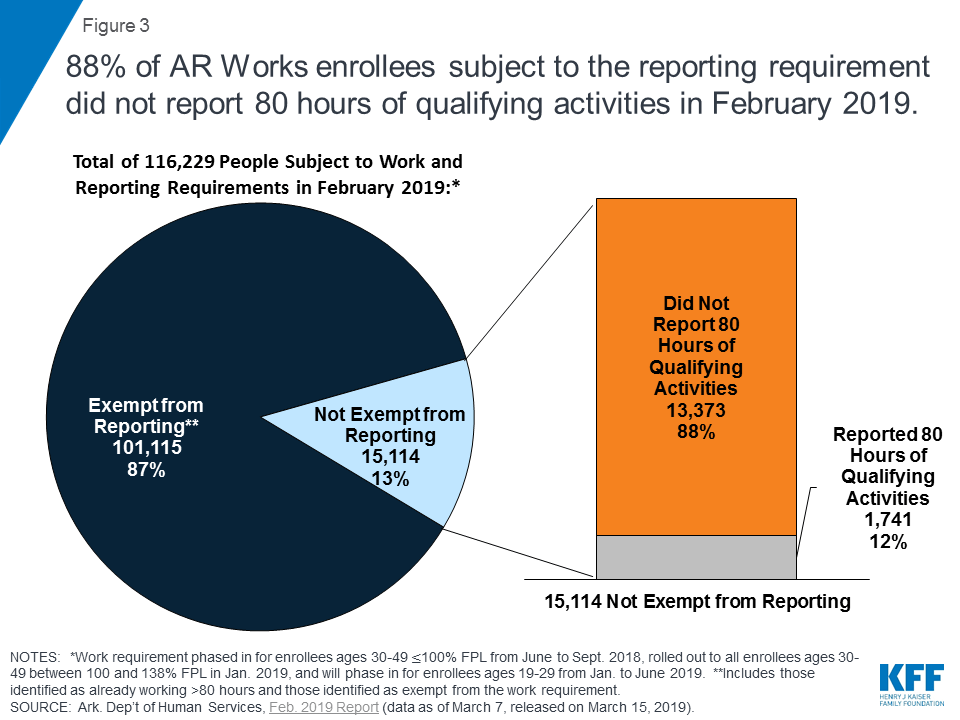
Nearly 9 out of 10 (88%) of those not exempt from the work and/or reporting requirements did not report 80 hours of qualifying activities in February (Figure 3). The large majority (87%) of individuals subject to the work requirements were exempt from the reporting requirements. Of those required to report, only 12% reported 80 hours of qualifying activities.8 

Figure 3: 88% of AR Works enrollees subject to the reporting requirement did not report 80 hours of qualifying activities in February 2019.

Consistent with prior months, nearly all enrollees (almost 99%) who failed to report 80 hours of qualifying activities reported no work activities. This could mean that they did not create and link the online accounts required to enable them to report online, they experienced difficulty accessing or navigating the online portal, or they were unable to report successfully by phone. A small number of enrollees (197 out of 13,373) did report some work activities, but not 80 hours of qualifying activities.9  Individuals who fail to complete 80 hours of qualifying work activities and/or fail to timely report their activities each month can request a good cause exception. From June 2018 through February 2019, the state reviewed a total of 1,017 good cause requests; of these, the state granted 676, denied 77, determined that 263 were “not a good cause issue,” and noted that verification was not received for one request.10 

How many enrollees were exempt from the work and reporting requirements and why?

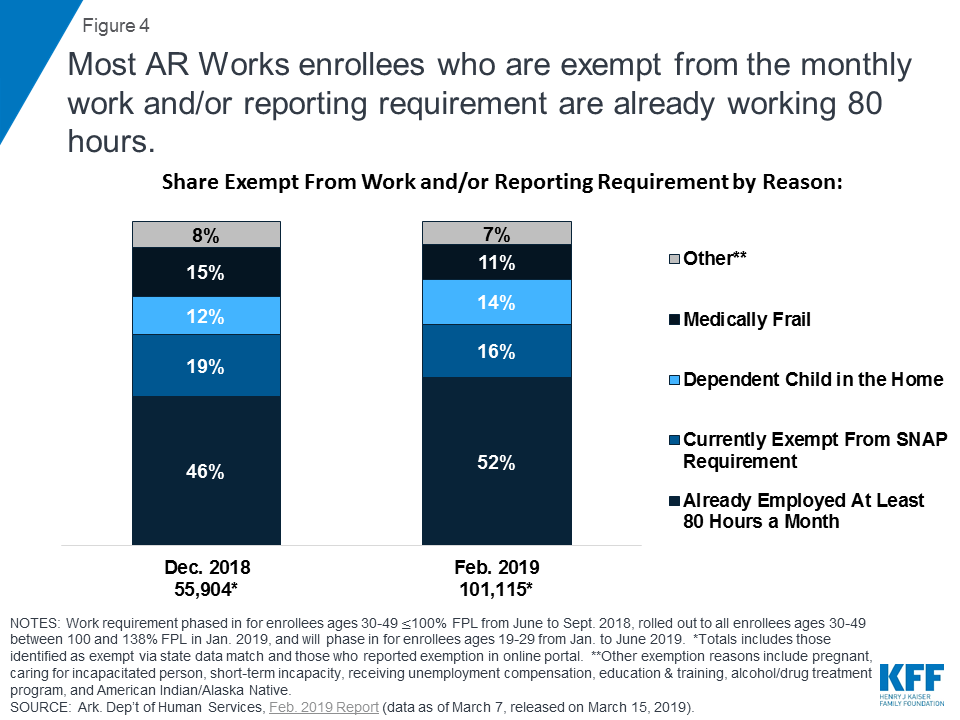
Most of the enrollees exempt from the reporting requirement in February were already working at least 80 hours per month. These 101,115 enrollees who were exempt from reporting represent 98% of those who met the requirements in February. The state identified many of these enrollees through a data match, and they should have received a notice indicating that they were subject to the work requirement but exempt from the reporting requirement. Overall, most exempt enrollees fell into four categories: those who were already working at least 80 hours per month, followed by those currently exempt from SNAP employment and training requirements, those with a dependent child in the household, and those identified as medically frail (Figure 4).11  While the shares falling into these categories were nearly identical in January and February, some of the shares of exemption categories shifted compared to December, with more enrollees identified through the state data match as already working 80 hours and fewer exempt due to SNAP compliance or medical frailty. These shifts are consistent with the phase-in of the enrollees ages 30-49 at 101-138% FPL in January, as enrollees at that income level are likely to be working already. State data about enrollees who are working do not indicate whether the individual newly obtained a job as a result of the new requirements.

Figure 4: Most AR Works enrollees who are exempt from the monthly work and/or reporting requirement are already working 80 hours.

How many enrollees actively met the reporting requirement and through what activities?

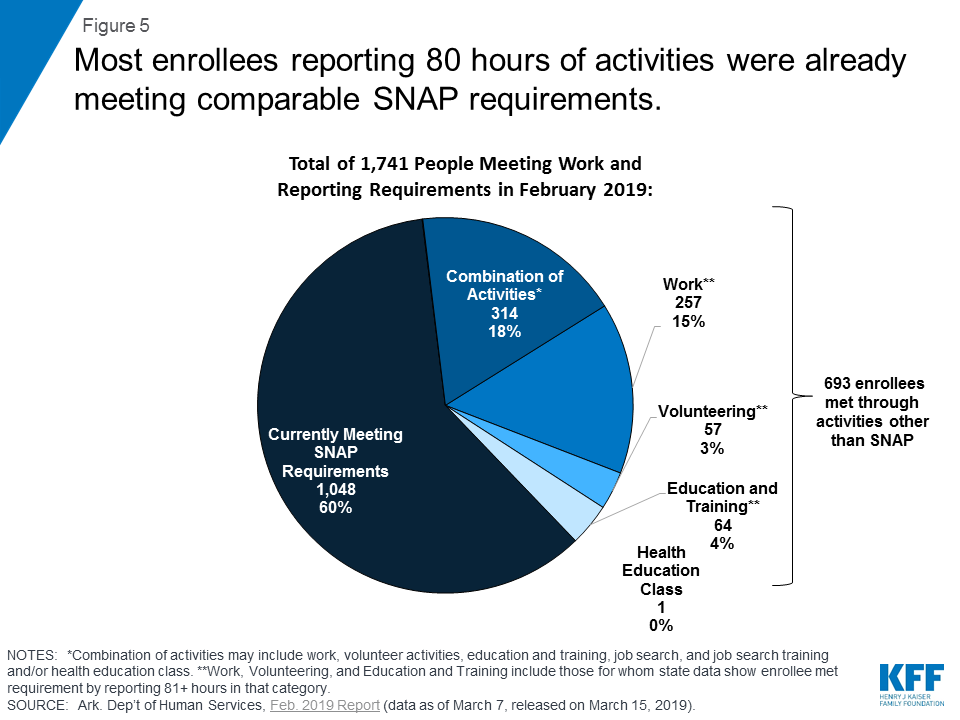
Less than 2% of enrollees who met the requirements in February 2019 did so by actively reporting activities, with 60% of this group doing so by meeting comparable SNAP requirements (Figure 5). A small number of enrollees (693) actively reported an activity other than SNAP compliance. The decrease in enrollees reporting compliance with comparable SNAP requirements (from 65% in January to 60% in February) was offset by small increases in the shares reporting work (12% to 15%) or a combination of activities that include work, volunteer activities, education and training, job search, job search training, and/or health education classes (15% to 18%). It is unclear if any activities actively reported by enrollees were initiated due to the new requirements.

Figure 5: Most enrollees reporting 80 hours of activities were already meeting comparable SNAP requirements.

What will future data reporting and research show?

Despite stakeholder concerns in 2018 about the complex new rules and coverage losses, additional enrollees continue to become newly subject to the work and reporting requirements in 2019. An early look at implementation in fall 2018 found that many enrollees had not been successfully contacted about the new requirements, despite substantial outreach and education efforts and concern that many who remain eligible would lose coverage for failure to navigate the process to verify work status or qualify for an exemption. As a result, over 18,000 people lost coverage for failure to comply with the new requirements over the first seven months of implementation in 2018. In January 2019, two new groups of enrollees — the first phase of those ages 19-29 and all of those ages 30-49 between 101 and 138% FPL — became subject to the requirements, and the 19-29 age group continued to be phased in in February 2019. Changes in state policy in December started to allow reporting by phone, and the state indicated that it would engage in additional outreach and education as new groups face the work and reporting requirements. Research shows that additional reporting or administrative burdens create barriers to eligible people retaining coverage. Going forward, it will be important to monitor the experience of the enrollees newly subject to the requirements in 2019 and assess the effect of policy changes that expand reporting options.

In addition, it will be important to understand more about the characteristics and experience of enrollees who lost coverage. Follow-up with enrollees who lost coverage will provide information about their awareness of the new requirements, their issues with compliance, and whether they gained alternative coverage or are uninsured after leaving Arkansas Works. Early implementation findings point to the potential that coverage losses will result in gaps in care and increased uncompensated care costs. Additional research is needed to examine the longer-term effects of coverage losses and lock-outs for enrollees, providers, and health plans. Over the coming months, it will be important to continue to monitor the status of enrollees and the number who fail to meet the new requirements for three months, putting them at risk of losing coverage in April 2019.

Another development to watch is the federal district court’s decision in the lawsuit challenging the HHS Secretary’s approval of Arkansas’ waiver, including the work and reporting requirements, which is expected by the end of March. Last year, the court set aside Kentucky’s waiver as an invalid exercise of the Secretary’s Section 1115 authority.12  The Medicaid enrollees challenging the Arkansas waiver argue that HHS committed the same error in approving Arkansas’ waiver as it did in Kentucky, by failing to consider the waiver’s impact on coverage. If the court finds that HHS’s approval of Arkansas’ waiver is flawed, it could stop implementation while the case is appealed, which would avert potential disenrollments scheduled for April 2019. The ruling could also have implications for other states implementing or pursuing similar waivers.

Endnotes

  1. CMS has also approved work requirement waivers in Arizona, Kentucky, Indiana, Michigan, New Hampshire, Ohio, and Wisconsin. CMS approved a work requirement in Maine, but Maine’s new governor rejected the waiver. Work requirement implementation began in Indiana in January, in New Hampshire in March, and is set to begin in Kentucky in July. ↩︎
  2. In 2018, the work requirement was phased in for those ages 30-49 with income at or below the federal poverty level. In January 2019, the work requirement also was applied to those ages 30-49 between 101% and 138% FPL. ↩︎
  3. On December 12, 2018, the state issued a press release indicating that enrollees would be able to report work activity by phone with DHS beginning on December 19. ↩︎
  4. According to state notices, coverage is terminated after the last day of the month (e.g., March 31st) if enrollees were not compliant in two earlier months and did not report 80 hours of qualifying activities by the last day of the month. However, individuals have until the 5th of the following month (e.g., April 5th) to report activities and could have coverage reinstated if they do so. Individuals who were disenrolled due to the work or reporting requirements in 2018 must file a new application to have coverage restored as of January 2019, and all enrollees subject to the new requirements have their non-compliance months reset to zero at the start of the new calendar year. For the next group of enrollees facing coverage loss due to any three months of non-compliance, notices will go out in March to those already non-compliant in two earlier months in 2019, informing recipients that their coverage will terminate as of April 1st but could be reinstated if they report 80 qualifying hours for March by April 5th. ↩︎
  5. On March 14, 2019, the U.S. District Court for the District of Columbia heard oral argument in a case brought by a group of Arkansas Medicaid enrollees challenging the U.S. Health and Human Services Secretary’s approval of Arkansas’s Section 1115 waiver including the work and reporting requirements. At the hearing, the judge indicated that he expected to issue a decision before April 1st. Gresham v. Azar, No. 1:18-cv-1900 (D.D.C.). ↩︎
  6. Of these 1,910 individuals, 1,889 regained coverage through Arkansas Works, meaning that they will again be subject to the work and reporting requirements, and 21 did so through other Medicaid eligibility pathways. ↩︎
  7. Another 22% of case closures were for unspecified “other” reasons. ↩︎
  8. The share of those not reporting in February (88%) was similar to the share not reporting in January (87%). ↩︎
  9. Of those 197 enrollees, 25 reported 80 or more hours of job search or job search training. Each month, however, enrollees are able to count only 39 hours of job search or job search training toward the required 80 hours of qualifying work activities, which means that those engaged in job search or job search training also must complete 41 hours of another qualifying activity or activities to meet the monthly requirement. One enrollee reported over 80 hours of health education classes, but enrollees are only able to count 20 hours of these classes per year. Seventy-five (75) of the 197 enrollees reported work that fell short of the 80-hour requirement in February, including 23 enrollees with at least 61 but fewer than 81 hours of work. Two enrollees reported education and training that fell short of the 80-hour requirement, including 2 with at least 61 but fewer than 81 hours. Nineteen enrollees reported volunteer hours that fell short of the 80-hour requirement, including 2 with at least 61 but fewer than 81 hours. ↩︎
  10. The state’s quarterly report for July 1, 2018 – September 30, 2018 has additional detail regarding reasons for good cause exemptions. Of the 140 good cause exemptions granted in September 2018, 31 were for failure to work and 109 were for failure to report. The majority of good cause exemptions for failure to work were for an enrollee with a disability (55%). Other reasons include family member disability (13%), hospitalization (13%), life-changing event (6.5%), technical issue (9.7%) or serious illness (3.2%). The large majority of good cause exemptions for failure to report were for technical issues (68%). Other reasons include enrollee disability (10%), hospitalization (6.4%), life-changing event (6.4%), family member disability (5.5%), serious illness (2.8%) and death of family member living in the home (1%). Ark. Dep’t of Human Servs. Ark. Works Program, Nov. 2018 Report (data as of Dec. 7, 2018, released Dec. 17, 2018), https://www.medicaid.gov/Medicaid-CHIP-Program-Information/By-Topics/Waivers/1115/downloads/ar/Health-Care-Independence-Program-Private-Option/ar-works-qtrly-rpt-jul-sep-2018.pdf ↩︎
  11. Other exemptions, accounting for about 7% of total exemptions, include pregnancy, caring for someone who is incapacitated, short-term incapacity, receiving unemployment benefits, receiving education and training full-time, participating in an alcohol or drug treatment program and American Indian / Alaska Natives. American Indian / Alaska Natives are subject to the requirements but will be phased in at a later date. ↩︎
  12. The same court also will decide whether HHS’s re-approval of Kentucky’s Section 1115 waiver exceeded the Secretary’s Section 1115 authority. Decisions in both cases are expected simultaneously. The Kentucky decision will address whether HHS has been able to successfully remedy the errors in the original Kentucky waiver approval. This issue bears on whether HHS might be able to similarly correct any errors in the original Arkansas waiver approval. ↩︎
Poll Finding

Data Note: Public’s Experiences With Electronic Health Records

Authors: Cailey Muñana, Ashley Kirzinger, and Mollyann Brodie
Published: Mar 18, 2019

Using data from the January 2019 KFF Health Tracking Poll, this data note examines the public’s attitudes about and experiences with electronic health records (EHRs). At the beginning of the health care reform debate in 2009, KFF polls showed the public held mixed views of EHRs. Most said it would improve care (67 percent), but fewer believed it would reduce health care costs (22 percent) and large shares had privacy concerns (59 percent). While there has been a significant increase in the implementation of EHRs since 2009, mostly driven by federal legislation mandating that health care providers adopt EHRs, the January 2019 KFF Health Tracking Poll finds the public remains concerned about privacy issues.

Over the past decade, the share of Americans who say their doctors or other health providers routinely enter their information into electronic health records has nearly doubled from 46% to 88%.

Electronic Health Records

EHRs have become ubiquitous, with an increasing share of the public reporting that their health provider usually enters their health information into a computer-based medical record. Since 2009, this share has almost doubled, from 46 percent in 2009 to 88 percent in 2019.

Figure 1: Majority Of The Public Now Says Their Physician Uses A Computer-Based Medical Record

Perceptions of how EHRs Have affected quality of care

Among those whose physician uses an electronic health record (88 percent of the public), large shares say that their physician’s use of an EHR has made the quality of care they receive and their interactions with their physician “better” (45 percent and 44 percent, respectively). Similar shares (47 percent, both) say the quality of care they receive and their interactions with their physician have “stayed the same” while few say that EHRs have made the quality of care they receive or their interactions with their physician “worse” (six percent and seven percent, respectively).

Figure 2: Few Say Electronic Health Records Have Made Their Patient Experience Worse

Perceptions of how EHRs have affected their patient experience differ among age groups, with the youngest group reporting the most positive effects on their experiences. For example, a majority (57 percent) of adults ages 18-29 say that the quality of care they receive is “better,” while none say that it is “worse” as a result of their physician using a computer-based medical record.

Figure 3: Few Say Electronic Health Records Have Made Health Care Experience Worse, Majority Of Young Adults Say It Has Improved Quality

Electronic Health Record Concerns: Privacy and Errors

While there is wide acceptance among the public for the use of EHRs, some concerns about privacy and accuracy of records remain.

Over half of those with EHRs (54 percent) report feeling “very concerned” or “somewhat concerned” that an unauthorized person might get access to their confidential medical records and information. This is a slight decrease from the share who reported feeling concerned in 2016 (60 percent).

Most patients who have electronic health records say they are concerned about unauthorized people accessing their confidential information, @KaiserFamFound poll finds

Younger adults are less likely to express privacy concerns compared to other age groups. Four in ten adults (42 percent) between the ages of 18-29 report being either “very” or “somewhat” concerned that an unauthorized person might get access to their records compared to more than half for older age groups.

Figure 4: More Young Adults Say They Are Not Concerned About Unauthorized People Accessing Confidential Medical Information

In addition, nearly half (45 percent) report feeling “very concerned” or “somewhat concerned” that there are errors in their personal health information that may negatively affect their care, compared to a larger share (54 percent) who say they are “not too concerned” or “not at all concerned.”

Figure 5: Nearly Half Are Concerned That Errors In Medical Information May Negatively Affect Care

While nearly half of those with EHRs are concerned about errors in their records (40 percent of total), one in five overall (21 percent) say that they or a family member have noticed an error in their EHR. The most-reported errors are incorrect medical history (9 percent); fewer report incorrect personal information (five percent), incorrect lab or test results (three percent), incorrect medication or prescription information (three percent), and billing issues (less than one percent).

Figure 6: One In Five Have Noticed An Error In Their Electronic Health Record
News Release

Most Medicare Beneficiaries Lack Dental Coverage, and Many Go Without Needed Care

Published: Mar 13, 2019

Almost two-thirds of Medicare beneficiaries (65%), or nearly 37 million people, do not have dental coverage and many go without needed care, according to a new KFF brief on dental coverage and costs for Medicare beneficiaries. Rates are even higher among black and Hispanic beneficiaries, and those with low incomes.

Medicare does not cover routine preventive dental care or more expensive dental services that are often needed by older adults. Lack of dental care can lead to delayed diagnosis of serious health conditions, preventable infections and complications, chronic pain, and costly emergency room visits.

About one-third of all Medicare beneficiaries have access to some dental coverage through Medicare Advantage, Medicaid or private dental plans. Like many private plans for working-age adults, these plans tend to cover most lower-cost preventive services, but have less generous coverage for more expensive services, and are often subject to annual dollar caps on covered services. Even with dental insurance, people of all ages can face high out-of-pocket costs for dental treatments.

The new analysis finds that almost half of all Medicare beneficiaries did not have a dental visit within the past year (49%). Roughly one in five beneficiaries (19%) who used dental services spent more than $1,000 out-of-pocket on dental care in 2016.

The brief reviews the state of oral health for people on Medicare. It describes the consequences of going without dental care, current sources of coverage, use of dental services and out-of-pocket spending. These ongoing challenges have heightened interest among policymakers in finding ways to make dental care more affordable and accessible for the Medicare population.

Drilling Down on Dental Coverage and Costs for Medicare Beneficiaries

Authors: Meredith Freed, Tricia Neuman, and Gretchen Jacobson
Published: Mar 13, 2019

Issue Brief

NOTE: A newer version of this analysis is available here. Due to a data collection and processing issue identified by CMS, the estimates for private dental coverage derived from the 2016 Medicare Current Beneficiary Survey (MCBS) were lower than they should have been by an unknown magnitude. As a result, the estimate of how many beneficiaries lack dental coverage (65%) should not be used. It is not possible to calculate a correct estimate for that year due to the MCBS data collection issue. CMS resolved this issue in 2017. Due to this and other methodological changes in our analysis, estimates of the number of people on Medicare with dental insurance cannot be trended using our 2016 estimate. Please see the methodology here for more information.

Oral health is an integral part of overall health, but its importance to overall health and well-being often goes unrecognized.1  Untreated oral health problems can lead to serious health complications. Having no natural teeth can cause nutritional deficiencies and related health problems.2  Untreated caries (cavities) and periodontal (gum) disease can exacerbate certain diseases, such as diabetes and cardiovascular disease, and lead to chronic pain, infections, and loss of teeth.3  Lack of routine dental care can also delay diagnosis of conditions, which can lead to potentially preventable complications, high-cost emergency department visits, and adverse outcomes.

Medicare, the national health insurance program for about 60 million older adults and younger beneficiaries with disabilities, does not cover routine dental care, and the majority of people on Medicare have no dental coverage at all. Limited or no dental insurance coverage can result in relatively high out-of-pocket costs for some and foregone oral health care for others. This brief reviews the state of oral health for people on Medicare. It describes the consequences of foregoing dental care, current sources of dental coverage, use of dental services, and related out-of-pocket spending.

Key Findings

  • Almost two-thirds of Medicare beneficiaries (65%), or nearly 37 million people, do not have dental coverage (Figure 1).
Figure 1: Most people on Medicare do not have dental coverage, and many go without needed care
  • Almost half of all Medicare beneficiaries did not have a dental visit within the past year (49%), with higher rates among those who are black (71%) or Hispanic (65%), have low incomes (70%), and are living in rural areas (59%), as of 2016.4 
  • Almost one in five Medicare beneficiaries (19%) who used dental services spent more than $1,000 out-of-pocket on dental care in 2016.

The Health and Economic Consequences of Unmet Need

Numerous studies confirm the direct connection between oral health and overall health.5 ,6  Oral health is often a reflection of the overall health of the body.7  Oral health examinations can identify nutritional deficiencies, HIV, certain microbial infections, and some cancers.8 ,9  In addition to reflecting underlying disease, poor oral health can exacerbate general health issues and systemic diseases. Periodontal disease, or advanced gum disease, is associated with increased risk of cardiovascular diseases, including arteriosclerosis, coronary heart disease, and stroke,10 ,11 ,12  increased risk of mortality for those with chronic kidney disease,13  adverse pregnancy outcomes,14  increased risk of cancer,15 ,16  and poor glycemic control for diabetes.17 ,18  The chronic systemic inflammation and dysbiosis (bacterial imbalances in the mouth) that are characteristic of periodontal disease can exacerbate these conditions. For example, inflammation and dysbiosis may generate immune responses that increase the risk of cancer as well as contribute to insulin resistance that makes diabetes management more difficult.19 ,20 ,21 

Oral health issues pose particular concerns for older adults. For example, xerostomia (dry mouth) is a side effect for hundreds of medications. Dry mouth significantly increases the risk of dental caries, loosening dentures that can lead to painful ulcerations, difficulty chewing or swallowing and altered taste, which can negatively impact nutrition, as well as a series of other oral health issues such as recurrent oral thrush and lesions on the oral mucosa.22  Incidence of dry mouth increases with the number of medications used, and is a particular concern for seniors: 54 percent of adults age 65 and older take at least four prescription drugs.23 ,24 ,25 

Among adults 65 and older residing in the community, 15 percent are edentulous, meaning they have no natural teeth (Figure 2).26  The share of older adults without natural teeth increases with age, from 12 percent among those 65 to 74 years old to 20 percent for 75 to 80 year olds. Edentulism is also more common among seniors with low incomes. While edentulism among all older adults has declined over time, the greatest declines have been among primarily high income populations.27  For example, almost one in three of those with incomes below 100% of the federal poverty level (30%) have no natural teeth, a rate five times higher than those with incomes over 400% of the federal level (6%).28  There is also significant geographic variation in the number of older adults without teeth. For example, more than 30 percent of seniors in West Virginia have no natural teeth, compared to less than 10 percent in states such as California and Connecticut.29 

Figure 2: 15 percent of adults ages 65 and older have no natural teeth

Having no or few teeth can adversely impact quality of life. Many older adults report being embarrassed about their teeth, avoid smiling, and even reduce social participation due the condition of their mouth and teeth.30  Furthermore, having no or few teeth can make chewing and eating difficult and can lead to additional health complications. Among all Medicare beneficiaries living in the community, 18 percent have some difficulty chewing and eating solid foods due to their teeth – a rate that rises to 29 percent for those with low incomes and 33 percent for adults with disabilities on Medicare who are under age 65.31  Tooth loss also affects nutrition because people without teeth are more likely to substitute easier to chew foods that are high in saturated fat and cholesterol for fruits and vegetables which are harder to chew.32 ,33 

Older adults also have high rates of untreated caries and periodontal disease, which negatively affect oral and overall health: more than 14 percent of older adults have untreated caries34  and about 2 in 3 (68%) have periodontal disease.35  If left untreated, caries and periodontal disease can lead to infections, abscesses, tooth loss, and chronic pain.36  Many older adults report having frequent painful aching in their mouths, with 15 percent having painful aching at least occasionally.37 

Poor oral health is associated with potentially preventable and costly emergency department (ED) visits, with more than 2 million visits to the ED each year among people of all ages due to oral health complications.38  Many dental-related ED visits are for potentially avoidable, non-traumatic dental conditions and could be treated in a primary care setting.39 ,40  However, further research is needed that focuses specifically on the Medicare population and their use of EDs for dental-related issues, including how lack of dental coverage may impact potentially preventable ED use.

Many People on Medicare Forego Non-Emergency Dental Care

A relatively large share of people on Medicare go without needed dental care. The American Dental Association recommends at least one annual visit per year, but suggests more frequent visits depending on the health status and dental needs of individual patients.41  Yet, almost half of all Medicare beneficiaries did not have a dental visit in 2016 (49%) – with even higher rates reported among those who are black or Hispanic, have low incomes, are in relatively poor health, and live in rural areas (Figure 3).

Figure 3: Nearly half of Medicare beneficiaries did not visit the dentist in the past year
  • In 2016, more than seven in ten black beneficiaries (71%) and nearly two in three Hispanic beneficiaries (65%) went without a dental visit in the past year, compared to 43 percent of white beneficiaries;
  • Seven in ten beneficiaries living on incomes of less than $10,000 per year (70%) reported not going to the dentist within the past year, compared to 27 percent of beneficiaries with incomes over $40,000 per year;
  • More than six in ten beneficiaries in self-reported fair or poor health did not go to the dentist in the past year (63%), as compared to 37 percent of beneficiaries in excellent or very good health;
  • More than six in ten beneficiaries younger than 65 with disabilities (62%) went without a dental visit in the past year; and
  • Nearly six in ten (59%) beneficiaries living in rural areas did not see a dentist in the past year, compared to 46 percent of beneficiaries living in metropolitan areas.

Many Medicare beneficiaries go without dental care due to costs. Overall, 10 percent of all beneficiaries did not get needed dental care in the past year because they could not afford it (Figure 4). The rate was higher among those with low incomes (18%), those in relatively poor health (24%), and beneficiaries under 65 with long-term disabilities (26%). While cost is often cited as top reason for not going to the dentist among those who said they needed care but did not go, fear of the dentist, inconvenient location or time for an appointment are also important contributing factors.42 

Figure 4: Medicare beneficiaries with low incomes, in poor health, and under age 65 with disabilities are most likely to go without needed dental care due to costs

Older adults also encounter additional challenges accessing oral health care, including dental health professional shortages, transportation challenges, and health literacy issues. Approximately 46 million people of all ages live in dental health professional shortage areas, 66 percent of which are considered rural.43 ,44  Many older adults and adults with disabilities cite transportation as an important barrier to accessing health care, which disproportionately affects certain populations, such as those living in rural areas and those with low-incomes.45  Oral health literacy continues to be an issue as many do not understand the importance of oral health, how to prevent oral health diseases, and how to obtain dental care.46 

Beneficiaries with Significant Dental Needs May Incur High Out-of-Pocket Costs, If They Seek Treatment

The vast majority (89%) of beneficiaries who received dental services paid for some of their care out-of-pocket (Figure 5). Across all beneficiaries, average out-of-pocket spending on dental care was $469 in 2016, and among those who used any dental services, average out-of-pocket spending on dental care was $922. Almost one-fifth of beneficiaries who used dental services (19%) spent more than $1,000 out-of-pocket on dental care. With half of Medicare beneficiaries living on less than $26,200 per year, this is a significant portion of their incomes.47  Only a small percentage (11%) used dental services without incurring any out-of-pocket costs. Medicare beneficiaries who used dental services may or may not have had dental insurance, including dental coverage through Medicare Advantage, Medicaid, or private plans.

Figure 5: Nearly one in five Medicare beneficiaries who used any dental services spent more than $1,000

As might be expected, average out-of-pocket spending on dental care rises with income because higher income beneficiaries are more able to afford such expenses, not because they have greater dental needs. Conversely, lower income beneficiaries are more likely to forego needed dental care. Among dental users, one in four beneficiaries (25%) living on incomes of less than $10,000 per year spent more than $500 out-of-pocket per year on dental care. Among those living on $10,000-$20,000 per year, more than 28 percent spent more than $500 out-of-pocket on dental care. The share of beneficiaries spending more than $500 out-of-pocket on dental care rises to 29 percent for those living on $20,000-$40,000 per year to 34 percent for those living on more than $40,000 per year.

Current Sources of Dental Coverage

Since its establishment in 1965, Medicare has explicitly excluded coverage for dental services, except in very limited circumstances.48  Traditional Medicare does not cover routine preventive dental services (such as exams, cleanings, or x-rays), nor minor and major restorative services (such as fillings, crowns, or dentures; Figure 6).

Figure 6: Medicare covers limited dental services

Medicare coverage is limited to dental services that are an integral part of a covered procedure, extractions done in preparation for radiation treatment for cancers involving the jaw, and oral examinations (but not treatment) preceding kidney transplants or heart valve replacements.49  Medicare also covers hospital care (such as emergency department visits) resulting from complications of a dental procedure, but does not cover the cost of the dental care itself.50  Current coverage policy for dental care is not completely clear or consistent, and the Medicare program is reviewing its authority to provide additional services.51 

Nearly 37 million people, or almost two in three Medicare beneficiaries (65%), do not have any form of dental coverage (Figure 7). Beneficiaries without any form of dental coverage are more likely than others to go without needed dental care, unless they can afford to cover the costs out-of-pocket.52 ,53 

Figure 7: Almost two-thirds of all people on Medicare have no dental coverage

The remaining Medicare beneficiaries have access to dental coverage through Medicare Advantage plans, Medicaid, and private plans, including employer-sponsored retiree plans and individually purchased plans. In 2016, about 10.2 million beneficiaries (18%) had access to some dental coverage through Medicare Advantage (including approximately 1.2 million enrollees who also have access to dental coverage through Medicaid). An estimated 6.2 million low-income Medicare beneficiaries (11%) had access to dental coverage through Medicaid (including the aforementioned who also have coverage through Medicare Advantage plans), and 4.5 million (8%) had coverage through private plans.

Scope of Coverage

The scope of dental coverage and affordability of dental care is an issue for people of all ages. Private dental insurance plans, primarily for working-age adults, vary in terms of benefits and cost-sharing, but typically provide limited coverage for high-cost treatments. Private dental insurance tends to cover most, if not all costs, associated with preventive services, but has less generous coverage for more expensive services, exposing patients to high out-of-pocket costs for needed dental care. For example, in these private dental plans, preventive care is generally 100% covered, while co-insurance for minor and major restorative services often ranges from 20-40% for basic procedures and up to 50% or more for major procedures.54  Further, private dental plans often impose an annual dollar cap on the amount the plan will pay toward covered services, with a median cap of about $1,500.55  Thus, even with dental insurance, people of all ages can face high out-of-pocket costs for dental treatments, an issue that also affects people on Medicare.

In the following sections, we review current sources of dental coverage that may be available to people on Medicare, including Medicare Advantage, Medicaid, and private dental plans (employer-sponsored retiree and individually purchased).

MEDICARE ADVANTAGE

Many Medicare Advantage plans provide access to dental coverage as a supplemental, non-Medicare covered benefit.56  In 2016, 60 percent of Medicare Advantage enrollees, or about 10.2 million beneficiaries, had access to some dental coverage (Figure 8).57  The remaining 40 percent of all Medicare Advantage enrollees, or almost 7 million beneficiaries, did not have access to dental coverage under their plan.

Figure 8: Most Medicare Advantage enrollees have access to coverage of some dental care through their plan

About four in ten (42%) Medicare Advantage enrollees had access to both preventive and more extensive dental benefits, while about one in five (19%) had access to preventive dental benefits only, which would exclude coverage of benefits many older adults need such as fillings, crowns, implants and dentures.58  Preventive dental coverage under Medicare Advantage plans generally includes oral exams, cleanings, fluoride treatments, and dental x-rays.

Additional Premiums for Dental Coverage. Some Medicare Advantage plans charge an additional premium for dental benefits, and enrollees must pay that premium in order to receive the dental coverage. No data are available about how many people take up this option when a premium is required. Overall, almost three in ten (29%) Medicare Advantage enrollees with access to dental benefits under their plan may be required to pay a monthly premium, averaging $284 per year in 2016, for the plan dental benefits. Premiums are more common in plans that offer coverage beyond preventive dental coverage: almost four in ten (38%) enrollees in plans that offered both extensive and preventive dental coverage may be required to pay a premium for that coverage, compared to less than one in ten enrollees (8%) in plans that provided only preventive coverage. Premiums for Medicare Advantage dental benefits in 2016 ranged from about $72 per year to more than $720 per year. Dental premiums are in addition to premiums for other Medicare Advantage benefits, as well as the Medicare Part B premium.

Cost-Sharing. Medicare Advantage plans’ cost-sharing for dental benefits varies widely from plan-to-plan and across counties. Some plans require no cost-sharing for preventive services but charge a monthly premium, while other plans require enrollees to pay a flat co-pay (e.g., $5) for each preventive service. Similarly, for relatively extensive benefits, some plans cover most of the cost of some benefits (e.g., dentures) and others charge a flat coinsurance rate (e.g., 50%) for all services. Plans charge coinsurance rates that often range greatly – from 20-70% – and some plans require flat copayments instead of coinsurance.59 

Annual Caps on Coverage and Service Limits. Medicare Advantage plans that offer access to preventive and more extensive dental benefits commonly cap the total amount the plan will pay for dental care. Of the 7 million Medicare Advantage enrollees in plans that offered both preventive and more extensive dental benefits, about four in ten (43%) are in plans with dollar limits on coverage, and most plans had limits around $1,000.60  Coverage limits are far more common among plans that cover both preventive and more extensive benefits than plans that cover only preventive services. In addition to dollar limits, Medicare Advantage plans typically limit the number of services covered (e.g., one periodontal exam every three years).

MEDICAID

Medicaid is a source of dental coverage for some low-income Medicare beneficiaries dually eligible for Medicaid (known as “dual eligibles”), but only in the states that elect to provide a dental benefit to adults. In 2016, approximately 10 million Medicare beneficiaries qualified for Medicaid, with 7 million qualifying as full dual eligibles and 3 million as partial dual eligibles.61  Full dual eligibles are generally eligible to receive full Medicaid benefits, such as dental, when it is covered by that state, whereas partial dual eligibles generally receive assistance from Medicaid with Medicare premiums and/or cost-sharing, but not other benefits. State Medicaid programs are not required to cover dental benefits for adults because it is an optional benefit, and can choose to provide the benefit to some but not all dual eligibles.

Among full dual eligibles, almost nine in ten (88%) lived in a state where they were eligible for some dental benefits from Medicaid.62  However, the range in covered benefits varies significantly across states. For example, some states only offer preventive benefits, such as Kansas, Maine, and North Dakota, which allow a limited number of exams and cleanings per year. A number of states offer more extensive coverage, but have annual dollar caps on benefits and may require prior authorization for certain procedures. There also some states, such as Georgia and Oklahoma, which limit coverage to emergency dental visits only. States that offer emergency-only benefits may not provide much additional coverage than what is currently covered by traditional Medicare. About one-tenth of dual eligibles (12%), or 800,000 people, resided in the 6 states that provided no dental coverage through Medicaid in 2016 (Alabama, Delaware, Maryland, Tennessee, Texas, Virginia).

In addition to the 800,000 full dual eligibles who do not have dental coverage through Medicaid, another 3 million partial dual eligibles do not have Medicaid dental coverage because they are not eligible for Medicaid-covered benefits. Overall, 3.8 million low-income people who qualify for Medicaid did not have dental coverage through Medicaid in 2016 (Figure 9).

Figure 9: Most full dual eligibles have some dental coverage through Medicaid, but partial dual eligibles have none

State dental benefits can change over time, particularly in response to budget pressures, since dental coverage for adults is an optional Medicaid benefit. For example, in California, adult dental benefits were cut in 2009 due to budget constraints, partially restored in 2014, and fully restored in 2018.63 ,64  In 2018 and 2019, two states (California, Illinois) enhanced or added dental benefits for all adults, while three states enhanced benefits for certain adult populations (Arizona’s applies to Non-Long Term Services and Supports (LTSS) adults, Utah’s applies to only those with disabilities, and Maryland’s applies only to full dual eligibles). Six states (Alaska, Connecticut, Iowa, Kentucky, Oklahoma, Nevada) restricted adult dental benefits.65 

Overlap of Dental Coverage for Dual Eligibles

Some beneficiaries covered by both Medicare and Medicaid are also able to access dental care through Medicare Advantage plans. In total, approximately 2.4 million full and partial dual eligibles (1.4 million full dual eligibles and 1.0 million partial dual eligibles) were enrolled in Medicare Advantage plans that provided access to dental coverage in 2016.66  However, premiums and cost-sharing for dental benefits may still present a significant hurdle and may make the coverage unaffordable, particularly if Medicaid does not cover these costs. About one in ten (11%) dual eligibles were in plans that charged an additional premium for dental coverage, which would be in addition to any cost-sharing for the dental care.

About 1.2 million full dual eligibles lived in states that offer some dental coverage through Medicaid and were enrolled in Medicare Advantage plans that offer access to some dental coverage. While these beneficiaries have more than one option for dental coverage, coordinating Medicaid dental coverage and dental coverage through Medicare Advantage plans, and specifically, figuring out the circumstances under which each coverage option would pay for particular services, can be especially complicated and murky.

PRIVATE INSURANCE

Medicare beneficiaries may also receive dental benefits through private plans such as employer-sponsored retiree plans or through individually purchased plans. In 2016, about 4.5 million Medicare beneficiaries received dental coverage through private plans.67 

Unfortunately, data describing dental coverage under employer-sponsored retiree and individually purchased plans for people on Medicare are limited. For example, nearly 10 million beneficiaries in traditional Medicare had employer-sponsored retiree insurance.68  However, there are no known data sources that convey how many of these plans cover dental benefits, or the level of dental coverage these plans provide.

Medicare beneficiaries can purchase individual dental policies directly through companies such as DeltaDental, United Healthcare, Cigna, and BlueCross BlueShield. These plans vary in terms of premiums, covered benefits, cost-sharing requirements, annual service limits, and annual benefit caps. Based upon company websites, annual caps appear to be similar to those offered by Medicare Advantage plans.

Older Adults Can Incur Substantial Out-of-Pocket Costs for Dental Care, Even with Insurance: Three Scenarios

Even with dental insurance, older adults can face substantial out-of-pocket costs for their dental care. While the scope of dental coverage varies, it is often the case that out-of-pocket costs may be relatively low for people who simply need routine check-ups and cleanings. However, people who need more extensive oral health services can incur relatively high costs for their dental care, on top of premiums and other out-of-pocket medical expenses, due to coinsurance requirements and annual caps.

We developed the following scenarios, with input from oral health experts, to demonstrate the range in potential costs older adults may face for common dental services, based on fees obtained from the American Dental Association (ADA) 2018 Survey of Dental Fees. The scenarios, based on national, median fees, are designed to be illustrative, recognizing that fees vary by a number of factors, including geography and the negotiated rates established between dentists and insurers. (See Table 4 for a detailed description of services and fees for each of the three scenarios.)

Scenario 1: Linda, age 67, is in excellent health and visits her dentist regularly. In a typical year, such as last year, Linda has one dental visit with an oral exam, cleaning, and x-rays, and a follow-up exam and cleaning six months later.

Without dental coverage, the total cost of Linda’s procedures would be about $350, based on national median fees derived from the 2018 ADA survey of dental fees. If Linda had coverage through a private, dental insurance plan – either a dental plan that she purchased directly or through a Medicare Advantage plan – her out-of-pocket costs would be relatively low because dental insurance often covers a large portion of preventive dental costs. Even if her dental plan capped annual benefits, as many do, she would have limited expenses because annual caps are typically not less than $500. Linda could have paid a premium for her Medicare Advantage dental plan and premiums are on average $284 per year,69  varying based on the extent of coverage and other factors.

If Linda had coverage under both Medicare and Medicaid (dually eligible) and lived in a state that covered adult dental through Medicaid, she would most likely have limited, if any expenses, if she were able to find a dentist who treats Medicaid patients and lived in a state that covers more than one preventive visit per year.

Scenario 2: James, age 72, went to the dentist after realizing he hadn’t had an oral exam in close to two years. After what he hoped would be a routine check-up and cleaning, his dentist said he would need periodontal treatment, three fillings, and two crowns due to degradation of restorations. After receiving these restorative services, he returned six months later for a regular check-up where he received periodontal maintenance.

Without dental coverage, the total cost of James’ visits would be an estimated $4,300. If James had dental coverage through a private plan or Medicare Advantage, his costs would be lower, but he would still likely incur substantial costs. Some Medicare Advantage plans, for example, cover only preventive services, which would leave him with the biggest expenses to pay for on his own. Others cover both preventive and more extensive dental care, but require relatively high coinsurance for the most expensive procedures, and often with caps on the annual amount paid by the plan. Medicare Advantage plans often charge coinsurance, which ranges from 20%-70% depending on the type of service.70  If James had signed up for a Medicare Advantage plan, with dental coverage that included a common cap of $1,000, he would be responsible for all charges above the cap, or as much as $3,300.

If James qualified for Medicaid, he could potentially get some help with these expenses, if he lived in a state that covers both preventive and more extensive dental services for older adults.

Scenario 3: Dorothy, age 80, has diabetes, heart disease, and arthritis, and takes multiple medications to manage her medical conditions, some of which cause dry mouth. Because she was more focused on her other health problems, she had not been to a dentist in three years. Last year, she went to see a dentist at the suggestion of her physician after she complained of a dull throbbing pain in her lower left jaw. After a comprehensive exam and x-rays, her dentist told her that she needed a root canal and crown, and would need to have four upper teeth extracted. Her dentist recommended two implants to replace the extracted teeth, but when she heard what that would cost, she opted instead for a partial upper denture.

Without dental coverage, Dorothy’s dental bill would be about $4,700, assuming she opted for the less expensive removable partial denture, but closer to $10,000 for 2 implants, if not more, since the estimated costs of the implants exclude fees for the final restorations.71 

If Dorothy had coverage through a private plan or Medicare Advantage plan, her costs would be somewhat lower, but by how much would depend on the specific features of her dental plan. With a more extensive plan, she may or may not have coverage for specific services, such as dentures, which is a substantial portion of her bill. Plans typically require coinsurance for these procedures, meaning she would still have to pay a significant amount out of pocket for her care. Plans often have caps on coverage, which means Dorothy would be responsible for all costs above her limit, which would be close to $4,000 in a plan with a $1,000 annual cap, or close to $9,000 if she had chosen the implants, or possibly less if the plan negotiated lower rates.

If Dorothy qualified for Medicaid, she could get some coverage if she lived in one of the states that covers adult dental. However, state annual caps and coverage of certain procedures vary, including for dentures, so she still might pay a substantial amount of money out-of-pocket. Dorothy would also need to make a number of visits to the dentist for these procedures, which could be a barrier for many Medicare beneficiaries, especially those that face transportation challenges.

Discussion

Oral health is important to people of all ages, including older adults and younger Medicare beneficiaries with disabilities, but maintaining good oral health is often challenging. Medicare does not generally cover dental care, which can make dental procedures unaffordable. Some Medicare beneficiaries have access to dental coverage through Medicare Advantage plans, Medicaid, or private plans (employer-sponsored retiree or individually purchased policies), but, similar to private dental plans offered to working-age adults, coverage varies widely, is often less generous for procedures beyond routine preventive care, and is frequently subject to annual caps. Poor dental care and oral health lead to edentulism, untreated caries, and periodontal disease, which contribute to adverse health outcomes and high-cost preventable emergency room visits. These ongoing challenges heighten interest in finding ways to make dental care more affordable and accessible for the Medicare population.

A broad array of policy options could be considered to expand dental coverage to people on Medicare. Some advocates believe that the Centers for Medicare and Medicaid Services (CMS) currently has the authority to cover oral health care when medically necessary for treatment of Medicare-covered diseases, illnesses, and injuries, and at the request of members of Congress, the agency is reviewing this.72 ,73  Legislation that would have a broader scope is also under consideration. For example, during the 115th and 116th Congresses, some have proposed striking the dental exclusion and including dental services as a covered benefit.74  Others have considered a separate, voluntary dental benefit, similar to the Part D prescription drug benefit, with its own premium.75  An alternative approach could be to create a benefit exclusively for low-income beneficiaries, under Medicare or Medicaid. Each of these approaches would have budget implications, and raises questions concerning scope of coverage, cost-sharing, provider fees and administration. Thus far, the Congressional Budget Office has not estimated the cost of adding a dental benefit to Medicare. Given the significant health risks associated with poor oral care and the costs and consequences of untreated dental needs, identifying potential solutions to improve the oral health status of the Medicare population remains a challenge.

Kendal Orgera, a Policy Analyst with the Kaiser Family Foundation, and Anthony Damico, an independent consultant, provided programming support for this brief. The brief also benefited from the research support of Nadia Massad and Robbie Herman of the Howard University College of Dentistry, and comments from reviewers, including Cassandra Yarbrough and Marko Vujicic of the American Dental Association.

This brief was funded in part by the AARP Public Policy Institute.

Data And Methods

Data and Methods

This analysis uses data from the Medicare Current Beneficiary Survey (MCBS), 2016; Medicare Chronic Conditions Data Warehouse data from 5 percent of beneficiaries (5% Sample), 2016; and CMS Medicare Advantage Enrollment, Benefit, and Landscape files, 2016, with enrollment data from March of that year and excluding Puerto Rico. The analysis also uses data from the National Health Interview Survey (NHIS), 2017; National Health and Nutrition Examination Survey (NHANES), 2013-2016; Kaiser Family Foundation database of Medicaid Dental Benefits, 2018; and Center for Health Care Strategies’ (CHCS) Medicaid Adult Benefits data, 2018.

To determine dental coverage in Figure 7, we combined data from multiple sources. The 5% Sample and the Medicare Advantage Benefit files were used to determine the number of Medicare Advantage enrollees with access to dental coverage. Both data sets were restricted to beneficiaries with both Parts A and B in March of 2016 and excluded US territories. The 5% Sample, combined with data from the KFF database of Medicaid Dental Benefits and CHCS, was used to calculate the number of dual eligibles with some dental coverage based on whether they lived in a state that offered dental benefits through Medicaid. 2016 is the most recent year of data available for the 5% Sample and was used to estimate Medicaid dental coverage, based on 2018 dental benefits in each state. Private dental coverage was calculated using the MCBS responses to questions about whether a beneficiary has dental coverage, and the total with private dental coverage includes community beneficiaries who answered affirmatively. Beneficiaries residing in nursing homes and other facilities were not asked the question in the MCBS, which excluded approximately 792,000 non-Medicare Advantage, non-dual beneficiaries; the Medicare Advantage and dual eligible statistics from the 5% Sample include beneficiaries residing in facilities.

To examine the scope of dental coverage offered by Medicare Advantage plans in greater detail, we reviewed 2019 Medicare Advantage plans with the highest enrollment in 6 large metropolitan counties: San Diego, CA; Harris, TX; Cook County, IL; Miami-Dade, FL; Philadelphia, PA; Charleston, SC; and 2 rural counties: Jefferson, OR and Wayne, OH. For this subanalysis, we selected the 8 counties based on geographical region, differences in population and density, where at least 1,000 people were enrolled in Medicare Advantage plans, and at least 3 firms offered plans. In each of the 8 counties, the 3 largest plans offered were selected, with no more than one plan from a firm. The subanalysis examined a variety of aspects of Medicare Advantage plans including premiums, annual caps, coinsurance/co-pays, covered services, networks, sub-contracting of dental networks, among others. Special Needs Plans and Employer-sponsored Group Waiver Plans were excluded.

NHANES 2013-2016 was used to define edentulism as no permanent tooth present and no dental root fragments present. If the tooth was recorded as not being present, it was marked as edentulous. NHANES 2015-2016 was used to define untreated caries. Untreated caries were defined differently in 2013-2014 and 2015-2016, so only 2015-2016 was used in this analysis. Untreated caries were defined as permanent teeth with a carious surface condition. Only individuals with at least one tooth present were included in the analysis. Decay in the root (i.e., root caries) was not included. In both analyses, third molars and dental implants were excluded.

Tables

Table 1: Medicare Beneficiaries Who Did Not Visit a Dentist in the Past Year and Beneficiaries’ Out-of-Pocket Spending on Dental Care, Among Dental Users
Number of Medicare Beneficiaries (in millions of people)No Dental Visit in Past Year

Beneficiaries’ Out-of-Pocket Spending on Dental Care, Among Dental Users

Any Dental Spending(in millions of people)Total$0$1 – $500$501 -$1000$1001 -$2000$2001 or More
Overall56.449%28.7$92211%59%12%8%11%
Age
Under 65 years8.762%3.3$71322%60%7%5%7%
65-74 years28.044%15.7$95010%59%11%9%11%
75-84 years14.047%7.3$9669%57%14%8%13%
85+ years5.756%2.5$8946%62%14%9%9%
Gender
Men25.751%12.6$97710%57%12%9%12%
Women30.747%16.1$87911%60%11%8%10%
Race/Ethnicity
White42.143%23.8$9648%60%12%9%11%
Black5.471%1.5$70623%55%7%6%9%
Hispanic5.065%1.7$66136%44%7%3%10%
Other3.658%1.5$73317%59%11%3%11%
Income
Less Than $10,0007.370%2.1$73223%51%9%8%8%
$10,000 – $19,99914.266%4.8$93116%56%11%8%9%
$20,000 – $39,99917.747%9.4$9759%61%12%7%11%
$40,0000 or above17.227%12.4$9117%59%12%9%13%
Geographic Area
Metropolitan44.946%23.8$97311%57%12%8%12%
Rural Micropolitan7.559%3.2$7456%66%9%9%9%

Rural Adjacent or Nonadjacent

4.169%1.7$5389%69%8%8%6%
Health status
Excellent 8.833%5.8$75910%58%13%11%8%
Very Good15.740%9.4$9767%59%12%9%13%
Good15.952%7.6$91412%60%10%8%10%
Fair8.562%3.1$87917%56%10%5%11%
Poor2.964%1.0$71817%55%9%7%12%
NOTE: Excludes beneficiaries in long-term care facilities as they do not collect data on dental utilization.Numbers may not sum due to rounding. Income numbers have been adjusted to align with the Urban Institute Dynasim model.SOURCE: Kaiser Family Foundation analysis of Medicare Current Beneficiary Survey (MCBS) Cost Supplement, 2016.
Table 2: Medicare Beneficiaries Who Needed Dental Care, But Could Not Afford It, by Selected Characteristics
Number of Medicare Beneficiaries(in millions)Share Who Could Not Afford Dental Care in theLast 12 Months
Overall54.710%
Age
Under 65 years7.826%
65-74 years27.39%
75-84 years14.46%
85+ years5.24%
Gender
Men24.510%
Women30.211%
Race/Ethnicity
White41.79%
Black5.612%
Hispanic4.815%
Other2.710%
Income
<100% FPL6.319%
100-200% FPL12.018%
200-400% FPL17.59%
400%+ FPL18.94%
Health status
Excellent/Very Good22.75%
Good/Fair28.212%
Poor3.824%
NOTE: Numbers may not sum due to rounding. In 2017, 100% of the federal poverty level was $11,756 for an individual and $14,828 for a couple older than 65.SOURCE: Kaiser Family Foundation analysis of the National Health Interview Survey (NHIS), 2017, which excludes institutional residents.
Table 3: Dental Benefits for Dual Eligibles Under Medicaid and for Medicare Advantage Enrollees (in thousands of beneficiaries)
 Dental Benefits for Dual Eligibles Under MedicaidDental Benefits for Medicare Advantage Enrollees
StateDental Benefit CoveredTotal Dual Eligibles*Full Dual Eligibles with Some Dental BenefitsLimits on ServicesTotal Medicare Advantage Enrollment% With Access to Dental Coverage
National9,9956,21816,92560%
AlabamaNo2030No dental benefit25560%
AlaskaYes1515Must have PAN/AN/A
ArizonaYes185138$1000 limit for emergency dental services, $1000 comprehensive benefit for ALTCS members43361%
ArkansasYes12932Limited mix of services -fewer than 100 diagnostic, preventive, and minor restorative procedures; annual expenditure for care is $1,000 or less12074%
CaliforniaYes1,2781,238$1,800 cap on services/year; does not apply to emergency services or to residents of nursing facilities, cap can be exceeded with PA2,22957%
ColoradoYes10867$1,000 benefit maximum. Limitations apply depending on the dental procedure.28845%
ConnecticutYes16773$1000 annual benefit maximum unless medically necessary. Also excludes dental surgery, dentures and some dental treatment.16778%
DelawareNo280No dental benefit1766%
DCYes3020Some procedures require PA1271%
FloridaYes764371Problem focused visits, extractions, pain management, and dentures based on medical necessity1,64472%
GeorgiaYes294125Emergency dental visits only50871%
HawaiiYes3137Emergency treatment11544%
IdahoYes4527No limits9058%
IllinoisYes329283Extensive mix of services – more than 100 diagnostic, preventive, and minor and major restorative procedures; annual expenditure cap for care is at least $1,00040852%
IndianaYes191110PA for specified services Exam and cleaning 1/year (2/year for nursing facility residents), x-rays vary by type, periodontia limited27765%
IowaYes8465Extensive mix of services – more than 100 diagnostic, preventive, and minor and major restorative procedures; annual expenditure cap for care is at least $1,0009934%
KansasYes61381 exam/cleaning per 6 months; x-rays vary by type;1 crown per 5 years6683%
KentuckyYes16487Comprehensive exam – 1 per year, x rays vary by type, prophylaxis limited by age, all other limited by age22758%
LouisianaYes206108Limited to following services: Examination; Radiographs; Complete Dentures Denture relines Denture repairs; Acrylic Partial Dentures25092%
MaineYes84492 exams with cleaning/year but only 1 in 150 days; 1 orthodontia treatment7561%
MarylandNo1370No dental benefit9068%
MassachusettsYes297275No limits24726%
MichiganYes295248Frequency limits on most services. Some services require PA.62443%
MinnesotaYes133116Non-pregnant adults receive limited benefits. Exams and cleanings limited to 4 times per year; x-rays vary by type50540%
MississippiYes16178$2500 annual maximum8398%
MissouriYes171132Traditional Medicaid Adults have dental coverage under a limited dental package33485%
MontanaYes2616$1,125 annual maximum benefit; Aged, Blind, Disabled not subject to annual cap; Diagnostic, Preventive, and Anesthesia don’t count toward cap4057%
NebraskaYes3934Dental coverage limited to $750 per fiscal year, excludes emergencies3831%
NevadaYes5326Emergency-Only15385%
New HampshireYes3019Emergency-Only2229%
New JerseyYes199172No limits24535%
New MexicoYes8551Most restorative services such as crowns are not covered for adults12036%
New YorkYes805663Extensive mix of services – more than 100 diagnostic, preventive, and minor and major restorative procedures; annual expenditure cap for care is at least $1,0001,24059%
North CarolinaYes313238Yes – Not Specified54148%
North DakotaYes14111 exam/evaluation per year 1 panoramic radiographic image every 5 years; 1 prophylaxis per year; 2 fluoride per year2217%
OhioYes333211Comprehensive adult dental coverage. Certain services require PA.73468%
OklahomaYes11190Emergency Extractions only11659%
OregonYes12478Prevention of dental disease states, limits on denture, crown, and periodontal coverage.33753%
PennsylvaniaYes441354Dental services limited to: Dentures – 1 per lifetime; Exams/prophylaxis – 1 per 180 days; Crowns, Periodontics, Endodontics only approved via exception1,01769%
Rhode IslandYes3831Not all codes covered7281%
South CarolinaYes149122Limited mix of services -fewer than 100 diagnostic, preventive, and minor restorative procedures; annual expenditure for care is $1,000 or less22191%
South DakotaYes2012$1,000 annual limit (emergency, preventive services, dentures exempt from $1,000 limit).3125%
TennesseeNo2740No dental benefit44268%
TexasNo6700No dental benefit1,16152%
UtahYes3528Pregnant, Blind or Disabled adult Medicaid members are allowed dental services. All others receive Emergency Dental Services only.11977%
VermontYes2820$510 per year for non-pregnant adults; limits on treatment for TMJ disorders and prophylaxis; Certain services required PA10N/A
VirginiaNo1830No dental benefit21868%
WashingtonYes184127Some may require PA35975%
West VirginiaYes8046Emergency services only10241%
WisconsinYes1601381 Exam/cleaning per year, certain services require PA40244%
WyomingYes107Preventive and emergency services only. No restorative2N/A
NOTES: Numbers may not sum due to rounding; numbers rounded to nearest thousands. N/A denotes sample size is too small to be reliable with fewer than 2,000 beneficiaries in the cell.*Includes Partial Dual Eligibles with No Coverage; PA – Prior Authorization2016 is the most recent year of data available for the 5% Sample of Medicare claims and was used to estimate Medicaid dental coverage, based on 2018 dental benefits in each state.6 States in the Kaiser Family Foundation analysis of state Medicaid benefits were listed as NR (No Response): IL, IA, NV, NH, NY, SC; in the Limits on Services section, AR was also listed as NR. State Medicaid benefits in these states came from the CHCS data.SOURCE: Kaiser Family Foundation analysis of the 5% Sample of Medicare claims, 2016; Kaiser Family Foundation. State Health Facts – Medicaid: Dental Benefits. 2018; The Center for Health Care Strategies. Medicaid Adult Dental Benefits: An Overview. Updated November 2018.
Table 4: Three Scenarios: Costs of Dental Procedures
Dental Treatment ScenariosServices ReceivedNational Median Fees
Scenario 1 
Linda, age 67, is in excellent health and visits her dentist regularly. In a typical year, such as last year, Linda has one dental visit with an oral exam, cleaning, and x-rays, and a follow-up exam and cleaning six months later.First Preventive Dental Visit
Periodic Oral Exam (D0120)$53
Prophylaxis (D1110)$95
4 Bitewing Radiographs Every 24-36 months (D0274)$67
Second Preventive Dental Visit
Periodic Oral Exam (D0120)$53
Prophylaxis (D1110)$95
Total Cost$363
Scenario 2 
James, age 72, went to the dentist after realizing he hadn’t had an oral exam in close to two years. After what he hoped would be a routine check-up and cleaning, his dentist said he would need periodontal treatment, three fillings, and two crowns due to degradation of restorations. After receiving these restorative services, he returned six months later for a regular check-up where he received periodontal maintenance.First Dental Visit
Periodic Oral Exam (D0120)$53
Periodontal Scaling and Root Planing – Four or MoreTeeth per Quadrant (D4341) ($259×4)$1,036
4 Bitewing Radiographs Every 6-18 months (D0274)$67
Follow-Up Restorative Dental Visits
#13 DO-Resin Based Composite-2 Surfaces Posterior (D2392)$239
#14 MO-Resin Based Composite-2 Surfaces Posterior (D2392)$239
#29 MOD-Resin Based Composite-3 Surface Posterior (D2393)$290
#3 Crown-Porcelain Fused to Noble Metal (D2752)$1,108
#30 Crown-Porcelain Fused to Noble Metal (D2752)$1,108
Second Preventive Dental Visit
Periodic Oral Exam (D0120)$53
Periodontal Maintenance (D4910)$145
Total Cost$4,338
Scenario 3 
Dorothy, age 80, has diabetes, heart disease, and arthritis, and takes multiple medications to manage her medical conditions, some of which cause dry mouth. Because she was more focused on her other health problems, she had not been to a dentist in three years. Last year, she went to see a dentist at the suggestion of her physician after she complained of a dull throbbing pain in her lower left jaw. After a comprehensive exam and x-rays, her dentist told her that she needed a root canal and crown, and would need to have four upper teeth extracted. Her dentist recommended two implants to replace the extracted teeth, but when she heard what that would cost, she opted instead for a partial upper denture.First Dental Visit
Comprehensive Oral Examination (D0150)$85
Panoramic X-Ray (D0330)$118
FMX (D0120)$138
Treatment Planning (D9450)$135
Prophylaxis (D1110)$95
Follow-Up Restorative Dental Visits
Endodontic Therapy, Molar #19 (D3330)$1,075
Crown #19 – Porcelain Fused to Noble Metal (D2752)$1,108
4 Extractions (D7140) ($180 x 4)$720
Maxillary Partial Denture with Resin Denture Bases (including any conventional clasps, rests, and teeth) (D5211)$1,300
Total Cost$4,774
NOTE: Fees do not assume negotiated discounts between dental providers and insurers.SOURCE: Kaiser Family Foundation analysis of the American Dental Association, 2018 Survey of Dental Fees, (Chicago, IL: American Dental Association, Health Policy Institute, 2018).

Endnotes

  1. U.S. Department of Health and Human Services. Oral Health in America: A Report of the Surgeon General. Rockville, MD: U.S. Department of Health and Human Services, National Institute of Dental and Craniofacial Research, National Institutes of Health, 2000. ↩︎
  2. Ibid. ↩︎
  3. Ibid. ↩︎
  4. Dental utilization rates are not consistent across nationally representative datasets and may vary depending on populations of interest and how utilization is measured. ↩︎
  5. U.S. Department of Health and Human Services. Oral Health in America: A Report of the Surgeon General. Rockville, MD: U.S. Department of Health and Human Services, National Institute of Dental and Craniofacial Research, National Institutes of Health, 2000. ↩︎
  6. IOM (Institute of Medicine) and NRC (National Research Council). 2011. Improving access to oral health care for vulnerable and underserved populations. Washington, DC: The National Academies Press. ↩︎
  7. U.S. Department of Health and Human Services. Oral Health in America: A Report of the Surgeon General. Rockville, MD: U.S. Department of Health and Human Services, National Institute of Dental and Craniofacial Research, National Institutes of Health, 2000. ↩︎
  8. Ibid. ↩︎
  9. IOM (Institute of Medicine) and NRC (National Research Council). 2011. Improving access to oral health care for vulnerable and underserved populations. Washington, DC: The National Academies Press. ↩︎
  10. Schenkein HA, Loos BG. Inflammatory mechanisms linking periodontal diseases to cardiovascular diseases. J Clin Periodontol 2013;40 (Suppl. 14):S51–S69 https://onlinelibrary.wiley.com/doi/epdf/10.1111/jcpe.12060 ↩︎
  11. Tonetti MS, Van Dyke TE. Periodontitis and atherosclerotic cardiovascular disease: consensus report of the Joint EFP/AAP Workshop on Periodontitis and Systemic Diseases. J Clin Periodontol 2013;40 (Suppl. 14):S24–S29. https://onlinelibrary.wiley.com/doi/epdf/10.1111/jcpe.12089 ↩︎
  12. Dietrich T, Sharma P, Walter C, Weston P, Beck J. The epidemiological evidence behind the association between periodontitis and incident atherosclerotic cardiovascular disease. J Clin Periodontol 2013;40 (Suppl. 14):S70–S84. https://onlinelibrary.wiley.com/doi/10.1111/jcpe.12062 ↩︎
  13. Sharma P, Dietrich T, Ferro CJ, Cockwell P, Chapple ILC. Association between periodontitis and mortality in stages 3–5 chronic kidney disease: NHANES III and linked mortality study. J Clin Periodontol 2016;43:104–113. https://onlinelibrary.wiley.com/doi/10.1111/jcpe.12502 ↩︎
  14. This may impact women who are under 65 with disabilities on Medicare. Madianos PM, Bobetsis YA, Offenbacher S. Adverse pregnancy outcomes (APOs) and periodontal disease: pathogenic mechanisms. J Clin Periodontol 2013;40(Suppl. 14):S170–S180. https://onlinelibrary.wiley.com/doi/epdf/10.1111/jcpe.12082. ↩︎
  15. Nwizu NN, Marshall JR, Moysich K, et al. Periodontal Disease and Incident Cancer Risk among Postmenopausal Women: Results from the Women’s Health Initiative Observational Cohort. Cancer Epidemiol Biomarkers Prev 2017;26(8):1255–65. http://cebp.aacrjournals.org/content/26/8/1255#ref-1 ↩︎
  16. Michaud DS, Kelsey KT, Papathanasiou E, Genco CA, Giovannucci E. Periodontal disease and risk of all cancers among male never smokers: an updated analysis of the Health Professionals Follow-up Study. Ann Oncol. 2016;27(5):941-7. https://www.ncbi.nlm.nih.gov/pubmed/26811350 ↩︎
  17. Teeuw WJ, Gerdes VE, Loos BG. Effect of periodontal treatment on glycemic control of diabetic patients: a systematic review and meta-analysis. Diabetes Care 2010;33(2):421-7. https://www.ncbi.nlm.nih.gov/pmc/articles/PMC2809296/pdf/zdc421.pdf ↩︎
  18. Preshaw PM, Alba AL, Herrera D, et al. Periodontitis and diabetes: a two-way relationship. Diabetologia 2011;55(1):21-31. https://www.ncbi.nlm.nih.gov/pmc/articles/PMC3228943/#CR7 ↩︎
  19. Hajishengallis G. Periodontitis: from microbial immune subversion to systemic inflammation. Nat Rev Immunol. 2015;15(1):30-44. https://www.ncbi.nlm.nih.gov/pmc/articles/PMC4276050/ ↩︎
  20. Michaud DS, Kelsey KT, Papathanasiou E, Genco CA, Giovannucci E. Periodontal disease and risk of all cancers among male never smokers: an updated analysis of the Health Professionals Follow-up Study. Ann Oncol. 2016;27(5):941-7. ↩︎
  21. Teeuw WJ, Gerdes VE, Loos BG. Effect of periodontal treatment on glycemic control of diabetic patients: a systematic review and meta-analysis. Diabetes Care 2010;33(2):421-7. ↩︎
  22. Plemons JM, Al-Hashimi I, Marek CL. Managing xerostomia and salivary gland hypofunction: Executive summary of a report from the American Dental Association Council on Scientific Affairs. JADA 2014:145(8):867-873. https://jada.ada.org/article/S0002-8177(14)60200-2/fulltext ↩︎
  23. Ibid. ↩︎
  24. Han P, Suarez-Durall P, Mulligan R. Dry mouth: A critical topic for older adult patients. J Prosthodont Res 2015: 59(1):6-19. https://www.journalofprosthodonticresearch.com/article/S1883-1958(14)00113-3/pdf ↩︎
  25. Kirzinger, A, Lopes, L, Wu, B, Brodie, M. KFF Health Tracking Poll – February 2019: Prescription Drugs. March 2019. https://modern.kff.org/health-costs/poll-finding/kff-health-tracking-poll-february-2019-prescription-drugs/ ↩︎
  26. Edentulous was defined as no permanent tooth present and no dental root fragments present. Molars and dental implants were excluded from the analysis (see data and methods for details). ↩︎
  27. Dye BA, Weatherspoon DJ, Mitnik GL. Tooth loss among older adults according to poverty status in the United States from 1999 through 2004 and 2009 through 2014. JADA 2019; 150(1):9-23. ↩︎
  28. Kaiser Family Foundation analysis of National Health and Nutrition Examination Survey (NHANES), 2013-2016; unpublished estimates. ↩︎
  29. Kaiser Family Foundation, State Health Facts: Percentage of Adults 65+ Who Have Had All of Their Natural Teeth Extracted. 2016. https://modern.kff.org/other/state-indicator/percent-who-had-all-teeth-extracted/?currentTimeframe=0&sortModel=%7B%22colId%22:%22Location%22,%22sort%22:%22asc%22%7D ↩︎
  30. Health Policy Institute. Oral Health and Well-Being in the United States. September 2016. https://www.ada.org/~/media/ADA/Science%20and%20Research/HPI/Files/HPIgraphic_0916_2.pdf?la=en ↩︎
  31. Kaiser Family Foundation analysis of the Medicare Current Beneficiary Survey (MCBS), 2016; unpublished estimates. ↩︎
  32. Centers for Disease Control and Prevention. Oral Health for Older Americans: Facts About Older Adults Oral Health. May 2, 2018. https://www.cdc.gov/oralhealth/basics/adult-oral-health/adult_older.htm ↩︎
  33. Griffin SO, Jones JA, Brunson D, Griffin PM, Bailey WD. Burden of oral disease among older adults and implications for public health priorities. Am J Public Health 2012;102(3):411-8. https://www.ncbi.nlm.nih.gov/pmc/articles/PMC3487659/#bib7 ↩︎
  34. Kaiser Family Foundation analysis of National Health and Nutrition Examination Survey (NHANES), 2015-2016; unpublished estimates. ↩︎
  35. Eke PI, Dye BA, Wei L, et al. Update on Prevalence of Periodontitis in Adults in the United States: NHANES 2009 to 2012. J Periodontol 2015;86(5):611-22. https://www.ncbi.nlm.nih.gov/pmc/articles/PMC4460825/ ↩︎
  36. Griffin SO, Jones JA, Brunson D, Griffin PM, Bailey WD. Burden of oral disease among older adults and implications for public health priorities. Am J Public Health 2012;102(3):411-8. https://www.ncbi.nlm.nih.gov/pmc/articles/PMC3487659/#bib7 ↩︎
  37. Kaiser Family Foundation analysis of National Health and Nutrition Examination Survey (NHANES), 2013-2016; unpublished estimates. ↩︎
  38. Rui P, Kang K. National Hospital Ambulatory Medical Care Survey: 2015 Emergency Department Summary Tables. https://www.cdc.gov/nchs/data/nhamcs/web_tables/2015_ed_web_tables.pdf ↩︎
  39. Allareddy V, Rampa S, Lee MK, et al. Hospital-based emergency department visits involving dental conditions. The Journal of the American Dental Association 2014;45(4):331–337. https://jada.ada.org/article/S0002-8177(14)60010-6/fulltext ↩︎
  40. Okunseri C, Okunseri E, Thorpe JM, Xiang Q, Szabo A. Patient characteristics and trends in nontraumatic dental condition visits to emergency departments in the United States. Clin Cosmet Investig Dent 2012;4:1-7. https://www.ncbi.nlm.nih.gov/pmc/articles/PMC3652363/ ↩︎
  41. American Dental Association. American Dental Association Statement on Regular Dental Visits. June 10, 2013. https://www.ada.org/en/press-room/news-releases/2013-archive/june/american-dental-association-statement-on-regular-dental-visits ↩︎
  42. Vujicic M, Buchmueller T, Klein R. Dental Care Presents The Highest Level Of Financial Barriers, Compared To Other Types Of Health Care Services. Health Affairs 2016; 35(12): 2176–2182. https://www.healthaffairs.org/doi/10.1377/hlthaff.2016.0800 ↩︎
  43. Health Resources and Services Administration. National and State-Level Projections of Dentists and Dental Hygienists in the U.S., 2012-2025. February 2015. https://bhw.hrsa.gov/sites/default/files/bhw/nchwa/projections/nationalstatelevelprojectionsdentists.pdf ↩︎
  44. Nelson J, Thatcher J, Williams J. National Rural Oral Health Association. Improving Rural Oral Healthcare Access. May 2018. https://www.ruralhealthweb.org/NRHA/media/Emerge_NRHA/Advocacy/Policy%20documents/05-11-18-NRHA-Policy-Improving-Rural-Oral-Health-Access.pdf ↩︎
  45. Syed ST, Gerger BS, Sharp LK. Traveling Towards Disease: Transportation Barriers to Health Care Access. J Community Health 2013;38(5):976-93. https://www.ncbi.nlm.nih.gov/pmc/articles/PMC4265215/ ↩︎
  46. IOM (Institute of Medicine). 2011. Advancing Oral Health in America. Washington, DC: The National Academies Press. ↩︎
  47. Jacobson G, Griffin S, Neuman T, Smith K. Kaiser Family Foundation. Income and Assets of Medicare Beneficiaries, 2016-2035. April 2017. http://files.kff.org/attachment/Issue-Brief-Income-and-Assets-of-Medicare-Beneficiaries-2016-2035 ↩︎
  48. Centers for Medicare and Medicaid Services. Medicare Dental Coverage. November 19, 2013. https://www.cms.gov/Medicare/Coverage/MedicareDentalCoverage/index.html ↩︎
  49. Ibid. ↩︎
  50. Institute of Medicine. 2000. Extending Medicare Coverage for Preventive and Other Services. Washington, DC: The National Academies Press. ↩︎
  51. Inside Health Policy. Advocates Seek Medically Necessary Oral Health Care, CMS Eyes Issue. January 29, 2019. ↩︎
  52. Manski RJ, Goodman HS, Reid BC, Macek MD. Dental insurance visits and expenditures among older adults. Am J Public Health 2004;94(5):759-64. https://www.ncbi.nlm.nih.gov/pmc/articles/PMC1448334/ ↩︎
  53. Manski RJ, Moeller JF, Chen H, Schimmel J, Pepper JV, St Clair PA. Dental use and expenditures for older uninsured Americans: the simulated impact of expanded coverage. Health Serv Res 2014;50(1):117-35. https://www.ncbi.nlm.nih.gov/pmc/articles/PMC4295003/ ↩︎
  54. National Association of Dental Plans. Dental Benefits Basics: What do dental plans normally cover? https://www.nadp.org/Dental_Benefits_Basics/Dental_BB_2.aspx ↩︎
  55. Ibid. ↩︎
  56. Many Medicare Advantage plans outsource the management of the dental benefits to large dental insurers. ↩︎
  57. Kaiser Family Foundation analysis of Medicare Advantage Enrollment File, 2016; unpublished estimates. ↩︎
  58. Kaiser Family Foundation analysis of Medicare Advantage Enrollment File, 2016; unpublished estimates. Less than 1% had access to extensive dental coverage only ↩︎
  59. To examine the scope of dental coverage offered by Medicare Advantage plans in greater detail, we reviewed 2019 Medicare Advantage plans with the highest enrollment in 6 large metropolitan counties: San Diego, California; Harris, Texas; Cook County, Illinois; Miami-Dade, Florida; Philadelphia, Pennsylvania; Charleston, South Carolina; and 2 rural counties: Jefferson, Oregon and Wayne, Ohio. Coinsurance estimates are illustrative (see data and methods for details). ↩︎
  60. Kaiser Family Foundation analysis of Medicare Advantage Enrollment File, 2016; unpublished estimates. ↩︎
  61. Kaiser Family Foundation analysis of 5% Sample, 2016; unpublished estimates. ↩︎
  62. 2016 is the most recent year of data available for the 5% Sample of Medicare claims and was used to estimate Medicaid dental coverage, based on 2018 dental benefits in each state. Kaiser Family Foundation analysis of 5% Sample of Medicare claims, 2016; unpublished estimates. Kaiser Family Foundation. State Health Facts – Medicaid: Dental Benefits. 2018. https://modern.kff.org/medicaid/state-indicator/dental-services/?currentTimeframe=0&sortModel=%7B%22colId%22:%22Location%22,%22sort%22:%22asc%22%7D; The Center for Health Care Strategies. Medicaid Adult Dental Benefits: An Overview. Updated November 2018. https://www.chcs.org/media/Adult-Oral-Health-Fact-Sheet_112118.pdf For states that listed “NR” (No Response) in the Kaiser Family Foundation database, the Center for Health Care Strategies Data was used to determine whether the state had some Medicaid dental benefits. ↩︎
  63. California Dental Association. New benefits for Denti-Cal adults in 2018. November 2, 2017. https://www.cda.org/news-events/new-benefits-for-denti-cal-adults-in-2018 ↩︎
  64. California Department of Health Care Services. What are the Medi-Cal Benefits? Accessed December 18, 2018. https://www.dhcs.ca.gov/services/medi-cal/Pages/Medi-Cal_EHB_Benefits.aspx ↩︎
  65. Kaiser Family Foundation and Health Management Associates. States Focus on Quality and Outcomes Amid Waiver Changes: Results from a 50-State Medicaid Budget Survey for State Fiscal Years 2018 and 2019. October 2018. http://files.kff.org/attachment/Report-States-Focus-on-Quality-and-Outcomes-Amid-Waiver-Changes-Results-from-a-50-State-Medicaid-Budget-Survey-for-State-Fiscal-Years-2018-and-2019 ↩︎
  66. Kaiser Family Foundation analysis of 5% Sample, 2016; unpublished estimates. ↩︎
  67. Kaiser Family Foundation analysis of the Medicare Current Beneficiary Survey (MCBS), 2016; unpublished estimates. ↩︎
  68. Cubanski J, Damico A, Neuman T, Jacobson G. Kaiser Family Foundation. Sources of Supplemental Coverage Among Medicare Beneficiaries in 2016. November 2018. http://files.kff.org/attachment/Data-Note-Sources-of-Supplemental-Coverage-Among-Medicare-Beneficiaries-in-2016 ↩︎
  69. Kaiser Family Foundation analysis of Medicare Advantage Enrollment File, 2016; unpublished estimates. ↩︎
  70. Coinsurance estimates are illustrative, based on our analysis of 2019 Medicare Advantage plans with the highest enrollment in 6 large metropolitan counties and 2 rural counties (see data and methods for details). ↩︎
  71. The implant procedure and treatment plan would be subject to dentist and patient preference; not all implant cost codes are available. An example scenario: intraoral – periapical first radiographic image (D0220): $100 ($50×2); Surgical placement of implant body – endosteal implant (D6010): $4,460 ($2,230×2); second stage implant surgery (D6011): $826 ($413×2) (procedures D6010 and D6011 may be performed by a periodontist or oral surgeon); prefabricated abutment – includes modification and placement (D6056): $1,432 ($716×2); implant/abutment supported removable denture for partially edentulous arch – maxillary (D6112); semi-precision attachment abutment (D6052) for 2 implants; fees were not available for the final restorations: D6112 and D6052 in the 2018 ADA Survey of Dental Fees, so the total cost of implant procedure is under-estimated. Total costs with available fee schedule: $6,818. Total out-of-pocket costs were calculated by including all services under Table 4 – scenario 3, as well as the total cost of implants, minus the cost of the partial maxillary denture (D5211) for a total of $10,292. ↩︎
  72. The Center for Medicare Advocacy. Legal Memorandum: Statutory Authority Exists for Medicare to Cover Medically Necessary Oral Health Care. January 3, 2019. https://www.medicareadvocacy.org/medicare-info/dental-coverage-under-medicare/ ↩︎
  73. Letter to Seema Verma and Alex Azar by members of Congress. September 17, 2018. https://familiesusa.org/sites/default/files/Letter%20on%20Medicare%20Coverage%20of%20Oral%20Health%20-%20September%2017%202018.pdf ↩︎
  74. Medicare Dental Benefit Act of 2019; S.22, 116th Congress (2019). https://www.congress.gov/bill/116th-congress/senate-bill/22/text; Seniors Have Ears, Eyes, and Teeth Act; H.R. 576, 116th Congress (2019). https://www.congress.gov/bill/116th-congress/house-bill/576/text; Medicare Dental, Vision, and Hearing Benefit Act of 2017; H.R.3111, 115th Congress (2017). https://www.congress.gov/bill/115th-congress/house-bill/3111/text; Medicare for All Act of 2017; S.1804, 115th Congress (2017). https://www.congress.gov/bill/115th-congress/senate-bill/1804/text ↩︎
  75. Willink A, Schoen C, Davis K. How Medicare Could Provide Dental, Vision, and Hearing Care for Beneficiaries. The Commonwealth Fund, January 2018. https://www.commonwealthfund.org/sites/default/files/documents/ ___media_files_publications_issue_brief_2018_jan_willink_medicare_dental_vision_hearing_ib.pdf ↩︎

White House Releases FY20 Budget Request

Published: Mar 11, 2019

The White House released its FY 2020 budget request to Congress on March 11, 2019, which includes significant cuts to global health programs compared to FY 2019 enacted levels (the overall levels in the request are similar to the FY 2019 budget request).

Key highlights are as follows (see table for additional detail):

  • Funding provided to the State Department and the U.S. Agency for International Development (USAID) (through the Global Health Programs account), which represents the bulk of global health assistance, would decline by $2.5 billion (-28%), from $8,837 million in FY 2019 to $6,344 million, which would be the lowest level of funding since FY 2007. Funding declined for each global health program area as follows:
    • Funding for bilateral HIV programs through the President’s Emergency Plan for AIDS Relief (PEPFAR) would decline overall by $1,350 million (-29%), from $4,700 million in FY19 to $3,350 million in the FY20 Request. This includes a decrease of $1,020 million (-23%) at State and $330 million (-100%) at USAID.
    • The U.S. contribution to the Global Fund to Fight AIDS, Tuberculosis and Malaria (Global Fund) would decline by $392 million (-29%), from $1,350 million in FY19 to $958 million in the FY20 Request. In addition, the administration proposes to make a pledge of up to $3.3 billion over three years for the next Global Fund replenishment period, matching $1 for every $3 contributed by other donors (in the previous replenishment period under the Obama administration, the U.S. pledged up to $4.3 billion, matching $1 for every $2 provided by other donors). For the first year of this pledge, the administration is proposing to provide a total of $1.1 billion to the Global Fund: $958 million from FY20 and $142 million in unmatched carryover funding from the previous pledge period.
    • Funding for family planning and reproductive health (FP/RH) would decline by $287 million (-55%), from $524 million in FY19 to $237 million in the FY20 Request.
    • Funding for global health security (GHS) would decline by $48 million (-35%), from $138 million in FY19 (which included a transfer of $38 million from unspent Emergency Ebola funding) to $90 million in the FY20 Request.
    • Funding for tuberculosis would decline by -$41 million (-14%), from $302 million in FY19 to $261 million in the FY20 Request.
    • Funding for malaria would decline by -$81 million (-11%) from $755 million in FY19 to $674 million in the FY20 Request
    • Funding for maternal and child health (MCH) would decline by -$215 million (-26%) from $835 million in FY19 to $620 million in the FY20 Request. Gavi, the Vaccine Alliance, which is included under MCH funding, would decrease by $40 million (-14%).
    • Funding for neglected tropical diseases (NTDs) would decline by -$28 million (-27%) from $103 million in FY19 to $75 million in the FY20 Request
    • Funding for nutrition would decline by -$66.5 million (-46%) from $145 million in FY19 to $79 million in the FY20 Request.
    • Funding for vulnerable children would be eliminated.
  • Funding for global health provided to the Centers for Disease Control and Prevention (CDC) would decline by $32 million (-6%), from $489 million in FY 2019 to $457 million in FY 2020. The FY20 Request includes $100 million for global health security activities at CDC.
  • Funding for the Fogarty International Center (FIC) at the National Institutes of Health (NIH) totaled $67 million, $11 million (-14%) below the FY 2019 enacted levels ($78 million).

Note: This summary will be updated as more information becomes available.

Resources:

The table (.xls) below compares the FY 2020 request to the FY 2019 enacted funding amounts as outlined in the “Consolidated Appropriations Act, 2019” (P.L. 116-6; KFF summary here) and the FY 2019 request (KFF summary here). Note that total funding for global health is not currently available as some funding provided through USAID, Health and Human Services (HHS), and the Department of Defense (DoD) is not yet available.

Table: KFF Analysis of FY20 Budget Request for Global Health
Department / Agency / AreaFY19Requesti(millions)FY19Enactedii(millions)FY20Requesti(millions)Difference(millions)
FY20 Request – FY19 RequestFY20 Request – FY19 Enacted
 SFOPs – Global Health
HIV/AIDS$3,850.0$4,700.0$3,350.0$-500 (-13%)$-1350 (-28.7%)
State Departmentiii$3,850.0$4,370.0$3,350.0$-500(-13%)$-1020(-23.3%)
USAID$0.0$330.0$0.0$0(0%)$-330(-100%)
of which Microbicides$0.0$45.0$0.0$0(0%)$-45(-100%)
Global Fund$925.1$1,350.0$958.4$33.3 (3.6%)$-391.6 (-29%)
Tuberculosisiv$180.8 – 
Global Health Programs (GHP) account$178.4$302.0$261.0$82.6(46.3%)$-41(-13.6%)
Economic Support Fund (ESF) account$2.4Not specifiedNot specified – –
Malaria$674.0$755.0$674.0$0 (0%)$-81 (-10.7%)
Maternal & Child Health (MCH)v vi –
GHP account$619.6$835.0$619.6$0(0%)$-215.4(-25.8%)
of which Gavi$250.0$290.0$250.0$0(0%)$-40(-13.8%)
of which Polio$21.3$51.5Not specified – –
UNICEFviiNot specified$137.5Not specified – –
ESF account$71.4Not specifiedNot specified – –
of which Polio$3.5$7.5Not specified – –
Nutritionviii$101.3 – – –
GHP account$78.5$145.0$78.5$0(0%)$-66.5(-45.9%)
ESF account$22.8Not specifiedNot specified – –
Family Planning & Reproductive Health (FP/RH)$330.5$607.5 – – –
GHP account$302.0$524.0$237.0$-65(-21.5%)$-287(-54.8%)
ESF account$28.5$51.1Not specified – –
UNFPA$0.0$32.5$0.0$0(0%)$-32.5(-100%)
Vulnerable Children$0.0$24.0$0.0$0(0%)$-24 (-100%)
Neglected Tropical Diseases (NTDs)$75.0$102.5$75.0$0 (0%)$-27.5 (-26.8%)
Global Health Security$72.5$138.0$90.0$17.5 (24.2%)$-48 (-34.8%)
GHP account$0.0$100.0$90.0$90.0(N/A)$-10(-10%)
Ebola transfer$72.5$38.0$0.0$-72.5(-100%)$-38(-100%)
Emergency Reserve Fund$0.0$2.0$0.0$0 (0%)$-2 (-100%)
Ebola transfer$0.0$2.0$0.0$0(0%)$-2(-100%)
Total (GHP account only)$6,702.6$8,837.5$6,343.5$-359.1 (-5.4%)$-2,493.9 (-28.2%)
Health & Human Services (HHS)
Centers for Disease Control & Prevention (CDC) – Total Global Health$408.8$488.6$457.0$48.2 (11.8%)$-31.6 (-6.5%)
Global HIV/AIDS$69.5$128.4$69.5$0(0%)$-58.9(-45.8%)
Global Tuberculosisix – –$7.2 – –
Global Immunization$206.0$226.0$206.0$0(0%)$-20(-8.8%)
Polio$165.0$176.0Not specified – –
Other Global Vaccines/Measles$41.0$50.0Not specified – –
Parasitic Diseases$24.5$26.0$24.5$0(-0.2%)$-1.5(-6%)
Global Public Health Protectionx$108.8$108.2$149.8$41(37.6%)$41.6(38.4%)
Global Disease Detection and Emergency ResponseNot specified$48.4Not specified – –
Global Public Health CapacityNot specified$9.8Not specified – –
Global Health Security$58.8$50.0$99.8$41(69.7%)$49.8(99.5%)
National Institutes of Health (NIH) – Total Global Health$765.1 –  – –
HIV/AIDS$511.0$590.1Not specified – –
Malaria$184.0Not yet knownNot specified – –
Fogarty International Center (FIC)$70.1$78.1$67.0$-3.1(-4.4%)$-11.1(-14.2%)
Notes:
i – In the FY19 and FY20 Requests, the administration proposed to consolidate the Development Assistance (DA), Economic Support Fund (ESF), the Assistance for Europe, Eurasia, and Central Asia (AEECA), and the Democracy Fund (DF) accounts in to one new account — the Economic Support and Development Fund (ESDF). ESF funding for the FY19 Request reflects the amounts requested by the administration for ESDF.
ii – The FY19 Enacted includes the transfer of $40.0 million in unspent Emergency Ebola funding including: $2.0 million for the Emergency Reserve Fund and $38.0 million for “programs to accelerate the capacities of targeted countries to prevent, detect, and respond to infectious disease outbreaks.”
iii – The FY19 Request includes $400 million in the “Addendum to the President’s FY19 Budget to Account for the Bipartisan Budget Act of 2018.”
iv – Some tuberculosis funding is provided under the ESF account, which is not earmarked by Congress in the annual appropriations bills and determined at the agency level (e.g. in FY17, TB funding under the ESF account totaled $3.4 million).
v – Some MCH funding is provided under the ESF account, which is not earmarked by Congress in the annual appropriations bills and determined at the agency level (e.g. in FY17, MCH funding under the ESF account totaled $53.92 million).
vi – It is not possible to calculate total MCH funding in the FY19 request because UNICEF, which has historically received funding through the International Organizations and Programs (IO&P) account, was not specified in the FY19 request.
vii – UNICEF funding in the FY19 Enacted totaled $137.5 million, of which $5 million is earmarked for programs addressing female genital mutilation.
viii – Some nutrition funding is provided under the ESF account, which is not earmarked by Congress in the annual appropriations bills and determined at the agency level. (e.g. in FY17, nutrition funding under the ESF account totaled $21 million).
ix – In FY20, the administration is proposing to create a new “Global Tuberculosis” funding line under global health programs at CDC and to transfer $7.2 million from the “HIV/AIDS, Viral Hepatitis, STI and TB Prevention” funding line to “Global Tuberculosis”.
x – In the CDC FY20 congressional justification, this funding line is titled “Global Disease Detection and Other Programs”.
News Release

Final Title X Regulation Changes, Implications and What’s Ahead

Published: Mar 8, 2019

On Monday, March 4, 2019, the Trump Administration published final regulations for the federal Title X family planning program that could dramatically reshape the safety-net program.  Some of the major changes in the new regulations focus on disqualifying providers who offer abortion services from the Title X program and banning participating providers from referring patients to others who can provide abortions. Clinics that have been offering women reproductive health care with the support of Title X funds may now be faced with the need to either lay off staff, reduce services or hours, or in some cases, close their doors.  As a result, these regulations will leave more women with fewer options to obtain time-sensitive, affordable, and high quality family planning care for their reproductive health. A new KFF issue brief reviews the final provisions highlighting changes from current rules and the implications for low-income people and the providers who serve them. The brief also provides information on historical and current legal challenges to Title X regulations.  Over 20 states and several other organizations have filed federal court motions to block the final regulations from going into effect in the coming months. In addition to the brief, KFF’s Alina Salganicoff, Vice President and Director of Women’s Health Policy, answered three questions about the final regulations recently in the new feature Ask KFF.

New Title X Regulations: Implications for Women and Family Planning Providers

Published: Mar 8, 2019

Issue Brief

 Key Takeaways

  • The Trump Administration’s new final regulations for the federal Title X family planning program make significant changes to the program and will:
    • Block the availability of federal funds to family planning providers that also offer abortion services with other funds;
    • Prohibit sites that participate in Title X from referring pregnant clients to abortion providers;
    • Eliminate current requirements for Title X sites to provide non-directive pregnancy options counseling that includes information about prenatal care/delivery, adoption, and abortion;
    • Prioritize providers that offer comprehensive primary health care services over those that specialize in reproductive health services; and
    • Encourage participation by “non-traditional” organizations such as those that only offer one method of family planning, such as fertility awareness-based methods.
  • Sites that do not offer abortion services may still qualify for Title X funds, but may not participate in the program because of concerns about clinical standards of care, medical liability, and burdensome administrative requirements.
  • If implemented, the changes to Title X will shrink the network of participating providers and could reduce the scope of services offered to low-income and uninsured people that rely on Title X-funded clinics for their family planning care.
  • The attorneys general from 23 states, major family planning organizations and the American Medical Association have filed legal challenges in federal court to block the implementation of the regulations, claiming the new rules violate the Constitution and federal law. The courts will likely make a decision on whether to stay the implementation before May 3rd, when some of the provisions of the regulation are scheduled to take effect.

Introduction

On March 4, 2019, the Trump Administration published new final regulations that restores Reagan-era restrictions regarding abortion and Title X. The primary goal of these regulations is to block the availability of federal funds to family planning providers, such as Planned Parenthood, that also offer abortion services with non-Title X funds and to prohibit sites that receive Title X funds from referring pregnant patients to other providers for abortion services. These regulations, if implemented will significantly shrink the network of clinics available to provide family planning services under Title X and weaken the scope of family planning services offered to low-income and uninsured women in many parts of the country. Without Title X funds, which on average make up 19% of the revenue of participating family planning clinics, some clinics may close, while other clinics will need to reduce staff and service hours and cut professional development and training, which could reduce access to time-sensitive reproductive health care services.

Key Facts–Title X Federal Family Planning Program

  • Title X, enacted in 1970, is the only federal program specifically dedicated to supporting the delivery of family planning care.
  • Administered by the HHS Office of Population Affairs (OPA), and funded at $286.5 million for Fiscal Year 2018, the program serves over 4 million low-income, uninsured, and underserved clients.
  • In 2017, nearly 4,000 clinics nationwide relied on Title X funding to help serve 4 million people. The sites include specialized family planning clinics such as Planned Parenthood centers, community health centers, state health departments, as well as school-based, faith-based, and other nonprofit organizations.
  • Title X grants made up about 19% of revenue for family planning services for participating clinics in 2017, providing funds to not only cover the direct costs of family planning services, but also pay for general operating costs such as staff salaries, staff training, rent, and health information technology.

The Department of Health and Human Services (HHS) maintains that banning Title X sites from referring for abortion services and requiring Title X sites to have complete physical and financial separation are necessary. They state that the prior regulations violate the Title X statute, which prohibits the inclusion of abortion as a family planning service. HHS also argues that requiring Title X projects to provide abortion referrals and nondirective pregnancy options counseling ­is inconsistent with federal conscience laws such as the Church, Coats-Snowe, and Weldon Amendments.

These new regulations comes in the midst of a funding cycle for grantees set to end March 31, 2019. Applicants have already applied for new grants expected to start on April 1, 2019 under the prior regulations, and those selected for funding will now need to decide whether they will comply with the new regulations or withdraw from the program. The regulations have been legally challenged by 23 states, a number of family planning organizations and state officials, and the American Medical Association on the basis of constitutional and statutory claims. This brief reviews the Trump Administration’s new final Title X family planning regulations, compares them to the current program rules and discusses the implications of these changes for low-income women seeking family planning services and the providers that have been serving them with Title X support.

Background

For low-income women, publically funded clinics are an important source of family planning services. These critical services help women avoid unintended, mistimed or unwanted pregnancies as well as give them access to critical preventive care and STI screening and treatment. One in three low-income women reported that they obtained birth control from a publically-funded clinic, such as Planned Parenthood or another health center or public health clinic. In 2017, over 4 million individuals obtained family planning services at a Title X funded site. The majority of the clients (67%) had family incomes at or below the poverty level, 38% were covered by Medicaid or another public program, and nearly half (42%) were uninsured (Figure 1). Two thirds were women and men of color.

Figure 1: Characteristics of Clients Who Used Services at Title X Sites in 2017

The statute governing Title X requires program funds to serve low-income populations at low or no cost, provide clients with a broad range of acceptable and effective family planning methods and services, and ensure that the services are voluntary. It also stipulates that funds may only go to entities where “abortion is not a method of family planning.” Regulations that have been in effect interpret this provision to mean that Title X projects are prohibited from using Title X funds to pay for abortions and must keep any abortion-related activities financially separate from their Title X activities. Title X projects are required to provide nondirective options counseling to pregnant people on prenatal care and delivery, infant or foster care, adoption, and abortion. Pregnant people desiring an abortion must be provided with a referral if asked, but the provider cannot promote abortion, schedule an appointment, negotiate rates, or arrange transportation for people desiring abortions.

New Regulations

On March 4, 2019, new final regulations for Title X grants were published in the Federal Register, with a phased-in implementation period that commences on May 3, 2019. The regulations make many changes to the requirements for Title X projects that will significantly reshape the program and provider network available to low-income people through Title X. Specifically, the regulations:

Prohibit federal Title X funds from going to any family planning site that also provides abortion services. The Title X statute specifies that no federal funds appropriated under the program “shall be used in programs where abortion is a method of family planning.” HHS has changed its interpretation of this provision over time, but throughout most of the history of the program, the ban has generally been understood to mean that Title X funds cannot be used to pay for or support abortion, as is the policy under the current regulations (Appendix).

The final regulation requires that Title X funded activities have full physical and financial separation from abortion-related activities. In addition to separate accounting (as has been the requirement prior to the new regulations), providers must have separate electronic and paper health records, separate treatment, consultation, examination and waiting rooms, office entrances and exits, workstations, signs, phone numbers, email addresses, educational services, websites, and staff. This new requirement essentially disqualifies any provider from receiving Title X funds if they also offer abortions. It also prohibits Title X projects from using Title X funds to participate in a variety of “activities that encourage abortion” including lobbying, attending an event during which they engage in lobbying, or paying dues to a group that uses the funds for lobbying or supporting a candidate for office.

The proposed regulations are nearly identical to regulations issued under President Reagan (Appendix), which were legally challenged by Title X projects and providers, and were ultimately upheld by the Supreme Court in Rust v. Sullivan in 1991 (Box 1). However, the Reagan era regulations were never fully implemented as President Clinton issued an executive order to suspend the regulations and then issued new regulations that were in place until the new regulations were published on March 4, 2019..

Box 1 – Legal Challenges to the Title X Regulations

Many provisions in the Trump Administration’s regulation mirror those issued in 1988 by the Reagan administration. Those regulations were challenged by Title X grantees and doctors in a lawsuit that ultimately reached the U.S. Supreme Court in Rust v. Sullivan. In 1991, the Supreme Court held that the regulations were a permissible interpretation of the statute and did not violate the First or Fifth Amendments.

The Court ruled that the government may favor childbirth over abortion and allocate funds consistent with this viewpoint without violating a woman’s right to choose to terminate her pregnancy. After the Supreme Court’s decision, Congress voted to repeal the prohibitions on counseling and referring for abortion, but lacked the votes to override President George H.W. Bush’s veto.

The Reagan era regulation, however, was never fully implemented. The Clinton Administration issued regulations that have been in effect since then that have permitted Title X providers to refer for abortions and allow sites that also provide abortion services to participate in Title X, so long as there is financial separation between the Title X funds and funds used for abortion services.

Twenty-three states, several family planning organizations, and the American Medical Association have sued to block the implementation of the new regulations based on both statutory and constitutional claims. The federal courts may weigh these new statutory claims and decide to block the implementation of the regulations until the cases can be heard. The courts will need to act on the request for a stay before May 3, 2019. Ultimately, the Supreme Court may again take up the Title X family planning regulations and decide if the Trump Administration regulations violate the federal statutes or the Constitution or are within their agency rights.

Ban sites from providing pregnant clients with referrals for abortions: Under the regulations in place from 2000 to 2019, Title X grantees were required to provide pregnancy options referrals upon request. The new final regulations interpret referrals for abortion to be activities that are considered providing “abortion as a method of family planning” and prohibit Title X grantees and subrecipients from providing, promoting, referring for, supporting, or presenting abortion services to patients. Under the new regulations, a Title X project is permitted—but not required—to provide pregnant people with a list of health care providers that offer comprehensive primary health services, that also includes prenatal care. The rules also stipulate that some—but not the majority—of providers on the list, may also provide abortion. Neither the list nor the project staff may indicate which of the listed providers also offer abortion services.

Eliminate the requirement for nondirective pregnancy options counseling that also includes discussion of abortion as an option: Under the previous regulations, Title X grantees were required to offer pregnant women the opportunity to be provided information and counseling regarding prenatal care and delivery; infant care, foster care, or adoption; and pregnancy termination. If asked for information and counseling, providers were required to provide nondirective counseling on each of the options. The decision about whether to offer pregnancy options counseling is now left up to each site and organization that participates (which may include those that do not support abortion) to decide whether to mention abortion as an option to pregnant people who seek counseling. Only a medical doctor or advanced practice provider (defined as including physician assistants and advanced practice registered nurses) is permitted to provide nondirective pregnancy options counseling. However, the regulations specify that all pregnant people must be referred to prenatal care, regardless of their stated wishes.

Add new primary care requirements for Title X projects: Title X projects are required to offer “comprehensive primary health services onsite or have a robust referral linkage with primary health providers who are in close physical proximity.” There is no definition of the term “close physical proximity” in the regulations.

Extend federal oversight, enforcement, and recordkeeping: The regulations grant enforcement and oversight authority of grantees and subrecipients to the Secretary of HHS. In the past, grantees were subject to review by HHS, but all subrecipients were under the authority of the grantee organization. In addition, there are new and significant informational requirements of the grantees including reporting detailed information about all subrecipients, and agencies or individuals providing referral services, including a description of the extent of the partnership and the process by which the grantee will “ensure adequate oversight and accountability for quality and effectiveness of outcomes.” Title X grantees and subrecipients would also be required to maintain and report records indicating the age of minor clients and the age of their sexual partners as specified under state notification laws.

Define family planning: While the regulations that have been in effect do not define family planning, OPA has required grantees to offer a broad range of FDA-approved contraceptive methods onsite and follow the CDC and OPA recommendations for providing Quality Family Planning (QFP) services. The new final regulations define family planning as including abstinence, natural family methods and effective contraceptive methods, but exclude abortion services. The regulations do not incorporate any of the other elements of CDC and OPA recommendations.

Re-define who is “Low-income” for purposes of program eligibility: Low-income under Title X has been historically defined as income below 100% of the federal poverty level. The final regulations adapt this definition to allow a Title X project director to consider the insurance status of women who receive employer-sponsored insurance offered by an employer who refuses to cover contraceptives in their plan due to religious or moral objections. The project must also “consider other circumstances affecting her ability to pay” but may “consider her annual income as being reduced by the total annual out-of-pocket costs of contraceptive services she uses or seeks to use… or estimate them at $600” in calculation of her eligibility for free or reduced cost services.

This new definition is an attempt to address concerns raised in litigation challenging the Trump Administration’s final ACA regulations to significantly broaden the ability of employers to be exempt from the Affordable Care Act’s (ACA) contraceptive coverage requirement based on a religious or moral objection to contraceptives. The Trump Administration’s ACA contraceptive coverage regulations, if implemented, would take away the ACA’s guarantee of no cost coverage of contraceptives from women insured by employers with religious or moral objections. Several states have legally challenged these regulations, and there is currently a stay blocking their implementation pending the outcome of the litigation. The Trump Administration contends that women affected by the ACA regulation could be able to obtain contraceptive services at Title X clinics. However, the revised Title X definition of “low-income” would probably not assist many women denied contraceptive coverage by their employers. For example, even women earning minimum wage may still not qualify as “low-income” and few women would probably be aware that they could potentially qualify for Title X services when they have employer coverage.

Implications for Providers and Patients

Access to family planning services is still a challenge for many low-income women. The impact of the final regulations will be far reaching and change the network of providers that are eligible to participate, limiting rather than expanding access.

Disqualifying family planning providers that also perform abortions from Title X program eligibility will significantly reduce the network of family planning providers and resources available to serve low-income and uninsured people under the program. The provisions that require physical and financial separation would make it impossible for clinics like Planned Parenthood and any other family planning provider that also offers abortion services to comply with the new requirements of the program.

The impact of banning federal Title X funds to Planned Parenthood, in conjunction with the prohibition on providing referrals to abortion services, will vary across the country. In 13 states, Planned Parenthood clinics were the site of care for over 40% of women who obtained publicly funded contraceptives (Figure 2). Research has shown that blocking Planned Parenthood from receiving public funds can reduce low-income women’s access to contraceptives. In 2013, the Wisconsin legislature approved family planning cuts directed at Planned Parenthood, which resulted in the closure of five Planned Parenthood clinics in rural areas. Women who used the Planned Parenthood clinics were referred to other clinics that were usually further away, with waiting lists, and that did not provide the full range of contraceptive methods. A study conducted by Health Management Associates for Planned Parenthood concluded that women in seven Wisconsin counties would have no alternative family planning provider should Planned Parenthood centers close there.

Figure 2: The Share of Women Served by Planned Parenthood Varies by State

The ban on referrals for abortions compromises the quality of family planning care women receive through Title X providers. The Institute of Medicine’s landmark study on health care quality identified six dimensions of quality: safety, timeliness, patient-centeredness, effectiveness, efficiency, and equity. Providers that withhold information about abortion and, if provided, limit the list of providers that pregnant people seeking abortion are offered would compromise the quality of care they provide. Care offered under those restrictions would not be patient-centered, could lead to delayed care, and would be inequitable. Adherence to medical standards of care requires providers to offer patients referrals to the highest quality providers that can offer care in the timeliest manner and respects a patient’s decision to seek that care. The provider cannot indicate which of the licensed comprehensive primary health care and prenatal care providers also offer abortion. This list would primarily be comprised of hospitals and doctor’s offices that include prenatal care. Hospitals account for roughly half of the abortion-providing facilities, but only provide about 5% of all abortion procedures. In contrast, abortion clinics and nonspecialized clinics provide 90% of abortions.

Banning referrals to abortion services could place participating providers at risk of medical liability. Providers who still qualify for Title X funds because they do not offer abortion may find themselves facing a medical liability risk if they opt to participate in the program that prohibits referrals for abortions. As Rosenbaum and her colleagues cite, the case of Wickline v. State of California finds that it is “no defense in a medical liability case to argue that physicians simply have followed a payer’s instructions,” which in this case, would be the Title X program. They argue that because Title X participating providers will be required to withhold information about services and referrals to qualified providers, they could be held liable and potentially jeopardize other funding they receive through the program that funds the federal Community Health Center program. Some community health centers may decide to discontinue their Title X participation because of concerns about medical liability and because these regulations would force them to offer their patients poorer quality care by restricting their ability to offer referrals for abortions desired by their patients and refer instead to prenatal care.

A Kaiser Family Foundation and George Washington University study illustrates the difference that having Title X support makes in terms of the quality and range of family planning services offered by Federally Qualified Health Centers (FQHCs) (Figure 3). Because they have been required to adhere to the QFP guidelines, Title X-funded sites consistently offer patients a broader range of onsite contraceptive methods, including natural family planning instruction and emergency contraception. Title X-funded health centers offer all seven of the most effective contraceptive methods onsite at three times the rate of sites not receiving Title X funding (48% to 15% respectively). Title X-funded sites also consistently show greater incorporation of evidence-based best practice methods, such as use of the “quick start” method for oral contraception that ensures that women who seek it have rapid access to effective contraceptive services.

Figure 3: Health Centers with Title X Status are More Likely to Provide Effective Family Planning Methods Onsite and to Offer Services Associated with High Quality Care

Some stand-alone family planning clinics, particularly in rural communities, may not be in close proximity to other primary health providers, and therefore may not qualify for funding. Excluding family planning clinics because they do not offer comprehensive primary care or are not near a primary care provider could make it more difficult for women, particularly in rural areas, to access the full range of family planning services that are available under the current program. Prioritizing comprehensive primary care providers over specialized reproductive health providers may compromise quality. Specialized family planning clinics have been shown to provide a wider range of contraceptive methods and higher quality family planning care than clinics providing comprehensive care, such as community health centers.

The new regulations could channel new federal family planning funds to ‘non-traditional” organizations that only offer natural family planning/fertility-awareness based methods or abstinence and do not provide other contraceptive services. The regulations permit and encourages the participation of these single method providers, so long as they are part of a Title X project that provides a broad range of family planning methods, and does not require that other contraceptive services be offered onsite. While these types of organizations were not disqualified from participating under the prior regulations, OPA prioritized clinical providers that offered women the full range of contraceptive methods, particularly those methods that are most effective rather than calling out the inclusion of organizations that only offer a single method.

Many elements of these regulations will add costly administrative burdens for grantees and subrecipients. The program, in its current state, already has significant reporting requirements and oversight, and this final rule would go far beyond current practice. Subrecipients do not typically oversee the policies and referral practices of the organizations that they refer to for other services. The documentation and reporting requirements for minors could provide a disincentive for minors to seek services because of their concerns about confidentiality. The regulations cite many areas where the grantees and the subrecipients will need to incur new costs as a result of the new program requirements. HHS estimates that $36.08 million will be needed for sites to comply with the new physical separation requirements. Other year one costs are for new training ($2.71 million), learning the rule’s requirements ($3.11 million), documentation ($11.69 million), coming into programmatic compliance ($1.2 million), monitoring and enforcement ($8.53 million) and documentation of encouragement of parental involvement in the medical record ($2.93 million). While they are not summed in the regulations, the total costs, based on the estimates outlined in the rule, equal $66.25 million in the first year. This accounts for one quarter of the $260 million annual budget for the program. Using one quarter of the grantees’ budget for administrative and compliance purposes will significantly decrease resources available for care under the program that will likely translate into reductions in clinic hours, staffing and access.

Looking Ahead

If fully implemented, the changes to Title X could have major repercussions on access to family planning services for low-income people who rely on sites that have been receiving Title X support for their care. The states and family planning organizations challenging the regulations are hoping the federal courts will block the implementation of the regulations before May 3rd, the date some of the provisions, including the ban on referrals for abortion services, becomes effective. The regulations eliminate the requirement to provide non-directive pregnancy options counseling, ban referrals for abortions, and encourage participation from “nontraditional” organizations that may object to providing one or more contraceptive methods. In addition to the abortion-specific provisions, other changes in the regulations are administratively burdensome and costly, weaken the advances in clinical standards of family planning care offered by Title X providers, and redefine programmatic eligibility standards to promote Administration priorities.

If implemented, the regulations will restrict the size, scope and quality of the Title X network and place considerable burdens on the providers who opt to stay in the program, but who may not be able to keep up with demand for care. In the 2017 Kaiser Family Foundation and George Washington University survey, many community health centers reported a limited ability to take on new patients given current staffing and space constraints, suggesting that these health centers may not have the capacity to provide services to patients formerly seeking care at specialized family planning clinics like Planned Parenthood.

At the same time that the need for publicly-supported family planning services is growing, clinics that have been offering women the highest quality reproductive health care with the help of Title X funds may be faced with the reality that they will need to either lay off staff, reduce services or hours, or in some cases, close their doors. These regulations will leave more women with fewer options to obtain time-sensitive, affordable, and high quality family planning care that allows them to achieve their reproductive goals — which runs counter to the stated objective of the Title X program.

Appendix

Appendix: Federal Rules for Title X Projects on Abortion Services and Activities
 1988(only in effect for one month due to litigation and subsequent change of Administration)1993–Present2019 Regulations
Counseling for Pregnancy OptionsProhibited.Nondirective counseling required for pregnant people addressing: prenatal care & delivery, infant care, foster care, adoption,

pregnancy termination.

Only a doctor or advanced practice provider, though not required to do so, is permitted to provide nondirective counseling on abortion.
Referral for Abortion ServicesProhibited.Must offer referral for abortion if asked but cannot:
  • promote abortion;
  • schedule an appointment;
  • negotiate a rate; or
  • arrange transportation.
All pregnant people must be referred to prenatal services regardless of their stated wishes. A medical doctor or advanced practice provider may provide a list of comprehensive health service providers, the majority of which do not also provide abortion.
Requirements For How Abortion Activities Supported By Non-Title X Funds Must Be Handled
FinancialSeparate accounting records.Separate accounting records.Separate accounting records, electronic and paper health records.
FacilitySeparate treatment, consultation, waiting rooms.Shared waiting room permissible as long as costs are properly pro-rated.Separate treatment, consultation, examination, and waiting rooms, office entrances and exits, workstations, signs, phone numbers, email addresses, educational services, and websites.
StaffSeparate staff.Shared staff permissible as long as all abortion related activities are financed separately from the Title X project.Separate staff.
SOURCE: Kaiser Family Foundation analysis of federal regulations.

Above Federal Subsidy Threshold, Older Adults Spend Much More Income on ACA Coverage

Published: Mar 8, 2019

Source

How Affordable Are 2019 ACA Premiums for Middle Income People?

NOTE: Alaska and Hawaii are excluded from this chart because these states have different poverty guidelines, and thus different subsidy cutoffs, from the rest of the U.S. This analysis includes plans that are offered on exchange. All premiums are displayed as the full price, rather than just the portion that covers essential health benefits.