A First Look at North Carolina’s Section 1115 Medicaid Waiver’s Healthy Opportunities Pilots

Authors: Elizabeth Hinton, Samantha Artiga, MaryBeth Musumeci, and Robin Rudowitz
Published: May 15, 2019

Executive Summary

Medicaid funds typically cannot be used to pay for non-medical interventions that target the social determinants of health. However, in October 2018, CMS approved North Carolina’s Section 1115 waiver which provides financing for a new pilot program, called “Healthy Opportunities Pilots,” to cover evidence-based non-medical services that address specific social needs linked to health/health outcomes. The pilots will address housing instability, transportation insecurity, food insecurity, and interpersonal violence and toxic stress for a limited number of high-need enrollees. This waiver differs from others recently approved by the Trump Administration that aim to address health determinants by conditioning coverage on meeting work requirements. The pilot program may yield important evidence about how addressing certain non-medical needs may impact program costs and health outcomes. However, the scope and impact of the program is restricted by its limited funding. Implementing a long-term program on a broader scale would require larger sustainable financing streams and it’s unclear at this point whether CMS will use this waiver as a model for other states. This brief summarizes key features of the Healthy Opportunities Pilots.

Healthy Opportunities Pilots Key Highlights

Funding – CMS authorized $650 million in Medicaid funding for the pilot over five years, $100 million of which will be available for capacity building.

Pilot area – will include two to four regions of the state and is expected to serve approximately 25,000 to 50,000 beneficiaries, or about 1% to 2% of total Medicaid enrollees in North Carolina.

Eligible beneficiaries – must be enrolled in a managed care plan and must have at least one physical or behavioral health risk factor and at least one social risk factor.

Pilot services – will include evidence-based enhanced case management and other services, which must be approved by CMS, to address enrollee needs related to housing, food, transportation, and interpersonal safety.

Health plans – will manage the pilot budget and, working in close collaboration with care managers, will determine enrollee eligibility and authorize the delivery of pilot services.

Lead Pilot Entities (LPEs) – will develop, contract with, and manage the network of human service organizations that will deliver pilot services.

Timeline – The state will release an RFP for LPEs by November 2019 and anticipates beginning to deliver pilot services in late 2020.

Issue Brief

Background

There has been growing recognition that although health care is essential to health many broader social and environmental factors play a major role in shaping health. Social determinants of health are the conditions in which people are born, grow, live, work, and age.1  They include factors like socioeconomic status, education, neighborhood and physical environment, employment, nutrition/food security, and social support networks, as well as access to health care. In recent years, a broad range of initiatives have been launched at the federal, state, and local levels and by plans and providers to address social determinants of health, including efforts within Medicaid. These efforts stem from increasing rates of coverage under the Affordable Care Act (ACA), new funding and demonstration authorities provided through the ACA, and an increasing shift across the health system toward value- or outcome-based payments and “whole person” care.

Under a new waiver, North Carolina’s Medicaid program will pay for non-medical interventions that address housing instability, transportation insecurity, food insecurity and interpersonal violence & toxic stress for a limited number of high-need enrollees

Within Medicaid, states can use a range of optional state plan and waiver authorities (e.g., 1915(i), 1915(c), or Section 1115) to add certain non-clinical services to the Medicaid benefit package including case management, housing supports, employment supports, and peer support services for people who need help with self-care or household activities as a result of disability or chronic illness. Generally, states have not been able to use federal Medicaid funds to pay the direct costs of non-medical services like housing and food. Under federal Medicaid managed care rules, managed care plans have some limited flexibility to pay for non-medical services.2  Additionally, other recent Medicaid payment and delivery system reforms, like the formation of Accountable Care Organizations (ACOs), may provide flexibility or opportunities to cover non-medical services that support health.

Section 1115 Medicaid demonstration waivers provide states an avenue to test new approaches in Medicaid that differ from what is allowed by federal statute. States can obtain approval for Section 1115 demonstration waivers that test broad changes in Medicaid eligibility, benefits and cost-sharing, and payment and delivery systems as long as the Secretary determines that the demonstration is furthering the objectives of the Medicaid program. Waivers generally reflect priorities identified by states and CMS and often reflect changing priorities from one administration to another.

The current administration has largely marked a new direction for Medicaid demonstration waivers, including the approval of waivers that condition Medicaid eligibility on meeting work and reporting requirements as well as the approval of other policies that restrict eligibility and enrollment. In its approval of these demonstrations, the administration asserts such policies are designed to address health determinants (like employment) and to ultimately improve health outcomes.3  These new waivers run counter to many other efforts to address social determinants of health that focus on identifying social needs and facilitating links to services rather than making individuals’ health coverage dependent on meeting certain requirements – like reporting minimum monthly work hours.

CMS’s approval of North Carolina’s enhanced case management pilots within the state’s new Medicaid managed care delivery system stands in contrast to this recent trend in waiver approvals. This waiver allows the state to use Medicaid to pay directly for non-medical interventions that target the social determinants of health, although the program scope is restricted by its limited funding.

Overview of North Carolina’s Section 1115 Waiver

In 2015, the North Carolina General Assembly passed legislation that required the state’s Medicaid program to transition from its long-standing enhanced PCCM model to capitated managed care.4  Although the use of capitated managed care does not require Section 1115 waiver authority, as part of this transition, the state pursued certain elements, including an “Institution for Mental Disease” (IMD) waiver, pilots to address targeted health-related needs, a tribal uncompensated care pool, workforce innovation fund, and behavioral health home capacity-building funds which required submission of a Section 1115 waiver.5 ,6  In October 2018, CMS approved North Carolina’s Section 1115 waiver, including its transition from a fee-for-service (FFS) Medicaid delivery system to a capitated managed care program. North Carolina aims to transition approximately 1.5 million of its 2 million Medicaid enrollees to the new managed care delivery system.7  The state will begin transitioning enrollees by region to managed care “standard” plans in November 2019. Standard plans will cover physical, behavioral health, and pharmacy benefits. In 2021, the state plans to launch “tailored” plans for enrollees that have more significant mental health, intellectual or developmental disabilities, substance use, and traumatic brain injury needs.8  The state will also add “specialized” plans for foster care youth and former foster care youth. The state will require health plans to contract with local care management entities, including advanced medical homes and local health departments.

Within the new Medicaid managed care delivery system and care management infrastructure, CMS also approved a Healthy Opportunities Pilot program. All health plans must implement standardized screening questions to assess enrollees’ non-medical needs. If unmet needs are identified, plans will connect beneficiaries to community resources. Plans will have access to a statewide tool – NCCARE360 – to identify community resources and track and monitor referrals.9  Beyond these statewide efforts, in select regions, the Healthy Opportunities Pilots will authorize the use Medicaid funds to pay for enhanced case management and other support services for certain high-risk enrollees that meet physical or behavioral health and social risk factor criteria. The program aims to reduce health care costs and improve health outcomes by providing services to address housing instability, transportation insecurity, food insecurity, and interpersonal violence and toxic stress. The program is the first of its kind approved by CMS, allowing Medicaid funds to be used to pay for non-medical interventions that target the social determinants of health. CMS authorized $650 million in Medicaid funding for the pilot over five years. Funding for the pilot is part of the broader Section 1115 waiver in which the state must demonstrate budget neutrality to the federal government – meaning federal costs under the waiver must not exceed what federal costs would have been for that state without the waiver.10 

Key Features of the Healthy Opportunities Pilots

The state will operate the Healthy Opportunities Pilot program in two to four regions. Reflecting the program’s funding limitations, it expects to serve approximately 25,000 to 50,000 beneficiaries (or about 1% to 2% of total Medicaid enrollees) through the pilot program.

To be eligible to participate in the pilot program, beneficiaries must be enrolled in a managed care plan (standard, tailored, or a specialized plan) and must have at least one physical or behavioral health risk factor and at least one social risk factor (Figure 1). Health risk factors include adults with two or more chronic conditions or repeated emergency room use or hospital admissions; high-risk pregnant women (e.g., multifetal gestation, chronic condition likely to complicate pregnancy); and high-risk infants and children (e.g., prematurity, low birth weight, Neonatal Abstinence Syndrome, or one or more uncontrolled chronic conditions). Social risk factors include homelessness and housing insecurity, food insecurity, transportation insecurity, and being at-risk of witnessing or experiencing interpersonal violence. Participation in the pilot is voluntary and enrollees may opt out at any time.

Figure 1: North Carolina Healthy Opportunities Pilots Eligibility Criteria and Services

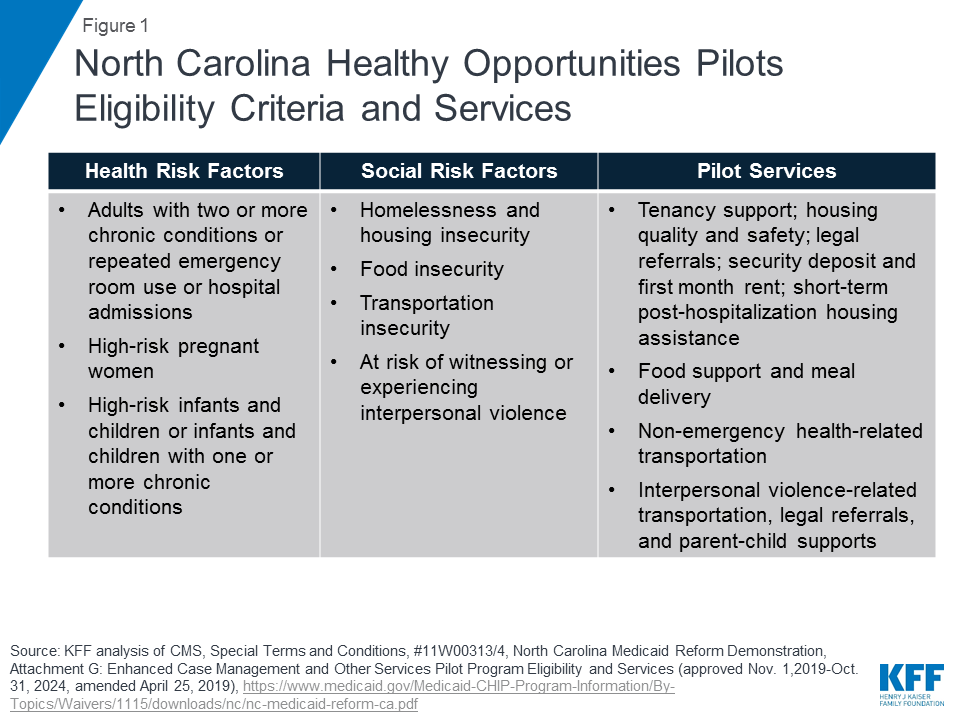
Pilot services will include evidence-based enhanced case management and other services designed to address enrollee needs related to: housing, food, transportation, and interpersonal safety. For example, pilot services may include housing modifications (e.g., carpet replacement, air conditioner repair) to improve a child’s asthma control, travel vouchers to a community-based food pantry or a medically-targeted healthy food box for an adult with diabetes living in a rural food desert, or assistance securing safe housing for a pregnant woman experiencing interpersonal violence.11  The care manager will recommend pilot services at the lowest intensity level that can be reasonably expected to meet an individual’s needs. Pilot transportation services include non-emergency health-related transportation including transportation to social services or to access pilot services. (Transportation services under the pilot are in addition to the non-emergency medical transportation (NEMT) benefit states are required to provide which helps ensure Medicaid beneficiaries have transportation to and from medical providers.) Approved pilot services are outlined in the waiver special terms and conditions.12  Any changes to the pilot services list must be reviewed and approved by CMS. Currently approved pilot services are also broadly outlined in Figure 1 (see Appendix for additional detail).

The state will require health plans to participate in the pilot program if they operate within any of the selected pilot regions. Health plans will be responsible for managing their pilot budget and may set enrollment caps/restrictions, if approved by the state – if/when the plan has limited funding capacity to serve all eligible enrollees (Figure 2). Health plans, in collaboration with care managers, will identify eligible enrollees and will seek consent from them to participate in the pilot program. Care managers will use standardized screening questions to assess health-related unmet resource needs.13  Health plans and their care managers will determine the pilot services to be provided to each enrollee and will work in collaboration with the lead pilot entity (LPE) to track enhanced case management and other pilot services. Every three months, health plans will review the pilot services each enrollee is receiving to ensure the services are meeting the enrollee’s needs. Plans must reassess enrollee pilot eligibility every six months. Health plans will also be required to participate in “learning communities” to disseminate best practices across regions.

Figure 2: Healthy Opportunities Pilots: Key Organizations and Responsibilities

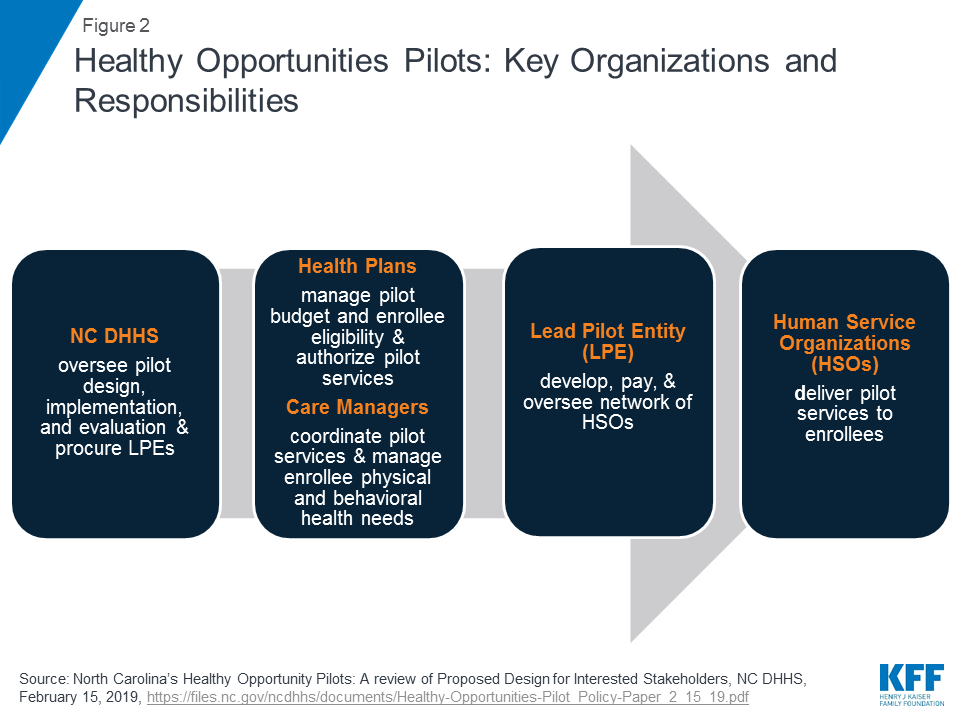
Each region will have one lead pilot entity (LPE) that will serve as the regional pilot coordinator and will be accountable for pilot operations. The state will select LPEs through a competitive procurement process. The state expects LPEs to be rooted in their communities, indicating entities best positioned for this role may include, community-based organizations, county-based public agencies, local health departments, social services or multiservice agencies, community health centers, community health foundations, associations, or a partnership of agencies.14  The state expects LPEs will be “anchored by” a community-based health or social service organization and will not be led by a health system. LPEs will develop, contract with, and manage the network of participating pilot providers, including community-based organizations, social service agencies, and health care providers, that will deliver pilot services. LPEs will develop payment protocols and procedures and will track payments made to pilot providers. They will monitor and track pilot services and report on metrics for rapid cycle and summative evaluations. LPEs will provide technical assistance to health plans and providers and will participate in “learning communities.”

CMS authorized $650 million in federal and state Medicaid funding for the pilot over five years, $100 million of which will be available for capacity building. The state will distribute funding for the pilots to the participating health plans. Funding for each plan, which is outside of their capitation rate, will be a capped allocation based on the volume and cost of pilot services delivered to enrollees, including an administrative fee. Health plans will distribute funds to lead pilot entities. The LPEs will then distribute funds to providers authorized to deliver pilot services. The majority of pilot funding must be used to deliver pilot services. To ensure pilot funding is not used for a single domain (e.g., housing) or for a single population, the state plans to establish requirements regarding the minimum share of pilot funds that must be used for each of the four domains and across populations. LPEs may use capacity building funding to develop infrastructure/systems to prepare providers to deliver services, receive payment, and report on managing patient care. LPEs may also use capacity building funds for monitoring and program integrity purposes as well as for providing technical assistance. Federal financial participation (FFP) will be calculated based on aggregated amounts actually paid by the state to pilot providers, LPEs, and health plans.15 

Pilot services will be reimbursed through two methods: fee-for-service/cost-based reimbursement and bundled payments. The state must develop and submit fee schedules, cost-based reimbursement service sets, and bundled payment fee schedules to CMS for review no later than July 1, 2019. Over the course of the demonstration, the state must incorporate value-based payments for pilot services, increasingly linking payments for pilot services to health outcomes. The state will incorporate incentive payments in demonstration years one and two, withholds in years three and four, and shared savings arrangements in year five.

The state must develop an evaluation design for the pilot program, and must use an independent evaluator to conduct a summative pilot program evaluation as well as rapid cycle assessments. The rapid cycle assessments will help the state identify which interventions are most and least effective, so the state can make any necessary mid-course adjustments. Evaluation activities will also help the state identify effective services to incorporate into managed care statewide after the pilot ends.

The state’s Section 1115 waiver was approved for a 5-year period from November 1, 2019 through October 31, 2024. The state will release a Request for Proposal (RFP) in two to four regions detailing roles and responsibilities for LPEs by November 1, 2019. The state anticipates that the pilots will begin delivering services in late 2020.16 

Looking Ahead

CMS’s approval of North Carolina’s enhanced case management pilots within the state’s new Medicaid managed care delivery system is notable, as Medicaid funds typically cannot be used to pay directly for non-medical interventions that target the social determinants of health and as the Trump administration has been largely focused on more restrictive policies that may result in coverage loss, like work requirements, in its effort to help states address determinants of health and improve health outcomes. In contrast, the pilots approved in North Carolina will use coverage, and service provision, to support health-related needs. The pilot program may yield important evidence involving how addressing certain non-medical needs may impact program costs and health outcomes. However, the scope and impact of the program is restricted by its limited funding. Implementing a long-term program on a broader scale would require larger sustainable financing streams and it’s unclear at this point whether CMS will use this waiver as a model for other states. managed care delivery system is notable, as Medicaid funds typically cannot be used to pay directly for non-medical interventions that target the social determinants of health and as the Trump administration has been largely focused on more restrictive policies that may result in coverage loss, like work requirements, in its effort to help states address determinants of health and improve health outcomes. In contrast, the pilots approved in North Carolina will use coverage, and service provision, to support health-related needs. The pilot program may yield important evidence involving how addressing certain non-medical needs may impact program costs and health outcomes. However, the scope and impact of the program is restricted by its limited funding. Implementing a long-term program on a broader scale would require larger sustainable financing streams and it’s unclear at this point whether CMS will use this waiver as a model for other states.

Appendix

Healthy Opportunities Pilot Services Examples
HousingTenancy support and sustaining services
  • Assisting with identifying housing preferences, completing housing application and selection process, developing housing support plan, completing reasonable accommodations requests, reducing risk of eviction (conflict resolution etc.)
  • Supports for budgeting and financial literacy and independent living skills
  • Assessing housing/living environment health risks
  • Assisting with moving into stable housing through arranging the move, assessing unit’s readiness for move-in
  • Providing funding for utility set-up and moving costs (provided funding is not available through any other program)

Housing quality and safety improvement services

  • Repairs or remediation for issues such as mold or pest infestation
  • Modifications to improve housing accessibility (e.g., ramps, rails) and safety (e.g., grip bars in bathtubs)

Legal assistance

  • Connecting enrollees with community resources to address legal issues impacting housing

Securing housing payments

  • Providing one-time payments for security deposits and first month’s rent (provided funding is not available through any other program)

Short-term post-hospitalization

  • Housing for short period of time post-hospitalization, not to exceed six months, if individual is at imminent risk of homelessness (provided funding is not available through any other program)
FoodFood support services
  • Assisting with SNAP and WIC applications, accessing school-based food programs, and locating food banks or food programs
  • Nutrition counseling and education
  • Funding for meal and food support from food banks or other community-based food programs

Meal delivery services

  • Funding for targeted nutritious food or meal delivery services for individuals with medical or medically-related special dietary needs (provided funding is not available through any other program)
TransportationNon-emergency health-related transportation
  • Transportation services to social services that promote community engagement
  • Providing education assistance in gaining access to public transit
  • Providing payment for public transportation to support ability to access pilot and other community-based and social services
Interpersonal Violence (IPV) / Toxic StressIPV-related transportation
  • Transportation to/from IPV service providers

IPV and parenting

  • Assistance with linkages to community-based social service and mental health agencies with IPV expertise

Support resources

  • Assistance with linking to child care and after school programs
  • Assistance with linking to programs to increase capacity to participate in community engagement
  • Navigational services that improve safety and health of IPV victims (e.g., obtaining new phone number and mailing address, securing shelter and longer-term housing, connecting enrollees to medical-legal partnerships)

Legal assistance

  • Connecting beneficiary to legal services for IPV related issues

Child-parent support

  • Evidence-based parenting support programs and home-visiting services
  • Dyadic therapy treatment for children/adolescents at risk of attachment disorder

SOURCE: North Carolina’s Medicaid Reform Demonstration, approved October 19, 2018, see Attachment G.

Endnotes

  1. “About Social Determinants of Health,” World Health Organization, accessed March 22, 2019, http://www.who.int/social_determinants/sdh_definition/en/. ↩︎
  2. Under federal Medicaid managed care rules, Medicaid MCOs may have flexibility to pay for non-medical services through “in-lieu-of” authority and/or “value-added” services. “In-lieu-of” services are a substitute for covered services and may qualify as a covered service for the purposes of capitation rate setting. “Value-added” services are extra services outside of covered contract services and do not qualify as a covered service for the purposes of capitation rate setting. ↩︎
  3. The federal court that’s ruled on this issue so far rejected the contention that the Secretary could focus on alternative criteria, including health and well-being, in approving the demonstration project, instead of the objective to promote affordable health coverage. See: https://ecf.dcd.uscourts.gov/cgi-bin/show_public_doc?2018cv1900-58. ↩︎
  4. Session Law 2015-245, General Assembly of North Carolina, Session 2015, http://www.ncleg.net/Sessions/2015/Bills/House/PDF/H372v8.pdf as amended by Session Law 2016-121, General Assembly of North Carolina, Session 2016, https://www.ncleg.net/EnactedLegislation/SessionLaws/HTML/2015-2016/SL2016-121.html. ↩︎
  5. North Carolina Amended 1115 Demonstration Application, submitted November 20, 2017, https://www.medicaid.gov/Medicaid-CHIP-Program-Information/By-Topics/Waivers/1115/downloads/nc/nc-medicaid-reform-pa2.pdf. ↩︎
  6. CMS did not approve a number of provisions requested by the state. The state notes that it will continue to negotiate the following waiver provisions with CMS: uncompensated care pool for tribal providers, workforce innovation fund, and behavioral health home capacity-building funds. See: https://files.nc.gov/ncdhhs/CMS-1115-Approval-FactSheet-FINAL-20181024.pdf. ↩︎
  7. North Carolina Amended 1115 Demonstration Application, submitted November 20, 2017, https://www.medicaid.gov/Medicaid-CHIP-Program-Information/By-Topics/Waivers/1115/downloads/nc/nc-medicaid-reform-pa2.pdf. ↩︎
  8. Prior to the implementation of BH I/DD tailored plans, BH I/DD qualified enrollees will remain in the FFS Medicaid system for physical health services and in the state’s 1915(b) program for BH I/DD services instead of being mandatorily enrolled in the “standard” plan. ↩︎
  9. North Carolina Department of Health and Human Services, North Carolina’s Healthy Opportunities Pilots: A Review of Proposed Design for Interested Stakeholders, February 15, 2019, https://files.nc.gov/ncdhhs/documents/Healthy-Opportunities-Pilot_Policy-Paper_2_15_19.pdf. ↩︎
  10. For waiver budget neutrality purposes, pilot services are being treated as “hypothetical” – meaning, CMS considers these expenditures would have been eligible to receive FFP elsewhere in the Medicaid program (e.g., under section 1915 or under state plan authority). Subsequently, CMS does not require savings to offset these expenditures as part of the Section 1115 waiver. See: SMD # 18-009 Budget Neutrality Policies for Section 1115(a) Medicaid Demonstration Projects, August 22, 2018, https://www.medicaid.gov/federal-policy-guidance/downloads/smd18009.pdf. ↩︎
  11. North Carolina Department of Health and Human Services, North Carolina’s Healthy Opportunities Pilots: A Review of Proposed Design for Interested Stakeholders, February 15, 2019, https://files.nc.gov/ncdhhs/documents/Healthy-Opportunities-Pilot_Policy-Paper_2_15_19.pdf. ↩︎
  12. North Carolina Medicaid Reform Demonstration (11-W00313/4), approved October 19, 2018, https://www.medicaid.gov/Medicaid-CHIP-Program-Information/By-Topics/Waivers/1115/downloads/nc/nc-medicaid-reform-ca.pdf. ↩︎
  13. North Carolina Department of Health and Human Services, Using Standardized Social Determinants of Health Screening Questions to Identify and Assist Patients with Unmet Health-related Resource Needs in North Carolina, April 5, 2018, https://files.nc.gov/ncdhhs/documents/SDOH-Screening-Tool_Paper_FINAL_20180405.pdf. ↩︎
  14. North Carolina Department of Health and Human Services, North Carolina’s Healthy Opportunities Pilots: A Review of Proposed Design for Interested Stakeholders, February 15, 2019, https://files.nc.gov/ncdhhs/documents/Healthy-Opportunities-Pilot_Policy-Paper_2_15_19.pdf. ↩︎
  15. For waiver budget neutrality purposes, pilot services are being treated as “hypothetical” – meaning, CMS considers these expenditures would have been eligible to receive FFP elsewhere in the Medicaid program (e.g., under section 1915 or under state plan authority). Subsequently, CMS does not require savings to offset these expenditures as part of the Section 1115 waiver. See: SMD # 18-009 Budget Neutrality Policies for Section 1115(a) Medicaid Demonstration Projects, August 22, 2018, https://www.medicaid.gov/federal-policy-guidance/downloads/smd18009.pdf. ↩︎
  16. NC Medicaid, Healthy Opportunities Pilots Fact Sheet, https://files.nc.gov/ncdhhs/SDOH-HealthyOpptys-FactSheet-FINAL-20181114.pdf. ↩︎

House Appropriations Committee Approves FY 2020 Health and Human Services (HHS) Appropriations Bill

Published: May 13, 2019

The House Appropriations Committee approved the FY 2020 Labor, Health and Human Services, and Education (LHHS) appropriations bill (and accompanying report) on May 8, 2019. The LHHS appropriations bill, which provides funding for U.S. global health programs, includes funding at the Centers for Disease Control and Prevention (CDC) and the National Institutes of Health (NIH).[i]

Key highlights are as follows (see table for additional detail):

  • Funding provided to CDC for global health totaled $524 million, an increase of $35 million above the FY 2019 enacted level ($489 million) and $74 million above the President’s FY 2020 request.
    • The bill includes $128.4 million for global HIV/AIDS, matching the FY19 enacted level and $58.9 million above the FY20 Request ($69.5 million).
    • The bill includes $10 million for global tuberculosis (TB). This funding is in addition to funding provided through a transfer from the “HIV/AIDS, Viral Hepatitis, STD and TB Prevention” account at CDC.
    • Funding for global immunization programs at CDC totals $226 million, matching the FY19 enacted level and $20 million above the FY20 Request ($206 million).
      • Funding for polio, which is included under global immunization funding, totals $176 million, matching the FY19 enacted level; the President’s FY20 request did not specify a funding amount for polio at CDC.
      • Funding for CDC’s other global vaccines/measles program, which is included under global immunization funding, totals $50 million, matching the FY19 enacted level; the President’s FY20 request did not specify a funding amount for other global vaccines/measles at CDC.
    • Funding for parasitic diseases and malaria totals $26 million, matching the FY19 enacted level and $1.5 million above the FY20 Request ($24.5 million).
    • Funding for the global public health protection program at CDC totals $133.2 million, $25 million above the FY19 enacted level ($108.2 million) and -$16.6 million below the President’s FY20 Request ($149.8 million).
      • Funding for the global disease detection and emergency response program, which is included under global public health protection, totals $123.4 million, $25 million above the FY19 enacted level ($98.4 million).
      • Funding for the global public health capacity development program, which is included under global public health protection, totals $9.8 million, matching the FY19 enacted level.
  • Funding for the Fogarty International Center (FIC) at NIH totaled $85 million, a $7 million increase above the FY 2019 enacted level ($78 million) and $18 million above the President’s FY 2020 request ($67 million).

Resources:

  • FY2020 Labor, Health and Human Services, and Education Appropriations Bill
  • FY2020 Labor, Health and Human Services, and Education Appropriations Report
  • Details on U.S. global health funding provided in the House FY 2020 State & Foreign Operations (SFOPs) Appropriations Bill, which was approved by the subcommittee on May 10, 2019 and by the full committee on May 16, 2019 can be found here.

The table (.xls) below compares global health funding in the FY 2020 House SFOPs and LHHS appropriations bills to the FY 2019 enacted funding amounts as outlined in the “Consolidated Appropriations Act, 2019” (P.L. 116-6; KFF summary here) and the President’s FY 2020 request (KFF summary here).

Table: KFF Analysis of FY20 House HHS Funding for Global Health
Department / Agency / AreaFY19Enacted(millions)FY20Request(millions)FY20House(millions)Difference(millions)
FY20 House- FY19 EnactedFY20 House- FY20 Request
Health & Human Services (HHS)
Centers for Disease Control & Prevention (CDC) – Total Global Health$488.6$449.8$523.6$35.0 (7%)$73.9 (16%)
Global HIV/AIDS$128.4$69.5$128.4$0(0%)$58.9(85%)
Global Tuberculosisi –$10.0 – –
Global Immunization$226.0$206.0$226.0$0(0%)$20.0(10%)
Polio$176.0Not specified$176.0$0(0%) –
Other Global Vaccines/Measles$50.0Not specified$50.0$0(0%) –
Parasitic Diseases & Malaria$26.0$24.5$26.0$0(0%)$1.5(6%)
Global Public Health Protectionii$108.2$149.8$133.2$25.0(23%)$-16.6(-11%)
Global Disease Detection and Emergency Response$98.4Not specified$123.4$25.0(25%) –
of which Global Health Security (GHS)$50.0$99.8Not specified – –
Global Public Health Capacity Development$9.8Not specified$9.8$0(0%) –
National Institutes of Health (NIH) – Total Global Health$880.2$760.1Not specified – –
HIV/AIDS$590.1$511.1Not specified – –
Malaria$212.0$182.0Not specified – –
Fogarty International Center (FIC)$78.1$67.0$84.9$6.8(9%)$17.9(27%)
Notes:
i – Tuberculosis totals do not include the transfer of funding from the “HIV/AIDS, Viral Hepatitis, STI and TB Prevention” account at CDC. In FY20, the administration proposed to transfer $7.2 million from the “HIV/AIDS, Viral Hepatitis, STI and TB Prevention” account to “Global Tuberculosis” activities.
ii – In the CDC FY20 congressional justification, this funding line is titled “Global Disease Detection and Other Programs”. The full breakdown in funding for “Global Public Health Protection,” which includes “Global Disease Detection and Emergency Response,” “Global Health Security,” and “Global Public Health Capacity” is not yet known for the draft House FY20 bill. However, the draft bill includes $99.8 million for “global public health protection,” and the committee report specifies $123.4 million for “Global Disease Detection and Emergency Response.” These totals will be updated as more information becomes available.

Health and Health Care in the U.S. by Race and Ethnicity

Published: May 10, 2019

Disparities in health and health care remain a persistent challenge in the United States, resulting in inequities, limiting overall improvements in quality of care and health, and resulting in unnecessary costs. Disparities occur across a broad range of dimensions, including race/ethnicity. Using the most recently available data across a range of data sources, these infographics provide data on demographics; health coverage, access, and utilization; and health outcomes by racial and ethnic group, including Blacks, Hispanics, Asians and Native Hawaiians and Other Pacific Islanders, and American Indians and Alaska Natives, relative to Whites.

News Release

Individual Market Insurers Are Expecting to Pay a Record $800 Million in Rebates to Consumers for Excessive Premiums in 2018

Insurers Saw Their Best Annual Financial Performance to Date Under the Affordable Care Act

Published: May 8, 2019

Individual market insurers are expecting to return to consumers a record total of about $800 million in excess premiums for 2018, a year in which the insurance companies posted their best annual financial performance under the Affordable Care Act to date, finds a new KFF analysis.

The rebates to more than 3 million eligible individual market consumers, based on preliminary estimates by insurers, must be issued by September 30. They are the result of the insurance companies not meeting the ACA’s medical loss ratio threshold, which requires insurers to spend at least 80 percent of premium revenues on health care claims or quality improvement activities.

On average, premiums per enrollee in the individual market grew 26 percent from 2017 to 2018, to $559, while per person claims grew only 7 percent, to $392. The analysis finds insurance companies posted their strongest performance in the individual market under the ACA to date, using two different financial indicators:

  • The average share of health premiums paid out in claims (or loss ratio) fell to 70 percent in 2018, down from 82 percent in 2017, 96 percent in 2016 and 103 percent in 2015.
  • Average premiums collected in excess of claims (or gross margins) reached $167 per enrollee per month, up from comparable figures of $79 in 2017, $14 in 2016 and -$9 in 2015.

Financial results for 2018 suggest that insurers in the individual market are generally returning to or exceeding profitability levels seen before 2014, when ACA insurance market rules took effect, including the requirement to cover people with pre-existing conditions.

Premium and claims data from 2018 support the notion that premium increases in 2018 were in large part compensating for uncertainty and policy changes such as the cessation of cost sharing subsidy payments, with some insurers over-correcting and raising premiums more than necessary to cover claims and administrative costs and earn a reasonable profit, the analysis finds. Even though repeal of the individual mandate penalty and the Trump administration’s push to expand loosely regulated insurance options had an upward effect on 2019 premiums, increases were mitigated by the prior year’s over-correction. On average, premiums went down a bit in 2019.

The analysis is based on insurer-reported financial data, including information from the National Association of Insurance Commissioners, compiled and maintained by Mark Farrah Associates.

Individual Insurance Market Performance in 2018

Authors: Cynthia Cox, Rachel Fehr, and Larry Levitt
Published: May 7, 2019

Issue Brief

Note: An analysis of first quarter 2019 data for the individual insurance market is available here.

The early years of the Affordable Care Act (ACA) exchanges and broader ACA-compliant individual market were marked by volatility. Markets in some parts of the country have remained fragile, with little competition, an insufficient number of healthy enrollees to balance those who are sick, and high premiums as a result. By 2017, however, the individual market generally had begun to stabilize. Absent any policy changes, it is likely insurers would have required only modest premium increases to regain or maintain profitability in 2018.

However, by mid-2017 when insurers were considering 2018 premiums and participation, it was unclear whether the individual mandate would be enforced, cost-sharing subsidies would be paid, or the ACA as a whole would remain law. In October 2017, the Trump Administration ceased payments for cost-sharing subsidies, which led some insurers to exit the market or request larger premium increases than they would have otherwise. The Administration also reduced funding for advertising and outreach. And, Congress ultimately repealed the individual mandate penalty, effective for 2019. Amid these policy changes and legislative uncertainty, insurers raised benchmark premiums by an average of 34% going into 2018.

In this analysis, we find individual market insurers saw better financial performance in 2018 than in all the earlier years of the ACA and returned to, or even exceeded, pre-ACA levels of profitability. Premiums fell slightly on average for 2019, as it became clear that some insurers had raised 2018 rates more than was necessary. It is likely premiums would have fallen even more if the individual mandate penalty were still in effect.

In this brief, we use financial data reported by insurance companies to the National Association of Insurance Commissioners and compiled by Mark Farrah Associates to look at the average premiums, claims, medical loss ratios, gross margins, and enrollee utilization from 2011 through 2018 in the individual insurance market, as well as the amount of medical loss ratio rebates insurers expect to issue to 2018 enrollees. These figures include coverage purchased through the ACA’s exchange marketplaces and ACA-compliant plans purchased directly from insurers outside the marketplaces (which are part of the same risk pool), as well as individual plans originally purchased before the ACA went into effect.

Our analysis also finds that insurers are expecting to pay a record total of about $800 million in rebates to individual market consumers for not meeting the ACA medical loss ratio threshold, which requires them to spend at least 80% of premium revenues on health care claims or quality improvement activities. This comes from initial estimates reported by insurers; actual rebates could end up being either higher or lower. In total, across the individual, small group, and large group markets, insurers expect to issue about $1.4 billion in rebates this year based on their 2018 performance. If insurer expectations hold true, these will be the largest consumer rebates issued since the MLR program began.

These new data from 2018 offer further evidence that insurers in the individual market are regaining profitability, though more recent policy and legislative changes taking effect in 2019 – the repeal of the individual mandate penalty as part of tax reform legislation and the proliferation of loosely-regulated short-term insurance plans – continue to cloud expectations somewhat for the future.

Medical Loss Ratios

As we found in our previous analysis, insurer financial performance as measured by loss ratios (the share of health premiums paid out as claims) worsened in the earliest years of the ACA Marketplaces, but began to improve more recently. This is to be expected, as the market had just undergone significant regulatory changes in 2014 and insurers had very little information to work with in setting their premiums.

The chart below shows simple loss ratios, which differ from the formula used in the ACA’s MLR provision.1  Loss ratios began to decline in 2016, suggesting improved financial performance. In 2017, following relatively large premium increases, individual market insurers saw significant improvement in loss ratios, a sign that individual market insurers on average were beginning to better match premium revenues to claims costs. Loss ratios have continued to decline, averaging 70% in 2018. This suggests insurers were able to build in the loss of cost-sharing subsidy payments when setting premiums and some insurers likely over-corrected.

Figure 1: Average Individual Market Medical Loss Ratios, 2011 – 2018

Margins

Another way to look at individual market financial performance is to examine average gross margins per member per month, or the average amount by which premium income exceeds claims costs per enrollee in a given month. Gross margins are an indicator of performance, but positive margins do not necessarily translate into profitability since they do not account for administrative expenses.

Figure 2: Average Individual Market Gross Margins Per Member Per Month, 2011 – 2018

Gross margins show a similar pattern to loss ratios. Insurer financial performance improved dramatically through 2018 (increasing to $167 per enrollee, from a recent annual low of -$9 in 2015). These data suggest that insurers in this market are now financially healthy, on average.

Driving recent improvements in individual market insurer financial performance are the premium increases in 2018 combined with more modest growth in claims for medical expenses. On average, premiums per enrollee grew 26% from 2017 to 2018, while per person claims grew only 7%. This growth in premiums is in part due to the loss of cost-sharing subsidy payments; insurers are required by law to provide cost-sharing subsidies to eligible enrollees, but are no longer being reimbursed by the federal government. Rate hikes to offset the termination of federal cost-sharing subsidy payments were a major factor in 2018 premium increases.

Figure 3: Average Individual Market Monthly Premiums and Claims Per Person, 2011 – 2018

One concern about rising premiums in the individual market was whether healthy enrollees would drop out of the market in large numbers rather than pay higher rates. While the vast majority of exchange enrollees are subsidized and sheltered from paying premium increases, those enrolling off-exchange would have to pay the full increase. Despite this dynamic, the average number of days individual market enrollees spent in a hospital in 2018 was slightly lower than inpatient days in the previous three years.2 

Figure 4: Average Individual Market Monthly Hospital Patient Days Per 1,000 Enrollees, 2011 – 2018

Taken together, these data on claims and utilization suggest that the individual market risk pool is relatively stable, though sicker on average than the pre-ACA market, which is to be expected since people with pre-existing conditions have guaranteed access to coverage under the ACA. Despite concerns that healthier enrollees may be dropping out of the market in recent years, somewhat lower average inpatient days indicate that the individual market did not get sicker, on average, during 2018.

Expected Rebates

The medical loss ratio (“MLR”) provision of the ACA requires most insurance companies that cover individuals to spend at least 80% of their premium income on health care claims and quality improvement, leaving the remaining 20% for administration, marketing, and profit. Beginning in 2012, insurers failing to meet the applicable MLR standard for the prior year (2011) were required to issue rebates to consumers and employers. Thus far, the 2011 rebates had remained the largest ever issued – totaling $399 million in the individual market alone (and $1.071 billion across the individual, small group, and large group markets).

Insurers’ preliminary estimates indicate they expect to issue about $800 million in rebates to 2018 individual market enrollees, which would be the highest total for the individual market by far since the program began. While this represents initial insurer estimates, and the actual rebate amount issued could be lower or higher3 , these high expected rebates provide further evidence that some insurers over-corrected in raising individual market premiums for 2018.

Insurers estimate more than 3 million 2018 individual market enrollees, or 26%, are eligible to receive rebates. Insurers owing rebates expect to issue about $260 per member, on average. All rebates must be issued by September 30 of the year following the applicable MLR reporting period (i.e., September 2019 for the 2018 reporting period).

Across all commercial markets – individual, small group, and large group – rebates are expected to total approximately $1.4 billion. If insurer estimates hold true, these will be the largest rebates issued since the MLR program began. These higher rebates are mostly driven by the individual market. Rebates in the small and large group markets are expected to be larger than average, but not significantly so.

Discussion

Annual results from 2018 suggest that despite significant challenges and recent enrollment declines, insurers in the individual insurance market are now generally profitable. Insurer financial results from 2018 – after the Administration’s decision to cease cost-sharing subsidy payments, but before the repeal of the individual mandate penalty in the tax overhaul went into effect – reveal the most favorable year in the ACA-compliant market’s history.

Premium and claims data support the notion that 2017 premium increases were necessary as a one-time market correction to adjust for a sicker-than-expected risk pool, and premium increases in 2018 were in large part compensating for policy uncertainty and the termination of cost-sharing subsidy payments, though some insurers appear to have over-compensated. Without these policy changes, it is likely that insurers would generally have required only modest premium increases in 2018. Low loss ratios and higher margins indicate that some insurers raised premiums more than was necessary to cover claims and administrative costs and earn a reasonable profit in 2018.

Across the individual market, insurers expect to pay record-high rebates to consumers for failing to meet the medical loss ratio requirement, providing further evidence that insurers over-corrected when setting 2018 premiums. Before the ACA’s MLR provision went into effect, insurers in such a situation would have experienced windfall profits. The MLR rule requires insurers to repay consumers in the form of a cash rebate or premium credit when the prior year’s premiums are determined to have been too high relative to claims costs.

While markets in some parts of the country remain more fragile, the individual market on average is becoming more profitable. Some insurers have exited the market in recent years, but others have been successful and expanded their footprints, as would be expected in a competitive marketplace. Even though repeal of the individual mandate penalty and expansion of loosely-regulated insurance options had an upward effect on 2019 premiums, premiums actually decreased slightly because 2018 premiums were higher than necessary to cover claims costs. In 2019, new insurers have entered and some insurers are reentering markets they had previously exited. While signups through the marketplace during the 2019 open enrollment period declined somewhat compared to 2018, financial results suggest the market is still stable and sustainable.

Methods

We analyzed insurer-reported financial data from Health Coverage Portal TM, a market database maintained by Mark Farrah Associates, which includes information from the National Association of Insurance Commissioners. The dataset analyzed in this report does not include NAIC plans licensed as life insurance or California HMOs regulated by California’s Department of Managed Health Care; in total, the plans in this dataset represent at least 80% of the individual market. All figures in this issue brief are for the individual health insurance market as a whole, which includes major medical insurance plans and mini-med plans sold both on and off exchange. We excluded some plans that filed negative enrollment, premiums, or claims and corrected for plans that did not file “member months” in the annual statement but did file current year membership.

To calculate the weighted average loss ratio across the individual market, we divided the market-wide sum of total incurred claims by the sum of all unadjusted health premiums earned. Medical loss ratios in this analysis are simple loss ratios and do not adjust for quality improvement expenses, taxes, or risk program payments. Gross margins were calculated by subtracting the sum of total incurred claims from the sum of unadjusted health premiums earned and dividing by the total number of member months (average monthly enrollment) in the individual insurance market. Using earned premiums adjusted for taxes and fees to calculate loss ratios and gross margins increases the MLR by 6 percentage points and decreases the gross margin per member by $42 in 2018. On average across all years, using earned premiums adjusted for taxes and fees increases the MLR by 3 percentage points and decreases the gross margin per member by $14.

Total rebates are based on preliminary estimates from insurers. Since 2014, the total rebate amount issued across the individual, small group and large group markets has varied by 3 to 5% from insurer estimates. At the market level, the difference between estimates and actual rebate totals have been more volatile. Since 2014, individual market estimates have varied by as much as $34 million, or over 20%, as compared to the final actual rebates reported in December of the year following the applicable MLR reporting period. In some years, final rebates are higher than expected and in other years, final rebates are lower.

Endnotes

  1. The loss ratios shown in this issue brief differ from the definition of MLR in the ACA, which makes some adjustments for quality improvement and taxes, and do not account for reinsurance, risk corridors, or risk adjustment payments. Reinsurance payments, in particular, helped offset some losses insurers would have otherwise experienced. However, the ACA’s reinsurance program was temporary, ending in 2016, so loss ratio calculations excluding reinsurance payments are a good indicator of financial stability going forward. ↩︎
  2. Hospital patient days for 2014 are not necessarily representative of the full year because open enrollment was longer that year and a number of exchange enrollees did not begin their coverage until mid-year 2014. ↩︎
  3. See Methods for more discussion on how insurer estimates tend to vary from actual rebate totals. ↩︎