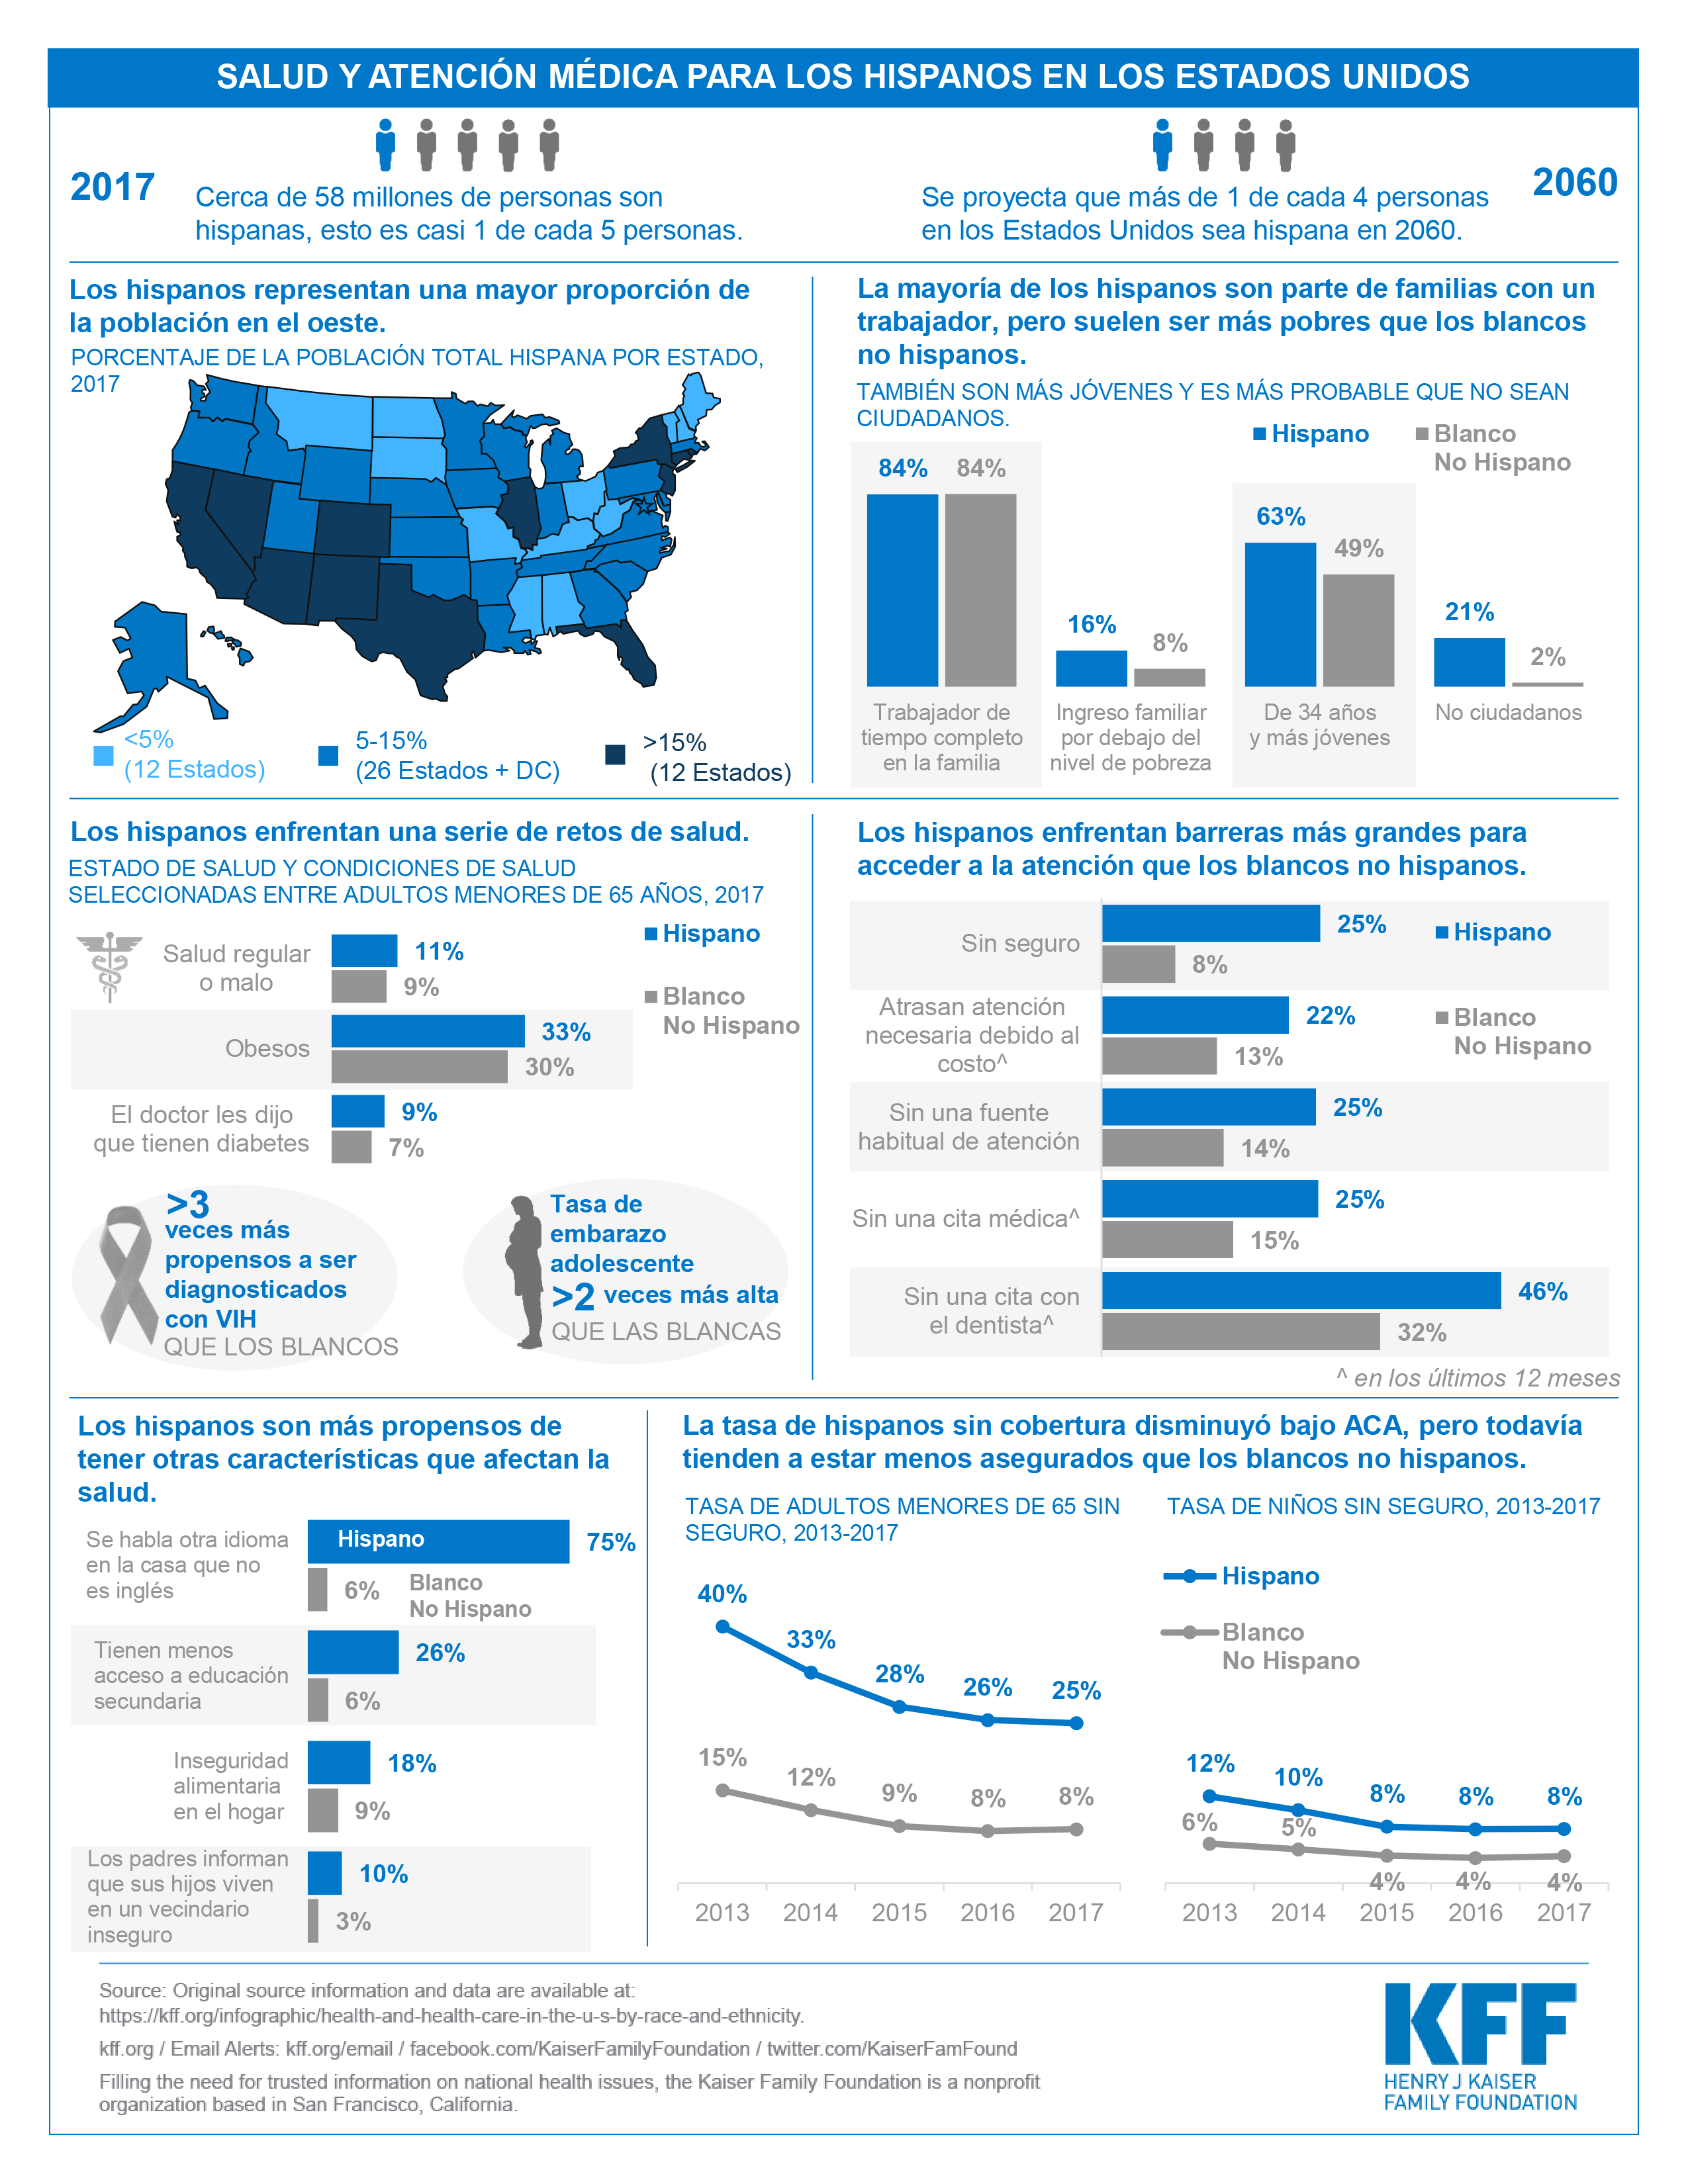
Insurance Coverage Among Nonelderly Adults with HIV in Medicaid Expansion and Non-expansion States, 2015
The independent source for health policy research, polling, and news.
As policymakers debate how to address the high cost of prescription drugs, a new KFF analysis compares data on prescription drug spending and use across large employer plans, Medicare Part D and Medicaid, and provides context for policy discussions about different approaches to curb rising drug costs that would affect people covered by each of the three major payers.
The data show that private insurers, Medicare and Medicaid account for 82 percent of retail prescription drug spending, while patients paid 14 percent of the cost out-of-pocket. However, the types of individuals covered by these payers varies, from adults 65 and over and younger people with disabilities in Medicare, to low-income children and adults including seniors and people with disabilities in Medicaid, to a comparatively healthier working-age population covered in employer health plans.
Other highlights in the data include:
The analysis is based primarily on claims data by payer, which does not account for rebates paid by drug manufacturers to pharmacy benefit managers, insurers, and state Medicaid programs. Rebates differ by payer, and are estimated to be larger for Medicaid than Medicare Part D or private employers.
The analysis is available at both kff.org and the Peterson-Kaiser Health System Tracker.
For more KFF data and analysis on this subject, visit our special resource page on prescription drugs
Prescription drug costs are a pressing concern for both consumers and policymakers. Rising drug prices affect patients’ out-of-pocket costs as well as the budgets of private and public payers, though the challenges vary by payer. This analysis compares prescription drug spending and use in large private employer plans, Medicare Part D, and Medicaid, based primarily on claims data by payer, which does not account for rebates. Rebates differ by payer, and are estimated to be larger for Medicaid than Medicare Part D or private employers.
Spending by private health insurers, Medicare, and Medicaid accounts for a majority of prescription drug spending in the U.S., but the types of individuals who receive prescription drug coverage from these three payers varies:
This variation in the types of individuals covered by each payer is reflected in some of the patterns of prescription drug spending and use presented below.
Highlights from this analysis include:

In 2017, total U.S. retail prescription drug spending was $333 billion, after accounting for rebates, with the majority (82%) of spending incurred by the three major sources of payment in the U.S. health system: private health insurance, Medicare, and Medicaid. Among all payers, private health insurance accounted for the largest share of drug spending, at 42%, followed by Medicare at 30%, and Medicaid at 10%. Patient out-of-pocket costs represented 14% of total retail drug spending.
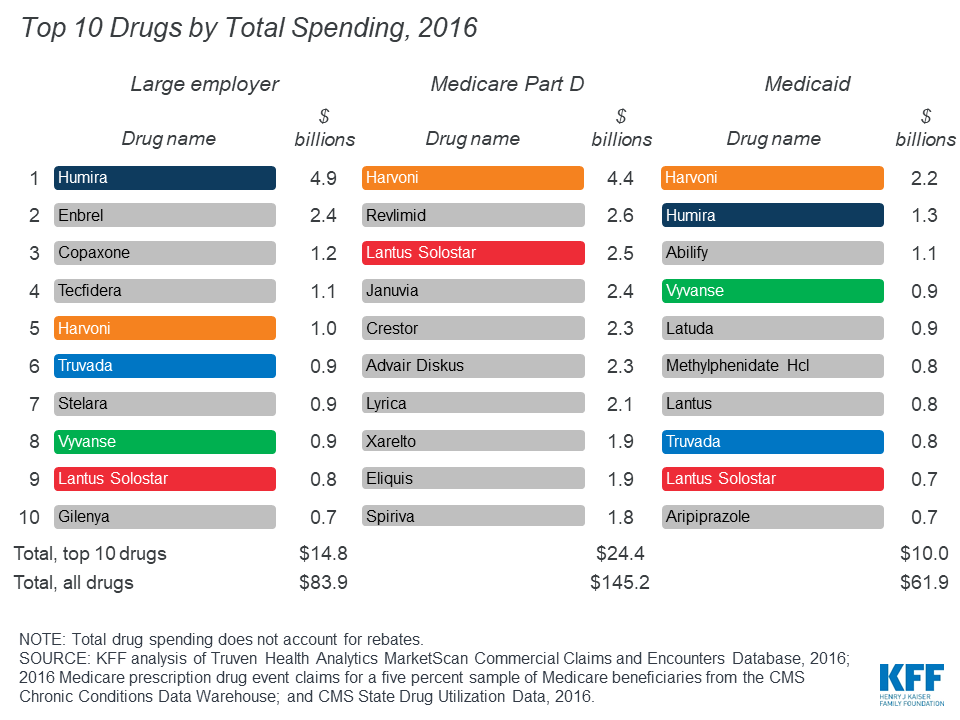
In 2017, retail prescription drug spending accounted for 13% of total personal health care spending in private health insurance plans and 15% of personal health care spending in Medicare. Drug spending as a share of personal health care spending in Medicaid was lower (6%) because Medicaid also pays for more expensive services, including long-term services and supports that are not paid for by private insurance or Medicare.
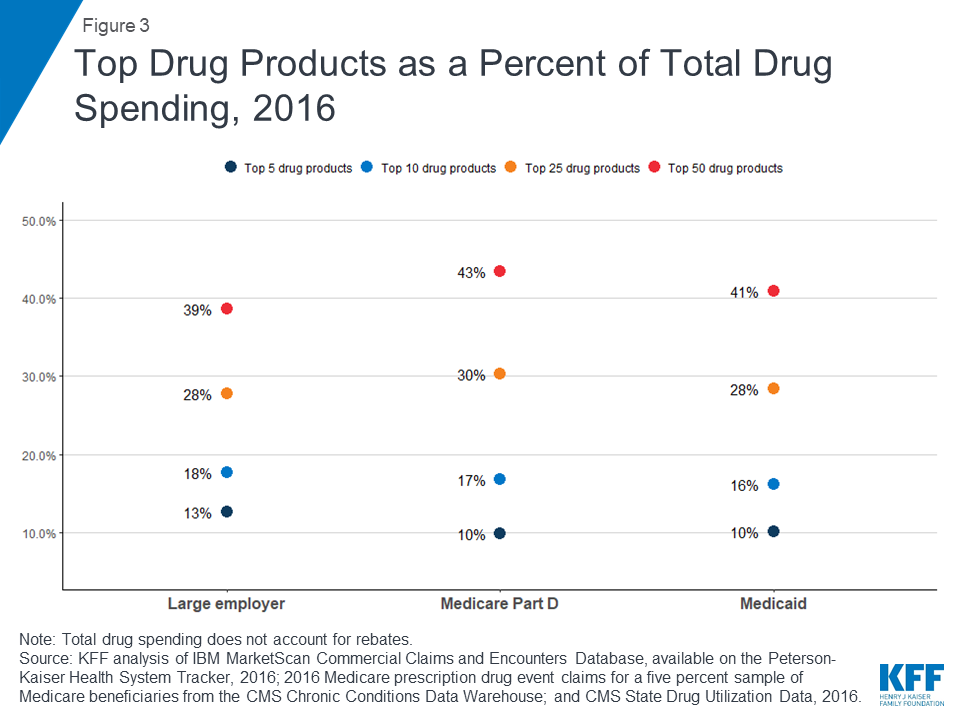
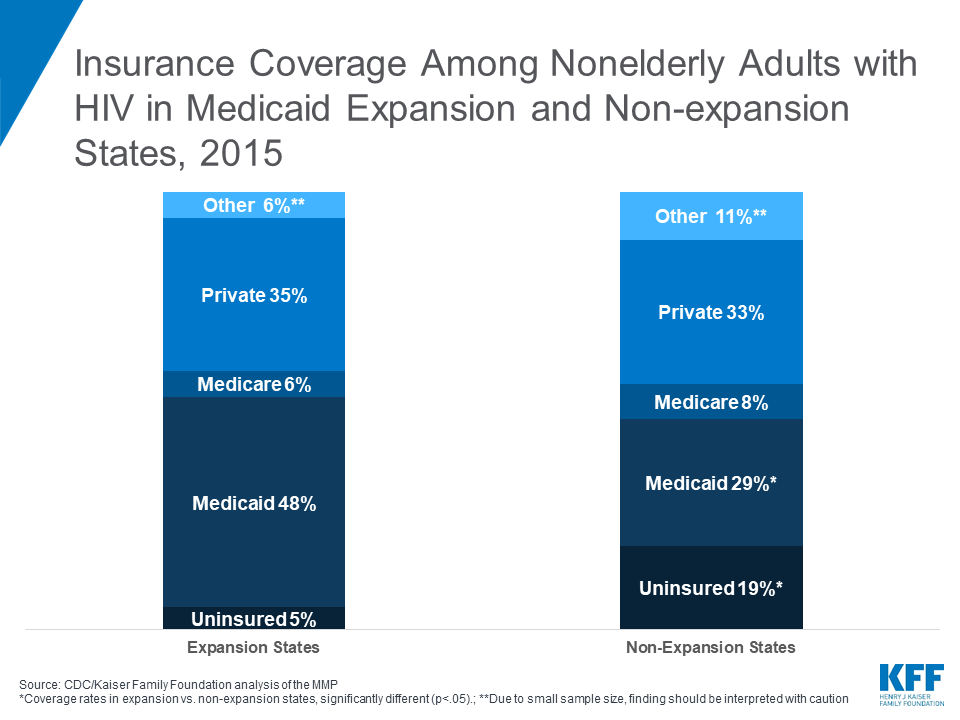
For large employer plans, Medicare Part D, and Medicaid, the top five drug products with the highest total spending alone account for at least 10% of total prescription drug spending by each payer (13%, 10%, and 10%, respectively), while the top 50 drug products account for roughly 40% of total prescription drug spending (39%, 43%, and 41%, respectively). These estimates do not account for rebates.

While the top 50 drug products account for roughly 40% of total prescription drug spending for large employers, Medicare Part D, and Medicaid, the share of total prescriptions accounted for by the top 50 drug products is much smaller: only 8% for both large employer plans and Medicaid, and 15% for Medicare Part D.

In 2016, the drug product with the highest total spending in Medicare Part D and Medicaid was Harvoni, a curative treatment for hepatitis C that was approved by the FDA in October 2014; total spending on Harvoni was $4.4 billion in Medicare Part D and $2.2 billion in Medicaid (not accounting for rebates payers may have received). The number one drug product for large employers in 2016 was Humira, a treatment for rheumatoid arthritis, with $4.9 billion in total spending (also not accounting for rebates).
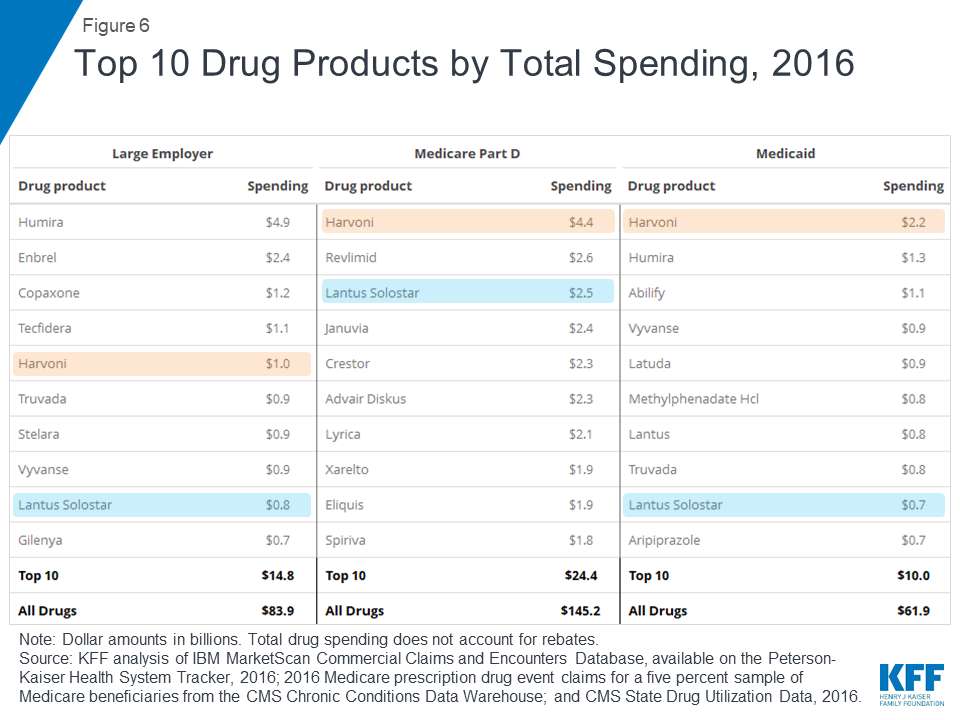
Among the top 10 drug products with the highest total spending in large employer plans, Medicare Part D, and Medicaid, there are two products in common: Harvoni, a treatment for hepatitis C, and Lantus Solostar, an insulin therapy for diabetes. There is additional overlap in the top 10 lists for large employer plans and Medicaid, including treatments for attention-deficit/hyperactivity disorder (ADHD) and HIV. Despite the overlap, the ranking of these drug products generally differs across payers, and there is also variation in which products have the largest total spending for each payer, which reflects the different types of populations covered. In particular, for Medicare Part D, the top 10 list includes treatments for cancer, chronic obstructive pulmonary disease, and high cholesterol which are more commonly used by older adults. For Medicaid, the top 10 list includes several psychotherapeutic medications, reflecting the important role that Medicaid plays in meeting the needs of people with mental illness.
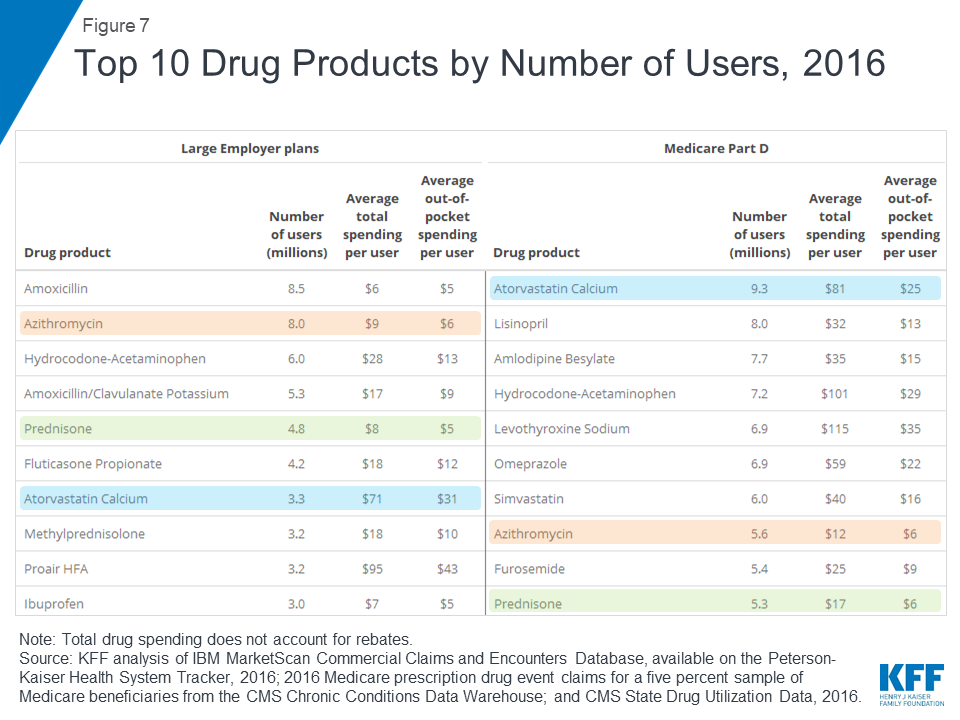
Atorvastatin calcium (generic for Lipitor), a treatment for high cholesterol, was used by 9.3 million people in Medicare Part D plans, more users than any other drug product used by Part D enrollees in 2016. The antibiotic amoxicillin was used by 8.5 million people in large employer plans in 2016, more than any other drug product used by people in large employer plans in 2016. Because the most commonly used drug products are generics, average total and out-of-pocket spending per user is relatively low for these drugs.
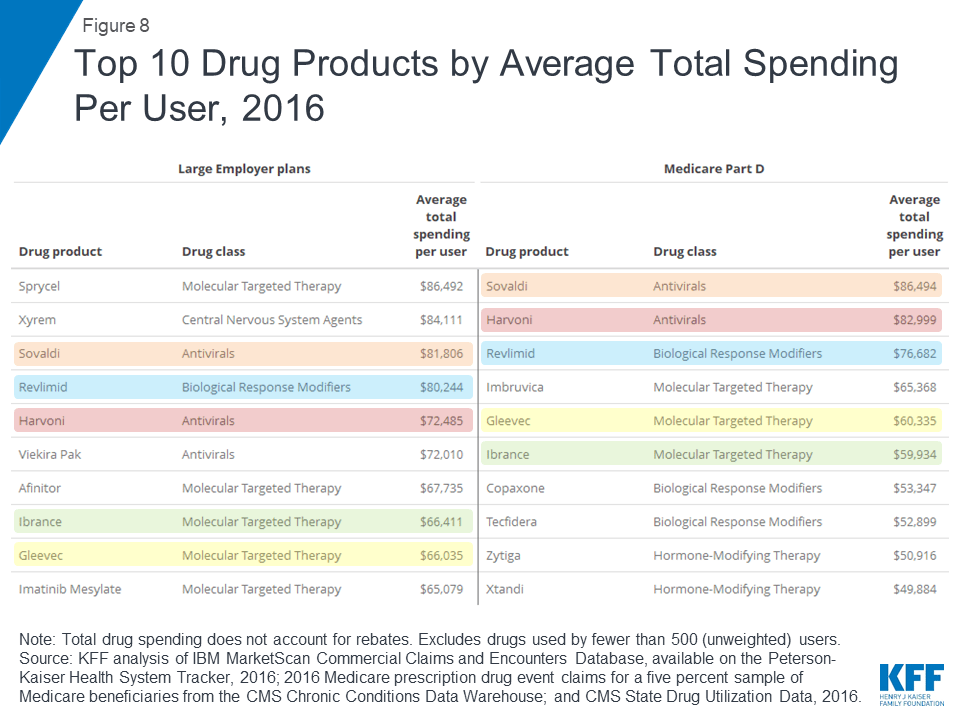
Two hepatitis C treatments, Sovaldi and Harvoni, are among the top 10 drug products by total spending per user in large employer plans and Medicare Part D, with total spending per user on both products of more than $70,000 in 2016. Cancer drugs are also among the drug products with the highest total spending per user for large employer plans and Medicare Part D, including Revlimid, Ibrance, and Gleevec, with annual costs of at least $60,000 per user.

Although there is little overlap in the specific list of top 10 drug products used by people in large employer plans and Medicare Part D in terms of annual average out-of-pocket spending per user, the types of drugs with the highest out-of-pocket costs are similar, and include drug products to treat cancer, multiple sclerosis, and rheumatoid arthritis. In 2016, people in large employer plans paid more out of pocket for Xyrem, a treatment for narcolepsy, than for other drug products—$1,568 on average. In 2016, the hepatitis C treatment Harvoni was the most expensive drug product for Part D enrollees, with $5,235 in average annual out-of-pocket costs per user among those who did not receive low-income subsidies.
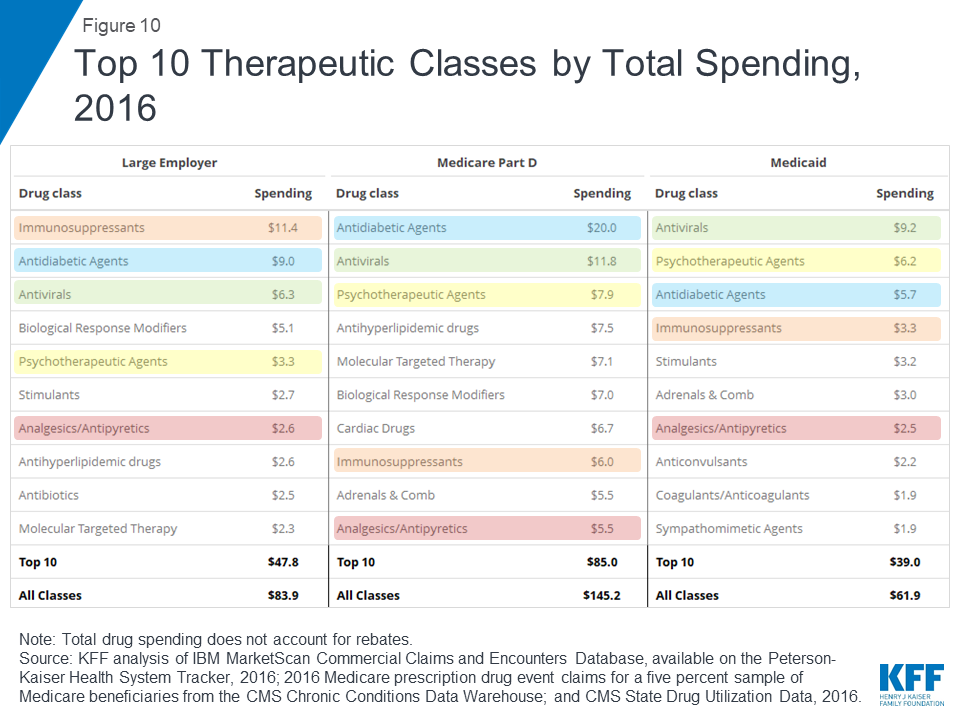
In terms of total spending on prescription drugs by therapeutic class, antidiabetic agents and antivirals are among the top 3 classes for large employer plans, Medicare Part D, and Medicaid. Total spending on antidiabetic agents, the number one class for Medicare Part D, was $20.0 billion for Part D, $9.0 billion for large employers, and $5.7 billion for Medicaid (not accounting for rebates on drug products in these classes). Total spending on antivirals, the number one class for Medicaid, was $9.2 billion for Medicaid, $11.8 billion for Medicare Part D, and $6.3 billion for large employer plans. But as with total spending by drug product, the rankings of top drug classes by spending show variation across payers that reflects variation in covered populations; for example, psychotherapeutics rank higher for Medicaid and Medicare Part D than large employers, while molecular targeted therapy (cancer treatments) rank higher for Medicare Part D than large employers.

In terms of number of prescriptions filled, the most commonly used types of drugs in large employer plans, Medicare Part D, and Medicaid include cardiac drugs and psychotherapeutic agents. The number of prescriptions for cardiac drugs—the top drug class by volume in large employer plans and Medicare Part D—was 69.9 million in large employer plans, 246.6 million in Medicare Part D, and 52.8 million in Medicaid. The number of prescriptions for psychotherapeutic agents—the number two drug class by volume in Medicaid and Medicare Part D and number three in large employer plans—was 56.2 million in large employer plans, 118.4 million in Medicare Part D, and 68.3 million in Medicaid.
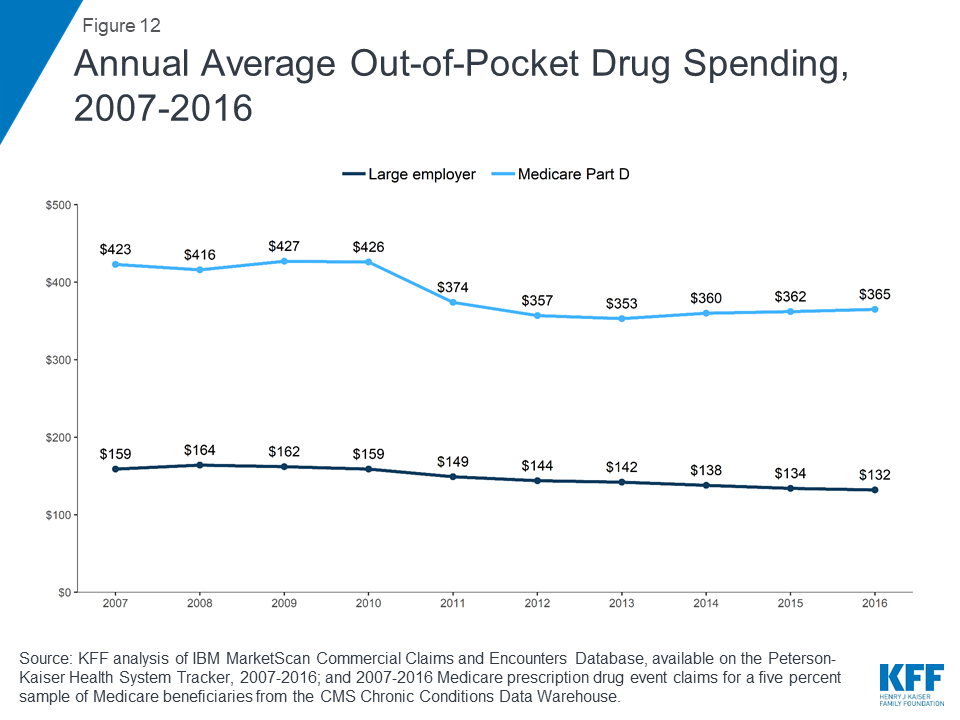
People in Medicare Part D plans spend more out of pocket on prescription drugs than people in large employer plans, on average. In 2016, people in Medicare Part D spent $365 out of pocket on drugs, more than 2.5 times the average out-of-pocket drug spending by people in large employer plans that year ($132). Between 2007 and 2016, average out-of-pocket drug spending by people in large employer plans decreased somewhat. Part D enrollees also spent less out of pocket in 2016 than in 2007, on average, but their out-of-pocket costs have been relatively flat since 2012, after decreasing between 2010 and 2012 due to a provision in the Affordable Care Act to phase out the coverage gap in the Part D benefit.
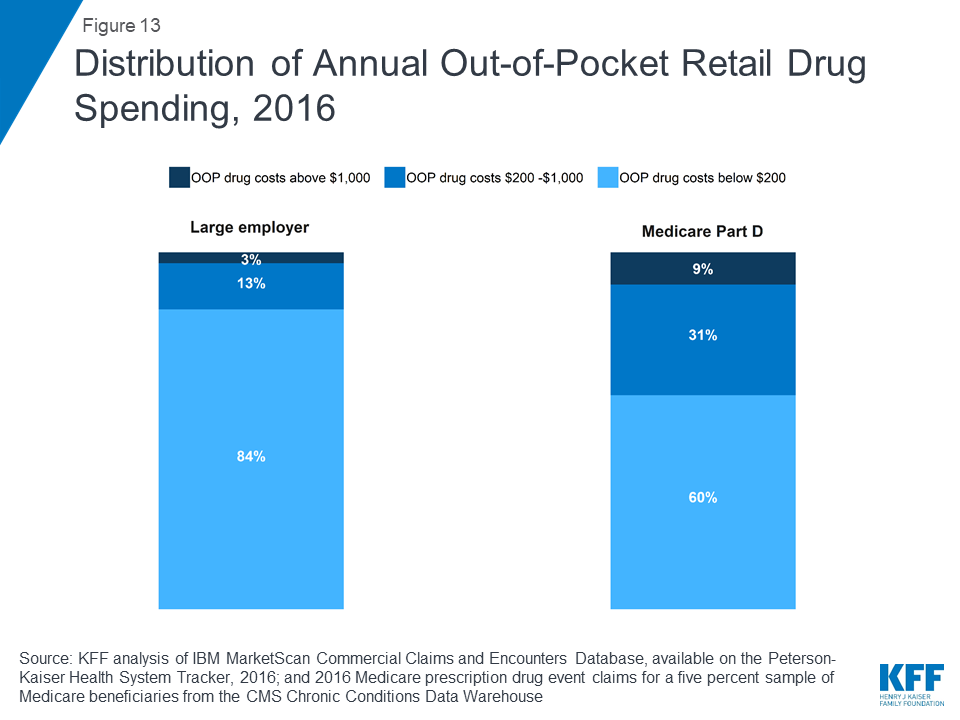
In 2016, nearly 1 in 10 people in Medicare Part D plans (9%) had out-of-pocket drug spending above $1,000, compared to 3% of people in large employer plans. Conversely, more than 8 in 10 people in large employer plans (84%) had out-of-pocket drug costs below $200, compared to 60% of people in Medicare Part D plans.
Juliette Cubanski and Matthew Rae are with KFF; Katherine Young was with KFF when the analysis was conducted. Anthony Damico is an independent consultant.
| This analysis is available both at kff.org and the Peterson-Kaiser Health System Tracker, a partnership between the Peterson Center on Healthcare and KFF. |
Our analysis of total retail prescription drug spending by payer and as a share of personal health care spending in 2017 is based on analysis of data from the National Health Expenditure Accounts (NHEA). Personal health care includes all medical goods and services that are rendered to treat or prevent a specific disease or condition in a specific person. Prescription drug expenditures in the NHEA include the retail sales of human-use dosage-form drugs, biological drugs, and diagnostic products that are available only by a prescription. Drug spending in the NHEA is adjusted to account for manufacturers’ rebates that reduce payers’ net payments for prescription drugs.
We analyzed a sample of medical claims obtained from the IBM MarketScan Commercial Claims and Encounters Database, which contains claims information provided by large employer plans. We used a subset of claims from the 2016 data. We only included claims for people under the age of 65 and people who were enrolled in a plan for more than half a year. Weights were applied to match counts in the Current Population Survey for enrollees at firms of a thousand or more by sex, age, state and whether the enrollee was a policy holder or dependent. This analysis used claims for almost 17 million people representing about 20% of the 86 million people in the large group market in 2016.
The MarketScan claims database contains information about health benefit claims and encounters for several million individuals each year provided by large employers. The advantage of using claims information to analyze out-of-pocket spending is that we can look beyond plan provisions and focus on actual payment liabilities incurred by enrollees. A limitation of these data is that they reflect cost sharing incurred under the benefit plan and do not include balance-billing payments that beneficiaries may make to health care providers for out-of-network services or out-of-pocket payments for non-covered services. Drug spending paid for by someone other than an enrollee’s insurer, drugs administered in an inpatient setting or not classified under the controlled substance act were excluded.
Each prescription drug claim was counted as a single prescription regardless of the quantity or strength of that prescription. Drugs with the same product name but separate entries in the MarketScan claims database corresponding to products with different delivery mechanisms and/or dosage forms are reported separately. Total spending does not include any rebates that may reduce the cost of the drug. MarketScan’s Red Book was used to classify drugs by the therapeutic/pharmacologic category of the drug product. Analysis of average total and out-of-pocket spending per user by drug (Figures 8 and 9) excludes drugs used by fewer than 500 (unweighted) enrollees.
We used data from the 2016 Medicare Part D prescription drug event (PDE) claims data from the Centers for Medicare & Medicaid Services (CMS) Chronic Conditions Data Warehouse (CCW) for a five percent sample of Medicare beneficiaries. Our five percent sample for 2016 includes 2,149,486 Part D enrollees (42,989,720 weighted) and 1.5 billion prescription drug events. The PDE claims data includes all prescription drug events reported by Part D plans for their enrollees in a given calendar year, and includes detailed data on spending for each event, corresponding to a single prescription drug fill, including how much was paid by plans, low-income subsidy amounts, and beneficiary out-of-pocket payments. The claims data includes spending for Part D covered drugs, but doesn’t include spending on Part D plan premiums, Part B covered drugs (which are typically administered in providers’ offices or hospital outpatient settings), or the cost of drugs purchased outside the Part D plan.
We calculated aggregate and per user average total and out-of-pocket drug spending for Part D enrollees overall, including beneficiaries with and without Part D low-income subsidies, and beneficiaries enrolled in both stand-alone prescription drug plans (PDPs) and Medicare Advantage prescription drug plans. Total spending reflects payments from all payers, including beneficiaries (out-of-pocket cost sharing amounts), but does not include rebates and discounts from pharmacies and manufacturers that are not reflected in prices at the pharmacies. Out-of-pocket costs are those paid directly by beneficiaries, not including amounts that other parties might pay on their behalf and not including the value of the manufacturer discount on brand-name drugs in the coverage gap. Drugs with the same product name but separate entries in the Part D claims data corresponding to products with different delivery mechanisms and/or dosage forms are reported separately. MarketScan’s Red Book was used to classify drugs by the therapeutic/pharmacologic category of the drug product. Analysis of average total and out-of-pocket spending per user by drug (Figures 8 and 9) excludes drugs used by fewer than 500 (unweighted) enrollees.
We used the CMS State Drug Utilization data, provided by states to CMS. These data reflect prescriptions provided through the Medicaid Drug Rebate Program. The data presents Medicaid spending, total spending, and units for each National Drug Code (NDC) in each quarter, for managed care or fee-for-service, at the state or national level. The spending data do not include any rebates, and do not include drugs purchased through 340B. Drugs with the same product name but separate entries in the Medicaid claims data corresponding to products with different delivery mechanisms and/or dosage forms are reported separately. MarketScan’s Red Book was used to classify drugs by the therapeutic/pharmacologic category of the drug product. We are unable to report average total spending per user for Medicaid prescription drug spending because the data do not include per user counts for each drug.
Intersection of State Abortion Policy and Clinical Practice, 2019
The House Appropriations Committee approved the FY 2020 State & Foreign Operations (SFOPs) appropriations bill (and accompanying report) on May 16, 2019. The SFOPs bill includes funding for U.S. global health programs at the State Department and the U.S. Agency for International Development (USAID).[i] Funding for these programs, through the Global Health Programs (GHP) account, which represents the bulk of global health assistance, totaled $9.3 billion, an increase of $459 million above the FY 2019 enacted level and almost $3 billion above the President’s FY 2020 request.
Key highlights are as follows (see table for additional detail):
Resources:
The table (.xls) below compares global health funding in the FY 2020 House SFOPs appropriations bill to the FY 2019 enacted funding amounts as outlined in the “Consolidated Appropriations Act, 2019” (P.L. 116-6; KFF summary here) and the President’s FY 2020 request (KFF summary here).
| Table: KFF Analysis of FY20 House SFOPs Funding for Global Health | |||||
| Department / Agency / Area | FY19Enactedi(millions) | FY20Requestii(millions) | FY20Houseiii(millions) | Difference(millions) | |
| FY20 House- FY19 Enacted | FY20 House- FY20 Request | ||||
| SFOPs – Global Health | |||||
| HIV/AIDS | $4,700.0 | $3,350.0 | $4,700.0 | $0 (0%) | $1,350.0 (40%) |
| State Department | $4,370.0 | $3,350.0 | $4,370.0 | $0(0%) | $1,020.0(30.4%) |
| USAID | $330.0 | $0.0 | $330.0 | $0(0%) | $330.0(NA) |
| of which Microbicides | $45.0 | $0.0 | $45.0 | $0(0%) | $45.0(NA) |
| Global Fund | $1,350.0 | $958.4 | $1,560.0 | $210.0 (16%) | $601.6 (63%) |
| Tuberculosisiv | – | $262.0 | – | – | – |
| Global Health Programs (GHP) account | $302.0 | $261.0 | $310.0 | $8.0(3%) | $49.0(19%) |
| Economic Support Fund (ESF) account | Not specified | $1.0 | Not specified | – | – |
| Malaria | $755.0 | $674.0 | $755.0 | $0 (0%) | $81.0 (12%) |
| Maternal & Child Health (MCH)v | – | vi | – | – | – |
| GHP account | $835.0 | $619.6 | $850.0 | $15.0(2%) | $230.4(37%) |
| of which Gavi | $290.0 | $250.0 | $290.0 | $0(0%) | $40(16%) |
| of which Polio | $51.5 | $16.0 | $59.0 | $7.5(15%) | $43(270%) |
| UNICEFvii | $137.5 | Not specified | $147.5 | $10.0(7%) | – |
| ESF account | Not specified | $75.5 | Not specified | – | – |
| of which Polio | $7.5 | $7.0 | Not specified | – | – |
| Nutritionviii | – | $89.7 | – | – | – |
| GHP account | $145.0 | $78.5 | $145.0 | $0(0%) | $66.5(85%) |
| ESF account | Not specified | $11.2 | Not specified | – | – |
| Family Planning & Reproductive Health (FP/RH)ix | $607.5 | $259.0 | $805.5 | $198.0 (33%) | $546.5(211%) |
| Bilateral FP/RH | $575.0 | $259.0 | $750.0 | $175.0(30%) | $491.0(190%) |
| GHP account | $524.0 | $237.0 | $750.0 | $226.1(43%) | $513.0(216%) |
| ESF account | $51.1 | $22.0 | Not specified | – | – |
| UNFPA | $32.5 | $0.0 | $55.5 | $23.0(71%) | $55.5(NA) |
| Vulnerable Children | $24.0 | $0.0 | $24.0 | $0 (0%) | $24.0(NA) |
| Neglected Tropical Diseases (NTDs) | $102.5 | $75.0 | $102.5 | $0 (0%) | $27.5 (37%) |
| Global Health Security | $138.0 | $90.0 | $100.0 | $-38.0 (-28%) | $10.0 (11%) |
| GHP account | $100.0 | $90.0 | $100.0 | $0(0%) | $10.0(11%) |
| Ebola transfer | $38.0 | $0.0 | $0.0 | $-38.0(-100%) | – |
| Emergency Reserve Fundx | $2.0 | $0.0 | $10.0 | $8.0 (400%) | $10.0(NA) |
| Ebola transfer | $2.0 | $0.0 | $0.0 | $-2.0(-100%) | $0(NA) |
| Total (GHP account only) | $8,837.5 | $6,343.5 | $9,296.5 | $459.0 (5%) | $2,953.0 (47%) |
| Notes: | |||||
| i – The FY19 Enacted includes the transfer of $40.0 million in unspent Emergency Ebola funding including: $2.0 million for the Emergency Reserve Fund and $38.0 million for “programs to accelerate the capacities of targeted countries to prevent, detect, and respond to infectious disease outbreaks.” | |||||
| ii – In the FY20 Request, the administration proposed to consolidate the Development Assistance (DA), Economic Support Fund (ESF), the Assistance for Europe, Eurasia, and Central Asia (AEECA), and the Democracy Fund (DF) accounts in to one new account — the Economic Support and Development Fund (ESDF). ESF funding for the FY20 Request reflects the amounts requested by the administration for ESDF. | |||||
| iii – The House FY20 SFOPs bill proposes to move the Economic Support Fund (ESF) from “Bilateral Economic Assistance” to “Security Assistance” and “redirects development, and most democracy and governance, funding that is long-term in nature to the Development Assistance or Democracy Fund accounts.” If the House FY20 bill is approved by Congress, it is possible that global health funding previously provided under the ESF account may be provided under the Development Assistance (DA) account. | |||||
| iv – Some tuberculosis funding is provided under the ESF account, which is not earmarked by Congress in the annual appropriations bills and determined at the agency level (e.g. in FY17, TB funding under the ESF account totaled $2.64 million). | |||||
| v – Some MCH funding is provided under the ESF account, which is not earmarked by Congress in the annual appropriations bills and determined at the agency level (e.g. in FY17, MCH funding under the ESF account totaled $56.54 million). | |||||
| vi – It is not possible to calculate total MCH funding in the FY20 request because UNICEF, which has historically received funding through the International Organizations and Programs (IO&P) account, was not specified in the FY20 request. | |||||
| vii – UNICEF funding in the FY19 Enacted totaled $137.5 million, of which $5 million is earmarked for programs addressing female genital mutilation. | |||||
| viii – Some nutrition funding is provided under the ESF account, which is not earmarked by Congress in the annual appropriations bills and determined at the agency level. (e.g. in FY17, nutrition funding under the ESF account totaled $21 million). | |||||
| ix – In prior fiscal years, bilateral FP/RH funding has been provided through both the GHP and ESF accounts. The report accompanying the House FY20 SFOPs bill states that “The Committee recommendation includes $750,000,000 for reproductive health and voluntary family planning in this Act.” All of this funding is included under the GHP account. The bill summary released by the House Committee on Appropriations states that the $750 million for FP/RH is an increase of $175 million above total funding provided in FY19 (GHP and ESF accounts). | |||||
| x – The draft House FY20 appropriations bill states that “up to $10,000,000 of the funds made available under the header ‘Global Health Programs’ may be made available for the Emergency Reserve Fund.” Based on the language in the bill and the GHP totals presented in the report, this is not a specified funding line but is an authority given to the administration to transfer funds specified for other purposes under the GHP account to the Emergency Reserve Fund. | |||||
[i] Total funding for global health is not currently available as some funding provided through USAID and DoD is not yet available.
[ii] The House FY20 SFOPs bill proposes to move the Economic Support Fund (ESF) from “Bilateral Economic Assistance” to “Security Assistance” and “redirects development, and most democracy and governance, funding that is long-term in nature to the Development Assistance or Democracy Fund accounts.” If the House FY20 bill is approved by Congress, it is possible that global health funding previously provided under the ESF account may be provided under the Development Assistance (DA) account.
Mistrust and confusion created by the 21st-century information ecosystem have contributed to outbreaks of once-eradicated vaccine-preventable disease, to overhyped research findings that confuse the public, and to distrust in the financial motivations of physicians, hospitals, insurers, and drug and device manufactures alike.
Co-authored by KFF Vice President David Rousseau, Vineet M. Arora of University of Chicago Medicine, and Gary Schwitzer of the University of Minnesota School of Public Health, this perspective highlights the important relationship between medicine and trust in news media and articulates three ways that clinicians, health care organizations, and journalists might begin to rebuild the foundation of trust on which both medicine and journalism rely. It was published in the Journal of the American Medical Association.
Deductible Relief Day is May 19.
That’s the date by which average spending for people with employer-sponsored health insurance is sufficient to satisfy the average deductible, the amount they must pay out-of-pocket for most health care services before their insurance plan kicks in to help pay the bills, KFF analysts explain in a new analysis.
If you have not heard of Deductible Relief Day before, that is because we just invented it. But the issue it illuminates is real and represents a growing cost to consumers as deductibles have risen in recent years and become an increasingly prominent feature of employer health plans.
The analysis documents that:
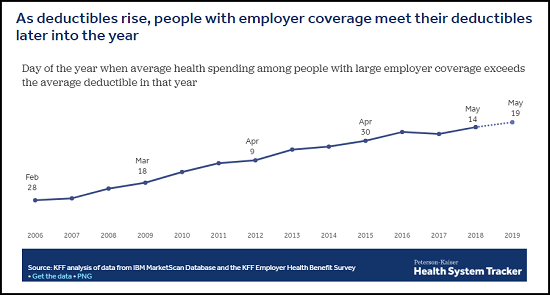
As deductibles rise and become more common, it takes longer for people with employer coverage to satisfy their deductibles each year and begin benefiting more fully from the financial protection of their health plan. May 19 is Deductible Relief Day this year, but ten years ago, when deductibles were smaller and less prevalent, it fell on March 18, 2009. While health care costs have increased over time, deductibles have increased even more.
Since some enrollees do not have enough savings or discretionary income to be able to pay a typical deductible, these costs, which tend to be concentrated when an enrollee uses services, can lead people to delay care or struggle to pay medical bills. They also often face additional out-of-pocket costs even after meeting their deductible. Such costs include copays, a fixed amount patients must pay when visiting the doctor or receiving a medical service, and coinsurance, the portion of a medical bill the consumer is required to pay while the insurer pays the rest.
The analysis is part of the Peterson-Kaiser Health System Tracker, an online information hub dedicated to monitoring and assessing the performance of the U.S. health system.
This analysis examines how health insurance deductibles are affecting consumers with employer-sponsored insurance. Deductibles have risen in recent years and become an increasingly prominent feature of job-based health plans.
“Deductible Relief Day” refers to the date by which average spending for people with employer-sponsored health insurance is sufficient to satisfy the average deductible, the amount consumers must pay out-of-pocket for most health care services before their insurance plan kicks in to help pay the bills.
The analysis is part of the Peterson-Kaiser Health System Tracker, an online information hub dedicated to monitoring and assessing the performance of the U.S. health system.
Medicaid funds typically cannot be used to pay for non-medical interventions that target the social determinants of health. However, in October 2018, CMS approved North Carolina’s Section 1115 waiver which provides financing for a new pilot program, called “Healthy Opportunities Pilots,” to cover evidence-based non-medical services that address specific social needs linked to health/health outcomes. The pilots will address housing instability, transportation insecurity, food insecurity, and interpersonal violence and toxic stress for a limited number of high-need enrollees. This waiver differs from others recently approved by the Trump Administration that aim to address health determinants by conditioning coverage on meeting work requirements. The pilot program may yield important evidence about how addressing certain non-medical needs may impact program costs and health outcomes. However, the scope and impact of the program is restricted by its limited funding. Implementing a long-term program on a broader scale would require larger sustainable financing streams and it’s unclear at this point whether CMS will use this waiver as a model for other states. This brief summarizes key features of the Healthy Opportunities Pilots.
Healthy Opportunities Pilots Key Highlights
Funding – CMS authorized $650 million in Medicaid funding for the pilot over five years, $100 million of which will be available for capacity building.
Pilot area – will include two to four regions of the state and is expected to serve approximately 25,000 to 50,000 beneficiaries, or about 1% to 2% of total Medicaid enrollees in North Carolina.
Eligible beneficiaries – must be enrolled in a managed care plan and must have at least one physical or behavioral health risk factor and at least one social risk factor.
Pilot services – will include evidence-based enhanced case management and other services, which must be approved by CMS, to address enrollee needs related to housing, food, transportation, and interpersonal safety.
Health plans – will manage the pilot budget and, working in close collaboration with care managers, will determine enrollee eligibility and authorize the delivery of pilot services.
Lead Pilot Entities (LPEs) – will develop, contract with, and manage the network of human service organizations that will deliver pilot services.
Timeline – The state will release an RFP for LPEs by November 2019 and anticipates beginning to deliver pilot services in late 2020.
There has been growing recognition that although health care is essential to health many broader social and environmental factors play a major role in shaping health. Social determinants of health are the conditions in which people are born, grow, live, work, and age.1 They include factors like socioeconomic status, education, neighborhood and physical environment, employment, nutrition/food security, and social support networks, as well as access to health care. In recent years, a broad range of initiatives have been launched at the federal, state, and local levels and by plans and providers to address social determinants of health, including efforts within Medicaid. These efforts stem from increasing rates of coverage under the Affordable Care Act (ACA), new funding and demonstration authorities provided through the ACA, and an increasing shift across the health system toward value- or outcome-based payments and “whole person” care.
Under a new waiver, North Carolina’s Medicaid program will pay for non-medical interventions that address housing instability, transportation insecurity, food insecurity and interpersonal violence & toxic stress for a limited number of high-need enrollees
Within Medicaid, states can use a range of optional state plan and waiver authorities (e.g., 1915(i), 1915(c), or Section 1115) to add certain non-clinical services to the Medicaid benefit package including case management, housing supports, employment supports, and peer support services for people who need help with self-care or household activities as a result of disability or chronic illness. Generally, states have not been able to use federal Medicaid funds to pay the direct costs of non-medical services like housing and food. Under federal Medicaid managed care rules, managed care plans have some limited flexibility to pay for non-medical services.2 Additionally, other recent Medicaid payment and delivery system reforms, like the formation of Accountable Care Organizations (ACOs), may provide flexibility or opportunities to cover non-medical services that support health.
Section 1115 Medicaid demonstration waivers provide states an avenue to test new approaches in Medicaid that differ from what is allowed by federal statute. States can obtain approval for Section 1115 demonstration waivers that test broad changes in Medicaid eligibility, benefits and cost-sharing, and payment and delivery systems as long as the Secretary determines that the demonstration is furthering the objectives of the Medicaid program. Waivers generally reflect priorities identified by states and CMS and often reflect changing priorities from one administration to another.
The current administration has largely marked a new direction for Medicaid demonstration waivers, including the approval of waivers that condition Medicaid eligibility on meeting work and reporting requirements as well as the approval of other policies that restrict eligibility and enrollment. In its approval of these demonstrations, the administration asserts such policies are designed to address health determinants (like employment) and to ultimately improve health outcomes.3 These new waivers run counter to many other efforts to address social determinants of health that focus on identifying social needs and facilitating links to services rather than making individuals’ health coverage dependent on meeting certain requirements – like reporting minimum monthly work hours.
CMS’s approval of North Carolina’s enhanced case management pilots within the state’s new Medicaid managed care delivery system stands in contrast to this recent trend in waiver approvals. This waiver allows the state to use Medicaid to pay directly for non-medical interventions that target the social determinants of health, although the program scope is restricted by its limited funding.
In 2015, the North Carolina General Assembly passed legislation that required the state’s Medicaid program to transition from its long-standing enhanced PCCM model to capitated managed care.4 Although the use of capitated managed care does not require Section 1115 waiver authority, as part of this transition, the state pursued certain elements, including an “Institution for Mental Disease” (IMD) waiver, pilots to address targeted health-related needs, a tribal uncompensated care pool, workforce innovation fund, and behavioral health home capacity-building funds which required submission of a Section 1115 waiver.5 ,6 In October 2018, CMS approved North Carolina’s Section 1115 waiver, including its transition from a fee-for-service (FFS) Medicaid delivery system to a capitated managed care program. North Carolina aims to transition approximately 1.5 million of its 2 million Medicaid enrollees to the new managed care delivery system.7 The state will begin transitioning enrollees by region to managed care “standard” plans in November 2019. Standard plans will cover physical, behavioral health, and pharmacy benefits. In 2021, the state plans to launch “tailored” plans for enrollees that have more significant mental health, intellectual or developmental disabilities, substance use, and traumatic brain injury needs.8 The state will also add “specialized” plans for foster care youth and former foster care youth. The state will require health plans to contract with local care management entities, including advanced medical homes and local health departments.
Within the new Medicaid managed care delivery system and care management infrastructure, CMS also approved a Healthy Opportunities Pilot program. All health plans must implement standardized screening questions to assess enrollees’ non-medical needs. If unmet needs are identified, plans will connect beneficiaries to community resources. Plans will have access to a statewide tool – NCCARE360 – to identify community resources and track and monitor referrals.9 Beyond these statewide efforts, in select regions, the Healthy Opportunities Pilots will authorize the use Medicaid funds to pay for enhanced case management and other support services for certain high-risk enrollees that meet physical or behavioral health and social risk factor criteria. The program aims to reduce health care costs and improve health outcomes by providing services to address housing instability, transportation insecurity, food insecurity, and interpersonal violence and toxic stress. The program is the first of its kind approved by CMS, allowing Medicaid funds to be used to pay for non-medical interventions that target the social determinants of health. CMS authorized $650 million in Medicaid funding for the pilot over five years. Funding for the pilot is part of the broader Section 1115 waiver in which the state must demonstrate budget neutrality to the federal government – meaning federal costs under the waiver must not exceed what federal costs would have been for that state without the waiver.10
The state will operate the Healthy Opportunities Pilot program in two to four regions. Reflecting the program’s funding limitations, it expects to serve approximately 25,000 to 50,000 beneficiaries (or about 1% to 2% of total Medicaid enrollees) through the pilot program.
To be eligible to participate in the pilot program, beneficiaries must be enrolled in a managed care plan (standard, tailored, or a specialized plan) and must have at least one physical or behavioral health risk factor and at least one social risk factor (Figure 1). Health risk factors include adults with two or more chronic conditions or repeated emergency room use or hospital admissions; high-risk pregnant women (e.g., multifetal gestation, chronic condition likely to complicate pregnancy); and high-risk infants and children (e.g., prematurity, low birth weight, Neonatal Abstinence Syndrome, or one or more uncontrolled chronic conditions). Social risk factors include homelessness and housing insecurity, food insecurity, transportation insecurity, and being at-risk of witnessing or experiencing interpersonal violence. Participation in the pilot is voluntary and enrollees may opt out at any time.
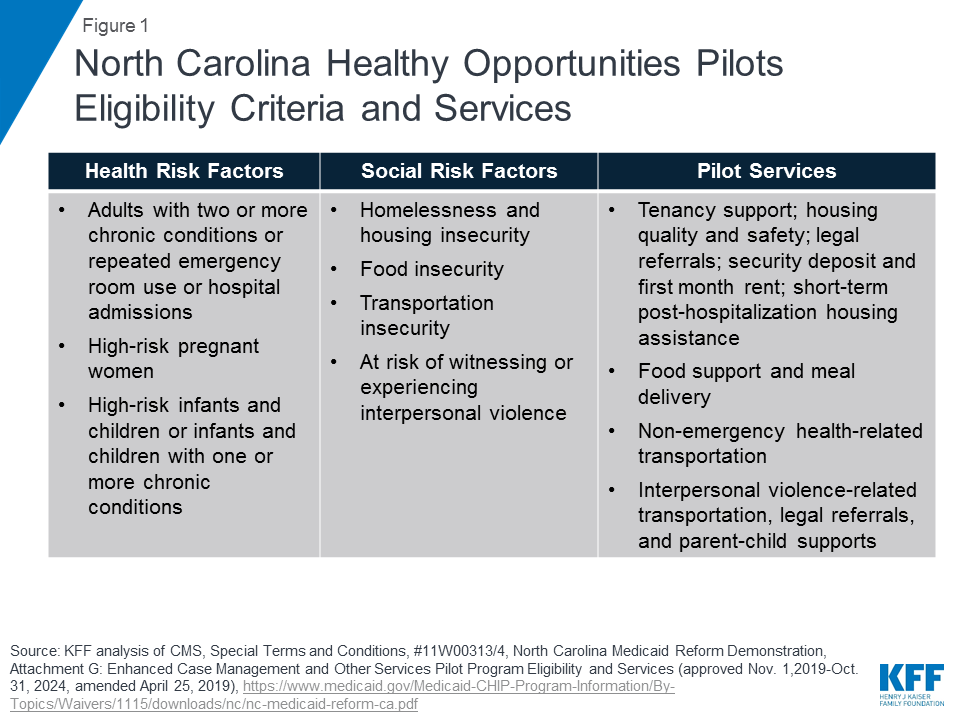
Pilot services will include evidence-based enhanced case management and other services designed to address enrollee needs related to: housing, food, transportation, and interpersonal safety. For example, pilot services may include housing modifications (e.g., carpet replacement, air conditioner repair) to improve a child’s asthma control, travel vouchers to a community-based food pantry or a medically-targeted healthy food box for an adult with diabetes living in a rural food desert, or assistance securing safe housing for a pregnant woman experiencing interpersonal violence.11 The care manager will recommend pilot services at the lowest intensity level that can be reasonably expected to meet an individual’s needs. Pilot transportation services include non-emergency health-related transportation including transportation to social services or to access pilot services. (Transportation services under the pilot are in addition to the non-emergency medical transportation (NEMT) benefit states are required to provide which helps ensure Medicaid beneficiaries have transportation to and from medical providers.) Approved pilot services are outlined in the waiver special terms and conditions.12 Any changes to the pilot services list must be reviewed and approved by CMS. Currently approved pilot services are also broadly outlined in Figure 1 (see Appendix for additional detail).
The state will require health plans to participate in the pilot program if they operate within any of the selected pilot regions. Health plans will be responsible for managing their pilot budget and may set enrollment caps/restrictions, if approved by the state – if/when the plan has limited funding capacity to serve all eligible enrollees (Figure 2). Health plans, in collaboration with care managers, will identify eligible enrollees and will seek consent from them to participate in the pilot program. Care managers will use standardized screening questions to assess health-related unmet resource needs.13 Health plans and their care managers will determine the pilot services to be provided to each enrollee and will work in collaboration with the lead pilot entity (LPE) to track enhanced case management and other pilot services. Every three months, health plans will review the pilot services each enrollee is receiving to ensure the services are meeting the enrollee’s needs. Plans must reassess enrollee pilot eligibility every six months. Health plans will also be required to participate in “learning communities” to disseminate best practices across regions.
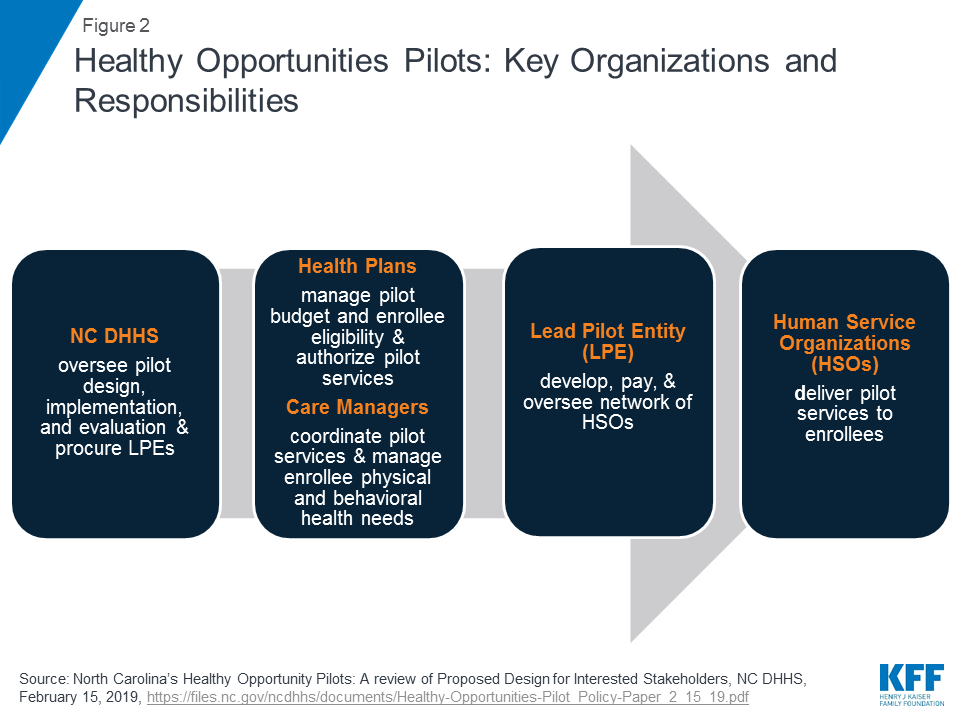
Each region will have one lead pilot entity (LPE) that will serve as the regional pilot coordinator and will be accountable for pilot operations. The state will select LPEs through a competitive procurement process. The state expects LPEs to be rooted in their communities, indicating entities best positioned for this role may include, community-based organizations, county-based public agencies, local health departments, social services or multiservice agencies, community health centers, community health foundations, associations, or a partnership of agencies.14 The state expects LPEs will be “anchored by” a community-based health or social service organization and will not be led by a health system. LPEs will develop, contract with, and manage the network of participating pilot providers, including community-based organizations, social service agencies, and health care providers, that will deliver pilot services. LPEs will develop payment protocols and procedures and will track payments made to pilot providers. They will monitor and track pilot services and report on metrics for rapid cycle and summative evaluations. LPEs will provide technical assistance to health plans and providers and will participate in “learning communities.”
CMS authorized $650 million in federal and state Medicaid funding for the pilot over five years, $100 million of which will be available for capacity building. The state will distribute funding for the pilots to the participating health plans. Funding for each plan, which is outside of their capitation rate, will be a capped allocation based on the volume and cost of pilot services delivered to enrollees, including an administrative fee. Health plans will distribute funds to lead pilot entities. The LPEs will then distribute funds to providers authorized to deliver pilot services. The majority of pilot funding must be used to deliver pilot services. To ensure pilot funding is not used for a single domain (e.g., housing) or for a single population, the state plans to establish requirements regarding the minimum share of pilot funds that must be used for each of the four domains and across populations. LPEs may use capacity building funding to develop infrastructure/systems to prepare providers to deliver services, receive payment, and report on managing patient care. LPEs may also use capacity building funds for monitoring and program integrity purposes as well as for providing technical assistance. Federal financial participation (FFP) will be calculated based on aggregated amounts actually paid by the state to pilot providers, LPEs, and health plans.15
Pilot services will be reimbursed through two methods: fee-for-service/cost-based reimbursement and bundled payments. The state must develop and submit fee schedules, cost-based reimbursement service sets, and bundled payment fee schedules to CMS for review no later than July 1, 2019. Over the course of the demonstration, the state must incorporate value-based payments for pilot services, increasingly linking payments for pilot services to health outcomes. The state will incorporate incentive payments in demonstration years one and two, withholds in years three and four, and shared savings arrangements in year five.
The state must develop an evaluation design for the pilot program, and must use an independent evaluator to conduct a summative pilot program evaluation as well as rapid cycle assessments. The rapid cycle assessments will help the state identify which interventions are most and least effective, so the state can make any necessary mid-course adjustments. Evaluation activities will also help the state identify effective services to incorporate into managed care statewide after the pilot ends.
The state’s Section 1115 waiver was approved for a 5-year period from November 1, 2019 through October 31, 2024. The state will release a Request for Proposal (RFP) in two to four regions detailing roles and responsibilities for LPEs by November 1, 2019. The state anticipates that the pilots will begin delivering services in late 2020.16
CMS’s approval of North Carolina’s enhanced case management pilots within the state’s new Medicaid managed care delivery system is notable, as Medicaid funds typically cannot be used to pay directly for non-medical interventions that target the social determinants of health and as the Trump administration has been largely focused on more restrictive policies that may result in coverage loss, like work requirements, in its effort to help states address determinants of health and improve health outcomes. In contrast, the pilots approved in North Carolina will use coverage, and service provision, to support health-related needs. The pilot program may yield important evidence involving how addressing certain non-medical needs may impact program costs and health outcomes. However, the scope and impact of the program is restricted by its limited funding. Implementing a long-term program on a broader scale would require larger sustainable financing streams and it’s unclear at this point whether CMS will use this waiver as a model for other states. managed care delivery system is notable, as Medicaid funds typically cannot be used to pay directly for non-medical interventions that target the social determinants of health and as the Trump administration has been largely focused on more restrictive policies that may result in coverage loss, like work requirements, in its effort to help states address determinants of health and improve health outcomes. In contrast, the pilots approved in North Carolina will use coverage, and service provision, to support health-related needs. The pilot program may yield important evidence involving how addressing certain non-medical needs may impact program costs and health outcomes. However, the scope and impact of the program is restricted by its limited funding. Implementing a long-term program on a broader scale would require larger sustainable financing streams and it’s unclear at this point whether CMS will use this waiver as a model for other states.
| Healthy Opportunities Pilot Services Examples | |
| Housing | Tenancy support and sustaining services
Housing quality and safety improvement services
Legal assistance
Securing housing payments
Short-term post-hospitalization
|
| Food | Food support services
Meal delivery services
|
| Transportation | Non-emergency health-related transportation
|
| Interpersonal Violence (IPV) / Toxic Stress | IPV-related transportation
IPV and parenting
Support resources
Legal assistance
Child-parent support
|
SOURCE: North Carolina’s Medicaid Reform Demonstration, approved October 19, 2018, see Attachment G.