The Critical Care Workforce and COVID-19: A State-by-State Analysis

Author: Eric Lopez
Published: Jul 30, 2020

Data Note

The United States remains among the countries most severely impacted by the coronavirus pandemic, with reported COVID-19 cases rising again in many states. While much recent research and media reporting on the pandemic response has focused on the availability of hospital beds and medical equipment, there is also concern that the availability of medical personnel capable of providing intensive care could be a limiting factor in the care of COVID-19 patients. This is a particular challenge as cases and hospitalizations surge in hotspots across the country.

Using recent data from the National Plan and Provider Enumeration System (NPPES) National Provider Identifier (NPI) Registry, this Data Note reports baseline estimates of the number of active critical care physicians and nurses in each state relative to state population.

Background

To date, much of the federal and state-level response to the COVID-19 pandemic in the United States has focused on the availability of hospital resources such as funding, beds, and personal protective equipment.1  However, some experts have signaled that personnel are also in short supply. Alarmingly, the Society for Critical Care Medicine (SCCM) reported that the number of providers trained in intensive care unit (ICU) care and mechanical ventilation could be a limiting factor in the care of COVID-19 patients, and has recommended that the pandemic response should place greater emphasis on increasing the number of available critical care professionals.2 

However, quantifying the number of critical care providers in the U.S. has historically been difficult. On the one hand, some professional societies have argued that only “intensivist” physicians who have completed a formal fellowship in critical care medicine should lead critical care teams, and some research suggests that this may improve clinical outcomes in the ICU setting.3  On the other hand, many providers without formal critical care training regularly care for critically ill ICU patients, including substantial numbers of hospitalists, pulmonologists, and anesthesiologists. The issue is further complicated by variability in the proportion of duty hours that individual providers spend in the intensive care setting. Researchers writing in 2015 noted that, “our current supply of full-time intensivists is very low, as the vast majority of adult, board-certified intensivists are really part-time practitioners based in pulmonary medicine, operating rooms (surgeons/anesthesiologists), or emergency medicine”.4 

Consequently, prior estimates have reflected these limitations. For example, an early landmark study by the Committee on Manpower for Pulmonary and Critical Care Societies in 2000 found that, of the 10,244 practicing U.S. physicians that classified themselves as critical care providers, nearly half did not hold a formal critical care certification.5  A 2013 study by the Health Resources and Services Administration (HRSA) took duty hour variation into account, reporting only 3,570 full-time equivalent intensivist physicians and 2,880 full-time equivalent critical care nurse practitioners.6  The most recent published estimates are based on data from 2015, though the ongoing COVID-19 pandemic response warrants further updates.7  Using data from the 2020 National Plan and Provider Enumeration System (NPPES) National Provider Identifier (NPI) Registry, this Data Note quantifies the availability of providers capable of providing critical care in each state relative to state-level population.

Key Takeaways

  • Approximately 16,600 intensivists and 67,900 critical care nurses, including certified registered nurse anesthetists (CRNAs), were identified in the United States. At the state level, these counts correspond to an average of 0.62 intensivists and 2.54 critical care nurses per 10,000 adults.
  • There are also nearly 116,000 second-line physicians—hospitalists, pulmonologists, and anesthesiologists—who do not have formal critical care training, but who may be caring for critically ill patients. Across the states, these providers average 4.32 per 10,000 adults.
  • Individual state-level provider concentrations varied widely. Several states that have recently reported a surge in cases have per-population numbers of intensivists or critical care nurses that are substantially lower than national average ratios, such as California, Arizona and Texas. Estimates per 10,000 adults are reported in Table 1.

Discussion

These estimates highlight several issues relevant to both the baseline critical care workforce in the U.S. and to the response to the coronavirus pandemic. Notably, the number of intensivist physicians is substantially smaller than that of “second-line” providers that sometimes provide critical care, such as hospitalists, pulmonologists, and anesthesiologists, lending credence to longstanding concerns that intensivists are in short supply in the U.S. at baseline. However, it is unclear how many of these second-line providers could be readily redirected into the ICU setting. Many hospitalists likely can be, since most practice in the hospital setting. However, significant numbers of anesthesiologists and pulmonologists may primarily practice in non-hospital settings such as ambulatory surgery centers and outpatient physician offices, and may have little experience providing ICU-level care. Similarly, the number of nurses specifically trained in critical care also appears relatively small compared to prior estimates, suggesting that the source data may lack comprehensive records for some categories of nurses that provide critical care.

Furthermore, recent increases in COVID-19 cases in several states may justify redirection of second-line providers into critical care roles, as well as recruitment of intensivists and critical care nurses from other regions, as the pandemic intensifies. Both approaches may be facilitated by volunteer programs and state government proposals similar to those that supported prior workforce expansions in New York.8 

Finally, providers outside of the hospital setting will also play instrumental roles in the pandemic response, both by reducing strain on hospitals and by providing direct COVID-19 care. For example, long-term care and skilled nursing facilities are continuing to be disproportionately impacted, increasing their demand for additional personnel as well.9  Similarly, sufficient numbers of primary care physicians and other ambulatory care providers are vital, not only to help minimize avoidable hospitalizations through monitoring of their patients’ chronic conditions, but also to coordinate essential follow-up care for recovering COVID-19 patients after hospital discharge.

National and state leaders are facing challenging decisions about where to allocate limited resources, including critical care providers. Estimates of the current workforce size and distribution can help inform these decisions, though they must be interpreted in conjunction with local factors such as disease burden, health care infrastructure, workplace safety, and the availability of funding and medical resources. The interactions between these factors are complex and will require continuous re-evaluation in order to best protect both patients and health care personnel during the pandemic.

Eric John Lopez was a member of KFF’s ACA and Medicare Policy teams. He is a medical student at the University of California, San Francisco, and participated in a yearlong UCSF-KFF Health Policy Fellowship.

Methods

State-level counts of active critical care providers were calculated based on May 2020 data from the National Plan and Provider Enumeration System (NPPES) National Provider Identifier (NPI) Registry (https://download.cms.gov/nppes/NPI_Files.html).10 

NPPES specialty taxonomy codes used to calculate raw provider counts included: 207LC0200X (Anesthesiology – critical care medicine), 207RC0200X (Internal medicine – critical care medicine), 207VC0200X (Obstetrics & gynecology – critical care medicine), 2084A2900X (Neurocritical care), 2086S0102X (Surgical critical care), 163WC0200X (Registered nurse – critical care medicine), 364SC0200X (Clinical nurse specialist – critical care medicine), 363LC0200X (Nurse practitioner – critical care medicine). Certified Registered Nurse Anesthetists (CRNAs) are included in estimates of critical care nurses, as an American Association of Nurse Anesthetists (AANA) position statement on COVID-19 has stated that CRNAs can safely assume care of ICU patients, subject to the experience and judgment of individual clinicians (https://www.aana.com/docs/default-source/practice-aana-com-web-documents(all)/crnas_asked_to_assume_critical_care_responsibilities_during_ the_covid_19_pandemic .pdf? sfvrsn=ea3630e7_6).

Providers are assigned to their state of practice as reported the most recent version of the dataset. State-level ratios of providers per 10,000 adults were calculated by dividing the number of each critical care provider by the state-level population as reported in the 2019 U.S. Census Bureau projections.11  Providers specializing in pediatric and neonatal critical care are not included. The full list of taxonomy codes and definitions can be found at the Washington Publishing Company website (http://www.wpc-edi.com/reference/codelists/healthcare/health-care-provider-taxonomy-code-set/).

Table

Table 1: Intensivist Physicians, Critical Care Nurses, and Second-line Critical CarePhysicians per 10,000 Adults
StateIntensivist (Critical Care) Physicians per 10,000 AdultsCritical Care Nurses and CRNAs per 10,000 AdultsTotal 2nd-Line Critical Care Physicians* per 10,000 Adults
Alabama0.415.073.48
Alaska0.512.544.37
Arizona0.561.465.23
Arkansas0.293.193.58
California0.630.894.43
Colorado0.751.775.18
Connecticut0.982.666.08
D.C.1.992.188.78
Delaware0.614.994.93
Florida0.633.174.14
Georgia0.562.453.99
Hawaii0.451.094.19
Idaho0.273.542.50
Illinois0.642.124.79
Indiana0.701.294.96
Iowa0.642.453.97
Kansas0.414.853.60
Kentucky0.574.234.50
Louisiana0.444.533.90
Maine0.453.715.12
Maryland1.132.015.22
Massachusetts1.012.156.19
Michigan0.723.994.18
Minnesota0.545.533.80
Mississippi0.293.523.41
Missouri0.803.735.39
Montana0.501.425.07
Nebraska0.404.034.33
Nevada0.670.904.41
New Hampshire0.913.155.38
New Jersey0.701.334.64
New Mexico0.392.213.15
New York0.851.345.60
North Carolina0.574.223.97
North Dakota0.796.364.21
Ohio0.813.594.56
Oklahoma0.362.444.18
Oregon0.701.524.89
Pennsylvania0.874.405.05
Puerto Rico0.270.272.06
Rhode Island0.912.263.95
South Carolina0.593.783.71
South Dakota0.426.623.57
Tennessee0.635.294.33
Texas0.482.644.00
Utah0.501.374.40
Vermont0.490.984.75
Virginia0.552.774.03
Washington0.591.814.45
West Virginia0.524.874.00
Wisconsin0.582.275.16
West Virginia0.524.874.00
Wyoming0.342.224.22
US Total0.622.544.32
*Hospitalists, Pulmonologists, and AnesthesiologistsSOURCE: KFF analysis of the National Plan and Provider Enumeration System (NPPES) National Provider Identifier (NPI) monthly data dissemination file May 2020 (https://download.cms.gov/nppes/NPI_Files.html) and 2019 U.S. Census Bureau projections (https://www.census.gov/data/tables/time-series/demo/popest/2010s-state-detail.html).

Endnotes

  1. Emanuel, Ezekiel, et. al. 2020. “Fair Allocation of Scarce Medical Resources in the Time of COVID-19”. N Engl J Med. https://doi.org/10.1056/NEJMsb2005114 ↩︎
  2. Halpern, N. A. and Tan, K. S. 2020. U.S. ICU Resource Availability for COVID-19. Mount Prospect, IL: Society of Critical Care Medicine. https://sccm.org/Blog/March-2020/United-States-Resource-Availability-for-COVID-19?_zs=OdHjd1&_zl=w9pb6   ↩︎
  3. Weled, Barry, et. al. 2015. “The Importance of Process of Care and ICU Structure to Improved Outcomes: An Update from the American College of Critical Care Medicine Task Force on Models of Critical Care”. Critical Care Medicine. Jul; 43(7): 1520-1525. https://journals.lww.com/ccmjournal/Abstract/2015/07000/Critical_Care_Delivery __The_Importance_of_Process.19.aspx ↩︎
  4. Pastores, Stephen, et. al. 2015. “Intensivist Workforce in the United States: The Crisis is Real, Not Imagined”. Am J Respir Crit Care Med. Mar; 191(6): 718-719. https://www.atsjournals.org/doi/full/10.1164/rccm.201501-0079LE ↩︎
  5. Angus, Derek, et. al. “Current and Projected Workforce Requirements for Care of the Critically Ill and Patients with Pulmonary Disease: Can We Meet the Requirements of an Aging Population?” JAMA. Dec; 284(21): 2762-2770. https://jamanetwork.com/journals/jama/fullarticle/193318 ↩︎
  6. National Center for Health Workforce Analysis. 2013. Health Workforce Projections: Critical Care Physicians and Nurse Practitioners. Rockville, MD: Health Resources and Services Administration. https://bhw.hrsa.gov/sites/default/files/bhw/health-workforce-analysis/research/projections/critical-care-fact-sheet.pdf ↩︎
  7. Halpern, N. A., et. al. 2019. “Intensivists in U.S. Acute Care Hospitals”. Critical Care Medicine. Apr; 47(4): 517-525. https://www.ncbi.nlm.nih.gov/pubmed/30694817 ↩︎
  8. Simmons-Duffin, Selena. March 25, 2020. “States Get Creative to Find and Deploy More Health Workers in COVID-19 Fight”. NPR. Accessed July 3, 2020. https://www.npr.org/sections/health-shots/2020/03/25/820706226/states-get-creative-to-find-and-deploy-more-health-workers-in-covid-19-fight ↩︎
  9. McMichael, Temet; Currie, Dustin; et. al. 2020. “Epidemiology of COVID-19 in a Long-Term Care Facility in King County, Washington”. N Engl J Med. (epub ahead of print) https://www.ncbi.nlm.nih.gov/pubmed/32220208 ↩︎
  10. Centers for Medicare and Medicaid Services. 2020. National Plan and Provider Enumeration System (NPPES) Data Dissemination Monthly National Provider Identifier (NPI) File (May 12, 2020). Baltimore, MD: Centers for Medicare and Medicaid Services. Accessed May 20, 2020. https://download.cms.gov/nppes/NPI_Files.html   ↩︎
  11. United States Census Bureau. 2020. 2019 National and State Population Estimates. Suitland, MD: United States Census Bureau. Accessed July 16, 2020. https://www.census.gov/newsroom/press-kits/2019/national-state-estimates.html ↩︎
News Release

Brief Examines What’s Known About Children and Coronavirus Transmission as Schools Prepare for Fall

Published: Jul 29, 2020

With schools nationwide preparing for fall and the federal government encouraging in-person classes, key concerns for school officials, teachers and parents include the risks that coronavirus poses to children and their role in transmission of the disease.

A new KFF brief examines the latest available data and evidence about the issues around COVID-19 and children and what they suggest about the risks posed for reopening classrooms. The review concludes that while children are much less likely than adults to become severely ill, they can transmit the virus. Key findings include:

  • Disease severity is significantly less in children, though rarely some do get very sick. Children under age 18 account for 22% of the population but account for just 7% of the more than 4 million COVID-19 cases and less than 1% of deaths.
  • The evidence is mixed about whether children are less likely than adults to become infected when exposed. While one prominent study estimates children and teenagers are half as likely as adults over age 20 to catch the virus, other studies find children and adults are about equally likely to have antibodies that develop after a COVID-19 infection.
  • While children do transmit to others, more evidence is needed on the frequency and extent of that transmission. A number of studies find children are less likely than adults to be the source of infections in households and other settings, though this could occur because of differences in testing, the severity of the disease, and the impact of earlier school closures.
  • Most countries that have reopened schools have not experienced outbreaks, but almost all had significantly lower rates of community transmission. Some countries, including Canada, Chile, France, and Israel did experience school-based outbreaks, sometimes significant ones, that required schools to close a second time.

The analysis concludes that there is a risk of spread associated with reopening schools, particularly in states and communities where there is already widespread community transmission, that should be weighed carefully against the benefits of in-person education.

What Do We Know About Children and Coronavirus Transmission?

Published: Jul 29, 2020

Key Points:

  • With just a few weeks remaining before schools in the U.S. are scheduled to reopen, and the federal government encouraging in-person schooling, there remain many questions about the risk COVID-19 poses to children and their role in transmission of the disease. Indeed, other countries have not reopened schools with the levels of community transmission found in the U.S., coupled with its insufficient testing and limited contact tracing.
  • Our review of the latest available data indicates that, while children who are infected with COVID-19 are more likely to be asymptomatic and less likely to experience severe disease (though a small subset become quite sick), they are capable of transmitting to both children and adults.
  • What remains unclear and where evidence is still needed is: whether children are less likely to be infected than adults and, when infected, the frequency and extent of their transmission to others. There is some evidence for an age gradient in infectiousness, with younger children less likely and older children more likely to transmit at levels similar to adults.
  • While other countries that reopened schools have generally not experienced outbreaks in school settings, almost all had significantly lower levels of community transmission than the U.S. and greater testing and contact tracing capacity. Moreover, several disease clusters connected to schools and children have been reported.
  • Taken together, the evidence indicates that where there is already widespread community transmission, as in many areas in the U.S., there is clearly a risk of further spread associated with reopening schools. The risks of reopening need to be considered carefully in light of the recognized benefits of in-person education.

Introduction

Policymakers in the United States are struggling to decide whether and how to reopen schools and daycares, at the same time that parents and caregivers are trying to weigh the risks and benefits of different approaches to schooling for their children. Indeed, our latest national poll found that most parents are worried about their child or a family member, as well as teachers and staff, getting sick from coronavirus if schools reopen and think it is better to wait.

With only a few weeks remaining until most U.S. schools are scheduled to begin, the White House for months has emphasized the importance of reopening schools and having students physically present in classrooms, although more recently has supported a more flexible approach for schools and parents. For its part, the Centers for Disease Control and Prevention (CDC) recently released updated guidance, including a review of the data, for school administrators, parents, and caregivers facing decisions around schooling, while also issuing a statement that having children physically present in reopened schools this fall was of utmost importance. CDC states, that, “No studies are conclusive, but the available evidence provides reason to believe that in-person schooling is in the best interest of students, particularly in the context of appropriate mitigation measures similar to those implemented at essential workplaces.”

Still, many large school districts, especially in locations where there is widespread community transmission, have opted for a virtual rather than an in-person start to the school year, citing the risks that the virus poses to students, teachers, staff, and households. Our recent analysis found, for example, that 1.5 million teachers are at high risk of severe disease if infected with coronavirus, due to underlying health conditions and age. In addition, we found that millions of seniors live in households with school-aged children.

Struggles surrounding decisions around schooling and childcare reflect some of the most perplexing aspects of the COVID-19 pandemic so far: understanding the risks the virus poses to children and their role in transmission of the disease. While researchers have been actively investigating these topics since the emergence of the pandemic, our understanding is, in many cases, still incomplete. Here, drawing on published literature and expert opinion, we summarize what is known about children and coronavirus, and what the information gaps remain.

Box 1: Data on COVID-19 in Children in the United States

Children, under the age of 18, to date, account for:

  • 7% (more than 200,000) of reported COVID-19 cases* (source CDC)
  • <1% of reported COVID-19 deaths* (source: CDC)
  • 1% of reported COVID-19 hospitalizations (source: CDC)

The number of reported cases of Multisystem Inflammatory Syndrome in Children (MIS-C) is 342, including 6 deaths, among states reporting data (source: CDC)

*Based only on data for which age group information was available.

Current Evidence on COVID-19 and Children

Disease severity is significantly less in children, though a small subset become quite sick: We know children of all ages can indeed be infected with coronavirus but the evidence at this point is quite clear that overall, children who become infected experience a milder disease course than adults. As one expert review panel stated, we are “essentially certain” the risk of death and of severe illness from COVID-19 in children is extremely low. Another expert panel organized by the National Academies of Medicine reported that “compared with adults, children who contract COVID-19 are more likely to experience asymptomatic infection or mild upper respiratory symptoms”, and that over 90 percent of children testing positive will have no or mild symptoms. While the infection has been known to cause an inflammatory condition (MIS-C) in some children, and these cases are serious (342 have been reported to date), so far such cases are very rare and most children who do experience the condition eventually recover.

One reflection of the generally milder disease course in children is that the reported number of COVID-19 deaths among children under the age 18 in the U.S. is less than 1% of reported COVID-19 deaths, even though children make up 22% of the U.S. population [see Box 1].

Evidence is mixed about whether children are less likely to become infected when exposed. Regarding risk of infection there is some evidence that, compared to adults, children are less likely to become infected when exposed to the virus. One prominent study estimated susceptibility to infection for those under 20 years of age to be about half that of those over 20 years, and several large-scale seroprevalence studies have found lower prevalence of infection in children, especially younger children, compared to adults. Still, the evidence is somewhat mixed on this point, with other studies showing children, especially older children (>10 years) having been infected at rates similar to adults in some places. A recent (pre-publication) review of the evidence concludes there is “significantly lower” susceptibility to infection for children under 10 compared to adults, but the same conclusion cannot be drawn for children 10 and older.

A number of biological explanations have been posited for this difference between children and adults in severity and infection risk, including less expression of a key receptor in the upper airways of children, and some level of pre-existing immune cross-reactivity to SARS-Cov-2 in many children due to recent exposure to related viruses (such as common cold viruses). Still, investigations continue and more evidence is needed to fully understand if lower infection rate in children is a real phenomenon and what explains it.

Children do transmit to others but more evidence is needed on the frequency and extent of that transmission. We do not yet know for sure how common transmission from children is compared to transmission from adults. We know that children are capable of transmission to others, but the frequency and extent of this transmission remains under investigation, and this is a question where only weak, and sometimes contradictory evidence, is available.

For example, multiple studies indicate that children have viral loads and shed virus in similar amounts to adults, which might indicate risk of transmission is similar across age groups. Without a doubt transmission from child-to-child and child-to-adult can occur, but a number of studies find children, particularly young children, are less likely to be source of infection in households and other settings, compared to adults. A number of these studies conclude that a majority of documented transmissions between children and adults have occurred from adults to children, rather than the other way around, but more detailed information is needed to fully understand this dynamic. There is new evidence, including from a recent comprehensive study from South Korea, suggesting there is an age gradient in terms of transmission risk from children, meaning younger children (<10 years old) are less likely to transmit compared to adults, while older children (10 and older) may transmit at levels similar to adults.

Evidence is so far lacking partly because doing studies and collecting the necessary information has been challenging for a number of reasons, including:

  • Children have been less likely to be tested for coronavirus infection compared to adults. Testing (particularly in the US where testing capacity constraints have been common) has been focused on symptomatic patients (especially those with severe symptoms), and children exhibit fewer and milder symptoms compared to adults.
  • Because children are less likely to be symptomatic, they may also be less likely to be identified as the “index” case during a contact tracing investigation and therefore their role in transmission could be underrecognized.
  • Children may have different social mixing patterns compared to adults, coming into close contact with others at different rates. This may complicate comparisons of transmission between children and adults. On the one hand, children may have had fewer contacts than adults during times when schools and daycares were closed, but, on the other, may have a greater number of close contacts than adults when in a more typical school environment.

Transmission in School Settings

Most countries that have reopened schools have not experienced outbreaks but almost all have had significantly lower rates of community transmission than the U.S. and higher testing and contact tracing capacity. In many countries around the world, schools and daycares have reopened following a period of lockdown. So far, most have not seen cases surge after re-opening. For the most part, the lack of a surge in cases and the ability to control any outbreaks in most countries that have re-opened schools is in large part explained by their significantly lower levels of community transmission at the time schools re-opened compared to much of the U.S. now, as well as their greater testing and contact tracing capacity.

In Table 1, we compare U.S. COVID-19 data to 13 other countries that have reopened schools. We looked specifically at the 7-day average of cases, cases per million, and test positivity rate as of the date each country reopened schools compared to the U.S. as of the most recent date. As shown, all countries that have reopened had significant lower case counts and cases per million than the U.S. currently has and all but one (Japan) had lower positivity rates. For example, when South Korea opened schools on June 8, the country had a 7-day average of just 44 cases nationwide (or 0.9 per million population), after more than two months of limited transmission; it also already had widespread testing (a test positivity rate of 0.3%) and contact tracing in place, meaning it was well positioned to respond quickly to any school outbreaks. By contrast, the U.S. is currently averaging at more than 65,000 cases a day (or 195 per million population) and its test positivity rate is 8%. Many other countries, such as Finland, Iceland, New Zealand, and Vietnam, similarly had low case numbers, cases per million, and positivity rates when they opened schools and have avoided large school-based outbreaks so far.

Table 1: School Re-Openings: Country Comparisons on Key Metrics Compared to Current U.S. Data
Date of reopeningDaily CasesDaily Cases Per Million PopulationPositivity Rate (%)
(7-day averages)
United States65,750.4198.68.3
Belgium5/18/2020291.325.12.1
Denmark4/15/2020205.735.56.2
France5/11/20201,110.917.01.1
Germany5/4/20201,140.313.62.4
Greece6/1/20205.60.50.1
Israel5/3/2020126.714.61.4
Japan4/24/20204393.58.7
South Korea6/8/202044.40.90.3
New Zealand5/14/20201.10.20
Norway4/20/202093.317.23.8
Switzerland5/11/202057.16.61.3
Taiwan2/25/20201.10.00.2
Vietnam5/18/20204.60.00
NOTES: U.S. estimates calculated based on most recent data. France positivity rate from May 24. Vietnam positivity rate from April 29. Data represent 7-day average, as of re-opening date (unless other date noted).SOURCES: COVID-19 data from: “Coronavirus Pandemic (COVID-19)”. Published online at OurWorldInData.org. Retrieved on July 28, 2020. School reopening dates from: University of Washington, Summary of School Re-Opening Models and Implementation Approaches During the COVID 19 Pandemic, July 6, 2020,

At the same time, school associated outbreaks have occurred in some countries. Not all countries have avoided school-associated outbreaks. For example, schools in Canada, Chile, France, and Israel have reported outbreaks, sometimes significant ones, necessitating re-closure of schools in some cases. Israel, in particular, has had several outbreaks at schools after reopening, including an outbreak in a high school where 13.2% of students tested positive for coronavirus as did 16.6% of staff and school-based cases have been linked to increasing community transmission. The country reopened when it had significant fewer cases, cases per million, and positivity rate than the U.S. does today (see Table 1); it reopened its entire school system with few social distancing or other mitigation measures. In Sweden, a country which never closed its schools for children under 16, health authorities have reported that teachers are no more at risk in schools than adults in other professions and community transmission was not affected by schools being open. There have been school outbreaks and deaths among school teachers in Sweden, but insufficient testing and contact tracing at Swedish schools make it difficult to draw definitive lessons from the Swedish school experience.

Like schools, daycare-associated outbreaks also have been reported, including in the U.S., such as in California and Texas.

Conclusion

Taken together, the evidence indicates that while children are much less likely than adults to become severely ill from COVID-19, they do transmit virus. It is still unclear to what extent children, especially younger ones, are likely to get infected or transmit the infection to others compared to adults. However, where there is already widespread community transmission, as is the case in many areas in the U.S., there is clearly a risk of spread associated with reopening schools. This challenge may be more pronounced where testing and contact tracing capacity is limited. As such, the risk of re-opening schools needs to be considered carefully in light of the recognized benefits of in-person education.

KFF Health Tracking Poll – July 2020

Published: Jul 27, 2020

Coronavirus

Coronavirus: Reopening, Schools, And The Government Response

Key Findings

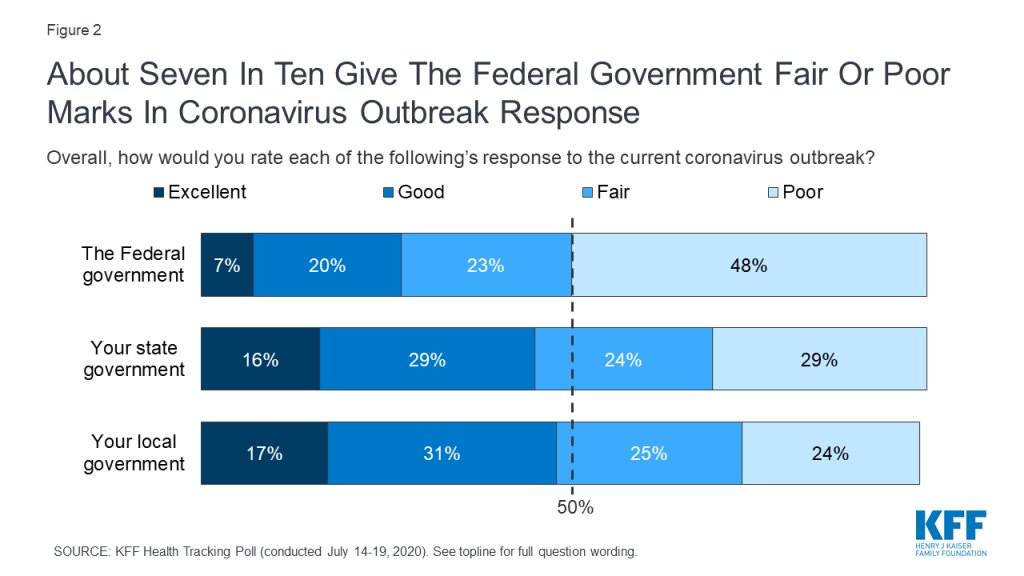
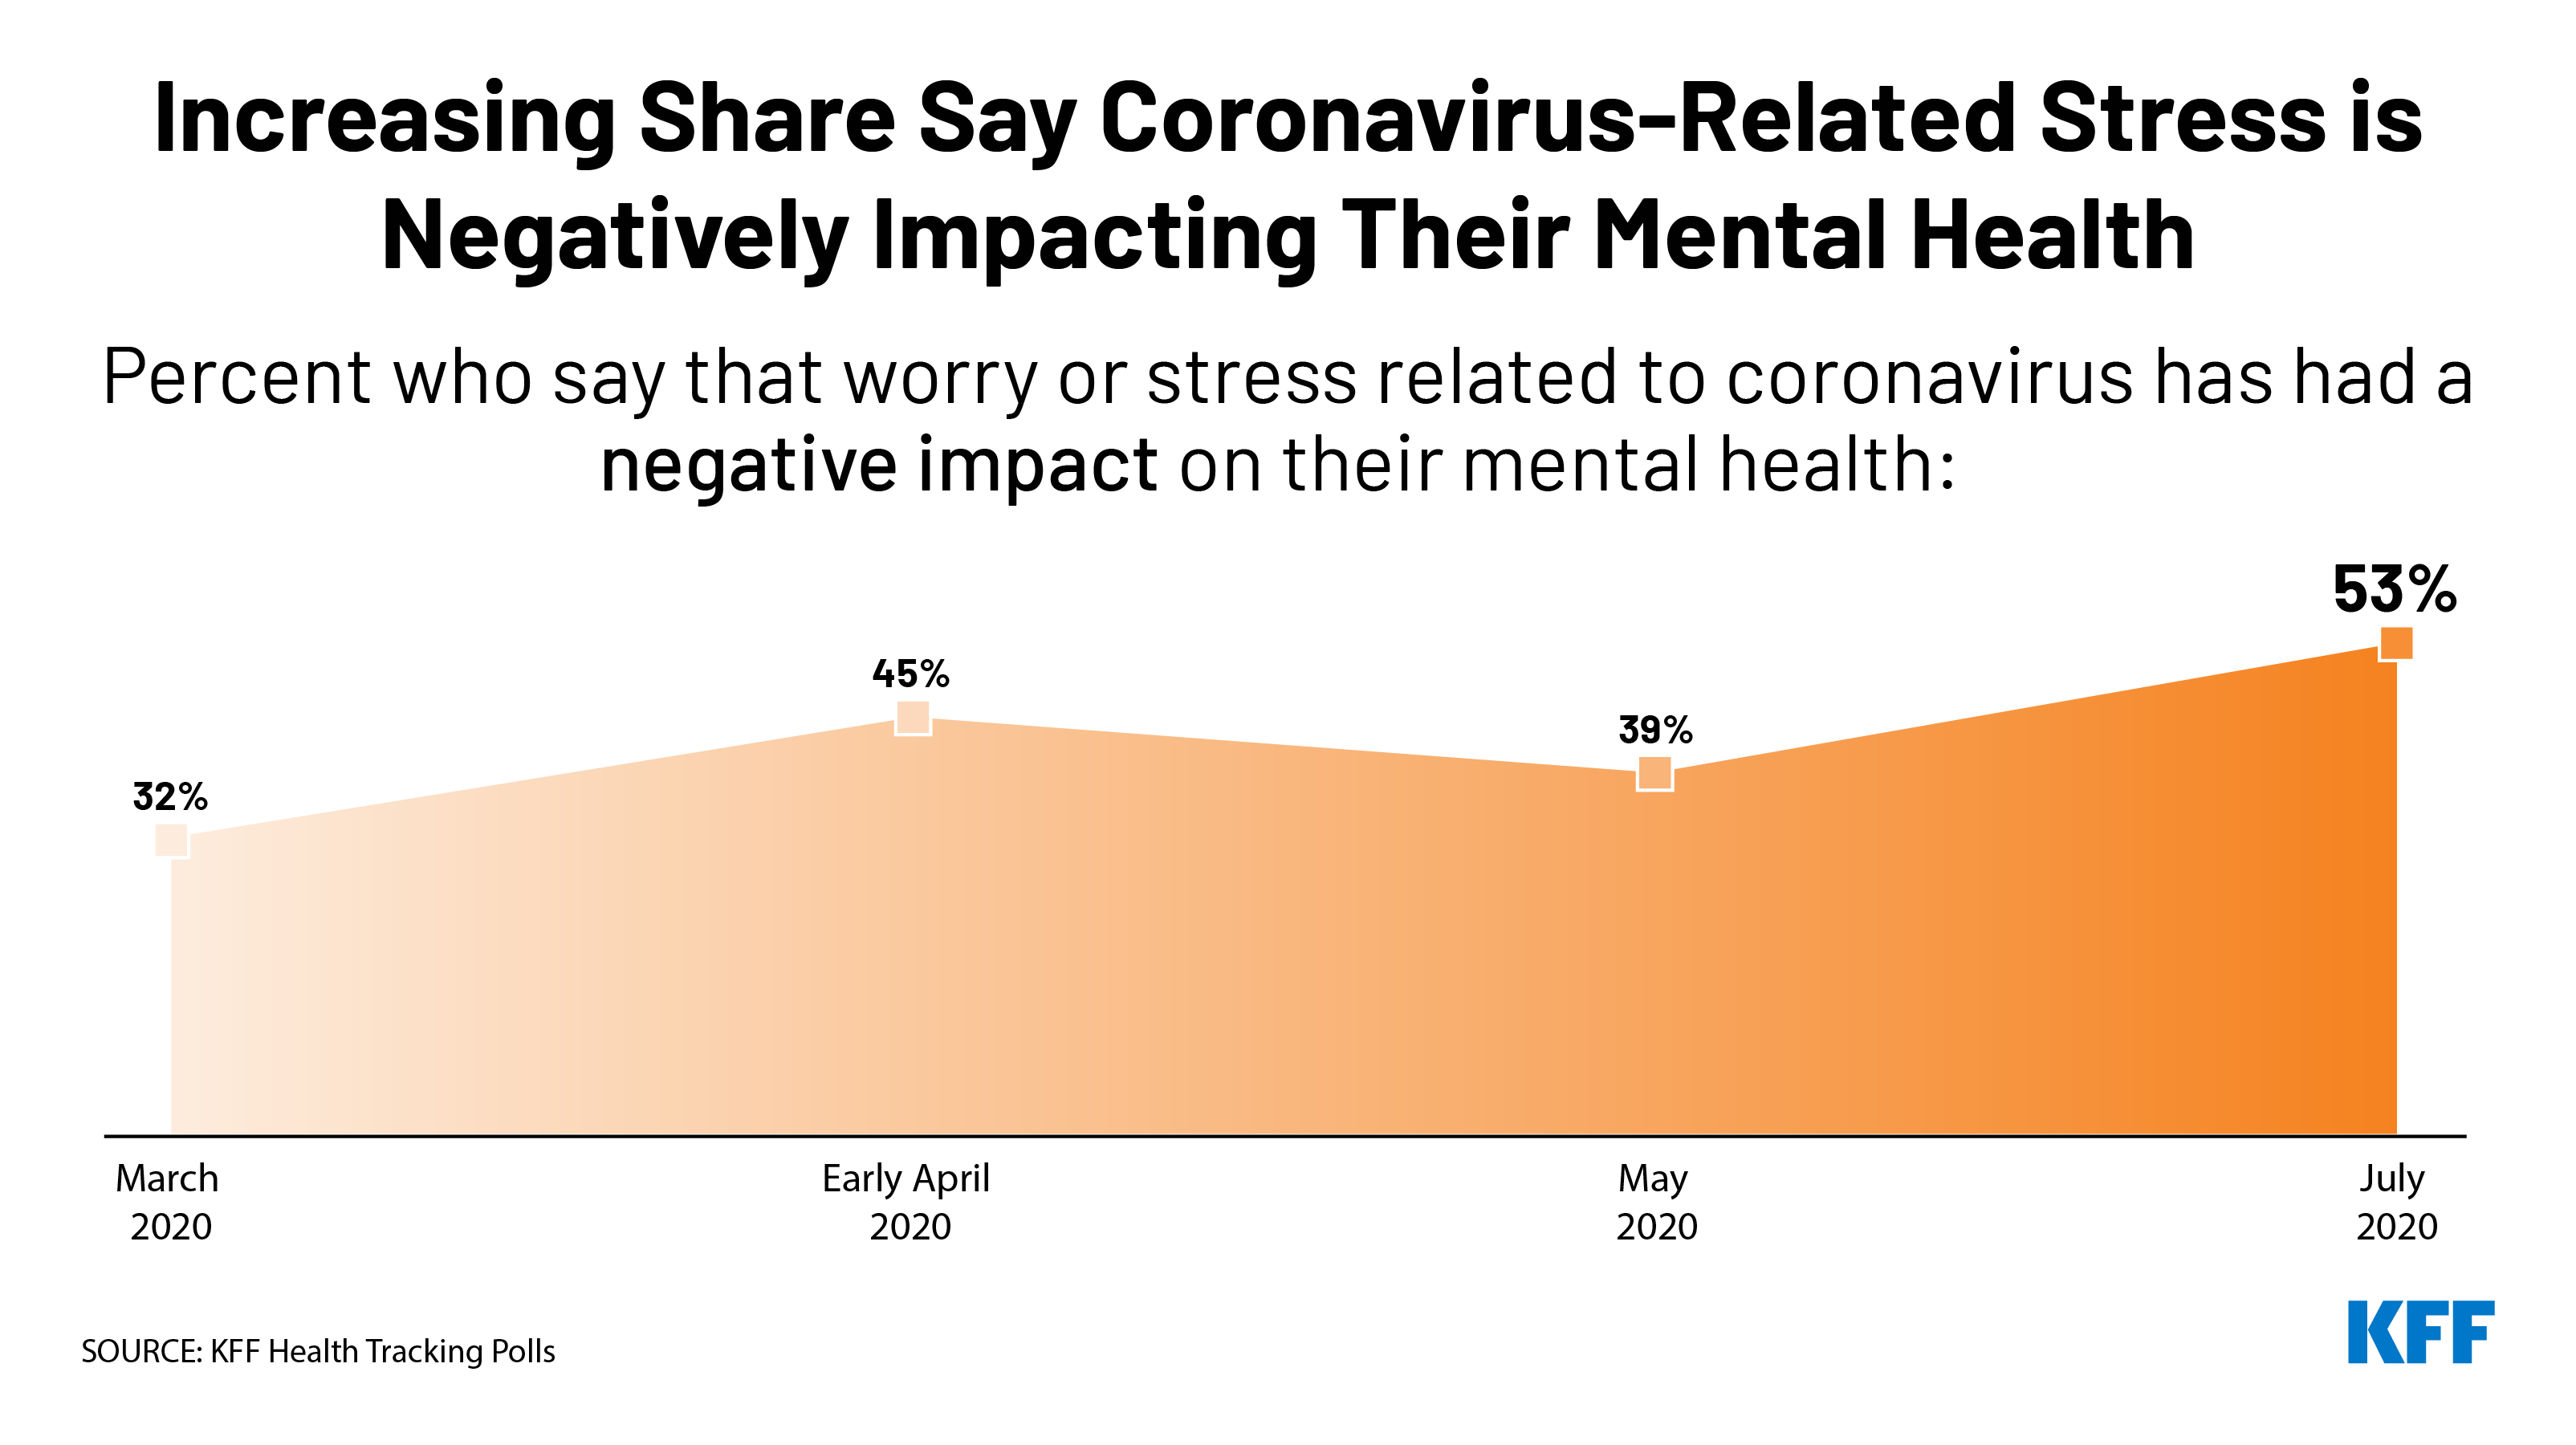
  • Amid a surging coronavirus pandemic and record numbers of new cases in many states, the latest KFF Health Tracking Poll finds most U.S. adults feel the worst effects of the pandemic are yet to come, and seven in ten (including four in ten Republicans) rate the federal government response to the pandemic as fair or poor. The survey also indicates that the pandemic is increasingly taking an emotional toll, with a majority of U.S. adults (53%) saying that worry and stress related to coronavirus has had a negative impact on their mental health, up from 39% in May.
  • With Congress set to consider its next coronavirus relief package, a clear majority of the public across political party affiliation says that top priority should be given to increasing federal funding for efforts to limit the spread of the virus such as testing, contact tracing, and personal protective equipment for essential workers. Most Democrats, and about half of independents and Republicans, also say Congress should prioritize increasing federal support for state and local governments to help schools reopen safely. Large shares of the public also see various measures to bolster individuals’ financial health and increase access to health insurance amid the economic downturn as important things for Congress to tackle, though partisans divide on the priority that should be placed on these measures.
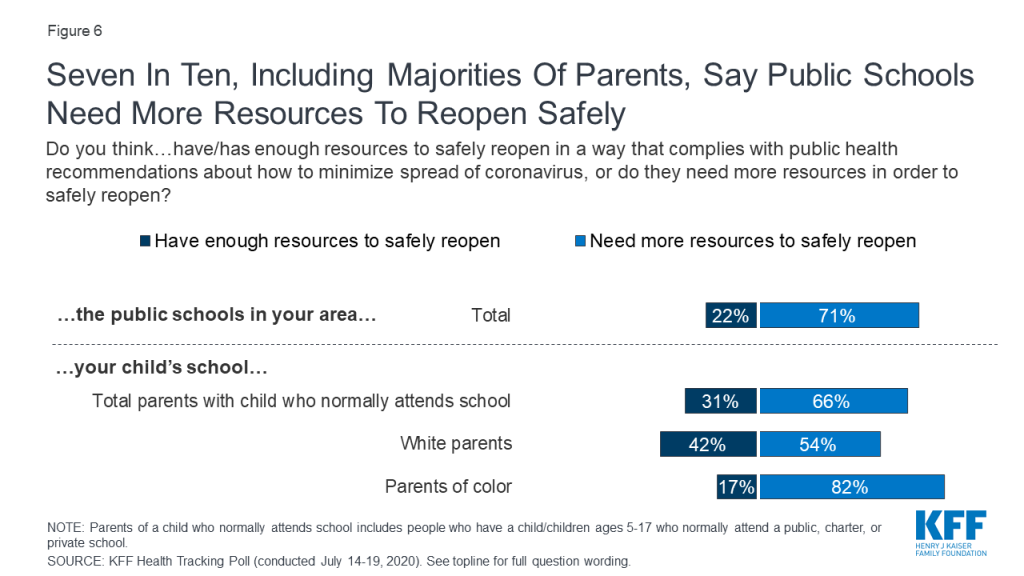
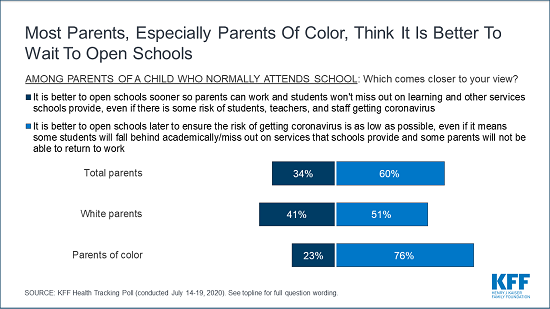
  • With the new school year quickly approaching, the issue of whether and how to reopen schools looms large for both parents and policymakers. On balance, most parents with kids in school (60%) say it is better to open schools later to minimize infection risk, even if students miss out on academics and social services and some parents will not be able to work, while about half as many (34%) say it’s better to open schools sooner so parents can work and kids can get services, even if there’s some risk of infection. A majority (71%) of the public overall say that public schools in their area need more resources to reopen safely, and 66% of parents say the same about their own child’s school. Parents of color are more likely than White parents to say it is better for schools to open later to minimize infection risk, and to say that their own child’s school lacks the resources it needs to reopen safely.1 
  • Parents – particularly parents of color and those with lower incomes – have a variety of worries related to both a school reopening scenario, and one in which schools remain closed. When it comes to reopening, majorities are worried that their child, family members, or teachers may get sick from the virus, and most also worry about schools’ and students’ ability to comply with physical distancing and other public health guidance. If schools don’t reopen, about two-thirds of parents are worried about their children falling behind socially and emotionally (67%) and academically (65%), and about half worry about losing income if they can’t go to work (51%) or not being able to pay enough attention to their kids if they’re working at home (47%). The inability to access other services schools provide is a concern for some parents: 40% worry about their child not getting needed social services if schools remain closed, 31% worry they won’t have access to technology needed for online learning, and 24% worry about their children having enough food to eat at home. Many of these worries – both about the risks of school reopening and the loss of learning and social services – are much higher among parents of color and those with lower incomes than they are among White and higher-income parents.
  • The latest KFF Health Tracking Poll also finds that more than four months in, the coronavirus pandemic continues to take an economic toll on Americans. Four in ten report trouble affording basic necessities or falling behind on household or medical bills in the past 3 months, including 22% who say they experienced this directly because of coronavirus and its impact on their financial situation, and 17% who say they were experiencing these problems before coronavirus.

View On The State Of The Pandemic And Government Response

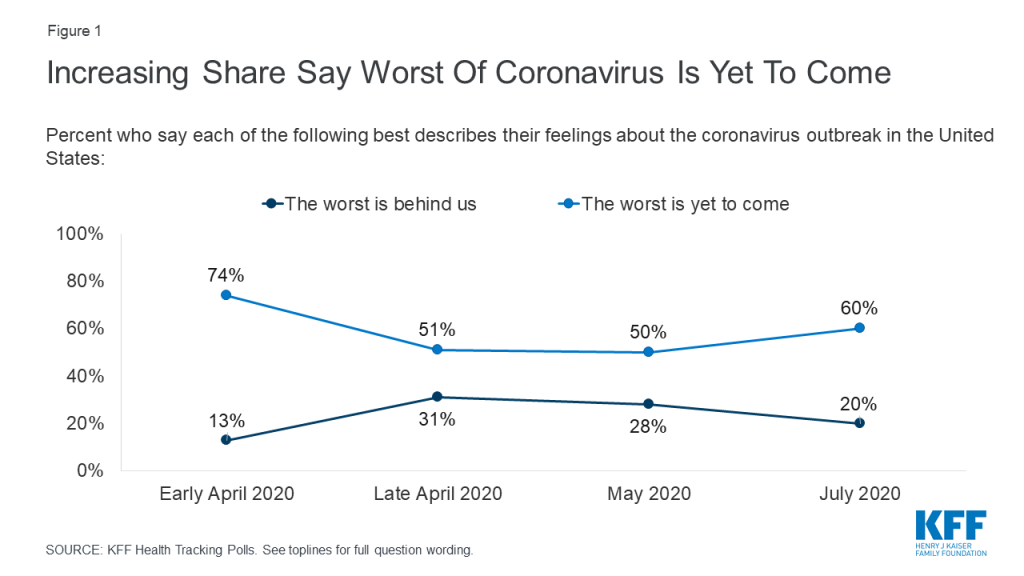
With a mounting death toll and coronavirus cases surging throughout much of the U.S., a majority of the public (60%) think that the worst is yet to come, up from 50% in May, though not as high as the 74% of adults in early April who thought things were likely to get worse. One in five adults (20%) currently think that the worst of the coronavirus outbreak is behind us. The overall numbers mask a deep partisan divide, with a slight majority of Republicans saying either “the worst is behind us” (31%) or that they don’t think the coronavirus is or will be a major problem (23%), while about eight in ten Democrats (79%) and a majority of independents (57%) say “the worst is yet to come.”

Figure 1: Increasing Share Say Worst Of Coronavirus Is Yet To Come

Amid what many see as a botched federal response to the virus, about half of U.S. adults (48%) rate the federal government response to the pandemic as “poor” while another 23% call it “fair.” Just 28% rate the federal response as “good” or “excellent.” Even among Republicans, who are generally supportive of President Trump and his Administration, 42% rate the federal government response to the pandemic as “fair” or “poor.” The public is more divided when it comes to assessing state and local governments, with about half of adults giving their state (46%) and local (48%) governments positive marks.

Figure 2: About Seven In Ten Give The Federal Government Fair Or Poor Marks In Coronavirus Outbreak Response
Table 1: Views of federal, state, and local response to coronavirus by party identification
How would you rate…to the current coronavirus outbreak?Party identification
DemocratsIndependentsRepublicans
…the federal government’s response…
Excellent/good8%26%57%
Fair/poor917342
…your state government’s response…
Excellent/good554244
Fair/poor445756
…your local government’s response…
Excellent/good574550
Fair/poor425447
Majorities Across Parties Say Congress Should Prioritize Funding For Testing And Contact Tracing

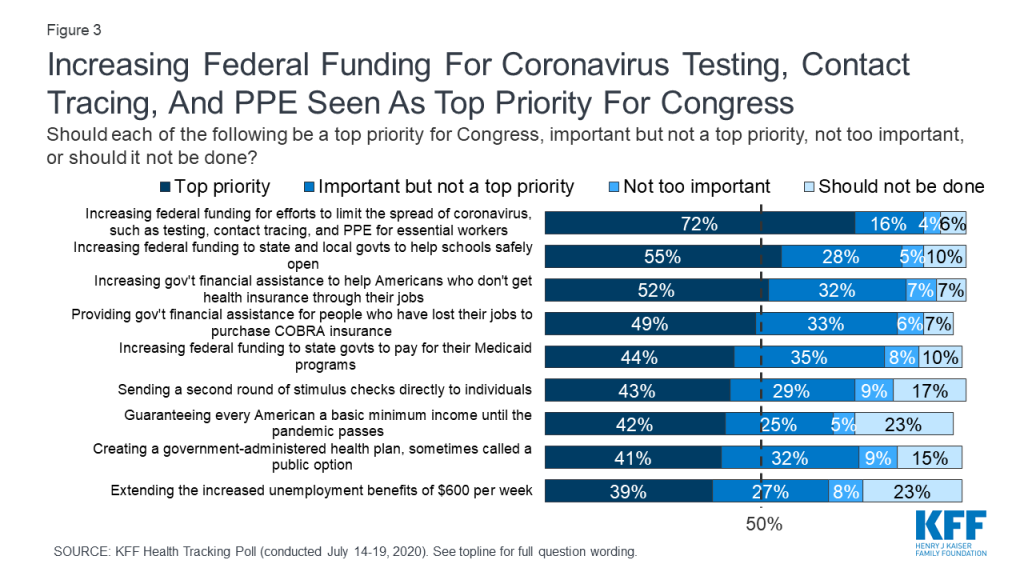
As Congress discusses its next coronavirus relief package, there are reports that the Trump Administration is resisting allocating additional federal funds for coronavirus testing, contact tracing, and other prevention measures. This is at clear odds with the public’s priorities; when asked about a number of potential actions Congress could take, the highest-ranked priority among the public is increasing federal funding for efforts to limit the spread of coronavirus, such as testing, contact tracing, and personal protective equipment for essential workers. Seven in ten adults overall (72%) say this should be a top priority for Congress, including majorities of Democrats, independents, and Republicans. Schools are another popular priority: a majority (55%) say increasing federal funding to state and local governments to help schools reopen safely should be a top priority, including about two-thirds of Democrats (68%) and about half of independents (53%) and Republicans (48%).

Figure 3: Increasing Federal Funding For Coronavirus Testing, Contact Tracing, And PPE Seen As Top Priority For Congress

Other measures to provide economic relief or extend insurance benefits are seen as important by large shares of the public overall, but have less broad appeal across partisans. For example, about half the public overall say increasing government financial assistance to help Americans who do not get health insurance from their jobs pay for coverage (52%) and providing financial assistance for people who have lost their jobs to purchase COBRA insurance through their former employers (49%) should be top priorities. However, there are large partisan gaps, with Democrats 42 percentage points more likely than Republicans to say Congress should place a top priority on increasing government financial assistance for individual health insurance, and 26 percentage points more likely to say Congress should place a top priority on providing assistance for people to purchase COBRA coverage.

About four in ten overall say other actions should be top priorities for Congress, including increasing funding to states to help pay for Medicaid (44%), sending a second round of stimulus checks to individuals (43%), guaranteeing every American a basic income until the pandemic passes (42%), creating a public option health insurance plan (41%), and extending the additional unemployment benefits set to expire at the end of July (39%). Views on each of these measures are marked by large partisan differences, with about six in ten Democrats saying each should be a top priority, compared with about a quarter of Republicans.

Table 2: Views of potential Congressional actions on coronavirus by party identification
Percent saying each of the following should be a “top priority” for Congress:Party identification
DemocratsIndependentsRepublicans
Increasing federal funding for efforts to limit the spread of coronavirus90%65%57%
Increasing federal funding to state and local governments to help schools safely open685348
Increasing government financial assistance to help more Americans who don’t get health insurance through their jobs purchase coverage734931
Providing government financial assistance for people who have lost their jobs to purchase COBRA health insurance634737
Increasing federal funding to state governments to help pay for their Medicaid programs634325
Sending a second round of stimulus checks directly to individuals584027
Guaranteeing every American a basic minimum income until the pandemic passes564227
Creating a public option health plan573926
Extending the increased unemployment benefits of $600 per week which are set to expire on July 31st593625

Views On The Pace Of Reopening, Including Schools

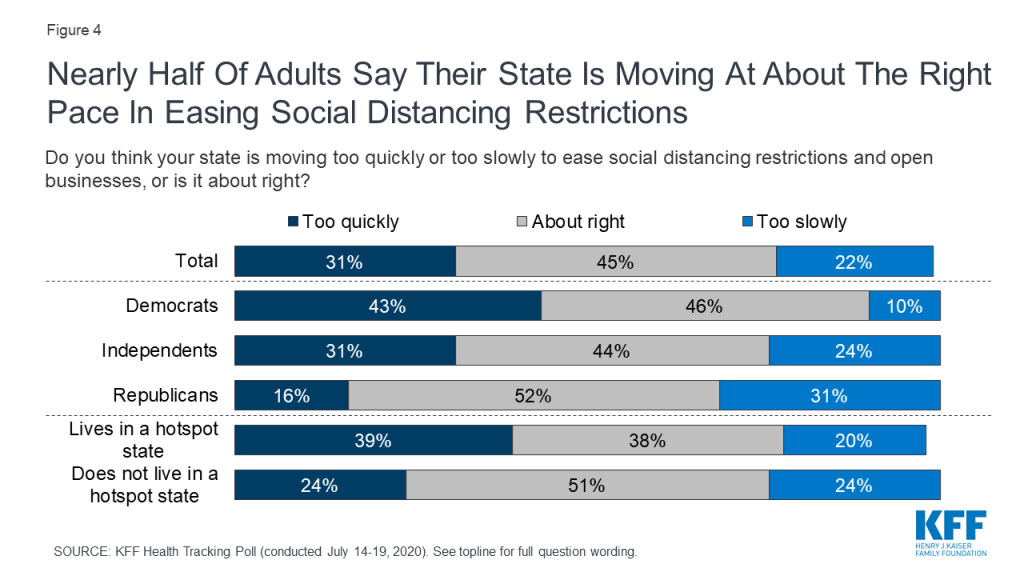
With coronavirus cases surging in many states that took an early approach to reopening, a plurality (45%) of adults overall say their state is moving at about the right pace in easing social distancing restrictions and opening businesses, while three in ten (31%) say their state is moving “too quickly” and about one in five (22%) say their state is opening “too slowly.” Views on reopening vary by both partisanship and location. Democrats are about three times as likely as Republicans to feel their state is moving too quickly, while Republicans are about three times as likely as Democrats to feel their state is moving too slowly. Notably, about four in ten adults (39%) in states that are current coronavirus hotspots (based on case data as of July 18) say their state is moving too quickly to reopen, compared to about one in four (24%) in non-hotspot states.2 

Figure 4: Nearly Half Of Adults Say Their State Is Moving At About The Right Pace In Easing Social Distancing Restrictions

Public And Parents Prefer To Delay School Openings To Mitigate Risk

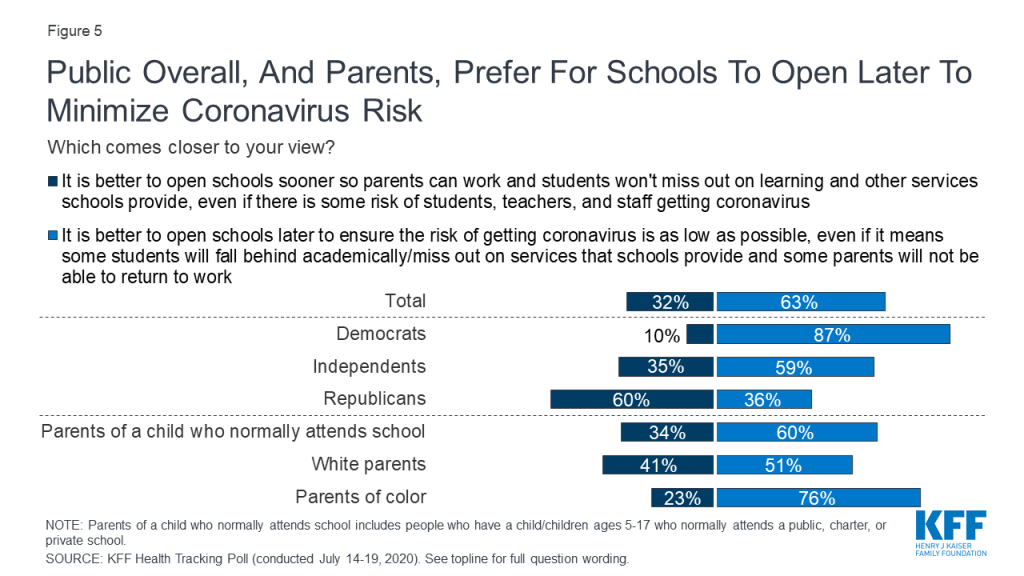
With the new school year quickly approaching, the issue of whether and how to reopen schools for in-person instruction has been at the forefront of discussions for both parents and policymakers. President Trump has stated that he wants schools to reopen for in-person instruction in the fall, and has even suggested that the federal government may withhold money from schools that don’t reopen. When asked to weigh the risks vs. benefits, a majority of the public (63%) thinks it is better to open schools later to ensure the risk of getting coronavirus is as low as possible, even if it means some students will fall behind academically or miss out on services and some parents will be unable to return to work. About a third (32%) think it is better to open schools sooner so that parents can work and students won’t miss out on learning and other services, even if there is some risk to teachers, students and staff. There is a large partisan gap on this issue among the public overall, with 87% of Democrats and 59% of independents preferring schools open later while six in ten Republicans (60%) prefer that schools open sooner.

Among parents with a child age 5-17 that normally attends school, six in ten (60%) think it is better to reopen schools later in order to ensure the risk of coronavirus is as low as possible, while about half as many (34%) think it is better to reopen sooner. Parents of color (76%) are even more likely to prefer a later reopening compared to their White counterparts (51%).

Figure 5: Public Overall, And Parents, Prefer For Schools To Open Later To Minimize Coronavirus Risk

The public’s caution towards reopening schools may be reinforced by a sense that schools do not have the necessary resources to safely reopen in a manner that complies with public health recommendations on how to minimize the risk of spreading coronavirus. Seven in ten adults overall say that public schools in their area need more resources in order to safely reopen, while just 22% say schools have enough resources. This sentiment is echoed by parents of school-aged children when they are asked about their own child’s school. Two-thirds of parents (66%) say their child’s school needs more resources in order to safely reopen. Notably, parents of color are more likely than their White counterparts to say their child’s school lacks the resources necessary to safely reopen (82% vs. 54%).

Figure 6: Seven In Ten, Including Majorities Of Parents, Say Public Schools Need More Resources To Reopen Safely
Parents – Particularly parents of color and those with Lower Incomes – Worry about both school reopening And remaining closed

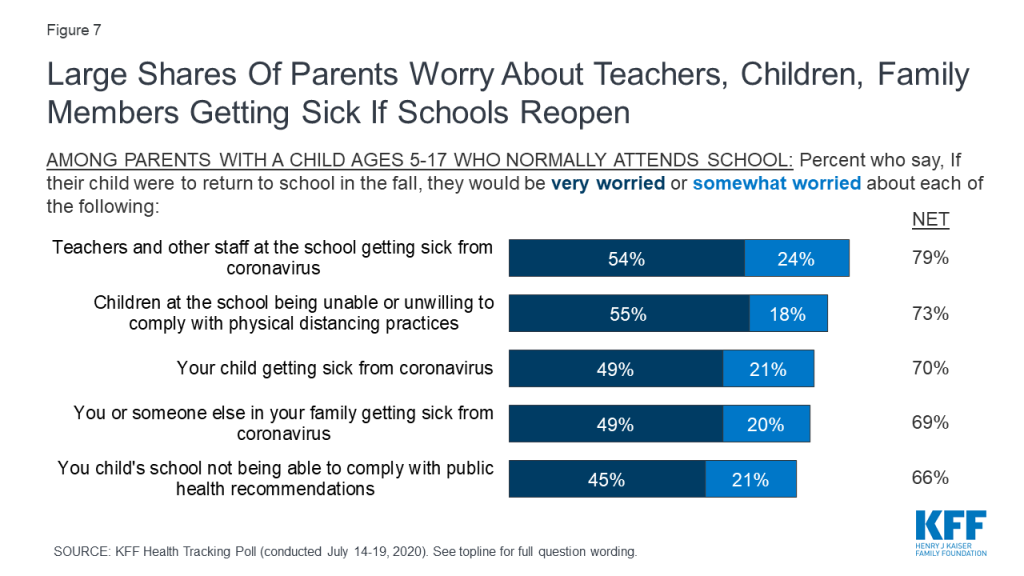
With many schools’ academic year commencing in August and early September, about half of parents with children who typically attend school (52%) said their child’s school had not yet announced whether they would be having in-person classes this fall at the time they took the survey. This month’s poll asked parents about worries related to both a school reopening scenario and one in which schools remain closed to in-person instruction. When it comes to reopening, large shares of parents with a child enrolled in school are worried about teachers and staff getting sick from coronavirus (79% very or somewhat worried) and children being unable or unwilling to comply with physical distancing practices (73% very or somewhat worried). About seven in ten are also worried about their child (70%) or themselves or a family member (69%) getting sick from coronavirus, while two-thirds (66%) worry about their child’s school being unable to comply with public health recommendations.

Figure 7: Large Shares Of Parents Worry About Teachers, Children, Family Members Getting Sick If Schools Reopen

Reflecting the disproportionate impact of the coronavirus pandemic on those with lower incomes and on communities of color, there are some notable differences in worry levels between parents of color and White parents, and between those with lower and those with higher household incomes. Nine in ten parents of color (91%) say they are either “very worried” or “somewhat worried” about their child getting sick with coronavirus if they return to school in the fall, compared to 55% of White parents who say the same. Similarly, about nine in ten of parents of color say they are worried about teachers and other staff getting sick with coronavirus (92%), children being unable or unwilling to physically distance (91%), and that they or a family member will get sick with coronavirus (90%). Far fewer White parents say they are worried about each of these concerns.

In addition, parents who have a household income under $90,000 are more likely than their higher-income counterparts to say they are worried about children being unable or unwilling to physically distance (82% vs. 62%) or teachers and staff getting sick from the coronavirus (84% vs. 73%).

Table 3: Worries about school reopening among parents by race/ethnicity and household income
Percent who say they are “very worried” or “somewhat worried” about each of the following if their child DOES return to school in-person:All parents with a child who normally attends schoolRace/ethnicityHousehold Income
Parents of colorWhite ParentsParents with HH income under $90,000Parents with HH income $90,000+
Teachers and other staff at school getting sick from coronavirus79%92%69%84%73%
Children at the school being unable or unwilling to comply with physical distancing practices7391608262
Their child getting sick with coronavirus7091557565
They or someone else in their family getting sick from coronavirus6990537266
Their child’s school being unable to comply with public health recommendations6688496866

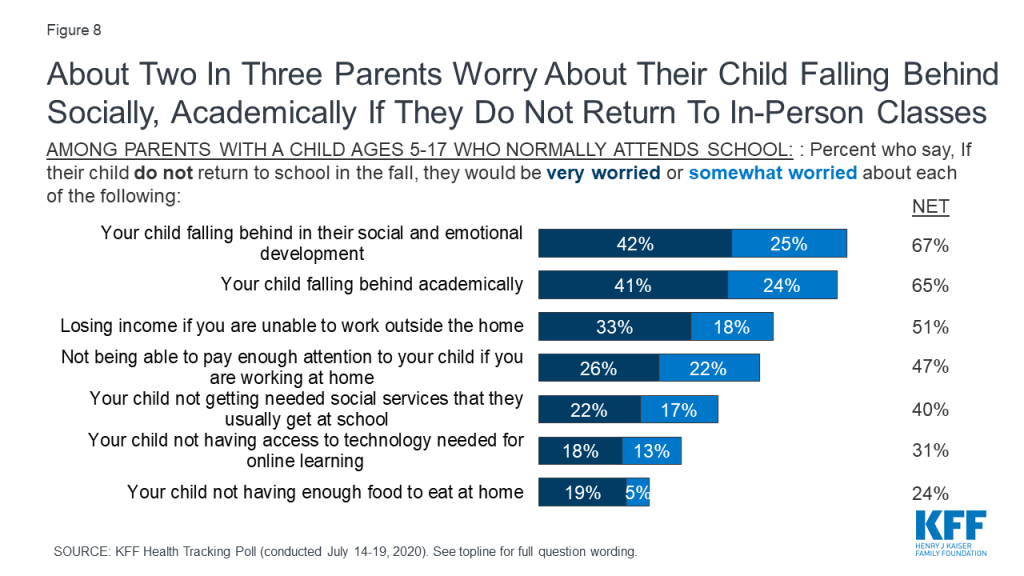
Parents also express a number of worries related to schools remaining closed for in-person instruction in the fall. If schools don’t reopen, about two-thirds of parents say they would worry about their children falling behind socially and emotionally (67%) and academically (65%), and about half say they would worry about losing income if they can’t go to work (51%) or not being able to pay enough attention to their kids if they’re working at home (47%). Other services schools provide are also a concern for some parents: 40% worry about their child not getting needed social services if schools remain closed, 31% worry they won’t have access to technology needed for online learning, and 24% worry about their children having enough food to eat at home.

Figure 8: About Two In Three Parents Worry About Their Child Falling Behind Socially, Academically If They Do Not Return To In-Person Classes

Similar to the findings on parental worries about their child returning to school in-person in the fall, parents of color and those with lower household incomes are also more likely than their counterparts to say they worry about possible outcomes if their children do not return to in-person classes.

Parents of color are more likely than White parents to say they are “very worried” or “somewhat worried” about their child not getting social services they usually get at school (52% vs. 32%), are almost three times as likely to worry their child won’t have access to the technology needed for online learning (49% vs. 17%), and about five times as likely to worry their child will not have enough to eat at home (44% vs. 9%). Parents of color are also more likely than White parents to worry about losing income if they are unable to work outside the home (65% vs. 41%).

Similarly, parents with household incomes under $90,000 more likely than their higher income counterparts to be worried that their child will not have access to social services they usually get at school (47% vs. 26%), will not have enough to eat at home (34% vs. 6%), or won’t have access to the technology needed for online learning (43% vs. 10%). Moreover, lower-income parents are more likely than those with higher incomes to worry about losing income if they are unable to work outside the home (61% vs. 35%).

Table 4: Worries about schools remaining closed among parents by race/ethnicity and household income
Percent saying they are “very worried” or “somewhat worried” about each of the following if their child DOES NOT return to school in-person:All parents with a child who normally attends schoolRace/ethnicityHousehold Income
Parents of colorWhiteParentsParents with HH income under $90,000Parents with HH income $90,000+
Their child falling behind on their emotional and social development67%76%62%68%65%
Their child falling behind academically6573606663
Losing income if they are unable to work outside the home5165416135
Not being able to pay enough attention to their child if they are working from home4756414948
Their child not getting needed social services they usually get at school4052324726
Their child not having enough to eat at home24449346
Their child not having access to the technology needed for online learning3149174310

The Continuing Impact Of The Coronavirus Pandemic On Mental Health, Wellbeing, And Financial Health

over half report a negative impact on mental health

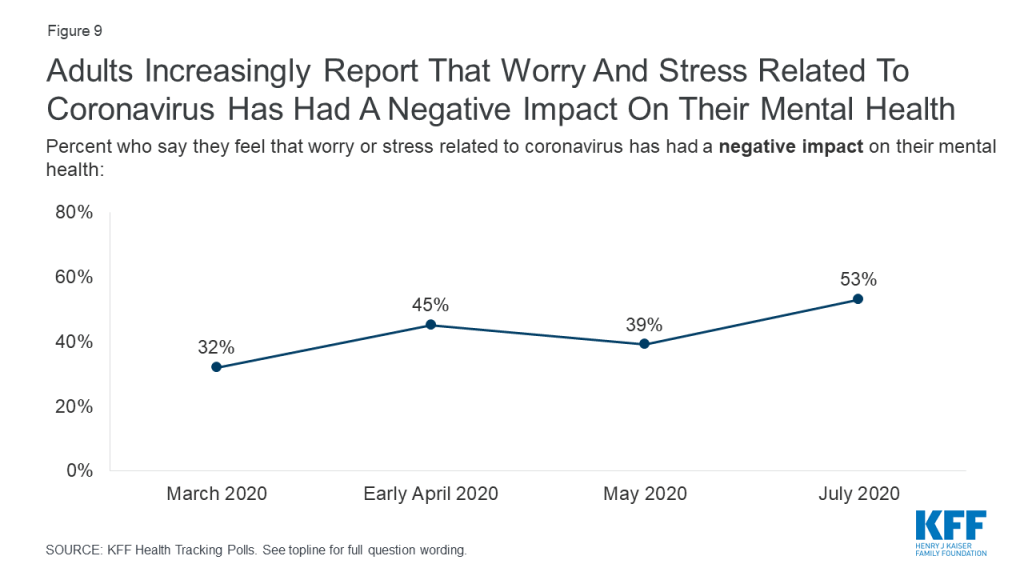
As life with the coronavirus pandemic wears on, Americans increasingly say it is taking a negative toll on their mental health. For the first time since KFF began tracking this question in March, a majority of adults (53%) now say that stress and worry related to the pandemic has had a negative impact on their mental health. This is up 14 percentage points since May, and up 8 percentage points since the previous high of 45% in early April. About one in four (26%) say worry and stress related to coronavirus has had a “major impact” on their mental health, while a similar share (28%) say it has had a “minor impact.”

Figure 9: Adults Increasingly Report That Worry And Stress Related To Coronavirus Has Had A Negative Impact On Their Mental Health

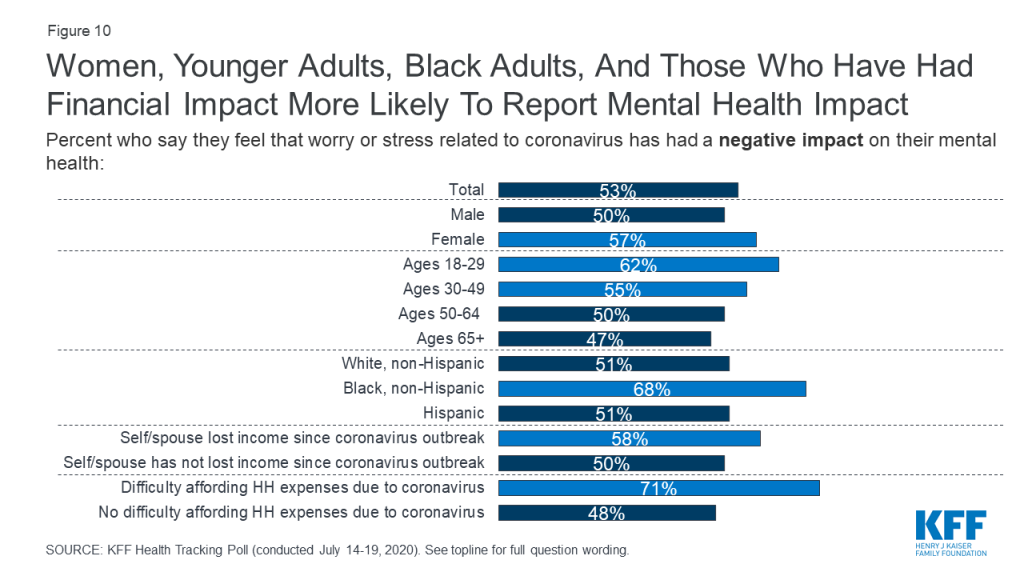
Notably, younger adults are more likely older adults, and women are more likely than men, to say stress and worry related to coronavirus has had a negative impact on their mental health. About seven in ten Blacks adults (68%) and those who have had difficulty paying household bills in the past three months due to the financial impact of the coronavirus outbreak (71%) say that stress and worry related to the pandemic has had a negative impact on their mental health.

Figure 10: Women, Younger Adults, Black Adults, And Those Who Have Had Financial Impact More Likely To Report Mental Health Impact

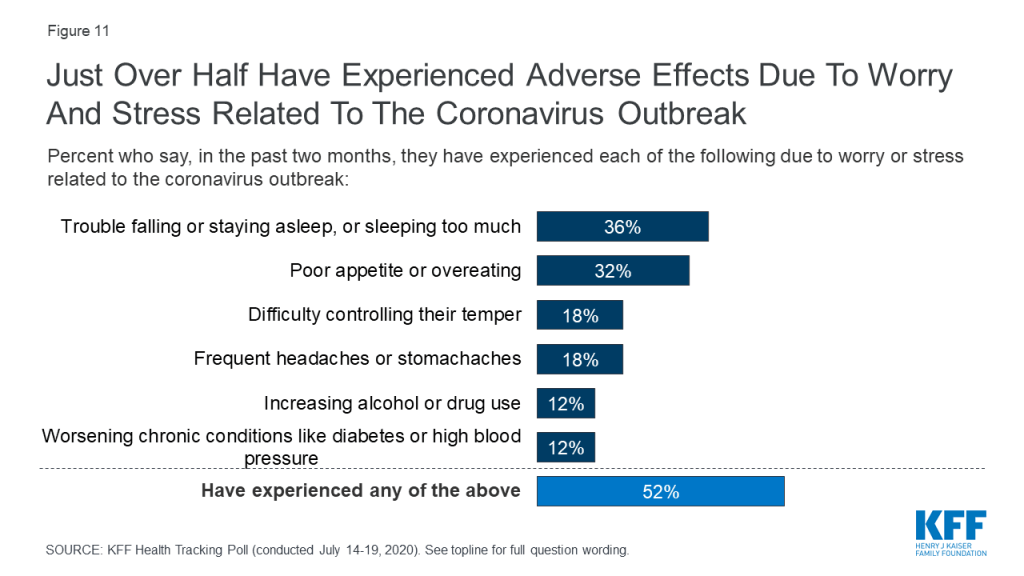
In addition to reporting a general negative impact on their mental health, about half (52%) of adults report that worry and stress related to the coronavirus outbreak has had adverse effects on their mental health and wellbeing in specific ways. About a third say coronavirus-related worry or stress has led to problems with their sleep (36%) or has led to a poor appetite or overeating (32%). About one in five say worry or stress related to the pandemic has caused them to experience frequent headaches or stomachaches (18%) or difficulty controlling their temper (18%), while 12% each say it has led to increased alcohol or drug use or worsening chronic health conditions.

Figure 11: Just Over Half Have Experienced Adverse Effects Due To Worry And Stress Related To The Coronavirus Outbreak

Mirroring the findings on overall negative impact on mental health, younger adults and women are more likely than their counterparts to say coronavirus-related stress has caused adverse effects on their mental health or wellbeing. Notably, three in four adults who have had difficulty paying household bills in the past three months due to the financial impact of coronavirus say they have also experienced adverse effects their mental health and wellbeing, as do about six in ten Hispanic adults and Black adults.

Figure 12: Certain Groups, Including Hispanic And Black Adults And Those Financially Impacted, More Likely To Report Adverse Health Effects

four in ten have problems affording household expenses or health care

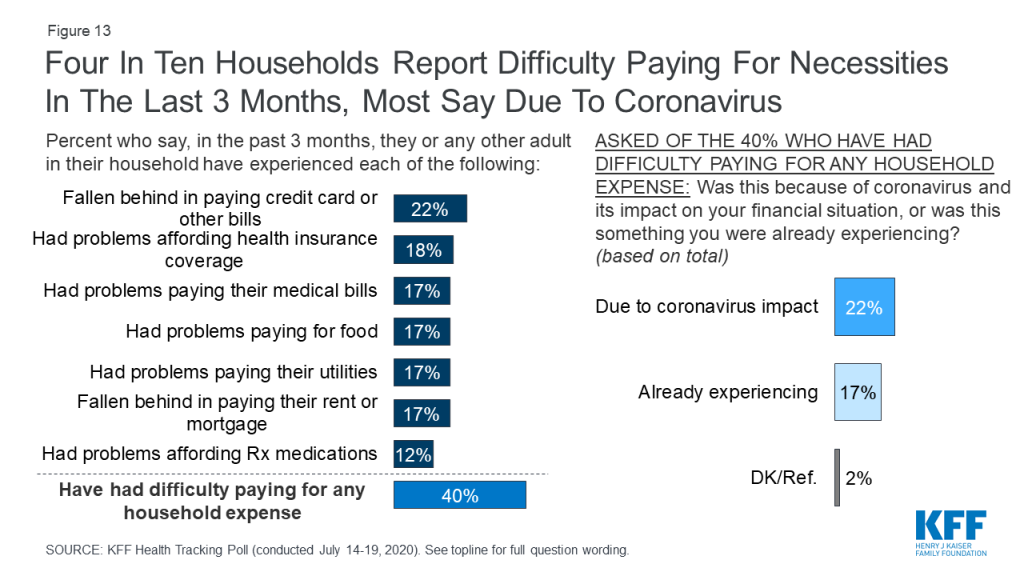
With the country facing a double-digit unemployment rate, four in ten adults say they or an adult in their household has had problems paying bills or difficulty affording medical care or basic expenses in the past three months. This includes about one in five who say they have fallen behind on their credit card bills (22%), 18% who have had trouble affording health insurance, and similar shares who say they have had trouble paying medical bills (17%), paying for food (17%), paying utility bills (17%) or have fallen behind on their rent or mortgage (17%). Additionally, 12% say they have had problems affording their prescription medications. Notably, among the 40% of adults who have experienced difficulty paying household or medical bills in the last three months, most (54%, or 22% of all adults) say it was due to the coronavirus outbreak and its impact on their financial situation, while 42% (17% of all adults) say this something they were already experiencing before the pandemic.

Figure 13: Four In Ten Households Report Difficulty Paying For Necessities In The Last 3 Months, Most Say Due To Coronavirus

Politics

Coronavirus and the 2020 Election, ACA

Key Findings

  • Less than four months before the 2020 presidential election, the latest KFF Health Tracking Poll finds President Trump receiving his lowest ratings ever from voters on his handling of the coronavirus outbreak. President Trump still garners majority support from Republican voters on all key issues.
  • With the number of coronavirus cases in the U.S. now exceeding 4 million people, nearly twice as many voters give President Trump negative marks on his handling of this issue as give him positive marks (61% v. 35%).
  • The July poll also explores how two key groups of voters for the 2020 election (swing voters and Electoral College battleground voters) view the job President Trump is doing. About half of these voters approve of President Trump’s handling of the U.S. economy, but similar to overall voters, they disapprove of his handling of other issues.
  • President Trump also receives low marks on his handling of health care and the Affordable Care Act, the 2010 health care law which the Trump administration is currently challenging in court. About one-third of voters say they approve of the president’s handling of health care generally (35%) and the Affordable Care Act specifically (33%). Partisans have very different views on President Trump’s handling on both of these issues with most Democrats disapproving while majorities of Republicans approving.
  • The public’s views of the Affordable Care Act have largely remained unchanged over the course of the coronavirus pandemic, with half of the public continuing to view the law favorably. There are strong partisan differences in how the public views both the ACA and the pending Supreme Court case challenging the legality of the 2010 law, with Republicans overwhelmingly wanting to see the law overturned while most Democrats want to see the ACA remain in place and largely disapprove of recent Trump administration actions challenging the law.

The 2020 Election

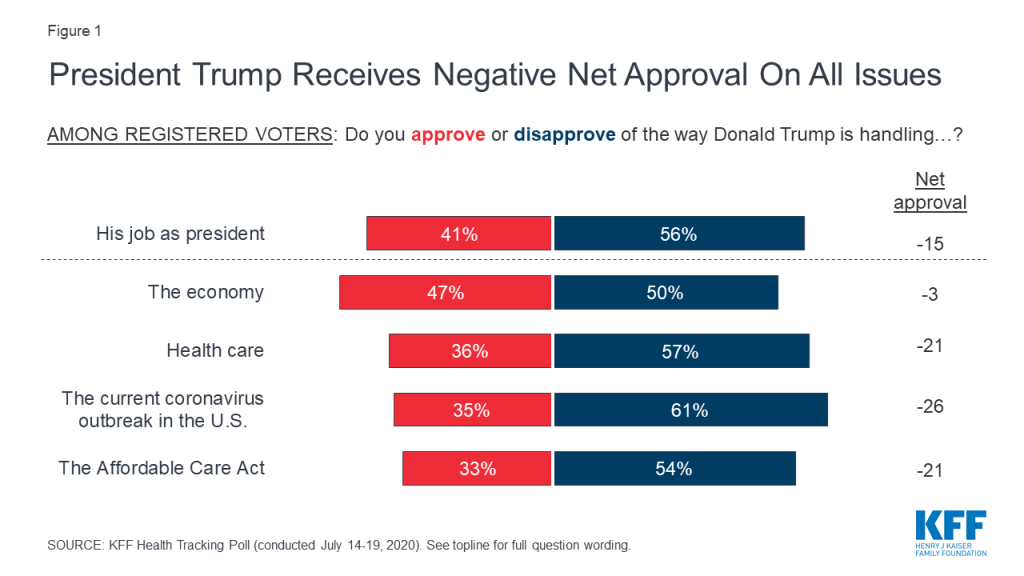
Four months out from 2020 election, voters give President Trump negative ratings on his overall job approval as well as his handling of key issues that will likely decide the election President Trump also now garners his lowest net approval on the handling of the coronavirus outbreak in the U.S. since KFF began polling on the topic. One-third (35%) of voters approve of his handling of the coronavirus outbreak in the U.S. while six in ten (61%) voters disapprove (net approval of -26 percentage points). President Trump also receives negative ratings on his handling of health care more broadly (net approval of -21 percentage points) as well as his handling of the Affordable Care Act (net approval of -21 percentage points). While President Trump had previously received positive marks on his handling of the economy, voters are now split with 47% approving of his handling of the nation’s economy, and 50% disapproving (resulting in a negative net approval—approval minus disapproval—of -3 percentage points). Overall, four in ten voters (41%) approve of how President Trump is handling his job as president while a majority disapprove (56%).

Figure 1: President Trump Receives Negative Net Approval On All Issues

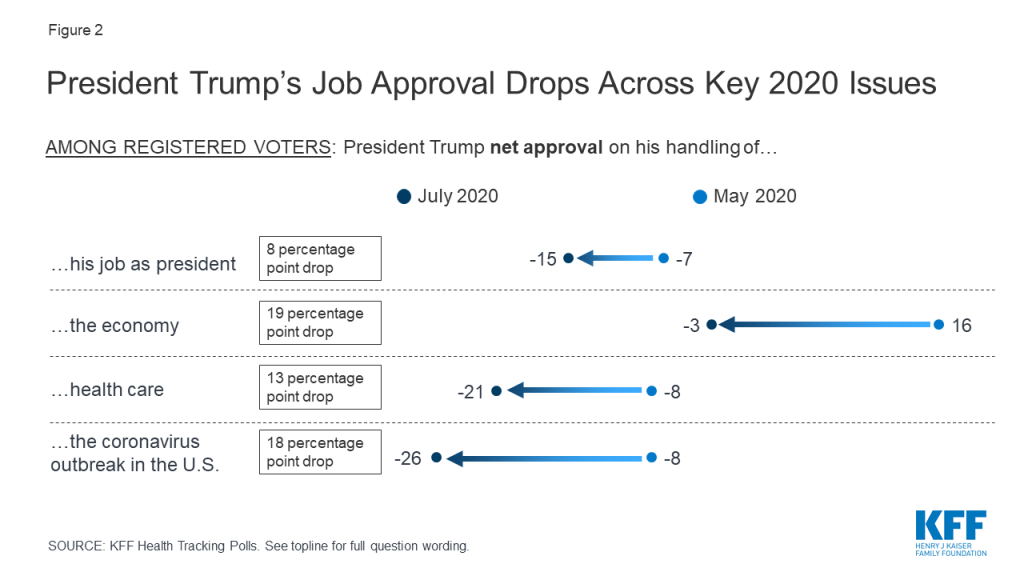
Voters’ attitudes on President Trump’s handling of both the economy and the coronavirus outbreak have dropped sharply since May 2020. The latest KFF Health Tracking Poll finds President Trump’s overall net approval on these two key issues has dropped nearly 20 percentage points over the course of the summer (economy: 19 percentage point drop in net approval; coronavirus: 18 percentage point drop in net approval).

Figure 2: President Trump’s Job Approval Drops Across Key 2020 Issues

Voters’ opinions of President Trump’s handling of the issues probed in the poll are largely partisan, with Republicans giving him much higher marks across all of the issues asked about. Majorities of Republican voters approve of President Trump’s handling of his job as president (84%), the economy (87%), health care (78%) and the coronavirus outbreak in the U.S. (74%), yet his net approval on each of these issues is down by double digits among Republicans since May.

Table 1: Across Issues, Trump Net Approval Has Dropped From May to July 2020 Among Partisans
Do you approve or disapprove of the way President Trump is handling…Democratic votersIndependent votersRepublican voters
May 2020July 2020May 2020July 2020May 2020July 2020
…his job as presidentApprove9%5%45%43%90%84%
Disapprove90935455915
Net Approval-81-88-9-128169
Difference in net Approval7 percentage point drop3 percentage point drop12 percentage point drop
…the economyApprove231457479387
Disapprove74844149610
Net Approval-51-7016-28777
Difference in net Approval19 percentage point drop18 percentage point drop10 percentage point drop
…health careApprove9741338878
Disapprove89895358916
Net Approval-80-82-12-257962
Difference in net Approval2 percentage point drop13 percentage point drop17 percentage point drop
…the coronavirus outbreak in the U.S.Approve12544368874
Disapprove889254611123
Net Approval-76-87-10-257751
Difference in net Approval11 percentage point drop15 percentage point drop26 percentage point drop
2020 Voters to Watch: Swing Voters

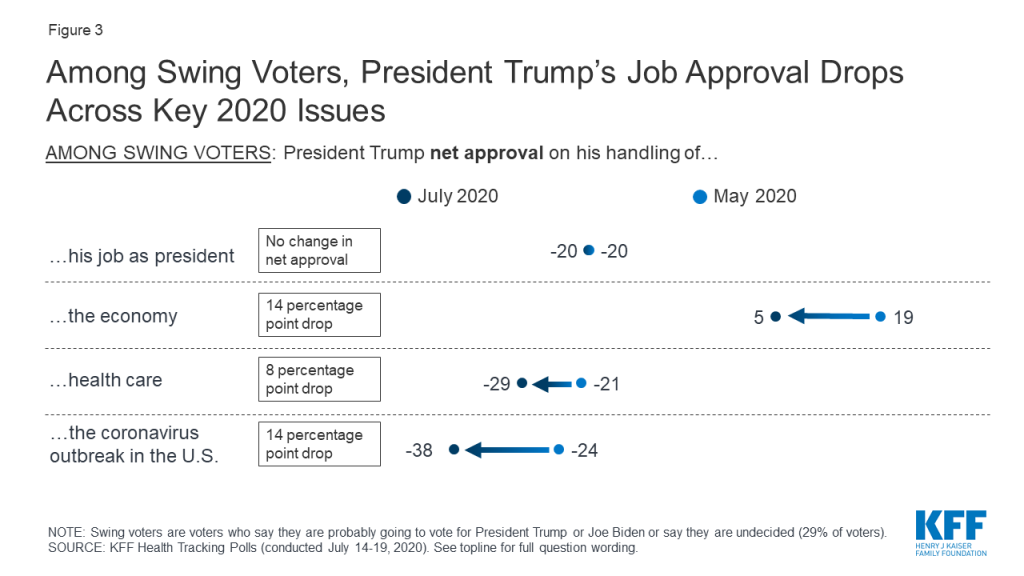
Swing voters, a crucial group of voters who have not yet decided which candidate they will vote for in November, are also negative in their assessments of President Trump’s presidency and his handling of most national issues – but remain positive in their assessment of his handling of the economy. Swing voters (who comprise 29% of all voters) largely disapprove (57%) of the way President Trump is handling his job overall and are also negative in Trump’s handling of both the coronavirus outbreak (66% disapprove) and health care (58% disapprove).

Defining Swing Voters

When asked about their intentions for the upcoming election, voters say they are either “definitely going to vote for President Trump” (30%), or “definitely going to vote for Joe Biden” (36%), while about three in ten voters either say they are undecided in their 2020 vote choice (8%), don’t know yet who they will vote for (2%), or are probably going to vote for President Trump (8%) or Democratic nominee Joe Biden (11%) but have not made up their minds yet.

Swing voters are more positive in views of how President Trump is handling the economy, but at a smaller margin than their assessments in May, with a net approval of +5 percentage points compared to +19 percentage point net approval in May. Swing voters’ assessments of Trump’s handling of health care and the coronavirus outbreak have also become more negative, with the assessments of the president’s handling of health care down 8 net percentage points, and the current coronavirus outbreak down 14 net percentage points.

Figure 3: Among Swing Voters, President Trump’s Job Approval Drops Across Key 2020 Issues
2020 Voters to Watch: Electoral College Battleground Voters

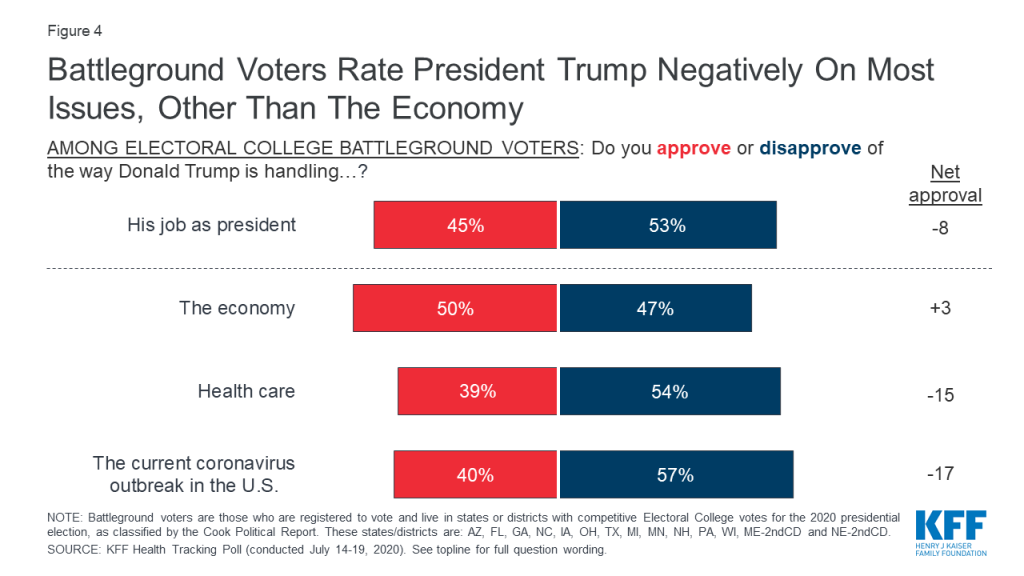
Another important group of voters to watch in 2020 are voters living in states where the election outcome is less predictable. The attitudes of these Electoral College battleground voters will be important in the upcoming election, as their states and districts are likely to swing the Electoral College towards President Trump or Joe Biden.3  This group of voters, representing 38% of all voters, are evenly split in their party preferences, with three in ten saying they are Democrats, Republicans and Independents (31%, 30% and 31% respectively).

Figure 4: Battleground Voters Rate President Trump Negatively On Most Issues, Other Than The Economy

President Trump fares slightly better with these battleground voters on all key issues. Half of these voters approve of President Trump’s handling of the economy and 45% say they approve of his handling of his job as president. But similar to the views of all voters and swing voters, President Trump fares slightly worse on his handling of health care and the coronavirus outbreak in the U.S.. Partisan voters in these battleground states and districts fall largely along the same party lines in their evaluations of President Trump, as partisan voters overall.

The Affordable Care Act

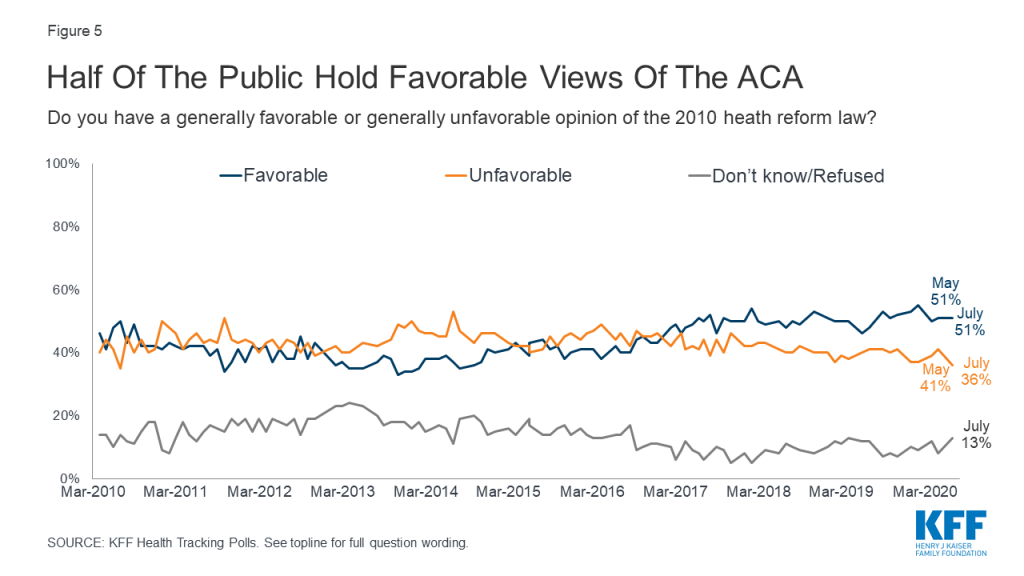
The public’s attitudes towards the 2010 Affordable Care Act (ACA) have remained relatively unchanged over the past 5 months, with half (51%) now saying they hold a favorable opinion of the law, while 36% hold an unfavorable view.

Figure 5: Half Of The Public Hold Favorable Views Of The ACA

Partisans continue to hold different views of the ACA, with about eight in ten Democrats (79%) holding favorable views while seven in ten Republicans (72%) view the law unfavorably. Half of independents hold favorable views (51%) while a smaller share (35%) say they view the law unfavorably.

On June 25th, 2020, the Trump administration issued a brief asking the U.S. Supreme Court to overturn the entire Affordable Care Act. The brief was filed in support of an ongoing challenge to the ACA by a group of Republican attorneys general in California v. Texas, a case that challenges the legality of the ACA in light of the zeroing out of the individual mandate penalty in the 2017 Tax Cuts and Job Acts. While there is a possibility that the case may be heard in the days leading up to the 2020 election, no opinion is expected to be issued until 2021.

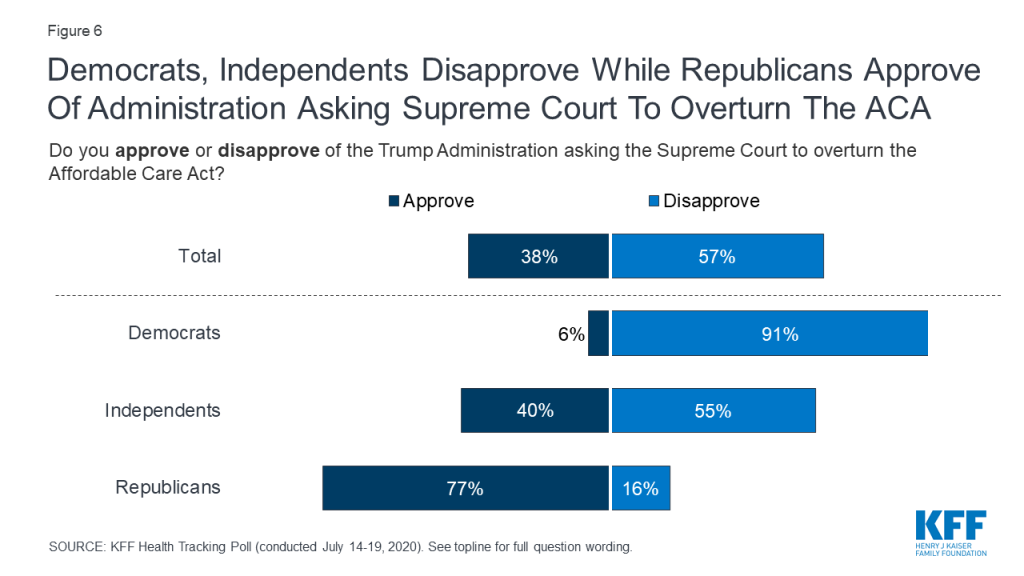
Republicans largely approve (77%) of the Trump administration’s actions, while the vast majority of Democrats (91%) as well as more than half of independents (55%) disapprove of the Trump administration asking the Supreme Court to overturn the ACA.

Figure 6: Democrats, Independents Disapprove While Republicans Approve Of Administration Asking Supreme Court To Overturn The ACA

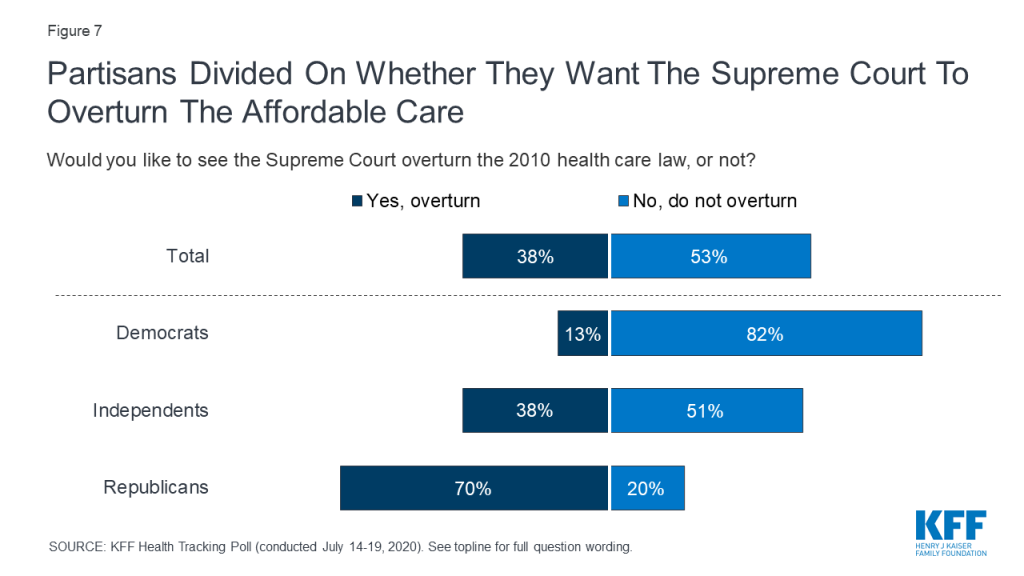
If the Supreme Court sides with the Trump administration and the coalition of Republican attorneys general, all or parts of the 2010 Affordable Care Act would no longer be the law of the land. About half (53%) of the public do not want to see the ACA overturned by the Supreme Court while four in ten (38%) say they want to see the law overturned. Once again, attitudes are largely partisan with eight in ten Democrats (82%) and half of independents (51%) not wanting the law overturned, while seven in ten Republicans say the Supreme Court should overturn the 2010 health care law. Previous KFF polling has found that majorities across partisans want many of the ACA’s protections to remain in place.

Figure 7: Partisans Divided On Whether They Want The Supreme Court To Overturn The Affordable Care

Methodology

This KFF Health Tracking Poll was designed and analyzed by public opinion researchers at the Kaiser Family Foundation (KFF). The survey was conducted July 14-19, 2020, among a nationally representative random digit dial telephone sample of 1,313 adults ages 18 and older, living in the United States, including Alaska and Hawaii (note: persons without a telephone could not be included in the random selection process). The sample included 292 respondents reached by calling back respondents that had previously completed an interview on the KFF Tracking poll at least nine months ago. Computer-assisted telephone interviews conducted by landline (323) and cell phone (990, including 714 who had no landline telephone) were carried out in English and Spanish by SSRS of Glen Mills, PA. To efficiently obtain a sample of lower-income and non-White respondents, the sample also included an oversample of prepaid (pay-as-you-go) telephone numbers (25% of the cell phone sample consisted of prepaid numbers) as well as a subsample of respondents who are parents of children ages 5 to 17 who had previously completed interviews on the SSRS Omnibus and Sports polls (n=101). Both the random digit dial landline and cell phone samples were provided by Marketing Systems Group (MSG). For the landline sample, respondents were selected by asking for the youngest adult male or female currently at home based on a random rotation. If no one of that gender was available, interviewers asked to speak with the youngest adult of the opposite gender. For the cell phone sample, interviews were conducted with the adult who answered the phone. KFF paid for all costs associated with the survey.

The combined landline and cell phone sample was weighted to balance the sample demographics to match estimates for the national population using data from the Census Bureau’s 2018 American Community Survey (ACS) on sex, age, education, race, Hispanic origin, and region along with data from the 2010 Census on population density. The sample was also weighted to match current patterns of telephone use using data from the January-June 2019 National Health Interview Survey. The weight takes into account the fact that respondents with both a landline and cell phone have a higher probability of selection in the combined sample and also adjusts for the household size for the landline sample, and design modifications, namely, the oversampling of prepaid cell phones and likelihood of non-response for the re-contacted sample. All statistical tests of significance account for the effect of weighting. The sample of parents with school-age children was weighted by: gender, age, educational attainment, race/ethnicity, and Census region.

The margin of sampling error including the design effect for the full sample is plus or minus 3 percentage points. Numbers of respondents and margins of sampling error for key subgroups are shown in the table below. For results based on other subgroups, the margin of sampling error may be higher. Sample sizes and margins of sampling error for other subgroups are available by request. Note that sampling error is only one of many potential sources of error in this or any other public opinion poll. Kaiser Family Foundation public opinion and survey research is a charter member of the Transparency Initiative of the American Association for Public Opinion Research.

GroupN (unweighted)M.O.S.E.
Total1,313± 3 percentage points
Party Identification
Democrats398± 6 percentage points
Republicans330± 6 percentage points
Independents450± 6 percentage points
Parent
Parent of child(ren) under 18377± 6 percentage points
Parent of child(ren) with a child who normally attends school308± 7 percentage points
Parent/Race
White Parents230± 8 percentage points
Parents of color136± 11 percentage points
Voters
Registered Voters1,117± 4 percentage points
Democratic Voters353± 6 percentage points
Independent Voters380± 6 percentage points
Republican Voters304± 7 percentage points
Swing Voters285± 7 percentage points
Battleground Voters419± 6 percentage points

Cross-tabs

Endnotes

  1. Due to sample size limitations, we analyzed parents who are Black, Hispanic, Asian, other races, or mixed race as a group (referred to as “parents of color”) compared to their White counterparts. We recognize these groups all have unique experiences; however, the sample size of the poll does not provide sufficient numbers of parents in each of these individual racial/ethnic groups to break out separately. ↩︎
  2. States were categorized as coronavirus hotspots based on data available from KFF’s COVID-19 Metrics By States on July 20th, 2020 and qualified as a hotspot if cases had increased by 5% of more in the past 14 days and the positivity rate (14-day rolling average) was 10% or greater or if the positivity rate had increased by more than 1 percentage point in the past 14 days. ↩︎
  3. Using the Cook Political Report’s 2020 Electoral College Ratings, the category of voters living in states and districts classified as “Toss-up”, “Lean Democrat”, and “Lean Republican” are analyzed as Electoral College voters. Voters in this category live in Michigan, Minnesota, Nebraska 2nd CD, New Hampshire, Pennsylvania, Wisconsin, Arizona, Florida, Georgia, Maine 2nd CD, North Carolina, Iowa, Ohio and Texas, constituting 195 volatile electoral votes.   ↩︎

This Week in Coronavirus: July 17 to July 23

Published: Jul 24, 2020

At almost 27 weeks since the first coronavirus case appeared in the United States, we have reached 4 million cumulative cases — only 15 days after crossing 3 million. While cases are climbing at increasing rates and the economy continues to suffer, the debate around the safety and feasibility of reopening schools for in-person instruction continued this week, as state and local officials released their decisions around in-person or online learning and the Centers for Disease Control and Prevention released its own guidance on reopening schools.

Amidst these developments, we released our latest poll, which found that parents overwhelmingly prefer that schools wait to restart in-person classes to reduce infection risk (60%) rather than open sooner so parents can work and students can return to the classroom (34%). Parents of color (76%) are even more likely than white parents (51%) to prefer that schools wait to return to in-person classes.

Increasing federal funding to state and local governments to help schools reopen safely was among the public’s top priorities for Congress, with 55% saying it should be a top priority.

But as Congress finalizes negotiations around the next coronavirus stimulus package, 72% of the public say increasing federal funding to limit the spread of coronavirus — including testing, contract tracing and personal protective equipment (PPE) — should be a top priority for Congress. It’s the highest-ranked priority in the poll, and the only one seen as a top priority by a majority of Democrats, Republicans, and independents.

The media and President Trump in his latest coronavirus briefings largely focused on the share of cases attributed to a younger population in the most recent resurgences in hotspot states, but our analysis highlights how continued community transmission has implications beyond increased cases. As of July 23, we identified 36 states that are now coronavirus hotspots — based on cases and positivity rates increasing, or meeting specific thresholds. That means approximately 73.5% of the U.S. population is now living in a hotspot.

Long-term care (LTC) facility deaths in these hotspot states as of July 23 have risen at six times the rate as LTC deaths in non-hotspot states. Long-term care cases in Texas and Florida have increased by approximately 50% in two weeks. Adults 65 and older account for 16% of the US population but 80% of COVID-19 deaths in the US. Nearly half of all COVID-19 deaths have been in long-term care facilities.

Here are the latest coronavirus stats from KFF’s tracking resources:

Global Cases and Deaths: Total cases worldwide reached 15.5 million between July 16 and July 23 – with an increase of approximately 1.7 million new confirmed cases. There were also approximately 43,600 new confirmed deaths worldwide between July 16 and July 23, bringing the total to 633,394 confirmed deaths.

U.S. Cases and Deaths: Total confirmed cases in the U.S. passed 4 million this week. There was an approximate increase of 463,000 confirmed cases between July 16 and July 23. Approximately 5,900 confirmed deaths in the past week brought the total to over 144,000 confirmed deaths in the U.S.

U.S. Tests: There have been over 48 million total COVID-19 tests with results in the U.S. In the past 7 days, 1.7% of the total U.S. population was tested.

Race/Ethnicity Data: As of this week, Black individuals made up a higher share of cases/deaths compared to their share of the population in 30 of 49 states reporting cases and 34 of 44 states reporting deaths. In 7 states (MI, TN, MO, IL, WI, KS, and NH), the share of COVID-19 related deaths among Black people was at least two times higher than their share of the total population.

Hispanic individuals made up a higher share of cases compared to their share of the total population in 35 of 45 states reporting cases and 10 of 44 states reporting deaths. In 8 states  (NE, VA, WI, AR, IA, MN, TN, and SD), Hispanic peoples’ share of cases was more than 3 times their share of the population. COVID-19 continues to have a sharp, disproportionate impact on American Indian/Alaska Native as well as Asian people in some states.

State Reports of Long-Term Care Facility Cases and Deaths Related to COVID-19 (Includes Washington D.C.)

  • Data Reporting Status: 47 states are reporting COVID-19 data in long-term care facilities, 4 states are not reporting
  • Long-term care facilities with known cases: 13,411 (across 44 states)
  • Cases in long-term care facilities: 322,505 (across 43 states) 
  • Deaths in long-term care facilities: 59,506 (in 42 states)
  • Long-term care facility cases as a share of total state cases: 10% (across 43 states)
  • Long-term care facility deaths as a share of total state deaths: 44% (across 42 states)
  • Texas, South Carolina, Utah, and Florida reported a >20% increase in LTC deaths over the last 14 days. Texas reports the highest increase — a 64% increase in LTC deaths between July 9 and July 23
  • The states that have historically had the highest deaths in LTC facilities overall (NY, NJ, MA, PA, and IL) all saw less than a 3% increase in LTC deaths over 14 days. These states are not classified as hotspots. There is evidence to suggest that LTC deaths are rising in hotspot states (such as in TX, SC, UT, FL) at a faster pace than in non-hotspot states (NY, NJ, MA, PA, and IL).

State Social Distancing Actions (includes Washington D.C.)

  • Status of reopening: Proceeding in 21 states, paused in 8 states, new restrictions in 15 states, reopened in 7 states
  • Stay At Home Order: Original stay at home order in 1 state, stay at home order eased or lifted in 44 states, no action in 6 states
  • Mandatory Quarantine for Travelers: Original traveler quarantine mandate in place in 9 states, new traveler quarantine mandate in place in 3 states, traveler quarantine mandate eased or lifted in 16 states, no action in 23 states
  • Non-Essential Business Closures: Some or all non-essential businesses permitted to reopen (some with reduced capacity) in 43 states, new business closures or limits in 3 states, no action in 5 states
  • Large Gatherings Ban: Original gathering ban/limit in place in 5 states, gathering/ban limit expanded or lifted in 38 states, new gathering/ban limit in place in 7 states, no action in 1 state
  • Restaurant Limits: Restaurants reopened to dine-in service in 45 states, newly closed to dine-in service in 1 state, new capacity limits in 4 states, no action in 1 state
  • Bar Closures: Closed in 9 states, reopened in 30 states, newly closed in 9 states, new service limits in 3 states
  • Face Covering Requirement: Required for general public in 31 states, required for certain employees in 11 states, allows local officials to require them for general public in 4 states, no action in 6 states
  • Primary Election Postponement: Postponement in 15 states, no postponement in 36 states
  • Emergency Declaration: There are emergency declarations in all 51 states.

State COVID-19 Health Policy Actions (Includes Washington D.C.)

  • Waive Cost Sharing for COVID-19 Treatment: 3 states require, state-insurer agreement in 3 states; no action in 45 states
  • Free Cost Vaccine When Available: 9 states require, state-insurer agreement in 1 state, no action in 41 states
  • States Requires Waiver of Prior Authorization Requirements: For COVID-19 testing only in 5 states, for COVID-19 testing and treatment in 6 states, no action in 40 states
  • Early Prescription Refills: State requires in 16 states, expired requirements in 2 states, no action in 33 states
  • Premium Payment Grace Period: Grace period extended for all policies in 2 states, grace period extended for COVID-19 diagnosis/impacts only in 4 states, expired in 10 states, no action in 35 states
  • Marketplace Special Enrollment Period: Marketplace special enrollment period still active in 5 states, ended in 7 states, no special enrollment period in 39 states
  • Paid Sick Leave: 13 states enacted, 2 proposed, no action in 36 states

State Actions on Telehealth (Includes Washington D.C.)38 states overall have taken mandatory action expanding access to telehealth services through private insurers, including:

  • New Requirements for Coverage of Telehealth Services: Parity with in-person services in 6 states, broad coverage of telehealth services in 6 states, limited coverage of telehealth services in 6 states, no action in 33 states
  • Waiving or Limiting Cost-Sharing for Telehealth Services: Waived for COVID-19 services only in 7 states, waived or limited for all services in 8 states, expired in 1 state, no action in 35 states
  • Reimbursement Parity for Telehealth and In-Person Services: Required for all services in 17 states, no action in 34 states
  • Require Expanded Options for Delivery of Telehealth Services: Yes in 35 states, for behavioral health services only in 1 state, no action in 14 states

Approved Medicaid State Actions to Address COVID-19 (Includes Washington D.C.)

  • Approved Section 1115 Waivers to Address COVID-19: 5 states (HI, NC, NH, WA) have approved waivers
  • Approved Section 1135 Waivers: All states have approved waivers
  • Approved 1915 (c) Appendix K Waivers: 50 states have approved waivers except Idaho
  • Approved State Plan Amendments (SPAs): 47 states have temporary changes approved under Medicaid or CHIP disaster relief SPAs, 1 state has an approved traditional SPA
  • Other State-Reported Medicaid Administrative Actions: All states report taking other administrative actions in their Medicaid programs to address COVID-19

The latest KFF COVID-19 resources:

The latest KHN COVID-19 stories:

  • As Long Waits for Results Render COVID Tests ‘Useless,’ States Seek Workarounds (KHN, Daily Beast)
  • Employers Require COVID Liability Waivers as Conflict Mounts Over Workplace Safety (CHL, Fortune)
  • KHN’s ‘What The Health?’: Trump Twists on Virus Response (KHN)
  • Lost on the Frontline (KHN, The Guardian)
  • COVID Runs Amok in 3 Detroit-Area Jails, Killing At Least 2 Doctors (KHN, The Guardian)
  • With DACA Ruling, Did Supreme Court Grant Trump New Powers To Reshape Health Care? (KHN, PolitiFact)
  • Adjunct Professors: Jobs Are Low on Pay and Health Benefits With High COVID Risk (KHN, US News)
  • Technology Divide Between Senior ‘Haves’ and ‘Have-Nots’ Roils Pandemic Response (KHN, CNN)
  • Essential and in Danger: Coronavirus Sickens, Even Kills Public Health Workers (KHNAP)
  • For COVID Tests, the Question of Who Pays Comes Down to Interpretation (KHNNBC News)
  • Medicaid Mystery: Millions of Enrollees Haven’t Materialized (CHLLos Angeles Times)
  • Administration Eases Rules to Give Laid-Off Workers More Time to Sign Up for COBRA (KHNNPR)
  • NIH Project Homes In on COVID Racial Disparities (KHN)
  • Scientists Want to Know More About Using UV Light to Fight COVID-19 Spread (KHNNPR)
  • Pandemic-Inspired Food Labeling Raises Alarms for Those With Food Allergies (KHNWashington Post)
  • Bingeing on Doom: Expert on the ‘Black Death’ Attracts Cult Following (KHNLos Angeles Times)
  • Behind The Byline: ‘Reporting From a Distance’ (KHN)
  • Watch: COVID Patients and Families Battle to Get Benefits (KHN)
News Release

8 in 10 People Who Have Died of COVID-19 Were Age 65 or Older – But the Share Varies By State  

Published: Jul 24, 2020

A new KFF analysis finds that 80 percent of people who have died of COVID-19 in the U.S. to date were age 65 or older, though the share varies considerably by state — from a high of 94 percent in Idaho to a low of 70 percent in the District of Columbia.

The analysis of data from the Centers for Disease Control and Prevention provides clear evidence of the toll that the novel coronavirus has taken on older Americans. It also provides a more detailed picture of where the impact on seniors has been the greatest.

The analysis finds that states that have seen the largest share of COVID-19 deaths among people 65 and older include those that have had a disproportionate number of deaths in long-term care facilities. These states include Idaho (with 94% of deaths among those 65 and older), New Hampshire (92%), Massachusetts (90%), Rhode Island (90%), Minnesota (89%), Connecticut (89%), Pennsylvania (87%), Ohio (86%), Kentucky (84%), and Delaware (83%).

States in which deaths among those 65 and older account for a somewhat lower share of all COVID-19 deaths compared to the national average are in the South and Sun Belt. Many of these states are hotspots where the virus has surged more recently and where deaths among older adults may be lagging, including Alabama (where 76% of COVID-19 deaths are among those 65 and older), Tennessee (76%), Nevada (75%), Arizona (74%), Mississippi (74%), Arkansas (71%), New Mexico (71%), and Texas (70%).

For more data and analyses regarding older Americans and the novel coronavirus pandemic, visit kff.org.

What Share of People Who Have Died of COVID-19 Are 65 and Older – and How Does It Vary By State?

Published: Jul 24, 2020

Since the early days of the pandemic, COVID-19 has taken its greatest toll among older adults in the US in terms of cases, hospitalizations and deaths. Months into the pandemic, older adults continue to be one of the populations most at risk of becoming seriously ill and dying from COVID-19. Adults 65 and older account for 16% of the US population but 80% of COVID-19 deaths in the US, somewhat higher than their share of deaths from all causes (75%) over the same period. Around the country, however, states have put in place a variety of policies regarding COVID-19, and on different timetables, which have contributed to different case trajectories and could result in variations across states in the proportion of COVID-19 deaths among older people. Other factors that may contribute to these differences include the prevalence of underlying medical conditions and racial composition of each state’s population.

To examine the extent of state-level variation in the share of COVID-19 deaths accounted for by older adults, we analyze the distribution of COVID-19 deaths by age group at the state level, based on data from the Centers for Disease Control and Prevention (CDC) as of July 22, 2020, for the week ending July 11. The data are provisional and reflect a time lag due to differences in how states report data.

Of the 41 states and District of Columbia included in this analysis, the share of people 65 and older who have died of COVID-19 varies considerably by state (Figure 1).

.The percent of COVID-19 deaths accounted for by people 65 and older is consistently high and ranges from a high of 94% in Idaho to a low of 70% in the District of Columbia.

In most states, the share of adults 65 and older who have died due to COVID-19 is higher than their share of deaths from all causes (Figure 2).

.For example, in Idaho, a substantially higher share of people who have died of COVID-19 were 65 and older (94%) compared to deaths from all causes (76%). Similarly, in West Virginia, the share of people 65 and older who have died of COVID-19 was much higher than for all causes (90% vs 73%). This was true for almost all states included in the analysis except for Arizona, Arkansas, Kansas, New Mexico, New York and Texas, where the share of COVID-19 deaths and deaths from all causes were the same, and Nebraska where the share of COVID-19 deaths was lower than for all causes.

States that have reported a larger share of adults 65 and older who have died of COVID-19 tend to be those states that have had a disproportionate number of deaths in long-term care facilities. These include Idaho, with 94% of COVID-19 deaths among those 65 and older, as well as New Hampshire (92%), Massachusetts (90%), Rhode Island (90%), Minnesota (89%), Connecticut (89%), Pennsylvania (87%), Ohio (86%), Kentucky (84%), and Delaware (83%).

Many of the states that have reported a smaller share of adults 65 and older who have died of COVID-19 compared to the national average are in the South and the Sun Belt, including Alabama (76%), Tennessee (76%), Nevada (75%), Arizona (74%), Mississippi (74%), Arkansas (71%), New Mexico (71%), and Texas (70%). With the exception of Texas, these states have a population age distribution similar to the US average, which suggests that this finding is not a function of having a younger population. In these states, the pandemic is peaking later than in states that were hit earlier, which may contribute to a lag in deaths among older adults.

States that have experienced a large percentage of deaths at long-term care facilities are also more likely to have a larger share of COVID-19 deaths in the oldest age cohort, those 85 and older (Figure 3).

.In the US overall, 33% of people who have died from COVID-19 were age 85 and older, compared to 31% of people who died from all causes over the same period who were 85 and older. In states with a relatively large share of deaths in long-term care facilities, the percentage is higher, e.g., 48% in New Hampshire and Massachusetts, 46% in Rhode Island, 45% in Minnesota and Connecticut, 43% in Pennsylvania, 39% in Idaho, 37% in Kentucky, Delaware, and Ohio.

The number of adults 65 and older who have died of COVID-19 is considerably higher in some states than others, with 61% of all adults 65 and older who died of COVID-19 as of July 15, residing in just 7 states: New York, New Jersey, Massachusetts, Pennsylvania, Illinois, California, and Michigan (Figure 4).1 

.By comparison, only 36% of deaths among people 65 and older from all causes were among older adults residing in those 7 states.

The majority of people who have died of COVID-19 are 65 and older nationwide; however, there is a fair amount of variation across states. These differences may reflect a number of factors, including underlying demographic characteristics, other state-specific factors, and the timing of outbreaks. In states that were affected earlier, older adults tend to account for a higher share of deaths. This may be attributable to the relatively large number of deaths in long-term care facilities. States that have experienced more recent outbreaks have a somewhat smaller share of deaths accounted for by people 65 and older, but as the pandemic progresses, the share of deaths among older people in these states may rise, especially in states that are now experiencing a sharp rise in coronavirus cases in long-term care facilities.

Methods

This analysis uses data from the Centers for Disease Control and Prevention, “Provisional COVID-19 Death Counts by Sex, Age, and State,” as of July 22, 2020, for the week ending July 11, 2020 https://data.cdc.gov/NCHS/Provisional-COVID-19-Death-Counts-by-Sex-Age-and-S/9bhg-hcku. The CDC uses incoming data from death certificates to produce provisional COVID-19 death counts. The number of deaths reported in this dataset are the total number of deaths received and coded as of the date of analysis, and do not represent all deaths that occurred in that period. Data during this period are incomplete because of the lag in time between when the death occurred and when the death certificate is completed, submitted to the National Center for Health Statistics (NCHS) and processed for reporting purposes. This delay can range from 1 week to 8 weeks or more. Death counts that are fewer than 10 by age group were suppressed in accordance with NCHS confidentiality standards. We excluded 9 states from this analysis where there was a discrepancy of more than 10% between the total number of COVID-19 deaths by age group and the total number of deaths overall within the state (Alaska, Hawaii, Maine, Montana, North Dakota, South Dakota, Utah, Vermont, and Wyoming). This discrepancy is likely due to the suppression of data within age cohorts that falls below the NCHS reporting standard.

  1. The Centers of Disease Control and Prevention dataset used in this analysis produces slightly different counts of deaths for July 11 than other sources producing these estimates, such as the Johns Hopkins University Coronavirus Resource Center or the COVID Tracking project. ↩︎
News Release

Updated Dashboard Features New Data on U.S. Health System Performance

Published: Jul 23, 2020

Newly updated and expanded, the Peterson-KFF Health System Dashboard compiles data on the U.S. health system’s performance in four areas: access and affordability, health and well-being, health spending, and quality of care. Users can explore trends over time, as well as disparities and differences across demographic groups. The dashboard also includes indicators comparing health outcomes and spending in the U.S. to that of similarly large and wealthy countries.

A new companion brief situates the data in broader trends in the U.S. health system and considers how the COVID-19 pandemic may impact measures of performance and quality. Among its key findings:

  • As of 2017, rates of disease burden, a measure that accounts for both longevity and quality of life, are higher in the U.S. than in comparable countries. The high rate of disease burden in the U.S. can be attributed in part to conditions believed to be risk factors for developing serious illness from COVID-19, including chronic respiratory diseases, heart disease, and diabetes.
  • From 2011 to 2018, the share of adults reporting problems paying medical bills dropped by more than a quarter. The potentially high cost of treating COVID-19 and shifts in the use of health care services during the pandemic could affect affordability of care.
  • Racial disparities in health outcomes persist. In 2017, life expectancy among White people in the U.S. was 78.5 years, but among Black people, it was 74.9. The pandemic has exacerbated inequalities underlying this Black-White life expectancy gap and other disparities, and it has thus disproportionately affected communities of color.

The Health System Dashboard is available on the Peterson-KFF Health System Tracker, a partnership between the Peterson Center on Healthcare and KFF that monitors the U.S. health system’s performance on key quality and cost measures.

News Release

By Nearly a 2-1 Margin, Parents Prefer to Wait to Open Schools to Minimize COVID Risk, with Parents of Color Especially Worried Either Way

Majorities Across Parties Want Congress to Prioritize Funding for COVID Testing, Tracing, and PPE

Published: Jul 23, 2020

Most Say Things Will Get Worse Before They Get Better, and Just Over Half Now Say Their Mental Health is Worse Because of Coronavirus Worry and Stress

As state and local officials prepare for the new school year amid the COVID-19 pandemic, parents with children who normally attend school overwhelmingly prefer that schools wait to restart in-person classes to reduce infection risk (60%) rather than open sooner so parents can work and students can return to the classroom (34%), the latest KFF tracking poll finds. Parents of color (76%) are even more likely than white parents (51%) to prefer that schools wait to return to in-person classes.

With President Trump calling for schools to reopen and threatening to withhold federal funds from schools that don’t do so, there is a big partisan divide – with 87% of Democrats and 59% of independents preferring schools open later while 60% of Republicans prefer that schools open sooner.

The cautious approach to reopening schools may reflect a lack of confidence that schools have the resources to do so safely. Large majorities of the public (71%) say the public schools in their area need more resources to comply with public health recommendations around reopening, and 66% of parents say the same thing about their own child’s school.

“It’s a no-win choice for parents, but most are erring on the side of protecting kids, teachers and families by delaying school reopening and keeping kids home,” KFF President and CEO Drew Altman said.

The poll also shows how parents are pulled in both directions at once on the issue of school reopening.

Most parents with a child who normally attends school are worried about teachers and staff getting sick from coronavirus (79%) and children being unable or unwilling to comply with physical distancing practices (73%). But, nearly as many are worried about their child (70%) or themselves or a family member (69%) getting sick from coronavirus and that their child’s school will be unable to comply with public health recommendations (66%).

However, if schools don’t reopen, about two thirds say they worry about their children falling behind socially and emotionally (67%) and academically (65%). About half say they worry about losing income because they can’t go to work (51%) and not being able to pay enough attention to their kids while working at home (47%). Smaller shares worry about not getting needed social services (40%), and not having access to technology needed for online learning (31%), and their child not having enough food to eat (24%).

Parents of Color More Likely Than White Parents to Worry about the Pandemic’s Effects

Reflecting the disproportionate impact that the pandemic has had on communities of color, the poll finds parents of color are more likely to be worried about each of these concerns than white parents.

For example, about 9 in 10 parents of color are worried that their child (91%) or they or someone else in their family (90%) will get sick with coronavirus if schools reopen. Far fewer white parents say they are worried about their child (55%) or someone in their family (53%) getting sick.

If schools stay closed, parents of color are far more likely than white parents to say they are worried about losing income (65% vs. 41%) and their child not getting needed social services (52% vs. 32%). Many parents of color also are worried about not having the technology for online learning (49%) and their child not having enough to eat at home (44%). Few white parents worry about either situation (17% and 9%, respectively).

Majorities across Parties Want Congress to Prioritize Funding for COVID Testing, Tracing, and PPE

As Congress works on its next coronavirus relief package, news reports suggest the Trump administration is resisting allocating additional federal funds for testing, contract tracing and other preventive service – a position at odds with public opinion.

The poll finds that 72% of the public say increasing federal funding to limit the spread of coronavirus, including testing, contract tracing and personal protective equipment (PPE), should be a top priority for Congress, making it the highest-ranked priority in the poll, and the only one seen as a top priority by a majority of Democrats, Republicans, and independents.

Other high-ranking priorities for Congress include increasing federal funding to state and local governments to help schools reopen (55% say it should be a top priority), increasing government assistance to help Americans who do not get health insurance from their jobs pay for coverage (52%), and providing financial assistance for people who lost their jobs to purchase COBRA insurance through their former employers (49%).

Somewhat fewer cite a second round of stimulus checks to individuals (43%) and extending the increased unemployment benefit of $600 per week (39%) as top priorities for Congress.

Democrats are more likely than Republicans to cite each of the nine actions as top priorities for Congress, while independents tend to fall in between.

Most Americans are Pessimistic about COVID Pandemic and Say Their Mental Health is Suffering 

With cases and deaths rising across much of the country, the public is increasingly pessimistic about the pandemic. Most (60%) now say “the worst is yet to come,” three times the share (20%) who say “the worst is behind us.” The share saying the worst is yet to come is up 10 percentage points since May.

For the first time, most Americans (53%) now say that stress and worry related to the pandemic has had a negative impact on their mental health – an increase of 14 percentage points since May. This includes about one in four who say it has had a “major” negative impact.

Those most likely to report negative mental health effects include women, young adults, Blacks and people with difficulties affording household expenses due to coronavirus.

About half (52%) of the public also report experiencing at least one of six specific issues due to worry and stress related to the pandemic: sleep difficulties (36%), poor appetite or overeating (32%), difficulty controlling their temper (18%), frequent headaches or stomachaches (18%), increased alcohol or drug use (12%), and worsening chronic conditions like diabetes or high blood pressure (12%).

Other findings include:

  • About half (48%) of the public rate the federal government response to the pandemic as “poor” while another 23% rate it “fair.” Smaller shares rate the federal response positively as “good” (20%) or excellent (7%). About half the public gives their state (46%) and local (48%) governments positive marks.
  • With the country facing a double-digit unemployment rate, 40% of adults say someone in their household has had problems paying bills or affording medical care or basic expenses in the past three months, including 22% who say this was a direct result of coronavirus and its impact on their financial situation.

Designed and analyzed by public opinion researchers at KFF, the poll was conducted July 14-19 among a nationally representative random digit dial telephone sample of 1,313 adults including an oversample of parents of school-aged (5-17 year-old) children. Interviews were conducted in English and Spanish by landline (323) and cell phone (990). The margin of sampling error is plus or minus 3 percentage points for the full sample. For results based on subgroups, the margin of sampling error may be higher.