Recent Efforts to Extend Medicaid Postpartum Coverage and What to Watch Looking Ahead

Authors: Meghana Ammula, Ivette Gomez, Jennifer Tolbert, and Usha Ranji
Published: Oct 6, 2021

Medicaid is a key source of coverage for low-income pregnant people in the United States, covering more than four in ten births nationally, but many people who qualify for Medicaid because they are pregnant lose that coverage 60 days postpartum, especially if they live in a state that has not expanded Medicaid. In recent years there has been a growing interest among state and federal policymakers in extending Medicaid postpartum coverage beyond the 60-day mark to help address racial disparities and improve maternal and infant health. Earlier this year, federal legislation was enacted that gives states a temporary option to extend postpartum coverage beyond 60 days, and Congress is currently considering additional legislation to require such extended coverage.

Federal law requires that all states cover pregnant individuals with incomes at least up to 138% of the federal poverty level (FPL), although many states have set higher income eligibility levels, and they must extend coverage for 60-days postpartum. Some people lose that coverage after the postpartum period because they have no eligibility pathway even though they have incomes below the federal poverty level. Following the 60-day postpartum period, in states that have adopted the Affordable Care Act (ACA)’s Medicaid expansion, individuals with incomes below 138% FPL have a continued pathway to Medicaid coverage and those with higher incomes may qualify for subsidized coverage through the ACA marketplace plans; however, individuals in non-expansion states may become uninsured because Medicaid eligibility levels for parents are much lower than for pregnant people. For example, in Alabama, which has not sought a postpartum coverage extension, the Medicaid eligibility level for parents is 18% FPL, which is approximately $4,000/year for a family of three.

The federal American Rescue Plan Act (ARPA) enacted in March 2021 gives states the option to extend postpartum coverage to pregnant individuals to a full year. The coverage option is available for five years starting on April 1, 2022 and states must provide a full scope of benefits without limitations on coverage during the extension. Prior to ARPA’s enactment, states had to seek permission from the Centers for Medicare and Medicaid Services (CMS) by applying for a Section 1115 waiver to extend the postpartum period beyond 60 days, although none of these applications were approved until April 2021. Even though the new option under ARPA will not be effective until April 2022, postpartum coverage has been continuous since the start of the coronavirus pandemic because Medicaid disenrollment has been suspended during the public health emergency.

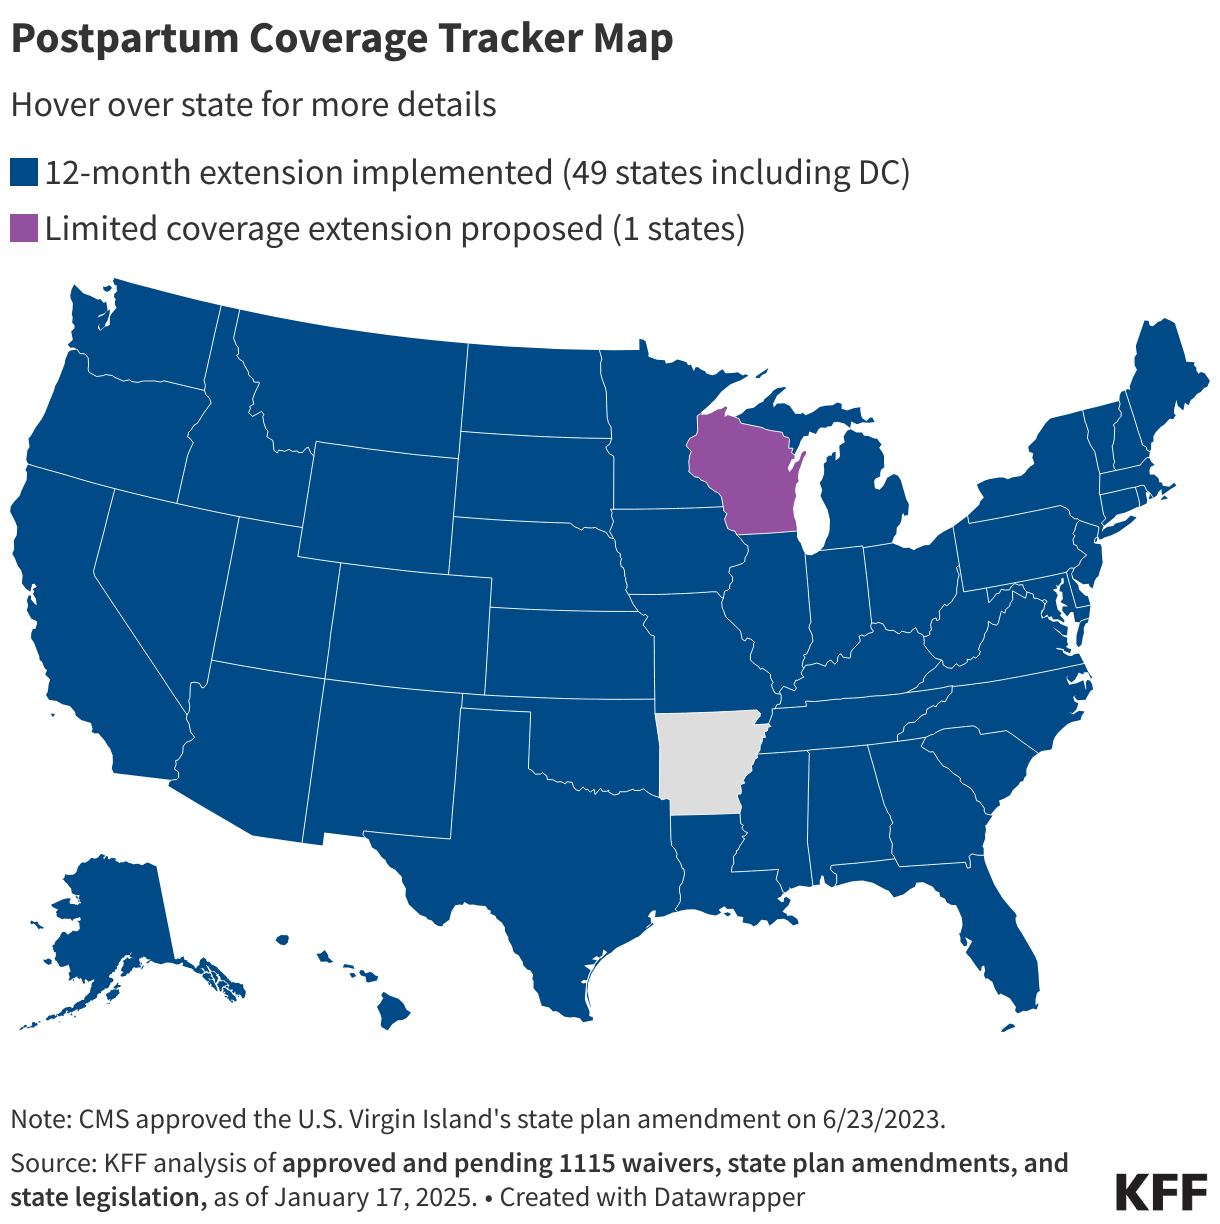
Largely in response to the new federal option, at least 25 states have taken steps to extend Medicaid postpartum coverage. To date, most of these are expansion states, but actions in non-expansion states will ensure continued coverage following the current postpartum period. Prior to the enactment of ARPA, California and Texas had limited state-funded postpartum coverage in place and a few states had submitted waivers to CMS to extend postpartum coverage through Medicaid, although, in some cases, targeted to narrow groups, such as those with a diagnosed substance use disorder, or for less than 12 months. States often seek approval of a demonstration waiver to do something they cannot do under current law. A few states are still seeking waivers to implement prior to April 2022 or to extend postpartum coverage in ways more limited than the new ARPA option.

Recent state actions to extend postpartum coverage for 12 months include:

  • Thirteen states (California, Colorado, Connecticut, DC, Maine, Maryland, Minnesota, New Jersey, Ohio, South Carolina, Tennessee, Washington, and West Virginia) enacted legislation, a first step to implementing a coverage extension;
  • New York and North Carolina are debating proposed legislation;
  • Two states (Indiana and Pennsylvania) announced plans to adopt the new option using existing authority; and
  • Illinois received approval to extend postpartum coverage for 12 months through a waiver (waivers are pending in three states—Florida, Massachusetts, and Virginia).

Although recent federal action has prompted many states to consider extending postpartum coverage, some states still won’t have a pathway for coverage beyond the current 60-day postpartum period, and Congress is currently considering proposals to require such coverage. Uneven adoption of the ARPA option means postpartum individuals in many states remain at risk of losing Medicaid coverage just two months after giving birth. Postpartum people with household incomes below the poverty level in non-expansion states often do not have another coverage option and become uninsured when they lose Medicaid coverage. Currently, Congress is considering a provision in the Build Back Better Act that would require all states to extend Medicaid postpartum coverage from 60 days to 12 months, ensuring continuity of Medicaid coverage for postpartum individuals in all states to more broadly reduce disparities and improve maternal and infant health outcomes. However, there is a push to lower the overall amount of spending in the package, and the extension of postpartum coverage could be forced to compete against other priorities.

To track updated state-by-state activity on Medicaid postpartum coverage, please visit our Medicaid Postpartum Coverage Extension Tracker.

Postpartum Coverage Tracker Map
News Release

Analysis Examines Insurance Coverage, Affordability and Access to Home and Community-Based Services for Children with Special Health Care Needs

Published: Oct 4, 2021

A new KFF analysis examines key characteristics of children with special health care needs, the affordability and adequacy of their health coverage, and the implications for such children of potential new federal Medicaid money to assist families in caring for them.

Medicaid is a significant source of coverage for medical, behavioral health, and long-term services and supports for children with special health care needs, including home and community-based services (HCBS) that they need to live at home with their families. During the pandemic, children have experienced health care disruptions, mental health challenges, and economic hardships, and these issues may have been intensified for those with special health care needs.

The American Rescue Plan Act provides a temporary increase in federal Medicaid matching funds for state spending on HCBS. As part of the budget reconciliation legislation, the House currently is considering $190 billion in additional Medicaid HCBS funding that states could use to support the HCBS provider workforce, offer new or expanded HCBS benefits, and/or serve more HCBS enrollees, though the final funding amount has not yet been set.

The analysis provides context for those ongoing policy discussions. Key findings include:

• Medicaid/CHIP covers almost half of the 13.9 million children in the U.S. with special health care needs, though the share varies by state.

• Children with special health care needs covered by both Medicaid/CHIP and private insurance have the greatest health care needs, and children who are covered only by Medicaid/CHIP are more likely to have greater health needs compared to those with private insurance only.

• While families of Medicaid/CHIP-only children with special health care needs are more likely to face financial difficulty, they find their health care more affordable than those with private insurance only. This is due to Medicaid’s cost-sharing protections.

• Even though children with special health care needs covered by Medicaid/CHIP-only have greater health care needs, they are more likely than those with private insurance alone to report that their benefits are always adequate to meet their needs.

For the full analysis, as well as other data and analyses about health care priorities in the budget reconciliation discussion on Capitol Hill, visit kff.org.


News Release

The Decline in COVID-19 Deaths Among Nursing Home Residents and Staff Reversed Course Amid the Surging Delta Variant This Summer

Published: Oct 1, 2021

The months-long decline in COVID-19 deaths among nursing home residents and staff reversed course this summer as the Delta variant dominated, with mortality increasing five-fold from 350 deaths in July to nearly 1,800 in August, finds a new KFF analysis.

The analysis also finds increases in nursing home COVID-19 cases and deaths were steeper than those in the broader community between July and August.

Nursing home deaths in August were the highest reported since February, when 5,300 nursing home residents and staff died of COVID-19, but still far below the peak of over 22,000 deaths in December 2020. COVID-19 cases in nursing homes also rose more than four-fold between July and August.

The findings illustrate that, while recent news coverage has focused heavily on the impact of the pandemic on children and unvaccinated adults, COVID-19 continues to disproportionately affect older adults and people with disabilities — populations that were hit particularly hard in the first year of the crisis.

The recent endorsement by the Centers for Disease Control and Prevention of booster shots for older adults and others at high risk of serious illness, including those in nursing homes, could help curb new cases and deaths. In addition, the Biden administration has recently announced staff vaccination mandate for nursing homes.

A second KFF analysis released this week similarly finds that COVID-19 deaths among older adults in the U.S. more broadly also have been on the rise amid the Delta variant outbreak, though not reaching the levels seen earlier in the pandemic.

Among 38 states in the new analysis, four of the five with the lowest COVID vaccination rates for older adults – Arkansas, Alabama, Georgia, and Nevada – had higher death rates than the national average, with a combined death rate nearly two times the national average for this age group during the recent surge. Had the death rate in the 10 least vaccinated states been the same as the death rate in the 10 most vaccinated states, there would have been 7,623 fewer deaths among older adults during the Delta surge in these states.

For more data and analyses about COVID-19, visit kff.org.

Nursing Homes Experienced Steeper Increase In COVID-19 Cases and Deaths in August 2021 Than the Rest of the Country

Authors: Priya Chidambaram and Rachel Garfield
Published: Oct 1, 2021

Staff and residents at long-term care facilities were particularly hard-hit by the first year of the pandemic, accounting for 31% of all COVID-19 deaths in the US as of June 30, 2021.  KFF analysis found that, following vaccine rollout in winter 2020-2021, weekly cases and deaths in long-term care facilities (including nursing homes, assisted living facilities, ICF/IIDs, and other settings) dropped, reaching an all-time low in June 2021, just prior to the rapid increase in national cases and deaths due to the Delta variant. As Delta spread across the US in the summer of 2021, much of the focus was on young children at risk during back-to-school; however, with the Delta surge, older Americans, especially those 85 and older, continued to face higher risk of death due to COVID-19 compared to younger Americans, according to the CDC. This data note analyzes federal nursing home data to determine the ongoing impact of the pandemic on COVID-19 cases and deaths among staff and residents. See methods box for more details.

Nursing homes across the US reported nearly 1,800 COVID-19 deaths among residents and staff in August 2021, the highest number of COVID-19 deaths reported in a single month since February 2021 and a steady increase from the approximately 350 deaths reported in July 2021 (Figure 1). This jump in the total number of deaths due to COVID-19 reverses the sustained pattern of decreasing deaths since CMS implemented the Pharmacy Partnership For Long-Term Care, even though the number of nursing home deaths due to COVID-19 in August 2021 was still far below the peak of over 22,000 seen in December 2020 (Table 1).

Figure 1: Nursing Home COVID-19 Deaths in August 2021 Reached the Highest Level Since February 2021

Deaths attributable to COVID-19 increased at a faster rate in nursing homes than among all others in the community between July and August 2021. The number of COVID-19 deaths among staff and residents in nursing homes quadrupled between July and August, while COVID-19 deaths in the community doubled in the same time period (Table 1). During this period, deaths increased at a faster rate among nursing home residents than among nursing home staff (423% versus 274%). While the vast majority of COVID-19 deaths happened outside of nursing homes in July and August, the high rate of increase within nursing homes indicates that residents and staff in these settings are at risk of death during the Delta surge, and not immune from the most recent wave.

Table 1: Monthly Nursing Home and Non-Nursing Home COVID-19 Cases and Deaths

COVID-19 cases also increased more rapidly in nursing homes than in the community. Nursing home cases grew by 440% (from 9,000 to 48,800) between July and August 2021, with a slightly higher increase in resident cases (483%, growing from 3,200 to 19,000) than staff cases (416%, growing from 5,700 to 29,600). Cases outside of nursing homes increased by 224% in the same time period, growing from 1.3 million to 4.2 million (Table 1).  Similar to COVID-19 deaths, the vast majority of COVID-19 cases occurred outside of nursing homes. However, the high rate of increase of nursing home cases shows the connection between community spread and the spread of the virus in nursing homes.

While recent news coverage has focused heavily on the impact of the pandemic on children and unvaccinated adults, the pandemic continues to disproportionately impact older adults and people with disabilities. The CDC recently endorsed an extra dose of the COVID-19 vaccine for a number of additional populations, including residents of long-term care settings, which would make booster shots available to people who live in nursing homes. In addition, the Biden administration has recently announced staff vaccination mandate for nursing homes. As of mid-September 2021, about 84% of all nursing home residents and 64% of all nursing home staff are vaccinated. Vaccines coupled with boosters may reverse the recent trend of rising cases and deaths within nursing homes, though ongoing spread in the community continues to have an impact on residents and staff.

Methods

This analysis uses federal data on coronavirus cases and deaths in nursing homes, which includes weekly data as of mid-May 2020 through August 29th, 2021. Data has been rolled up to the month level, with each month of data representing between 4 and 5 weeks of data. This analysis excludes suspected cases from the definition of nursing home cases among residents and staff. Data on community cases and deaths are calculated based on the number of nationwide cases and deaths from the Johns Hopkins Coronavirus Resource Center minus nursing home cases and deaths; we make this adjustment to account for possible endogeneity (that is, cases or deaths in nursing homes contributing to the patterns in COVID-19 cases and deaths nationwide). The federal data includes only data on federally certified nursing homes. This analysis therefore does not include data on other long-term care settings, such as assisted living facilities, residential care facilities, group homes, or intermediate care facilities.

Previous analysis used state-reported data on long-term care facility cases and deaths, which represented a more comprehensive set of facilities. Due to a drop-off in reporting regularity and lack of consistency in states overtime, this analysis uses federal data to be able to trend cases and deaths in nursing homes since June 2020.

Universal Paid Family and Medical Leave Under Consideration in Congress

Authors: Michelle Long and Usha Ranji
Published: Oct 1, 2021

The House of Representatives is considering a provision of the Build Back Better Act that would create a universal paid family and medical leave program. This post takes a look at this proposal, key policy questions, and what it could mean for women and families.

What is in the proposal?

Effective July 2023, the proposal would guarantee 12 weeks of paid family and medical leave annually to all workers in the U.S., including those working for private employers, state, local, and federal governments, as well as self-employed and gig workers. Workers would be covered through either the new federal program or a qualified existing employer or state paid leave program. The proposal would replace 85% of wages for earnings up to $290 per week ($15,080 annually), plus 75% of average weekly earnings between $290 and $659, plus 55% of average weekly earnings between $659 and $1,385, plus 25% of average weekly earnings between $1,385 and $1,923, plus 5% of average weekly earnings between $1,923 and $4,808 (about $250,000 annually).

Qualifying reasons for leave include:

  • Welcoming a new child by birth, adoption, or foster care.
  • Recovering from a serious illness.
  • Caring for a seriously ill family member (by blood or affinity)
  • Addressing issues arising from a loved one’s military deployment or serious injury.

What family members could workers take leave to care for?

  • Spouses, parents and guardians, and children.
  • Siblings, grandparents, and grandchildren; in-laws; and any other association by blood or affinity that is equivalent to a family relationship.

The proposal also allows for three days of paid bereavement leave following the death of an immediate family member. There is currently no national bereavement leave policy.

What does the status quo look like?

The U.S. is the only industrialized nation without a minimum standard of paid family or medical leave, even though universal paid leave enjoys strong public support, including among Republicans. Nine states and DC have paid leave requirements and some employers voluntarily offer these benefits, resulting in a patchwork of policies with varying degrees of generosity. The federal Family and Medical Leave Act (FMLA) requires some employers to provide unpaid time off as well as job protection to eligible employees for family caregiving and medical leave, but just over half (56%) of the workforce is eligible.

Most people will need to take time off work to care for themselves or their families at some point, but only about one in four (23%) workers have access to paid family leave through their employer. That share is even lower for low-wage and part-time workers, and in certain occupations (Figure 1). Data on the share of workers with access to paid medical leave for a longer, serious illness are limited, although 40% of workers are estimated to have access to short-term disability insurance.

Figure 1: Share of Workers Whose Employer Reports Providing Paid Family Leave, by Worker Characteristics, 2021

How would this proposal intersect with existing state-level and voluntary employer paid leave programs?

The proposed federal bill would allow existing programs to remain so long as they’re at least as comprehensive as the federal program. However, it would apply to a broader range of workers than many employer programs or any of the state-level laws, suggesting that modifications to existing programs could be needed should the federal bill be enacted.

What is the process for Congressional approval?

The Build Back Better Act is being considered through the budget reconciliation process. Passage would require almost all Democrats in the House and all Democrats in the Senate to vote for it.

Some Senators (Republicans and some conservative Democrats) have expressed concern about the overall cost of the budget resolution. While the current version of the entire legislative package is estimated to cost about $3.5 trillion over ten years, it is unclear how the paid leave program, specifically, would be financed and the Congressional Budget Office (CBO) has not scored it. If the price of the current budget resolution gets reduced during Congressional negotiations, the scope of the paid leave provision could be scaled back.

Senate Democrats have not released a recent paid leave proposal but could take up the House bill in its current form or look to elements of other proposals. For example, the paid family and medical leave proposed as part of President Biden’s American Families Plan would cover nearly all workers, would have a $4,000/month cap on wage replacement, and would be financed through general taxes, but it also has not been scored by the CBO. Unlike the House proposal, in Biden’s plan, full benefits would not be realized until year ten of the program. In 2019, the CBO estimated that the Democratic-led FAMILY Act, similar to Biden’s proposal, but partially paid for by a new payroll tax, would cost $547 billion over ten years.

What would universal paid leave mean for women and families?

Paid leave is especially important for women, who are typically the primary caregivers in families, and is associated with improved mental and physical health for new mothers and infants. Research has also found that access to paid family leave helps women remain in the workforce after giving birth.

Additionally, research suggests that under this new proposal, the average American worker taking 12 weeks of paid leave would receive nearly $9,000 of pay.

Enacting universal paid family and medical leave would mean increased federal spending, but would have tangible health and economic benefits for workers and families when they need to take an extended leave for caregiving and medical reasons.

COVID-19 Deaths Among Older Adults During the Delta Surge Were Higher in States with Lower Vaccination Rates

Published: Oct 1, 2021

Older adults continue to be one of the populations hardest hit by the coronavirus pandemic. Since the start of the pandemic, people 65 and older have been at greatest risk of hospitalization and death due to COVID-19 compared to other age groups, and represent nearly 80% of all COVID-19 deaths as of September 29, 2021, similar to the rate observed in a July 2020 KFF analysis. At the same time, older adults, among the first groups prioritized to receive the COVID-19 vaccine, have the highest vaccination rate among all age groups, with 83.3% of the 65 and older population fully vaccinated as of September 29, 2021. Vaccination rates for adults 65 and older range from 71.3% in West Virginia to 95.3% in Vermont.

Although cases, hospitalizations and deaths among older adults declined after widespread vaccination efforts began, deaths due to COVID-19 for older adults have recently been on the rise in the U.S. amid the Delta variant outbreak, though not reaching the numbers seen in earlier stages of the pandemic. Recent CDC data show that vaccines remain effective at preventing hospitalizations and deaths. We examined the relationship between vaccination rates as of September 29, 2021 and death rates among adults ages 65 and older during the Delta surge (covering July 1, 2021 through September 25, 2021), by state, based on CDC data for 38 states. This analysis does not include all states due to CDC’s data suppression conventions. (See Methods for additional information.)

Our analysis shows a significant negative correlation between vaccination rates and death rates among older adults during the Delta variant outbreak, with states having lower vaccination rates among adults ages 65 and older experiencing higher death rates among older adults (Figure 1, Table 1).

States With Lower Vaccination Rates Among Older Adults Have Higher Death Rates During Recent Delta Surge

In the U.S. overall, the death rate was 93 per 100,000 people 65 and older during the study period. In four of the five states with the lowest vaccination rate for older adults – Arkansas, Alabama, Georgia and Nevada – death rates were higher than the national average. For example, in Arkansas, which has a vaccination rate of 72.8%, there were 198 deaths per 100,000 residents 65 and older during the study period. Death rates were similarly high in Alabama (182), Georgia (150), and Nevada (164), where vaccination rates are well below the national average for older adults. The death rate in those four states combined was nearly 2 times the national average. In West Virginia, which has the lowest vaccination rate for people 65 and older (71.3%), the death rate was below the national average at 73 deaths per 100,000 residents.

Conversely, states with the highest vaccination rates for older adults – Wisconsin, Maryland, Minnesota, New Mexico, and Massachusetts – experienced comparatively low death rates among older adults during the Delta surge. For example, in Massachusetts, where 88.8% of older adults have been vaccinated, the death rate was 28 per 100,000 adults 65 and older, a rate about 7 times lower than that of Arkansas during the study period. Other states with comparatively high vaccination rates for older adults and low death rates during the Delta surge include Minnesota (35), Maryland (39) and Wisconsin (48). New Mexico also has one of the highest vaccination rates (89.4%), but there were slightly more deaths among older adults compared to other states during this time period (60 deaths per 100,000). Among the 38 states in this analysis, vaccination rates for people 65 and older range from 71.3% in West Virginia to 90.5% in Wisconsin (Table 1).

Had the death rate in the 10 least vaccinated states been the same as the death rate in the 10 most vaccinated states, there would have been 7,623 fewer deaths among older adults during this period in these 10 states, a 61.7% reduction from the actual number of deaths (12,363). Or, put differently, there were 2.6 times more deaths per 100,000 older adults in the 10 states with lowest vaccination rates than in the 10 states with the highest vaccination rates.

Vaccination rates are a key factor in the number of cases, hospitalizations, and deaths due to COVID-19 occurring during the Delta surge. Other factors could include decreasing vaccine effectiveness over time, which could be a particular concern for older adults during the Delta variant outbreak because much of this group was vaccinated in early 2021, as well as variations in state and local mitigation strategies put in place to address surging rates of infection. Some states implemented mask mandates in certain settings and/or vaccination and testing requirements, while others rejected mandates. For example, Florida – where there has been significant controversy over mask mandates and other restrictions – had the highest death rate for adults 65 and older among all states during this period (230 per 100,000), despite having a higher vaccination rate for adults 65 and older than other states with high death rates.

Substantial variation in vaccination rates and other mitigation strategies at the state level suggests that older adults in some states may face greater risk of death than others in the midst of the ongoing and evolving COVID-19 pandemic. While much of the focus has been on rising cases among children since Delta took hold, cases, hospitalizations, and deaths have been on the rise among older adults. There are signs that cases may be starting to decline in some areas of the country, but death is a lagging indicator, and some areas with recent surges may still see an increase in deaths. With the rollout of boosters for adults 65 and older, we will soon learn whether and when we will see a reversal of these troubling trends for older adults.

Table 1: Percent of Adults 65 and Older Fully Vaccinated and Deaths Per 100,000 For Adults 65 and Older

Methods

This analysis uses vaccination rates for fully vaccinated adults 65 and older for each state. When we use the term “vaccinated” in the document, it refers to the fully vaccinated population. These data are from the Centers for Disease Control and Prevention (CDC) as of September 29, 2021 and cover the entire time period in which vaccinations began. https://covid.cdc.gov/covid-data-tracker/#vaccinations_vacc-people-fully-percent-pop65

To calculate deaths among adults 65 and older, data are from the CDC, “Provisional COVID-19 Death Counts by Sex, Age, and State,” as of September 29, 2021, for the period from July 1, 2021 to September 25, 2021. https://data.cdc.gov/NCHS/Provisional-COVID-19-Death-Counts-by-Sex-Age-and-S/9bhg-hcku. The CDC uses incoming data from death certificates to produce provisional COVID-19 death counts. The number of deaths reported in this dataset are the total number of deaths received and coded as of the date of analysis, and do not represent all deaths that occurred in that period. Data during this period are incomplete because of the lag in time between when the death occurred and when the death certificate is completed, submitted to the National Center for Health Statistics (NCHS) and processed for reporting purposes. This delay can range from 1 week to 8 weeks or more. Death counts that are fewer than 10 by age group were suppressed in accordance with NCHS confidentiality standards.

We excluded 12 states and the District of Columbia from this analysis where there was a discrepancy of more than 10% between the total number of COVID-19 deaths by age group and the total number of deaths overall within the state (Alaska, Connecticut, Delaware, District of Columbia, Hawaii, Maine, Nebraska, New Hampshire, North Dakota, Rhode Island, South Dakota, Vermont, and Wyoming). This discrepancy is likely due to the suppression of data within age cohorts that falls below the NCHS reporting standard.

We calculated the Pearson correlation coefficient, which indicated there was a significant negative correlation between vaccination rates and death rates among older adults: r= –.59, p-value <.001.

Population estimates of adults 65 and older from each state are from the 2019 US Census Bureau.

News Release

Nearly Half of Parents of Adolescents Ages 12-17 Say Their Child Got a COVID-19 Vaccine Already; a Third of Parents of Children Ages 5-11 Say Their Child Will Get Vaccinated “Right Away” Once Eligible

Almost 1 in 4 Parents with Children Attending In-Person School Say a Child Had to Quarantine Since the School Year Began Due to Possible COVID Exposure

Published: Sep 30, 2021

Nearly half (48%) of parents of vaccine-eligible children ages 12-17 now say their child has received at least one dose of a COVID-19 vaccine, a new KFF Vaccine Monitor report shows.

Another 15% of those parents now say they want to “wait and see” how the vaccine works for others before their adolescent gets it, while 4% say they would get vaccinated “only if required” for school or other activities. About one in five (21%) say their adolescent child would “definitely not” get a vaccine.Largely fielded before Pfizer’s Sept. 20 announcement about favorable results from its clinical trials for children ages 5-11, the new report shows a third (34%) of parents of children in that age group want their child to get vaccinated “right away” once eligible. A similar share (32%) wants to “wait and see,” while a quarter (24%) say their children will “definitely not” get a COVID vaccine.

The report also highlights the toll that the COVID-19 pandemic is taking on students attending in-person classes this fall. Nearly a quarter (23%) of parents say that they have a child who has had to quarantine at home due to a possible COVID-19 exposure since the school year began. The includes 26% of parents with children ages 5-11 and 20% of parents with children ages 12-17.

Most parents (58%) say K-12 schools should require students and staff to wear masks, regardless of their vaccination status, while more than a third (35%) say schools should have no mask requirements. Mothers are much more likely than fathers to favor a mask requirement for all students and staff (70% vs. 42%).

Among parents with a child attending in-person school, nearly seven in ten (69%) say their school is requiring all students and staff to wear masks, just one percent say masks are required only for unvaccinated individuals, and 28% say their school has no mask requirement. Most parents (73%) who say their child’s school requires all students and staff to wear masks favor that policy.

Few parents of children attending in-person schools say their school offers routine testing for children who are not vaccinated (6%), and one in five (20%) say that it is offering optional testing.

Two-thirds (66%) of parents with a child attending in-person school say their school overall is doing about the right amount to limit the spread of COVID-19. Parents are somewhat more likely to say that their school is not doing enough (21%) than that their school is doing too much (11%).

Designed and analyzed by public opinion researchers at KFF, the KFF Vaccine Monitor survey was conducted from September 13-22 among a nationally representative random digit dial telephone sample of 1,519 adults, including oversamples of adults who are Black (306) or Hispanic (339). 414 parents were surveyed with a margin of error of plus or minus 6 percentage points. Interviews were conducted in English and Spanish by landline (171) and cell phone (1,348). The margin of sampling error is plus or minus 3 percentage points for the full sample. For results based on subgroups, the margin of sampling error may be higher.

The KFF COVID-19 Vaccine Monitor is an ongoing research project tracking the public’s attitudes and experiences with COVID-19 vaccinations. Using a combination of surveys and qualitative research, this project tracks the dynamic nature of public opinion as vaccine development and distribution unfold, including vaccine confidence and acceptance, information needs, trusted messengers and messages, as well as the public’s experiences with vaccination.


Poll Finding

KFF COVID-19 Vaccine Monitor: Vaccination Trends Among Children And COVID-19 In Schools

Authors: Lunna Lopes, Liz Hamel, Grace Sparks, Mellisha Stokes, and Mollyann Brodie
Published: Sep 30, 2021

Findings

The KFF COVID-19 Vaccine Monitor is an ongoing research project tracking the public’s attitudes and experiences with COVID-19 vaccinations. Using a combination of surveys and qualitative research, this project tracks the dynamic nature of public opinion as vaccine development and distribution unfold, including vaccine confidence and acceptance, information needs, trusted messengers and messages, as well as the public’s experiences with vaccination.

Key Findings

  • The latest KFF COVID-19 Vaccine Monitor finds that nearly half (48%) of parents of children ages 12-17 say their child has received at least one dose of a vaccine. With news from Pfizer that clinical trials showed their COVID-19 vaccine was safe and effective for children ages five to eleven, the Vaccine Monitor (conducted September 13-22, with the bulk of interviews concluding before Pfizer’s announcement) finds that about a third of parents (34%) say they will vaccinate their 5-11 year old child “right away” once a vaccine is authorized for their age group.
  • As policymakers and school leaders across the country implement policies to help limit the spread of COVID-19 in school and keep children safe, a majority of parents (58%) say K-12 schools should require all students and staff to wear masks while at school while about a third (35%) say schools should have no mask requirements at all. Regardless of preferences, nearly seven in ten parents with a child attending in-person school (69%) say their school is requiring all students and staff to wear masks and just 28% say their school has no mask requirement. While mask requirements appear to be widespread in schools, COVID-19 testing is less common with half of parents saying their school district is not offering testing to students who are not eligible to get the vaccine.
  • While two-thirds (66%) of parents with a child attending in-person school say their child’s school is doing about the right amount to limit the spread of COVID-19 at school, almost one in four parents of a child attending in-person school (23%) say their child has been required to quarantine at home due to a possible COVID-19 exposure since the school year began.

Five months after the FDA granted emergency use authorization for the Pfizer COVID-19 vaccine’s use in children ages 12 and over, nearly half (48%) of parents of children ages 12-17 say their child has received at least one dose of a vaccine. The share of parents who say they want to “wait and see” before getting their 12-17 year old vaccinated has decreased to 15%, down from 23% in July. Just 4% of parents say they will only get their teenager vaccinated “if their school requires it,” and one in five (21%) say they will “definitely not” vaccinate their child, similar to the share measured in previous months.

Nearly Half Of Parents Of 12-17 Year Olds Say Their Child Has Received At Least One Dose Of The COVID-19 Vaccine

On September 20th, Pfizer announced that clinical trials showed their COVID-19 vaccine was safe and effective for children ages five to eleven. The KFF COVID-19 Vaccine Monitor (conducted September 13-22, with the bulk of interviews concluding before Pfizer’s announcement) finds that about a third of parents (34%) say they will vaccinate their 5-11 year old child “right away” once a vaccine is authorized for their age group. About a third of parents (32%) say they will “wait and see” how the vaccine is working before having their 5-11 year old vaccinated. Notably, the share who say they definitely won’t get their 5-11 year old vaccinated remains steady at one in four (24%).

Parents continue to be more cautious about getting their younger children vaccinated with about one in four (23%) saying they will get their child under the age of 5 vaccinated right away once a vaccine is available for that age group and about a third (35%) saying they will definitely not get their child under 5 vaccinated for COVID-19.

A Third Of Parents Of 5 To 11 Year Olds Say They Will Vaccinate Their Child Right Away Once A Vaccine Is Available For Their Age Group

COVID-19 and Schools

With schools now back in session amidst a resurgent COVID-19 pandemic, the Biden administration and government and school officials across the country are implementing precautions and policies in an attempt to limit COVID-19 transmission and keep students safe at school. As part of the efforts, many schools are requiring students and staff to wear masks, regardless of their vaccination status. Overall, a majority of parents (58%) say K-12 schools should require all students and staff to wear masks while at school, 4% say they should only require unvaccinated students and staff to wear masks, and about a third (35%) say schools should have no mask requirements at all. Seven in ten parents (73%) who are vaccinated for COVID-19 themselves say schools should require all students to wear masks, while about six in ten unvaccinated parents (63%) say there should be no masking requirements at all. Notably mothers are more likely than fathers to say schools should require all students and staff to wear masks (70% vs 42%).

About Seven In Ten Mothers And Vaccinated Parents Say Schools Should Require All Students And Staff To Wear Masks

Among parents with a child attending in-person school, nearly seven in ten (69%) say their school is requiring all students and staff to wear masks, just one percent say masks are required only for unvaccinated individuals, and 28% say their school has no mask requirement. Notably, a large majority of parents who say their child’s school requires all students and staff to wear masks support that policy with 73% saying schools should require all students and staff to wear masks.

Earlier this month, President Biden outlined further steps his administration would take in efforts to address the COVID-19 pandemic and limit its spread in schools. A key component of his plan is increasing access to COVID-19 testing in schools. However, the KFF COVID-19 Vaccine Monitor finds that just 6% of parents of children who attend school in person say their school district is offering routine testing to students who are not eligible to get the vaccine and one in five say it is offering optional testing. Half of parents say their school district is not offering testing at all (51%) and another one in five (22%) say they don’t know if testing is being offered to students not eligible for the vaccine.

About Seven In Ten Parents Say Their Child's School Requires All Students To Wear Masks, About A Quarter Say Their School District Is Offering COVID-19 Testing To Those Ineligible To Get Vaccinated

Overall, two-thirds (66%) of parents with a child attending in-person school say their child’s school is doing about the right amount to limit the spread of COVID-19 at school. About one in ten (11%) say their child’s school is doing too much while about one in five (21%) feel their child’s school is not doing enough to limit the spread of COVID-19 at school.

Most Parents Say Their Child's School Is Doing About The Right Amount To Limit The Spread Of COVID-19

Despite most parents saying they feel their child’s school is doing about the right amount to limit the spread of COVID-19 at school, almost one in four parents of a child attending in-person school (23%) say their child has been required to quarantine at home due to a possible COVID-19 exposure since the school year began, including a 26% of parents of younger children ages 5-11. With a notable share of parents reporting their child has had to quarantine due to a possible COVID-19 exposure, a majority of parents (57%) say they are worried their child may get seriously sick from coronavirus. Mothers (68%), Hispanic parents (71%), and lower-income parents (74%) are particularly likely to say they are worried their child may get seriously sick from coronavirus.

About One in Four Parents Say Their Child Has Had To Quarantine At Home Due To A Possible COVID-19 Exposure Since The Start Of The School Year

Methodology

This KFF COVID-19 Vaccine Monitor was designed and analyzed by public opinion researchers at the Kaiser Family Foundation (KFF). The survey was conducted September 13-22, 2021, among a nationally representative random digit dial telephone sample of 1,519 adults ages 18 and older (including interviews from 339 Hispanic adults and 306 non-Hispanic Black adults), living in the United States, including Alaska and Hawaii (note: persons without a telephone could not be included in the random selection process). Phone numbers used for this study were randomly generated from cell phone and landline sampling frames, with an overlapping frame design, and disproportionate stratification aimed at reaching Hispanic and non-Hispanic Black respondents as well as those living in areas with high rates of COVID-19 vaccine hesitancy. Stratification was based on incidence of the race/ethnicity subgroups and vaccine hesitancy within each frame. High hesitancy was defined as living in the top 25% of counties as far as the share of the population not intending to get vaccinated based on the U.S. Census Bureau’s Household Pulse Survey.  The sample also included 30 respondents reached by calling back respondents that had previously completed an interview on the KFF Tracking poll at least six months ago. Another 123 interviews were completed with respondents who had previously completed an interview on the SSRS Omnibus poll (and other RDD polls) and identified as Hispanic (n =64; including 4 in Spanish) or non-Hispanic Black (n=59). Computer-assisted telephone interviews conducted by landline (171) and cell phone (1,348, including 1,007 who had no landline telephone) were carried out in English and Spanish by SSRS of Glen Mills, PA. To efficiently obtain a sample of lower-income and non-White respondents, the sample also included an oversample of prepaid (pay-as-you-go) telephone numbers (25% of the cell phone sample consisted of prepaid numbers) Both the random digit dial landline and cell phone samples were provided by Marketing Systems Group (MSG). For the landline sample, respondents were selected by asking for the youngest adult male or female currently at home based on a random rotation. If no one of that gender was available, interviewers asked to speak with the youngest adult of the opposite gender. For the cell phone sample, interviews were conducted with the adult who answered the phone. KFF paid for all costs associated with the survey.

The combined landline and cell phone sample was weighted to balance the sample demographics to match estimates for the national population using data from the Census Bureau’s 2019 U.S. American Community Survey (ACS), on sex, age, education, race, Hispanic origin, and region, within race-groups, along with data from the 2010 Census on population density. The sample was also weighted to match current patterns of telephone use using data from the July-December 2020 National Health Interview Survey The weight takes into account the fact that respondents with both a landline and cell phone have a higher probability of selection in the combined sample and also adjusts for the household size for the landline sample, and design modifications, namely, the oversampling of potentially undocumented respondents and of prepaid cell phone numbers, as well as the likelihood of non-response for the re-contacted sample. All statistical tests of significance account for the effect of weighting.

The margin of sampling error including the design effect for the full sample is plus or minus 3 percentage points. Numbers of respondents and margins of sampling error for key subgroups are shown in the table below. For results based on other subgroups, the margin of sampling error may be higher. Sample sizes and margins of sampling error for other subgroups are available by request. Sampling error is only one of many potential sources of error and there may be other unmeasured error in this or any other public opinion poll. Kaiser Family Foundation public opinion and survey research is a charter member of the Transparency Initiative of the American Association for Public Opinion Research.

This work was supported in part by grants from the Chan Zuckerberg Initiative DAF (an advised fund of Silicon Valley Community Foundation), the Ford Foundation, and the Molina Family Foundation. We value our funders. KFF maintains full editorial control over all of its policy analysis, polling, and journalism activities.

GroupN (unweighted)M.O.S.E.
Total1,519± 3 percentage points
COVID-19 Vaccination Status
Have gotten at least one dose of the COVID-19 vaccine1,102± 4 percentage points
Have not gotten the COVID-19 vaccine379± 6 percentage points
Race/Ethnicity
White, non-Hispanic766± 4 percentage points
Black, non-Hispanic306± 7 percentage points
Hispanic339± 7 percentage points
Party Identification
Democrats458± 6 percentage points
Republicans345± 6 percentage points
Independents489± 5 percentage points

Navigator Funding Restored in Federal Marketplace States for 2022

Authors: Karen Pollitz, Jennifer Tolbert, and Kendal Orgera
Published: Sep 29, 2021

On August 27, 2021, the Centers for Medicare and Medicaid Services (CMS) announced $80 million in funding for 60 Navigator programs serving consumers in 30 Federally-Facilitated Marketplace (FFM) states for the 2022 plan year. Navigator programs help consumers understand their plan choices and complete their application for financial help for Marketplace coverage or for Medicaid or CHIP. The multi-year award provides $80 million annually for 3-years; awardees must comply with grant terms and conditions to receive funding each year. Shortly after the funding announcement, CMS also finalized certain changes to regulatory standards for navigators in the federal marketplace.

The 2021 funding is significantly higher than the $10 million in annual funding awarded in 2018-2020 during the Trump Administration and more than the $63 million awarded in the final year of the Obama Administration. Total funding announced this year is 27% higher than the total announced in 2016, though funding changes vary considerably by state (Table 1). Four FFM states (Georgia, Hawaii, Iowa and South Carolina) received less navigator funding than in 2016, while in five other states (Kansas, Montana, New Hampshire, South Dakota, and Tennessee) funding more than doubled. In Delaware, federal navigator funding is more than three times the 2016 total.

Table 1: Changes in Federal Navigator Funding, 2016-2021

Increased funding will support growth in the number of navigator programs – which had fallen to 30 by the end of the Trump Administration. Compared to the first year the FFM was open, when more than 100 Navigator programs received grants, a smaller number of grantees will begin work this fall; however, nearly half of the FFM navigators (29) will operate statewide programs, and most of those (20) will coordinate and share funding with a network of local partners. By contrast, in 2016, coordination among marketplace assister programs was more limited, although those that did so regularly said coordination was important to their effectiveness.

Federal regulatory standards for navigators previously required that there be a minimum of two navigators per state, at least one of which should be a community-based nonprofit. These requirements were eliminated during the Trump Administration and have not been restored. In all but two of the FFM states (Utah and Texas), every county will be included in the service area of at least one navigator program and nearly one in five (19%) counties in FFM states will be included in the service area of at least two programs (Figure 1). Although the funding awards posted by CMS do not indicate the type of grantee organization, it appears that nearly two-thirds (38 of 60) of navigator grantees are community-based nonprofits, another 15 are providers or provider groups--federally qualified health centers, primary care associations, or hospitals—and 4 are public universities, government agencies, or tribal organizations. Until 2017, federal navigators were required to maintain a physical presence in their state. This requirement also was eliminated during the Trump Administration and has not been restored, though CMS did encourage grant applicants to meet this standard. One of the non-physically-present grantees funded during the Trump years has been funded to provide statewide services in three states during the 2022 plan year and apparently will offer only call-center assistance in the state of Iowa.

Number of Navigator Programs by County in FFM States, 2021

Discussion

A 2020 KFF national survey on consumer assistance documented significant unmet need for enrollment help by consumers seeking coverage through the marketplace. Since then, the COVID-19 epidemic has increased reliance on marketplace coverage and Medicaid. Following enactment of subsidy increases and expanded enrollment periods during the pandemic, enrollment in marketplace plans increased by 2.8 million this year, including 2.1 million in HealthCare.gov states. Recently published regulations will extend the federal marketplace open enrollment period for the 2022 plan year from 6 weeks to 8 weeks (November 1 - January 15), and will allow people with income up to 150% of the federal poverty level (or $19,320 for an individual in 2021) to enroll throughout the year. Assuming the public health emergency ends in 2022, the moratorium on Medicaid disenrollment will be lifted and many more low-income people may need to transition to marketplace plans if their Medicaid eligibility is terminated. The restoration of federal navigator funding comes at a time when the need for consumer assistance may reach new, higher levels.

In addition to increasing funding for navigators, ensuring consumers are aware that navigator assistance is available and where to find it can help improve access to enrollment assistance. In recent years CMS has taken various steps to facilitate consumer access to agents and brokers – including a “Help On Demand” feature of HealthCare.gov that connects individual consumers directly with brokers. CMS has also promoted the use of web broker sites, called enhanced direct enrollment entities (EDE), that offer online dashboards and other technological tools to make broker-assisted enrollments faster and more efficient. Comparable initiatives have not been undertaken to promote and facilitate enrollment assistance by marketplace navigators. Because CMS accumulated more than $1 billion in unspent marketplace user fee revenue during the Trump Administration, additional resources are available to increase support for enrollment assistance if needed.

News Release

Surging Delta Variant Cases, Hospitalizations, and Deaths Are Biggest Drivers Of Recent Uptick in U.S. COVID-19 Vaccination Rates

The Vast Majority Of Vaccinated Americans Will Get A Booster if Recommended, But Many Unvaccinated People See Need for Boosters As Evidence Vaccines Are Not Working

Published: Sep 28, 2021

Large Majorities of Americans, Both Vaccinated and Not, Say COVID-19 is Likely to Persist at Lower Levels and Be Something the U.S. Will “Learn to Live With” like Seasonal Flu

More than 7 in 10 adults (72%) in the U.S. now report that they are at least partially vaccinated against COVID-19, with the surge in disease and death driven by the Delta variant serving as the chief impetus in recent weeks, finds the latest KFF COVID-19 Vaccine Monitor.

That was up from 67 percent of adults in late July. The survey finds that self-reported vaccination rates increased most for Hispanic adults, rising 12 percentage points to 73 percent in September, and among adults ages 18 to 29, up 11 percentage points to 68 percent. Similar shares of adults now report being vaccinated across racial and ethnic groups, a sign that the racial gap in vaccinations may be narrowing.

Adults who got vaccinated since June 1 cite as major reasons the increase in COVID cases due to the Delta variant (39%), reports of local hospitals filling up (38%), and knowing someone who became seriously ill or died (36%). Thirty-five percent also say a major reason was to participate in activities where vaccinations are required, such as traveling or attending events. Fewer people say being mandated by their employer (19%) or the FDA granting full approval to the Pfizer vaccine (15%) were major factors.

“Nothing motivates people to get vaccinated quite like the impact of seeing a family member, friend or neighbor die or become seriously ill with COVID-19, or to worry that your hospital might not be able to save your life if you need it,” said KFF President and CEO Drew Altman. “When a theoretical threat becomes a clear and present danger, people are more likely to act to protect themselves and their loved ones.”

Two percent of adults in September say that they plan to get the vaccine as “soon as possible,” while seven percent want to “wait and see”, down from 10 percent in July. Four percent say they will get vaccinated only if required for work, school, or other activities and 12 percent say they will “definitely not” get the vaccine.

The largest remaining gap is between political partisans, with 90 percent of Democrats reporting they have gotten at least one dose compared to 58 percent of Republicans. Sixty-eight percent of independents say they are at least partially vaccinated. Large gaps in vaccine uptake also remain by education level, age, and health insurance status.

Most say boosters show scientists are finding ways to make vaccine more effective

The September Vaccine Monitor was in the field after the Biden Administration announced plans to roll out COVID-19 booster doses to all Americans, but before federal health officials recommended boosters for people 65 and older and those at high-risk of illness.

Overall, 62 percent of adults say news that some people might need boosters “shows that scientists are continuing to find ways to make vaccines more effective” while one-third say it “shows that the vaccines are not working as well as promised.” Among unvaccinated adults, however, 71 percent say boosters are a sign that vaccines are not working. Similarly, two-thirds of unvaccinated Americans see recent news of breakthrough infections as an indication that the vaccines are not working.

Among fully vaccinated Americans, a large majority say they will definitely (55%) or probably (26%) get a booster if it is recommended for people like them, while small shares say they will probably not (8%) or definitely not get it (5%). Those who don’t want a booster say they feel they won’t need it (14%), believe more research is necessary (13%), and they don’t trust the government or the CDC (8%).

Partisan differences in intentions to get a booster emerge even among the fully vaccinated population. Democrats are almost twice as likely as Republicans to say they’ll “definitely” get a booster if recommended (68% vs. 36%). Nearly a quarter of fully vaccinated Republicans (23%) say they will probably or definitely not get a booster even if it is recommended for people like them.

Most expect the U.S. will learn to live with COVID-19

As the pandemic wears on, about 8 in 10 adults – including large majorities of both vaccinated and unvaccinated adults– say they expect that COVID-19 will “continue at a lower level and be something the U.S. will learn to live with and manage with medical treatments and vaccines, like the seasonal flu.” Few (14%) think COVID-19 will be “largely eliminated in the U.S. like polio.”

“We may have reached a turning point in attitudes about the pandemic,” KFF Executive Vice President Mollyann Brodie said. “A majority of the public seem resigned to accept the possibility that COVID-19 may never be fully defeated and instead will have to be dealt with as a chronic problem.”

About a third of the public (36%) say they would be satisfied, but not enthusiastic, about an outcome with annual vaccinations and treatments for COVID-19, but some people still getting sick and dying every year. A similar share (35%) say they would be dissatisfied, but not angry. One in six (15%) say they would be angry about this outcome, with more than twice as many Democrats (23%) angry about it than independents and Republicans (12% and 10%).

As for what’s driving the recent surge in COVID-19 cases in many parts of the country, it depends on whom you ask.

Vaccinated people say it is due to too many people refusing the vaccine (77%), people not taking enough precautions (73%), and the infectiousness of the Delta variant (67%).

Unvaccinated people say it’s because vaccines are not as effective at preventing the spread of COVID-19 as scientists initially thought they would be (58%), followed by immigrants and tourists bringing COVID-19 into the country (40%), people not taking enough precautions (37%), and the infectiousness of Delta (35%).

Republicans and Democrats divide along similar lines. Big majorities of Democrats point to people not taking precautions like wearing masks and social distancing (89%), and too many people refusing to get the COVID-19 vaccine (87%), while about 3 in 10 Republicans say the same. On the other hand, 55 percent of Republicans say immigrants and tourists bringing COVID-19 into the U.S. is a major reason for the high number of cases, whereas fewer independents (34%) and Democrats (21%) see this as a major reason.

Sixty-five percent of Democrats say they are angry at people who have not gotten a COVID-19 vaccine, compared with just 16 percent of Republicans. About 6 in 10 Republicans say they are angry at the federal government regarding the state of the pandemic, compared to 2 in 10 Democrats. Among independents, a somewhat larger share says they are angry with the federal government (41%) than says they are angry with people who have not gotten vaccinated (33%).

Workplace mandates may prompt more people to get vaccinated

Nearly 6 in 10 Americans (58%) support the new federal government mandate on larger employers to require vaccines or weekly testing for their workers, and nearly eight in ten (78%) support the requirement that these employers offer workers paid time off to get vaccinated and recover from side effects. The public is more divided on whether employers in general should require workers to be vaccinated against COVID-19 (48% say they should and 50% say they should not).

Such requirements have the potential to further increase vaccine uptake, the survey finds. When unvaccinated workers are asked what they would do if their employer required them to get a COVID-19 vaccine in order to continue working, one-third (34%) say they would be very or somewhat likely to get the vaccine, one in six (15%) say they would be “not too likely” to get it, and half (50%) say they would be “not at all likely” to get vaccinated.

However, when presented with the option to get weekly testing instead — an option that larger employers could offer under the Biden plan – over half of unvaccinated workers (56%) say they would take the testing option. Just 12 percent say they would get the vaccine and three in ten would leave their job.

A large majority of unvaccinated workers (87%) oppose their own employer requiring workers to be vaccinated, as do a substantial share of vaccinated workers (35%).

Designed and analyzed by public opinion researchers at KFF, the KFF Vaccine Monitor survey was conducted from September 13-22 among a nationally representative random digit dial telephone sample of 1,519 adults, including oversamples of adults who are Black (306) or Hispanic (339). Interviews were conducted in English and Spanish by landline (171) and cell phone (1,348). The margin of sampling error is plus or minus 3 percentage points for the full sample. For results based on subgroups, the margin of sampling error may be higher.

The KFF COVID-19 Vaccine Monitor is an ongoing research project tracking the public’s attitudes and experiences with COVID-19 vaccinations. Using a combination of surveys and qualitative research, this project tracks the dynamic nature of public opinion as vaccine development and distribution unfold, including vaccine confidence and acceptance, information needs, trusted messengers and messages, as well as the public’s experiences with vaccination.