News Release

Implementation of the 988 Number Brought More Calls and Texts to the National Suicide Prevention and Crisis Hotline This Summer – And Early Data Show Answer Rates Improved or Held Steady

Published: Oct 17, 2022

A new KFF analysis finds that more people contacted the new 988 number for the national suicide prevention and crisis hotline following its launch in July, that callers waited less time on hold, and that callers connected with crisis counselors at higher rates than before the 988 number came online through a combination of calls, chats and texts.

The easy-to-remember three-digit number steers callers who are suicidal or experiencing a behavioral health crisis to the recently renamed 988 Suicide & Crisis Lifeline, where they can be connected to a local Lifeline counselor and may receive crisis counseling, resources, and referrals.

Before 988, the Lifeline crisis hotline–established in 2005–was typically accessed through a 10-digit number, which was difficult for callers experiencing a mental health crisis to recall. The new phone number was expected to increase outreach, but there was concern that the Lifeline service might not be able to accommodate the increased demand, potentially resulting in higher rates of unanswered calls.

Early federal data show that combined call, text, and chat volume to Lifeline increased substantially after the 988 number went live. The combined number of calls, texts, and chats rose by more than 112,000 in August 2022 compared to a year earlier (a 45% increase); however, the overall answer rate actually improved, rising from 67 percent to 88 percent over the same time frame. People who reached out to 988 spent less time waiting on hold for a counselor, with the average wait time for all methods (combined) decreasing from 2 minutes and 30 seconds in August 2021 to 42 seconds in August 2022.

Lifeline’s 988 calling code became nationally available on July 16, 2022. Despite some early reports of public hesitancy, a recent KFF/CNN poll finds that among those that knew about 988, 85 percent say they would be at least somewhat likely to call the hotline if they or a loved one were experiencing a mental health crisis. However, less than half of people know about 988. Nearly half a million lives (480,622) were lost to suicide between 2010 to 2020 and an additional 47,646 lives were lost in 2021, reflecting a recent rise in suicide rates.

Additional state and national crisis center metrics may help inform the 988 implementation and future program improvements. Publicly available Lifeline data only capture a small slice of metrics needed to understand implementation, identify gaps, and identify policies and interventions to address shortfalls.

News Release

Firearm Deaths of Children and Adolescents Continued to Rise in 2021, Especially Among Black Youth

About Seven Children Die Each Day Due to Firearms

Published: Oct 14, 2022

Gun deaths among children and adolescents continued to rise in 2021, particularly among Black youth, a new KFF analysis of federal injury and mortality data finds.

The analysis finds that the rate of firearm-related deaths for children ages 17 and younger reached 3.6 per 100,000 children in 2021, a 50% increase from before the COVID-19 pandemic began. This represents about seven children dying each day due to firearms.

The rate of firearm-related deaths among Black youth was 12.0 per 100,000 – six times higher than White youth and substantially higher than any other racial and ethnic group. Although Black children made up 14% of the nation’s children in 2021, they accounted for 46% of youth firearm deaths.

While most child firearm deaths stem from assaults, the number of firearms-related deaths by suicide is on the rise, climbing from 657 in 2019 to 827 in 2021. At the same time, youth suicide deaths by other means have declined in recent years. As a result, nearly half (47%) of all youth suicides now involve firearms, the analysis finds.

The analysis also examines the negative mental health consequences for children and youth stemming from exposure to gun violence and describes recent policy changes aimed at addressing them.

Half of Adults Say Their Family Has Experienced a Severe Mental Health Crisis

Published: Oct 13, 2022

The latest partnership survey between KFF and CNN finds half of adults have experienced a severe mental health crisis in their family, including one in four adults who say they have had a family member receive in-person treatment because they were thought to be a threat to themselves or others, or had a family member engaged in cutting or other self-harming behaviors. The Mental Health in America survey was conducted July 28-August 9, 2022, online and by telephone among a nationally representative sample of 2,004 U.S. adults in order to provide insights into the current state of mental health and mental health care among U.S. adults, including their experiences during the COVID-19 pandemic.

News Release

Abortion Grows as a Motivator for Midterm Voters, Particularly for Democrats and in States Where It Has Become Illegal Since the Supreme Court Overturned Roe v. Wade

Voters, Including Most Republicans and Most Living in States with Abortion Bans, Oppose Prohibiting It in Cases of Rape or Incest, or Criminalizing Women and Doctors

Published: Oct 12, 2022

Few Voters Know About the Medicare Drug Provisions in the Inflation Reduction Act, Though Seniors are More Aware and Would Be Likely to Vote for Candidates Who Support Them

About a month ahead of the 2022 midterm election, abortion continues to grow as a motivating issue for voters, especially among Democrats and those living in states where abortion is now illegal, the latest KFF Health Tracking Poll finds.

Half (50%) of voters now say the Supreme Court’s decision overturning Roe v. Wade has made them more motivated to vote in this year’s elections, up from 43% in July shortly after the Court’s decision and from 37% in a similar question in May, prior to the decision. About two thirds of Democrats (69%), and half of independents (49%), cite the Court’s decision as a motivator, as do a third of Republicans (32%).

Many races in the midterms will be decided by marginal changes in turnout, with a few voters making a difference. The new survey reveals how abortion access and reproductive health is motivating majorities of Democratic women, women of reproductive age, and Democratic and Democratic-leaning voters in states where abortion is currently illegal.

Among those who say the Supreme Court decision is making them more motivated to vote, three-quarters (76%) say they plan to vote for candidates who want to protect abortion access, compared to 17% who say they plan to vote for candidates who want to limit access.

With states now determining whether and when abortion is legal for their residents, four in ten (40%) voters say their state’s abortion laws are making them more motivated to vote this year.

In states with abortion bans in place following the Supreme Court’s decision, half (51%) of voters say their state’s abortion laws are making them more motivated to vote this year. This includes three quarters of Democratic and Democratic-leaning voters (74%) and a third of Republican and Republican-leaning voters (35%) in those states.

Nationally, 82% of voters oppose laws that would prohibit abortion in cases of rape and incest, as is now in place in some states such as Texas, Tennessee, South Dakota, Missouri, Louisiana and Kentucky. About six in ten (59%) oppose prohibiting abortions after a fetal heartbeat is detected, which is usually at around six weeks.

In addition, large majorities of voters oppose punitive abortion laws, such making it a crime for doctors to perform them (74%) or for women to get them (79%), and allowing private citizens to sue people who provide or assist in abortions (81%).

Most Democratic and independent voters oppose each of these five laws, and most Republican voters oppose a prohibition even in cases of rape or incest (70%), allowing private citizens to sue those involved in abortions (65%), or making it a crime for a woman to get one (64%). Half (51%) of Republican voters oppose making it a crime for a doctor to provide one, while a third (34%) oppose a prohibition once a fetal heartbeat is detected.

Most voters living in states with abortion bans oppose each of these restrictions, often by large margins.

“With a Democrat in the White House, Republicans start with an advantage in this year’s midterm, especially on issues such as gas prices and crime, but their efforts to ban and criminalize abortion are backfiring on them politically, even in red states,” KFF President and CEO Drew Altman said. “Whether this motivates enough voters to hit the polls and change the outcome remains to be seen.”

Awareness of IRA’s Medicare Provisions is Low, Though Most Older Voters Like Them

The survey also probes the public’s knowledge and views about the Inflation Reduction Act (IRA), which President Biden signed into law in August. The law includes provisions related to health care and drug prices, as well as climate change and tax policy.

The provisions are popular, with majorities of voters supporting some of the new law’s Medicare provisions, suggesting that Democrats can campaign on them with positive results.

However, relatively few people are aware of the law’s Medicare provisions, including allowing Medicare to negotiate some drug prices (36% are aware the law does this), capping monthly out-of-pocket insulin costs for people on Medicare (29%), and limiting overall out-of-pocket prescription costs for those on Medicare (29%).

Older adults at least 65 years old, who are most directly affected by Medicare changes, are twice as likely as younger adults to say they’ve heard “a lot” about the IRA (25% vs. 12%). They are also more likely than younger adults to know about the Medicare drug negotiations and insulin provisions.

Most Democratic and independent voters say they would be more likely to vote for candidate who supports each of the IRA’s Medicare drug provisions. Nearly half of Republican voters say the same about candidates who support limiting out-of-pocket drug costs (48%) and insulin costs (47%) for people with Medicare, though somewhat fewer say so about candidates who support Medicare drug price negotiations (38%).

In addition, large majorities of older voters say they would be more likely to vote for candidates who support each of the IRA’s Medicare drug provisions, including limiting out-of-pocket prescription costs (73%), allowing Medicare drug price negotiations (65%), and capping monthly insulin costs (64%).

Designed and analyzed by public opinion researchers at KFF, the survey was conducted from Sept 15-26, 2022, online and by telephone among a nationally representative sample of 1,534 U.S. adults, in English and in Spanish. The survey included an oversample of 599 women between the ages of 18 and 49. The margin of sampling error is plus or minus 3 percentage points for the full sample. For results based on other subgroups, the margin of sampling error may be higher.

Poll Finding

KFF Health Tracking Poll October 2022: The Issues Motivating Voters One Month Before The Midterm Elections

Published: Oct 12, 2022

Findings

Key Findings

  • In the upcoming midterm elections, many races will be decided by marginal changes in turnout with a few voters making a difference. The latest KFF Health Tracking Poll examines what health care issues may be motivating small groups of voters that could shift some key races. Abortion access and reproductive health is motivating majorities of Democratic women, women of reproductive age, and Democratic and Democratic-leaning voters in states where abortion is currently illegal. This is also the issue that these voters want to hear candidates talk about during the next month of the campaign. Moreover, state action on abortion seems to be a particularly motivating issue for Democrats in states that have a full abortion ban. The other health care issue that is resonating with a group of voters – older voters – is reducing the cost of prescription drugs for people with Medicare. Majorities of voters ages 65 and older say they are more likely to vote for a candidate who supports the Inflation Reduction Act provisions aimed at capping costs and allowing the federal government to negotiate prices for people with Medicare. These provisions were also motivating, to a lesser extent, Republican voters.
  • With about a month before the 2022 midterm election, half of registered voters say they are more motivated to vote in this upcoming election compared with past elections. A single party doesn’t hold a distinct advantage – with more than half of both Republican and Democratic voters saying they are more motivated – but the issues motivating each group of voters differ. When asked to say in their own words why they are more motivated to vote now, the top issue provided by Republicans is the economy, while Democratic voters are more likely to offer abortion as their motivation for being more eager to vote. Independent voters are divided between the two issues. Large shares of voters also offer partisan reasons like keeping the other party out of office for the main reason why they are motivated to vote.
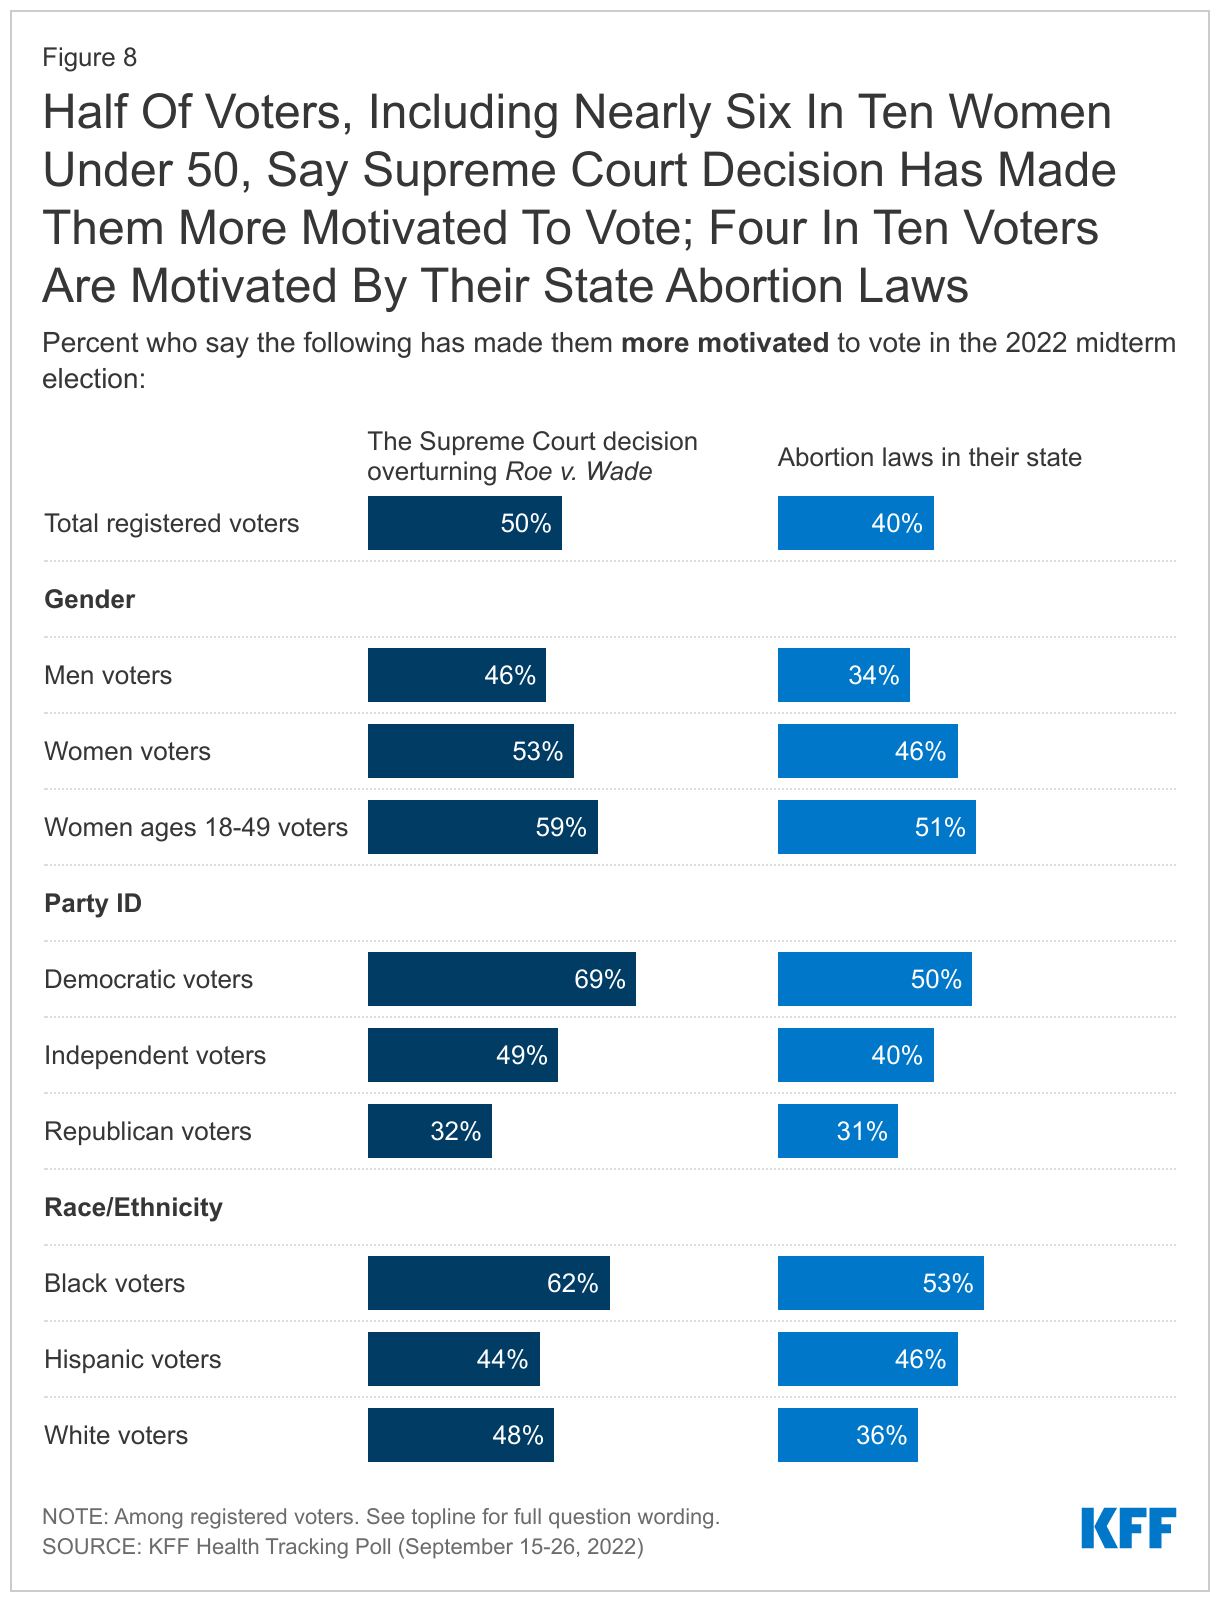
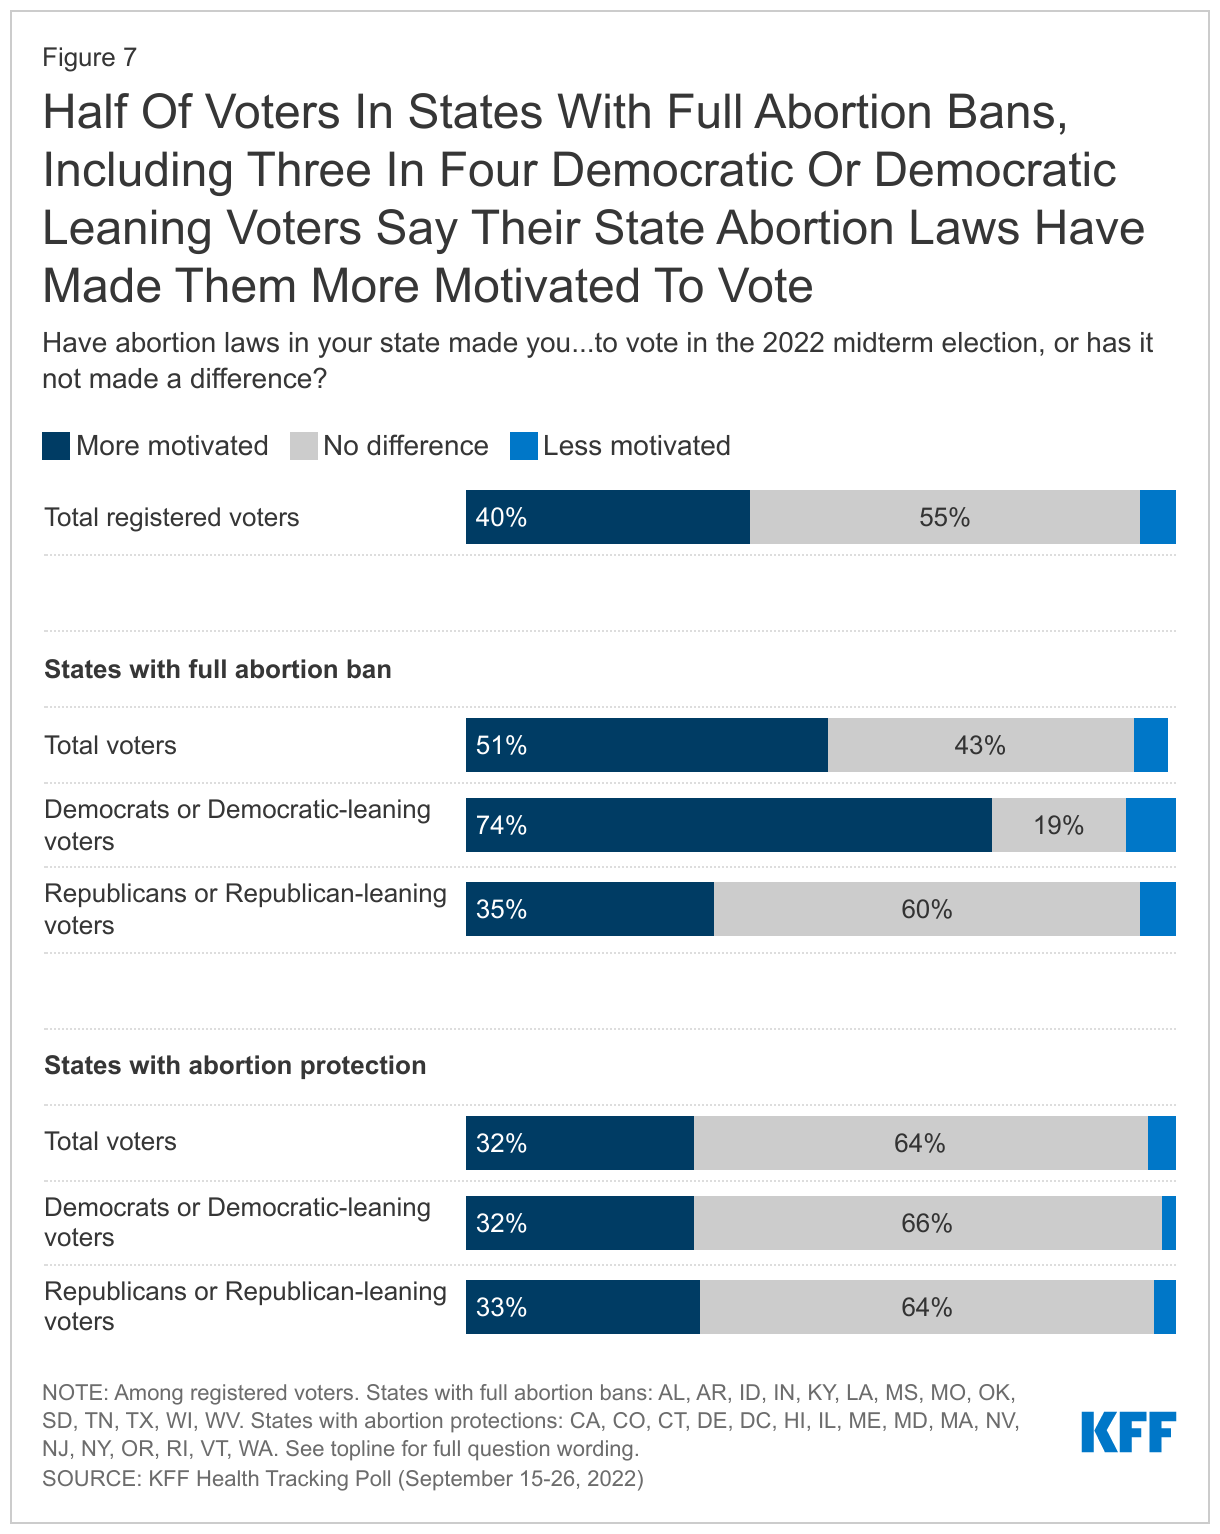
  • The Supreme Court’s decision overturning Roe v. Wade is continuing to motivate some voters as half of voters (50%) now say the Court’s decision has made them more motivated to vote, up from 43% who said the same in July and an increase of 13 percentage points from a similar question in May. In addition, state actions on abortion are also motivating voters, particularly in the states where full abortion bans are now in place. Overall, four in ten voters say their state’s abortion laws have made them more motivated to vote, but this increases to 51% among voters living in states with full abortion bans. In addition, three in four Democratic or Democratic leaning independent voters (74%) living in states with full abortion bans in place say their state abortion laws have made them more motivated to vote.
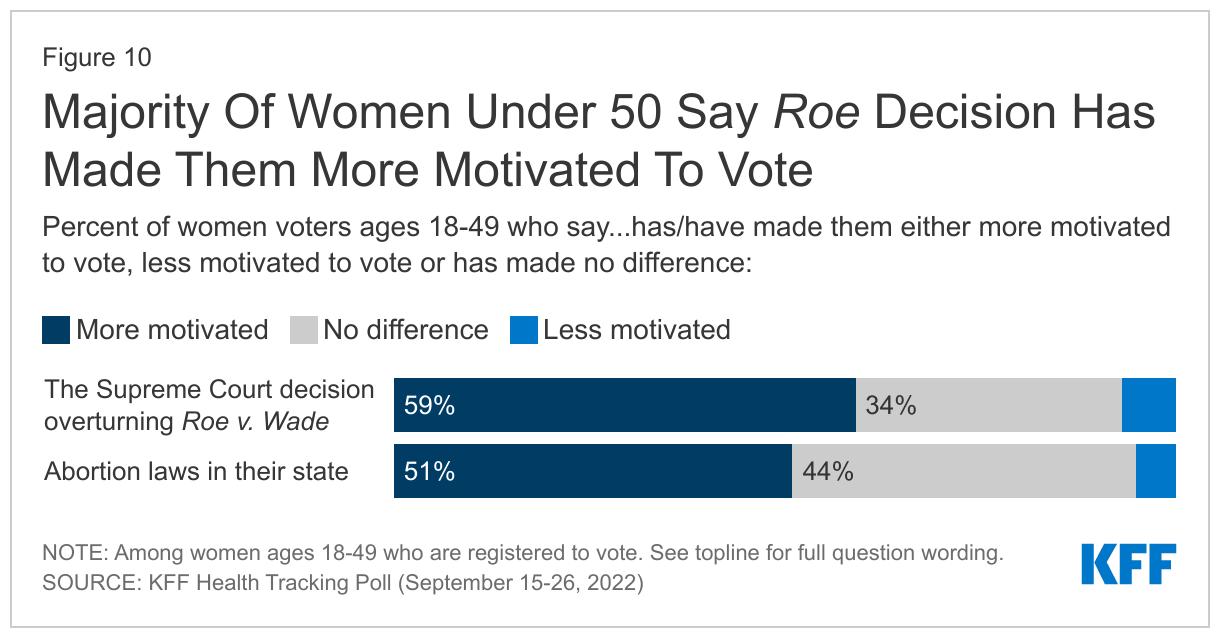
  • The legality of abortion in the wake of the Dobbs decision also continues to resonate with women voters, ages 18 to 49. More than four in ten (44%) women voters, ages 18-49, say they are more motivated to vote this year compared to previous elections, and most of them (59%) say the Supreme Court decision overturning Roe v. Wade has made them more motivated to vote. In addition, when asked to say in their own words why they are more motivated to vote, one in seven of this group offers reasons related to the Supreme Court decision, such as the issue of abortion and reproductive rights (9%) and protecting women’s rights (4%).
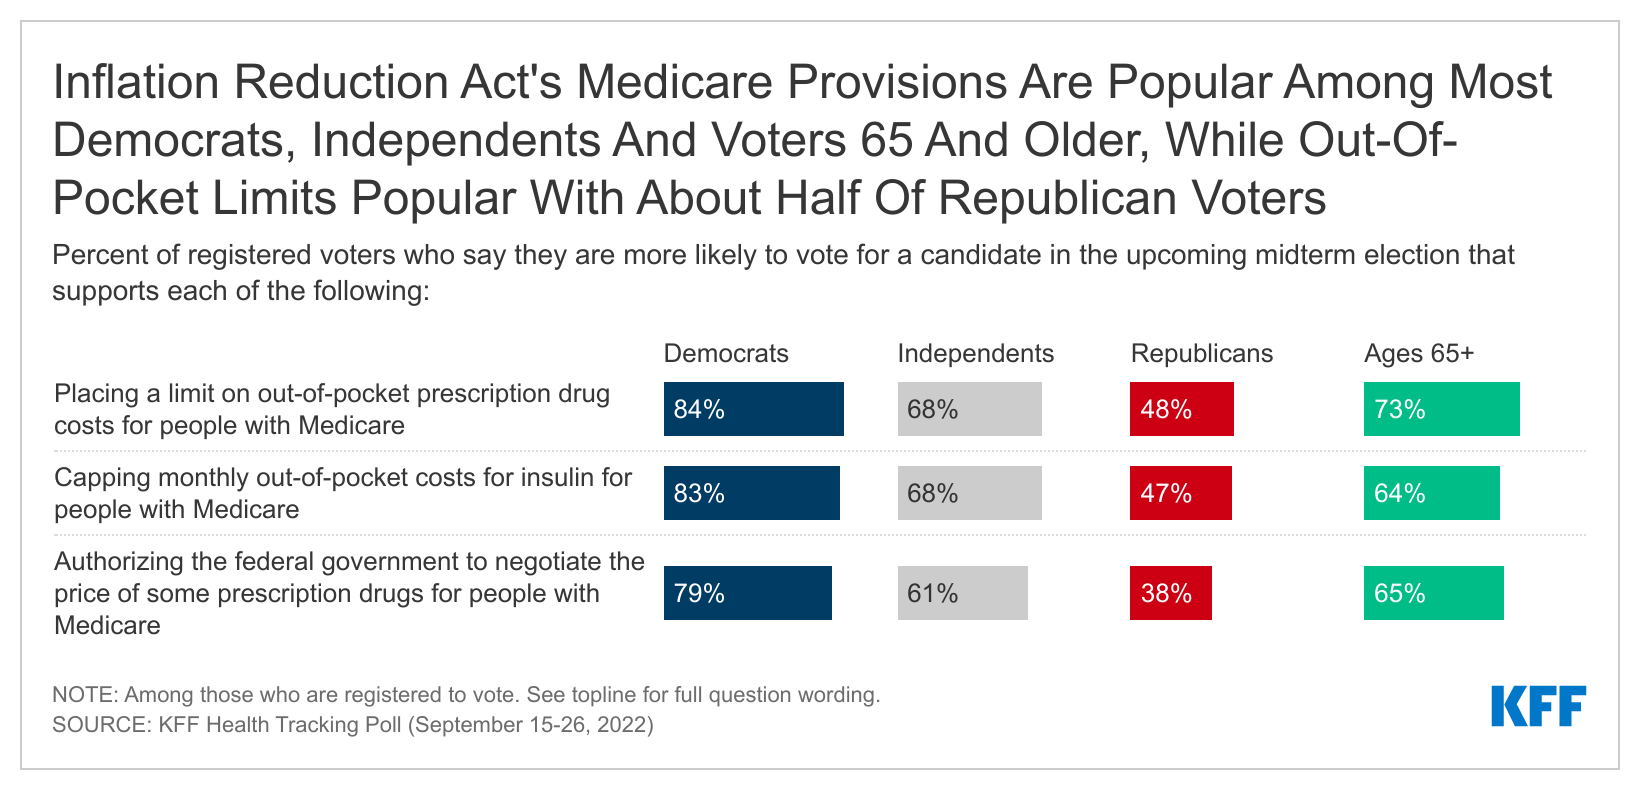
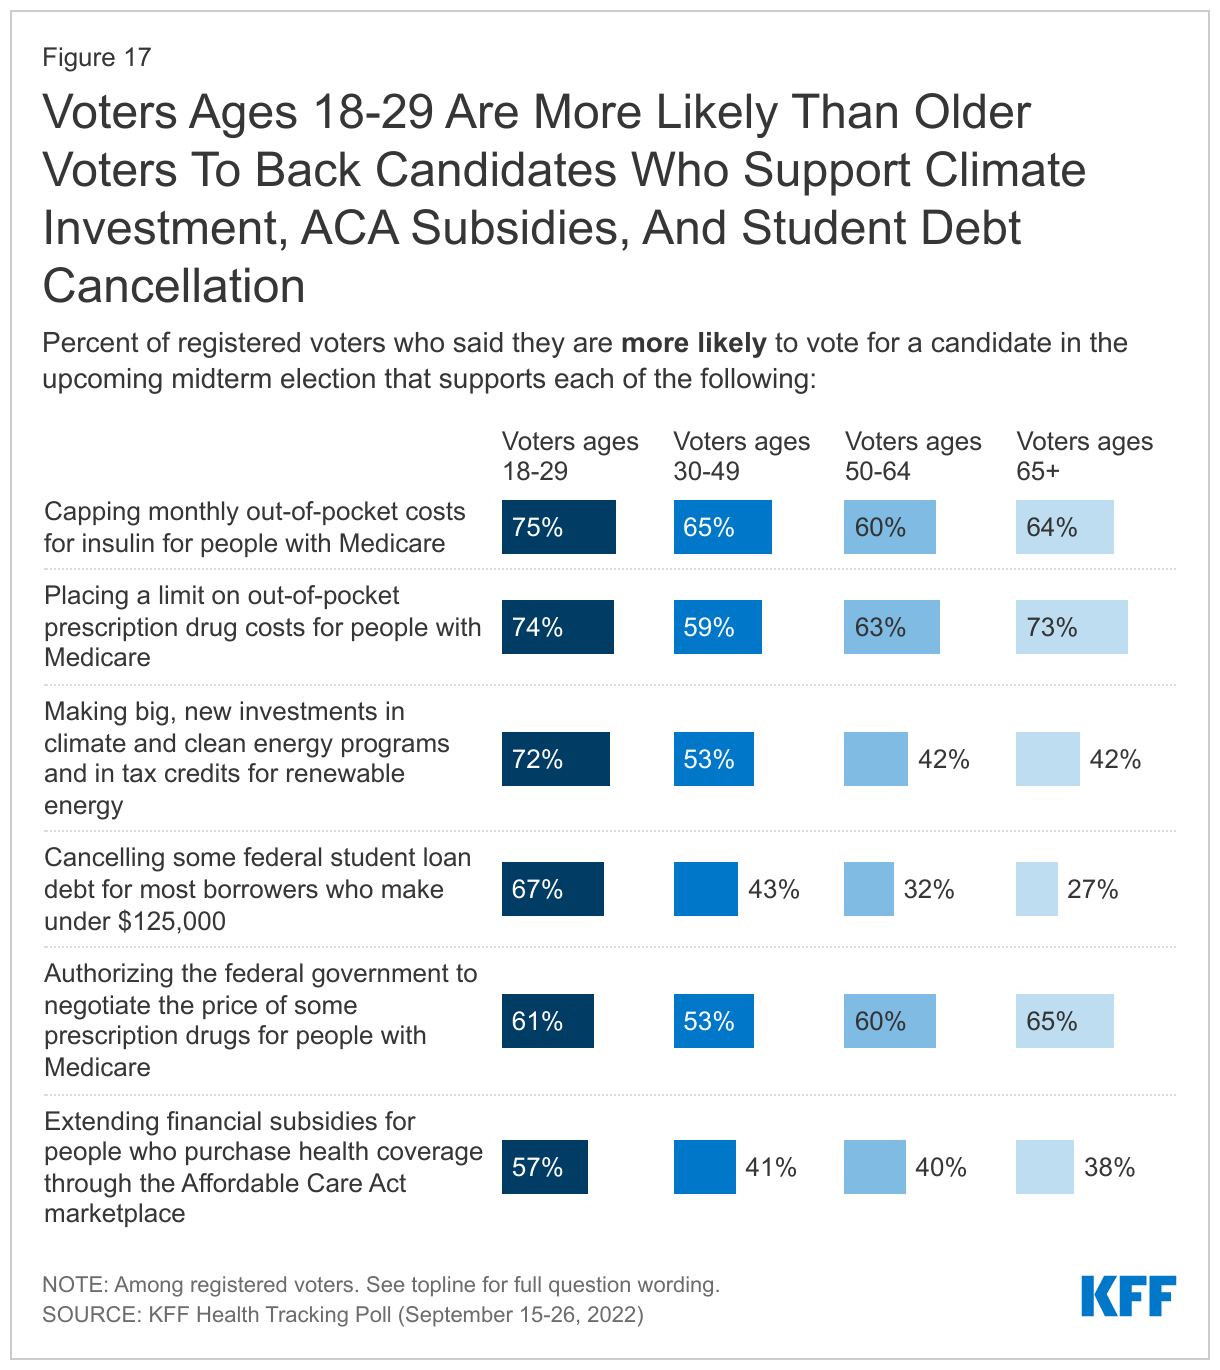
  • With abortion dominating the issue of health care so far in the 2022 midterm election, the KFF Health Tracking Poll also examines whether the health care provisions in the Inflation Reduction Act are resonating with certain groups of voters. While adults are aware of some of the key health provisions that are included in the law, some of the provisions aimed at lowering the cost of prescription drugs for people with Medicare are resonating with some voters, including those ages 65 and older. About two-thirds of voters ages 65 and older say they are more likely to vote for a candidate who supports capping out-of-pocket costs for insulin for people with Medicare (64%) or authorizing the federal government to negotiate the price of some prescription drugs for people with Medicare (65%), and three-fourths of older voters (73%) say they are more likely to vote for a candidate who supports placing a limit on out-of-pocket drug costs for people with Medicare.

What Is Motivating Voters Ahead of the Midterm Elections?

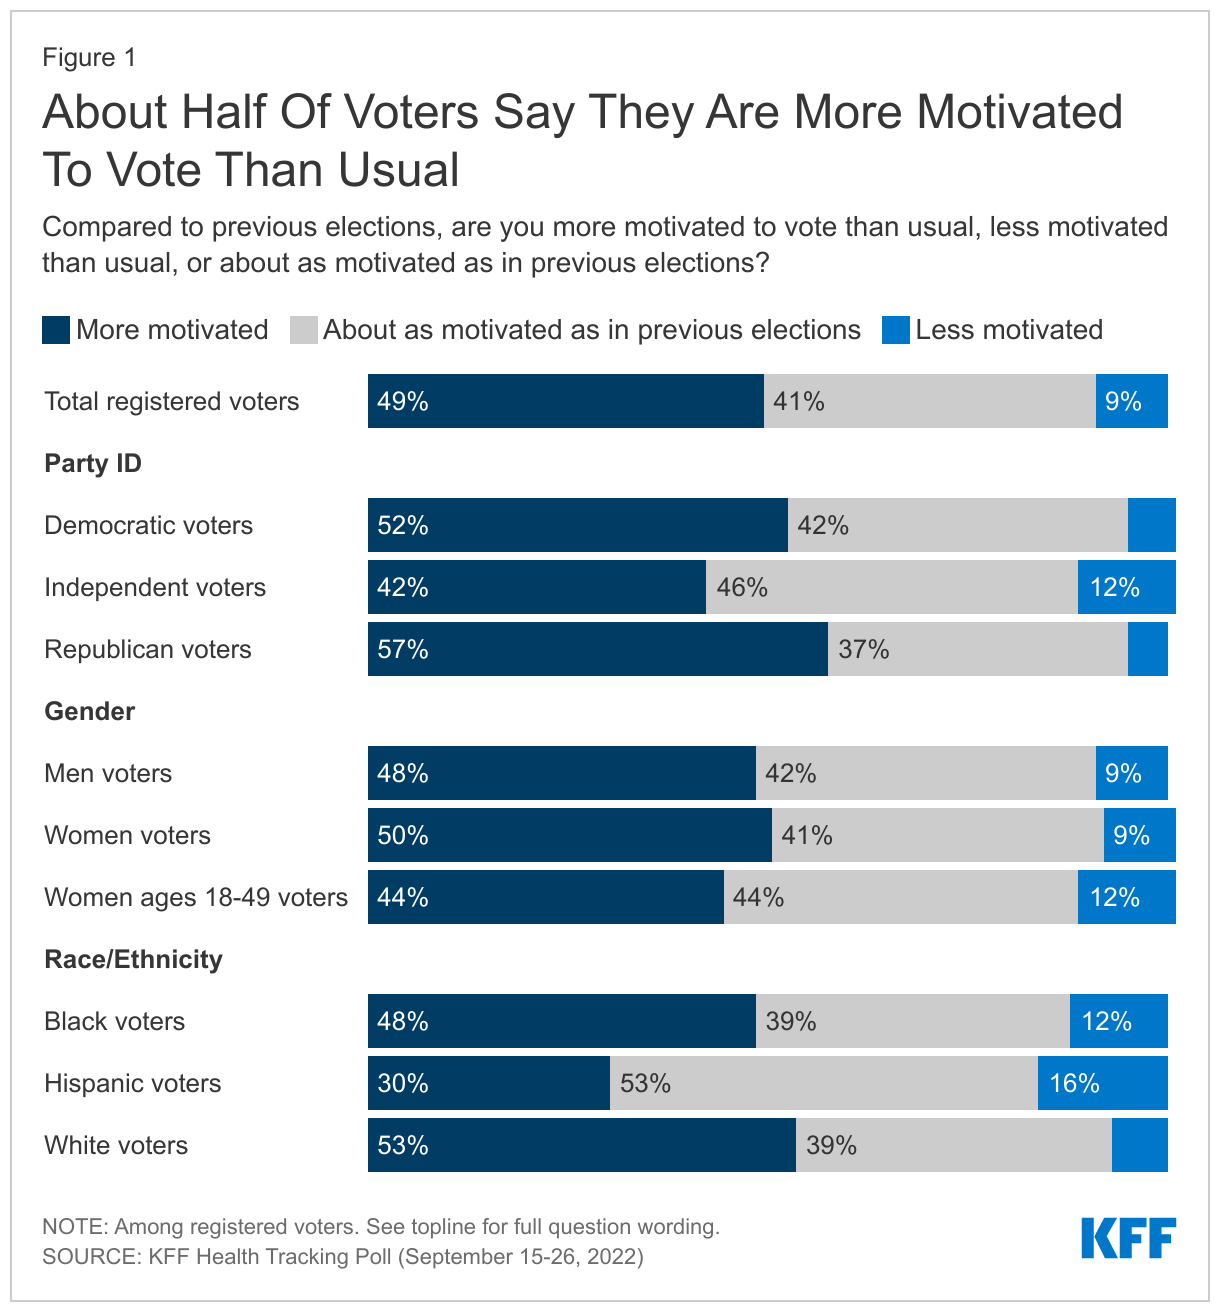
With the upcoming midterm election only a month away, about half of registered voters (49%) say they are more motivated to vote compared to previous elections. About four in ten (41%) say they are about as motivated as they have been in past elections and one in ten (9%) say they are less motivated to vote. No party holds a motivation advantage at this point in the election with similar shares of Republican voters (57%) and Democratic voters (52%) saying they are motivated to vote. Older voters have historically had higher rates of voter turnout than younger voters and the 2022 midterm election looks to be no exception with nearly six in ten adults ages 65 and older say they are more motivated to vote, compared to slightly less than half of their younger counterparts.

Across racial and ethnic groups, Hispanic voters seem to have more tepid levels of motivation to vote in the 2022 midterm election. While about half of White voters (53%) and Black voters (48%) say they are more motivated to vote, just three in ten Hispanic voters (30%) say the same. Indeed, about one in six Hispanic voters (16%) say that compared to previous elections, they are less motivated to vote.

About Half Of Voters Say They Are More Motivated To Vote Than Usual

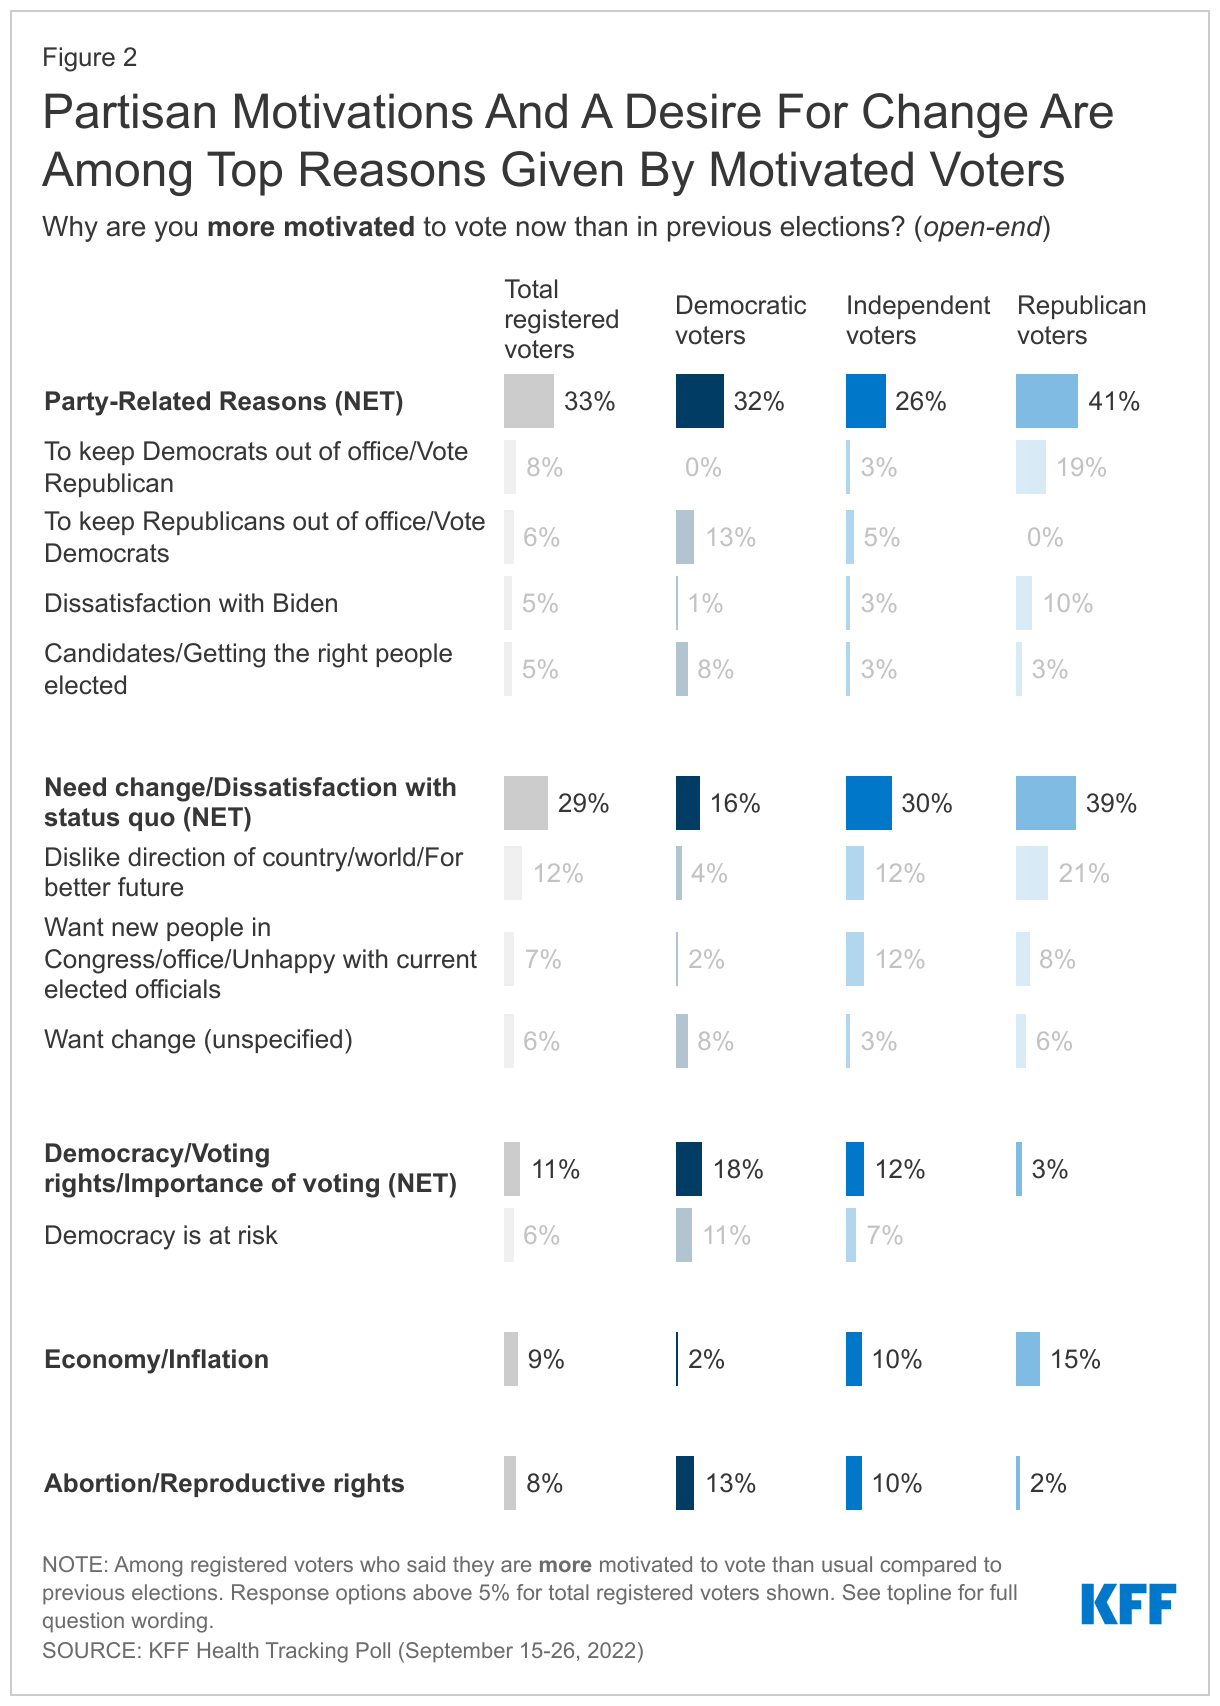
When motivated voters are asked to say in their own words why they are more motivated to vote now than in previous elections, about one in ten say they are more motivated to vote due to the economy and inflation (9%) and a similar share say their increased motivation is due to the issue abortion and reproductive rights (8%). However, reflecting the polarized state of politics in the nation, significant shares of more motivated voters give partisan reasons (33%) for their increased motivation to vote. About three in ten cite the desire for change (29%) and about one in ten motivated voters mention democracy, voting rights, and the importance of voting as a reason why they are more motivated to vote now than in previous elections.

The top issue provided by motivated Republican voters for their increased motivation is the economy (15%), while Democratic voters are more likely to offer abortion (13%) than the economy (2%) as the issue making them more eager to vote. Independent voters are divided between the two issues with similar shares offering the economy (10%) and abortion (10%) as their motivating issue. Unsurprisingly, partisanship also seems to be a key driver for both Republican and Democratic voters, with large shares of motivated voters from both parties citing party-related reasons for their increased motivation. Four in ten motivated Republicans (41%) give partisan reasons for their increased motivation including 19% who say they are more motivated to vote to either to keep Democrats out of office or to vote for Republicans, and an additional 10% mention dissatisfaction with President Biden. Among motivated Democratic voters, about a third (32%) name party-related reasons for their increased motivation, including 13% who mention wanting to keep Republicans out of office or wanting to vote for Democrats.

In Their Own Words: Why are you more motivated to vote now than in previous elections?

“We all need to vote blue. Abortion needs to be legal in all states.” – 72-year-old Democratic woman in Oregon

“Because women's rights are being threatened now more than ever and I'll be damned if I stand by and let it happen.” – 29-year-old Democratic woman in Alabama

“Personal Investments have plummeted, my grocery bill is astronomical, fuel cost is out of control, bail reform in NYS and criminals across the country are not being punished!” – 48-year-old Republican man in New York

“To vote out them Dems that are destroying the country.” – 58-year-old Republican woman in Connecticut

“To help protect women's rights.” – 40-year-old Democratic man in Georgia

Partisan Motivations And A Desire For Change Are Among Top Reasons Given By Motivated Voters

Among voters who say they are less motivated to vote now compared to previous elections, 16% cite not believing in the election process as a reason why they are less motivated and similar shares mention disliking the candidates (15%) and not thinking their vote matters or will count (12%).

In Their Own Words: Why are you less motivated to vote now than in previous elections?

“Voting really does not matter. It is all rigged.” – 55-year-old Republican woman in Minnesota

“Because I don't believe in the promises that the candidates are making.” – 44-year-old Democratic woman in New York

“The candidates are all disappointing. No matter who is in office they all work for the same government. Things are getting worse and worse”. – 49-year-old Democratic woman in Texas

“I don't believe in either side anymore. I am through with politics.” – 61-year-old independent man in California

“Because our votes don't matter.” – 37-year-old Republican man in Kansas

“I would never vote republican but I'm not always happy to vote democrat.” – 24-year-old Democratic man in Texas

The Top Issues For Voters

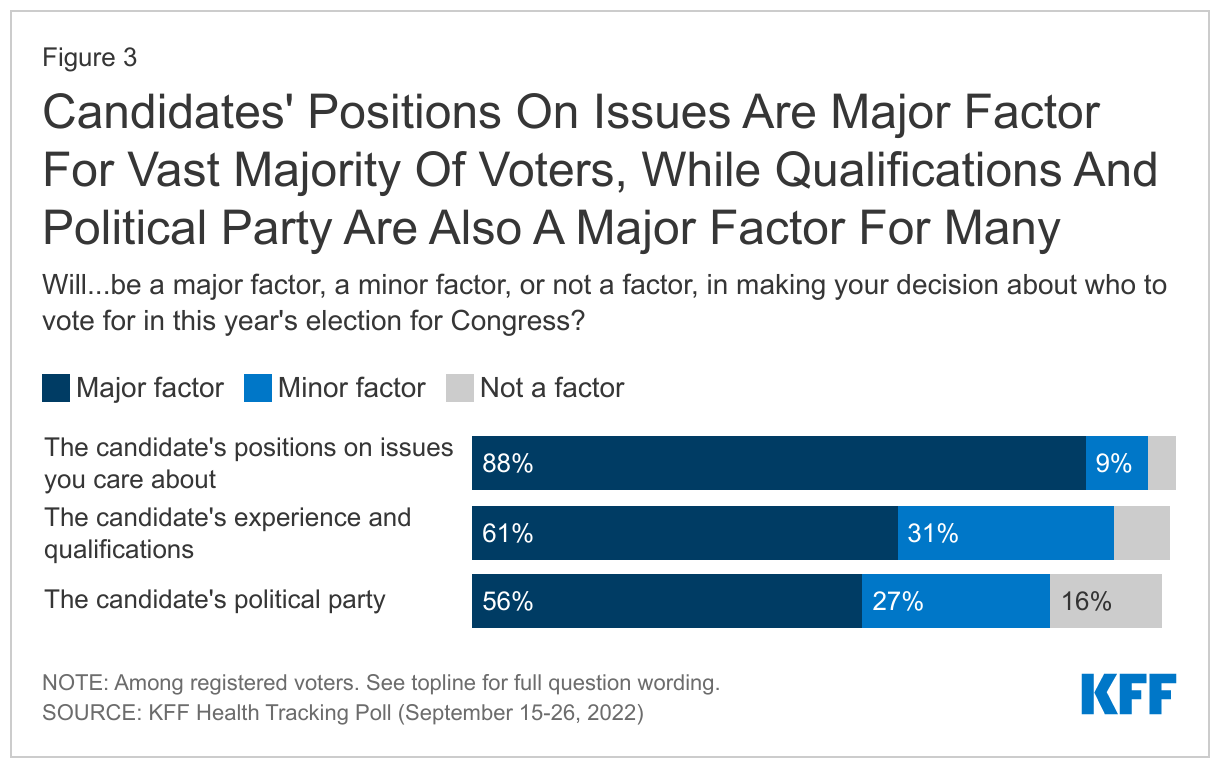
An overwhelming majority (88%) of voters say that a candidate’s positions on issues they care about will be a “major factor” in deciding how they vote for Congress this year, highlighting the importance of how candidates talk about the top issues for voters over the next few weeks. Most voters also say the candidate’s experience (61%) and political party (56%) is a “major factor” in their voting decision.

Candidates' Positions On Issues Are Major Factor For Vast Majority Of Voters, While Qualifications And Political Party Are Also A Major Factor For Many

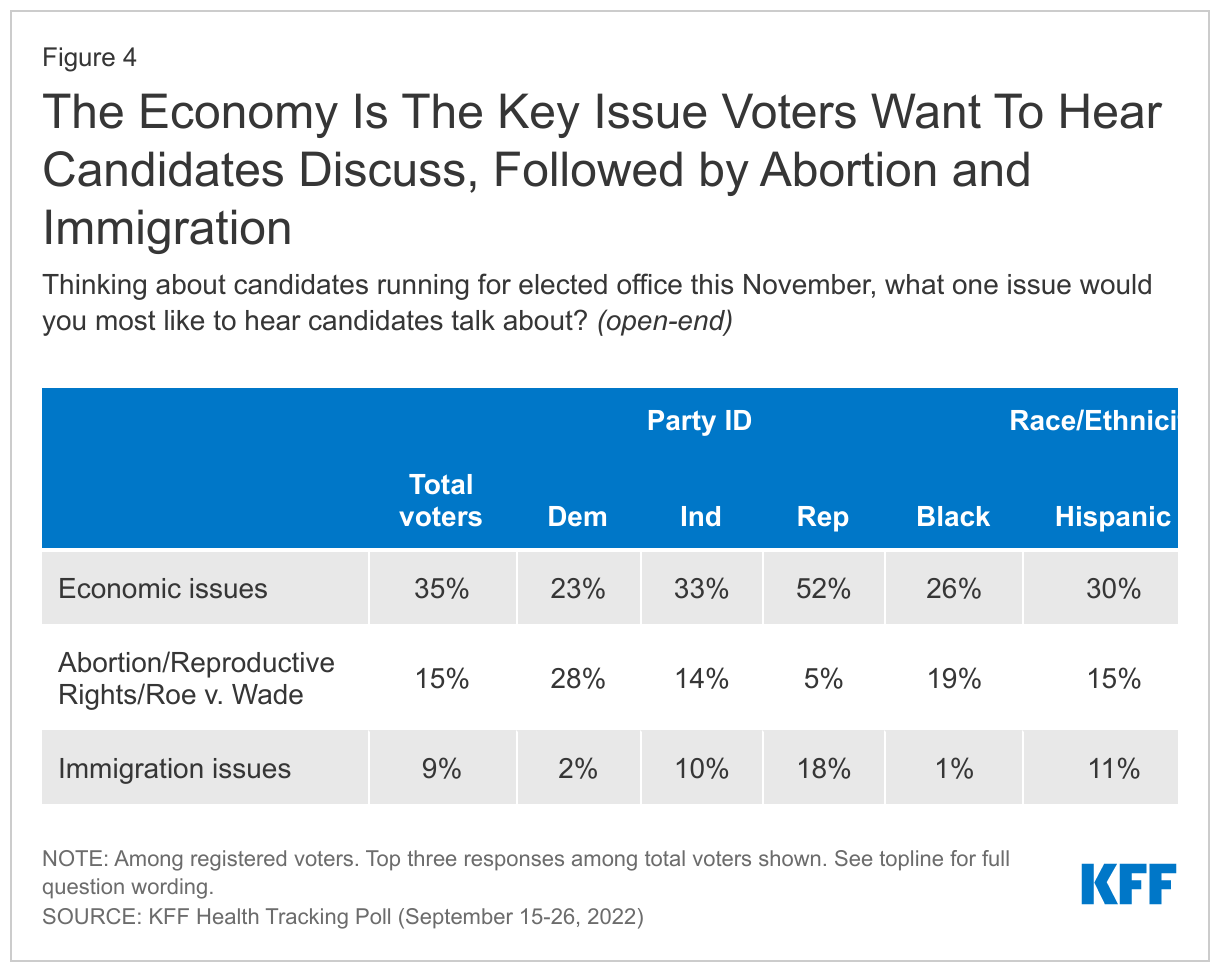
Given the overwhelming majority of voters who say a candidate’s positions on issues will be major factor in their vote, the latest KFF Health Tracking poll asked voters to name in their own words the one issue they would most like to hear candidates talk about. Economic issues, including inflation, emerge as the key issue ahead of the November midterm election with 35% of voters saying that is what they want to hear candidates talk about. Beyond economic issues, notable shares of voters say they would like to hear candidates talk about abortion, Roe v. Wade, and reproductive rights (15%), and about immigration (9%).

Across partisans, the economy is clearly the top issue for Republicans and for independents. Half of Republican voters (52%) and one-third of independent voters say they want to hear candidates talk about economic issues, including inflation. Immigration is the second most mentioned issue by Republican voters (18%) whereas among independent voters, 14% say they want candidates to discuss abortion and reproductive rights, while one in ten (10%) want to hear about immigration. Democratic voters are somewhat divided on what they want to hear candidates discuss, with nearly three in ten (28%) who say they want to hear about abortion and reproductive rights, while a quarter of Democratic voters (23%) want to hear about candidates talk about the economy.

The economy also stands as the most prominent issue across racial and ethnic groups with nearly four in ten White voters (39%), three in ten Hispanic voters (30%), and a quarter of Black voters (26%) saying they want to hear candidates talk about economic issues ahead of the election. However, abortion also emerges as a key issue, particularly for Black voters as nearly one in five say they want to hear candidates talk about it.

The Economy Is The Key Issue Voters Want To Hear Candidates Discuss, Followed by Abortion and Immigration

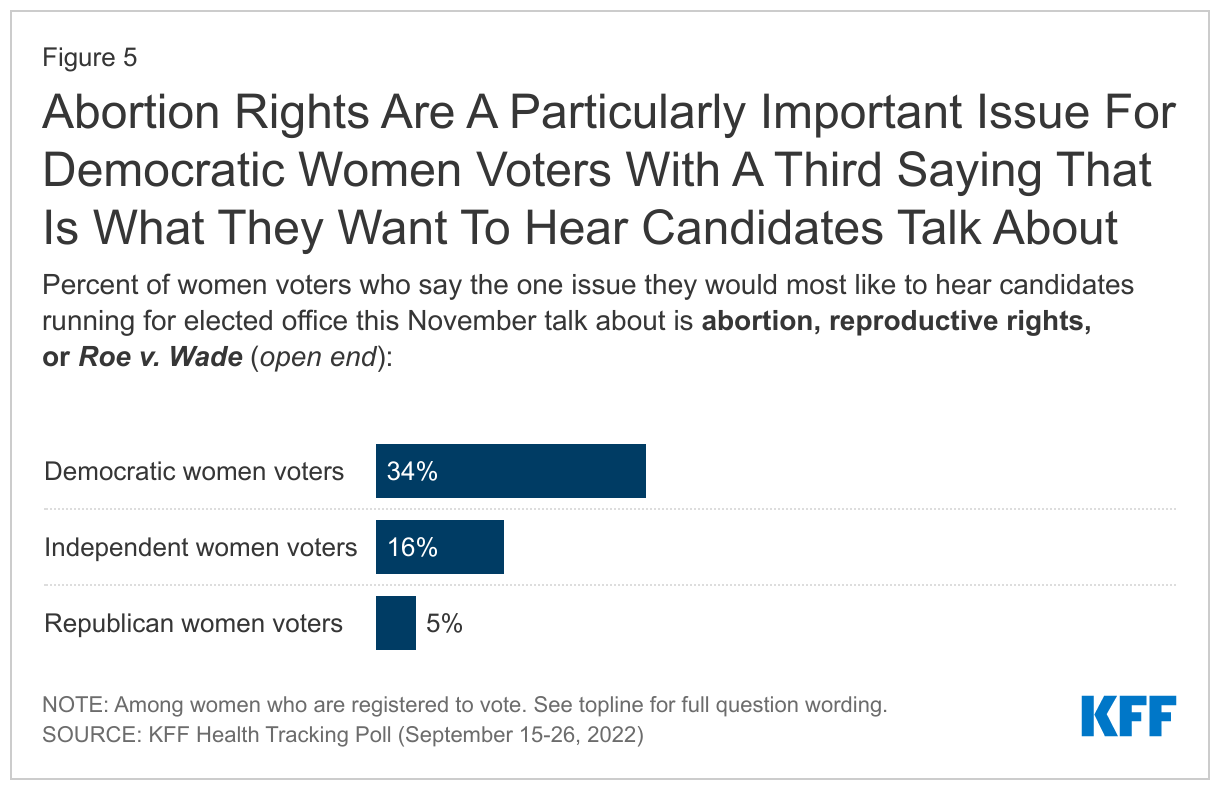
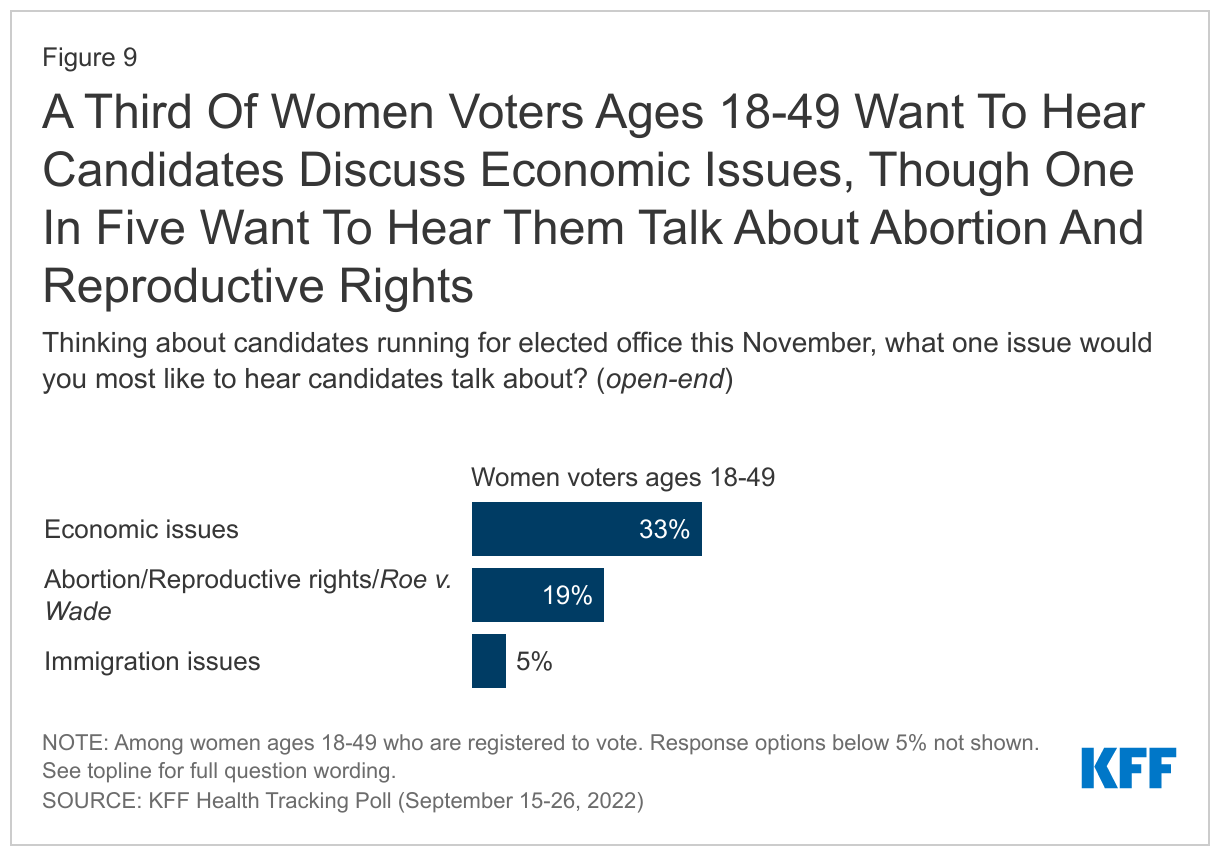
Women voters are more likely than men to say they want to hear the candidates discuss abortion, reproductive rights and Roe v. Wade (19% vs. 11%), though the economy is the top issue for both groups (34% and 37% respectively). Abortion rights are particulalrly important among Democratic women – a third of Democratic women (34%) say they want to hear candidates talk about abortion, more than twice the share of independent women (16%) and nearly seven times the share of Republican women (5%) who say the same.

Abortion Rights Are A Particularly Important Issue For Democratic Women Voters With A Third Saying That Is What They Want To Hear Candidates Talk About

How Changes In Abortion Policies Are Motivating Midterm Voters

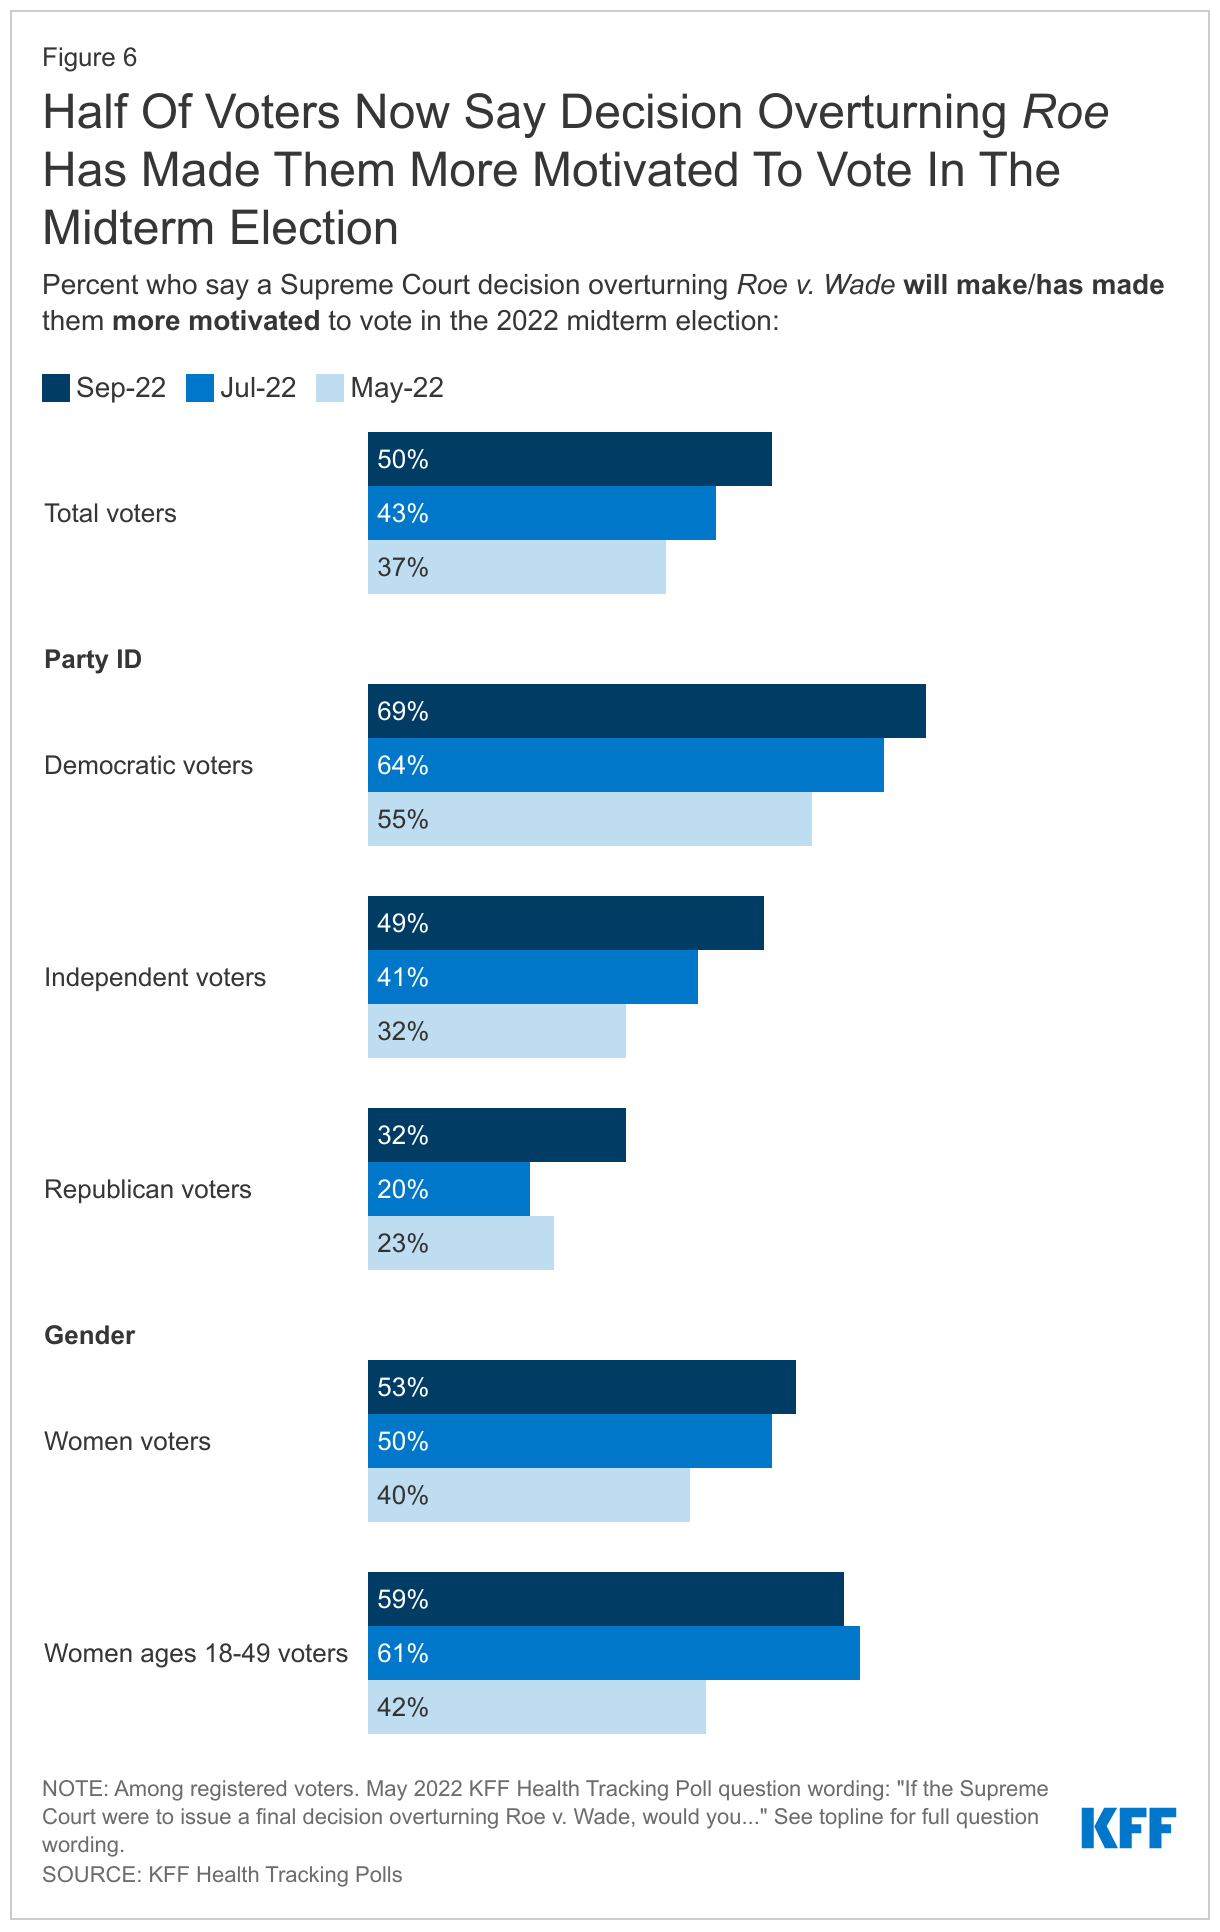
In the wake of the Dobbs decision overturning Roe v. Wade and a number of states taking legislative action to restrict abortion, the latest KFF poll finds that half of voters (50%) say the Supreme Court’s decision has made them more motivated to vote, up from 43% who said the same in July and an increase of 13 percentage points from a similar question in May, before the Court had issued its decision but after a draft of the forthcoming decision was leaked. A majority of women voters, ages 18 to 49, (59%) continue to say the Supreme Court decision overturning Roe v. Wade has made them more motivated to vote, relatively unchanged from the July KFF poll.

Half Of Voters Now Say Decision Overturning Roe Has Made Them More Motivated To Vote In The Midterm Election

The Dobbs decision seems to be motivating voters who want to vote for candidates who support abortion access more than those voters who want candidates to limit access. Voters who say they are more motivated to vote in this election compared to previous ones are about twice as likely to say they plan on voting for candidates who want to protect access to abortion (58%) than for candidate who want to limit abortion access (27%).

In addition, among those who say the Supreme Court decision itself has made them more motivated, three in four (76%) say they plan on voting for candidates who want to protect access to abortion compared to 17% who say they plan on voting for candidates who want to limit abortion access.

Similarly, with abortion laws being determined at the state level, many voters (40%) say their state’s abortion laws have made them more motivated to vote in the 2022 midterm election. Notably, voters in states with an abortion ban1  in place (51%) are more likely than those in states with protections for abortion access (32%) to say their state abortion laws have made them more motivated to vote. State abortion bans appear to be particularly motivating for Democrats as three in four Democratic or Democratic-leaning voters in states that have full abortion bans say their state abortion laws have made them more motivated to vote in the midterm election.

Half Of Voters In States With Full Abortion Bans, Including Three In Four Democratic Or Democratic Leaning Voters Say Their State Abortion Laws Have Made Them More Motivated To Vote

On both, the Supreme Court decision and recent state actions, larger shares of Democratic voters say each has made them more motivated to vote than Republican voters. Similarly, Black voters are more likely than their White counterparts to say both Supreme Court’s decision and their state abortion laws have made them more motivated to vote. About half of women voters say the Court’s decision overturning Roe (53%) and their state abortion laws (46%) have increased their motivation to vote. Notably, Republican women voters are somewhat more likely than their Republican male counterparts to say the abortion laws in their state have made them more motivated to vote (36% vs. 24%), though half of both Republican women (50%) and men (50%) say they plan to vote for candidates who want to limit access to abortion.

Half Of Voters, Including Nearly Six In Ten Women Under 50, Say Supreme Court Decision Has Made Them More Motivated To Vote; Four In Ten Voters Are Motivated By Their State Abortion Laws

How The Dobbs Decision Is Motivating Women Voters Of Reproductive Age

KFF polling from July 2022 found that more than seven in ten women voters under the age of 50 said the issue of abortion access would be very important in making their decision about who to vote for in the midterm election. The latest KFF Health Tracking poll finds that large shares of women voters under 50 remain more motivated to vote due to the Supreme Court’s decision overturning Roe v. Wade, and that most are planning to vote for candidates who will protect abortion access.

Several months since the Supreme Court overturned Roe, the issue of reproductive rights remains salient for women voters ages 18 to 49, the group most directly impacted by the Court’s decision. While a third of women voters under age 50 say they want to hear candidates discuss economic issues, one in five (19%) say the issues they most want to hear them talk about are abortion, reproductive rights, and Roe v. Wade.

A Third Of Women Voters Ages 18-49 Want To Hear Candidates Discuss Economic Issues, Though One In Five Want To Hear Them Talk About Abortion And Reproductive Rights

Overall, 44% of women voters under age 50 say, compared to previous elections, they are more motivated to vote in November. The issue of abortion and reproductive rights resonated with these younger women voters as about six in ten women voters ages 18 to 49 (59%) say the Supreme Court decision overturning Roe v. Wade has made them more motivated to vote, and half (51%) say their state abortion laws have increased their motivation to go to the polls.

Majority Of Women  Under 50 Say Roe Decision Has Made Them More Motivated To Vote

Similar to overall voters who say they are motivated by the Dobbs decision, women voters 18 to 49 who are now more motivated to vote also are more likely to vote for candidates who support abortion access. Eight in ten women voters 18-49 who say they are more motivated to vote because of the Supreme Court decision on Roe say they will vote for a candidate who wants to support abortion access (79%).

State Abortion Restrictions

Following the Dobbs decision, fourteen states now have full bans on abortion. For the latest breakdown of key facts about abortion access in the U.S., see the KFF Abortion in The U.S. Dashboard.

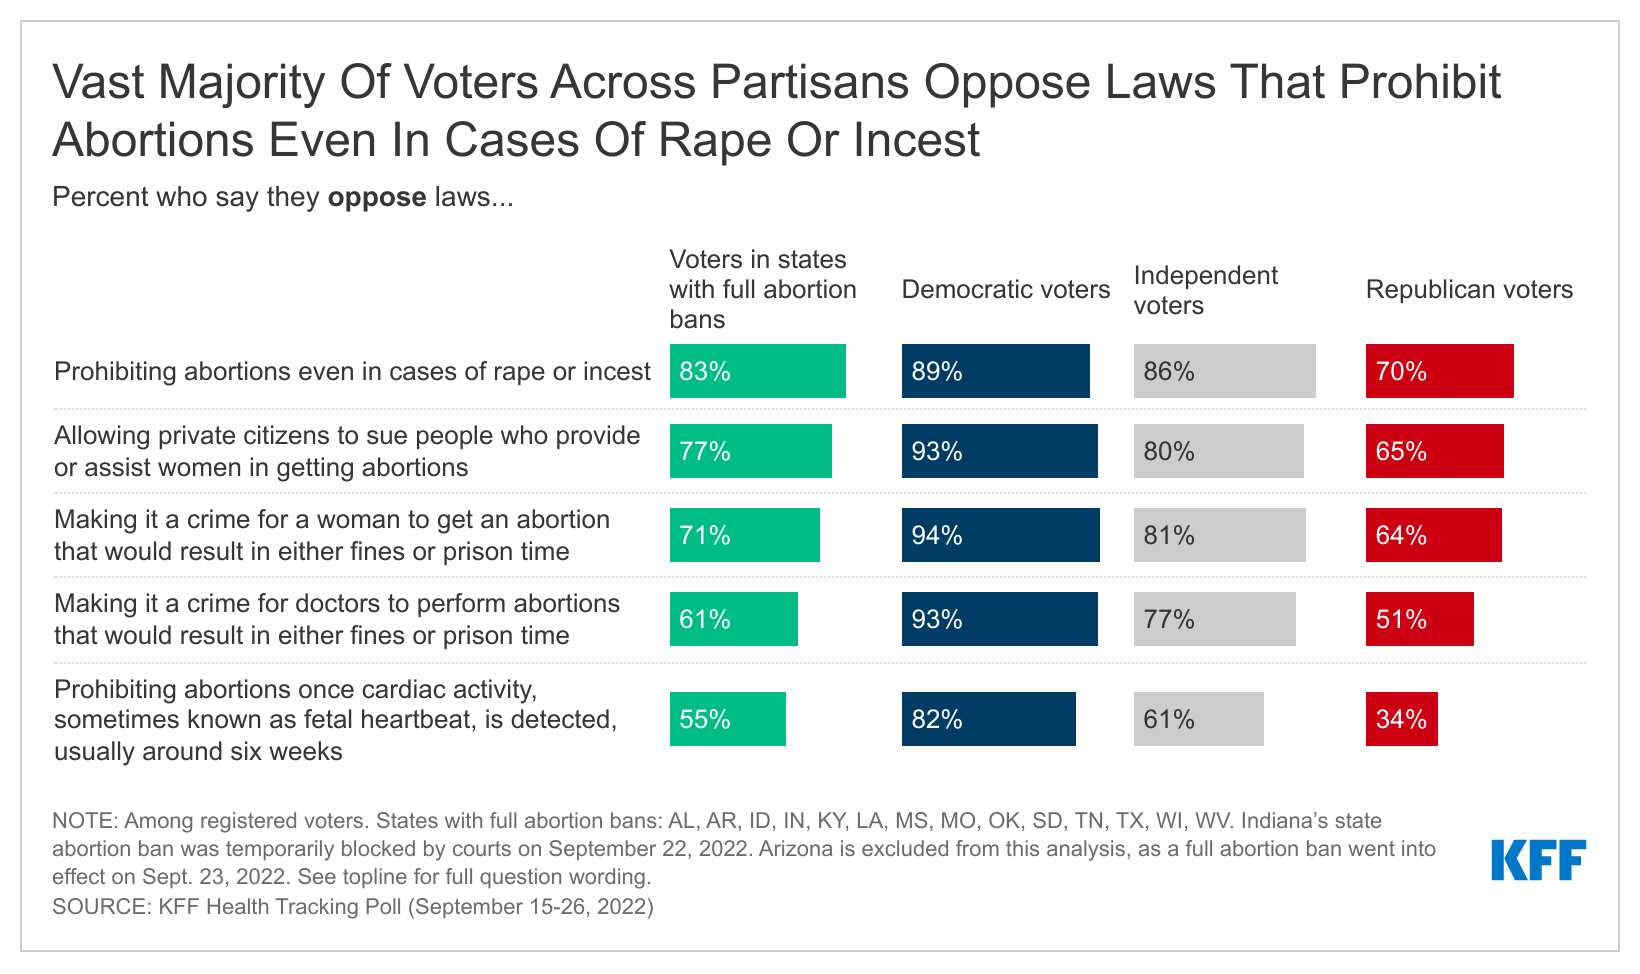
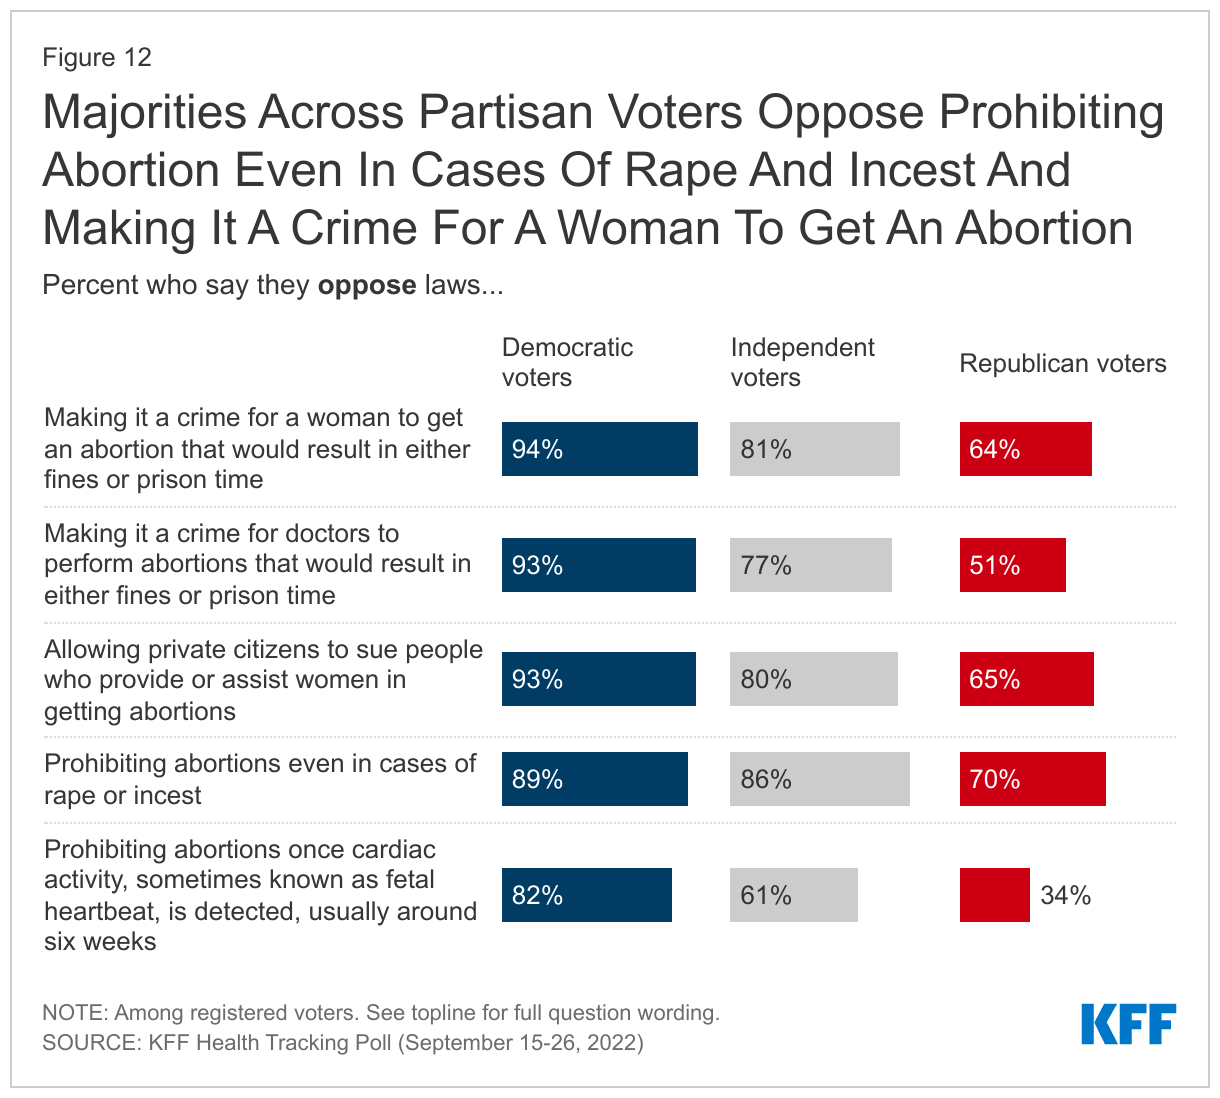
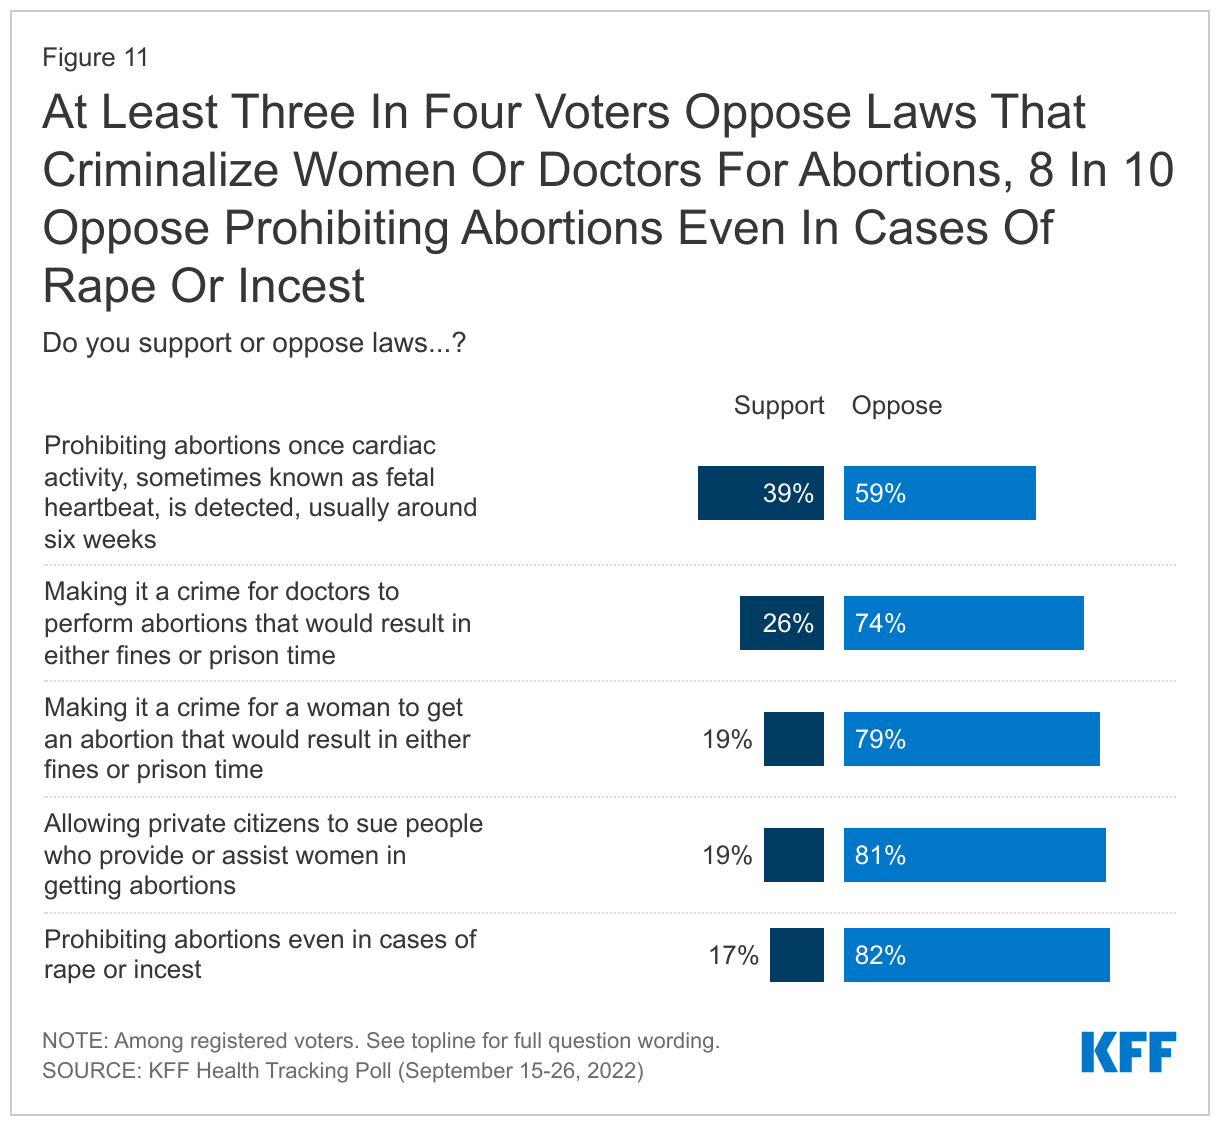
Most voters remain opposed to punitive abortion restrictions, with more than seven in ten voters opposed to making it a crime for doctors to perform abortions (74%) or for women to get abortions (79%) or allowing private citizens to sue people who provide or assist in abortions (81%). Six in ten voters (59%) oppose prohibiting abortions after a fetal heartbeat is detected and eight in ten (82%) oppose prohibiting abortion even in cases of rape or incest – a restriction that is currently in-place in states such as Texas, Tennessee, South Dakota, Missouri, Louisiana and Kentucky among others.

At Least Three In Four Voters Oppose Laws That Criminalize Women Or Doctors For Abortions, 8 In 10 Oppose Prohibiting Abortions Even In Cases Of Rape Or Incest

Though a majority of Republican voters (70%) approve of the Supreme Court’s decision overturning Roe v. Wade, majorities across partisan voters – including most Republicans – are opposed to laws prohibiting abortion even in cases of rape or incest, laws making it a crime for women to get an abortion that would result in either fines or prison, and laws allowing private citizens to sue people who provide or assist women in getting abortions.

Majorities Across Partisan Voters Oppose Prohibiting Abortion Even In Cases Of Rape And Incest And Making It A Crime For A Woman To Get An Abortion

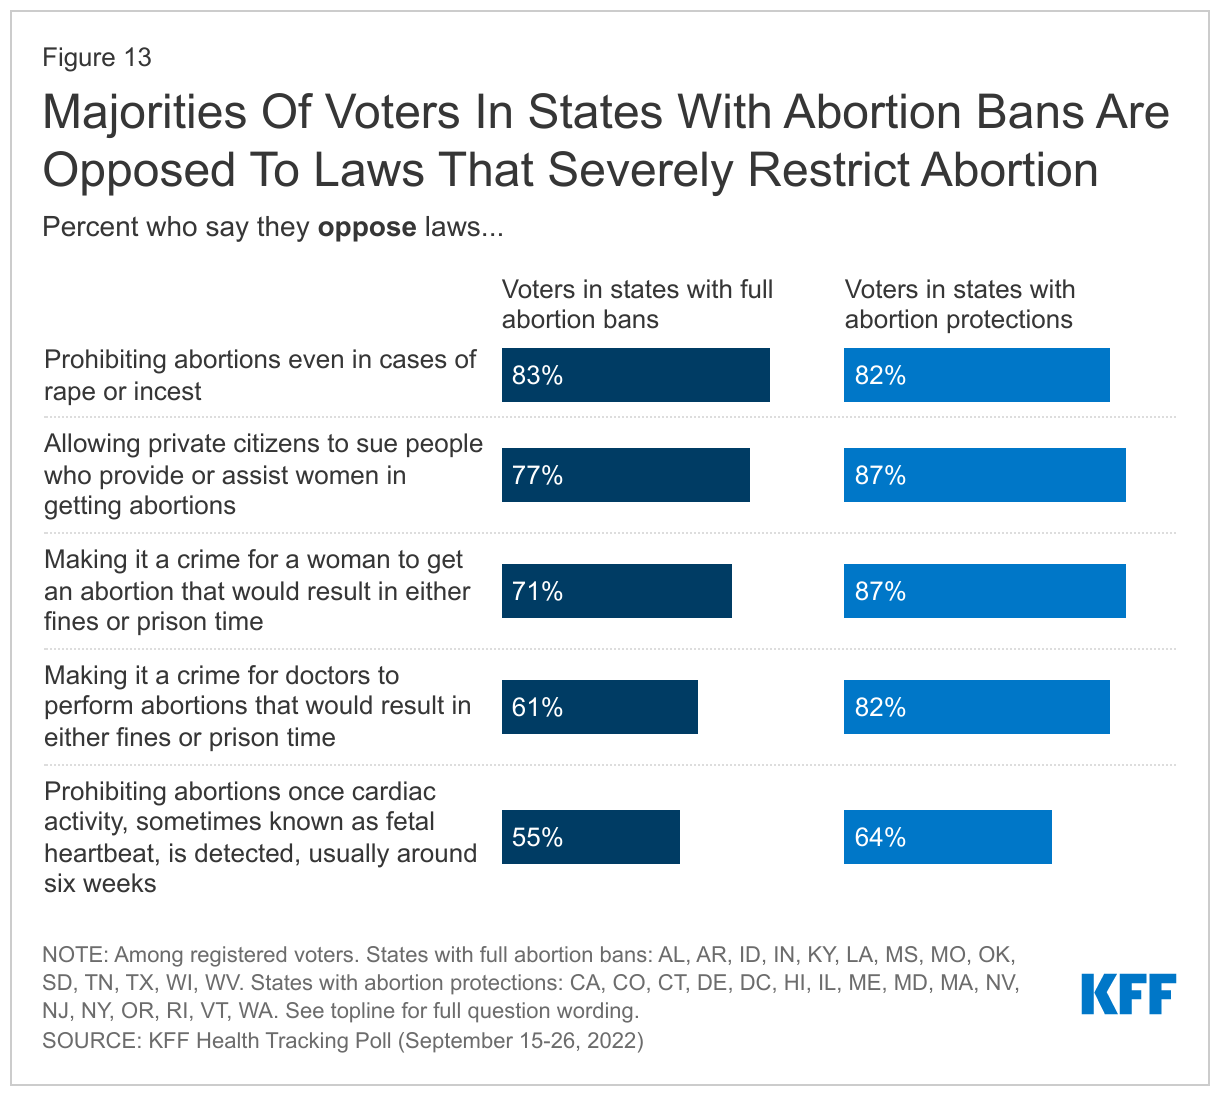
Large shares of voters living in states with abortion bans oppose many of the restrictions surveyed. More than eight in ten voters (83%) in states with full abortion bans say they oppose laws prohibiting abortion even in cases of rape and incest – which is currently the case in most of these states with full abortion bans. However, there is some support for prohibiting abortions once cardiac activity is detected among voters in states with full bans (45% support vs. 55% oppose).

Interactive DataWrapper Embed

Inflation Reduction Act Health Care Provisions And Student Loan Cancellation As Voting Issues

In the months leading up to the midterm election, which is historically viewed as a referendum on the president and their party, President Biden signed into effect the Inflation Reduction Act (IRA), a new law containing provisions related to health care and prescription drug costs, climate, and tax policy. In addition, he announced student loan debt forgiveness for many adults in the U.S. The KFF Health Tracking Poll examined how these recent Biden actions may be impacting voters ahead of the midterm elections.

The Inflation Reduction Act

Just over one month after President Biden signed the IRA into law, most of the public (77%) say they have heard or read at least a little about the new law, including majorities of adults across partisans, age groups, and racial and ethnic groups. About eight in ten adults ages 65 and older (82%), many of whom may be affected by the new law’s Medicare provisions, say they have heard at least a little about the new law and they are twice as likely as adults under age 65 to say they have heard “a lot” about it (25% vs. 12%).

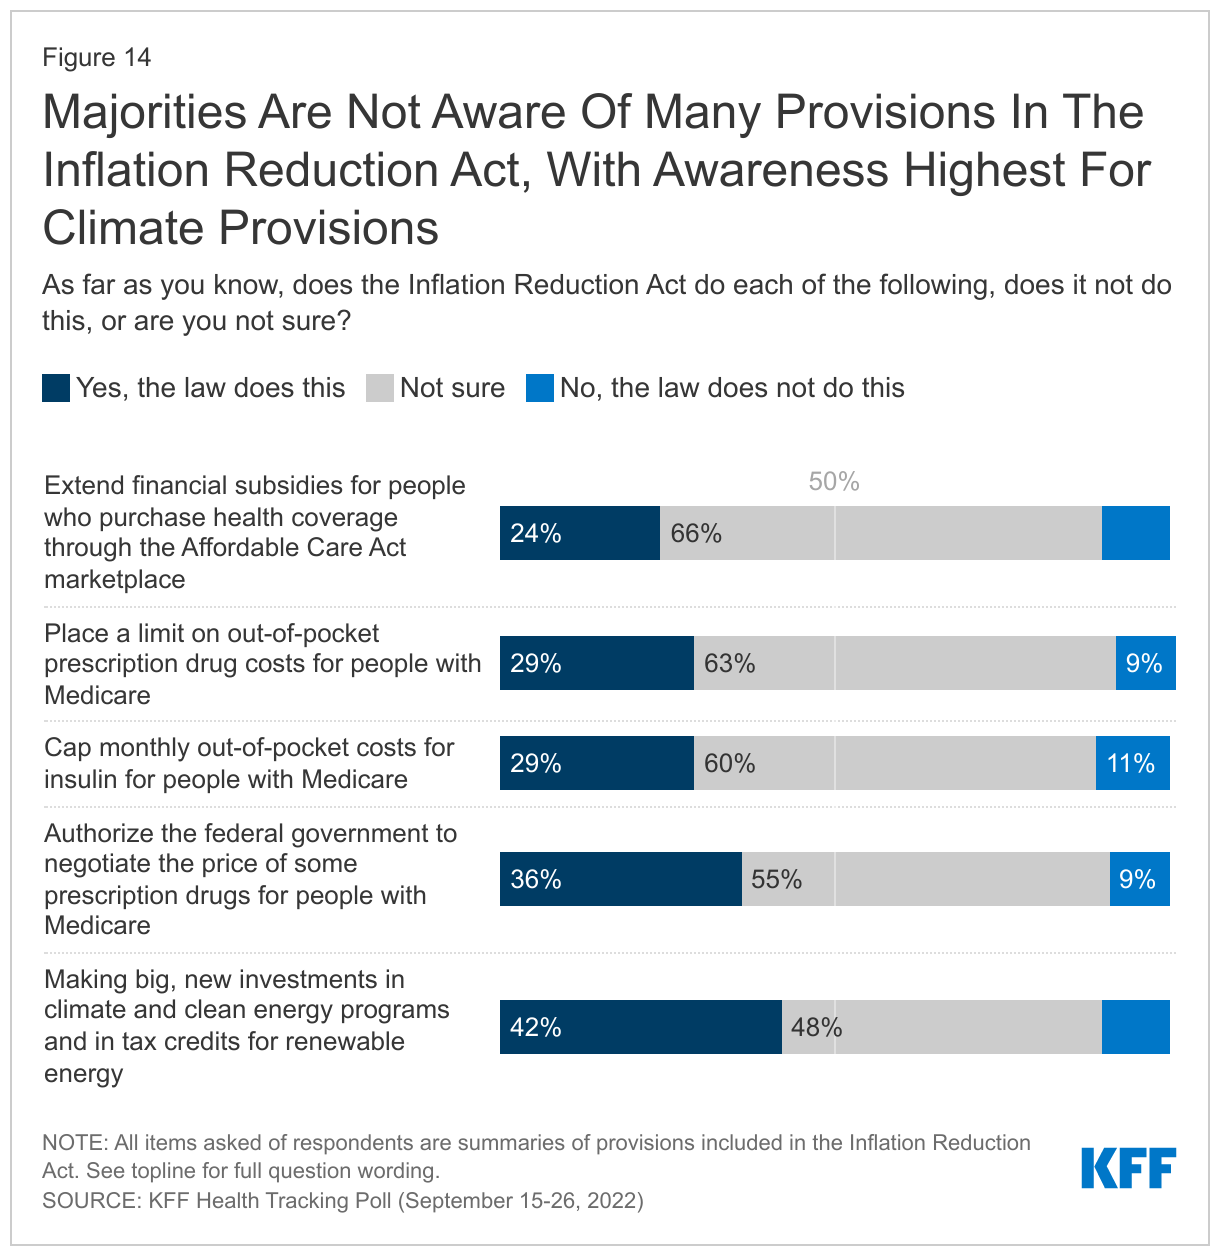
Yet, despite the fact that three in four adults have heard at least a little about the new law, few know what the law does. In fact, most adults are unaware of the law’s key health provisions. Most say they are unsure if the law extends financial subsidies for people who purchase health coverage through the Affordable Care Act marketplace (66%), places a limit on out-of-pocket prescription drug costs for people with Medicare (63%), caps monthly out-of-pocket costs for insulin for people with Medicare (60%) or authorizes the federal government to negotiate the price of some prescription drugs for people with Medicare (55%).

Awareness of the climate provisions in the new law, however, is higher compared to some of the health care elements of the law. While about half of adults (48%) say they are “not sure” if the new law makes big, new investments in climate and clean energy programs and in tax credits for renewable energy, about four in ten adults (42%) are aware the IRA does this.

Adults who say they have heard or read “a lot” or “some” about the Inflation Reduction Act are more likely than those who have only heard or read a little to know that each of the IRA provisions asked about in the survey were indeed part of the new law.

Majorities Are Not Aware Of Many Provisions In The Inflation Reduction Act, With Awareness Highest For Climate Provisions

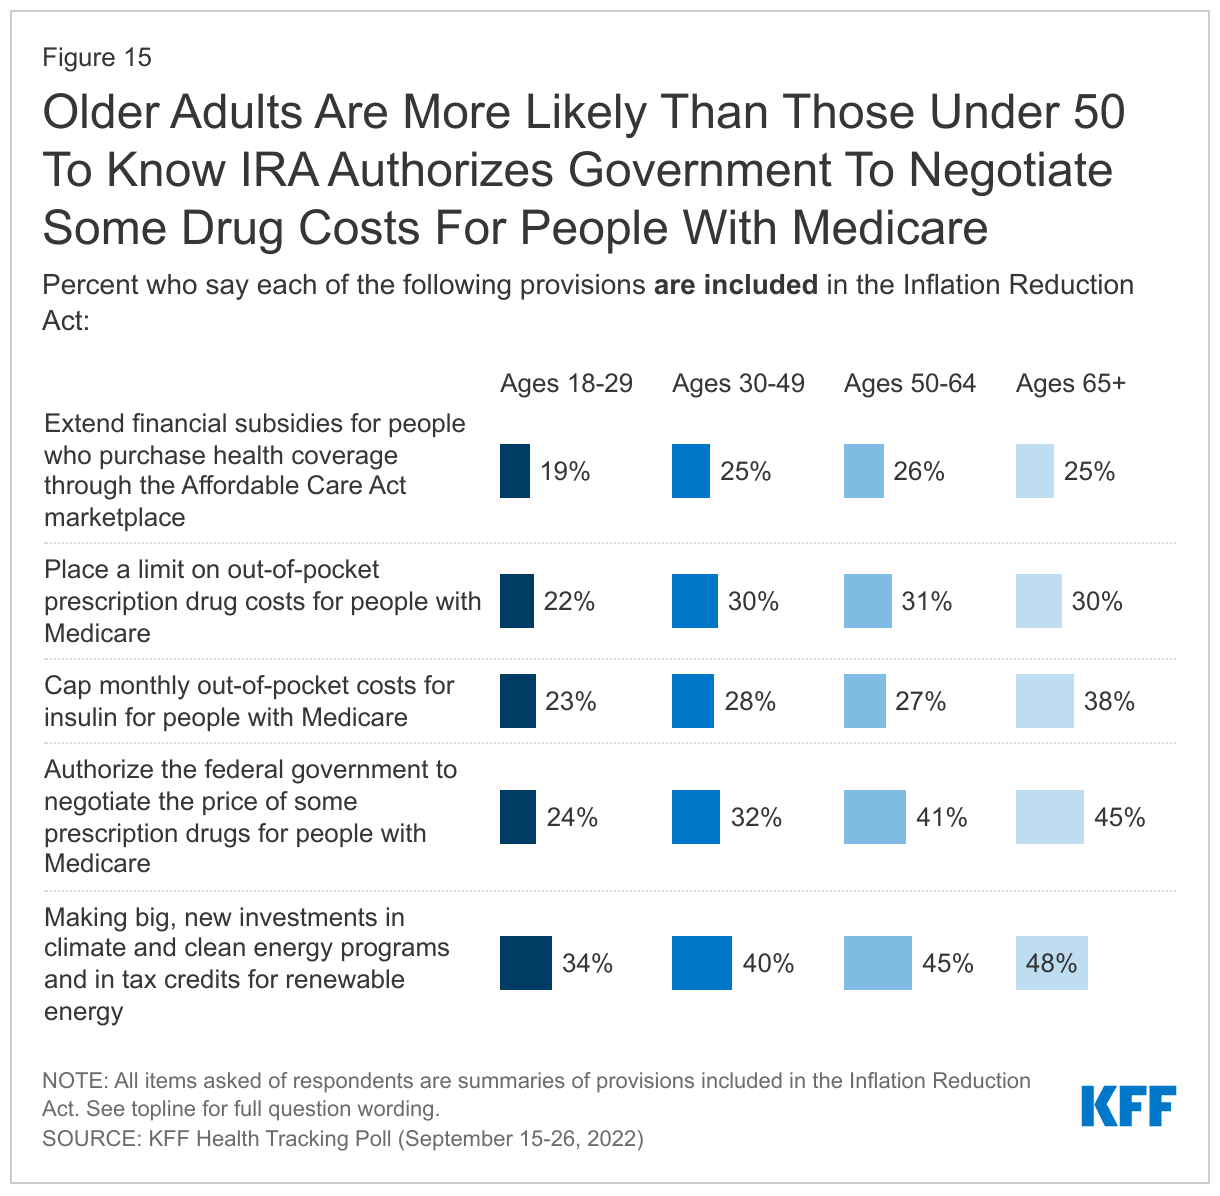
Adults ages 65 and over, a group that largely benefits from the Medicare prescription drug provisions of the law, are more likely than their younger counterparts to know that the IRA authorizes the federal government to negotiate the prices of some prescription drugs for people with Medicare (45% vs. 33% of adults 18 to 64) and to know that the bill caps monthly costs for insulin for people with Medicare (38% vs. 26% of adults 18 to 64).

Older Adults Are More Likely Than Those Under 50 To Know IRA Authorizes Government To Negotiate Some  Drug Costs For People With Medicare

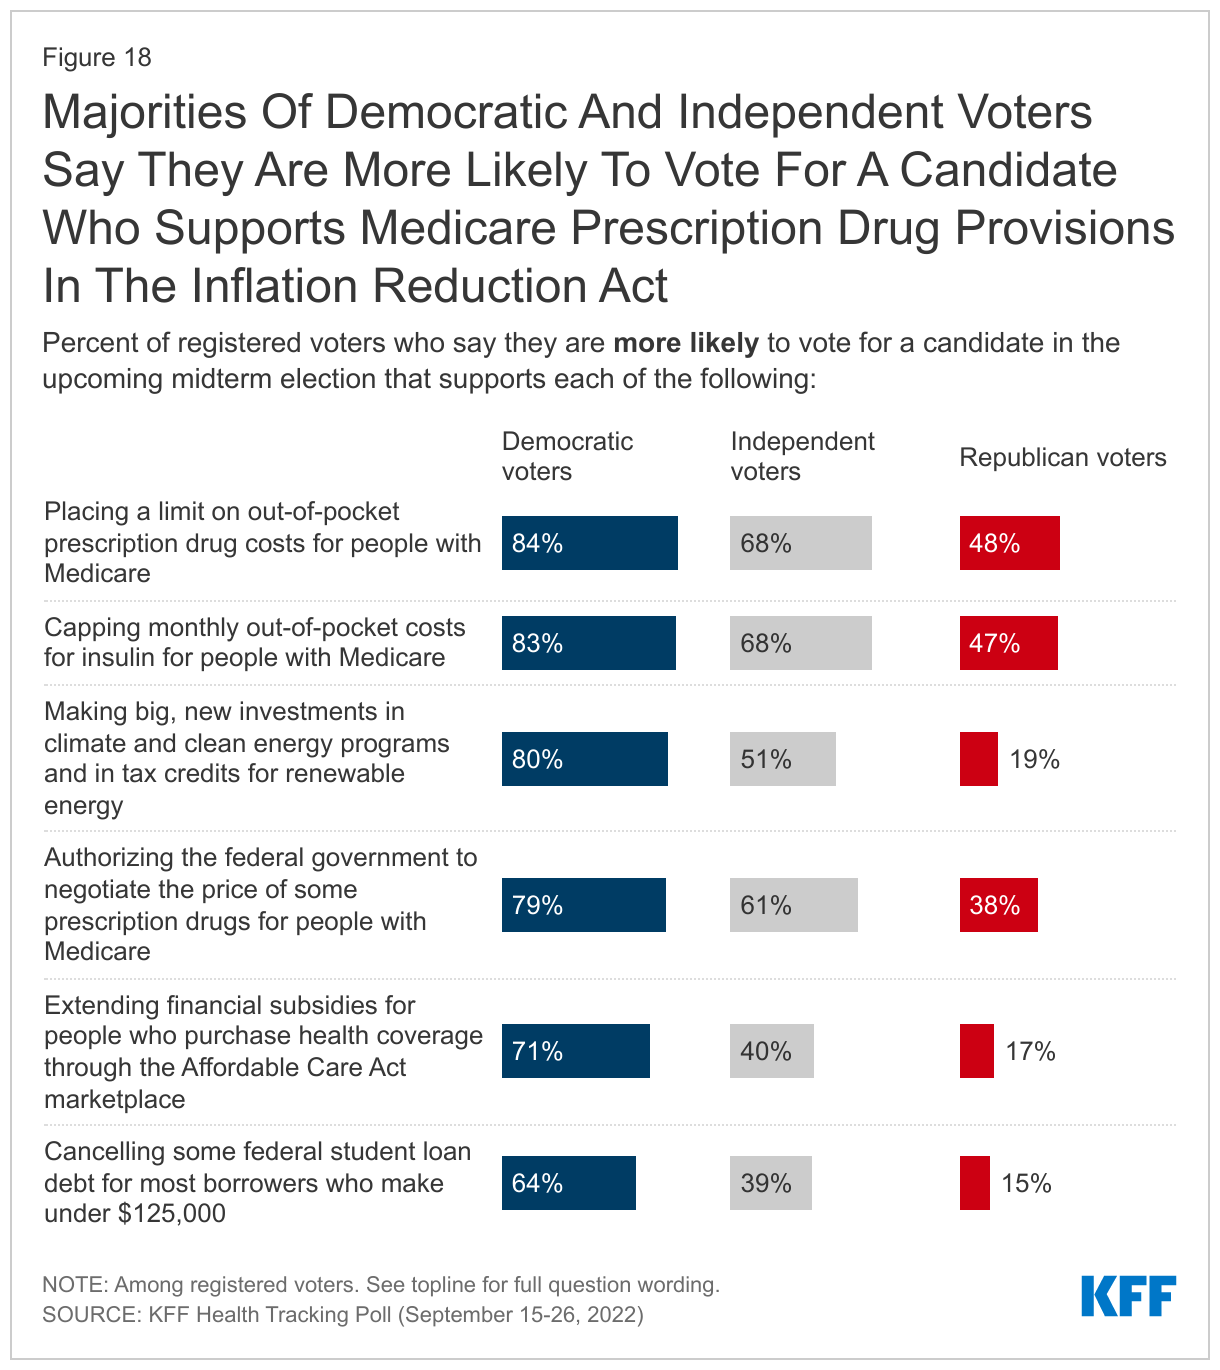
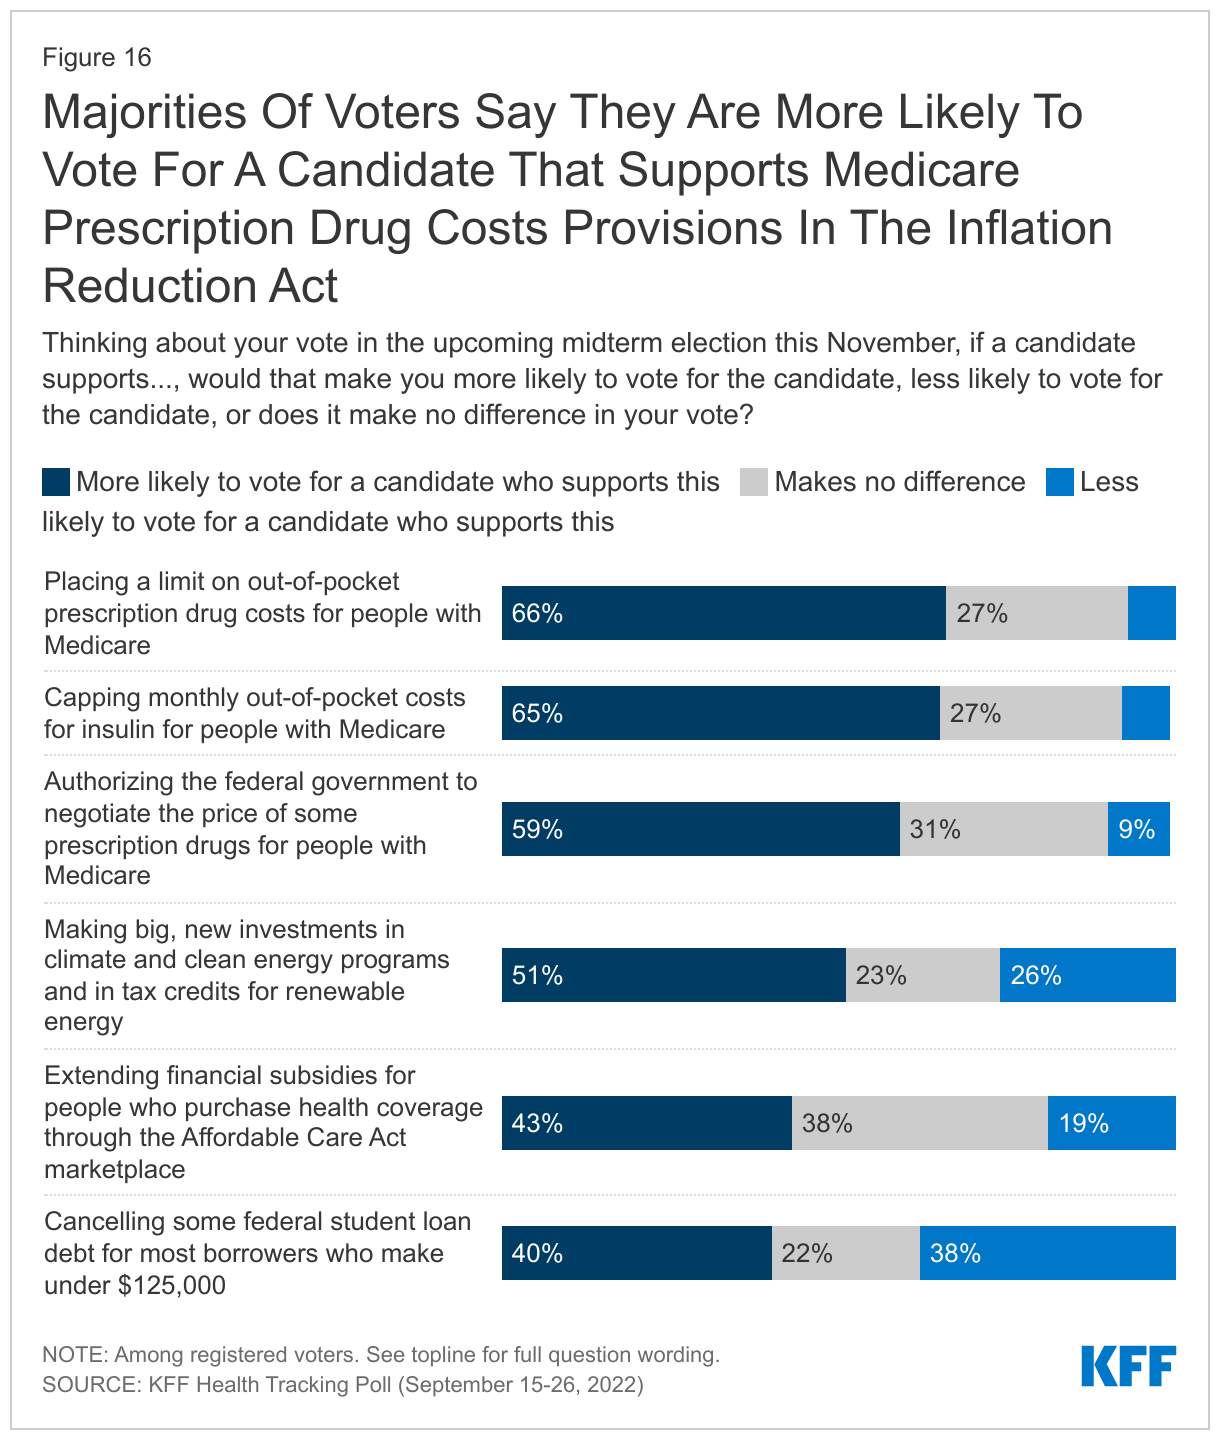
Though few adults are aware of the specific provisions included in the Inflation Reduction Act, many of these provisions are popular among voters. Majorities of voters say they would be more likely to vote for a candidate who supports placing a limit on out-of-pocket prescription drug costs for people on Medicare (66%), capping monthly out-of-pocket insulin costs for people with Medicare (65%) and authorizing the federal government to negotiate the price of some prescription drugs for people on Medicare (59%).

Voters are more divided on provisions related to climate and clean energy and extending subsidies under the Affordable Care Act. About half of voters (51%) say they would be more likely to vote for a candidate who supports making big, new investments in climate and clean energy programs and provide tax breaks for renewable energy, while less than half (43%) say they would be more likely to vote for a candidate who supports extending financial subsidies for people who purchase coverage through the Affordable Care Act marketplace.

Additionally, just a week after the passage of the IRA, the Biden Administration announced a plan to cancel up to $10,000 in federal student loans for most borrowers with incomes under $125,000. Notably, student loan cancellation appears to be particularly polarizing with four in ten voters (40%) saying they are more likely to vote for a candidate who supports cancelling some federal student loan debt for most borrowers who make under $125,000 while a similar share (38%) say they would be less likely to vote for a candidate who supports this.

Majorities Of Voters Say They Are More Likely To Vote For A Candidate That Supports Medicare Prescription Drug Costs Provisions In The Inflation Reduction Act

These new policies could motivate different segments of voters. Majorities of voters ages 65 and older say they are more likely to vote for a candidate who supports the Medicare provisions in the Inflation Reduction Act, though fewer say the same about a candidate who supports clean energy investment, the extending ACA subsides, or cancelling some student loans. On the other hand, student loan cancellation may resonate among younger voters as those ages 18 to 29 are more than twice as likely as voters over 65 to say they are more likely to vote for a candidate who supports cancelling some student loans.

Voters Ages 18-29 Are More Likely Than Older Voters To Back Candidates Who Support Climate Investment, ACA Subsidies, And Student Debt Cancellation

At least six in ten Democratic voters say they are more likely to vote for a candidate who supports each of the policies asked about, with the policies aimed at addressing prescription drug costs for people with Medicare being among the most popular. At least six in ten independent voters say they are more likely to vote for candidates who support these Medicare prescription drug provisions, though these policies are less popular among Republican voters. Eight in ten Democratic voters and half (51%) of independent voters also are motivated to vote for candidates who support climate investments, compared to just one in five Republicans (19%) who say the same.

Majorities Of Democratic And Independent Voters Say They Are More Likely To Vote For A Candidate Who Supports Medicare Prescription Drug Provisions In The Inflation Reduction Act

Methodology

This KFF Health Tracking Poll/COVID-19 Vaccine Monitor Poll was designed and analyzed by public opinion researchers at the Kaiser Family Foundation (KFF). The survey was conducted September 15-26, 2022, online and by telephone among a nationally representative sample of 1,534 U.S. adults including 599 women aged 18 to 49, conducted in English (1,475) and in Spanish (59). The sample includes 1,282 adults reached through the SSRS Opinion Panel either online or over the phone (n=36 in Spanish). The SSRS Opinion Panel is a nationally representative probability-based panel where panel members are recruited randomly in one of two ways: (a) Through invitations mailed to respondents randomly sampled from an Address-Based Sample (ABS) provided by Marketing Systems Groups (MSG) through the U.S. Postal Service’s Computerized Delivery Sequence (CDS); (b) from a dual-frame random digit dial (RDD) sample provided by MSG. For the online panel component, invitations were sent to panel members by email followed by up to three reminder emails. 1,241 panel members completed the survey online and panel members who do not use the internet were reached by phone (41).

Another 252 (n=23 in Spanish) interviews were conducted from a random digit dial telephone sample of prepaid cell phone numbers obtained through MSG. Phone numbers used for the prepaid cell phone component were randomly generated from a cell phone sampling frame with disproportionate stratification aimed at reaching Hispanic and non-Hispanic Black respondents. Stratification was based on incidence of the race/ethnicity groups within each frame. Respondents in the phone samples received a $10 incentive via a check received by mail, and web respondents received a $10 electronic gift card incentive.

The combined cell phone and panel samples were weighted to match the sample’s demographics to the national U.S. adult population using data from the Census Bureau’s 2021 Current Population Survey (CPS). Weighting parameters included gender, age, education, race/ethnicity, region, and household tenure. The sample was weighted to match patterns of civic engagement from the September 2017 Volunteering and Civic Life Supplement data from the CPS and to match frequency of internet use from the National Public Opinion Reference Survey (NPORS) for Pew Research Center. Finally, the sample was weighted to match patterns of political party identification based on a parameter derived from recent multi-mode benchmarking polls conducted by SSRS. The weights take into account differences in the probability of selection for each sample type (prepaid cell phone and panel). This includes adjustment for the sample design and geographic stratification of the cell phone sample, within household probability of selection, and the design of the panel-recruitment procedure.

The online questionnaire included two questions designed to establish that respondents were paying attention. Cases with over 40% item non-response, and cases with a length less than one quarter of the mean length by mode were flagged and reviewed. Cases were removed from the data if they failed two or more of the above quality checks. Based on this criterion, no cases were removed.

The margin of sampling error including the design effect for the full sample is plus or minus 3 percentage points. Numbers of respondents and margins of sampling error for key subgroups are shown in the table below. For results based on other subgroups, the margin of sampling error may be higher. Sample sizes and margins of sampling error for other subgroups are available by request. Sampling error is only one of many potential sources of error and there may be other unmeasured error in this or any other public opinion poll. Kaiser Family Foundation public opinion and survey research is a charter member of the Transparency Initiative of the American Association for Public Opinion Research.

GroupN (unweighted)M.O.S.E.
Total1,534± 3 percentage points
Women
Women ages 18-49599± 5 percentage points
Women ages 50 and older332± 7 percentage points
Race/Ethnicity
White, non-Hispanic864± 4 percentage points
Black, non-Hispanic260± 9 percentage points
Hispanic283± 8 percentage points
Party identification
Democrat622± 6 percentage points
Republican342± 7 percentage points
Independent378± 7 percentage points
Registered voters
Total voters1,291± 4 percentage points
Democratic voters561± 6 percentage points
Republican voters309± 7 percentage points
Independent voters308± 8 percentage points
Parents
Parent with a child ages 6 months through 4 years old179± 10  percentage points
Parent with a child ages 5-11251± 8  percentage points
Parent with a child ages 12-17235± 9  percentage points

Endnotes

  1. The following states had an abortion ban in place during the majority of the survey fieldwork (September 15-26, 2022) and are included in the “States with abortion bans” category: AL, AR, ID, IN, KY, LA, MS, MO, OK, SD, TN, TX, WI, WV. Indiana’s state abortion ban was temporarily blocked by courts on September 22, 2022. Arizona, which is not included in category of “states with an abortion ban” in this report had an abortion ban go into effect on September 23, 2022. For more information on the current status of abortion access in the U.S. please see the KFF Abortion in the U.S. Dashboard. ↩︎
News Release

Few State Medicaid Programs Report Covering a Broad Range of Gender-Affirming Health Services for Adults

Published: Oct 11, 2022

While many state Medicaid programs cover aspects of gender-affirming health services for adults, only Maine and Illinois reported covering five standard gender-affirming services in 2021: hormone therapy, gender-affirming surgery, mental health counseling related to gender-affirming care, voice and communication therapy, and fertility assistance for adult transgender enrollees, according to a KFF survey. Nine states, including Michigan, Connecticut, and Colorado, reported covering four of the five services. Alabama and Texas reported not covering any of these services under Medicaid.

The survey of states on coverage of sexual and reproductive health services for adult enrollees was conducted in Summer 2021. Forty-one states and the District of Columbia responded to the survey.

Despite protections implemented by the Biden administration, several states have recently moved to implement bans or consider actions limiting access to gender-affirming health care, particularly for youth. Coverage of specific services for adults varies and policies like requiring prior authorization can limit access. Additionally, some states do not have policies addressing coverage in their state Medicaid programs, potentially leaving many low-income transgender and nonbinary individuals without a clear path to coverage for medically necessary health services.

Read the brief on the full survey findings

Update on Medicaid Coverage of Gender-Affirming Health Services

Authors: Ivette Gomez, Usha Ranji, Alina Salganicoff, Lindsey Dawson, Carrie Rosenzweig, Rebecca Kellenberg, and Kathy Gifford
Published: Oct 11, 2022

Issue Brief

Transgender and nonbinary adults often face challenges and barriers to accessing needed health services and face worse health outcomes than their cisgender peers. Transgender adults are more likely than cisgender adults to be uninsured, report poor health, have lower household incomes, and face barriers to care due to cost. Given their lower incomes, Medicaid plays an important role in health coverage for transgender people. A 2019 report by the Williams Institute estimated that among the 1.4 million transgender adults living in the United States, approximately 152,000 had Medicaid coverage.

Medicaid is the country’s health coverage program for low-income people and is jointly funded by the federal government and states. Under Medicaid, states must cover certain mandatory benefits, such as inpatient and outpatient services, home health services, and family planning services. While there are no specific federal requirements regarding coverage or exclusion of gender-affirming health care services as a category of Medicaid benefits, there are rules regarding comparability requiring that services must be equal in amount, duration, and scope for all beneficiaries within an eligibility group.

Medicaid benefits are subject to Section 1557 of the Affordable Care Act (ACA), the law’s major non-discrimination provisions, which prohibit discrimination based on sex. The Biden Administration recently proposed a new rule on Section 1557 that explicitly states that it interprets, and will enforce, sex-based protections to include sexual orientation and gender identity. The administration had already asserted this position in guidance stating that under 1557 protections, “categorically refusing to provide treatment to an individual based on their gender identity is prohibited discrimination” and it returns to a position more closely aligned to that under the Obama administration but walked back under the Trump administration.

Despite these protections, some states have recently moved to implement or consider actions aimed at limiting access to gender-affirming health care, particularly for youth. This has included restrictions on coverage of benefits as well as bans on the provision of gender-affirming care by health care providers. A number of lawsuits are pending.

Definitions of Gender Identity
Gender Identity: One’s deeply held, internal sense of self as masculine, feminine, a blend of both, neither, or something else. Identity also includes the name used to convey one’s gender. Gender identity can correspond to or differ from the sex assigned at birth.
Transgender: Somebody who is transgender has a gender identity different from that traditionally associated with sex assigned at birth.
Non-binary: An umbrella term for gender identities that are not exclusively masculine or feminine.
Cisgender: Refers to people whose gender identity aligns with their assigned sex at birth
Gender dysphoria: “A concept [and clinical diagnosis] designated in the DSM-5 as clinically significant distress or impairment related to a strong desire to be of another gender, which may include desire to change primary and/or secondary sex characteristics. Not all transgender or gender diverse people experience dysphoria.”
Gender-affirming care: Gender-affirming care is a model of care which includes a spectrum of “social, psychological, behavioral or medical (including hormonal treatment or surgery) interventions designed to support and affirm an individual’s gender identity.”
SOURCES: Gender Spectrum, The Language of Gender, Accessed October 3, 2022; American Psychiatric Association, What is Gender Dysphoria?, August 2022; OASH Office of Population Affairs, Gender-Affirming Care and Young People, Accessed October 3, 2022.

What gender affirming services do states report covering through Medicaid?

The standards of care for gender-affirming health services set by the World Professional Association for Transgender Health include hormone therapy, surgeries, fertility assistance, voice and communication therapy, primary care, and behavioral health interventions. Additionally, the Endocrine Society supports gender-affirming care in their clinical practice guidelines. Together, these guidelines form the standard of care for treatment of gender dysphoria. Gender-affirming care is highly individualized, and while not all transgender and nonbinary individuals will want or seek any or all of these medically necessary services, limiting access to them can lead to negative and life threating outcomes. Major U.S. medical associations, such as the American Medical Association, the American College of Obstetricians and Gynecologists, the American Academy of Nursing, the American Psychiatric Association, among others, have issued statements underscoring the medical necessity of gender-affirming care.

In a survey of states on coverage of sexual and reproductive health services conducted in Summer 2021, KFF and Health Management Associates (HMA) asked states about coverage of five gender-affirming care services: gender-affirming counseling, hormones, surgery, voice and communication therapy, and fertility assistance for transgender enrollees (Questions presented in Appendix Table 1). Because the survey focused on adult access, states were not asked about puberty blocking hormones. States were asked if a service was covered, excluded from coverage, or whether coverage was not addressed in state policy or statute for adults over the age of 21, as of July 1, 2021. Services that are not addressed in state policy or statute may or may not be covered by the state, or coverage may vary by case. The survey instrument was distributed via email to state Medicaid directors and where applicable, Medicaid agency staff working on women’s health and reproductive health issues. Forty-one states and the District of Columbia responded to the survey. Tennessee responded to the survey but did not answer questions related to gender-affirming services. Survey findings are summarized in Figure 1 and Table 1 and highlights are presented below.

Overall coverage of gender-affirming care:

As detailed below, many state Medicaid programs cover aspects of gender-affirming health services. However, only two of the 41 states responding to this survey, Maine and Illinois, reported covering all five services. Two states, Alabama and Texas, reported they do not cover any of these services under Medicaid.

Gender-Affirming Hormone Therapy:

Gender-affirming hormone drugs include estrogen, anti-androgens, and progestins (feminizing hormones), as well as testosterone and other agents (masculinizing hormones). Under federal law, and subject to exceptions for a few drugs or drug classes, state Medicaid programs are required to cover all drugs from manufacturers that have entered into a rebate agreement with the Secretary of Health and Human services under the federal Medicaid Drug Rebate program. Twenty-five states reported covering gender-affirming hormones, and 10 of these states require prior authorization. Thirteen states said coverage was not addressed in state statute or policy, and three states—Alabama, Hawaii, and Texas —exclude coverage of gender-affirming hormone therapy.

Gender Affirming Surgery:

Gender-affirming surgery can include chest surgery, genital surgery, facial surgery, and other surgical procedures aimed at helping a transgender or nonbinary person transition to their self-identified gender. Not all transgender or nonbinary individuals seek or want surgical treatments. Twenty-three of the 41 responding states reported covering gender-affirming surgery for adults through their state Medicaid programs. Nine states reported coverage was not addressed in state statute or policy, and nine states reported that they excluded gender-affirming surgery from coverage. This survey did not ask states to specify what surgical procedures they cover, but some states provided additional details, which can be found in Appendix Table 2.

Ten of 23 covering states require prior authorization. For example, Colorado requires a clinical diagnosis of gender dysphoria and that the patient has lived in their preferred gender for 12 continuous months. Colorado and Wisconsin also require that the patient has completed 12 continuous months of hormone therapy.

Voice and Communication Therapy

Some transgender people have challenges with developing a voice that matches their gender identity. Voice therapy services can encompass a range of treatments that address pitch, intonation, articulation, pragmatic speech and other aspects of communication.

Thirteen of the 41 responding survey states report that they cover gender-affirming speech or voice therapy services, some requiring prior authorization. Ten of the survey states reported that they exclude coverage for gender-affirming voice therapy services, and 18 states responded that they have not addressed this coverage in their state policy.

Fertility Services:

A broad array of diagnostic and treatment services are available to assist with achieving a pregnancy. Diagnostics typically include lab tests, semen analysis and imaging studies, or procedures of the reproductive organs. Treatment services include medications, reproductive system procedures to allow for pregnancy, and an array of other interventions to help an individual achieve pregnancy, such as intrauterine insemination (IUI) and in-vitro fertilization (IVF). While federal rules require states to cover most prescription medications under Medicaid, there is an exception that allows states to exclude coverage for fertility medications.

Fertility services can be unaffordable without insurance coverage but few states (11) cover services for any beneficiaries, regardless of gender identity. In this survey, just three states (Illinois, Maryland, and Maine) reported covering fertility services as part of gender-affirming care. Of these three states, Illinois is the only one that reported covering services for beneficiaries without exceptions. More than half of states (29) reported that they exclude coverage for fertility services for transgender individuals, and nine states responded that they have not addressed this coverage in their state policy (Table 1).

Mental Health Counseling:

Transgender and nonbinary individuals may seek mental health services to address issues related to their gender identity and transition but may also seek care to address issues that are not related to their gender transitions. As noted, in some cases a diagnosis of gender dysphoria is required before gender-affirming services can be accessed.

Twenty-seven states reported covering mental health counseling and services specifically related to gender affirming health services, 11 states reported coverage was not addressed in their state statute or policy, and three states, Alabama, Kansas, and Texas, reported that they exclude this benefit.

Some states reported requiring that transgender and non-binary Medicaid enrollees receive mental health assessments prior to receiving hormone therapy or having gender-affirming surgeries. For example, Delaware requires prior authorization for mental health counseling related to gender-affirming care, and Connecticut reported that depending on the type of service, prior authorization may be required.

Conclusion

The need for coverage of and access to medically necessary gender-affirming care has been recognized by leading medical and health professional organizations. However, some states have enacted laws banning the provision of gender-affirming health services to youth, and coverage for gender-affirming health services is uneven in state Medicaid programs. In most states, there is variation in coverage for specific services and some states do not have policies addressing coverage in their state Medicaid programs, potentially leaving many low-income transgender and nonbinary individuals without access to medically necessary health services.

Since this survey was conducted, the Biden Administration has proposed a new rule on Section 1557, which is consistent with their prior guidance, and proposes that excluding coverage for gender-affirming care constitutes sex discrimination. In addition, beyond what is stated in rulemaking by the current or previous administrations, some courts have found that the statue itself (i.e., sex non-discrimination provisions) protects against health care discrimination based on gender identity and sexual orientation. For example, a federal district court permanently enjoined the Wisconsin Medicaid program from categorically excluding gender-affirming services from coverage, relying on the statute. Similarly, in recent months, federal courts have ruled the Georgia and West Virginia must cover gender-affirming care in their Medicaid programs. Most recently, in June 2022, Florida’s Medicaid agency announced it would ban coverage of gender-affirming health services in the state. The policy went into effect in August and was challenged in court a few weeks later (with the case still pending). States that do not cover components of gender-affirming care may be in violation of Sec. 1557 of the ACA. However, there are a number of pending legal challenges to the Sec. 1557 rule as well as over specific Medicaid state policies related to coverage of gender-affirming services which will be important to watch moving forward to fully understand this evolving landscape.

Medicaid Coverage of Gender Affirming Health Services
State Medicaid Coverage of Gender-Affirming Health Services, as of July 1, 2021

Appendices

Appendix A: Survey Questionnaire

SECTION III: MEDICAID AND HEALTH SERVICES FOR TRANSGENDER PEOPLE In Table G, use the drop-down boxes in the table below to indicate whether, as of July 1, 2021, the various transgender health services were covered for adults aged 21 and older in the traditional Medicaid program, explicitly excluded from coverage, or whether coverage is not explicitly addressed in statute or administrative policy. Describe limits or utilization controls applied by entering text in the space provided and use the drop-down boxes to indicate if coverage policies are aligned across all eligibility groups (i.e., traditional Medicaid, ACA expansion adults, etc.). If not aligned, please describe coverage policy variations in the comment field at the bottom of the table. Please do NOT include services that are provided by managed care plans as value-added benefits (that is, are not a required state benefit).

Transgender Health ServicesTraditional Medicaid covers as of 7/1/2021?Describe limits or utilization controlsCoverage Policies Aligned all Elig. groups?
1. Gender-affirming surgery
2. Gender-affirming hormone therapy
3. Infertility services, such as fertility preservation or IVF, for transgender individuals
4. Mental health counseling and services related to gender-affirming care
5. Voice and Communication Therapy
Comments on Transgender Health Services coverage, including any coverage policy variations across different eligibility pathways (i.e., ACA expansion adults):

Appendix Table B: Detailed Tables

State Medicaid Coverage of Gender Affirming Health Services, as of July 1, 2021
News Release

Deaths From COVID-19 Spiked Over The Summer, Especially Among People 65 and Older, Before Dipping Again in September

While Overall COVID Deaths Remain Much Lower Than Earlier in the Pandemic, The Share Dying Who Are 65 Or Older (88%) Is The Highest Yet

Published: Oct 6, 2022

Although COVID-19 fatalities remain much lower than during the peak of last winter’s Omicron surge, deaths among people 65 and older spiked over the summer, more than doubling between April and July 2022, finds a new KFF analysis. The number of deaths topped more than 11,000 people 65 and older in both July and August.

For people younger than 65, deaths have increased more slowly since April, rising by 52 percent to about 1,900 in both July and August 2022. While COVID-19 deaths began declining again in September, they remained higher for those ages 65 and older compared to levels in April and May. For those younger than 65, deaths dropped below April levels.

The numbers illustrate that, despite the determination of many Americans to move on and resume normal activities, COVID-19 continues to exact a toll, especially among older adults. As of the week ending October 1, 2022, the United States had lost nearly 1.1 million lives to COVID-19, including about 790,000 people ages 65 and older. Although people 65 and older are 16 percent of the country’s population, they account for 75 percent of all COVID deaths to date.

In fact, since the summer of 2021, COVID deaths among people 65 and older have been growing as a share of all deaths. The nearly 7,100 deaths among this age group in September of 2022 accounted for 88 percent of all COVID deaths that month – the highest share since the pandemic began. (The absolute number of monthly COVID deaths in this age group peaked at more than 85,000 in January 2021.) The new analysis contains detailed data on the number and share of COVID-19 deaths by age in each month of the pandemic.

The recent rise in deaths is primarily a function of increasing cases due to the more transmissible Omicron variant. Other factors include relatively low booster uptake and waning vaccine immunity, underscoring the importance of staying up to date on vaccination, particularly for older adults. Last month public health authorities began encouraging eligible Americans to get new bivalent booster shots recently authorized by the Food and Drug Administration that target both the original strain of the virus and the more recent Omicron subvariants.

A second analysis released today examines COVID vaccination rates among residents and staff of nursing facilities, where the virus poses a particularly strong threat, and finds that although initial vaccination rates for both groups were quite high, take-up of earlier boosters has been lower. (Sufficient data on take-up of the bivalent boosters is not yet available, however.)

More than 85 percent of residents and staff had completed the primary vaccination series as of September 18, 2022. Only 74 percent of all residents and 51percent of all staff (including those who did not complete the primary series) had received one or more booster shots as of that date. Vaccination and booster rates in nursing facilities also varied considerably across the states, among both residents and staff. In 30 states, fewer than half of all staff had received one or more booster shots as of September 18, 2022.

Recent KFF polling shows that public awareness about the new boosters is modest, although older adults — who tend to be at greater risk of serious illness and death — are most likely to know about the new shots. About a third (32%) of all adults say that they’ve either gotten the new booster (5%) or intend to do so as soon as possible (27%). Among older adults (ages 65 and up), nearly half (45%) say they’ve already gotten the new booster (8%) or plan to get it as soon as possible (37%).

For more data and analyses about Medicare Advantage, visit kff.org


A Look at Vaccine and Booster Rates in Nursing Facilities as New Boosters Become Available

Published: Oct 6, 2022

Keeping nursing facility staff and residents current on their COVID-19 vaccines is an important tool for reducing deaths from COVID-19. This is particularly relevant now since KFF analysis found that over one-fifth of all U.S. COVID-19 deaths occurred in long-term care facilities and death rates from COVID-19 are rising for people ages 65 and older, who comprise most nursing facility residents. The number of COVID-19 deaths per month among people 65 and over doubled between April 2022 and July 2022, exceeding 11,000 for the months of July and August.

Although initial vaccination rates for both groups were quite high, take-up of boosters has been lower. Those are troubling numbers because a recent report from the CDC found that receipt of a second COVID-19 booster dose was 90% effective against death and 74% effective against severe COVID-19-related outcomes for nursing facility residents. This data note describes COVID-19 vaccination rates of nursing facility residents and staff between August 2021 and the week ending September 18th, 2022. We briefly explore how federal policy actions have affected vaccine take-up thus far, and what that might mean for take-up of the new, bivalent boosters. Federal policy may be important to promoting take-up of those boosters as the KFF COVID-19 Vaccine Monitor from September 2022 show half of adults have heard little or nothing at all about the new boosters.

Take-up of the initial vaccine series has been relatively high, with over 85% of residents and staff completing the primary series as of September 18, 2022 (Figure 1). Among nursing facility residents, 87% completed a primary vaccine series, which includes either 2 doses of the Pfizer-BioNTech, Moderna, or Novavax vaccines; or a single dose of the Janssen vaccine. There has been minimal change in that rate over the last year among nursing facility residents – in August 2021, 83% of residents had completed their primary series. Among nursing facility staff, 88% completed a primary vaccine series by September 18, 2022. That rate increased from 62% in August 2021 to 88% in March 2022 and has remained stable since.

Nursing Facility Resident and Staff Vaccination and Booster Rates, August 2021 - September 2022

Take-up of boosters has been lower: Only 74% of all residents and 51% of all staff had received one or more booster shots as of September 18, 2022. Among the population who completed the initial vaccine series and were eligible for a booster, 86% of residents and 57% of staff had received one or more boosters. The CDC began recommending booster shots for nursing facility residents in September 2021, after data indicated that vaccinations become less effective over time, especially among older adults. Initial take-up among residents was rapid and the percentage of vaccinated residents who had a booster shot increased from 1% in September 2021 to nearly 60% in January 2022. Since then, the percentage of residents who have had a booster has increased but at a much slower rate, rising to 74% in September 2022. Booster take-up has been much lower among nursing facility staff. Between September 2021 and September 2022, the percentage of vaccinated staff who had received a booster grew from 1% to 51%. Any booster dose given to nursing facility residents or staff after September 1, 2022 is the new bivalent booster.

Vaccination and booster rates vary considerably across the states and in 30 states, fewer than half of all staff had received one or more booster shots as of September 18, 2022 (Figure 2). Vaccination rates for nursing facility residents range from 76% in Arizona to 97% in Vermont. Booster rates are lower, ranging from 59% in Arizona to 92% in Vermont. Among staff, the vaccination rate ranges from 78% in Ohio, Idaho, and Missouri to 100% in New York and Maine. The percentages who have received a booster range from 32% in Missouri, Alabama, and Mississippi to 96% in Massachusetts.

Nursing Facility Resident and Staff Vaccination and Booster Rates, As of Week Ending September 18th, 2022

Looking forward, both federal policy and local outreach efforts could be important to promoting take-up of the new bivalent boosters among nursing facility residents and staff. One likely reason for the quick initial take-up of vaccines and boosters during 2021 among nursing facility residents and staff was that there were three on-site vaccination clinics held at all long-term care facilities participating in the Federal Pharmacy Partnership for Long-Term Care Program. (Other factors contributing to high take-up rates include very high death rates from COVID-19 among people in nursing facilities and the fact that they were a main focus of the initial vaccine roll-out.) Facilities are still able to request additional clinics, but it’s unclear how many facilities are doing so or how many pharmacy partners continue to participate. Current CDC guidance encourages facilities to let residents and staff know about opportunities to receive vaccines in the community. It is possible that lower take-up of boosters could reflect increased difficulty in getting vaccinated in the community rather than on-site. Among nursing facility staff, initial take-up of COVID-19 vaccines was low until the health care worker vaccination mandate required providers that participate in Medicare and/or Medicaid to be vaccinated. Along with other factors, this mandate led to increased take-up of the primary vaccination series among nursing facility staff and early evidence suggests that it did not increase the frequency of staffing shortages.

Creating new opportunities for on-site vaccinations and updating the health care worker vaccination mandate to reflect current CDC guidance could increase the number of nursing facility residents and staff who are up to date with their COVID-19 vaccinations. The CDC recently updated the definition of “up-to-date” vaccination status for long-term care facilities to align with the definition of “up-to-date” that the CDC rolled out earlier more broadly across the country. Starting on September 2nd across the country and on September 26th for long-term care facilities’ reporting/surveillance purposes, the CDC’s new definition of “up-to-date” is having received a bivalent booster or having received a final shot of the original vaccines less than 2 months ago. Nursing facilities may have been subject to this delayed definition of “up-to-date” to align better with quarterly reporting periods. As such, they began reporting the percentage of residents who met the new “up-to-date” standard starting September 26th, 2022. After there are sufficient data available using the new definition, KFF will update this analysis and provide state-level results on State Health Facts.

Methods

This analysis uses federal data on staffing reported weekly by facilities to the CDC’s National Healthcare Safety Network (NHSN) and reflects weekly data through the week ending September 18th, 2022. These data are updated regularly to reflect revised data from previous weeks, so future versions of this dataset reflecting the same time period may output different values.

Each week, approximately 15,200 nursing facilities submit data through NHSN. CMS performs data quality checks to identify facilities that may have entered incorrect data before publishing this data for public download. Facilities that have submitted erroneous data will have an “N” displayed in the column titled “Passed Quality Assurance Check”. Our final sample of nursing facilities in this analysis excludes facilities that CMS flagged in their data quality check, as well as facilities that are missing shortage measures. This analysis reflects data from anywhere between 14,118 nursing facilities (93% of all facilities) and 15,043 nursing facilities (99% of all facilities) each week.


Deaths Among Older Adults Due to COVID-19 Jumped During the Summer of 2022 Before Falling Somewhat in September

Published: Oct 6, 2022

As of the week ending October 1, 2022, the United States has lost nearly 1.1 million lives to COVID-19, of which about 790,000 are people ages 65 and older. People 65 and older account for 16% of the total US population but 75% of all COVID deaths to date. Vaccinations, boosters, and treatments have led to a substantial decline in severe disease, hospitalizations, and deaths from COVID-19, but with booster uptake lagging, deaths for older adults rose again during the summer of 2022.

From April to July 2022, the number of deaths due to COVID increased for all ages but rose at a faster rate for older than younger adults and stayed high through August 2022, with deaths due to COVID topping 11,000 in both July and August among people 65 and older. While COVID deaths began to drop again in September, they were still higher for those ages 65 and older than in April or May; for those younger than 65, deaths dropped below their April levels.

The rise in deaths is primarily a function of increasing cases due to the more transmissible Omicron variant. Other factors include relatively low booster uptake, compared to primary vaccination, and waning vaccine immunity, underscoring the importance of staying up to date on vaccination. On September 1st, CDC recommended a new, updated booster for all those ages 12 and older, but particularly for those who are older.

Vaccination rates among people 65 and older were high for the primary vaccination series (92.4%), but were lower for the first booster (71.1%, among those who received a primary series) and even lower for the second booster dose (43.8%, among those who received a first booster), according to the CDC. Similar trends can be seen in nursing facilities, which are primarily comprised of people 65 and older. Further, CDC data show that, among people 50 and older, those who have received both a primary vaccination series and booster shots have a lower risk of dying from COVID-19 than their non-vaccinated counterparts. Though the uptake in boosters among people 65 and older has been much higher than among people under 65 and they are more likely to say they will get the new booster as soon as possible, booster uptake still remains relatively low compared to primary vaccination among older adults. This, combined with the rise in deaths among adults 65 and older over the summer, raises questions about whether more can be done to encourage older adults to stay up to date on their vaccinations.

The total number of deaths for people 65 and older more than doubled from April to July 2022 and stayed high in August 2022, topping 11,000 in both July and August (Figure 1, Table 1).

Deaths Due to COVID-19 Rose Faster for Older than Younger Adults in the Summer of 2022
  • The number of COVID-19 deaths among people 65 and older is now much lower than at the peak of Omicron in early 2022, but deaths more than doubled between April and July 2022 (125%) and topped more than 11,000 in both July and August 2022.
  • For people younger than 65, deaths also increased during this time, but more slowly between April and July compared to older adults (52%) to about 1,900 in both July and August 2022.
  • While COVID deaths began to drop again in September, they were still higher for those ages 65 and older (~7,100 deaths) than in April (~4,900 deaths) and May (~6,300); for those younger than 65, deaths dropped below their April levels.
  • Among all age groups, deaths due to COVID-19 generally declined after the introduction of vaccines in late December 2021, but the number of deaths spiked with the introduction of the more transmissible Delta and Omicron variants, and due to relatively low booster uptake and waning vaccine immunity, as well as loosening COVID-19 mitigation measures.

People 65 and older have consistently accounted for a larger share of COVID-19 deaths than those younger than 65, and represented 88% of all deaths in September 2022 – the highest share since the pandemic began more than two years ago (Figure 2, Table 1).

People 65 and Older Account for a Much Larger Share of COVID-19 Deaths Than Those Under 65
  • With the rollout of vaccinations in the winter of 2020, the share of total deaths due to COVID declined for older adults from a peak of 84% in November 2020 to a low of 58% in August and July 2021.
  • Since the summer of 2021, however, COVID deaths among people 65 and older have been growing as a share of all deaths, reaching 88% in September 2022 – similar to the share of COVID-19 deaths accounted for by this group before vaccines were available.
  • People 85 and older account for 26% of COVID-19 deaths overall, but since May 2022, have accounted for 38% or more of all COVID-19 deaths (Table 1).
Number and Share of COVID-19 Deaths, By Ag

Methods

This analysis uses data from the Centers for Disease Control and Prevention, “Provisional COVID-19 Death Counts by Sex and Age,” as of the week ending October 1, 2022 https://data.cdc.gov/NCHS/Provisional-COVID-19-Deaths-by-Sex-and-Age/9bhg-hcku. We include COVID-19 death counts from April 2020 to September 2022. Coronavirus disease deaths are identified using the ICD–10 code U07.1. Deaths are coded to U07.1 when coronavirus disease 2019 or COVID-19 meets the definition of principal diagnosis. COVID-19 death counts are based on a current flow of mortality data in the National Vital Statistics System. The number of deaths reported in this dataset are the total number of deaths received and coded as of the date of analysis, and do not represent all deaths that occurred in that period. Data during this period are incomplete because of the lag in time between when the death occurred and when the death certificate is completed, submitted to the National Center for Health Statistics (NCHS) and processed for reporting purposes. This delay can range from 1-2 weeks. In addition, death counts for earlier weeks are continually revised and may increase or decrease as new and updated death certificate data are received.