Medicaid Financing: The Basics
Introduction
Medicaid represents nearly $1 out of every $5 spent on health care in the U.S. and is the major source of financing for states to provide health coverage and long-term care for low-income residents. Medicaid is administered by states within broad federal rules and jointly funded by states and the federal government through a federal matching program with no cap. States are facing substantial Medicaid financing changes and historic reductions in federal funding following the passage of the 2025 reconciliation law, though the timing of the changes and the impacts vary by state. In addition, administrative actions related to financing and more aggressive oversight of potential fraud by health care providers, including withholding federal Medicaid operating funds, contribute to fiscal uncertainty for states. Amid federal policy changes, states are also experiencing a more tenuous fiscal climate due to slowing revenue growth and increasing spending demands. Medicaid is often central to state budget decisions as it is simultaneously a significant spending item as well as the largest source of federal revenues for states. This issue brief examines key questions about Medicaid financing and explores the impact of recent policy changes.
How does Medicaid financing work?
Medicaid financing is shared by states and the federal government with a guarantee to states for federal matching payments with no pre-set limit. The percentage of costs paid by the federal government (known as the federal medical assistance percentage or “FMAP”) varies across states, for specific services and types of enrollees, and depending on whether the costs are for medical care or program administration. Congress has enacted legislation to temporarily increase federal matching payments during economic downturns and, most recently, during the COVID-19 pandemic, because Medicaid is a counter-cyclical program. During economic downturns, more people become eligible and enroll, but states typically face declines in revenues that make it difficult to finance the state share of funding for the program.
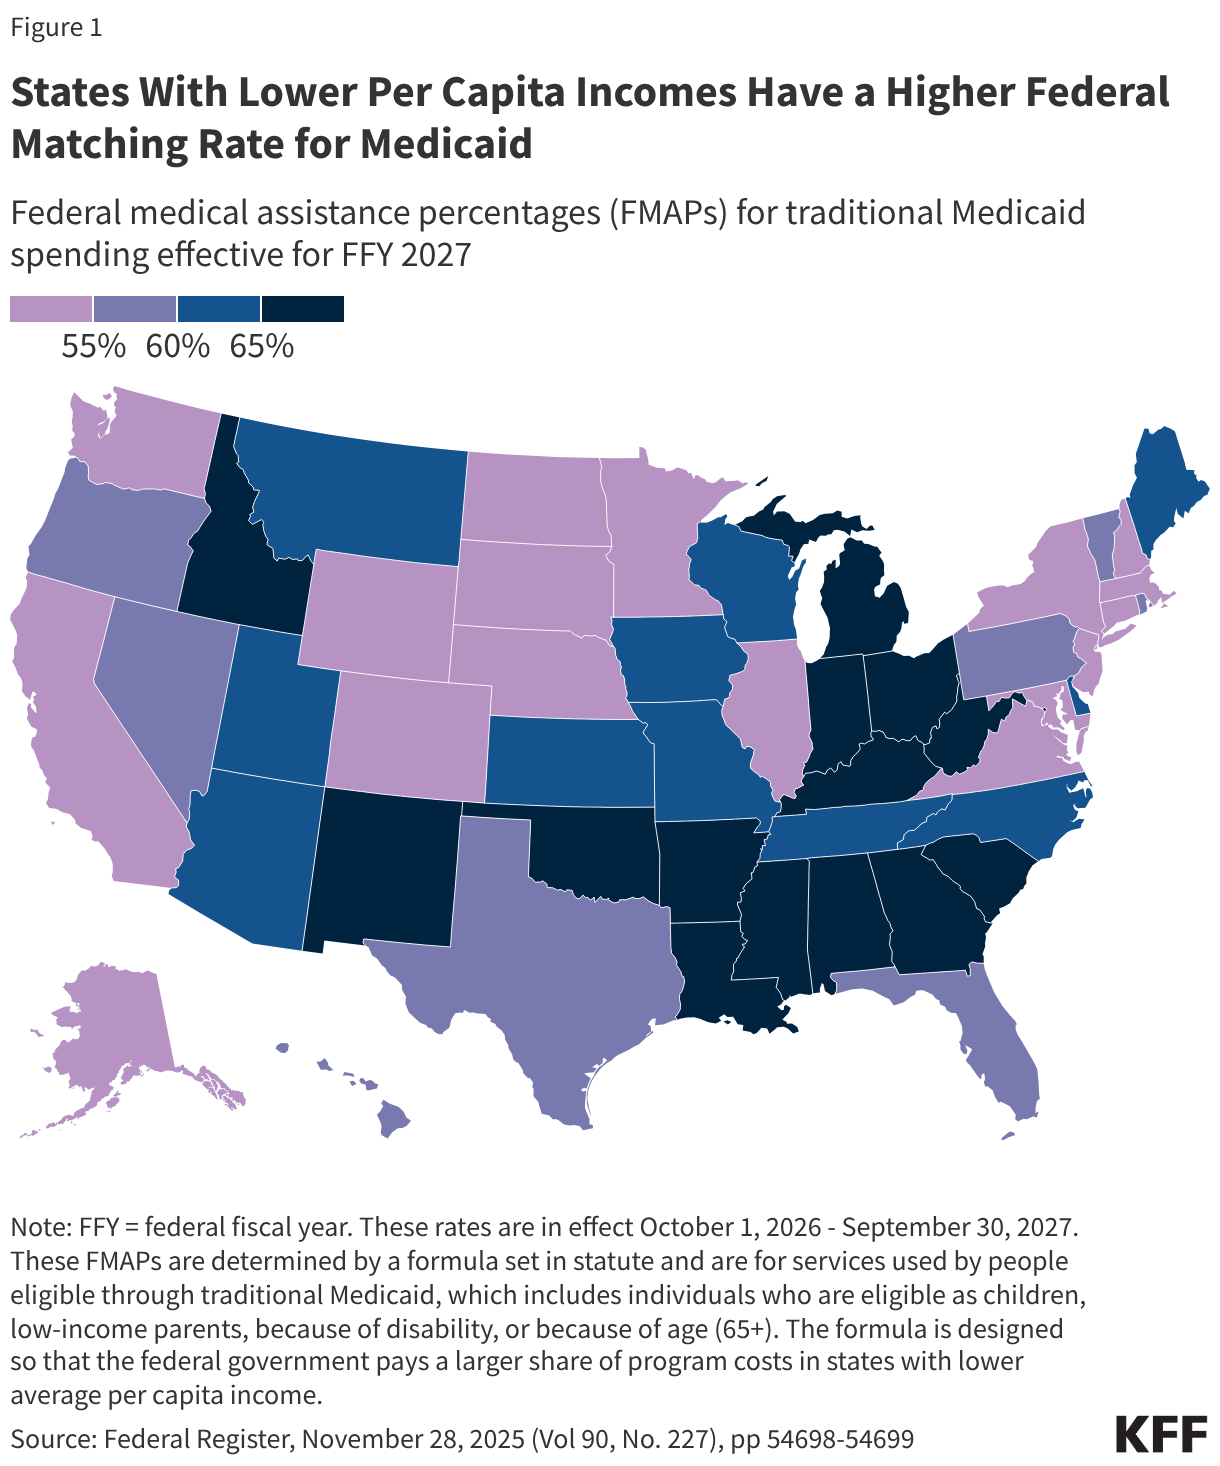
The FMAP for services used by people eligible through traditional Medicaid, which includes individuals who are eligible as children, low-income parents, because of disability, or because of age (65+), is determined by a formula set in statute. The formula is designed so that the federal government provides a match rate of at least 50% and provides a higher match rate for states with lower average per capita income. The resulting FMAP varies by state and ranges from 50% (the FMAP “floor”) in ten states (California, Colorado, Connecticut, Maryland, Massachusetts, New Hampshire, New Jersey, New York, Washington, and Wyoming) to 77% in Mississippi for federal fiscal year (FFY) 2027 (Figure 1).
There are special match rates for the Affordable Care Act (ACA) expansion group, administration, and other services. While the traditional FMAP applies to the vast majority of Medicaid spending, there are a few exceptions that provide higher match rates for specific services or populations, such as family planning and most notably people covered under the ACA Medicaid expansion. States that have implemented the expansion receive 90% FMAP for adults covered through the ACA Medicaid expansion. Administrative costs incurred by states are usually matched by the federal government at a 50% rate, but some functions such as eligibility and enrollment systems receive higher match rates. Medicaid administrative costs are about 4% of total Medicaid spending.
Unlike in the 50 states and D.C., annual federal funding for Medicaid in the U.S. territories is subject to a statutory cap and fixed matching rate. Once a territory exhausts its capped federal funds, it no longer receives federal financial support for its Medicaid program during that fiscal year. Over time, Congress has provided increases in federal funds for the territories broadly and in response to specific emergency events. Various pieces of legislation during the pandemic significantly increased the allotments for each of the territories and also raised the FMAP rates from the statutory level of 55% to 76% for Puerto Rico and 83% for the other territories. The 2023 Consolidated Appropriations Act extended the 76% FMAP for Puerto Rico through FFY 2027 and made the 83% match rate for other territories permanent.
To participate in Medicaid and receive federal matching dollars, states must meet core federal requirements. States must provide certain mandatory benefits (e.g., hospital, physician, and nursing home services) to core populations (e.g., low-income pregnant women, children, people with disabilities, and people ages 65 and older) without waiting lists or enrollment caps. States may also receive federal matching funds to cover “optional” services (e.g., adult dental care and home care, also known as home- and community-based services) or “optional” groups (e.g. people with income above the limits established for core populations). States also have discretion to determine how to purchase covered services (e.g., through fee-for-service or capitated managed care arrangements) and to establish provider payment methods and rates.
Both the federal government and states are responsible for promoting program integrity. Program integrity broadly refers to the proper management and function of the Medicaid program to ensure it is providing quality and efficient care while using funds–taxpayer dollars–appropriately, with minimal waste. Program integrity efforts, historically, have worked to prevent and detect fraud, waste, and abuse; to increase program transparency and accountability; and to work on corrective action plans and recover improperly used funds. Improper payments, which are often cited when discussing program integrity, are not a measure of fraud but payments that do not meet Centers for Medicare and Medicaid Services (CMS) program requirements. CMS’s Medicaid Payment Error Rate Measurement (“PERM”) program estimated the overall Medicaid improper payment rate was about 6% in 2025. Most improper payments (77% in 2025) are due to insufficient information (or missing administrative steps), not necessarily due to payments for ineligible enrollees, providers, or services (i.e. since they may have been payable if the missing information had been on the claim and/or the state had complied with requirements).
How much does Medicaid cost and how are funds spent?
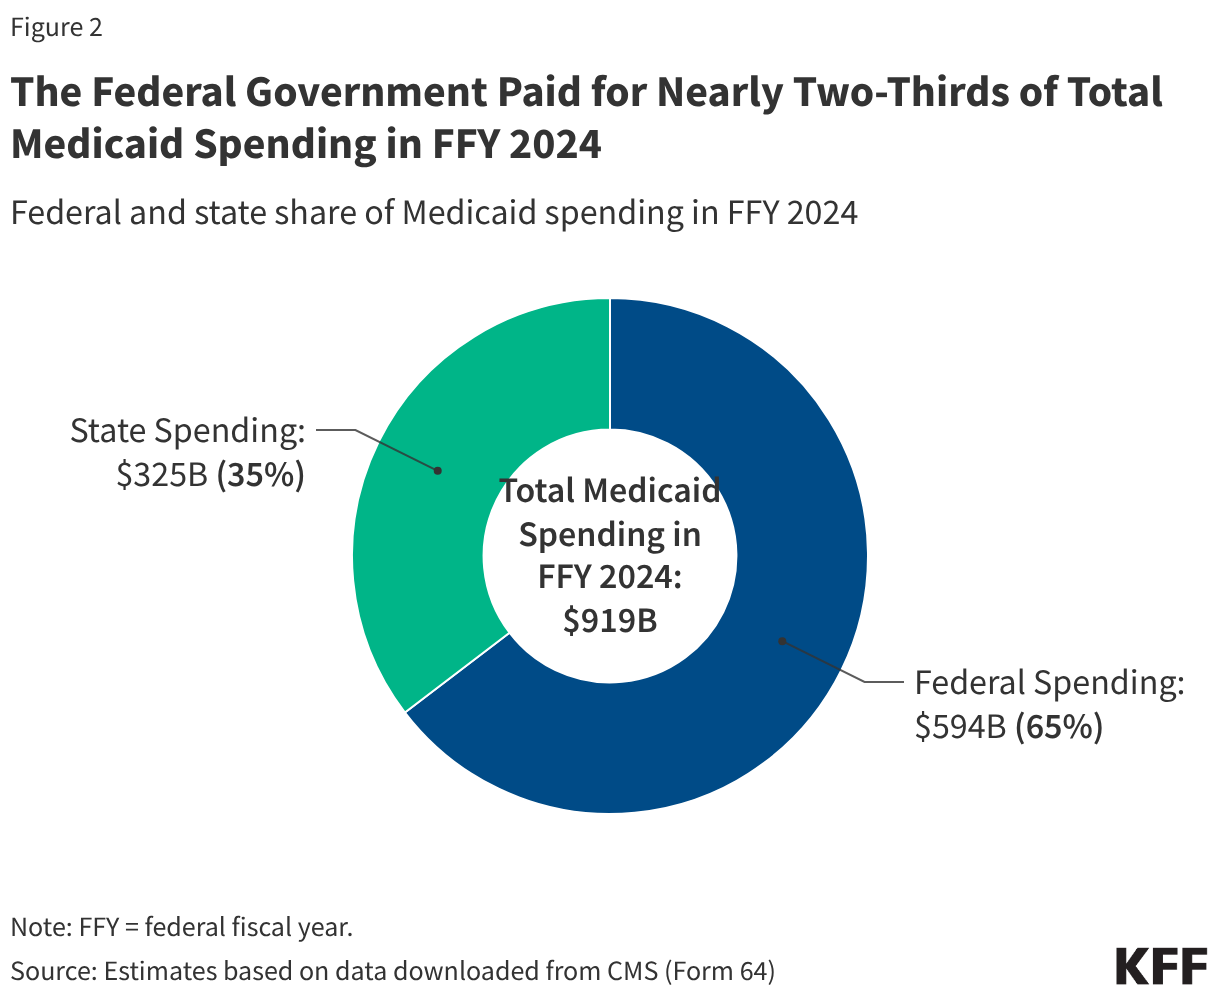
Overall, Medicaid spending totaled $919 billion in FFY 2024 with the federal government paying nearly two-thirds (65% or $594 billion) and states paying over one-third (35% or $325 billion) (Figure 2). The overall share of federal spending on Medicaid depends on states’ per capita income (lower income states receive a higher match) and whether they adopted the ACA expansion (which has a 90% match).
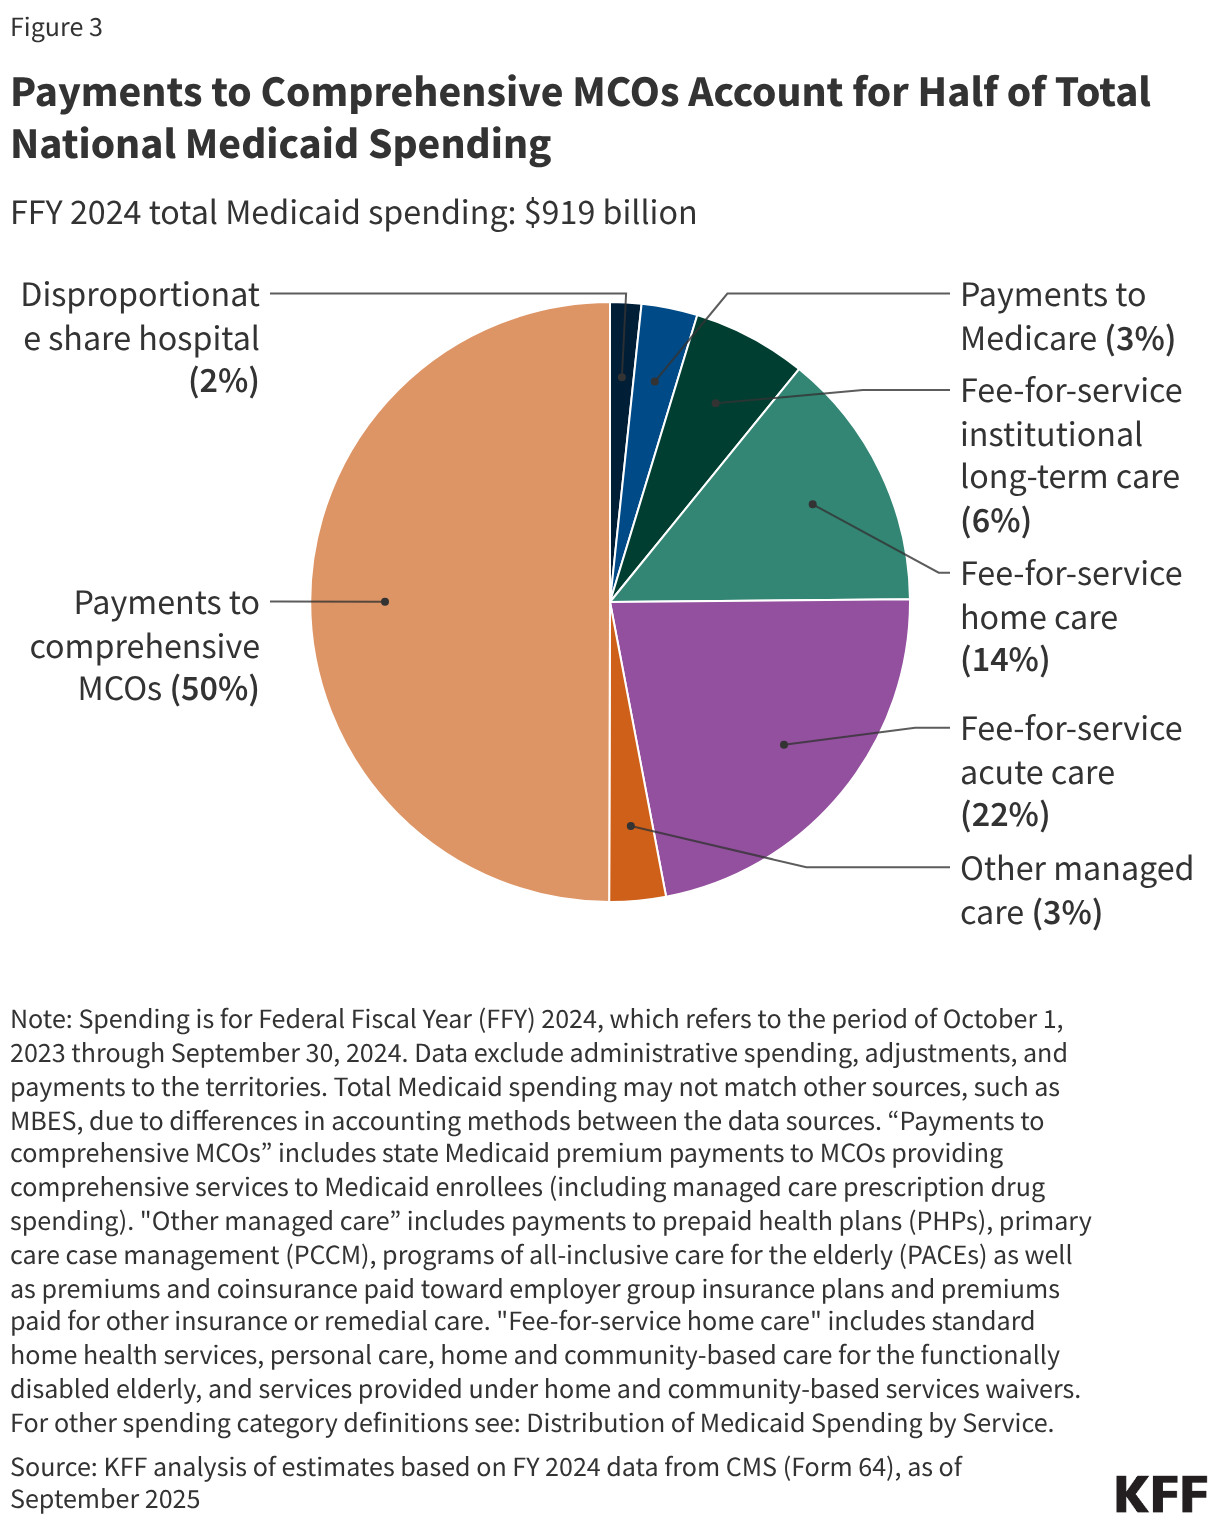
Capitated payments to Medicaid managed care organizations (MCOs) accounted for half of Medicaid spending in FFY 2024 (Figure 3). Managed care and health plans accounted for the largest share (53%) of Medicaid spending, with capitated payments to comprehensive MCOs accounting for 50% of Medicaid spending in FFY 2024 and other Medicaid managed care (e.g., primary care case management (PCCM) arrangements or payments to specialty plans) accounting for another 3%. Smaller shares of total Medicaid spending in FFY 2024 were for fee-for-service acute care (22%), fee-for-service long-term care (20%), Medicaid spending for Medicare premiums on behalf of enrollees who also have Medicare (3%), and disproportionate share hospital (DSH) payments (2%).
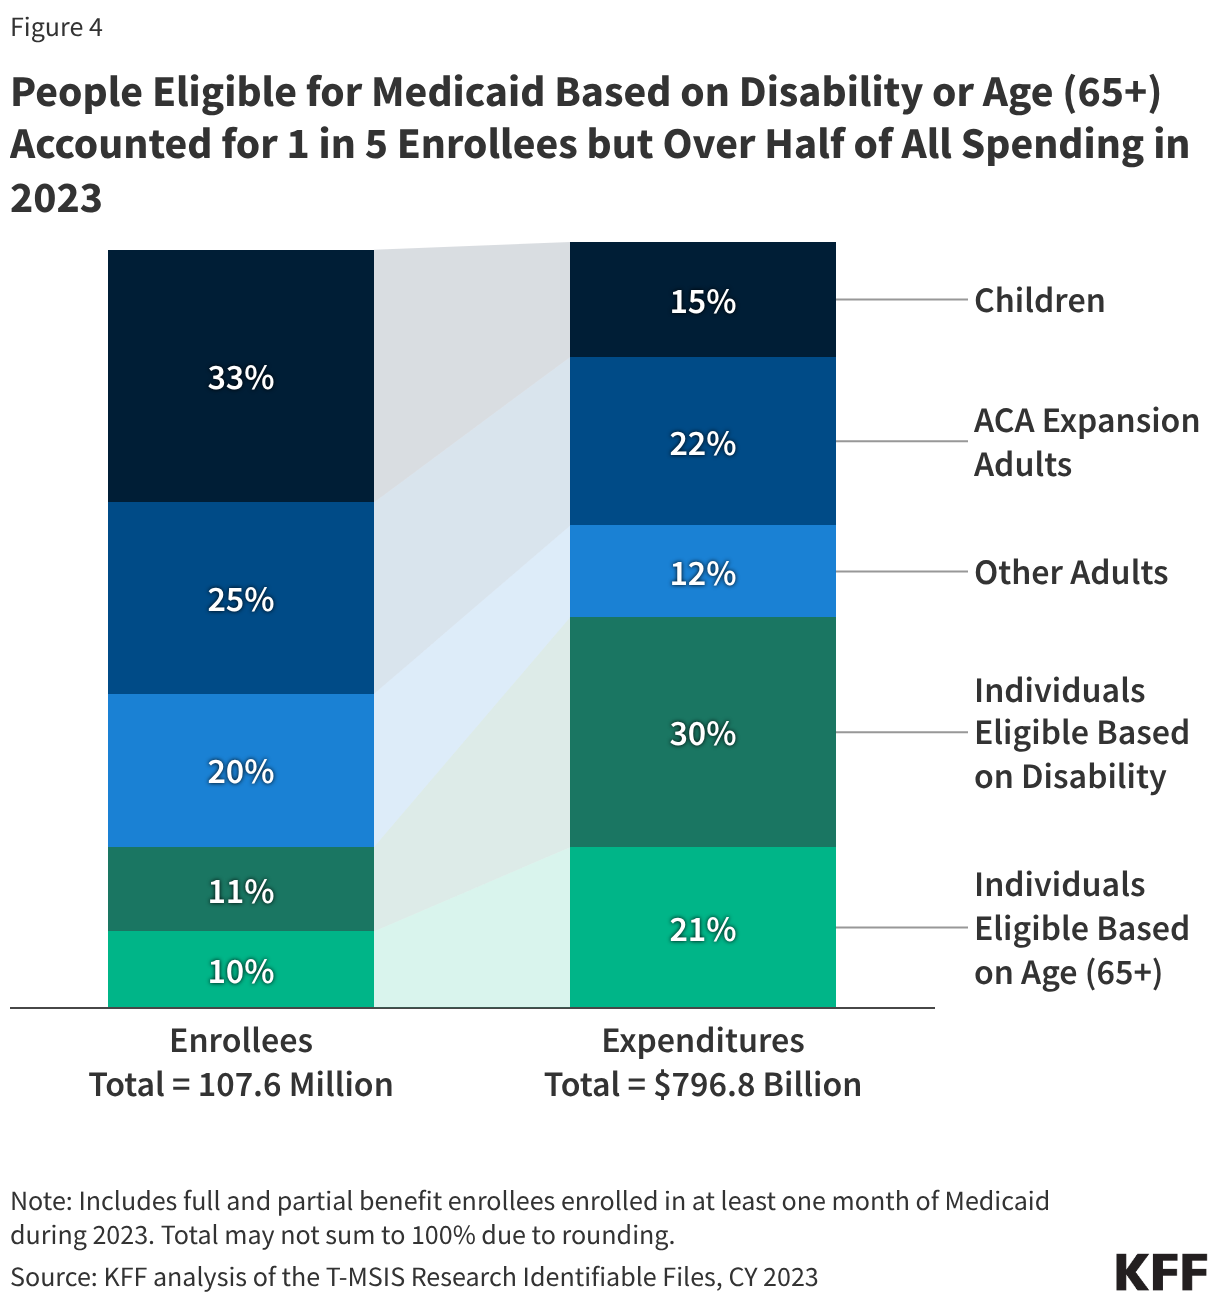
Enrollees eligible based on disability or age (65+) comprise about one in five of all Medicaid enrollees but account for over half of total spending due to higher per person costs (Figure 4). Children account for 33% of enrollees but only 15% of spending. Adult enrollees (those made eligible under the ACA Medicaid expansion, as well as low-income parents) account for 45% of all enrollees and 34% of spending. The disproportionate spending on certain eligibility groups stems from variation in spending per enrollee across the eligibility groups, reflecting differences in health care needs and utilization. Spending per enrollee for individuals eligible based on age (65+) and disability, the two groups with the highest per enrollee costs, is approximately six times higher than spending per enrollee for children, who had the lowest spending of any eligibility group. Those eligible on the basis of age or disability tend to have higher rates of chronic conditions, more complex health care needs and are more likely to utilize long-term care than other enrollees, contributing to higher spending.
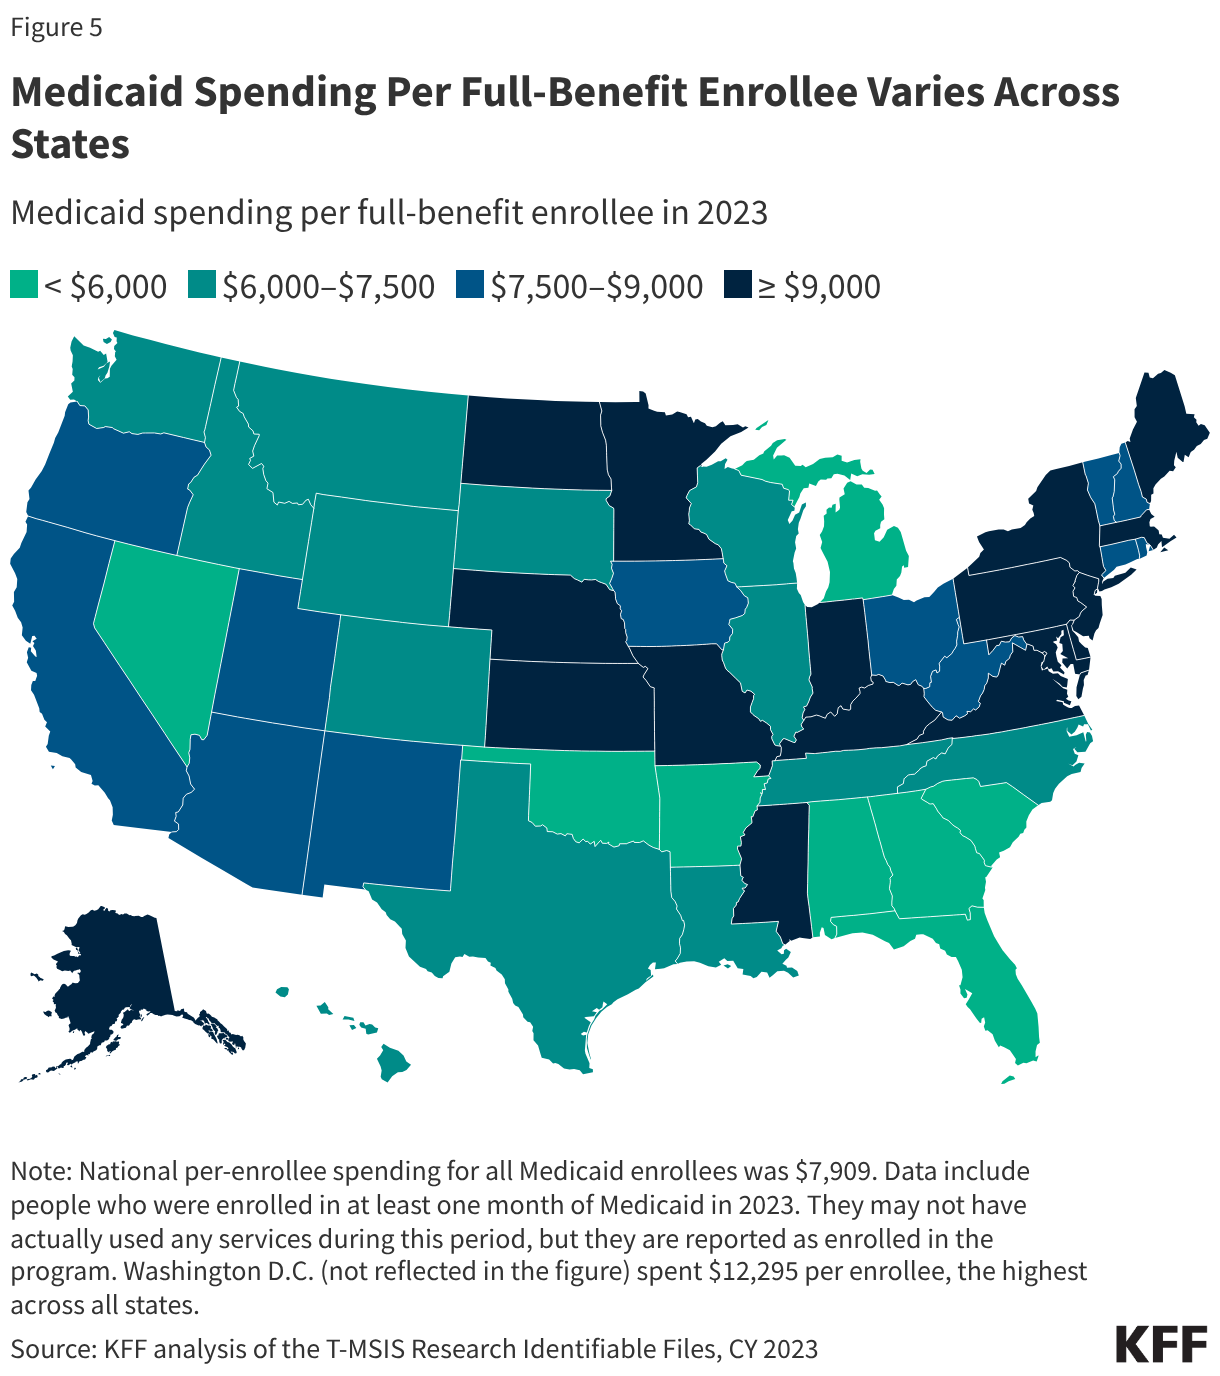
Total spending per full-benefit enrollee ranged from a low of $4,780 in Alabama to $12,295 in D.C. in 2023 (Figure 5). Variation in spending across the states reflects considerable flexibility for states to design and administer their own programs – including what benefits are covered and how much providers are paid — and variation in the cost of living and the health and population characteristics of state residents. Within each state, there is also substantial variation in the average costs for each eligibility group and within each eligibility group, per enrollee costs may vary significantly. Overall, Medicaid spending has experienced slower cumulative growth since 2008 compared to private insurance on a per-enrollee basis.
Medicaid spending includes payments to providers, particularly hospitals, that include base rates as well as supplemental payments. Supplemental payments generally add on to “base” payments from fee-for-service Medicaid or from Medicaid managed care organizations, both of which don’t always cover the costs of providing services.There are various types of supplemental payments (see Box 1), and their use varies by state.
Box 1: Types of Medicaid Supplemental Payments
“Disproportionate share hospital” (DSH) payments ($15 billion in FFY 2024) pay hospitals that serve a large number of Medicaid and low-income uninsured patients to offset uncompensated care costs. Federal DSH spending is capped for each state and facility but within those limits, states have considerable discretion in determining the amount of DSH payments to each DSH hospital. The ACA called for a reduction in federal DSH allotments starting in FFY 2014 based on the assumption of reduced rates of uninsurance, but the cuts have been delayed several times and have yet to go into effect. DSH payments are intended to supplement Medicaid payment rates and to help defray the costs of care provided to people without health insurance.
States may make other non-DSH supplemental payments to providers ($39 billion in FFY 20241). Upper payment limits (UPLs) are the most common, and permit states to make up the difference between Medicaid fee-for-service payments and what Medicare would pay for comparable services. As such, the maximum payment rate for UPLs is what Medicare would pay in most cases. Other types of supplemental payments include payments for graduate medical education and those authorized under various demonstration programs. Most supplemental payments are made to hospitals, but some go to mental health facilities, nursing facilities, intermediate care facilities, physicians and other practitioners. For physician and other practitioners, UPLs are set at average commercial rates, which tend to be much higher than Medicare rates.
Subject to CMS approval, states may implement “state directed payments” that require managed care plans to make certain types of payments to health care providers (estimated to be well over $100 billion each year). State directed payments are generally aimed at bolstering provider payment rates to increase access to or quality of care. Prior to passage of the 2025 reconciliation law, the total payment made through state directed payments and base MCO payments was capped at average commercial rates for hospital services, nursing facility services, and professional services at academic medical centers.
How does Medicaid relate to federal and state budgets?
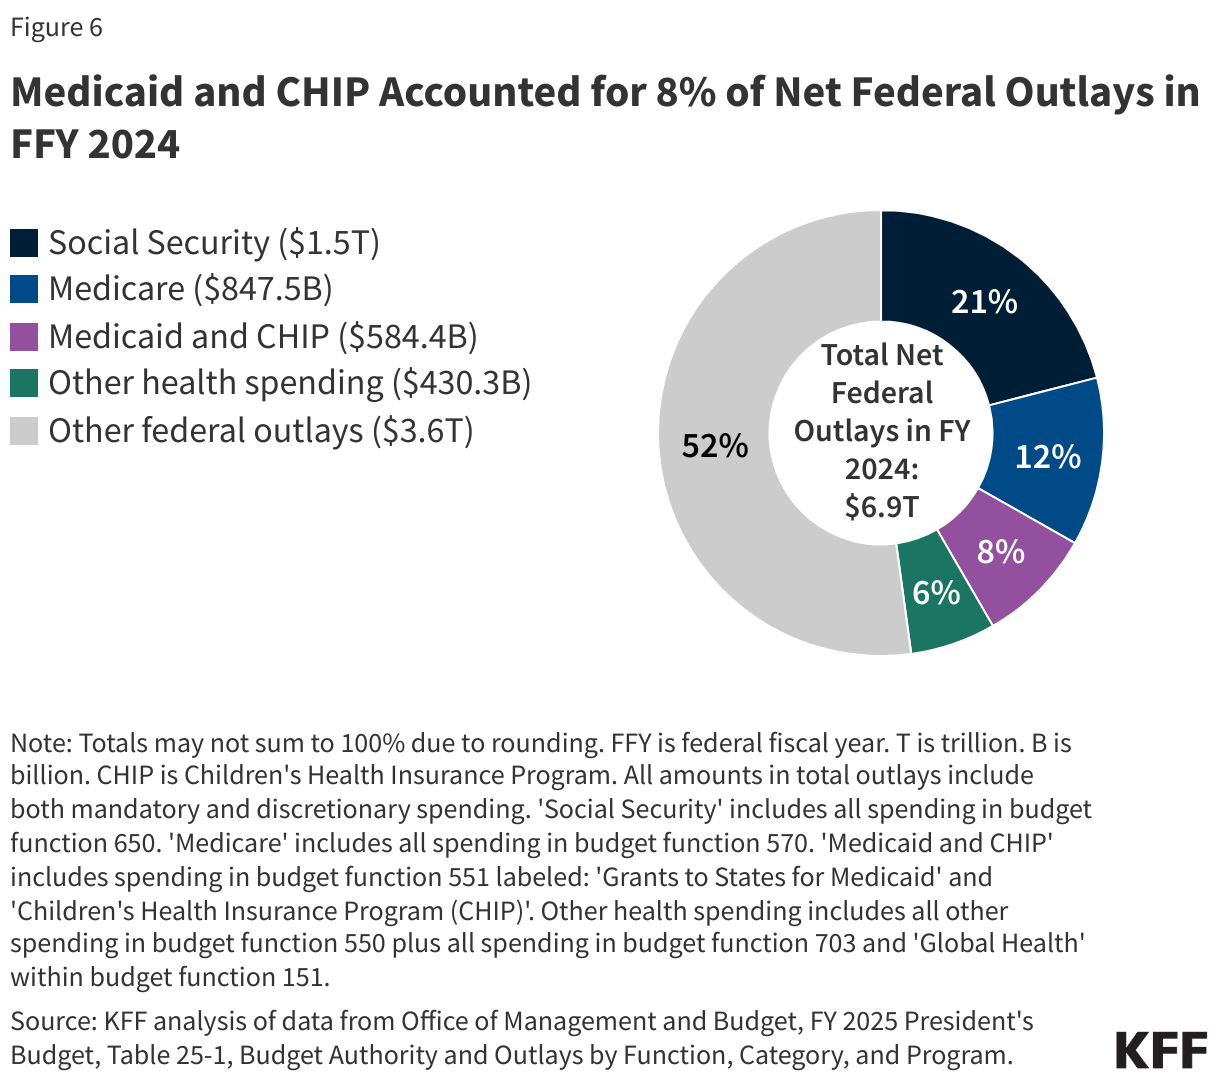
Social Security, Medicare, and Medicaid are the three main entitlement programs and accounted for 41% of all federal outlays in FFY 2024 (Figure 6). Of these three programs, Medicaid is smallest in terms of federal outlays, though it covers a larger number of people than Medicare or Social Security. Overall, federal spending on domestic and global health programs and services accounted for more than one-fourth of net federal outlays in FFY 2024, including spending on Medicare (12%), Medicaid and CHIP (8%), and other health spending (6%). (The numbers in Figure 6 come from the FFY 2025 budget request. The FFY 2026 budget request did not include full data on prior years’ spending, and the FFY 2027 budget request has not been posted as of the writing of this issue brief.)
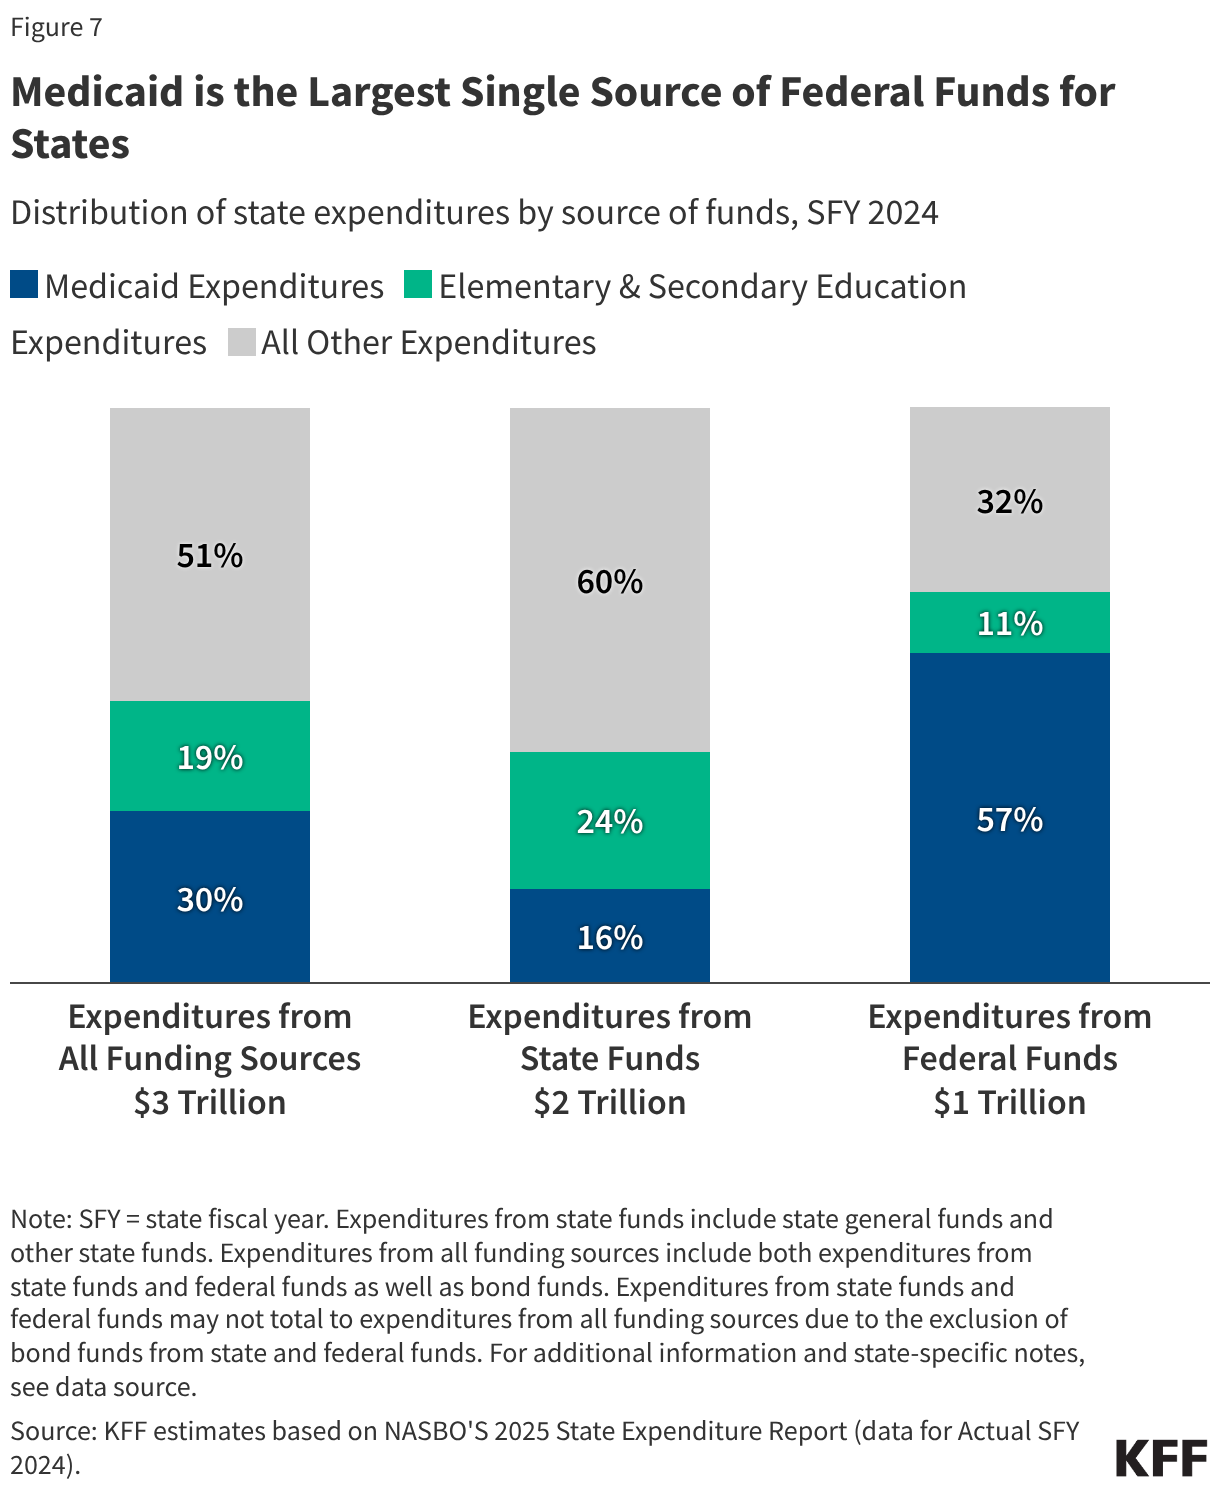
Medicaid is often central to state fiscal decisions as it is simultaneously a significant spending item as well as the largest source of federal revenues for states due to the federal matching structure. According to data from the National Association of State Budget Officers (NASBO), in state fiscal year (SFY) 2024, Medicaid accounted for 30% of total state spending for all items in the budget (Figure 7). Medicaid accounted for only 16% of expenditures from state funds (including state general funds and other state funds), second to K-12 education (24%). On the other hand, Medicaid accounted for 57% of all expenditures from federal funds. States have an incentive to control Medicaid spending because they pay a share of Medicaid costs, though states must reduce total Medicaid spending by more than one dollar to achieve a dollar in savings due to the federal matching structure. At the same time, research shows that federal matching dollars from Medicaid spending have positive effects for state economies. A number of studies show that states that have adopted the ACA Medicaid expansion have realized budget savings, revenue gains, overall economic growth as well as observed positive effects on the finances of hospitals and other health care providers.
States can use a variety of methods to pay for the state share of Medicaid spending. States have flexibility in determining how to finance the state (or non-federal) share of Medicaid payments, within certain limits. In addition to state general funds appropriated directly to the Medicaid program, most states also rely on funding from health care providers and local governments generated through provider taxes and donations, intergovernmental transfers (IGTs), and certified public expenditures (CPEs). KFF’s 2025 Medicaid budget survey found that general funds accounted for a median of 70% of the non-federal share in SFY 2026 enacted budgets, while provider taxes accounted for 18% and funds from local governments or other sources accounted for 6%, though there was considerable variation across states.
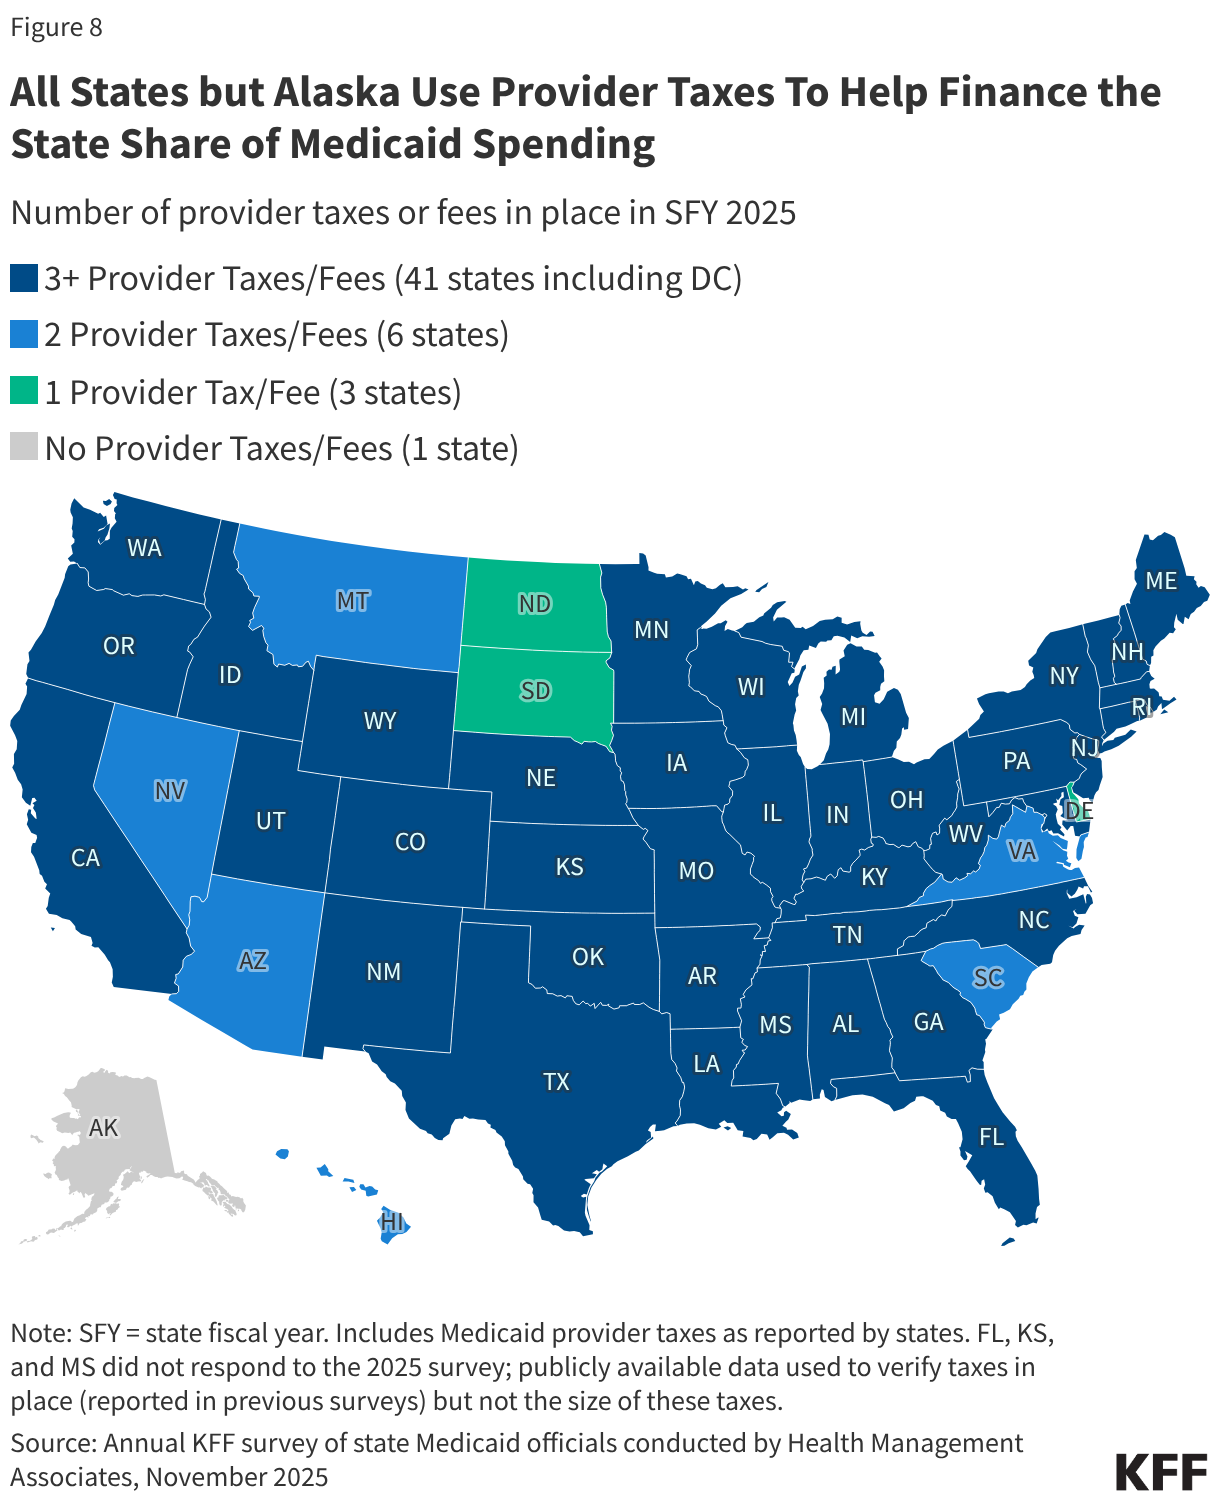
All states (except Alaska) have at least one provider tax in place and many states have more than three (Figure 8). Medicaid provider taxes are defined as those for which at least 85% of the tax burden falls on health care items or services or entities that provide or pay for health care items or services. Provider taxes fall on a wide range of provider types but are most common for institutional providers including hospitals (47 states), nursing facilities (45 states), and intermediate care facilities for people with intellectual or developmental disabilities (33 states). States use provider tax revenues to fund Medicaid “base” rates as well as supplemental payments (including state directed payments); to finance eligibility expansions (including the ACA Medicaid expansion); or to more generally support the Medicaid program. Smaller sources of state share funding include IGTs, CPEs, and provider donations (see Box 2).
Box 2: State Share Funding Sources Beyond Provider Taxes
Intergovernmental transfers (IGTs) are transfers of public funds between governmental entities (such as county government or state university hospital transferring funding to the state Medicaid agency). Similar to provider taxes, IGTs may be used to finance payments for providers but also finance overall Medicaid spending.
Provider donations are voluntary contributions from health care providers or related entities to the state or local government, which are only permissible if they are “bona fide” and not related to the payments the provider receives from Medicaid. (Provider donations of up to $5,000 per year for an individual provider and up to $50,000 per year for health care organizations are presumed to be bona fide.) Similar to provider taxes and IGTs, provider donations may be used to finance various types of Medicaid spending.
Certified public expenditures (CPEs) are certifications by a governmental entity (such as a county hospital or schools) that authorized funds were spent on Medicaid expenses. Unlike other types of Medicaid financing, CPE funds are not transferred from a governmental entity to the state for use as a non-federal funding source. Instead, the government entity that provides the services certifies that it has expended the dollars on Medicaid-covered services. CMS provides states with the federal share of the total amount paid by the government entity and encourages (but does not require) states to reimburse the provider for the federal share of costs
What factors affect Medicaid spending and what is the impact of recent policy changes?
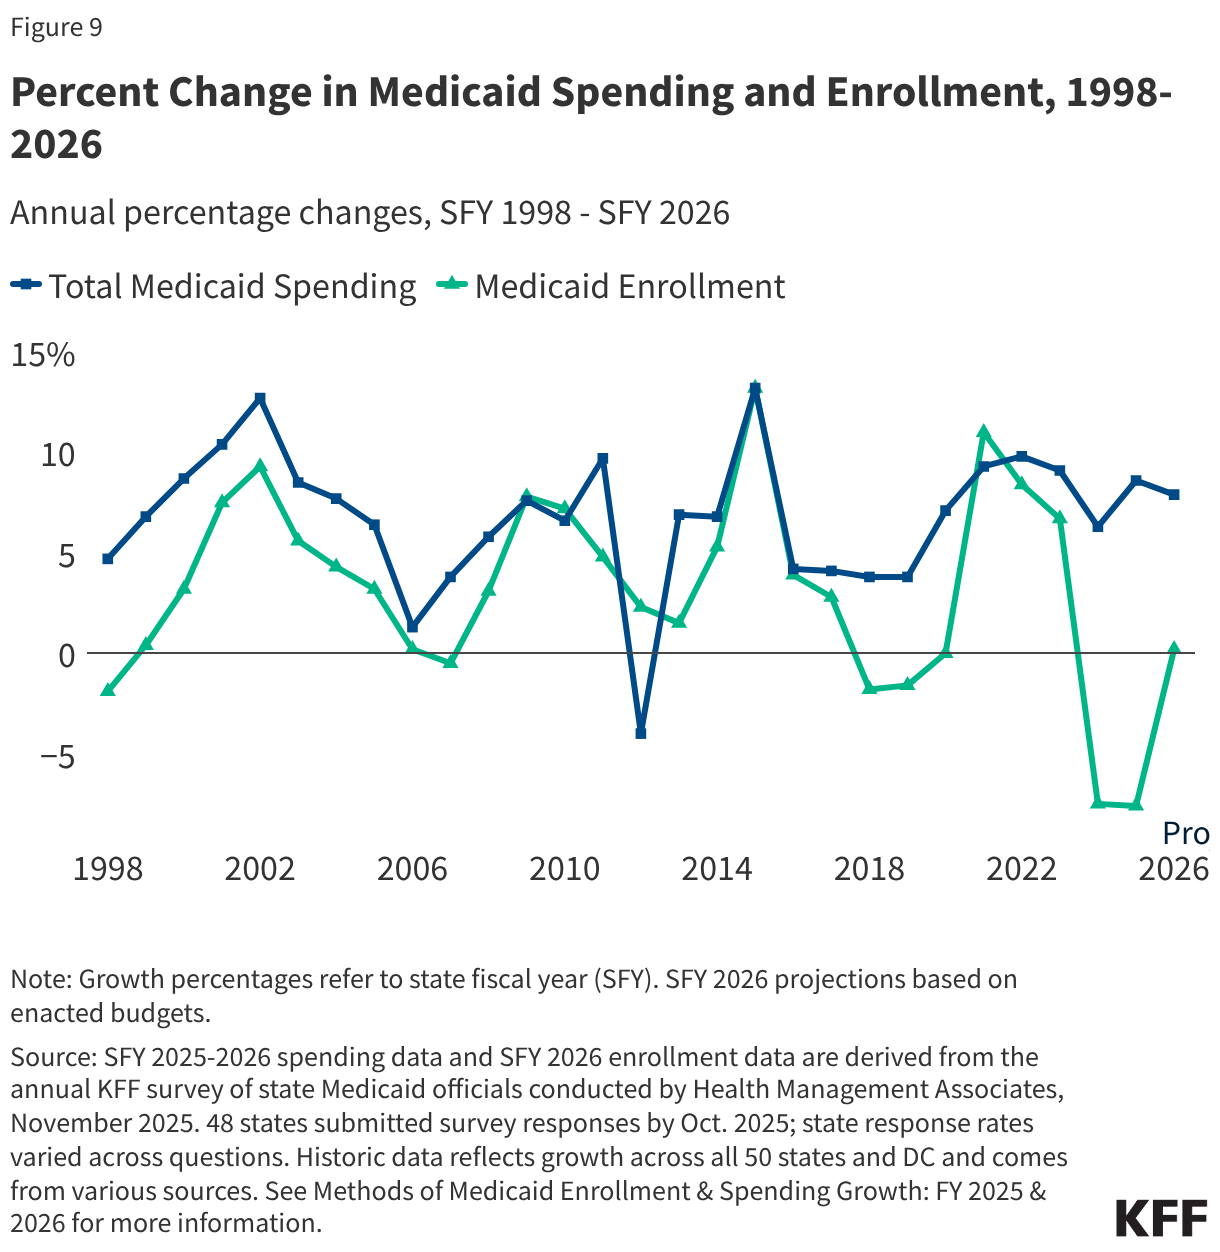
Medicaid spending is driven by multiple factors, including the number and mix of enrollees, their use of health care and long-term care, and the prices of Medicaid services. High enrollment growth rates, tied first to the Great Recession, then ACA implementation, and later the pandemic-era continuous enrollment provision, were the primary drivers of total Medicaid spending growth over the last two decades (Figure 9). However, by SFY 2026, the pandemic-era federal support and policies had ended, and states were projecting flat enrollment growth but increasing total Medicaid spending growth due to several cost pressures including provider and managed care rate increases, greater enrollee health care needs, and increasing costs for long-term care, pharmacy benefits, and behavioral health services.
Medicaid spending is also affected by federal policy changes like those included in the 2025 reconciliation law, which made historic reductions in federal Medicaid spending. The 2025 reconciliation law, signed by President Trump on July 4, 2025, will have a significant impact on Medicaid spending and enrollment trends. Overall, the Medicaid provisions in the new law are expected to reduce federal Medicaid spending by $911 billion (or by 14%) over a decade and increase the number of uninsured people by 7.5 million, though the impacts vary by state.
Changes to Medicaid financing in the 2025 reconciliation law, in particular, are expected to reduce federal Medicaid spending by about $400 billion over a decade. Those changes include:
- Establishing new restrictions on states’ ability to generate Medicaid provider tax revenue, including prohibiting all states from establishing new provider taxes or from increasing existing taxes; reducing existing provider taxes for states that have adopted the ACA Medicaid expansion; and changing the requirements for states to receive waivers that implement various provider taxes.
- Revising the payment limit for state directed payments.
- Imposing a financial penalty for states with eligibility-related improper payment error rates greater than 3%.
- Eliminating the temporary 5% increase in a state’s traditional FMAP for two years to incentivize states to adopt the Medicaid expansion.
Beyond the changes to Medicaid financing, states will be working to implement other major changes to Medicaid, most notably work requirements for adults eligible for Medicaid through the ACA expansion.
Other federal Medicaid financing changes beyond the 2025 reconciliation law will also have implications for Medicaid spending. These include the following.
- CMS has an enhanced focus on addressing fraud, waste, and abuse in Medicaid that differs from prior practices by: increasing the use of deferrals (which require states to prove expenditures are allowable before CMS will pay for the federal share of spending), potentially withholding federal funding when future fraud is expected as was done recently in Minnesota (rather than the historic process of identifying fraud, working with a state on a corrective action, and then retroactively denying payment for disallowed expenditures), and publishing provider-level spending data to spur analysis of potential fraud, waste, and abuse by private individuals and organizations.
- There will be additional regulations coming to implement requirements in the 2025 reconciliation. For example, a proposed rule is under review at the Office of Management and Budget to implement new requirements governing provider taxes.
- CMS has indicated interest in potentially changing requirements governing how states finance the state share of Medicaid, including a recent request for information about ways CMS can “improve the prevention, identification, and resolution of fraud, waste, and abuse related to non-federal share financing sources, including intergovernmental transfers.”
- Puerto Rico’s FMAP will revert to 55% from 76% after FFY 2027 without further legislative action.
As states respond to federal Medicaid cuts and shifting state fiscal conditions, changes to benefits, provider payment rates, and eligibility could further limit Medicaid spending. Amid federal funding cuts and policy changes, states are experiencing a more tenuous fiscal climate due to slowing revenue growth and increasing spending demands. The challenging fiscal climate across many states and the magnitude of federal Medicaid cuts will make it difficult for states to absorb or offset the reductions, and states may seek to restrict Medicaid provider reimbursement rates, benefits, or eligibility in response to reduce state Medicaid spending. Even though many provisions in the reconciliation law do not take effect immediately, a few states have already implemented Medicaid spending cuts for SFY 2026 or are proposing cuts for SFY 2027.
Endnotes
- This includes non-DSH other supplemental payments to inpatient and outpatient hospitals as well as other providers. Total based on FFY 2024 data downloaded from CMS (Form 64) for the following service categories: Clinic Services – Sup. Payments, Critical Access Hospitals Inpatient – Sup. Payments, Critical Access Hospitals Outpatient – Sup. Payments, Inpatient Hospital – Sup. Payments, Inpatient Hospital – GME Sup. Payments, Intermediate Care Facility – Individuals with Intellectual Disabilities (ICF/IID): Supplemental Payments, Non-Emergency Medical Transportation – Sup. Payments, Nursing Facility Services – Sup. Payments, Other Practitioners Services – Sup. Payments, Outpatient Hospital Services – Sup. Payments, and Physician & Surgical Services – Sup. Payments. Total may not match other estimates of non-DSH supplemental payments due to differences in included provider types and/or types of payments. ↩︎