Medicaid Enrollment and Unwinding Tracker
Enrollment Data
Note: The data presented below are updated monthly as new Medicaid/CHIP enrollment data become available.
The Medicaid Enrollment and Unwinding Tracker presents the most recent data on monthly Medicaid/CHIP enrollment reported by the Centers for Medicare & Medicaid Services (CMS) as part of the Performance Indicator Project as well as archived data on renewal outcomes reported by states during the unwinding of the Medicaid continuous enrollment provision. The unwinding data were pulled from state websites, where available, and from CMS.
Medicaid/CHIP Enrollment Trends
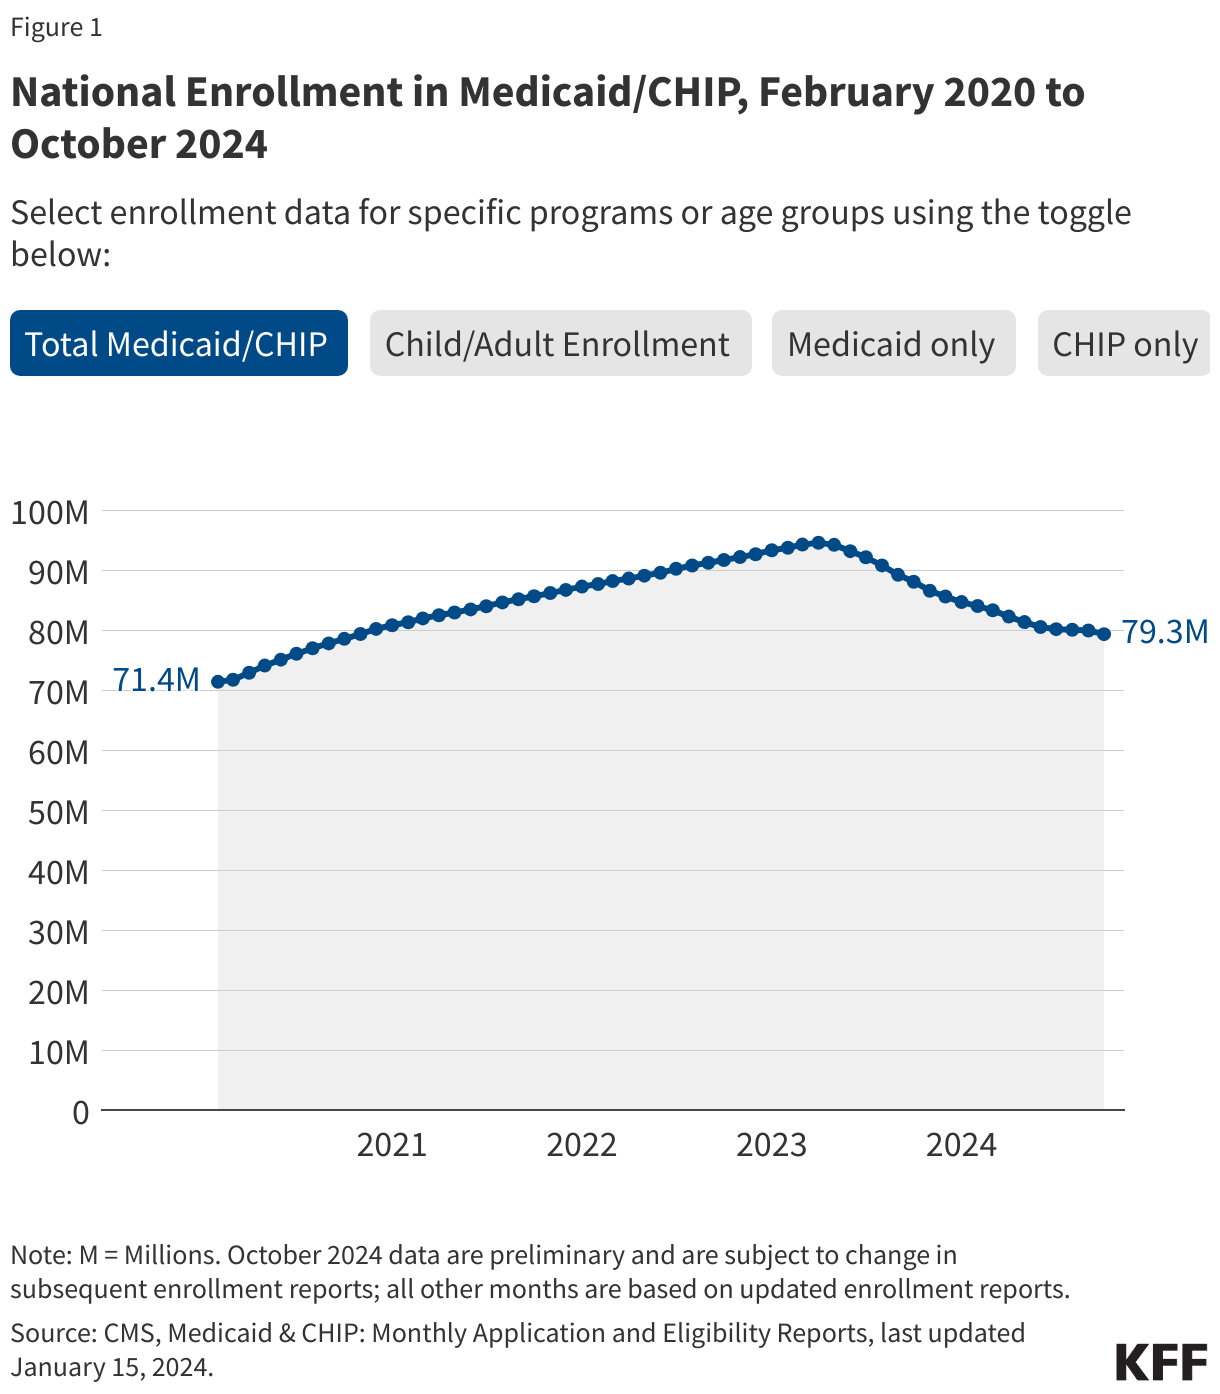
Medicaid/CHIP enrollment trends generally use February 2020 as the baseline month because it was the month prior to the start of the COVID-19 pandemic and implementation of the continuous enrollment provision. During continuous enrollment, which was in place during the three years of the pandemic, states paused Medicaid disenrollments. As a result, when the continuous enrollment provision ended in March 2023, national Medicaid/CHIP enrollment had increased to a record high of 94 million enrollees. Beginning April 1, 2023, states could resume disenrolling people after conducting renewals to verify eligibility for the program, though some states delayed the start of their unwinding periods until May, June, or July 2023. Most states took 12 months to complete unwinding renewals and nearly all states completed renewals by August 2024.
The figures below show Medicaid and CHIP enrollment from February 2020 through the most current month of available data. Some figures also include enrollment for adults and children in Medicaid/CHIP. Key enrollment trends as of October 2025 include:
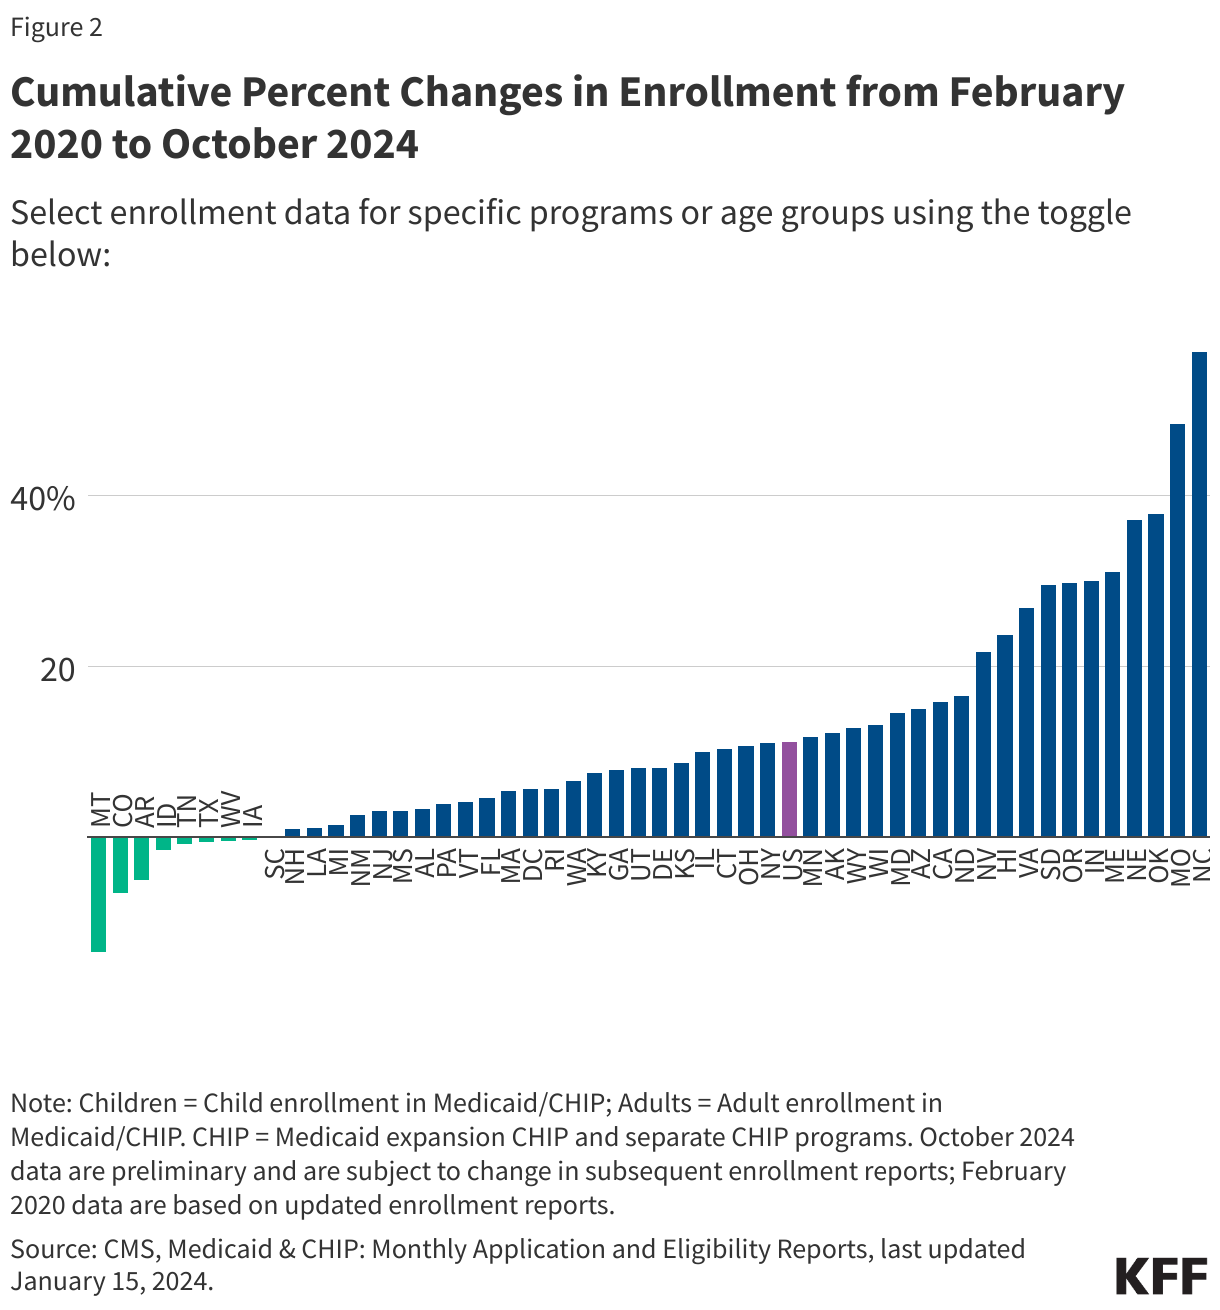
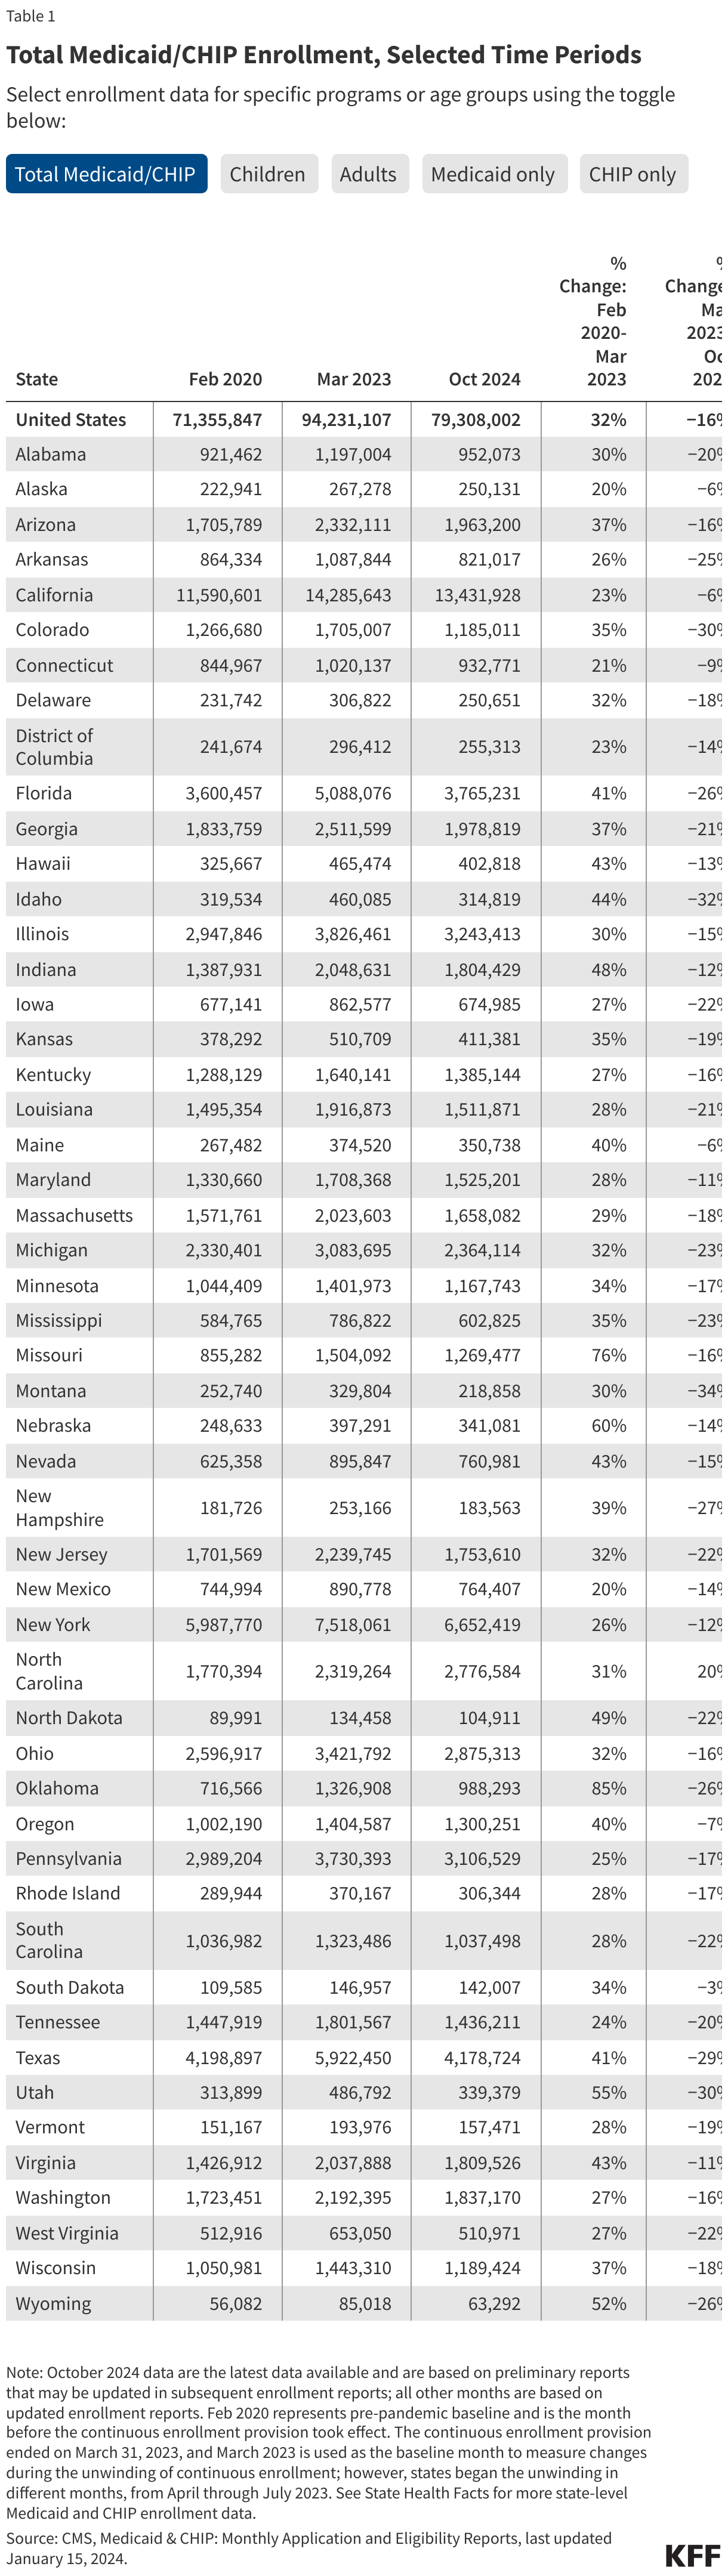
- There are 76.8 million people enrolled in Medicaid/CHIP nationally (Figure 1). This represents an 19% decline from total Medicaid/CHIP enrollment in March 2023, but is still 7% higher than Medicaid/CHIP enrollment in February 2020, prior to the pandemic (Figure 2 and Table 1).
- Several factors likely explain why national Medicaid/CHIP enrollment is higher than pre-pandemic enrollment. The pandemic may have encouraged some people who were previously eligible for Medicaid but not enrolled to newly enroll in the program. During the unwinding, many states took steps to improve their renewal processes, which reduced the number of people who were disenrolled despite remaining eligible. In addition, some states expanded eligibility for certain groups since the start of the pandemic, such as the Affordable Care Act’s (ACA) Medicaid expansion.
- Medicaid/CHIP enrollment is higher than pre-pandemic levels in all but fourteen states (AK, AR, CO, ID, IA, LA, MI, MT, NH, NM, SC, TN, TX, and WV). Enrollment changes from pre-pandemic baseline vary from a 17% decrease in Montana to a 54% increase in North Carolina (Figure 2). Many of the states with the largest increases in enrollment expanded eligibility since the start of the pandemic. For example, five states (NE, OK, MO, SD, and NC) implemented the Medicaid expansion between October 2020 and December 2023 and Maine increased the income limit for children to qualify for Medicaid.
- In the 49 states and DC with complete enrollment data by age, there are 35.9 million children (48%) and 39.2 million adults (52%) enrolled, a change from pre-pandemic (February 2020) enrollment patterns when children made up a slight majority (51%) of Medicaid/CHIP enrollees (Figure 1).
- Child enrollment in Medicaid/CHIP is below pre-pandemic enrollment in 20 states, while adult enrollment is below pre-pandemic levels in 12 states (Figure 2).
- There are 69.5 million people enrolled in Medicaid and 7.2 million people enrolled in CHIP (Figure 1). More states report Medicaid enrollment above their pre-pandemic baselines compared to the number reporting CHIP enrollment above the baseline (Figure 2).
Unwinding Data – Archived
Note: The data on unwinding renewal outcomes presented below were last updated on September 12, 2024; since most states have now completed the Medicaid unwinding, the information will not be updated again.
As of September 12, 2024 and with nearly complete unwinding data for most states:
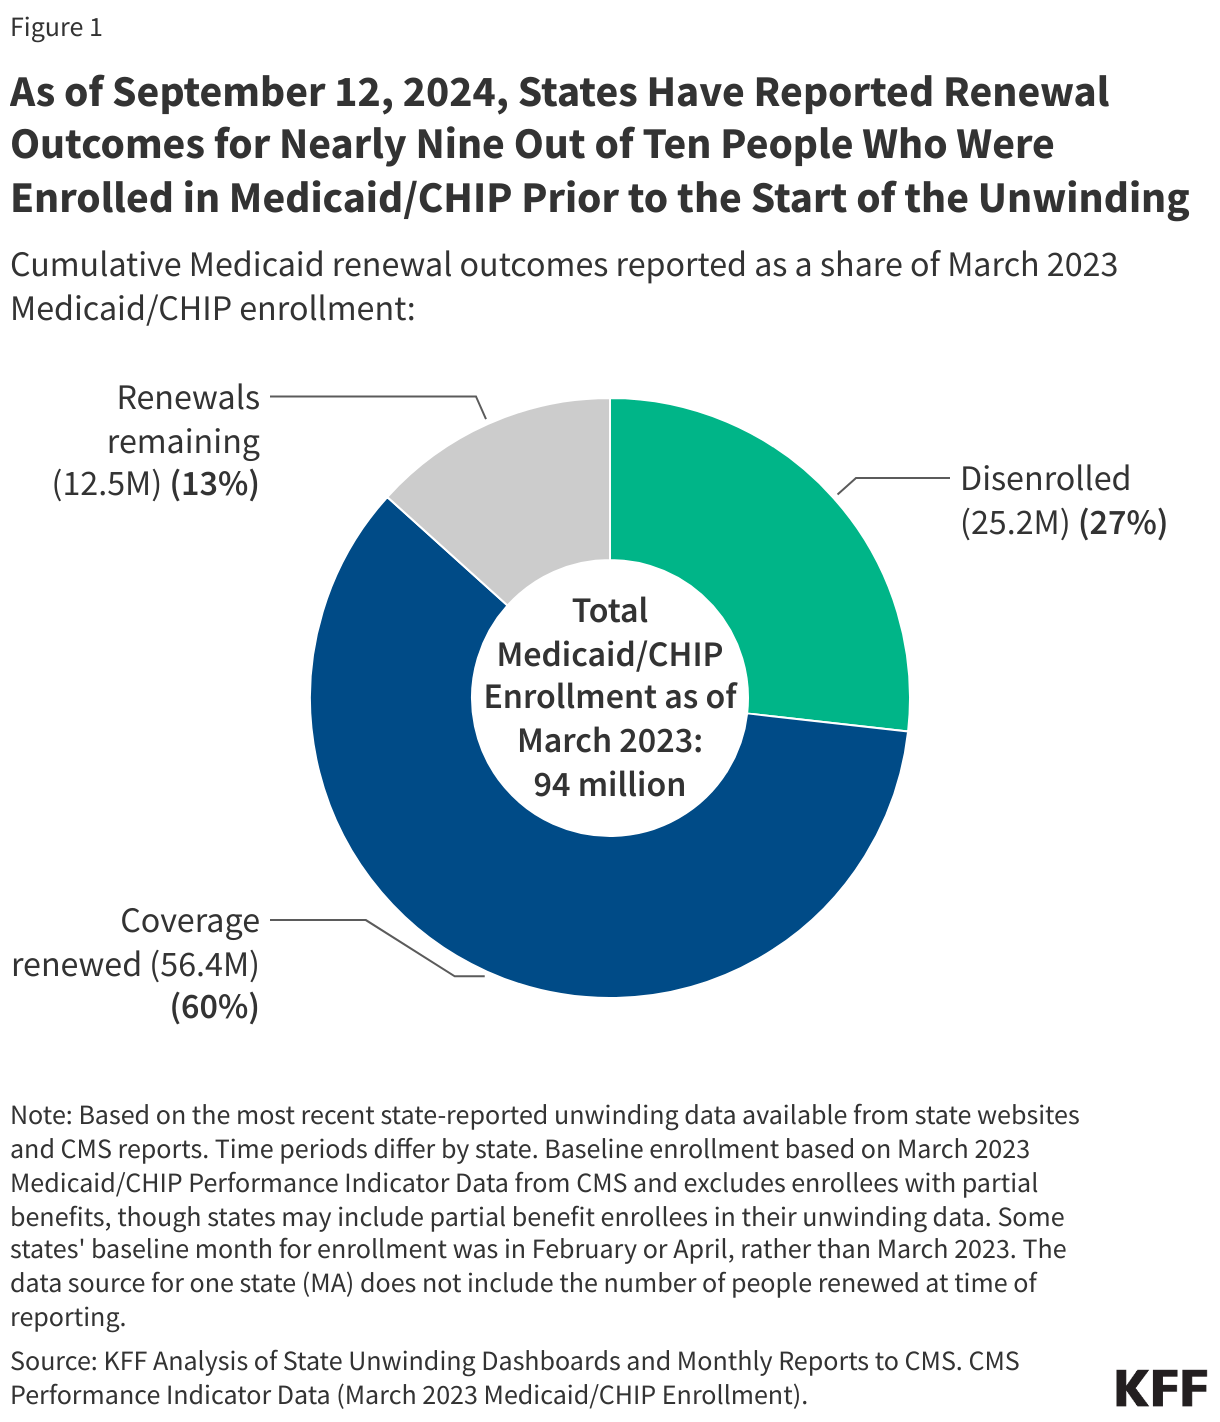
- Over 25 million people were disenrolled (31% of completed renewals) and over 56 million people had their coverage renewed (69% of completed renewals).
- Disenrollment rates varied across states from 57% in Montana to 12% in North Carolina, driven by a variety of factors including differences in renewal policies and procedures as well as eligibility expansions in some states.
- Among those who were disenrolled, nearly seven in ten (69%) were disenrolled for paperwork or procedural reasons while three in ten (31%) were determined ineligible.
- Among those whose coverage was renewed during the unwinding, 61% were renewed on an ex parte, or automated, basis, meaning the individual did not have to take any action to maintain coverage.
State Data on Renewal Outcomes
The data on unwinding-related renewal outcomes presented in this section rely primarily on monthly reports that states were required to submit to the Centers for Medicare & Medicaid Services (CMS) during the unwinding period. The data also reflect updates to the monthly reports that states submit three months after the original report submission to account for the resolution of pending cases and any other changes in renewal metrics. For 13 states, data were pulled from dashboards or reports published on state websites that provide more complete information, and for a few additional states, updated monthly reports were pulled from state websites because they were more timely than what is reported on the CMS website.
To view archived data for specific states, click on the State Data – Archived tab.
Medicaid Disenrollments
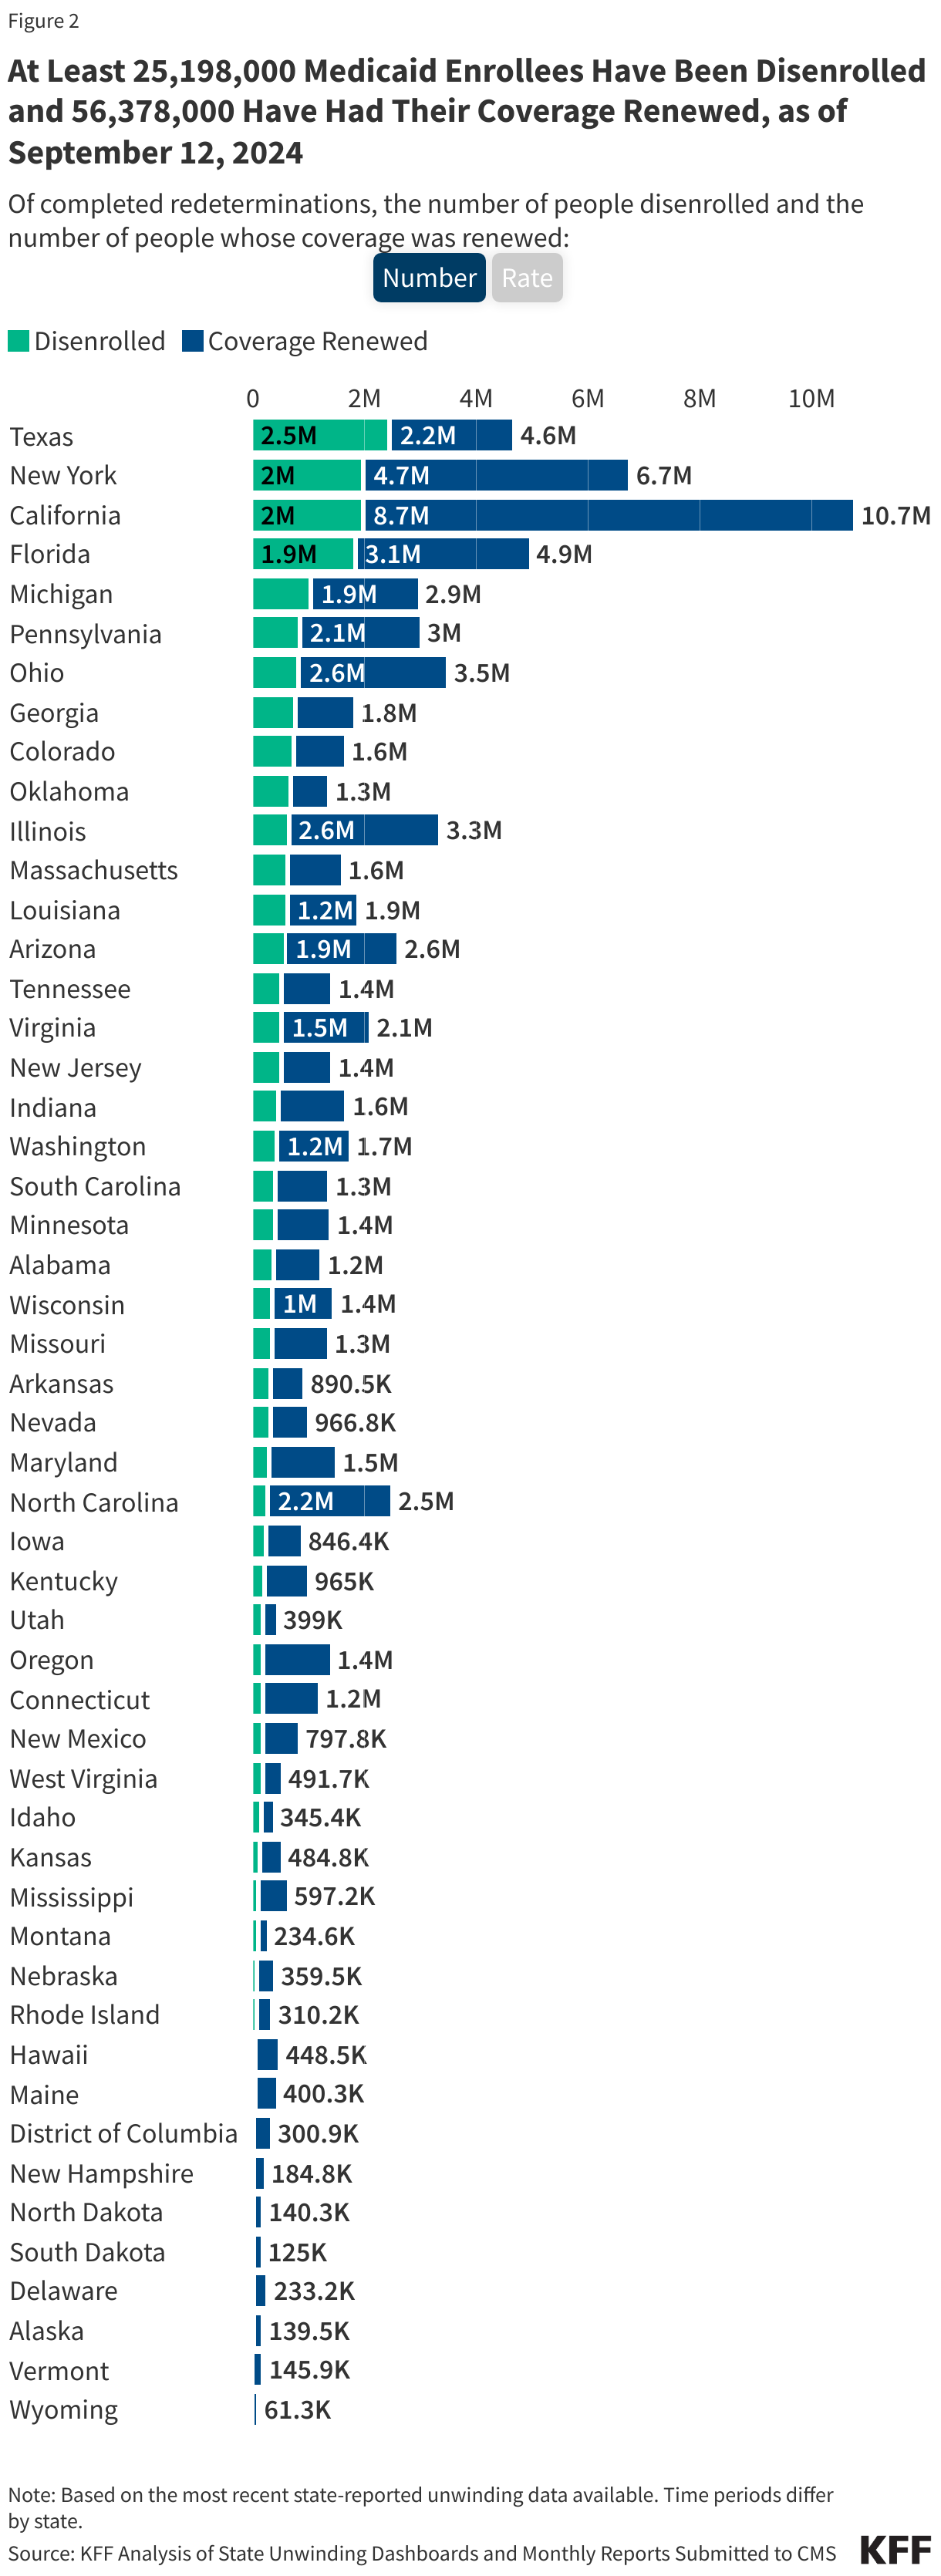
- As of September 12, 2024, at least 25,198,000 Medicaid enrollees had been disenrolled during the unwinding of the continuous enrollment provision. Overall, 31% of people with a completed renewal were disenrolled in reporting states while 69%, or 56.4 million enrollees, had their coverage renewed.
- There is wide variation in disenrollment rates across reporting states, ranging from 57% in Montana to 12% in North Carolina. A variety of factors contribute to these differences, including differences in renewal policies and system capacity. Some states adopted policies that promote continued coverage among those who remain eligible and/or have automated eligibility systems that can more easily and accurately process renewals while other states have adopted fewer of these policies and have more manually-driven systems. In addition, North Carolina and South Dakota adopted Medicaid expansion and other states increased eligibility levels for certain populations (e.g., children, parents, etc.) during the unwinding, which may have lowered disenrollment rates in these states.
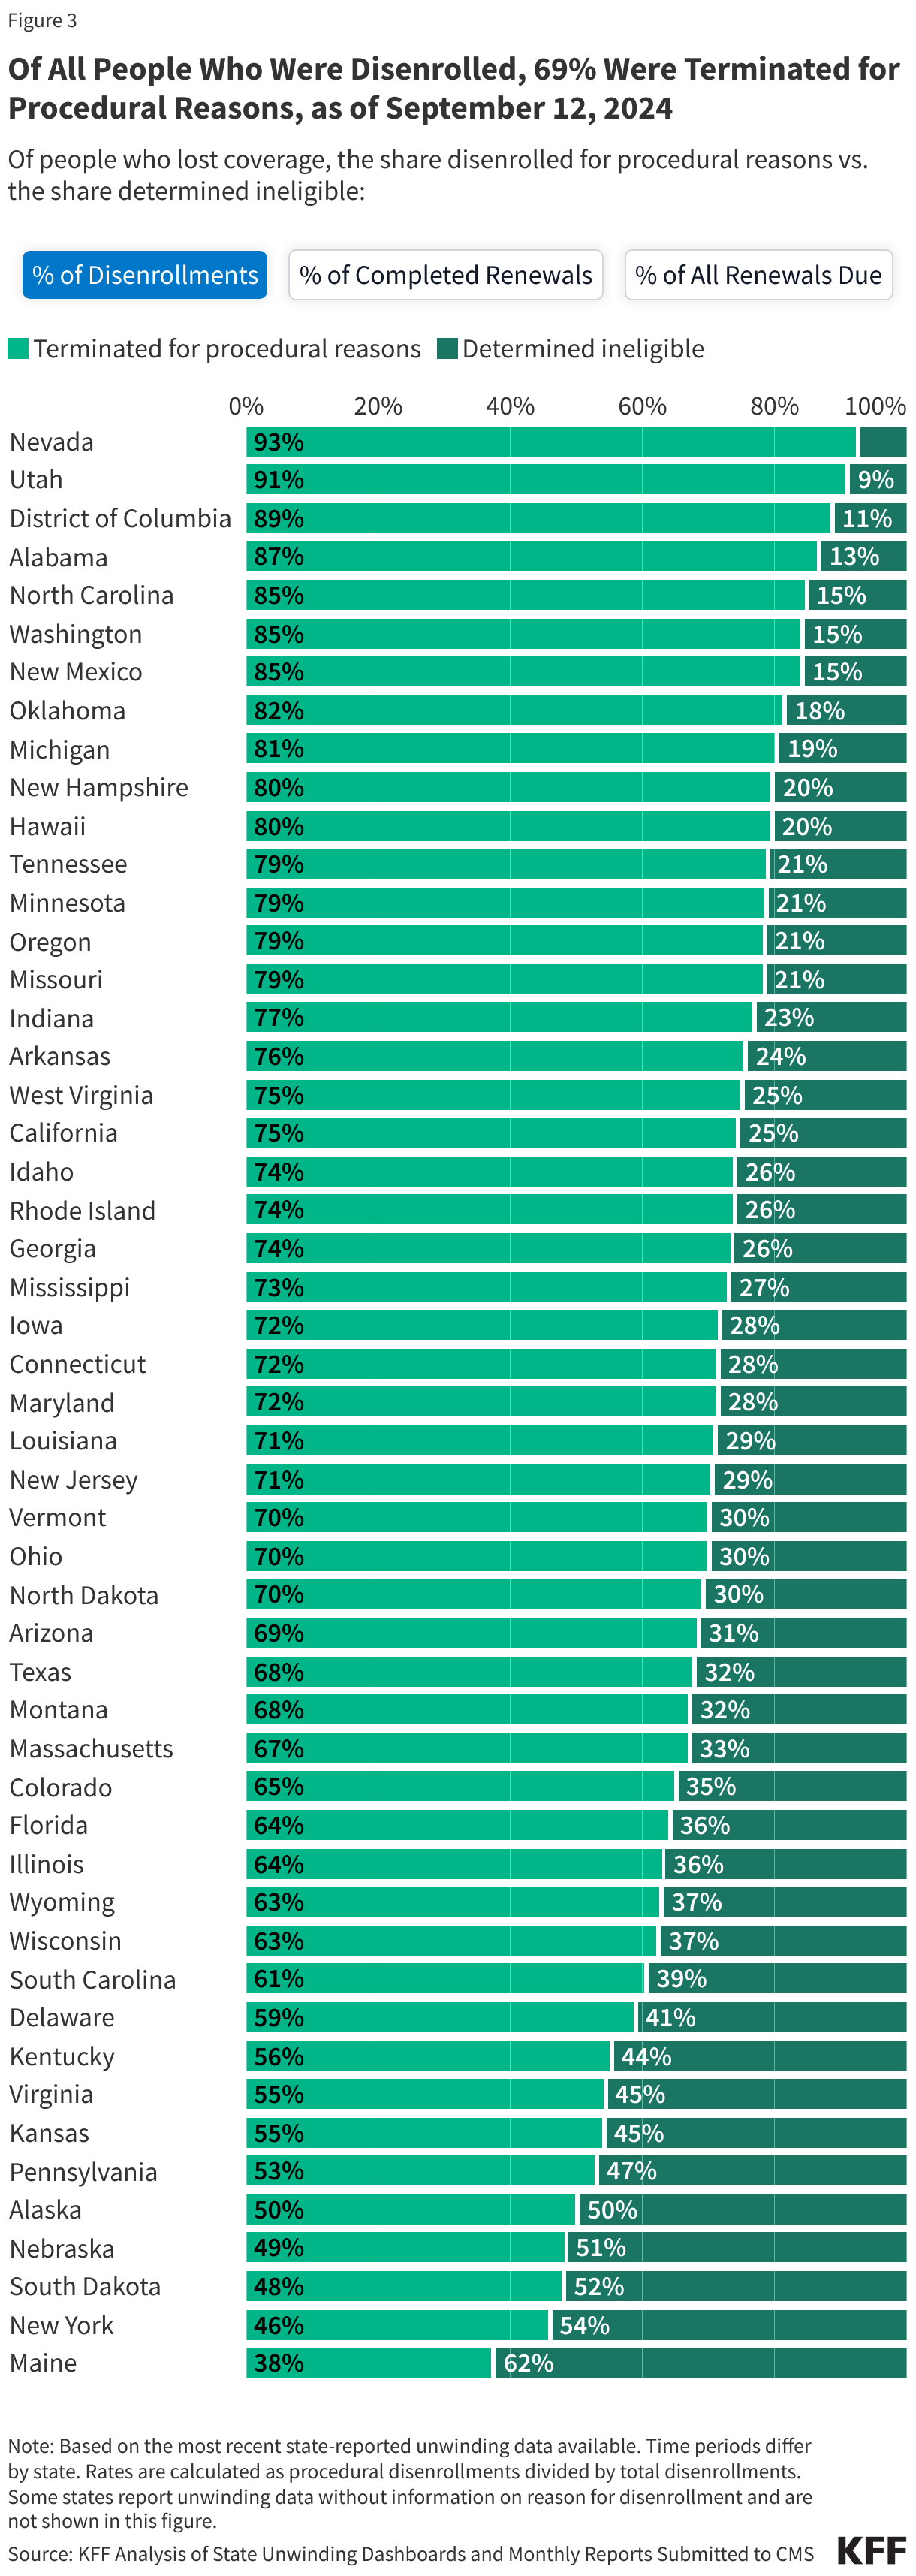
- Across all states with available data, 69% of all people disenrolled had their coverage terminated for procedural reasons. However, these rates vary based on how they are calculated (see note below). Procedural disenrollments are cases where people are disenrolled because they did not complete the renewal process and can occur when the state has outdated contact information or because the enrollee does not understand or otherwise does not complete renewal packets within a specific timeframe. High procedural disenrollment rates are concerning because many people who are disenrolled for these paperwork reasons may still be eligible for Medicaid coverage.
(Note: The first tab in the figure below calculates procedural disenrollment rates using total disenrollments as the denominator. The second tab shows these rates using total completed renewals, which include people whose coverage was terminated as well as those whose coverage was renewed, as the denominator. And finally, the third tab calculates the rates as a share of all renewals due, which include completed renewals and pending cases.)
Medicaid Renewals
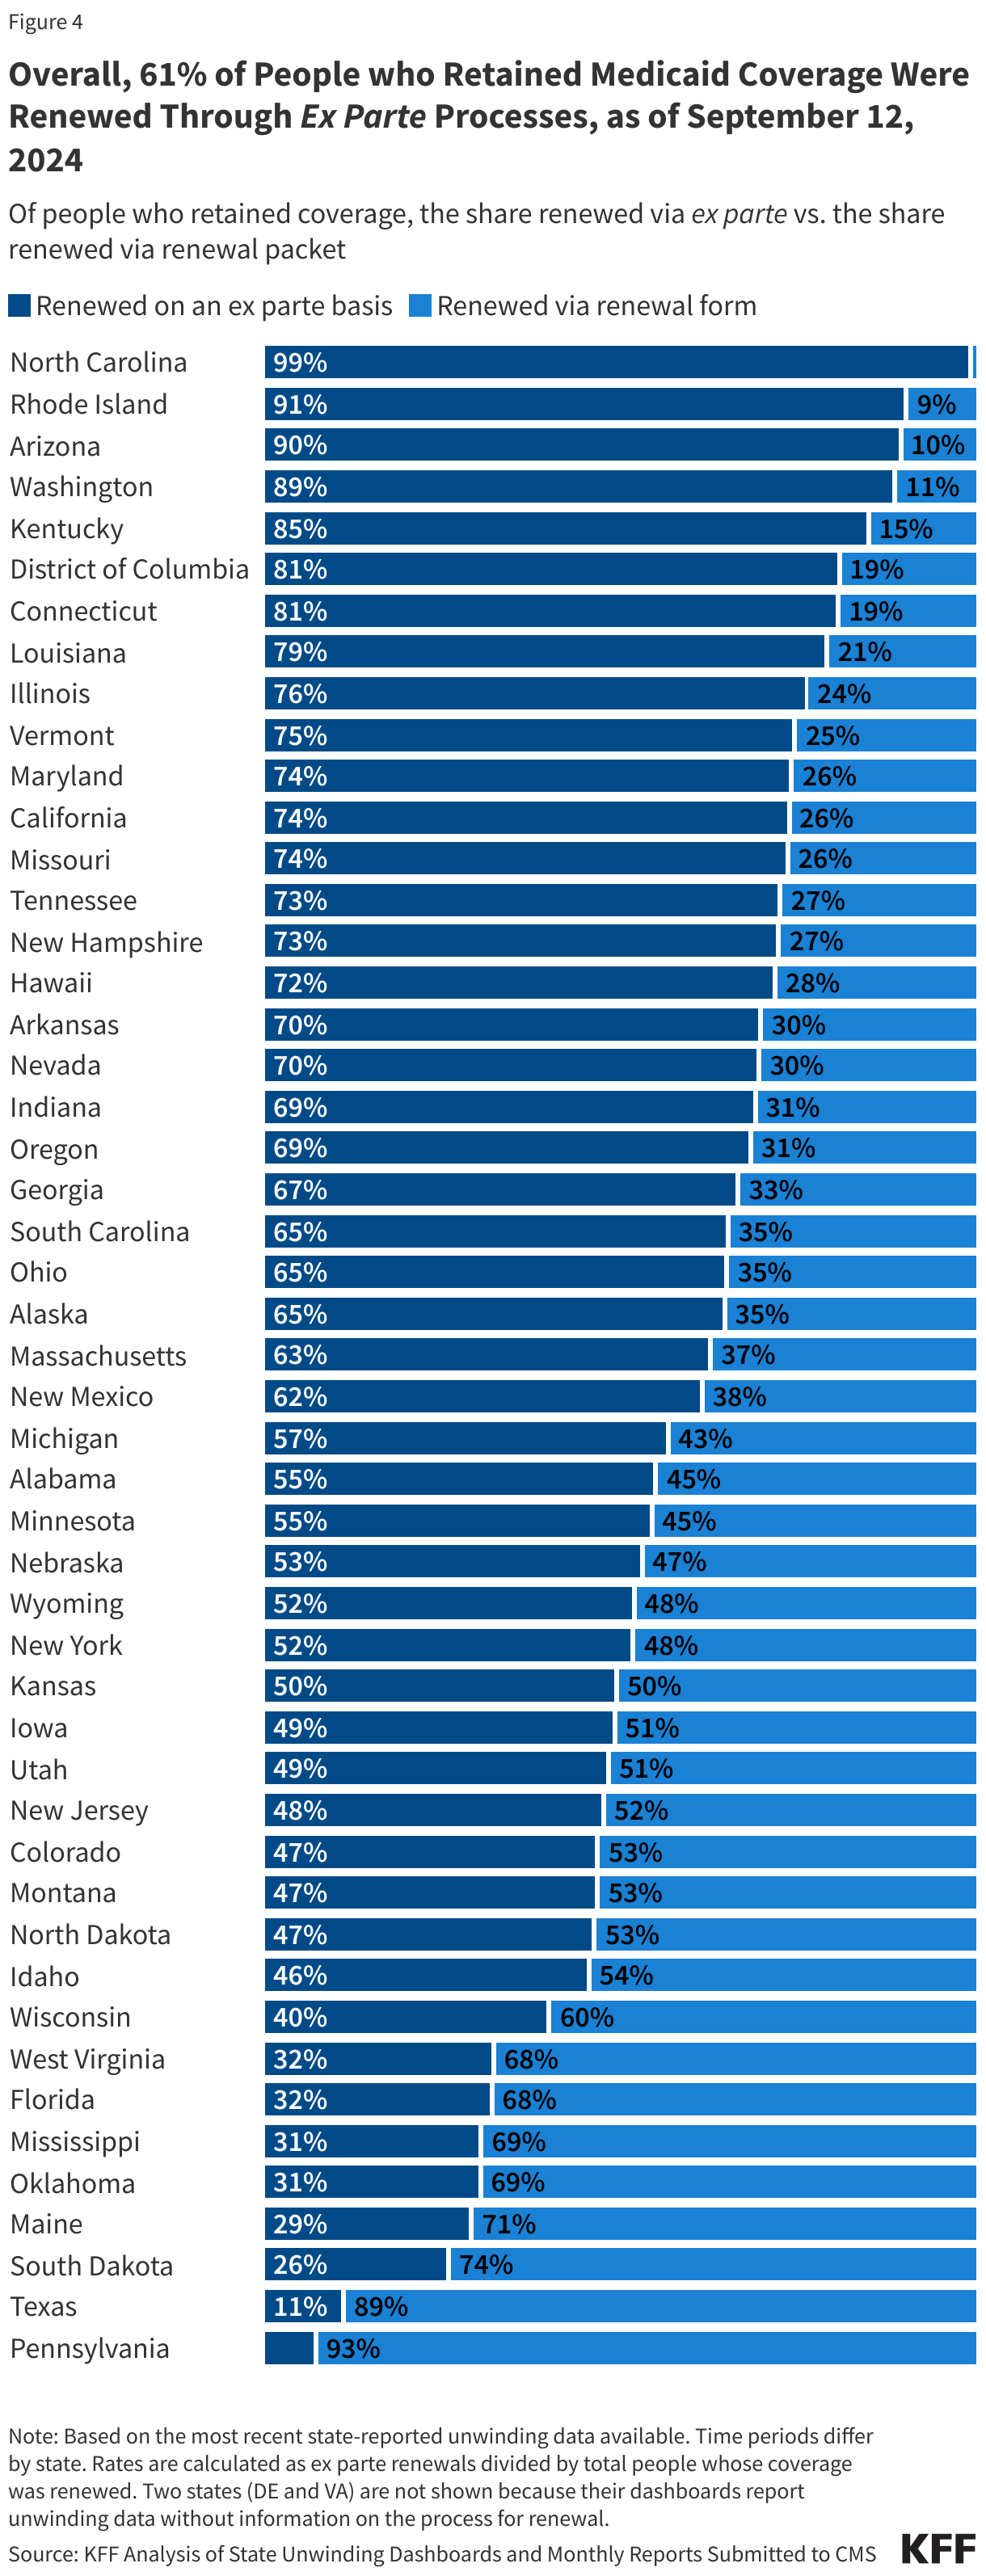
- Of the people whose coverage has been renewed as of September 12, 2024, 61% were renewed on an ex parte basis while 39% were renewed through a renewal form, though rates vary across states. Under federal rules, states are required to first try to complete administrative (or “ex parte”) renewals by verifying ongoing eligibility through available data sources, such as state wage databases, before sending a renewal form or requesting documentation from an enrollee. Ex parte renewal rates varied across states from 90% or more in Arizona, North Carolina, and Rhode Island to less than 20% in Pennsylvania and Texas.
Federal Data on Renewal Outcomes
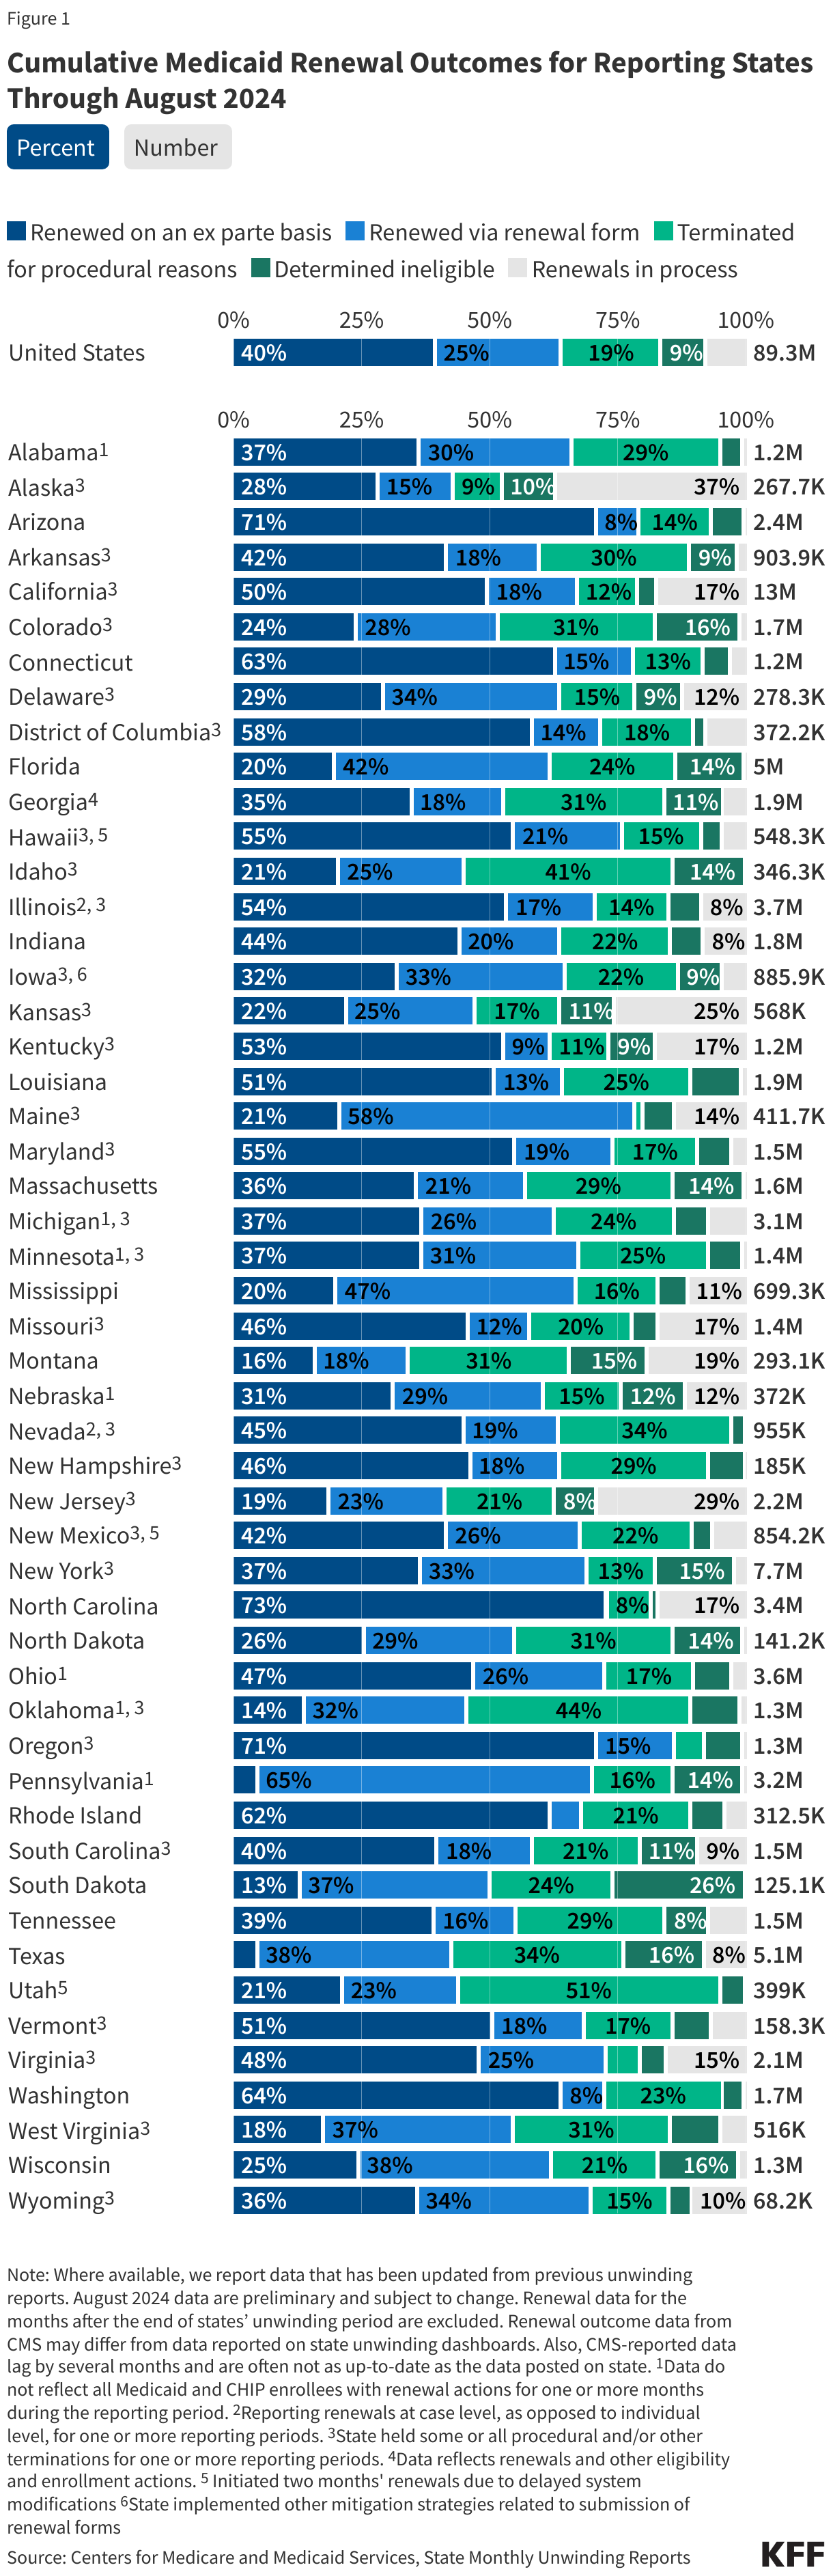
The data presented here are cumulative unwinding metrics published by CMS. These counts and percentages may differ from the above data, which present renewal metrics reported on state websites when state-reported data are more complete.
Figure 1 below shows cumulative renewal data reported by CMS during states’ unwinding periods. Renewal data for the months after the end of states’ unwinding period are excluded. The data reflect updated unwinding data reported by states three months after the original monthly reports as they become available.
For questions about this tracker, please contact KFFTracker@kff.org
State Data – Archived
Note: The state data presented below were last updated on September 12, 2024; since most states have now completed the Medicaid unwinding, the information will not be updated again.
The data presented here provide state-level data on enrollment trends and renewal outcomes during the unwinding period. Figure 1 shows total Medicaid enrollment by month starting in January 2023 and, once disenrollments resumed in a state, the cumulative percent change in Medicaid enrollment relative to the month before Medicaid disenrollments started (this baseline month will differ across states). Figure 2 shows renewal metrics for each month of a state’s unwinding period (or cumulative data for the unwinding period for some states).
For total national Medicaid enrollment, click on the Enrollment Data tab.
Related Resources
Resources on unwinding data
- An Examination of Medicaid Renewal Outcomes and Enrollment Changes at the End of the Unwinding
- How Did Medicaid Renewal Outcomes Change During the Unwinding?
- KFF Survey of Medicaid Unwinding
- Three Questions About Medicaid Unwinding: What We Know and What to Expect
- Halfway Through the Medicaid Unwinding: What Do the Data Show?
- Unwinding of Medicaid Continuous Enrollment: Key Themes from the Field
- Navigating the Unwinding of Medicaid Continuous Enrollment: A Look at Enrollees Experiences
- Six Months into the Medicaid Unwinding: What Do the Data Show and What Questions Remain?
- What Do Medicaid Unwinding Data by Race and Ethnicity Show?
- Understanding Medicaid Ex Parte Renewals During the Unwinding
- States Obtain Special Waivers to Help Unwinding Efforts
- Understanding Medicaid Procedural Disenrollment Rates
- Do State Decisions to Prioritize Renewals for Medicaid Enrollees Who are Likely Ineligible Affect Early Disenrollment Rates?
- What Do the Early Medicaid Unwinding Data Tell Us?
- How Many People Might Lose Medicaid When States Unwind Continuous Enrollment?
Resources on state policies and preparations for the unwinding
- A Look at Medicaid and CHIP Eligibility, Enrollment, and Renewal Policies During the Unwinding of Continuous Enrollment and Beyond
- State Policy Choices Are Likely to Affect the Extent of Medicaid Enrollment Declines During the Unwinding Period
- Medicaid and CHIP Eligibility, Enrollment, and Renewal Policies as States Prepare for the Unwinding of the Pandemic-Era Continuous Enrollment Provision
- The Unwinding of Medicaid Continuous Enrollment: Knowledge and Experiences of Enrollees
- Unwinding the Continuous Enrollment Provision: Perspectives from Current Medicaid Enrollees
Resources on pre-pandemic enrollment patterns and coverage transitions
- What Happens After People Lose Medicaid Coverage?
- Medicaid Enrollment Growth: Estimates by State and Eligibility Group Show Who may be at Risk as Continuous Enrollment Ends
- Unwinding the PHE: What We Can Learn From Pre-Pandemic Enrollment Patterns
- Medicaid Enrollment Churn and Implications for Continuous Coverage Policies
- Implications of Continuous Eligibility Policies for Children’s Medicaid Enrollment Churn
- Medicaid Enrollment Patterns During the Postpartum Year
