A View from the States: Key Medicaid Policy Changes: Results from a 50-State Medicaid Budget Survey for State Fiscal Years 2019 and 2020
Executive Summary
Medicaid covers one in five Americans, accounts for one in six dollars spent on health care in the United States, and makes up more than half of all spending on long-term services and supports.1 Medicaid is a state budget driver as well as the largest source of federal revenue to states. The program is constantly evolving in response to federal policy changes, the economy, and state budget and policy priorities. As states began state fiscal year (FY) 2020, the economy in most states was strong. With fewer budget pressures, many states reported expansions or enhancements to provider rates and benefits. As several states implemented, adopted, or continued to debate the ACA Medicaid expansion, a number of states also continued to pursue work requirements and other policies promoted by the Trump administration that could restrict eligibility. Other key areas of focus highlighted in the report include Medicaid initiatives to address social determinants of health, control prescription drug spending, improve birth outcomes and reduce infant mortality, and address the opioid epidemic.
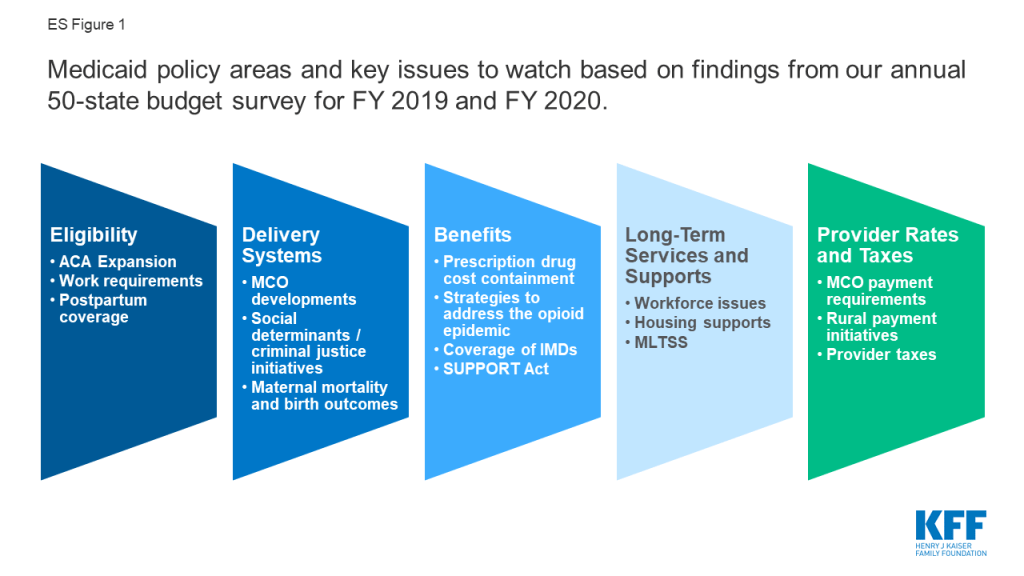
This report provides an in-depth examination of the changes taking place in Medicaid programs across the country. The findings are drawn from the 19th annual budget survey of Medicaid officials in all 50 states and the District of Columbia conducted by the Kaiser Family Foundation (KFF) and Health Management Associates (HMA), in collaboration with the National Association of Medicaid Directors (NAMD). This report highlights certain policies in place in state Medicaid programs in FY 2019 and policy changes implemented or planned for FY 2020. The District of Columbia is counted as a state for the purposes of this report. Given differences in the financing structure of their programs, the U.S. territories were not included in this analysis. Key findings from the report are pulled from five sections: eligibility, delivery systems, benefits, long-term services and supports, and provider rates and taxes. Each section highlights key issues to watch for future policy development (ES Figure 1).
Eligibility & Premiums
Since 2014, most major eligibility policy changes have been related to adoption of the ACA Medicaid expansion. Maine and Virginia implemented the ACA Medicaid expansion in FY 2019, bringing the total number of states with the expansion in place to 34 as of July 2019. Three additional states have adopted the expansion but have not yet implemented it, including Idaho which plans to implement the ACA Medicaid expansion to 138% of the federal poverty level (FPL) in FY 2020. Most other Medicaid eligibility expansions for FY 2019 and FY 2020 were narrow and targeted to a limited number of beneficiaries. In contrast, eligibility restrictions implemented in FY 2019 (by 7 states) or planned for implementation in FY 2020 (by 6 states) generally target broader Medicaid populations including expansion adults and parents/caretakers. All states implementing or planning eligibility policies that are counted as restrictions in FY 2019 or FY 2020 are doing so through Section 1115 waiver authority, whereas most states implementing or planning eligibility expansions are doing so through state plan authority.
What to watch:
- Medicaid expansion. Utah and Nebraska adopted the Medicaid expansion through 2018 ballot initiatives but both states are pursuing waivers to implement the expansion with program elements that differ from what is allowed under federal law, leading to implementation delays. Idaho also adopted the Medicaid expansion through a 2018 ballot initiative but submitted a Section 1332 waiver seeking to make changes to the expansion. In August 2019, CMS rejected Idaho’s waiver request; the state will implement the Medicaid expansion to 138% FPL effective January 2020. Medicaid expansion debates are active in Kansas, Missouri, and North Carolina.
- Coverage for postpartum women. In FY 2020, three states are seeking waivers to extend coverage for postpartum women beyond the current statutory requirement of 60 days after delivery.
- Work requirements. An appeal is underway in the DC Circuit after the DC federal district court stopped implementation of Arkansas’ work and reporting requirement waiver in March 2019, and prohibited Kentucky’s waiver from going into effect in April as planned. In July 2019, the DC federal district court also set aside New Hampshire’s work requirement waiver, stopping the implementation of the work requirement. Litigation challenging Indiana’s work requirements was also recently filed in the same court. Work requirement waiver requests from six non-expansion states – which may have much lower levels of eligibility based on income for parents and do not cover childless adults – are now pending. The outcomes of these requests will have implications for other states seeking to adopt similar policies.
Delivery Systems
As of July 1, 2019, among the 40 states with comprehensive risk-based managed care organizations (MCOs), 33 states reported that 75% or more of their Medicaid beneficiaries were enrolled in MCOs. States continue to carve-in behavioral health services to MCO contracts and nearly all states have in place managed care quality initiatives like pay for performance or capitation withholds. Medicaid programs have been expanding their use of other service delivery and payment reform models to achieve better outcomes and lower costs. Forty-four states had one or more delivery system or payment reform initiatives in place in FY 2019 (most often patient centered medical homes or ACA Health Homes) with 14 states adding or expanding such reforms in FY 2020.
What to watch:
- MCO developments. North Carolina reported plans to implement a new MCO program in FY 2020. In FY 2019, 21 states set a target percentage of MCO provider payments or covered lives that must be in alternative payment models (APMs), three additional states plan to do so in FY 2020, and several states noted that their APM targets would increase in the future.
- Social determinants of health and criminal justice. Over three-quarters of the 41 MCO states as of FY 2020 (35 states) are leveraging MCO contracts to promote at least one strategy to address social determinants of health. Non-MCO states also report moving forward with initiatives to identify and address social determinants of health. States are also working with their MCO and corrections partners to coordinate care for justice-involved individuals prior to release with the goal of improving continuity of care and smoothing community transitions.
- Maternal mortality and birth outcomes. About two-thirds of states reported new or expanded Medicaid initiatives to improve birth outcomes and/or reduce maternal mortality in FY 2019 or FY 2020.
Benefits & Cost-Sharing
The number of states reporting benefit expansions (23 in FY 2019 and 28 in FY 2020) continues to significantly outpace the number of states reporting benefit restrictions (4 in FY 2019 and 2 in FY 2020). The most common benefit enhancements reported were for mental health/substance use disorder (SUD) services, but other service expansions include dental services, pregnancy and postpartum benefits, and diabetes prevention and care. Eleven states reported policies to eliminate or reduce a cost-sharing requirement for FY 2019 or FY 2020, compared to five states that reported new or increased cost-sharing requirements.
What to watch:
- Prescription drug cost containment. Twenty-four states in FY 2019 and 26 states in FY 2020 reported newly implementing or expanding at least one initiative to contain prescription drug costs. Strategies cited included efforts to address pharmacy benefit manager (PBM) transparency and the impact of spread pricing in managed care and implementation of new purchasing arrangements, including value-based contracts linking pharmacy reimbursement to patient outcomes. Some states reported unique models, including a modified subscription model for hepatitis C drugs in Louisiana and a drug spending cap in New York.
- Strategies to address the opioid epidemic. All states reported using pharmacy benefit management strategies (such as adoption of opioid prescribing guidelines prospective drug utilization review, prior authorization based on clinical criteria/step therapy, retrospective drug utilization review and state prescription drug monitoring programs (PDMP)) to prevent opioid-related harms. States also reported a variety of initiatives to expand access to medication-assisted treatment (MAT), including removing or relaxing prior authorization for MAT drugs.
- Institutions for Mental Disease (IMDs). In an effort to address the opioid epidemic as well as broader behavioral health issues, CMS and Congress have provided states additional flexibility to provide services in settings that would otherwise qualify as “institutions for mental disease,” or IMDs, and thus be ineligible for federal Medicaid funding. A large majority of states (43 states) reported they plan to use at least one of the flexibilities (MCO “in lieu of authority, Section 1115 waiver authority, or The Substance Use Disorder Prevention that Promotes Opioid Recovery and Treatment for Patients and Communities [SUPPORT Act] state plan option) to provide services in IMDs in FY 2020.
- SUPPORT Act. States are implementing new SUPPORT Act requirements including pharmacy benefit management strategies to reduce prescription opioid abuse and misuse and providing coverage for all FDA approved MAT drugs. Some states are also pursuing options such as enhanced matching funds for implementation of PDMPs or coverage of residential pediatric recovery centers (RPRC) for services provided to infants under age one with neonatal abstinence syndrome (NAS) and their families.
Long-Term Services and Supports
Nearly all states in FY 2019 (48 states) and in FY 2020 (47 states) are employing one or more strategies to expand the number of people served in home and community-based settings. Of these states, the vast majority report using home and community-based services (HCBS) waivers and/or state plan options (i.e., 1915(c), Section 1115, 1915(i), and 1915(k)) to serve more individuals in the community. As of July 1, 2019, 25 states covered LTSS through one or more capitated managed care arrangements, and another two states operated managed fee-for-service LTSS models.
What to watch:
- Workforce issues. States continue to work to address challenges finding and retaining LTSS direct care workers. Roughly half of states reported raising wages for direct care workers in FY 2019 and FY 2020, a notable increase from prior years. In addition, 15 states had direct care workforce development strategies (e.g., recruiting, training, credentialing) in place in FY 2019, and 10 states reported expanding (7 states) or implementing new workforce development strategies (3 states) in FY 2020.
- Housing supports. Housing supports remain an important component of state LTSS rebalancing efforts. Thirty-seven states offer housing-related supports, such as community transition services, case management, or transitional supports as part of their HCBS and Section 1115 waiver programs. States were set to phase out their Money Follows the Person (MFP) programs in federal FY 2020, but Congress provided additional funding for a short-term extension of the program; however, the uncertain future of MFP may place some of the initiatives funded through MFP at risk.
- Managed Long-Term Services and Supports (MLTSS). Several states will expand their MLTSS programs in FY 2019 and FY 2020. Pennsylvania is positioned to complete its statewide expansion of MLTSS in FY 2020, and several other states (Idaho, Illinois, and Tennessee) reported geographic or population expansions for FY 2020.
Provider Rates and Taxes
A strong economy and state revenue growth allowed most states to implement and plan more fee-for-service (FFS) provider rate increases for FY 2019 (50 states) and FY 2020 (45 states). This holds true across all major provider types. As more states increasingly rely on capitated managed care, however, FFS rate changes are a less meaningful measure of provider payment unless the state establishes MCO payment requirements. Nearly half of MCO states reported doing so: 19 states reported mandating minimum provider reimbursement rates in their MCO contracts for inpatient hospital, outpatient hospital, or primary care physicians and 17 states reported requiring MCOs to change provider payment rates in accordance with FFS payment rate changes for one or more of these provider types. As in prior years, all states except Alaska rely on provider taxes and fees to fund a portion of the non-federal share of the costs of Medicaid. Six states indicate plans for new provider taxes in FY 2020.
What to watch:
- Rural payment initiatives. About half of states reported at least one policy related to payment adjustments in place to promote access to rural hospitals or other rural providers.
- Provider taxes. With the addition of California in FY 2019, eight states reported that they have a provider tax on ground emergency medical transportation, or on ambulance providers.
Looking Ahead
While national attention on health care is focused on broader debates involving prescription drug pricing and the presidential candidates’ health plans, states continue to administer and make changes to Medicaid programs, adapting to state budget and policy priorities as well as new federal Medicaid options. When asked about key priorities for state Medicaid programs, over half of states reported that delivery system and payment reforms are a key priority. A number of states also pointed to developing and implementing demonstration waivers as well as controlling Medicaid costs as key areas of focus. States are also pursuing a broad range of policies to help address increased Medicaid demands associated with an aging population.
When asked about potential for Medicaid block grant waivers, only a limited number of states expressed interest in such an option, particularly since CMS guidance on such policies has not been released. When asked about potential challenges or opportunities related to federal or state-level coverage expansions such as Medicare-for-All, few states had assessed the implications for state Medicaid programs of these broader health reforms. At the time of the survey, litigation challenging the ACA was pending before the U.S. Court of Appeals for the 5th Circuit that could have complex and far-reaching consequences for Medicaid and the entire health care system if the ACA is overturned. Looking ahead, the trajectory of the economy, the direction of federal policies around Section 1115 Medicaid waivers, and the focus of the debate and attention to health care issues in the lead up to the November 2020 elections will also be factors that continue to shape Medicaid in FY 2020 and beyond.
Acknowledgements
Pulling together this report is a substantial effort, and the final product represents contributions from many people. The combined analytic team from the Kaiser Family Foundation and Health Management Associates (HMA) would like to thank the Medicaid directors and Medicaid staff in all 50 states and the District of Columbia. In a time of limited resources and challenging workloads, we truly appreciate the time and effort provided by these dedicated public servants to complete the survey, to participate in structured interviews, and to respond to our follow-up questions. Their work made this report possible. We also thank the leadership and staff at the National Association of Medicaid Directors (NAMD) for their collaboration on this survey. We offer special thanks to Jim McEvoy at HMA who developed and managed the survey database and whose work is invaluable to us.
Introduction
Medicaid provides health insurance coverage to one in five Americans and accounts for nearly one-sixth of all U.S. health care expenditures.2 The Medicaid program constantly evolves due to changes in federal and state policies, the economy, and other state budget and policy priorities, and has become a significant driver of innovation in the broader health care sector. Unlike 2018 when only two states had not enacted a budget as of July 1, seven states in 2019 did not have a fully completed budget at the beginning of their fiscal year. Budget impasses, however, were driven by various policy disagreements rather than by a weak fiscal environment.3 ,4 In fact, strong revenue performance in the spring of 2019 enabled most states to finalize their FY 2020 budgets with increased spending for priority programs and more dollars directed to state rainy day funds at the beginning of FY 2020 when this survey was conducted.5
Report findings are drawn from the 19th annual budget survey of Medicaid officials in all 50 states and the District of Columbia conducted by the Kaiser Family Foundation (KFF) and Health Management Associates (HMA), in collaboration with the National Association of Medicaid Directors (NAMD). (Previous reports are archived here.6 ) This year’s KFF/HMA Medicaid budget survey was conducted from June through September 2019 via a survey sent to each state Medicaid director in June 2019 and then a follow-up telephone interview. An acronym glossary and the survey instrument are included as appendices to this report.
The District of Columbia is counted as a state for the purposes of this report; the counts of state policies or policy actions that are interspersed throughout this report include survey responses from the 51 “states” (including DC). All 50 states and DC participated in the survey which typically includes completion of the survey instrument and a follow-up telephone interview discussions between July and September 2019.7 Given differences in the financing structure of their programs, the U.S. territories were not included in this analysis.
This report examines Medicaid policies in place or implemented in FY 2019, policy changes implemented at the beginning of FY 2020, and policy changes for which a definite decision has been made to implement in FY 2020 (which began for most states8 on July 1, 2019). Policies adopted for the upcoming year are occasionally delayed or not implemented for reasons related to legal, fiscal, administrative, systems, or political considerations, or due to delays in approval from CMS. Key findings of this survey, along with state-by-state tables, are included in the following sections of this report:
Eligibility And Premiums
Key Section Findings
Since 2014, most major eligibility policy changes have been related to adoption of the ACA Medicaid expansion. Maine and Virginia implemented the ACA Medicaid expansion in FY 2019, bringing the total number of states with the expansion in place as of July 2019 to 34. Three additional states have adopted the expansion but not yet implemented it, including Idaho which plans to implement the expansion in FY 2020. Utah expanded coverage for most adults to 100% FPL (without enhanced ACA matching funds) in April 2019. Other Medicaid eligibility expansions for FY 2019 and FY 2020 were narrow and targeted to a limited number of beneficiaries. In contrast, eligibility restrictions implemented in FY 2019 (by 7 states) or planned for implementation in FY 2020 (in 6 states) generally target broader Medicaid populations including expansion adults and parents/caretakers. All states implementing or planning eligibility policies that are counted as restrictions in FY 2019 or FY 2020 are doing so through Section 1115 waiver authority, whereas most states implementing or planning eligibility expansions are doing so through state plan authority.
What to watch:
- Utah and Nebraska adopted the Medicaid expansion through 2018 ballot initiatives but both states are pursuing waivers to implement the expansion with program elements that differ from what is allowed under federal law, leading to implementation delays. Idaho also adopted the Medicaid expansion through a 2018 ballot initiative but submitted a Section 1332 waiver seeking to make changes to the expansion. In August 2019, CMS rejected Idaho’s waiver request; the state will implement the Medicaid expansion to 138% FPL effective January 2020.
- Medicaid expansion debates are active in Kansas, Missouri, and North Carolina.
- In FY 2020, three states are seeking waivers to extend coverage for postpartum women beyond the current 60 days after delivery and two states will increase the income eligibility limit for pregnant women.
- An appeal is underway in the DC Circuit after the DC federal district court stopped implementation of Arkansas’ work and reporting requirement waiver in March 2019, and prohibited Kentucky’s waiver from going into effect in April as planned. In July 2019, the DC federal district court also set aside New Hampshire’s work requirement waiver, stopping the implementation of the work requirement. Litigation challenging Indiana’s work requirement was also recently filed in the same court.
- The outcome of pending work requirement waiver requests from six non-expansion states – which may have much lower levels of eligibility based on income for parents and do not cover childless adults – will have implications for states seeking to adopt similar policies.
Table 1 summarizes the nature of eligibility policy changes by state in FY 2019 and FY 2020.
Changes to Eligibility Standards
Eligibility expansions
Aside from implementation of the ACA Medicaid expansion in two states in FY 2019 and one additional state in FY 2020, most other eligibility expansions for FY 2019 and FY 2020 are narrow in scope. Overall, nine states implemented policy changes that expanded Medicaid eligibility in FY 2019, and 20 states plan to expand Medicaid eligibility in FY 2020. More states are pursuing eligibility expansions through State Plan Amendments (SPAs) compared to waivers in both FY 2019 and FY 2020 (Exhibit 1).
| Exhibit 1: Eligibility Expansions by Policy Authority | ||||
| FY 2019 | FY 2020 | |||
| State Plan Amendment | 7 States | CT, LA, MA, MD, ME, MO, VA | 13 States | CA, DC, ID, IA, LA, MA, MN, MO, ND, NJ, OK, WI, WV |
| Section 1115 Waiver | 2 States | IA, UT | 9 States | DE, HI, IL*, MO*, NJ*, NM*, RI, SC*, TN |
| *Indicates the Section 1115 Waiver has not yet been approved by CMS. | ||||
Two states (Maine and Virginia) implemented the ACA Medicaid expansion in FY 2019, bringing the total number of states that have implemented the ACA Medicaid expansion as of July 2019 to 34 (Figure 1). Expansion was implemented in Virginia and Maine in January 2019. Maine adopted the Medicaid expansion through a November 2017 ballot initiative. Due to delays by the former governor, however, implementation did not occur until the new governor signed an executive order in January 2019 directing the Department of Health and Human Services to begin expansion implementation and provide coverage to those eligible retroactive to July 2018. CMS approved the state’s plan retroactive to July 2, 2018.

Three states (Idaho, Nebraska and Utah) newly adopted the expansion through 2018 ballot initiatives, but implementation of the full expansion has been delayed in all three states. 9
- Utah voters approved a full ACA expansion to cover nearly all adults with income up to 138% of the FPL, however, the Utah legislature significantly changed and limited the coverage expansion that was adopted by the voters. The governor signed legislation in February 2019 that calls for multiple steps to implement an expansion of Medicaid coverage to adults in ways that differ from a full ACA expansion.10 As of October 2019, CMS had approved an amendment to Utah’s existing Section 1115 demonstration waiver to expand Medicaid to a capped number of adults with income up to 100% FPL beginning on April 1, 2019 at the state’s regular Medicaid matching rate, not the enhanced ACA matching rate. Additional waivers are pending/forthcoming per state law.11 ,12 If CMS does not approve the waivers by July 1, 2020 (the start of FY 2021), state legislation requires the state to adopt the full Medicaid expansion without restrictions as required by the ballot initiative.
- In Idaho, the governor signed a bill passed by the legislature in April 2019 that makes changes to the Medicaid expansion program approved by voters. The state submitted a Section 1332 waiver seeking permission to access the ACA enhanced match rate for the newly eligible population up to 100% FPL and for individuals between 100-138% FPL who choose to “opt-in” to Medicaid coverage. The state proposed that the default for the 100-138% FPL population would be qualified health plan (QHP) coverage in the Marketplace with advance premium tax credits. In August 2019, CMS rejected Idaho’s 1332 waiver request.13 The state will implement the Medicaid expansion to 138% FPL effective January 2020.
- Nebraska submitted an expansion SPA in April 2019 that delays implementation until October 1, 2020 (FY 2021) to allow time for the state to seek a Section 1115 waiver to implement expansion with program elements that differ from what is allowed under federal law.
In May 2019, the Montana governor signed legislation to continue the state’s Medicaid expansion program with significant changes until 2025. This action came after Montana residents voted down a measure on the November 2018 ballot that would have extended the Medicaid expansion beyond the June 30, 2019 sunset date and raised taxes on tobacco products to finance the expansion. Current legislation directs the state to seek federal waiver authority to make several changes to the existing expansion program, including adding a work requirement as a condition of eligibility and increasing the premiums required by many beneficiaries.
In a number of states, Medicaid expansion was still under debate for FY 2020 and beyond. In North Carolina, the governor vetoed the budget passed in late June 2019 primarily because it did not expand Medicaid. The budget stalemate continues as of October 2019. In September 2019, advocates in Missouri launched a campaign to put Medicaid expansion on the ballot in November 2020. To qualify for the ballot initiative, they must obtain at least 172,000 signatures. After legislation failed to pass last session in Kansas, in September 2019, the governor signed an executive order establishing a committee to study the Medicaid expansion experience in other states and to outline these findings for consideration during the 2020 legislative session.
Six states implemented more narrow eligibility expansions in FY 2019 and 19 states plan to implement more limited expansions in FY 2020. Some examples of these other expansions include the following:
- Restoring retroactive coverage. In FY 2019, Iowa reinstated retroactive eligibility for nursing facility residents. In FY 2020, Delaware and Oklahoma will restore retroactive eligibility for children and pregnant women. In FY 2020, Hawaii and New Mexico plan to reinstate retroactive eligibility for all groups.14 (The elimination of retroactive coverage requires a Section 1115 waiver.)
- Expanding coverage for pregnant and postpartum women. Three states (Illinois, Missouri, and South Carolina) are seeking waiver authority to extend coverage in FY 2020 for postpartum women beyond the current 60 days: Illinois plans to submit a Section 1115 waiver proposal to extend postpartum coverage to one year; Missouri’s proposal will specifically target women with a substance use disorder (SUD) diagnosis; South Carolina is seeking to extend coverage for pregnant women up to 199% FPL from 60 days postpartum to one-year postpartum. In addition, in FY 2020, North Dakota will increase the income limit for pregnant women from 152% FPL to 162% FPL, and West Virginia will increase the income limit for pregnant women from 150% FPL to 185% FPL.
- Covering children with disabilities/complex needs. Three states (Louisiana, Rhode Island, and Tennessee) are using either SPA or waiver authority to cover children with significant disabilities at home who would not qualify for Medicaid if the incomes and assets of their families were counted.
- Eliminating the 5-year waiting period for lawfully-residing immigrant children. In FY 2019, Louisiana eliminated the five-year waiting period for Medicaid eligibility for lawfully-residing immigrant children.
- Increasing the income limit for the parent/caretaker group and other limited groups.15 In FY 2020, if approved by CMS, South Carolina plans to increase the income limit for parent/caretakers from 67% FPL to 100% FPL. South Carolina’s pending waiver would also provide new coverage with an enrollment cap (that can be set at zero) for childless adults who are eligible due to homelessness, justice system involvement, or need for mental health or SUD treatment. The pending waiver includes a work requirement for non-exempt parent/caretakers and those in the new, capped enrollment groups.
Eligibility Restrictions
A number of states continue to pursue Section 1115 waivers which include policies that would result in eligibility restrictions in FY 2019 and FY 2020 (Exhibit 2). Policies that have or are likely to result in enrollment declines are counted as restrictions in this report. Seven states reported implementing restrictions in FY 2019 and six states reported restrictions already implemented or planned for implementation in FY 2020 (Exhibit 2 and Table 1).
Although not cited as eligibility standards changes, several states (not included in the counts below) noted a downward pressure on enrollment in FY 2019 or FY 2020 related to increased eligibility verifications, data matching, and other process-related issues.
| Exhibit 2: Eligibility Restrictions by Policy Authority | ||||
| FY 2019 | FY 2020 | |||
| State Plan Amendment | 0 States | 0 States | ||
| Section 1115 Waiver | 7 States | AR, FL, IN, KY, MA, NH, NM | 6 States | AZ, MI, MT*, UT, VA*, WI |
| *Indicates the Section 1115 Waiver has not yet been approved by CMS. | ||||
The most frequently reported eligibility restrictions implemented in FY 2019 or planned for FY 2020 are work or community engagement requirements. Work requirement waivers generally require beneficiaries to verify their participation in certain activities, such as employment, job search, or job training programs, for a certain number of hours per week or verify an exemption to receive or retain Medicaid coverage. Details about the specific number of hours, approved activities, exemptions, reporting process, and populations included (e.g., expansion adults and/or low-income parents) vary across states. Data show, however, that most Medicaid enrollees are already working or would qualify for exemptions from these requirements, yet many of these individuals would still need to navigate a reporting or exemption process to retain their Medicaid coverage.16 ,17 ,18 In this report, work requirement policies are counted based on the initial date of implementation rather than the date on which the first coverage terminations will occur.
| Exhibit 3: Work Requirement Waivers by Approval Status as of October 2019 | |
| Approved* | 6 States: AZ, IN, MI, OH, UT, WI |
| Pending+ | 9 States: AL, ID, MS, MT, OK, SC, SD, TN, VA |
| Vacated by Court^ | 3 States: AR, KY, NH |
| *AZ and OH plan to implement in FY 2021; +No non-expansion state pending work requirement waivers (AL, MS, OK, SC, SD, TN) were counted as “planned for implementation” in FY 2020 (see additional discussion below); ^AR, KY, and NH counted as eligibility restriction in FY 2019. | |
Six states currently have approved Section 1115 work requirement waivers (Exhibit 3). While Indiana began implementation of the work requirement in FY 2019 (in January 2019), no hours are required in the first 6 months. The phase-in of required hours began in months 7-9 with a requirement of 5 hours per week. Each December beneficiaries will be subject to a review of their community engagement hours for the prior 12-months. The first coverage losses are expected to take effect January 1, 2020 for beneficiaries who do not meet the required community engagement hours. (On September 23, 2019, a federal lawsuit was filed in the DC district court challenging the HHS Secretary’s approval of Indiana’s “Healthy Indiana Plan” waiver, including the approval of its work requirement (among other waiver provisions).) Michigan, Utah, and Wisconsin19 plan to implement work requirement waivers in FY 2020. Arizona and Ohio plan to implement work requirement waivers in FY 2021.
With the exception of Virginia, Montana, and Idaho, all other pending work requirement waivers are from non-expansion states. If approved, Virginia and Montana plan to implement work requirement waivers in FY 2020 and Idaho plans to implement in FY 2021.20 As of October 2019, CMS has not approved a work requirement waiver from a non-expansion state other than Wisconsin. The Wisconsin work requirement only applies to childless adults. Since there is no precedent for an approval of a work requirement waiver for parents and caretaker relatives in a non-expansion state and the timing of such an approval is unknown, this report does not count any non-expansion state pending work requirement waivers under “planned implementation” for FY 2020 (even though a few states indicated, depending on if/when approved, FY 2020 implementation may be possible).
As a result of litigation challenging work requirements, three states (Arkansas, Kentucky and New Hampshire) have had work requirement waivers set aside by the courts. On March 28, 2019, the DC federal district court set aside the HHS Secretary’s approval of Medicaid waivers with work and reporting requirements and other eligibility and enrollment restrictions in Kentucky and Arkansas.21 This was the second time the court ruled on Kentucky’s waiver, after finding that the Secretary’s initial approval was similarly flawed, and the first time the court considered Arkansas’s waiver. The court vacated both waivers – stopping work and reporting requirements as well as other waiver provisions. While Kentucky had not begun implementation, Arkansas’s waiver implementation began in June 2018 and resulted in over 18,000 people losing coverage.22 An appeal currently is underway in the DC Circuit.
On July 29, 2019, the DC federal district court set aside New Hampshire’s work requirement waiver. Implementation was stopped unless and until HHS issues a new approval that passes legal muster or prevails on appeal.23 Although the state began implementation in June 2019, no enrollees had lost coverage yet.
While several states moved to restore retroactive eligibility (described above), a few new states obtained waivers to eliminate or reduce retroactive coverage. In FY 2019, Florida eliminated retroactive coverage for non-pregnant adults. In FY 2020 (effective July 1, 2019), Arizona eliminated retroactive coverage for most newly eligible members excluding pregnant women and children. Although Maine received waiver approval (in December 2018) to eliminate retroactive eligibility, in January 2019 the incoming governor informed CMS that the state would not accept the terms of the approved waiver. Similarly, in New Mexico, a Section 1115 waiver amendment was approved in December 2018 that allowed the state to limit retroactive coverage to one month for most managed care members; however, under the new governor, the state submitted an amendment in June 2019 to reinstate the full 90-day retroactive coverage period. Finally, as a result of litigation challenging Section 1115 waivers, retroactive coverage restrictions were set aside/stopped in Arkansas, Kentucky, and New Hampshire.
Other examples of reported eligibility restrictions in FY 2019 or FY 2020 include:
- Conditioning eligibility on premium payment. In FY 2020, Virginia plans to implement (if their pending waiver is approved) premiums for non-exempt adults above 100% FPL. Coverage will be suspended for failure to pay premiums after a three-month grace period. In FY 2020, Wisconsin plans to implement premiums for childless adults from 50-100% FPL as a condition of eligibility, with disenrollment and a lock-out period for up to six months.
- Waiving reasonable promptness. In FY 2020, Virginia plans to implement (if their pending waiver is approved) a reasonable promptness waiver, delaying the start of coverage until after the first premium is paid for non-exempt enrollees above 100% FPL.
- Conditioning eligibility on completion of a health risk assessment. In FY 2020, Wisconsin will condition eligibility for childless adults on the completion of a health risk assessment.
Many states implementing Section 1115 waivers that include eligibility conditions (e.g., work requirements, coverage lockouts, and premium requirements) indicated that these policies impact administrative processes and expenses. Specific examples noted include:
- Information system costs – data matches and interfaces with other programs, creation of enrollee reporting portals, and development of automated participant notices24
- Staffing costs and contract changes – call center staff, staff or contractors for outreach and education, staff to invoice and track premiums
- MCO contract changes – requiring plans to verify exemptions, manage premium collections and reductions, etc.
Births Financed by Medicaid
Medicaid is a key source of financing of births for low- and modest-income families. Women who would not otherwise be eligible can qualify for Medicaid coverage for pregnancy, delivery, and postpartum care due to higher income eligibility thresholds for pregnant women.25 Medicaid directors were asked to provide the most recent available data on the share of all births in their states that were financed by Medicaid. About three-quarters of the 50 reporting states were able to provide data for calendar year or fiscal year 2017 or 2018. The rest of the states provided data from 2013-2016 or 2019. The median share of births financed by Medicaid in the 50 reporting states was 46%. Six states (Arkansas, Louisiana,26 Mississippi, Nevada, New Mexico, and South Carolina) reported that Medicaid pays for 60% or more of all births in their state, while four states reported that Medicaid finances less than 30% of all births (New Hampshire, North Dakota, Utah, and Vermont).
Premiums
The Medicaid statute generally does not allow states to charge premiums to most Medicaid beneficiaries. Historically, premiums were limited to special higher income categories of beneficiaries such as expanded Medicaid for working people with disabilities. However, some states have obtained waiver authority to charge higher premiums and/or copayments than otherwise allowed, especially for the Medicaid expansion population.
Four states (Iowa, Indiana, Maine, and Wisconsin) reported implementation of new premium programs or changes to existing premiums in FY 2019. In FY 2019, Indiana implemented a tobacco premium surcharge for expansion adults and low-income parent/caretakers, increasing premiums by 50% for tobacco users beginning in their second year of enrollment, as part of its Healthy Indiana Plan (“HIP”) waiver. Maine implemented premium increases in its long-standing Section 1115 waiver serving persons with HIV/AIDS. Those subject to premium amounts will see premiums increase 5% annually over the ten-year demonstration period. Effective July 1, 2018, Iowa added a new $3 per month premium for Dental Wellness Program (DWP) members that do not complete healthy behaviors. Effective January 1, 2019, Wisconsin ended premiums for parents and caretaker relatives receiving Medicaid under the Transitional Medical Assistance component of the program. New Mexico had obtained approval under a Section 1115 waiver to implement premiums for expansion adults above 100% FPL starting in 2019; however, the state, under a new governor, is amending the waiver to remove this authority and does not intend to implement premiums.
Four states (Idaho, Montana, Virginia, and Wisconsin) reported planned implementation of new premium programs or changes to existing premiums in FY 2020. Montana and Virginia have implemented or plan to implement new premiums or premium changes for Medicaid expansion adults. Montana’s pending waiver request proposes to gradually increase premiums for each year a member is enrolled in the expansion (from 2% of income for the first two years up to 4% at the rate of 0.5% per year) for expansion adults 50-138% FPL. Virginia’s pending waiver request would add premiums for expansion adults above 100% FPL. In FY 2020, Wisconsin plans to implement premiums for childless adults which will vary based on completion of a health risk assessment and healthy behaviors. Finally, Idaho is planning to implement premiums for children in its Serious Emotional Disturbance (SED) Youth Empowerment Services (“YES”) Section 1915(i) program in FY 2020.
Coverage Initiatives for the Criminal Justice Population
The Medicaid expansion provided a new coverage option for many individuals involved with the criminal justice system, especially childless adults who were not previously eligible in most states. While Medicaid cannot pay for services other than inpatient hospitalization during incarceration, most states are seeking ways to promptly provide coverage and health care services to individuals upon release. Maintenance of medications and access to behavioral health services can be important factors in mitigating recidivism rates.27
Most states reported policies already in place as of FY 2019 to suspend Medicaid eligibility for incarcerated individuals in both prisons and jails (Exhibit 4). When Medicaid eligibility is suspended (instead of terminated) when an enrollee becomes incarcerated, a simple change in status can allow for prompt reinstatement of eligibility upon release from incarceration. Six states plan to implement suspension policies for prisons and jails in FY 2020. Alabama already suspends Medicaid eligibility for individuals incarcerated in jails but plans to implement the suspension policy for prisons in FY 2020.
| Exhibit 4: Suspension of Medicaid Eligibility for Incarcerated Individuals | ||
| Prisons | Jails | |
| In place as of FY 2019 | 43 states | 42 states |
| Plan to implement in FY 2020 | AL, ID, MO, NV, OK, UT, WI | ID, MO, NV, OK, UT, WI |
| No plans to implement in FY 2019 or FY 2020 | KS | IL, KS, NC |
States were also asked if Medicaid eligibility agencies have an electronic, automated data exchange process with jails and/or prisons to facilitate suspension and reinstatement of eligibility for individuals moving into and out of incarceration. About half of states (23 states) indicated such processes were in place in FY 2019. Nine additional states indicated plans to implement an electronic, automated data exchange process in FY 2020. Seventeen states indicated there are no current plans to implement such a process.28
SUPPORT Act: Foster Care Eligibility
As of October 1, 2019, The Substance Use Disorder Prevention that Promotes Opioid Recovery and Treatment for Patients and Communities (SUPPORT) Act prohibits states from terminating Medicaid eligibility for individuals under age 21 or former foster care youth up to age 26 while they are incarcerated and also requires states to redetermine eligibility for these populations prior to release without requiring a new application and to restore coverage upon release.29 States were asked to describe any challenges or issues related to coming into compliance with these requirements. About half of states indicated that they are not facing challenges related to complying with this requirement. In contrast, other states indicated that this policy presents challenges or requires significant additional steps including new process development, system changes, development of automated data exchanges, interagency communication and coordination, changes to state laws, and need for additional federal guidance.
Table 1: Changes to Eligibility Standards in all 50 States and DC, FY 2019 and FY 2020
Eligibility Standard Changes | ||||||
States | FY 2019 | FY 2020 | ||||
(+) | (-) | (#) | (+) | (-) | (#) | |
Alabama | ||||||
Alaska | ||||||
Arizona | X | |||||
Arkansas | X | * | ||||
California | X | |||||
Colorado | ||||||
Connecticut | X | |||||
Delaware | X | |||||
DC | X | X | ||||
Florida | X | |||||
Georgia | ||||||
Hawaii | X | |||||
Idaho | X | |||||
Illinois | X | |||||
Indiana | X | X | ||||
Iowa | X | X | ||||
Kansas | ||||||
Kentucky | X | * | ||||
Louisiana | X | X | ||||
Maine | X | |||||
Maryland | X | |||||
Massachusetts | X | X | X | |||
Michigan |
| X | ||||
Minnesota | X | |||||
Mississippi | ||||||
Missouri | X | X | ||||
Montana | X | |||||
Nebraska | ||||||
Nevada | ||||||
New Hampshire | X | * | ||||
New Jersey | X | |||||
New Mexico | X | X | ||||
New York | ||||||
North Carolina | ||||||
North Dakota | X | |||||
Ohio | ||||||
Oklahoma | X | |||||
Oregon | ||||||
Pennsylvania | ||||||
Rhode Island | X | |||||
South Carolina | X | |||||
South Dakota | ||||||
Tennessee | X | |||||
Texas | ||||||
Utah | X | X | X | X | ||
Vermont | ||||||
Virginia | X | X | ||||
Washington | ||||||
West Virginia | X | |||||
Wisconsin** | X | X | ||||
Wyoming | ||||||
Totals | 9 | 7 | 1 | 20 | 6 | 3 |
NOTES: From the beneficiary’s perspective, eligibility expansions or policies likely to increase Medicaid enrollment are denoted with (+), eligibility restrictions or policies likely to decrease enrollment are denoted with (-), and neutral changes are denoted with (#). This table captures eligibility changes that states have implemented or plan to implement in FY 2019 or FY 2020, including changes that are part of approved and pending Section 1115 waivers. No non-expansion state pending work requirement waivers (AL, MS, OK, SC, SD, TN) were counted as “planned for implementation” in FY 2020.*Denotes that the court set aside continued or new implementation of waiver provisions. **Wisconsin’s Section 1115 waiver covers childless adults ages 19 to 64 with income up to 100% FPL, without ACA enhanced matching funds. The state has an approved work and reporting requirement waiver for this population. The state plans to implement this provision as soon as CMS approves their implementation plan and when funding is made available for work supports. SOURCE: Kaiser Family Foundation Survey of Medicaid Officials in 50 states and DC conducted by Health Management Associates, October 2019. | ||||||
Delivery Systems
Key Section Findings
As of July 1, 2019, among the 40 states with comprehensive risk-based managed care organizations (MCOs), 33 states reported that 75% or more of their Medicaid beneficiaries were enrolled in MCOs. States continue to carve-in behavioral health services to MCO contracts and nearly all states have managed care quality initiatives in place such as pay for performance or capitation withholds. Medicaid programs have been expanding their use of other service delivery and payment reform models to achieve better outcomes and lower costs. Forty-four states had one or more delivery system or payment reform initiatives in place in FY 2019 (most often patient centered medical homes or ACA Health Homes) with 14 states adding or expanding delivery system reforms in FY 2020.
What to watch:
- North Carolina reported plans to implement a new MCO program in FY 2020.
- In FY 2019, 21 states set a target percentage of MCO provider payments or covered lives that must be in alternative payment models (APMs), three additional states plan to do so in FY 2020, and several states noted that their APM targets would increase in the future.
- Over three-quarters of the 41 MCO states as of FY 2020 (35 states) are leveraging MCO contracts to promote at least one strategy to address social determinants of health. Non-MCO states also report moving forward with initiatives to identify and address social determinants of health.
- States are working with their MCO and corrections partners to coordinate care for justice-involved individuals prior to release with the goal of improving continuity of care and smoothing community transitions.
- About two-thirds of states reported new or expanded Medicaid initiatives to improve birth outcomes and/or reduce maternal mortality in FY 2019 or FY 2020.
Tables 2 through 5 include more detail on the populations covered under managed care (Tables 2 and 3), behavioral health services covered under MCOs (Table 4), and managed care quality initiatives (Table 5). Table 6 contains more detailed information on emerging delivery system and payment reform initiatives in place in FY 2019 and new or expanded initiatives in FY 2020.
Managed Care
Capitated managed care remains the predominant delivery system for Medicaid in most states. As of July 2019, all states except four – Alaska, Connecticut,30 Vermont,31 and Wyoming – had some form of managed care (comprehensive risk-based managed care organizations (MCOs) and/or primary care case management (PCCM)) in place. As of July 2019, 40 states were contracting with MCOs, up from 39 states last year. Twelve states reported operating a PCCM program, down two states from last year. PCCM is a managed FFS based system in which beneficiaries are enrolled with a primary care provider who is paid a small monthly fee to provide case management services in addition to primary care. For purposes of this report, states contracting with “PCCM entities”32 are also counted as offering a PCCM program.
Of the 47 states that operate some form of managed care, five operate both MCOs and a PCCM program while 35 states operate MCOs only and seven states operate PCCM programs only33 (Figure 2 and Table 2). In total, 28 states contracted with one or more limited benefit prepaid health plans (PHPs) (unchanged from 2018) to provide Medicaid benefits including, behavioral health care, dental care, vision care, non-emergency medical transportation (NEMT), or long-term services and supports (LTSS).

Populations Covered by Risk-Based Managed Care
Among the 40 states with MCOs, 33 states reported that 75% or more of their Medicaid beneficiaries were enrolled in MCOs as of July 1, 2019. This is unchanged from last year’s survey and includes nine of the ten states with the largest total Medicaid enrollment. These nine states (California, New York, Florida, Texas, Pennsylvania, Illinois, Ohio, Michigan, and Washington) account for over half of all Medicaid beneficiaries across the country (Figure 3 and Table 2).34

Children and adults, particularly those enrolled through the ACA Medicaid expansion, are much more likely to be enrolled in an MCO than elderly Medicaid beneficiaries or persons with disabilities. Thirty-six35 of the 40 MCO states reported covering 75% or more of all children through MCOs. Of the 34 states that had implemented the ACA Medicaid expansion as of July 1, 2019, 29 were using MCOs to cover newly eligible adults.36 The large majority of these states (26 states) covered more than 75% of beneficiaries in this group through capitated managed care, including New Hampshire that ended its Section 1115 premium assistance waiver at the end of CY 2018 and transitioned its Qualified Health Plan-enrolled members to MCOs.37 Thirty-two of the 40 MCO states reported covering 75% or more of low-income adults in pre-ACA expansion groups (e.g., parents, pregnant women) through MCOs. In contrast, the elderly and people with disabilities were the group least likely to be covered through managed care contracts, with only 21 of the 40 MCO states reporting coverage of 75% or more such enrollees through MCOs (Figure 3).
Of the five states with both MCOs and PCCM programs, PCCM programs cover a larger share of beneficiaries than MCOs in three of these states. As of July 1, 2019, Arkansas’ recently implemented MCO program (described further below) covered only 5% of Medicaid beneficiaries with the rest of the Medicaid population divided between PCCM (45%) and fee-for-service (50%); over 90% of Colorado’s enrollees remained in the PCCM program, which is the foundation of the state’s “Accountable Care Collaboratives;” and North Dakota covered 44% of its Medicaid enrollees in its PCCM program compared to 23% of enrollees (all ACA expansion adults) under an MCO contract. In contrast, Massachusetts reported greater MCO enrollment (42%) compared to PCCM (26%) and Washington reported only minimal PCCM enrollment (1%) compared to MCO enrollment (93%).
Arkansas reported implementing an MCO program for the first time in FY 2019 and North Carolina reported plans to implement an MCO program for the first time in FY 2020. In March 2019, Arkansas began making actuarially sound “global payments” to “Provider-led Arkansas Shared Savings Entities” (PASSEs) that serve Medicaid beneficiaries who have complex behavioral health and intellectual and developmental disabilities (I/DD) service needs. In FY 2020, North Carolina will launch new MCO “Standard Plans” with mandatory enrollment for most population groups (about 1.6 million enrollees). Conversely, Alaska reported that it had halted its previous plan to implement an MCO arrangement in FY 2020 to serve one geographic area (Anchorage and the Mat-Su Valley). Only one state reported a policy change that reduces the state’s reliance on the MCO model of managed care: Indiana reported that presumptively eligible members are now initially covered under FFS rather than being enrolled in MCOs.
Populations with Special Needs
For geographic areas where MCOs operate, this year’s survey asked MCO states whether, as of July 1, 2019, certain subpopulations with special needs – excluding those dually eligible for Medicaid and Medicare or receiving long-term services and supports – were enrolled in MCOs for their acute care services on a mandatory or voluntary basis or were always excluded (Exhibit 5 and Table 3).
Consistent with results from past surveys, pregnant women were most likely to be enrolled on a mandatory basis while persons with I/DD were among the least likely to be enrolled on mandatory basis. As a group, seniors were most likely to be excluded (although a number of states noted that non-dual, non-LTSS seniors constitute a relatively small subpopulation). Foster children were most likely to be enrolled on a voluntary basis, although they were enrolled on a mandatory basis in a larger number of states.
| Exhibit 5: MCO Enrollment of Populations with Special Needs, July 1, 2019(# of States) | |||||||
| Non-Dual/Non-LTSS: | |||||||
| Pregnant women | Medically Fragile/ Technology Dependent Children | Foster Children | Persons with SMI/SED | Persons with I/DD | Persons w/ physical disabilities | Seniors | |
| Always mandatory | 34 | 20 | 22 | 26 | 19 | 24 | 23 |
| Always voluntary | 2 | 7 | 8 | 5 | 6 | 4 | 3 |
| Varies | 3 | 8 | 7 | 7 | 8 | 8 | 5 |
| Always excluded | 1 | 5 | 3 | 2 | 7 | 4 | 9 |
| Notes: “SMI/SED” – persons with serious mental illness or serious emotional disturbance, “I/DD” – persons with intellectual and developmental disabilities. | |||||||
This year’s survey also asked MCO states to comment on their acute care MCO enrollment policies for dual eligibles and persons receiving LTSS. Because these two characteristics often overlap, all state responses could not be sorted into discrete categories. At least 11 states, however, reported that both dual eligibles and persons receiving LTSS had their Medicaid acute care services covered on a mandatory basis under an MCO arrangement (Arizona, Delaware, Hawaii, Iowa, Kansas, Nebraska, New Hampshire, New Jersey, New Mexico, Tennessee, and Virginia). Conversely, nine states reported that both dual eligibles and persons receiving LTSS were always excluded from acute care MCO coverage (Georgia, Indiana, Louisiana, Missouri, Mississippi, North Dakota, Nevada, Wisconsin, and West Virginia). Also, states with Financial Alignment Initiatives for dual eligibles in addition to other managed care programs often cited varying enrollment criteria for dual eligibles.
Acute Care Managed Care Population Changes
In both FY 2019 and FY 2020, a few states reported actions to increase enrollment in acute care managed care, reflecting full or nearly full MCO saturation in most MCO states. As described above, Arkansas and North Carolina reported implementing, or plans to implement, an MCO program for the first time in FY 2019, and FY 2020, respectively. Of the 40 states with MCOs already in place as of July 1, 2019, six states in FY 2019 and eight states in FY 2020 indicated that they made specific policy changes to increase the number of enrollees in MCOs through voluntary or mandatory enrollment of new groups into MCOs, or mandatory enrollment of specific eligibility groups that were formerly enrolled on a voluntary basis (Exhibit 6). Thirty-eight states reported that acute care MCOs were operating statewide as of July 2019. The remaining two MCO states without statewide programs (Colorado and Nevada) did not report a geographic expansion planned for FY 2020.
| Exhibit 6: Medicaid Acute Care Managed Care Population Expansions, FY 2019 and FY 2020 | ||
| FY 2019 | FY 2020 | |
| Geographic Expansions | — | — |
| New Population Groups Added | DE, MS, NH, OH, PA, VA | DE, IL, NY, OH, PA, TN, WV |
| Voluntary to Mandatory Enrollment | — | NE, NY |
| Implementing an MCO program for the first time | AR | NC |
In FY 2019 and FY 2020, states expanded MCO enrollment (either voluntary or mandatory) to other groups including persons with ID/DD (Delaware and New York), special needs children, children with SED, or SSI children (Illinois, Mississippi, Tennessee), expansion adults transitioning from the state’s premium assistance program to MCO coverage (New Hampshire), children in foster care (New York and West Virginia), workers with disabilities, persons receiving Specialized Recovery Services, and persons meeting the nursing facility level of care criteria (Ohio), and persons with third party liability coverage (Virginia). Also, Pennsylvania reported the addition of full benefit dual eligibles and individuals receiving LTSS to acute care managed care by continuing the geographic phase-in of its Community HealthChoices (CHC) MCO program that combines both acute care and LTSS.
Only two states made enrollment mandatory for a specific eligibility group that was formerly enrolled on a voluntary basis: in FY 2020, Nebraska is making enrollment mandatory for refugee resettlement and state disability assistance enrollees, and New York is making enrollment mandatory for participants in its 1915(c) HCBS Children’s waiver (unless eligible for another enrollment exception).
Services Covered Under MCO Contracts
Behavioral Health Services Covered Under MCO Contracts
Although MCOs are at risk financially for providing a comprehensive set of acute care services, nearly all states exclude or “carve-out” certain services from their MCO contracts, frequently behavioral health services. States with acute care MCOs were asked to indicate whether specialty outpatient mental health (MH) services, inpatient mental health services, and outpatient and inpatient substance use disorder (SUD) services are always carved-in (i.e., virtually all services are covered by the MCO), always carved-out (to PHP or FFS), or the carve-in status varies by geographic or other factors. Consistent with results from last year’s survey, more than half of the 40 MCO states reported that specific behavioral health service types were carved into their MCO contracts, with specialty outpatient mental health services somewhat less likely to be carved in (Exhibit 7 and Table 4).
| Exhibit 7: MCO Coverage of Behavioral Health, July 1, 2019(# of States) | ||||
| Specialty Outpatient MH* | Inpatient MH | Outpatient SUD | Inpatient SUD | |
| Always carved-in | 23 | 28 | 29 | 29 |
| Always carved-out | 10 | 7 | 7 | 6 |
| Varies | 7 | 5 | 4 | 5 |
| *“Specialty outpatient mental health” services mean services used by adults with Serious Mental Illness (SMI) and/or youth with serious emotional disturbance (SED), commonly provided by specialty providers such as community mental health centers. | ||||
Eight states in FY 2019 and nine states in FY 2020 reported changes in how behavioral health benefits are delivered under MCO contracts:
- Four states in FY 2019 (Mississippi, New Jersey, New York, and Virginia) and one state in FY 2020 (New Jersey) reported actions to carve certain behavioral health services into their MCO contracts. Ohio reported a full carve-in of behavioral health services as of July 1, 2018.
- Four other states (Kentucky, Nebraska, West Virginia, and Wisconsin) reported plans to add SUD waiver services to their MCO contracts in FY 2020. South Carolina added “in lieu of” SUD IMD (“Institutions for Mental Disease”) services to its MCO contracts in FY 2019 and other SUD services in FY 2020.
- Arizona and Washington reported implementing, or plans to implement, additional integrated MCO contracts in both FY 2019 and FY 2020.
- Mississippi added “in lieu of” free standing psychiatric hospital services to its MCO contracts in FY 2019.
- North Carolina’s “Standard” MCO plans implemented in FY 2020 will cover some behavioral health services, other than certain high intensity services that will continue to be provided by the state’s current behavioral health plans.
Managed Care (Acute and LTSS) Quality, Contract Requirements, and Administration
Quality Initiatives
Over time, the expansion of comprehensive risk-based managed care in Medicaid has been accompanied by greater attention to measuring quality and plan performance and, increasingly, to measuring health outcomes. After years of comprehensive risk-based managed care experience within the Medicaid program, states have become more sophisticated in incorporating quality metrics into the ongoing monitoring of MCOs, and many states now incorporate quality into the procurement process.38
States procure MCO contracts using different approaches; however, most states use competitive bidding, in part because the dollar value is so large. Under these procurements, states can specify requirements and criteria that go beyond price and may expect plans to compete on the basis of value-based payment arrangements with network providers, specific policy priorities such as improving birth outcomes, strategies to address social determinants of health, and/or other specific performance and quality criteria.
Nearly all MCO states (36 of 40 states) reported using at least one select Medicaid managed care quality initiative in FY 2019 (Figure 4 and Table 5). Two additional states not reporting quality initiatives in 2019 indicated that they had implemented new quality initiatives in FY 2020, bringing the total number to 38 states with at least one of these managed care quality strategies in place. States were asked to indicate whether they had specific managed care quality strategies (acute and/or MLTSS) in place in FY 2019 and to identify newly added or expanded initiatives for FY 2020. The overwhelming majority of states (34 out of 40) reported they made MCO comparison data publicly available in FY 2019. More than half of MCO states reported pay for performance incentives and/or capitation withhold arrangements in place in FY 2019. Fewer states reported use of an auto-assignment algorithm that includes quality performance measures.
In FY 2020, more than half of MCO states (23 states) expect to implement new or expanded quality initiatives (Figure 4). The majority of the actions states plan for FY 2020 represent enhancements or expansions to current quality strategies, rather than implementation of a new strategy. However, five states reported new initiatives in FY 2020. Three states reported implementing a pay for performance strategy (California, Illinois, and New Hampshire) and two states reported implementing a capitation withhold (Mississippi and New Hampshire) for the first time. Utah plans to make acute care MCO comparison data available in FY 2020 through the creation of a public-facing dashboard. Ohio reports transitioning from a pay for performance to a capitation withhold strategy in its acute care programs.39

PERFORMANCE MEASURE FOCUS AREAS
States that employed a pay for performance bonus or penalty, a capitation withhold and/or an auto-assignment quality factor (discussed above) were asked to identify performance measure focus areas linked to these quality incentives (Exhibit 8). Over three quarters of MCO states (31 states) reported using chronic disease management metrics when rewarding or penalizing plan performance. More than half of MCO states reported linking these quality initiatives to perinatal/birth outcome measures (26 states) or mental health measures (24 states). These focus areas are not surprising given the chronic physical health and behavioral health needs of the Medicaid population, as well as the significant share of the nation’s births funded by Medicaid. Over half of MCO states (22 states) tie quality incentives to potentially preventable events (PPEs) and nearly half (17 states) link incentives to value-based purchasing metrics, which is a growing area of focus for states (discussed in more detail below). Twelve states listed “other” focus areas including LTSS-related metrics (e.g., documentation of care goals and interaction with the care team in a dual eligible Financial Alignment Initiative (California)) and HCBS rebalancing (Hawaii). Other states reported incentives or penalties linked to operational metrics such as claims processing timelines and submission of encounter data.
| Exhibit 8: Performance Measure Focus Areas for MCO Incentives | ||
| Performance Area | # of States | States(39 of 40 MCO States Responding)* |
| Chronic Disease Management | 31 | AZ, CA, CO, DC, DE, FL, GA, HI, IA, IL, IN, KS, LA, MA, MI, MN, MO, MS, NE, NJ, NM, NV, NY, OH, OR, PA, RI, SC, TX, WA, WI |
| Perinatal/Birth Outcome | 26 | CA, CO, DC, DE, FL, HI, IL, IN, KS, LA, MI, MO, MS, NE, NH, NJ, NM, NV, OH, OR, PA, RI, SC, TX, VA, WI |
| Mental Health | 24 | CA, CO, FL, GA, HI, IA, IL, IN, KS, LA, MA, MN, MO, NH, NM, NY, OH, OR, PA, RI, SC, TX, WA, WI |
| Potentially Preventable Events | 22 | AZ, CA, DC, DE, FL, GA, IA, LA, MA, MI, MN, MO, NE, NH, NJ, OH, PA, RI, SC, TX, VA, WI |
| Substance Use Disorder | 19 | CO, FL, HI, IL, IN, KS, LA, MA, NH, NM, OH, OR, PA, RI, SC, TX, VA, WA, WI |
| Value-Based Purchasing | 17 | AZ, CA, DE, GA, KS, LA, MI, MN, NH, NM, OH, PA, RI, SC, TN, TX, WA |
| Dental | 13 | AZ, CA, GA, IN, KS, MI, MN, MO, NY, OR, PA, TX, WI |
| Member Satisfaction | 12 | DC, GA, HI, LA, MA, MI, NH, NY, OH, OR, SC, TX |
| Health Info Exchange | 4 | CA, MI, OH, WI |
| Health Disparities | 2 | CA, MI |
| Telehealth | 1 | NY |
| Other | 12 | CA, DE, HI, IA, IL, IN, MA, MI, NE, NV, TN, WI |
| *MD did not report. | ||
State-Mandated Performance Improvement Projects (PIPs)
For contracts starting on or after July 1, 2017, federal regulations mandate that states require each MCO or PHP to establish and implement an ongoing comprehensive quality assessment and performance improvement (QAPI) program for Medicaid services that includes Performance Improvement Projects (PIPs). PIPs may be designated by CMS, by states, or developed by health plans, but must be designed to achieve significant, sustainable improvement in health outcomes and enrollee satisfaction. In this year’s survey, states were asked to indicate whether they mandate MCO PIPs in a particular focus area. Thirty MCO states reported mandating certain PIPs in their MCO and PHP contracts in FY 2019 and four additional states indicated they were adding PIP requirements in FY 2020. The mandated PIP focus areas reported covered a wide range of programmatic topics, including child and adolescent wellness, perinatal/birth outcomes, behavioral health, dental health, chronic disease management, and long-term care, among other areas. Unlike the performance-based incentive initiatives mentioned above, a mandated PIP may not be directly tied to incentives or penalties, but nevertheless represents a performance area of particular importance to the state. Priority areas frequently reported include:
- Maternal and Child Health. Michigan reports requiring an MCO PIP to address racial disparities in the timeliness of prenatal care. Florida’s new MCO contracts require PIPs in the areas of reducing adverse birth outcomes, as well as reducing potentially preventable hospital events, transportation, and mental health or integrating mental health and primary care. In addition to a PIP related to consumer satisfaction, Iowa mandates an MCO PIP related to well child visits for children between 3 and 6 years of age.
- Chronic Care Disease Management. In addition to a PIP related to maternal health, DC also mandates a PIP related to comprehensive diabetes care. With a focus on efforts to reduce health disparities, Ohio reports requiring a PIP related to hypertension control in addition to a PIP on reducing preterm birth/infant mortality.
- Behavioral Health. Massachusetts mandates PIPs that correspond with two quality domains: Behavioral Health – prevention, assessment, and treatment of mental illness, including substance use and other dependencies; and Community Needs Assessment/ Risk Stratification – identifying and assessing priority populations for health conditions and social determinants of health and developing appropriate and timely interventions. In addition to a clinical PIP in the area of either child or perinatal health, Tennessee requires MCOs to implement a behavioral health PIP related to bipolar disorder, major depression, and schizophrenia.
- Long-Term Services and Supports. Pennsylvania MLTSS PIPs include a focus on transitioning beneficiaries from nursing facilities to home and community-based settings and strengthening care coordination. New Jersey MLTSS PIPs include initiatives to reduce falls and address gaps in care. Delaware mandates a PIP related to oral health of LTSS beneficiaries and at least one other MCO-defined PIP related to this population among five required PIPs in its MCO contracts.
MCO Contract Requirements
Alternative [Provider] Payment Models Within MCO Contracts
Value-based purchasing (VBP) strategies are important tools for states pursuing improved quality and outcomes and reduced costs of care within Medicaid and across payers. Generally speaking, VBP strategies include activities that hold a provider or MCO accountable for cost and quality of care.40 This often includes efforts to implement alternative payment models (APMs) which replace FFS/volume-driven provider payments with payment models that incentivize quality, coordination, and value (e.g., shared savings/shared risk arrangements and episode-based payments). Many states included a focus on adopting and promoting APMs as part of their federally-supported State Innovation Model (SIM) projects and as part of delivery system reform efforts approved under Section 1115 Medicaid waivers.41 A number of states are now encouraging or requiring MCOs to adopt APMs to advance VBP in Medicaid; our survey asked about requirements in MCO contracts.
More than half of MCO states (21 states) identified a specific target in their MCO contracts for the percentage of provider payments or plan members that MCOs must cover via APMs in FY 2019 (Exhibit 9). Three additional states plan to add a target percentage in FY 2020. States with targets linked to expenditures reported a wide range of currently required APM percentage targets ranging from a high of 80% (Hawaii) and 75% (Washington) to a low of 10% (Missouri and Wisconsin). Eleven states (Arizona, California, Louisiana, New Hampshire, New Mexico, North Carolina, Oregon, Pennsylvania, South Carolina, Texas, and Washington) reported that their APM targets were linked to the Health Care Payment Learning & Action Network’s (LAN’s) APM Framework that categorizes APMs in tiers.42
In addition, fourteen states reported that their MCO contracts included incentives or penalties for meeting or failing to meet APM targets in FY 2019 (Exhibit 9). Three states reported plans to add penalties or incentives in FY 2020 (DC, New Hampshire, and Oregon).
| Exhibit 9: States that Require MCOs to Meet a Target % for Provider APMs | ||
| # of States | States | |
| In Place FY 2019 | 21 | AZ*, CA, DE*, HI, IA*, LA*, MA, MO*, NE, NH, NM*, NY*, OH*, PA*, RI*, SC*, TN*, TX*, WA*, WI, WV |
| Plan to Begin in FY 2020 | 3 | DC, NC, OR |
| States with an * reported MCO contracts include incentives or penalties for meeting or failing to meet APM targets in FY 2019. While MI did not report an APM target, it did report that a performance incentive related to APM requirements was in place in FY 2019. | ||
In FY 2019, eight states had contracts that required MCOs to participate in a state-directed VBP initiative (e.g., state—administered or directed episode of care or ACO initiative) and seven states planned to do so in FY 2020 (Exhibit 10). For example: California requires MCOs to make payments to Designated Public Hospitals on performance measures in four strategic categories; Illinois plans to require MCOs to participate in its new Integrated Health Home initiative; Ohio requires MCOs to participate in its SIM payment innovation efforts, episode-based payment model, and Comprehensive Primary Care program; Tennessee mandates that MCOs participate in the state’s episodes of care, patient-centered medical home and behavioral health home initiatives; and Virginia is planning to implement bundled payments for maternity and asthma that MCOs will be required to implement.
Further, 12 states in FY 2019 required MCOs to develop a VBP strategy within state-specified guidelines and five states planned to do so in FY 2020 (Exhibit 10). For example: Arizona requires its MCOs to develop strategies within the LAN-APM categories 2B and above; Kansas requires MCOs to implement VBP models that expand service coordination, increase employment, and provide better outcomes for foster children; Oregon requires its MCOs to develop new or expanded VBP efforts in specified care delivery focus areas; and Utah will require MCOs to adopt a VBP strategy to address hypertension.
| Exhibit 10: State Requirements for MCO VBP Initiatives | |||||
| Require MCOs to: | FY 2019 | FY 2020 | |||
| Participate in a state-directed VBP initiative | 8 States | CA, FL, GA, IA, MN, OH, RI, TN | 7 States | IL, KS, LA, MO, MS, PA, VA | |
| Develop a VBP strategy within state-specified guidelines | 12 States | AZ, DE, GA, HI, IA, KS, LA, MI, MN, NM, NY, RI, | 5 States | MO, NH, OR, PA, UT | |
Administrative Policies
Minimum Medical Loss Ratios
The Medical Loss Ratio (MLR) reflects the proportion of total capitation payments received by an MCO spent on clinical services and quality improvement. CMS published a final rule in 2016 that requires states to develop capitation rates for Medicaid to achieve an MLR of at least 85% in the rate year, for rating periods and contracts starting on or after July 1, 2019. Also, contracts taking effect on or after July 1, 2017 must include a requirement for plans to calculate and report an MLR.43 The 85% minimum MLR is the same standard that applies to Medicare Advantage and private large group plans. There is no federal requirement for Medicaid plans to pay remittances to the state if they fail to meet the MLR standard, but states have discretion to require remittances.
States were asked whether they require MCOs that do not meet the minimum MLR requirement to pay remittances. Twenty-four states reported that they always require MCOs to pay remittances, while six states indicated they sometimes require MCOs to pay remittances (Exhibit 11). States reporting that they sometimes require remittances often limit this requirement to certain MCO contracts – for example, MCO contracts for the adult expansion population. One state (South Carolina) reported allowing an exception to the remittance requirement if an MCO achieved a high National Committee for Quality Assurance (NCQA) health insurance plan rating.44
| Exhibit 11: Medicaid MCO Minimum Medical Loss Ratio (MLR) Remittance Requirements as of July 1, 2019 | ||
| # of States | States | |
| State always requiring remittance | 24 | CO, DE, IA, IL, IN, KY, LA, MD, MI, MN, MO, MS, NE, NH, NJ, NM, NV, OR, PA, RI, UT, VA, WA, WV |
| State sometimes requiring remittance | 6 | AR, CA, MA, NY, OH, SC |
PCCM and PHP Program Changes
Primary Care Case Management (PCCM) Program Changes
Of the 12 states with PCCM programs, three reported enacting policies to increase PCCM enrollment in FY 2019 or FY 2020. Colorado reported growth in its PCCM-based Accountable Care Collaboratives in FY 2019 when it implemented a mandatory enrollment policy and Idaho reported that implementation of the ACA Medicaid expansion in January 2020 would increase PCCM enrollment. Also, Alabama reported implementing two new PCCM programs that rely on contracts with PCCM entities:
- In FY 2019, Alabama implemented the “Integrated Care Network” (ICN) program that provides enhanced case management, education, and outreach services to most LTSS recipients in both HCBS and institutional settings.
- In FY 2020, Alabama reported plans to replace its current PCCM program (Patient 1st) and Maternity PHP program with a new PCCM entity program (the Alabama Coordinated Health Network) that will cover care coordination services.
Three states (California, North Carolina, and Vermont) reported actions to decrease enrollment in a PCCM program in FY 2019 or FY 2020. California and Vermont ended their PCCM programs in FY 2019 and North Carolina will be transitioning many PCCM enrollees to its new MCO program in FY 2020.
Limited-Benefit Prepaid Health Plans (PHP) Changes
Over half of states (28 states) reported contracting with at least one PHP as of July 1, 2019. In this year’s survey, the 28 states were asked to indicate whether certain services (listed in Exhibit 12 below) were provided under these arrangements. The most frequently cited services provided (of those included in the question) were dental services (15 states), followed by outpatient mental health services (14 states), and inpatient mental health, outpatient SUD treatment services, and NEMT (13 states each).
| Exhibit 12: Services Covered Under PHP Contracts, July 1, 2019 | ||
| # of States | States45 | |
| Dental | 15 | AR, CA, FL, IA, ID, LA, MI, NE, NV, OR, RI, TN*, TX, UT, WI |
| Outpatient Mental Health | 14 | CA, CO, HI, ID, LA, MA, MI, NC, OR, PA, TN*, UT, WA, WI |
| Inpatient Mental Health | 13 | CA, CO, HI, LA, MA, MI, NC, OR, PA, TN*, UT, WA, WI |
| Outpatient SUD Treatment | 13 | CA, CO, ID, LA, MA, MI, NC, OR, PA, TN*, UT, WA, WI |
| Non-Emergency Medical Transportation (NEMT) | 13 | AR, FL, IN, KY, ME, MI, NJ, OK, RI, TN*, TX, UT, WI |
| Inpatient SUD Treatment | 11 | CA, LA, MA, MI, NC, OR, PA, TN*, UT, WA, WI |
| Long-Term Services and Supports | 6 | ID, MI, NC, NY, TN*, WI |
| Vision | 2 | TN*, WI |
| * In addition to separate dental and vision PHPs, TN contracts with a non-risk PHP to provide comprehensive benefits (physical health, behavioral health and LTSS) to children who are in foster care, receive Supplemental Security Income (SSI), or receive care in certain institutional settings. | ||
Four states reported implementing policies to increase PHP enrollment in FY 2019 or FY 2020. Three states (Florida, Utah, and Rhode Island) reported new or expanded dental PHPs in FY 2019 or planned for FY 2020 and Idaho reported that implementation of the ACA Medicaid expansion in FY 2020 would increase PHP enrollment.
Eight states also reported actions that decreased PHP enrollment in FY 2019 or FY 2020. Alabama reported plans to end its maternity care PHP (when its new PCCM-entity program is implemented); Hawaii reported that as of July 1, 2018, its behavioral health PHP contract includes stricter requirements for contacting hard to engage members which is expected to slightly reduce PHP enrollment; Kentucky reported that it is planning to eliminate methadone treatment-related NEMT coverage for most adults (excluding pregnant women and former foster care youth); North Carolina reported that many members will shift to integrated Standard Plans when they are implemented in FY 2020, reducing enrollment in the state’s behavioral health PHPs; Oregon reported that one behavioral health PHP was ending its state contract in FY 2020; Tennessee reported that in FY 2020, SSI children will be assigned to an MCO rather than its non-risk PHP that provides comprehensive benefits; Texas reported plans to transition from a NEMT brokerage model to an MCO carve-in model; Washington reported that enrollment in its behavioral health PHPs is decreasing as the state converts behavioral health PHPs to fully integrated MCO contracts in additional geographic areas.
In this year’s survey, states with PHPs were also asked to briefly describe PHP contract quality strategies in place in FY 2019 or planned for FY 2020. Nearly two-thirds of states with PHPs reported a variety of quality strategies including tracking of HEDIS and/or other measures; requiring PIPs; incentive payments; withholds tied to performance measures; public reporting of performance results (e.g., report cards or dashboards); imposition of penalties or liquidated damages; and use of APMs.
Social Determinants of Health
Social determinants of health are the conditions in which people are born, grow, live, work, and age that shape health.46 Addressing social determinants of health is important for improving health and reducing longstanding disparities in health and health care. Social determinants of health include but are not limited to housing, food, education, employment, healthy behaviors, transportation, and personal safety.
In April 2017, the CMS Center for Medicare and Medicaid Innovation (CMMI) launched the “Accountable Health Communities” (AHC) Model to implement and test different approaches to support local communities in addressing the health-related social needs of Medicare and Medicaid beneficiaries. The model aims to bridge the gap between clinical and community service providers and is the first CMS innovation model that focuses on social determinants of health.47 As part of this effort, CMS has developed an AHC Health-Related Social Needs Screening Tool.48 There are currently 30 organizations participating in the program, and the release of the first evaluation is anticipated in 2020.49
There has also been increased attention to social determinants of health at the state level, with many states developing strategies to identify and address a range of these issues both within MCO contracts and more broadly outside of managed care.
With Medicaid managed care delivery systems operating in 41 states as of FY 2020, many states are leveraging MCO contracts to promote strategies to address social determinants of health. In this year’s survey, MCO states were asked about MCO contract requirements related to social determinants of health in place in FY 2019 or planned for implementation in FY 2020. Over three-quarters of the 41 MCO states as of FY 2020 (35) are leveraging Medicaid MCO contracts to promote at least one strategy to address social determinants of health (Figure 5). As of FY 2020, about three-quarters of MCO states will require MCOs to: screen enrollees for social needs (31 states); provide enrollees with referrals to social services (31 states); or partner with community-based organizations (28 states) (Figure 5). 50 Almost half of MCO states will require MCOs to employ community health workers (CHWs) or other non-traditional health workers (19 states). Approximately a third of MCO states reported that they will require MCOs to track the outcomes of social services referrals (12 states) and fewer states reported that they will require MCOs to encourage/require their providers to capture member social determinants of health data using ICD-10 Z codes51 (7 states) (ICD-10 Z codes are a subset of the ICD-10 diagnosis codes that reflect patient social characteristics).

The following are examples of state MCO initiatives related to social determinants of health:
- Colorado is working with its MCOs to develop a reporting mechanism to track referrals to social services, with the goal of establishing a future performance metric that could be tied to payment.
- Michigan establishes a minimum ratio of CHWs to members and requires MCOs to provide or arrange for CHW services as part of the state’s comprehensive population health management strategy.52
- West Virginia’s enrollment broker collects social determinants of health data for beneficiaries enrolling in managed care and shares this data with MCOs. The MCOs use the data to identify and engage members in need of non-medical supports and refer those members to community services.
North Carolina: Transitioning to Managed Care with a Focus on Social Determinants of Health
In FY 2020, North Carolina will implement risk-based, capitated managed care contracts that will eventually cover approximately 1.6 million of its 2 million enrollees. MCOs will be required to:
- Report rates of completed screenings for unmet health-related resource needs.
- Incorporate social determinants of health into their quality strategies, including one non-clinical performance improvement project (PIP).
- Indicate how they will incorporate social determinants of health into value-based payment strategies.
- Use state developed tools, including standardized care needs screening questions and “NCCARE360,” a statewide coordinated care network that electronically connects members with community resources and allows for a feedback loop.53
- Participate in “Healthy Opportunities” pilots if operating in a pilot region.54 The pilot is part of the state’s Section 1115 waiver which authorized $650 million in Medicaid funding over five years to implement evidenced-based enhanced case management and other services (in two to four regions) to address needs related to housing, food, transportation, and interpersonal safety for a limited number of enrollees that have at least one physical or behavioral health risk factor and at least one social risk factor.
In addition to initiatives through MCOs, many states have strategies outside of their MCO programs (in FFS programs) to address social determinants of health. This year’s survey asked all states about non-MCO initiatives in place in FY 2019 or planned for implementation in FY 2020 related to social determinants of health. About half of all states indicated having non-MCO initiatives in place in FY 2019 related to screening enrollees for social needs, providing enrollees with referrals to social services, or partnering with community-based organizations. Fewer states indicated having non-MCO initiatives in place in FY 2019 to track the outcome of social services referrals, employ community health workers, or encourage/require providers to capture social determinants of health data using ICD-10 Z codes.
The following are state examples of non-MCO initiatives related to social determinants of health:
- Connecticut requires participating practices of its PCMH+ program (an upside-only shared savings initiative) to demonstrate formal agreements with community partners (e.g., housing entities, food pantries). The state also encourages providers to capture ICD-10 Z codes on claims to help identify beneficiaries who may need assistance and connect them to community resources and supports.
- Montana’s Medicaid program will reimburse for services provided by Tribal Community Health Aides, as directed by House Bill 599.55
- Vermont’s Chronic Care Initiative (VCCI) has a licensed case management team that screens members that are engaged with VCCI for SDOH needs. Screening areas include housing, transportation, food security, and utility payments. VCCI employs two outreach coordinators whose primary role is to reach out to all newly enrolled adult members, screen them, and provide brief intervention and navigation to services.
In addition to the MCO and non-MCO social determinants initiatives discussed above, states also highlighted other social determinants of health activity currently underway, including:
- Three states (Arizona, District of Columbia, and Oregon) indicated they are exploring ways to leverage health information exchange (HIE) systems to support a “closed loop” referral process.
- In addition to North Carolina, at least three other states (Connecticut, Ohio, and Pennsylvania) have developed or are in the process of developing standardized screening and assessment tools that include domains related to social determinants of health. Additionally, Indiana’s Medicaid eligibility application includes screening questions related to social determinants of health.
- South Carolina has a statewide pediatric ambulatory care quality improvement collaborative (called Quality Through Technology and Innovation in Pediatrics), funded by the South Carolina Department of Health and Human Services (SCDHHS) and involving over 30 pediatric offices in South Carolina, that promotes social and emotional development, positive parenting, and the promotion of the parent-child bond and parental mental health. The program includes social determinants of health screenings and community resource ideas for practices to screen and refer for non-medical needs.
- Washington’s Section 1115 Medicaid Transformation Project leverages Accountable Communities of Health (ACH) as lead entities to align priorities, partners from the traditional and non-traditional sectors, resources, and action to transform the Medicaid delivery system. While performance outcomes are largely clinical, the design of the effort is based on the premise that social health, public health, and community-based organizations must play a role with the clinical delivery system in order to achieve these outcomes. ACHs in several regions are implementing the Pathways Community Hub model56 for care coordination, which uses template screening and referral systems for social services and CHWs to screen, refer, and complete interventions for select social service needs.
Criminal Justice-Involved Populations
Improving continuity of care for individuals released from correctional facilities into the community is important to ensure that individuals with complex or chronic health conditions, including behavioral health needs, have an effective transition to treatment in the community. It can also help address the opioid epidemic by mitigating the risk of overdose in the period following incarceration.57 In FY 2019, five states required MCOs to provide care coordination services to at least some enrollees prior to release from incarceration, and three additional states reported plans to require care coordination in FY 2020 (Exhibit 13). Several states also reported providing or plans to provide FFS care coordination services to incarcerated persons prior to release.
| Exhibit 13: Providing Care Coordination Services to Enrollees Prior to Release from Incarceration58 | ||||
| FY 2019 | FY 2020 | |||
| MCO Requirement | 5 States | AZ, CO, LA, OH, WA | 3 States | DE, HI, VA |
| FFS Initiative | 8 States | CA, CO, CT, KS, MI, PA, RI, SC | 3 States | DC, DE, VA |
| MCO requirement not reported: GA, MD, MI, NH; FFS initiative not reported: GA, MD | ||||
The following are state examples of MCO pre-release care coordination initiatives:
- Louisiana Department of Corrections staff identify “high-need” beneficiaries for pre-release case management through MCOs, including the provision of at least one “in-reach” appointment prior to release and the scheduling of needed appointments following release.
- Ohio’s Medicaid Pre-Release Enrollment program facilitates direct enrollment of incarcerated individuals into an MCO. Beneficiaries with complex needs are assigned an MCO care manager prior to release who develops a transition plan and helps connect the member to needed community services and supports.
- Washington requires MCOs to provide care coordination for enrollees transitioning into or out of a correctional facility. This includes establishing a data sharing process to support the sharing of health information between the MCO and the correctional facility. As part of the care coordination program, MCOs must also arrange transportation, schedule appointments, and provide housing and employment assistance services.
While not an MCO initiative, Connecticut outstations Medicaid eligibility staff at correctional facilities to support transitions into the community, including enrollment in Medicaid, the provision of medication vouchers, and connecting the individual to the state’s contracted Medicaid medical administrative services organization to facilitate care coordination. Additionally, New York is pursuing a Section 1115 waiver amendment to provide the following covered Medicaid services beginning 30 days prior to release from a correctional facility for Medicaid beneficiaries with certain serious health conditions: care management services, including “in-reach” engagement; needs assessment; discharge care plan; referrals and appointment scheduling; linkages to social services and peer supports; clinical consultation services to support continuity of care; and a medication management program.
Emerging Delivery System and Payment Reforms
Over three-quarters of all state Medicaid programs (44 states) had at least one of the specified delivery system or payment reform models in place in FY 2019, continuing the upward trend of state-led reforms that aim to address quality and costs (Figure 6 and Table 6). This year’s survey asked states whether certain delivery system and payment reform models (defined in the box below) were in place in FY 2019, and whether they planned to adopt or enhance these models in FY 2020. For FY 2020, 14 states reported plans to adopt or expand one or more of the models to reward quality and encourage integrated care. Key initiatives include patient-centered medical homes (PCMHs), ACA Health Homes, and Accountable Care Organizations (ACOs).
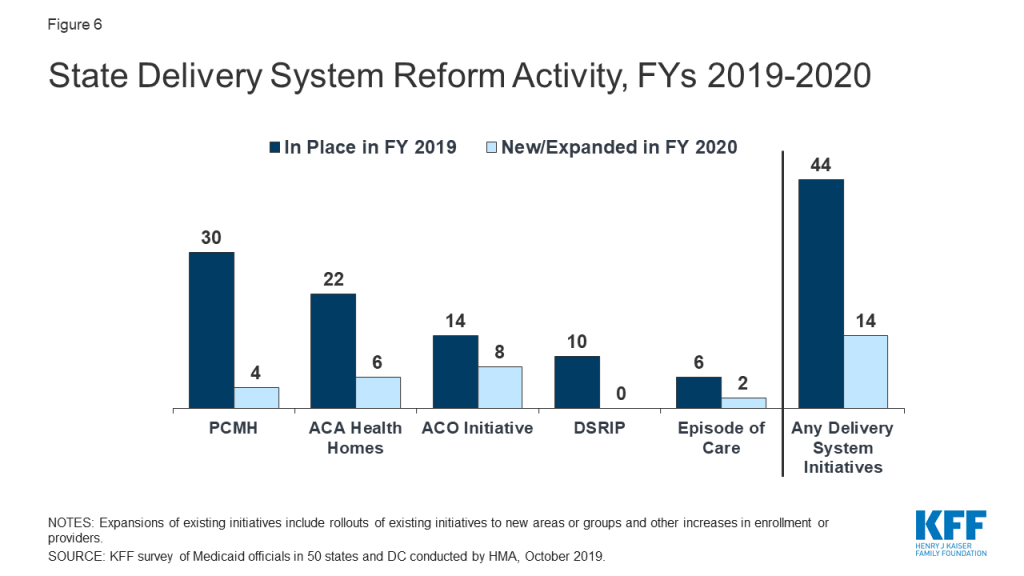
Delivery System Reform Initiatives Defined
- Patient-Centered Medical Home (PCMH). Under a PCMH model, a physician-led, multi-disciplinary care team holistically manages the patient’s ongoing care, including recommended preventive services, care for chronic conditions, and access to social services and supports. Generally, providers or provider organizations that operate as a PCMH seek recognition from organizations like the National Committee for Quality Assurance (NCQA).59 PCMHs are often paid (by state Medicaid agencies directly or through MCO contracts) a per member per month (PMPM) fee in addition to regular FFS payments for their Medicaid patients.
- ACA Health Home. The ACA Health Homes option, created under Section 2703 of the ACA, builds on the PCMH concept. By design, Health Homes must target beneficiaries who have at least two chronic conditions (or one and risk of a second, or a serious and persistent mental health condition), and provide a person-centered system of care that facilitates access to and coordination of the full array of primary and acute physical health services, behavioral health care, and social and long-term services and supports. This includes services such as comprehensive care management, referrals to community and social support services, and the use of health information technology (HIT) to link services, among others. States receive a 90% federal match rate for qualified Health Home service expenditures for the first eight quarters under each Health Home State Plan Amendment; states can (and have) created more than one Health Home program to target different populations.60 For SUD Health Homes approved on or after October 1, 2018, the SUPPORT Act extends the enhanced federal match rate from eight to ten quarters.
- Accountable Care Organization (ACO). While there is no uniform, commonly accepted federal definition of an ACO, an ACO generally refers to a group of health care providers or, in some cases, a regional entity that contracts with providers and/or health plans, that agrees to share responsibility for the health care delivery and outcomes for a defined population.61 An ACO that meets quality performance standards that have been set by the payer and achieves savings relative to a benchmark can share in the savings. States use different terminology in referring to their Medicaid ACO initiatives, such as Regional Accountable Entities62 in Colorado and Accountable Entities in Rhode Island.
- Episode of Care Initiatives. Unlike FFS reimbursement, where providers are paid separately for each service, or capitation, where a health plan receives a PMPM payment for each enrollee intended to cover the costs for all covered services, episode-of-care payment provides a set dollar amount for the care a patient receives in connection with a defined condition or health event (e.g., heart attack or knee replacement). Episode-based payments usually involve payment for multiple services and providers, creating a financial incentive for physicians, hospitals, and other providers to work together to improve patient care and manage costs.
- Delivery System Reform Incentive Payment (DSRIP) Programs. DSRIP initiatives, which emerged under the Obama administration, provide states with significant federal funding to support hospitals and other providers in changing how they provide care to Medicaid beneficiaries.63 DSRIP initiatives link funding for eligible providers to process and performance metrics. Although some states may be interested in developing new DSRIP initiatives, the Trump administration has not indicated an intent to use this tool to advance delivery system reform.
PCMH and Health Home initiatives were the most common delivery system reform initiatives in place in states in FY 2019 (Table 6). PCMH initiatives operated in over half (30 states) of Medicaid programs in FY 2019 and four states reported plans to expand or enhance their existing PCMH programs in FY 2020, often citing increased provider participation. Over one-third of states (22 states) had at least one Health Home initiative in place in FY 2019. Four states reported plans to adopt and two states reported plans to expand Health Homes in FY 2020. Additionally, one state (Ohio) reported plans to request to extend the ACA enhanced match rate for two additional quarters (i.e., for a total of 10 quarters) for SUD Health Homes approved on or after October 1, 2018, as permitted under the SUPPORT Act.
Two states reported eliminations or restrictions to their programs coming in FY 2020. One state (Alabama) reported that both its PCMH and Health Home programs would end in FY 2020 when its new PCCM-entity program is implemented, and New York reported that its PCMH program would be restricted in FY 2020 due to budget caps being applied to PMPM payments.
About a quarter of states had ACO initiatives in place and fewer states have episode of care initiatives in place in FY 2019 (Table 6). Fourteen states reported having an ACO initiative in place for at least some of their Medicaid beneficiaries in FY 2019.64 In some cases, states reported contracting directly with ACOs while other states reported encouraging or requiring their MCOs to contract with ACOs. Two states reported new initiatives and six states reported plans to expand an existing initiative in FY 2020. Six states reported that they had episode-of-care payment initiatives in place in FY 2019, unchanged from 2018 although Pennsylvania will implement a new initiative in 2020 and Ohio will expand its existing initiative in 2020. One state (Arkansas) reported plans to delink its program from reimbursement incentives while retaining as an informational quality benchmark.
State Delivery System Reform Examples
- Connecticut reported expanding its PCMH+65 initiative to include additional FQHCs and advanced networks.
- Kansas reported on plans to develop a Health Home targeted at persons with Serious Mental Illness (SMI).
- North Carolina reported that its “Advanced Medical Home” (AMH) program will be the primary vehicle for delivering care management as the state transitions to MCO managed care in FY 2020. The AMH program builds on the Carolina ACCESS program, the state’s PCCM program.
- Vermont reported on the expansion of participating providers and attributed lives in the ACO component of the state’s Vermont All Payer Model. In CY 2019, approximately 47% of Medicaid enrollees are enrolled with an ACO.
Ten states reported DSRIP initiatives in place in FY 2019, unchanged from FY 2018 (Table 6) with three states (Kansas, New Jersey, New Mexico) ending their programs in 2020 and one state (Texas) indicating a funding decrease. DSRIP initiatives, which emerged under the Obama administration, have provided states with significant federal funding to support hospitals and other providers in changing how they provide care to Medicaid beneficiaries. No states reported expansions or enhancements to existing initiatives or reported new DSRIP initiatives planned for FY 2020. These initiatives were not intended to be permanent and the Trump administration has not signaled an intent to promote these initiatives going forward.
All-payer claims database (APCD) systems are large-scale databases that systematically collect medical claims, pharmacy claims, dental claims (typically, but not always), and eligibility and provider files from both private and public payers. APCDs can be used to help identify areas to focus reform efforts and for other purposes. Eighteen states reported having an APCD in place. Two states (Connecticut and New York) reported that their APCD would be expanded in FY 2020 and one state (Hawaii) reported plans for a new APCD in FY 2020 (data not shown). California and Delaware also reported that they were in the early stages of development for an APCD in FY 2020.
In addition to the initiatives discussed above, states mentioned a variety of other delivery system and payment reform initiatives. These are not counted in the totals for Figure 6 and Table 6, including value-based purchasing initiatives, pay for performance payments, or other incentive arrangements targeted at hospitals, nursing facilities, federally qualified health centers (FQHCs), or other provider types. Examples of other initiatives reported include the following: in FY 2019, Arizona implemented an APM for FQHCs; in FY 2020, Georgia will expand its school nurse administrative claiming program to include services to students who do not have an Individualized Education Plan (IEP); Maryland reported seeking Section 1115 waiver authority to implement a “Collaborative Care” model pilot that integrates physical and behavioral health services in primary care settings, and Pennsylvania implemented MCO directed payments to Opioid Use Disorder Centers of Excellence (COEs) for care management services in January 2019.
States with significant populations and/or services delivered outside of contracted MCO arrangements also reported on a wide range of non-MCO quality activities. These activities include collection of HEDIS data and other performance measures, conducting beneficiary satisfaction (CAHPS66 ) surveys, collecting LTSS measures, conducting performance improvement projects, and publicly reporting quality data. One state (Alabama) that is implementing a comprehensive quality strategy for its new PCCM-entity program is highlighted below.
Alabama Coordinated Health Network Quality Activities
In FY 2020, Alabama will contract with one PCCM-entity in each of the state’s seven predefined regions to provide care coordination services for the majority of its Medicaid members. Each PCCM-entity will be held accountable for improving health outcomes based on HEDIS and CMS Quality Measures and will be eligible for a 10% quality bonus based on their performance on those measures. Each PCCM-entity must also implement three Quality Improvement Projects focused on prevention of childhood obesity, reduction in infant mortality, and substance use disorder.
State strategies to improve maternal health
The rates of maternal mortality (typically defined as death within one year of pregnancy) in the U.S. have been steadily rising over the past several decades, with significantly higher mortality rates among people of color.67 Medicaid plays a pivotal role in providing prenatal and maternity-related services to pregnant women in the U.S. and pays for nearly half of all births.68 Reflecting that the Medicaid program covers a high need, low-income population, women with Medicaid coverage are more likely to have chronic conditions, preterm births, and low-birthweight babies.69
This year’s survey asked states to briefly describe initiatives implemented in FY 2019 or planned for FY 2020 to improve birth outcomes and/or address maternal mortality challenges. About two-thirds of the states reported new or expanded Medicaid initiatives with over a quarter of states focused on pregnant women with SUD. The most frequently mentioned strategies were MCO-related initiatives including Performance Improvement Projects (PIPs), incentives tied to improvement on performance measures related to birth outcomes or maternal health, and state encouraged MCO value-added benefits for pregnant women. More states reported expanding benefits (both statewide and pilot programs) and eligibility for pregnant and postpartum women compared to the 2017 and 2018 survey (see Benefits and Cost-sharing section for more information on benefit changes and Eligibility and Premiums section for more information on eligibility changes).
The following are other examples of strategies states are using to improve maternal health:
- At least 11 states70 reported applying for the Maternal Opioid Misuse (MOM) Model CMMI grant initiative. The MOM model is intended to address fragmentation in the care of pregnant and postpartum Medicaid beneficiaries with opioid use disorder (OUD) through delivery system transformation. CMMI will distribute a maximum of $64.6 million across a maximum of 12 states, whose Medicaid agencies will implement the model with one or more “care-delivery partners” in their communities. Award notices are anticipated in the fall of 2019.
- Seven states (Arizona, Florida, Maine, Missouri, New York, Pennsylvania, and Virginia) reported initiating some type of statewide initiative or task force that aims to collect information and address issues related to maternal health.
- Six states added or expanded one or more statewide or pilot-based benefits that include doula care services (New Jersey, and New York), home visiting programs (Illinois and New Mexico), group prenatal care services (Georgia and New Jersey), and midwife services (Wyoming).71
- Seven states reported eligibility changes for women that include extending postpartum coverage from 60 days to one year (Illinois, South Carolina, and Missouri [only for pregnant women with SUD] ), increasing the income limit for eligibility (North Dakota and West Virginia), and restoring retroactive coverage for pregnant women (Delaware and Oklahoma).
- Four states reported on other value-based purchasing strategies (Colorado, Connecticut, New Jersey, and Texas) that include incentives to providers to increase health outcomes around deliveries and perinatal care.
- Two states reported delivery system reforms to increase the use of risk screening tools by providers (Montana and Texas). Also, Ohio reported plans to submit a SPA to implement SUD “Mom and Baby Dyad” care, linking it to other SUD waiver activities such as intensive care coordination, and developing a residential treatment provider type to provide treatment for mom and baby as needed.
Table 2: Share of the Medicaid Population Covered Under Different Delivery Systems in all 50 States and DC, as of July 1, 2019
| States | Type(s) of Managed Care In Place | Share of Medicaid Population in Different Delivery Systems | ||
| MCO | PCCM | FFS / Other | ||
| Alabama | PCCM | — | 85.0% | 15.0% |
| Alaska | FFS | — | — | 100.0% |
| Arizona | MCO | 94.0% | — | 6.0% |
| Arkansas* | PCCM and MCO | 5.0% | 45.0% | 50.0% |
| California | MCO | 81.1% | — | 18.9% |
| Colorado | MCO and PCCM* | 9.5% | 90.5% | 0.0% |
| Connecticut | FFS* | — | — | 100.0% |
| Delaware | MCO | 97.0% | — | 3.0% |
| DC | MCO | 75.0% | — | 25.0% |
| Florida | MCO | 90.0% | — | 10.0% |
| Georgia | MCO | 75.0% | — | 25.0% |
| Hawaii | MCO | 99.9% | — | 0.1% |
| Idaho* | PCCM | — | 83.9% | 16.1% |
| Illinois | MCO | 81.4% | — | 18.6% |
| Indiana | MCO | 78.0% | — | 22.0% |
| Iowa | MCO | 94.3% | — | 5.8% |
| Kansas | MCO | 99.4% | — | 0.6% |
| Kentucky | MCO | 91.0% | — | 9.0% |
| Louisiana | MCO | 90.1% | — | 9.9% |
| Maine | PCCM | — | 60.0% | 40.0% |
| Maryland | MCO | 85.7% | — | 14.3% |
| Massachusetts | MCO and PCCM | 42.0% | 26.0% | 32.0% |
| Michigan | MCO | 76.5% | — | 23.5% |
| Minnesota | MCO | 82.9% | — | 17.1% |
| Mississippi | MCO | 65.0% | — | 35.0% |
| Missouri | MCO | 73.0% | — | 27.0% |
| Montana | PCCM | — | 87.0% | 13.0% |
| Nebraska | MCO | 99.9% | — | 0.1% |
| Nevada | MCO | 74.0% | — | 26.0% |
| New Hampshire | MCO | 97.7% | — | 2.3% |
| New Jersey | MCO | 95.0% | — | 5.0% |
| New Mexico | MCO | 80.7% | — | 19.3% |
| New York | MCO | 76.6% | — | 23.4% |
| North Carolina | PCCM | — | 90.0% | 10.0% |
| North Dakota | MCO and PCCM | 23.0% | 43.5% | 33.5% |
| Ohio | MCO | 93.7% | — | 6.3% |
| Oklahoma | PCCM | — | 74.5% | 25.5% |
| Oregon | MCO* | 91.0% | — | 9.0% |
| Pennsylvania | MCO | 89.3% | — | 10.7% |
| Rhode Island | MCO | 90.0% | — | 10.0% |
| South Carolina | MCO* | 77.0% | — | 23.0% |
| South Dakota | PCCM | — | 80.0% | 20.0% |
| Tennessee | MCO | 100.0% | — | 0.0% |
| Texas | MCO | 94.0% | — | 6.0% |
| Utah | MCO | 75.3% | — | 24.7% |
| Vermont | FFS | — | — | 100.0% |
| Virginia | MCO | 98.0% | — | 2.0% |
| Washington | MCO and PCCM | 93.0% | 1.0% | 6.0% |
| West Virginia | MCO | 77.0% | — | 23.0% |
| Wisconsin | MCO | 78.3% | — | 21.7% |
| Wyoming | FFS | — | — | 100.0% |
| NOTES: MCO refers to risk-based managed care; PCCM refers to Primary Care Case Management. FFS/Other refers to Medicaid beneficiaries who are not in MCOs or PCCM programs. *AR – Most expansion adults served by Qualified Health Plans through “Arkansas Works” premium assistance waiver. *CO – PCCM enrollees are part of the state’s Accountable Care Collaboratives (ACCs). *CT – Terminated its MCO contracts in 2012 and now operates its program on a fee-for-service basis using three ASO entities. *ID – The Medicaid-Medicare Coordinated Plan (MMCP) has been recategorized by CMS as an MCO but is not counted here as such since it is secondary to Medicare. *OR – MCO enrollees include those enrolled in the state’s Coordinated Care Organizations. *SC – Uses PCCM authority to provide care management services to medically complex children. SOURCE: Kaiser Family Foundation Survey of Medicaid Officials in 50 states and DC conducted by Health Management Associates, October 2019. | ||||
Table 3: Enrollment of Special Populations Under Medicaid Managed Care Contracts for Acute Care in all 50 States and DC, as of July 1, 2019
| States | Non-Dual, Non-LTSS Populations | ||||||
| Pregnant Women | Medically Fragile/Tech Dependent Children | Foster Children | Persons with SMI/SED | Persons with ID/DD | Persons with Physical Disabilities | Seniors | |
| Alabama | — | — | — | — | — | — | — |
| Alaska | — | — | — | — | — | — | — |
| Arizona | Mandatory | Mandatory | Mandatory | Mandatory | Mandatory | Mandatory | Mandatory |
| Arkansas | Varies | Excluded | Varies | Mandatory | Mandatory | Excluded | Varies |
| California | Mandatory | Mandatory | Varies | Mandatory | Mandatory | Mandatory | Mandatory |
| Colorado | Voluntary | Voluntary | Voluntary | Voluntary | Voluntary | Voluntary | Voluntary |
| Connecticut | — | — | — | — | — | — | — |
| Delaware | Mandatory | Mandatory | Mandatory | Mandatory | Mandatory | Mandatory | Mandatory |
| DC | Mandatory | Voluntary | Varies | Varies | Excluded | Varies | Excluded |
| Florida | Mandatory | Mandatory | Mandatory | Mandatory | Voluntary | Mandatory | Mandatory |
| Georgia | Varies | Excluded | Mandatory | Excluded | Excluded | Excluded | Excluded |
| Hawaii | Mandatory | Mandatory | Mandatory | Mandatory | Mandatory | Mandatory | Mandatory |
| Idaho | — | — | — | — | — | — | — |
| Illinois | Mandatory | Excluded | Excluded | Mandatory | Mandatory | Mandatory | Mandatory |
| Indiana | Mandatory | Varies | Voluntary | Varies | Varies | Varies | Mandatory |
| Iowa | Mandatory | Mandatory | Mandatory | Mandatory | Mandatory | Mandatory | Mandatory |
| Kansas | Mandatory | Mandatory | Mandatory | Mandatory | Mandatory | Mandatory | Mandatory |
| Kentucky | Mandatory | Varies | Mandatory | Varies | Varies | Varies | Varies |
| Louisiana | Mandatory | Varies | Mandatory | Varies | Varies | Varies | Varies |
| Maine | — | — | — | — | — | — | — |
| Maryland | Mandatory | Excluded | Mandatory | Varies | Varies | Varies | Excluded |
| Massachusetts | Voluntary | Voluntary | Voluntary | Voluntary | Voluntary | Voluntary | Voluntary |
| Michigan | Mandatory | Mandatory | Mandatory | Mandatory | Mandatory | Varies | Mandatory |
| Minnesota | Varies | Voluntary | Voluntary | Voluntary | Voluntary | Voluntary | Varies |
| Mississippi | Mandatory | Voluntary | Voluntary | Varies | Excluded | Mandatory | Excluded |
| Missouri | Mandatory | Voluntary | Mandatory | Voluntary | Excluded | Voluntary | Excluded |
| Montana | — | — | — | — | — | — | — |
| Nebraska | Mandatory | Mandatory | Mandatory | Mandatory | Mandatory | Mandatory | Mandatory |
| Nevada | Mandatory | Voluntary | Voluntary | Voluntary | Excluded | Excluded | Excluded |
| New Hampshire | Mandatory | Mandatory | Mandatory | Mandatory | Mandatory | Mandatory | Mandatory |
| New Jersey* | Mandatory | Mandatory | Mandatory | Mandatory | Mandatory | Mandatory | Mandatory |
| New Mexico | Mandatory | Mandatory | Mandatory | Mandatory | Mandatory | Mandatory | Mandatory |
| New York | Mandatory | Mandatory | Varies | Mandatory | Voluntary | Mandatory | Mandatory |
| North Carolina | — | — | — | — | — | — | — |
| North Dakota | Excluded | Excluded | Excluded | Excluded | Excluded | Excluded | Excluded |
| Ohio | Mandatory | Mandatory | Mandatory | Mandatory | Mandatory | Mandatory | Mandatory |
| Oklahoma | — | — | — | — | — | — | — |
| Oregon | Mandatory | Mandatory | Varies | Mandatory | Varies | Mandatory | Mandatory |
| Pennsylvania | Mandatory | Mandatory | Mandatory | Mandatory | Mandatory | Mandatory | Mandatory |
| Rhode Island | Mandatory | Varies | Mandatory | Mandatory | Mandatory | Mandatory | Excluded |
| South Carolina | Mandatory | Varies | Voluntary | Mandatory | Varies | Varies | Voluntary |
| South Dakota | — | — | — | — | — | — | — |
| Tennessee | Mandatory | Mandatory | Mandatory | Mandatory | Mandatory | Mandatory | Mandatory |
| Texas | Mandatory | Mandatory | Mandatory | Mandatory | Mandatory | Mandatory | Mandatory |
| Utah | Mandatory | Varies | Varies | Mandatory | Varies | Varies | Mandatory |
| Vermont | — | — | — | — | — | — | — |
| Virginia | Mandatory | Mandatory | Mandatory | Mandatory | Mandatory | Mandatory | Mandatory |
| Washington | Mandatory | Varies | Voluntary | Mandatory | Varies | Mandatory | Mandatory |
| West Virginia | Mandatory | Mandatory | Excluded | Mandatory | Excluded | Mandatory | Excluded |
| Wisconsin | Mandatory | Varies | Varies | Varies | Voluntary | Mandatory | Varies |
| Wyoming | — | — | — | — | — | — | — |
| Mandatory | 34 | 20 | 22 | 26 | 19 | 24 | 23 |
| Voluntary | 2 | 7 | 8 | 5 | 6 | 4 | 3 |
| Varies | 3 | 8 | 7 | 7 | 8 | 8 | 5 |
| Excluded | 1 | 5 | 3 | 2 | 7 | 4 | 9 |
| NOTES: “–” indicates there were no MCOs operating in that state’s Medicaid program as of July 1, 2019. I/DD – intellectual and developmental disabilities, SMI – Serious Mental Illness, SED – Serious Emotional Disturbance. States were asked to indicate for each group if enrollment in MCOs is “Mandatory,” “Voluntary,” “Varies,” or if the group is “Excluded” from MCOs as of July 1, 2019. *NJ: Nursing facility residents as of July 1, 2014 were grandfathered and remain excluded from MCO enrollment unless they experience a change in eligibility status or are discharged from the nursing facility. SOURCE: Kaiser Family Foundation Survey of Medicaid Officials in 50 states and DC conducted by Health Management Associates, October 2019. | |||||||
Table 4: Behavioral Health Services Covered Under Acute Care MCO Contracts in all 50 States and DC, as of July 1, 2019
| States | Specialty OP Mental Health | Inpatient Mental Health | Outpatient SUD | Inpatient SUD |
| Alabama | — | — | — | — |
| Alaska | — | — | — | — |
| Arizona* | Always Carved-in | Always Carved-in | Always Carved-in | Always Carved-in |
| Arkansas | Always Carved-in | Always Carved-in | Always Carved-in | Always Carved-in |
| California | Always Carved-out | Always Carved-out | Always Carved-out | Always Carved-out |
| Colorado | Always Carved-out | Always Carved-out | Always Carved-out | Always Carved-out |
| Connecticut | — | — | — | — |
| Delaware | Varies | Varies | Varies | Varies |
| DC | Always Carved-out | Always Carved-in | Always Carved-out | Always Carved-in |
| Florida | Always Carved-in | Always Carved-in | Always Carved-in | Always Carved-in |
| Georgia | Always Carved-in | Always Carved-in | Always Carved-in | Always Carved-in |
| Hawaii | Always Carved-out | Always Carved-out | Always Carved-in | Always Carved-in |
| Idaho | — | — | — | — |
| Illinois | Always Carved-in | Always Carved-in | Always Carved-in | Always Carved-in |
| Indiana | Varies | Always Carved-in | Always Carved-in | Always Carved-in |
| Iowa | Always Carved-in | Always Carved-in | Always Carved-in | Always Carved-in |
| Kansas | Always Carved-in | Always Carved-in | Always Carved-in | Always Carved-in |
| Kentucky | Always Carved-in | Always Carved-in | Always Carved-in | Always Carved-in |
| Louisiana | Always Carved-in | Always Carved-in | Always Carved-in | Always Carved-in |
| Maine | — | — | — | — |
| Maryland | Always Carved-out | Always Carved-out | Always Carved-out | Always Carved-out |
| Massachusetts | Always Carved-in | Always Carved-in | Always Carved-in | Always Carved-in |
| Michigan | Always Carved-out | Always Carved-out | Always Carved-out | Always Carved-out |
| Minnesota | Always Carved-in | Always Carved-in | Always Carved-in | Always Carved-in |
| Mississippi | Always Carved-in | Always Carved-in | Always Carved-in | Always Carved-in |
| Missouri | Always Carved-out | Varies | Varies | Varies |
| Montana | — | — | — | — |
| Nebraska | Always Carved-in | Always Carved-in | Always Carved-in | Always Carved-in |
| Nevada | Always Carved-in | Varies | Always Carved-in | Always Carved-in |
| New Hampshire | Always Carved-in | Always Carved-in | Always Carved-in | Always Carved-in |
| New Jersey | Varies | Always Carved-in | Varies | Always Carved-in |
| New Mexico | Always Carved-in | Always Carved-in | Always Carved-in | Always Carved-in |
| New York | Varies | Always Carved-in | Always Carved-in | Always Carved-in |
| North Carolina | — | — | — | — |
| North Dakota | Always Carved-in | Always Carved-in | Always Carved-in | Always Carved-in |
| Ohio | Always Carved-in | Always Carved-in | Always Carved-in | Always Carved-in |
| Oklahoma | — | — | — | — |
| Oregon | Always Carved-in | Always Carved-in | Always Carved-in | Always Carved-in |
| Pennsylvania | Always Carved-out | Always Carved-out | Always Carved-out | Always Carved-out |
| Rhode Island | Always Carved-in | Always Carved-in | Always Carved-in | Always Carved-in |
| South Carolina | Always Carved-in | Always Carved-in | Always Carved-in | Always Carved-in |
| South Dakota | — | — | — | — |
| Tennessee | Always Carved-in | Always Carved-in | Always Carved-in | Always Carved-in |
| Texas | Varies | Always Carved-in | Always Carved-in | Always Carved-in |
| Utah | Always Carved-out | Always Carved-out | Always Carved-out | Always Carved-out |
| Vermont | — | — | — | — |
| Virginia | Always Carved-out | Varies | Always Carved-in | Varies |
| Washington | Varies | Varies | Varies | Varies |
| West Virginia | Always Carved-in | Always Carved-in | Always Carved-in | Varies |
| Wisconsin | Varies | Always Carved-in | Always Carved-in | Always Carved-in |
| Wyoming | — | — | — | — |
| Always Carved-in | 23 | 28 | 29 | 29 |
| Always Carved-out | 10 | 7 | 7 | 6 |
| Varies | 7 | 5 | 4 | 5 |
| NOTES: OP – Outpatient. SUD – Substance Use Disorder. “–” indicates there were no MCOs operating in that state’s Medicaid program in July 2019. For beneficiaries enrolled in an MCO for acute care benefits, states were asked to indicate whether these benefits are always carved-in (meaning virtually all services are covered by the MCO), always carved-out (to PHP or FFS), or whether the carve-in varies (by geography or other factor). “Specialty outpatient mental health” refers to services utilized by adults with Serious Mental Illness (SMI) and/or youth with serious emotional disturbance (SED) commonly provided by specialty providers such as community mental health centers. *AZ: Foster care children have separate MCOs for Acute and Behavioral Health, all other populations are in an integrated MCO. SOURCE: Kaiser Family Foundation Survey of Medicaid Officials in 50 states and DC conducted by Health Management Associates, October 2019. | ||||
Table 5: Select Medicaid Managed Care Quality Initiatives in all 50 States and DC, In Place in FY 2019 and Actions Taken in FY 2020
States | Pay for Performance/Performance Bonus | Capitation Withhold | Auto-Assignment Algorithm Includes Quality Performance Measures | Publicly Available Comparison Data About MCOs | Any Select Quality Initiatives | |||||
InPlace FY 2019 | New or ExpandedFY 2020 | In Place FY 2019 | New or ExpandedFY 2020 | InPlaceFY 2019 | New or ExpandedFY 2020 | In Place FY 2019 | New or ExpandedFY 2020 | InPlace FY 2019 | New or ExpandedFY 2020 | |
Alabama | — | — | — | — | — | — | — | — | — | — |
Alaska | — | — | — | — | — | — | — | — | — | — |
Arizona | X | X | X | X | X | X | X | |||
Arkansas | X | X | ||||||||
California | X* | X | X | X | X | X | X | |||
Colorado | X | X | X | |||||||
Connecticut | — | — | — | — | — | — | — | — | — | — |
Delaware | X | X | X | X | X | X | ||||
DC | X | X | ||||||||
Florida | X | X | X | X | X | X | ||||
Georgia | X | X | X | X | X | |||||
Hawaii | X | X | X | X | X | X | X | |||
Idaho | — | — | — | — | — | — | — | — | — | — |
Illinois | X* | X | X | X | X | |||||
Indiana | X | X | X | X | X | X | X | |||
Iowa | X | X | X | X | ||||||
Kansas | X | X | X | X | X | X | ||||
Kentucky | X | X | ||||||||
Louisiana | X | X | X | X | X | X | ||||
Maine | — | — | — | — | — | — | — | — | — | — |
Maryland | X | X | X | X | ||||||
Massachusetts | X | X | X | X | ||||||
Michigan | X | X | X | X | X | X | X | X | X | |
Minnesota | X | X | X | |||||||
Mississippi | X* | X | ||||||||
Missouri | X | X | X | X | X | X | ||||
Montana | — | — | — | — | — | — | — | — | — | — |
Nebraska | X | X | X | X | X | |||||
Nevada | X | X | X | X | ||||||
New Hampshire | X* | X* | X* | X | X | X | ||||
New Jersey | X | X | X | |||||||
New Mexico | X | X | X** | X | X | |||||
New York | X | X | X | |||||||
North Carolina | — | — | — | — | — | |||||
North Dakota | ||||||||||
Ohio | X | X | X | X | X | X | X | X | ||
Oklahoma | — | — | — | — | — | — | — | — | — | — |
Oregon | X | X | X | X | X | X | ||||
Pennsylvania | X | X | X | X | X | X | ||||
Rhode Island | X | X | X | X | X | X | ||||
South Carolina | X | X | X | X | X | |||||
South Dakota | — | — | — | — | — | — | — | — | — | — |
Tennessee | X | X | ||||||||
Texas | X | X | X | X | X | X | ||||
Utah | X* | X | ||||||||
Vermont | — | — | — | — | — | — | — | — | — | — |
Virginia | X | X | X | X | X | X | ||||
Washington | X | X | X | X | X | X | ||||
West Virginia | ||||||||||
Wisconsin | X | X | X | X | ||||||
Wyoming | — | — | — | — | — | — | — | — | — | — |
Totals | 25 | 10 | 24 | 7 | 11 | 4 | 34 | 12 | 36 | 23 |
NOTES: States with MCO contracts were asked to report if select quality initiatives were included in contracts in FY 2019, or are new or expanded in FY 2020. The table above does not reflect all quality initiatives states have included as part of MCO contracts. “*” indicates that a policy was newly adopted in FY 2020, meaning that the state did not have any policy in that category/column in place in FY 2019. “**” New Mexico reported eliminating the use of quality metrics in its auto-assignment algorithm at end of CY 2018. SOURCE: Kaiser Family Foundation Survey of Medicaid Officials in 50 states and DC conducted by Health Management Associates, October 2019. | ||||||||||
Table 6: Select Delivery System and Payment Reform Initiatives in all 50 States and DC, In Place in FY 2019 and Actions Taken in FY 2020
States | Patient-Centered Medical Homes(PCMH) | ACA Health Homes | Accountable Care Organizations (ACO) | Episode of Care Payments | Delivery System Reform Incentive Payment Program(DSRIP) | Any Delivery System or Payment Reform Initiatives | ||||||
In Place FY 2019 | New/ Expand FY 2020 | In Place FY 2019 | New/ Expand FY 2020 | In Place FY 2019 | New/ Expand FY 2020 | In Place FY 2019 | New/ Expand FY 2020 | InPlace FY 2019 | New/ Expand FY 2020 | InPlace FY 2019 | New/ Expand FY 2020 | |
Alabama | X | X | X | |||||||||
Alaska | X | X* | X | X | ||||||||
Arizona | X | X | ||||||||||
Arkansas | X | X | X | |||||||||
California | X | X | X | X | X | |||||||
Colorado | X | X | X | |||||||||
Connecticut | X | X | X | X | X | X | X | |||||
Delaware | X | X | ||||||||||
DC | X | X | ||||||||||
Florida | X | X | ||||||||||
Georgia | X | X | ||||||||||
Hawaii | X* | X | ||||||||||
Idaho | X | X* | X | X | ||||||||
Illinois | X | X* | X | X | ||||||||
Indiana | ||||||||||||
Iowa | X | X | X | |||||||||
Kansas | X* | X | X | X | ||||||||
Kentucky | ||||||||||||
Louisiana | X | X | X | X | X | |||||||
Maine | X | X | X | X | X | |||||||
Maryland | X | X | ||||||||||
Massachusetts | X | X | X | |||||||||
Michigan | X | X | X | |||||||||
Minnesota | X | X | X | X | ||||||||
Mississippi | ||||||||||||
Missouri | X | X | X | X | ||||||||
Montana | X | X | ||||||||||
Nebraska | X | X | X | |||||||||
Nevada | ||||||||||||
New Hampshire | X | X | ||||||||||
New Jersey | X | X | X | X | X | |||||||
New Mexico | X | X | X | X | X | |||||||
New York | X | X | X | X | X | X | X | X | X | |||
North Carolina | X | X | ||||||||||
North Dakota | ||||||||||||
Ohio | X | X | X* | X | X | X | X | |||||
Oklahoma | X | X | X | |||||||||
Oregon | X | X | ||||||||||
Pennsylvania | X | X | X | X | X* | X | X | |||||
Rhode Island | X | X | X | X | ||||||||
South Carolina | X | X | ||||||||||
South Dakota | X | X | ||||||||||
Tennessee | X | X | X | X | ||||||||
Texas | X | X | X | |||||||||
Utah | ||||||||||||
Vermont | X | X | X | X | X | X | X | |||||
Virginia | X | X | ||||||||||
Washington | X | X | X | |||||||||
West Virginia | X | X | ||||||||||
Wisconsin | X | X | ||||||||||
Wyoming | X | X | X | X | ||||||||
Totals | 30 | 4 | 22 | 6 | 14 | 8 | 6 | 2 | 10 | 0 | 44 | 14 |
NOTES: Expansions of existing initiatives include rollouts of existing initiatives to new areas or groups and significant increases in enrollment or providers. “*” indicates that a policy was newly adopted in FY 2020, meaning that the state did not have any policy in that category/column in place in FY 2019. SOURCE: Kaiser Family Foundation Survey of Medicaid Officials in 50 states and DC conducted by Health Management Associates, October 2019. | ||||||||||||
Benefits And Cost-sharing
Key Section Findings
The number of states reporting benefit expansions (23 in FY 2019 and 28 in FY 2020) continues to significantly outpace the number of states reporting benefit restrictions (4 in FY 2019 and 2 in FY 2020). The most common benefit enhancements reported were for mental health/substance use disorder (SUD) services, but other service expansions include dental services, pregnancy and postpartum benefits, and diabetes prevention and care. Eleven states reported policies to eliminate or reduce a cost-sharing requirement for FY 2019 or FY 2020, exceeding the five states that reported new or increased cost-sharing requirements. States continue to pursue strategies to control high-cost prescription drugs and to address the opioid epidemic.
What to watch:
- Prescription Drugs. Twenty-four states in FY 2019 and 26 states in FY 2020 reported newly implementing or expanding at least one initiative to contain prescription drug costs. Strategies cited included efforts to address pharmacy benefit manager (PBM) transparency and the impact of spread pricing in managed care and implementation of new purchasing arrangements, including value-based contracts linking pharmacy reimbursement to patient outcomes. Some states reported unique models including a modified subscription model for hepatitis C drugs in Louisiana and a drug spending cap in New York.
- Strategies to Address the Opioid Epidemic. All states reported using pharmacy benefit management strategies (such as adoption of opioid prescribing guidelines prospective drug utilization review, prior authorization based on clinical criteria / step therapy, retrospective drug utilization review and state prescription drug monitoring programs (PDMP)) to prevent opioid-related harms. States also reported a variety of initiatives to expand access to medication-assisted treatment (MAT), such as removing or relaxing prior authorization.
- Institutions for Mental Disease (IMDs). In an effort to address the opioid epidemic as well as broader behavioral health issues, CMS and Congress have provided states additional flexibility to provide services in settings that would otherwise qualify as “institutions for mental disease,” or IMDs, and be ineligible for federal Medicaid funding. A large majority of states (43 states) reported they plan to use at least one of the flexibilities (MCO “in lieu of authority, Section 1115 waiver authority, or the SUPPORT Act state plan option) to provide services in IMDs in FY 2020.
- SUPPORT Act. States are moving forward to adopt new SUPPORT Act requirements such as pharmacy benefit management strategies to reduce prescription opioid abuse and misuse and providing coverage for all FDA approved MAT drugs. Some states are also pursuing options such as enhanced matching funds for implementation of PDMPs or coverage of residential pediatric recovery centers (RPRC) for services provided to infants under age one with neonatal abstinence syndrome (NAS) and their families.
Table 7 summarizes the nature of benefit policy changes by states in FY 2019 and FY 2020.
Benefit Changes
The number of states reporting new benefits and benefit enhancements continues to significantly outpace the number of states reporting benefit cuts and restrictions. Twenty-three states reported new or enhanced benefits in FY 2019, and 28 states are adding or enhancing benefits in FY 2020. Few states reported benefit cuts or restrictions – four in FY 2019 and two in FY 2020 (Figure 7 and Table 7).
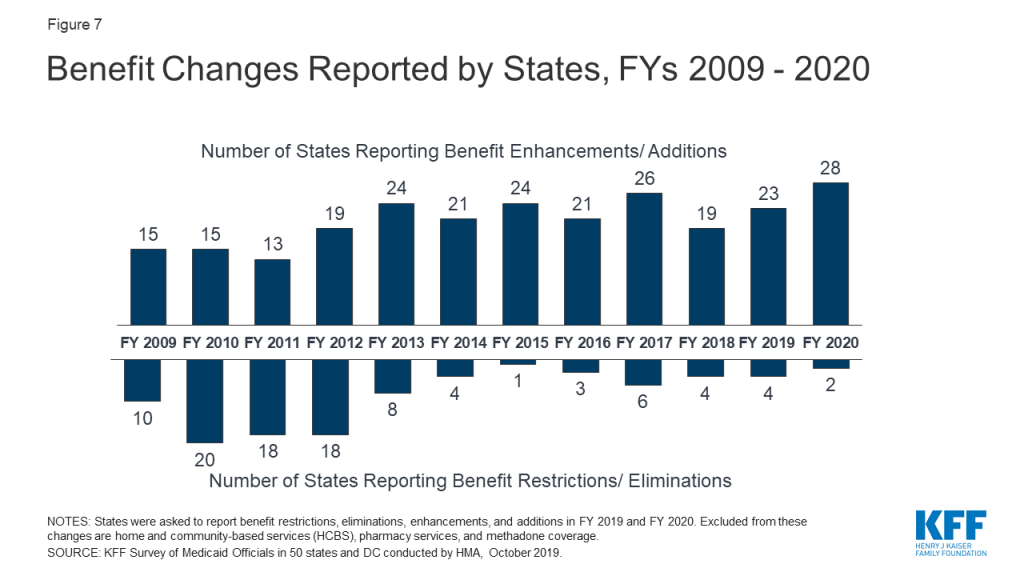
Similar to our findings in last year’s budget survey, many states reported expanding mental health and/or SUD services. Many of these mental health and SUD benefit expansions are incorporated into comprehensive Section 1115 waivers that include a request to use Medicaid funds for services provided in institutions for mental disease (IMDs) (more details about recent and planned IMD service changes and authorities used are discussed later in this section). Other non-IMD mental health and SUD service expansions that states reported include expanding access to crisis stabilization services and supporting recovery with new services such as peer supports. States also continue to increase access to medication-assisted treatment (MAT) services (detailed later in this section). Exhibit 14 highlights states implementing expanded mental health and/or SUD services and other select benefit enhancements.
States are also expanding pregnancy and postpartum services. For women covered by Medicaid under the pregnancy pathway, states are required to cover services “necessary for the health of a pregnant woman and fetus, or that have become necessary as a result of the woman having been pregnant.” Most states provide a comprehensive set of services for pregnant women.72 This year, states reported targeting additional pregnancy and postpartum services in FY 2019 and FY 2020. Some examples include the following: two states (Illinois73 and New Mexico) reported new home visiting programs; Georgia and New Jersey added CenteringPregnancy as a benefit to all or some members, a program designed to provide a set of prenatal services to Medicaid enrollees in a group setting; New Jersey and New York added doula service coverage; and Wyoming expanded coverage of midwife services. In addition, Missouri noted plans to seek approval through a demonstration waiver to add coverage of SUD treatment services and transportation for mothers who have given birth within the previous six months.
States are adding new benefits related to diabetes prevention and care. Diabetes Prevention Programs are evidence-based programs that aim to delay or prevent the onset of type 2 diabetes with targeted health behavior interventions. Two states (California, New Jersey) reported plans to cover Diabetes Prevention Program services in last year’s survey and these changes were implemented in FY 2019. Two more states (Maryland, New York) will begin covering Diabetes Prevention Program services effective in FY 2020. Additionally, South Carolina is expanding access to diabetes related care by covering continuous glucose monitoring devices for individuals with Type 1 diabetes and insulin-dependent gestational diabetes (FY 2020).
| Exhibit 14: Select Categories of Benefit Enhancements or Additions | ||||
| Benefit | FY 2019 | FY 2020 | ||
| Mental Health/SUD Services | 13 States | IL, MA, MD, NC, NH, NJ, NM, RI, SD, TX, UT, WA, WV | 20 States | AK, AL, CA, DC, DE, HI, IL, IN, KY, ME, MO, NE, NH, NV, OH, RI, TN, WI, WV, WY |
| Pregnancy and Postpartum Services | 4 States | GA, NJ, NM, NY | 4 States | IL, MO, NJ, WY |
| Dental Services | 4 States | IL, MA, MD, UT | 2 States | DE, VT |
| Diabetes Prevention and Care | 2 States | CA, NJ | 3 States | MD, NY, SC |
| Therapy Services (PT, OT, Speech) | 3 States | MO, NY, RI | 1 State | CA |
| Chiropractic Services | 2 States | DE, MO | 1 State | NE |
| Community Health Workers | 2 States | IN, SD | ||
| Telehealth Services | 1 State | TX74 | 2 States | MN,75 OH |
States reported initiatives to expand access to non-emergency medical transportation (NEMT). For example, Arizona added rideshare companies as NEMT providers and Colorado updated NEMT coverage policy to address urgent transportation needs by removing a requirement that rides be scheduled at least 48 hours in advance. In addition, the District of Columbia and Georgia are covering, or have plans to cover, “treatment without transport” services or transport to alternate locations by emergency medical services (EMS) transportation providers. These benefit changes are in line with the CMS Center for Medicare and Medicaid Innovation (CMMI) Medicare Emergency Triage, Treat, and Transport (ET3) payment model and August 2019 CMS guidance for reducing unnecessary transport to the emergency department in Medicaid programs.76
States also reported efforts to expand access to services for children. States are required to cover comprehensive services for children through the Early Periodic Screening, Diagnostic, and Treatment (EPSDT) benefit. Even with this comprehensive benefit, states reported an array of targeted service expansions for children including: intensive home-based services (Alabama, Illinois); trauma-informed care coordination for children with serious emotional disturbance (West Virginia); evidence-based parenting interventions (Maine); same day well-child and sick visits (South Carolina); and coverage of lead investigation services (North Carolina). States are also leveraging school settings to expand access to services for children. For example, in FY 2019 Texas expanded coverage of telemedicine services to occupational therapy and speech-language pathology provided in a school-based setting. In FY 2020, Ohio will expand coverage of telehealth services for behavioral health in schools, Michigan will expand provision of school-based services to general education students, and Nevada will extend coverage of school-based services to any community-based service provided in a school setting.
SUPPORT Act Residential Pediatric Recovery Centers (RPRC) State Plan Options
In this year’s survey, states were asked whether they planned to adopt the SUPPORT Act’s state plan option to pay for services at residential pediatric recovery centers (RPRC) for services provided to infants under age 1 with neonatal abstinence syndrome (NAS) and their families. The rising incidence of NAS is associated with the nation’s opioid epidemic. Although infants with NAS have historically been treated in the hospital inpatient setting, states may be interested in other treatment settings like RPRCs. RPRCs can also provide services to mothers and other caretakers, including counseling or referrals for services, activities to encourage caregiver-infant bonding, and training on caring for infants with NAS.77
July 2019 CMS guidance78 indicates states may need to file a State Plan Amendment (SPA) to recognize RPRCs as a provider type and to update payment methodologies, as applicable. One state, Ohio, indicated it plans to adopt this option in FY 2020 joining West Virginia which, in FY 2018 and preceding the SUPPORT Act, became the first state to receive CMS SPA approval to finance NAS services using a bundled payment for providers outside of the hospital inpatient setting.79 The majority of states reported that they remain undecided about this opportunity or have no plans to file a SPA establishing RPRCs as a new provider type at this time.
Most benefit restrictions in FY 2019 or FY 2020 are narrowly targeted. Benefit restrictions reflect the elimination of a covered benefit, benefit caps, or the application of utilization controls for existing benefits. This includes benefit restrictions that limit dental coverage (Alaska, Iowa) or implemented new prior authorization requirements (Colorado and Nevada80 ). In addition, Utah eliminated coverage of Early and Periodic Screening, Diagnostic, and Treatment (EPSDT) coverage for individuals ages 19 and 20 through a Section 1115 Waiver and Kentucky eliminated coverage of NEMT for methadone services for all non-pregnant adults and former foster youth (also through a Section 1115 waiver).
Cost-Sharing
Federal law limits cost-sharing for people with income below 100% FPL to “nominal” amounts (defined in federal regulations), with higher amounts allowed for beneficiaries at higher income levels. Total Medicaid premiums and cost-sharing for a family cannot exceed 5% of the family’s income on a quarterly or monthly basis.81 Certain groups are exempt from cost-sharing, including mandatory eligible children, pregnant women, most children and adults with disabilities, people residing in institutions, and people receiving hospice care. In addition, certain services are exempt from cost-sharing: emergency services, preventive services for children, pregnancy-related services, and family planning services.
Many state Medicaid programs require beneficiary cost-sharing, usually in the form of copayments, but to varying degrees. Research shows that even relatively small levels of cost-sharing in the range of $1 to $5 are associated with reduced use of care, including necessary services.82 Research also finds that cost-sharing can result in unintended consequences, such as increased use of the emergency room, and that cost-sharing negatively affects access to care and health outcomes.
In this survey, 15 states reported changes to cost-sharing requirements in either FY 2019 or FY 2020. Key changes are described below.
States were more likely to report policies to eliminate or reduce cost-sharing than report new or increased cost-sharing requirements. Eleven states reported policies to eliminate or reduce a cost-sharing requirement and five states reported new or increased cost-sharing in FY 2019 or FY 2020. Key changes include:
- Illinois, Montana, North Dakota, and New Mexico reported eliminating or plans to eliminate copayments on all services for some or all populations. For example, an approved Section 1115 waiver in New Mexico would have imposed a number of new copayments and other cost-sharing requirements, but the new administration did not implement the waiver’s changes and allowed existing copayments, including for people with disabilities, to sunset.
- The District of Columbia and Oklahoma are eliminating cost-sharing on medication-assisted treatment (MAT) and Michigan eliminated cost-sharing for all drugs used in the treatment of mental health conditions and SUD.
- Two states (Virginia and Wisconsin) reported new or increased copayments for non-emergency use of a hospital emergency department (ED) for certain populations.
- Kentucky reported changes that will prohibit MCOs from waiving copayments that apply in the Medicaid FFS program.
Pharmacy Cost Containment Actions in FY 2019 and FY 2020
As pharmacy expenditure growth became a greater Medicaid budget concern in the late 1990’s and early 2000’s, most states implemented an array of pharmacy cost containment strategies, including preferred drug lists (PDLs), supplemental rebate programs, state maximum allowable cost programs, multi-state purchasing pools, and prior authorization policies linked to clinical criteria. States continue to update and refine their drug utilization controls to respond to changes, especially new product offerings, in the pharmaceutical marketplace.
In this year’s survey, states were asked to describe any new or expanded pharmacy program cost containment strategies implemented in FY 2019 or planned for FY 2020. States were asked to exclude routine updates to PDLs or state maximum allowable cost programs as these utilization management strategies are employed by states regularly and are not typically considered major new policy initiatives. States reported a variety of actions in FY 2019 and FY 2020 to refine and enhance their pharmacy programs, often targeting new and emerging specialty and high-cost drug therapies, which many states noted as coming to the market with increasing speed and frequency.
Twenty-four states in FY 2019 and 26 states in FY 2020 reported newly implementing or expanding upon at least one initiative to contain costs in the area of prescription drugs. With growing political attention to the pharmaceutical supply chain, several states reported new and expanded initiatives to address concerns related to PBM transparency and the impact of spread pricing in managed care (at least seven states in both FY 2019 and FY 2020). A number of states also reported innovative purchasing arrangements, including value-based contracts linking pharmacy reimbursement to patient outcomes for certain high-cost drugs (three states in FY 2019 and five states in FY 2020). In addition, three states reported targeted initiatives specific to routine drugs used to treat chronic conditions like diabetes and asthma, including tightening monthly quantity limits on insulin and inhalers and instituting a new diabetes drug PDL.
Other strategies reported by states this year targeted uniform PDL requirements for MCOs. Four states report plans to implement a uniform PDL in FY 2020, and two additional states are expanding their uniform PDL policy in both FY 2019 and FY 2020. Additional highlights of state strategies to control pharmacy costs are noted below:
- Importation of prescription drugs. At the direction of the state legislature under Senate Bill 19-005, and subject to federal approval, Colorado plans to import prescription drugs from Canada.83 Under the Canadian Prescription Drug Importation Program, the Department of Health Care Policy and Financing will develop a wholesale drug importation list based on highest potential cost savings to the state and contract with one or more vendors to safely import and distribute drugs on the list.
- Direct negotiations with drug manufacturers. Beginning in FY 2020, Massachusetts will initiate direct negotiations with drug manufacturers with the goal of entering into supplemental rebate agreements for the highest cost drugs. If no agreement is reached, a public process will be used to determine the target value of the drug and improve transparency. Manufacturers may be referred to the state Health Policy Commission for further accountability. The state anticipates these reforms will save the Medicaid program $70 million in FY 2020.
- Subscription models. After obtaining final CMS approval in June 2019, Louisiana implemented a modified subscription model for hepatitis C antiviral therapies via a supplemental rebate agreement. The five-year partnership between the state and manufacturer set a capped expenditure amount, beyond which the state will continue to receive drugs at essentially no cost.
- Medicaid Drug Cap. New York continues to enhance its Medicaid Drug Cap as reported in last year’s survey. This initiative, which is separate from the state’s Medicaid Global Spending Cap, was initiated in FY 2018 and limits aggregate drug costs to an annual trend factor. For each year that costs exceed the allowable cap, the Department of Health negotiates enhanced rebates with the drug manufacturer and may refer drugs to the Drug Utilization Review (DUR) Board for additional review and recommendations as necessary.
- Prior authorization on certain new and/or high cost drugs. Four states used utilization management tools to address the unique challenges presented by new and/or high-cost drugs. For example, Kansas may place a temporary prior authorization requirement on new drugs that meet certain criteria until the state’s DUR Committee is able to adopt a more permanent policy. Nevada requires prior authorization for hemophilia drugs, oral oncology drugs, and drugs that exceed $10,000 per claim.
Strategies to Address Opioid Use Disorder
The opioid epidemic continues to impact individuals and communities across the country. According to the U.S. Department of Health and Human Services, as of 2016, 2.1 million people in the United States had an opioid use disorder and 11.5 million people misused prescription opioids as of 2016.84 The Centers for Disease Control and Prevention (CDC) indicates that drug overdose deaths are increasing nationally, the majority (around 68%) of which involve an opioid (prescription opioids, illicitly manufactured fentanyl and heroin).85 In 2017, 47,600 people died from an opioid overdose.86 The number of opioid overdose deaths is six times higher than it was in 1999, and approximately 130 people die from opioid-related drug overdoses each day.87
Medicaid plays a critical role in addressing the opioid epidemic, covering 4 in 10 people with opioid use disorder and expanding access to a range of treatment services.88 These services include inpatient detoxification, residential rehabilitation, outpatient detoxification, intensive outpatient services, and MAT medications. Many states have responded to July 2015 CMS guidance and November 2017 CMS guidance that allows states to seek Section 1115 waivers to pay for SUD services provided in IMDs.89 ,90 These state Medicaid director letters set out parameters for states to obtain Section 1115 waivers to try using federal Medicaid funds to provide short-term inpatient and residential SUD treatment services in IMDs. Signed into law October 24, 2018, the SUPPORT Act also includes a number of provisions related to Medicaid’s role in providing coverage and services to people who need opioid use disorder (OUD) treatment.91
Medicaid Pharmacy Benefit Management Strategies
This year’s survey asked states to report on specific Medicaid pharmacy benefit management strategies for preventing opioid-related harms that were in place in FY 2019 for FFS and changes to these strategies planned for FY 2020 (Exhibit 15). All states and the District of Columbia reported having at least one of these opioid-focused pharmacy management policies in FFS in place in FY 2019 and more than half of the states (32 states) plan to take further action in FY 2020. See Exhibit 15 and Table 8 for details on states implementing or expanding pharmacy benefit management strategies to reduce harm from opioid use or misuse.
| Exhibit 15: States Implementing Opioid-Focused Pharmacy Benefit Management Strategies in FFS | |||
| Strategy | In Place in FY 2019(# of states) | FY 2020 (# of states) | |
| New | Expanded | ||
| Adoption of opioid prescribing guidelines92 | 43 | 2 | 14 |
| Prospective drug utilization review93 | 46 | 0 | 17 |
| Prior authorization based on clinical criteria / step therapy94 | 49 / 36 | 0 / 0 | 16 / 6 |
| Retrospective drug utilization review95 | 48 | 0 | 15 |
| Medicaid prescribers must query state prescription drug monitoring program96 | 37 | 4 | 6 |
| Prescription drug lock-in programs97 | 44 | 0 | 6 |
States continue to report having point-of-sale safety edits, quantity limits, cumulative morphine milligram equivalents (MME) limits, and other utilization controls. Enhancements implemented in FY 2020 include adopting or updating opioid prescribing guidelines to align with guidance from the CDC, refining system edits (e.g., related to quantity, age, and/or concurrent use of opioids with benzodiazepines or antipsychotics), expanding prior authorization policy for both short- and long-acting opioids, and providing prescriber education and outreach based on retrospective drug utilization review activity. At least five states with MME limits reported lowering the threshold in FY 2020. Notable new initiatives include Florida’s new required urine drug screen for both initiation and continued opioid therapy and a new peer-to-peer prescriber outreach initiative in Utah focused on providers with high dose and high-risk prescribing patterns. Additionally, Delaware updated its prior authorization form with a recommendation to add naloxone to any opioid prescription with a dose in excess of 90 MME, and New York reported encouraging non-opioid pain management as part of its step therapy policy.
SUPPORT Act Requirements & State Opportunities
The SUPPORT Act requires state Medicaid programs to adopt by December 31, 2019 a variety of targeted pharmacy benefit management strategies to reduce opioid-related fraud, misuse, and abuse. As summarized in August 2019 CMS guidance,98 states must implement the following changes in their FFS delivery system and MCO contracts:
- Point-of-sale safety edits to identify early fills, duplicate fills, and fills in excess of state quantity limits
- Point-of-sale safety edits to identify prescriptions in excess of state cumulative morphine milligram equivalent (MME) limits
- Retrospective drug utilization review (DUR) activities to identify concurrently prescribed opioids and benzodiazepines or opioids and antipsychotics
- Other programming to identify and address fraud and abuse, such as drug lock-in programs and prescription drug monitoring programs
A number of states reported plans to make pharmacy benefit management changes to meet the requirements of the SUPPORT Act, but other states indicated they are already in compliance. The most commonly reported changes that will be made include implementation or expansion of point-of-sale safety edits, updated drug utilization review activities, and updating MCO contracts to include new requirements as applicable.
The SUPPORT Act also directs states to implement Prescription Drug Monitoring Programs (PDMPs) and requires certain Medicaid providers to review the PDMP before prescribing a controlled substance by October 1, 2021. Thirty-seven states reported that they already have a legislative mandate or other policy that requires certain providers to check the state PDMP prior to prescribing opioids and four states are implementing this policy in FY 2020. One additional state (Montana) has a legislative mandate requiring prescribers to query the state PDMP beginning in FY 2021. Two states, Florida and Pennsylvania, report that review of the PDMP has been incorporated into the prior authorization process for prescribing opioids.
The SUPPORT Act makes 100% FMAP available in FY 2019 and FY 2020 for certain PDMP implementation or connectivity activities, but only if the requesting state enters into agreements with border states to share PDMP data.99 In this year’s survey, we asked if states planned to access the 100% federal match for PDMP system design and development activities, such as connecting the PDMP to provider electronic health records (EHR) systems or performing other system upgrades. Most states reported that they remain undecided about this opportunity, but nine states indicate they used or plan to use the available enhanced federal match in FY 2019 and/or FY 2020.
A majority of states that use MCOs to deliver pharmacy benefits require or partially require MCOs to follow the state’s FFS pharmacy benefit management policies for opioids. Fourteen states required MCOs to follow all of the state’s FFS pharmacy benefit management policies for opioids as of July 1, 2019, and 15 additional states reported MCOs must follow them in part. Of the 15 states with partial requirements, most reported some level of flexibility for MCOs to establish their own coverage criteria. At least four states require that MCOs be no more restrictive in their prior authorization or other criteria than FFS, while other states reported ongoing efforts to develop a more uniform opioid pharmacy management strategy across their FFS and managed care delivery systems.
Medication-Assisted Treatment coverage and access
The standard of care for opioid use disorder is MAT, which combines psychosocial treatment with medication.100 Compared to psychosocial treatment alone, MAT is associated with greater adherence to treatment, decreased opioid use, and reduced likelihood of overdose fatalities.101 There are three medications used as part of MAT for opioid use disorder: methadone, buprenorphine, and naltrexone (both oral and extended-release injectable forms).102 ,103 The SUPPORT Act requires state Medicaid programs to cover MAT, including all FDA-approved drugs,104 from October 2020 to September 2025. Today, all state Medicaid programs cover at least two MAT medications, and most cover all three.105
Most states cover methadone as FY 2019. In this year’s survey, forty-four states reported coverage of methadone in FY 2019, up from 38 states in FY 2018. Six states plan to add coverage for methadone in FY 2020 (Idaho, Kansas, Kentucky, Louisiana, Nebraska, and Tennessee). Wyoming reports plans to add methadone coverage prior to the October 1, 2020 deadline established by the SUPPORT Act, which falls in state fiscal year 2021. The state noted there are currently no certified methadone clinics operating in the state.
States experience a variety of challenges related to access to MAT. The most widely reported barrier to care is a shortage of waivered providers and rural providers in particular. States also identified shortages of behavioral therapy services, lack of knowledge of the evidence base for MAT, and provider stigma associated with substance use disorders as significant challenges. Other common challenges include lack of treatment resources for patients at all ASAM levels, low reimbursement rates, preference for the abstinence approach among providers, waivered-providers only accepting cash payment, and lack of access for pregnant women. In addition to these common challenges, other barriers identified include strict state licensing and registration requirements, difficulties for primary care providers to integrate MAT into daily practice routines, lack of transportation, limited MAT access in jails and prisons, failure to incorporate MAT into clinical training programs, few telehealth options, and waivered providers not treating beneficiaries with OUD.
Many states reported removing or relaxing prior authorization requirements to expand access to MAT. In this year’s survey, we asked states to describe initiatives or policies implemented in FY 2019 or planned for FY 2020 to address MAT access challenges. Twenty-one states indicated changes in prior authorization requirements to improve access to MAT in FY 2019 and FY 2020. Three states reported adding vivitrol to the PDL and/or expanding MAT coverage policy to include vivitrol. Vivitrol is an extended-release injectable form of naltrexone that can be prescribed by any healthcare provider licensed to prescribe medications.106
In addition to reducing administrative barriers like prior authorization, a number of states report multi-faceted initiatives to expand access to MAT. Some of these initiatives are funded through State Targeted Response to the Opioid Crisis (STR) and State Opioid Response (SOR) grants. Activities include collaborating with emergency departments, prisons, and other community partners; leveraging telehealth capabilities; opening new treatment centers; increasing MAT reimbursement rates; and supporting providers with training and other resources. Examples of state strategies to expand access to MAT include:
- Using STR and SOR grants, Arizona opened six 24/7 Opioid Treatment on Demand Centers, four in metropolitan areas and two in rural areas. The Medicaid program has also increased the number of peer support specialists in the state and launched a “feet-on-the-street” outreach campaign to identify and engage high-risk beneficiaries and refer them to OUD treatment resources. Additional efforts include helping finance an OUD /MAT stigma reduction campaign through the Governor’s Office and providing MAT information sessions for professional associations, universities, and substance abuse coalitions.
- The Office of Behavioral Health (OBH) in Colorado implemented the IT MATTTRs2 initiative which offers incentives to providers to obtain a Drug Enforcement Authority (DEA) waiver to prescribe MAT. This initiative also delivers team training and practice supports to make sure providers have tools and resources to adopt a comprehensive MAT program.
- Massachusetts and New York require administration of buprenorphine to individuals presenting in the emergency department with an OUD. The District of Columbia implemented a MAT induction pilot that screens emergency department patients for SUD risk and connects at-risk patients to a peer recovery coach to discuss initiation of MAT. Interested patients will begin buprenorphine in the emergency department and receive a warm handoff to community services within 48 hours. Demonstration projects in South Carolina involve participation by five anchor hospitals where emergency department staff identify patients in need of MAT and refer for coordination and ongoing treatment through community partners.
- Arizona and Illinois operate a peer consultation line for providers with questions regarding MAT therapies.
- New Jersey initiated a modified hub and spoke model Office Based Addiction Treatment program that offers clinical support and enhanced reimbursement for physicians that provide care management services in addition to MAT. It is also requiring residential programs to offer MAT, as an alternative to an abstinence-only approach and is in the process of increasing after-hours access to MAT to support working individuals and late releases from jail.
Institutions for Mental Disease (IMD) Flexibilities
In an effort to address the opioid epidemic as well as broader behavioral health initiatives, CMS and Congress have acted to give states additional flexibility to provide services in residential treatment facilities and other settings that would otherwise qualify as “institutions for mental disease,” or IMDs, and be ineligible for federal Medicaid funding. States have been actively using these new flexibilities to expand the availability of substance use disorder and mental health services for Medicaid beneficiaries. According to this year’s survey, a large majority of states (43 states)107 report they plan to use at least one of the following flexibilities to provide services in IMDs in FY 2020:
- Managed Care “In Lieu of” Authority. The 2016 Medicaid Managed Care Final Rule allows states, under the authority for health plans to cover services “in lieu of” those available under the Medicaid state plan, to receive federal matching funds for capitation payments on behalf of nonelderly adults who receive inpatient psychiatric or SUD treatment or crisis residential services in an IMD for no more than 15 days during a given month.108
- Section 1115 Waivers. CMS guidance issued under the Obama Administration in July 2015 and later revised by the Trump Administration in November 2017 allows states to obtain Section 1115 waivers of the federal IMD payment exclusion as part of a broader demonstration to improve access to a continuum of treatment services for opioid use disorder (OUD) and other substance use disorders.109 ,110 ,111 The guidance sets out goals and milestones states would need to meet as part of their Section 1115 demonstration in order to receive federal Medicaid funds for short-term inpatient and residential SUD treatment services in IMDs. In November 2018, CMS issued new guidance inviting states to apply for Section 1115 waivers to receive funding for services provided in an IMD for adults with a serious mental illness (SMI) or children with a serious emotional disturbance (SED) as part of an effort to expand services across the care continuum.112 States must meet milestones regarding care quality, care coordination, increased access to crisis stabilization services, and earlier identification and engagement in treatment. This guidance reverses prior CMS policy to not use Section 1115 waiver authority to allow Medicaid payments for non-elderly adults with a primary mental health diagnosis in IMDs.
- The SUPPORT Act. In October 2018, President Trump signed into law, the Substance Use Disorder Prevention that Promotes Opioid Recovery and Treatment for Patients and Communities (SUPPORT) Act.113 The legislation created a new state plan option, from October 1, 2019 to September 30, 2023, to cover IMD services for up to 30 days in a year for individuals with an SUD. The SUPPORT Act also codified the 2016 Medicaid Managed Care final rule provision allowing MCOs to offer “in lieu of” IMD coverage for up to 15 days in a month and authorizes Medicaid payments for services provided outside IMDs for pregnant and postpartum women receiving IMD SUD services, as of October 2018.114
On this year’s survey, states were asked about whether they currently use or plan to use the managed care “in lieu of” authority (MCO states only), plan to pursue the Section 1115 SMI/SED waiver opportunity, or plan to adopt the SUPPORT Act state plan option:
More than three-quarters of MCO states (31 states) reported using “in lieu of” authority in their managed care programs in both FY 2019 and FY 2020 (Table 9). Two states reported plans to begin using this authority in FY 2020 and two states reported using this authority in FY 2019 but not in FY 2020.115 Just four MCO states indicated they did not use “in lieu of” authority in their managed care contracts in either year.
One state submitted in FY 2019 and 12 states plan to submit (in FY 2020 or after) Section 1115 IMD waivers for services for individuals with SMI or SED (Table 9).116 Nine states indicated they do not plan to pursue a SMI/SED IMD waiver while 28 states reported their plans were undetermined at this time.117 In addition, as of October 2019, 26 states had an approved IMD SUD waiver while 3 states had pending waiver requests at CMS (not shown in table). (States were not asked on this survey about plans to submit IMD SUD waivers; however, IMD SUD pending/approved waiver activity is tracked separately).118
Only five states reported plans to pursue the SUPPORT Act IMD SPA option in FY 2020 (Table 9). Twenty-one states reported they have not yet determined if they will pursue the SUPPORT Act IMD SPA option and 24 states indicated they do not plan to adopt this option.119 In explaining the rationale for not pursuing this opportunity, many states noted they had a Section 1115 waiver in place or were in the process of implementing a Section 1115 waiver that would allow for funding of IMD services, removing the need to pursue the SPA option. Several states also felt that the Section 1115 waiver would provide more flexible limits on length of IMD stays compared to the 30-day cap on IMD services under the SPA option.
Table 7: Benefit Changes in all 50 States and DC, FY 2019 and FY 2020
States | FY 2019 | FY 2020 | ||
Enhancements/ Additions | Restrictions/ Eliminations | Enhancements/ Additions | Restrictions/ Eliminations | |
Alabama | X | |||
Alaska | X | X | ||
Arizona | X | |||
Arkansas | ||||
California | X | X | ||
Colorado | X | X | ||
Connecticut | ||||
Delaware | X | X | ||
DC | X | X | ||
Florida | ||||
Georgia | X | |||
Hawaii | X | |||
Idaho | ||||
Illinois | X | X | ||
Indiana | X | X | ||
Iowa | X | |||
Kansas | ||||
Kentucky | X | X | ||
Louisiana | ||||
Maine | X | |||
Maryland | X | X | ||
Massachusetts | X | |||
Michigan | X | |||
Minnesota | X | |||
Mississippi | X | X | ||
Missouri | X | X | ||
Montana | ||||
Nebraska | X | |||
Nevada | X | X | ||
New Hampshire | X | X | ||
New Jersey | X | X | ||
New Mexico | X | |||
New York | X | X | ||
North Carolina | X | |||
North Dakota | ||||
Ohio | X | |||
Oklahoma | ||||
Oregon | ||||
Pennsylvania | ||||
Rhode Island | X | X | ||
South Carolina | X | |||
South Dakota | X | |||
Tennessee | X | |||
Texas | X | |||
Utah | X | X | ||
Vermont | X | |||
Virginia | ||||
Washington | X | |||
West Virginia | X | X | ||
Wisconsin | X | |||
Wyoming | X | |||
Totals | 23 | 4 | 28 | 2 |
NOTES: States were asked to report benefit restrictions, eliminations, enhancements, and additions in FY 2019 and FY 2020. Home and community-based services (HCBS) and pharmacy benefit changes are excluded from this table. Methadone benefit changes were also excluded from this table. SOURCE: Kaiser Family Foundation Survey of Medicaid Officials in 50 states and DC conducted by Health Management Associates, October 2019. | ||||
Table 8: Medicaid FFS Pharmacy Benefit Management Strategies for Opioids in all 50 States and DC, in Place in FY 2019 and Actions Taken in FY 2020
States | Opioid Prescribing Guidelines | Prospective DUR | Prior Authorization and Step Therapy | Retrospective DUR | Required use of Prescription Drug Monitoring Programs | Prescription Drug Lock-In Programs | Any Opioid Management Strategies | |||||||
In place FY 2019 | New/Exp FY 2020 | In place FY 2019 | New/Exp FY 2020 | In place FY 2019 | New/Exp FY 2020 | In place FY 2019 | New/Exp FY 2020 | In place FY 2019 | New/Exp FY 2020 | In place FY 2019 | New/Exp FY 2020 | In place FY 2019 | New/Exp FY 2020 | |
Alabama | X | X+ | X | X | X | |||||||||
Alaska | X | X | X | X+ | X+ | X | X | X | X | X | X | X | ||
Arizona | X | X | X+ | X | X | X | X | |||||||
Arkansas | X | X | X | X | X | X | X | |||||||
California | X | X | X | X | X | |||||||||
Colorado | X | X | X | X+ | X+ | X | X | X | X | X | ||||
Connecticut | X | X | X | X | X | X | X | X | X | X | X | |||
Delaware | X | X | X | X | X+ | X | X | X | X | X | ||||
DC | X | X | X | X | X | X | ||||||||
Florida | X | X | X | X+ | X+ | X | X | X | X | X | ||||
Georgia | X | X | X+ | X | X | X | X | |||||||
Hawaii | X | X | ||||||||||||
Idaho | X | X | X+ | X | X* | X | X | X | ||||||
Illinois | X | X | X | X | X | X | X | |||||||
Indiana | X | X | X | X+ | X | X | X | X | X | X | X | X | ||
Iowa | X | X | X+ | X | X | X | X | X | X | |||||
Kansas | X | X+ | X | X | ||||||||||
Kentucky | X | X | X+ | X | X | X | ||||||||
Louisiana | X | X | X | X | X | X | X | |||||||
Maine | X | X | X | X+ | X | X | X | X | X | X | X | |||
Maryland | X | X | X | X | X | X | ||||||||
Massachusetts | X | X | X | X | X+ | X | X | X | X | X | X | X | X | |
Michigan | X | X | X | X+ | X | X | X | X | X | X | X | X | ||
Minnesota | X | X | X | X | X | X | X | X | X | X | ||||
Mississippi | X* | X | X | X+ | X | X | X | X | X | X | ||||
Missouri | X | X | X | X+ | X | X | X | X | ||||||
Montana | X | X | X | X+ | X | X | X | X | X | |||||
Nebraska | X | X+ | X | X | X | X | X | X | ||||||
Nevada | X | X | X | X | X | X | X | X | X | |||||
New Hampshire | X | X | X+ | X | X | X | X | |||||||
New Jersey | X | X | X | X | X | X | X | X | X | X | X | |||
New Mexico | X | X | X+ | X | X | X | X | |||||||
New York | X | X | X | X | X+ | X+ | X | X | X | X | X | X | ||
North Carolina | X | X | X | X+ | X+ | X | X | X | X | X | X | X | ||
North Dakota | X | X+ | X | X | X | X | ||||||||
Ohio | X | X | X+ | X | X | X | X | X | X | |||||
Oklahoma | X | X | X+ | X | X | X | X | X | X | X | ||||
Oregon | X* | X | X | X | X | X | X | X | X | X | X | |||
Pennsylvania | X | X | X | X | X | X | X | |||||||
Rhode Island | X | X | X+ | X | X | X | X | X | X | |||||
South Carolina | X | X | X+ | X | X | X | X | |||||||
South Dakota | X | X | X | X+ | X | X | X | |||||||
Tennessee | X | X | X+ | X | X | X | X | |||||||
Texas | X | X | X | X | X | X* | X | X | ||||||
Utah | X | X | X | X+ | + | X | X | X | X | X | X | |||
Vermont | X | X | X | X+ | X | X | X | X | X | X | ||||
Virginia | X | X | X+ | X | X | X | X | |||||||
Washington | X | X | X | X | X | X | X* | X | X | X | ||||
West Virginia | X | X | X+ | X | X | X | X | |||||||
Wisconsin | X | X | X+ | X | X | X | X | X | ||||||
Wyoming | X | X+ | X | X* | X | X | X | |||||||
Totals | 43 | 16 | 46 | 17 | 49 | 17 | 48 | 15 | 37 | 10 | 44 | 6 | 51 | 32 |
NOTES: States were asked to report whether they had select pharmacy benefit management strategies in place in their FFS programs in FY 2019, and/or had plans to adopt or expand these strategies in FY 2020. Prospective drug utilization review activies includes screening prescription drug claims, while retrospective drug utilization review examines already-paid prescription drug claims. “*” indicates that a policy was newly adopted in FY 2020, meaning that the state did not have any policy in that category/column in place in FY 2019. “+” indicates step therapy policies. Utah responded that it plans to expand step therapy in FY 2020, but not prior authorization. SOURCE: Kaiser Family Foundation Survey of Medicaid Officials in 50 states and DC conducted by Health Management Associates, October 2019. | ||||||||||||||
Table 9: New IMD Service Authorities and Actions Taken or Planned by States
States | States using the Medicaid managed care “in lieu of” authority for enrollees(ages 21-64) receiving inpatient treatment in an IMD* | States pursuing a Section 1115 IMD waiver for services for individuals with SMI or SED+ | States planning to adopt the SUPPORT Act State Plan option# | |||||||
Yes – in FY 2019^ | Yes – in FY 2020 | Yes – in both FY 2019 and FY 2020 | Undetermined | Submitted in FY 2019 | Plan to submit in FY 2020 | Plan to Submit after FY 2020 | Undetermined | Plan to Adopt in 2020 | Undetermined | |
Alabama | — | — | — | — | X | X | ||||
Alaska | — | — | — | — | X | X | ||||
Arizona | X | X | ||||||||
Arkansas | X | X | X | |||||||
California | X | |||||||||
Colorado | X | |||||||||
Connecticut | — | — | — | — | X | |||||
Delaware | X | X | ||||||||
DC | X | X | ||||||||
Florida | X | X | X | |||||||
Georgia | X | X | X | |||||||
Hawaii | X | X | X | |||||||
Idaho | — | — | — | — | X | X | ||||
Illinois | X | X | ||||||||
Indiana | X | X | X | |||||||
Iowa | X | |||||||||
Kansas | X | X | X | |||||||
Kentucky | X | X | X | |||||||
Louisiana | X | |||||||||
Maine | — | — | — | — | X | |||||
Maryland | NR | NR | NR | NR | NR | NR | ||||
Massachusetts | X | X | X | |||||||
Michigan | X | X | ||||||||
Minnesota | X | X | X | |||||||
Mississippi | X | |||||||||
Missouri | X | X | ||||||||
Montana | — | — | — | — | X | X | ||||
Nebraska | X | X | ||||||||
Nevada | X | X | X | |||||||
New Hampshire | X | X | X | |||||||
New Jersey | X | X | ||||||||
New Mexico | X | X | X | |||||||
New York | X | X | X | |||||||
North Carolina | — | X | X | |||||||
North Dakota | ||||||||||
Ohio | X | X | ||||||||
Oklahoma | — | — | — | — | X | X | ||||
Oregon | X | |||||||||
Pennsylvania | ||||||||||
Rhode Island | X | X | ||||||||
South Carolina | X | X | ||||||||
South Dakota | — | — | — | — | X | |||||
Tennessee | X | X | X | |||||||
Texas | X | X | ||||||||
Utah | X | X | ||||||||
Vermont | — | — | — | — | X | X | ||||
Virginia | X | X | X | |||||||
Washington | X | X | ||||||||
West Virginia | X | X | X | |||||||
Wisconsin | X | X | X | |||||||
Wyoming | — | — | — | — | X | X | ||||
Totals | 2 | 2 | 31 | 2 | 1 | 8 | 4 | 28 | 5 | 21 |
NOTES: NR – not reported. “–” indicates state without MCOs. States without an “x” on a given row under each column, indicated “no plans to adopt/submit.” *The 2016 Medicaid Managed Care Final Rule allows states, under the authority for health plans to cover services “in lieu of” those available under the Medicaid state plan, to receive federal matching funds for capitation payments on behalf of adults who receive inpatient psychiatric or SUD treatment or crisis residential services in an IMD for no more than 15 days during a given month. +In November 2018, CMS issued new guidance inviting states to apply for Section 1115 waivers of the federal IMD payment exclusion for services for adults with serious mental illness (SMI) or children with serious emotional disturbance (SED). #The SUPPORT Act legislation created a new state plan option, from October 1, 2019 to September 30, 2023, to cover IMD services for up to 30 days in a year for individuals with an SUD. Re: adoption of SUPPORT Act SPA option, states were also given the response option, “plan to submit after FY 2020.” No states selected this option. ^These states (NM, WV) may have discontinued use of Medicaid managed care “in lieu of” authority in FY 2020 due to approval/implementation of Section 1115 IMD SUD waivers. SOURCE: Kaiser Family Foundation Survey of Medicaid Officials in 50 states and DC conducted by Health Management Associates, October 2019. | ||||||||||
Long-term Services And Supports
Key Section Findings
Nearly all states in FY 2019 (48 states) and in FY 2020 (47 states) are employing one or more strategies to expand the number of people served in home and community-based settings. Of these states, the vast majority report using HCBS waivers and/or state plan options (i.e., 1915(c), Section 1115, 1915(i), and 1915(k)) to serve more individuals in the community. As of July 1, 2019, 25 states covered LTSS through one or more capitated managed care arrangements, and another two operated managed fee-for-service LTSS models.
What to watch:
- States continue to work to address challenges finding and retaining LTSS direct care workers. Roughly half of states reported raising wages for direct care workers in FY 2019 and 2020, a notable increase from prior years. In addition, 15 states had direct care workforce development strategies (e.g., recruiting, training, credentialing) in place in FY 2019, and 10 states reported expanding (7 states) or implementing new workforce development strategies (3 states) in FY 2020.
- Housing supports remain an important component of state LTSS rebalancing efforts. Thirty-seven states offer housing-related supports, such as community transition services, case management, or transitional supports as part of their HCBS and Section 1115 waiver programs. States were set to phase out their Money Follows the Person (MFP) programs in federal FY 2020, but Congress provided additional funding for a short-term extension of the program; however, the uncertain future of MFP may place some of the initiatives funded through MFP at risk.
- Several states will expand their MLTSS programs in FY 2019 and FY 2020. Pennsylvania is positioned to complete its statewide expansion of MLTSS in FY 2020, and several other states (Idaho, Illinois, and Tennessee) reported geographic or population expansions for FY 2020.
Additional information on HCBS expansions implemented in FY 2019 or planned for FY 2020 as well as state-level details on capitated MLTSS models can be found in Tables 10 and 11.
Medicaid is the nation’s primary payer for long-term services and supports (LTSS), covering a continuum of services ranging from home and community-based services (HCBS) that allow people to live independently in their own homes or in other community settings to institutional care provided in nursing facilities (NFs) and intermediate care facilities for individuals with intellectual disabilities (ICF-IDs). States have increasingly sought to expand home and community-based options and decrease reliance on institutional care in an effort to support beneficiaries’ preference to remain in their homes and community and rebalance their LTSS systems. In federal fiscal year 2016, spending on Medicaid LTSS totaled $167 billion, and HCBS represented 57% of these expenditures. In recent years, growth in Medicaid LTSS expenditures has been largely concentrated in HCBS.120
This year’s survey shows that nearly all states in FY 2019 (48 states) and FY 2020 (47 states) are using one or more strategies to expand the number of people served in home and community-based settings (Figure 8 and Table 10). States were asked about their use of the following rebalancing tools/methods: HCBS waivers and/or State Plan Amendments (SPAs) (including 1915(c), Section 1115, 1915(i), and 1915(k)); rebalancing incentives in managed care contracts; Programs of All-Inclusive Care for the Elderly (PACE); and efforts to downsize state institutions.
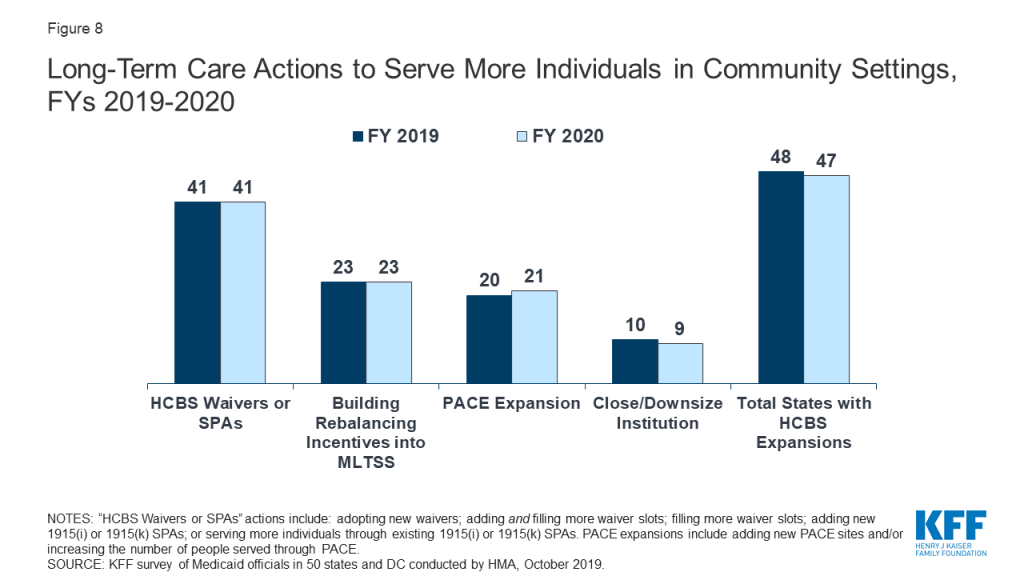
A large majority of states in FY 2019 (41 states) and in FY 2020 (41states) reported adopting new HCBS waivers/SPAs and/or serving more individuals through existing HCBS waivers/SPAs. Twenty-three states, or nearly all states that use an MLTSS model for at least some populations, reported using rebalancing incentives in their MLTSS contracts.121 For example, a number of states reported setting a blended nursing facility/HCBS rate for their long-term care population with assumptions built into the rates to incentivize plans to provide more home and community-based services. Nearly half of states (25 states) reported implementing PACE expansions in FY 2019 or FY 2020 by opening new PACE sites in one or both years (17 states) and/or expansion at existing sites. Fewer states reported efforts to downsize state institutions (likely because many states already have taken these actions in past years). No states took action to reduce or restrict the number of people receiving Medicaid HCBS in FY 2019 or FY 2020.
LTSS Direct Care Workforce
Many states are struggling to find sufficient numbers of trained direct care workers to meet the demand for services, including the demand for care in home and community-based settings.122 ,123 Low wages, few benefits, limited opportunities for career advancement, inadequate training, and high rates of worker injury are factors that contribute to a workforce shortage and high workforce turnover among paid LTSS direct care workers. The National Center for Health Workforce Analysis projects that demand for direct care workers (including nursing assistants, home health aides, personal care aides, and psychiatric assistants/aides) could grow by 48% between 2015 and 2030. Driven by demographic shifts, increased longevity, and increased prevalence of disability, this increased demand is expected to far exceed the available LTSS workforce supply.124
To address LTSS direct care workforce shortages and turnover, more states are reporting wage increases and workforce development activities (Exhibit 16). In FY 2019, 25 states reported implementing wage increases for Medicaid-reimbursed direct care workers, while 27 states reported implementing wage increases in FY 2020 (20 states in both years). This activity represents a significant uptick from FY 2018 when 15 states reported wage increases for direct care workers. In addition, 15 states had direct care workforce development strategies (e.g., recruiting, training, credentialing) in place in FY 2019, and 10 states reported expanding (7 states) or implementing new workforce development strategies (3 states) in FY 2020 (Exhibit 16).
| Exhibit 16: Strategies to Address LTSS Direct Care Workforce Shortages & Turnover | |||
| Fiscal Year | # of States | States | |
| Wage Increases | 2019 | 25 | AZ, CA, CO, CT, DC, DE, HI, IL, MA, MI, MT, NC, NH, NJ, NY, OK, OR, RI, SC, TN, UT, VT, WA, WI, WV |
| 2020 | 27 | AL, AR, AZ, CA, CO, CT, DC, DE, IL, LA, MA, MI, NH, NJ, NY, OH, OK, OR, PA, TN, TX, UT, VA, VT, WA, WI, WV | |
| Workforce Development (including recruiting, training, credentialing etc.) | In Place FY 2019 | 15 | AR, AZ, CA, CT, KY, MA, MN, MS, NY, OH, OR, PA, TN, WA, WI |
| New/Expanded FY 2020 | 10 | AZ, CT, MI*, MN, OR*, PA, RI*, TN, WA, WI | |
| MD and SD did not report; “*” above indicates “new” initiative in FY 2020 | |||
The following are examples of state direct care workforce development strategies reported:
- In FY 2020, Georgia is implementing structured family caregiving as a waiver service to address professional workforce shortages and provide formal training, support, and a stipend for family caregivers who live with and assist an elderly and/or disabled waiver participant requiring significant assistance with activities of daily living. Similarly, North Carolina plans to expand workforce options in FY 2020 by adopting a similar new live-in support service, coordinated caregiving, in their waiver serving seniors and people with disabilities.
- In Minnesota, for FYs 2019 and 2020, payments on behalf of enrollees who are eligible for 12 or more hours of state plan personal care assistant (PCA) services per day may be made at a higher reimbursement rate after the provider has completed required training. Starting on the date the worker qualifies, the PCA provider agency must pass the enhanced rate increase in wages and/or benefits to the specific direct care worker.
- Tennessee is pursuing a three-prong workforce development strategy which includes: 1) developing a competency-based education and training curriculum; 2) investing in collecting provider workforce data and in building provider capacity to improve recruitment and retention; and 3) developing wage incentives tied to competency-level (e.g., based on training/certification and/or tenure) as well as provider incentives for the adoption of evidence-based approaches to workforce recruitment and retention.
Housing Supports
Thirty-seven states reported offering at least some housing-related services in FY 2019 and/or FY 2020 under SPA, Section 1915 (c), or Section 1115 to promote community integration for individuals with disabilities, seniors in need of LTSS, individuals experiencing homelessness, or individuals with SMI/SUD (Exhibit 17). The availability of affordable, accessible housing has long been identified as a major barrier to state efforts to transition individuals from institutions and rebalance their LTSS systems.125 In 2015, CMS issued an Informational Bulletin to clarify how Medicaid can be used to support certain housing-related activities and promote community integration for targeted groups (individuals with disabilities, seniors in need of LTSS, and individuals experiencing chronic homelessness).126 While noting Medicaid funds generally cannot be used for room and board, the bulletin identified several categories of services that can be funded including: individual housing transition services, individual housing and tenancy sustaining services, and state-level housing related collaborative activities.127 A majority of the housing-related services described by states are offered through Section 1915 (c) waivers followed by housing services offered through Section 1115 waivers. Fewer states provide these services under their State Plan.
| Exhibit 17: Housing Support Services | |||
| States providing housing supports in FY 2019 and/or FY 2020 | 37 States | AK, AL, AR, AZ, CA, CO, CT, DC, DE, FL, HI, IL, IN, KY, LA, MA, MD, MI, MN, MT, NC, NE, NJ, NM, NV, NY, OH, OR, PA, TN, TX, UT, VA, VT, WA, WI, WV | |
| States implementing new or expanded housing supports in FY 2020 | 13 States | CT, HI, IL*, MA*, NC*, NJ*, NV*, NY*, OH*, UT*, VT, WA, WI | |
| “*” Indicates state reporting a new initiative in 2020 | |||
The following are examples of states implementing new or expanded housing supports in FY 2020:
- Illinois will be implementing new pre-tenancy and tenancy support services for beneficiaries with frequent ER utilization, two or more chronic conditions, and at risk of homelessness or institutional care.
- Massachusetts will be adding certain health-related social services under its Section 1115 waiver targeted at individuals experiencing homelessness, including pre-tenancy supports, tenancy sustaining supports, and home modifications.
- North Carolina recently received CMS approval of a Section 1115 waiver authorizing the state to establish a “Healthy Opportunities” pilot program in two to four regions within the state’s new Medicaid managed care delivery system. Under the pilot program, beneficiaries with certain health conditions (e.g., two or more chronic conditions) and social risk factors, including homelessness and housing insecurity, will receive evidence-based enhanced case management and other services designed to address enrollee needs related to housing, food, transportation and safety.128
- Ohio plans to expand community transition services under its Section 1915(c) HCBS waiver programs for adults with physical disabilities and individuals with developmental disabilities as well as add a new community integration service that will provide independent living assistance and community support coaching activities to enable individuals to live independently in the community.
Money Follows the Person
Money Follows the Person (MFP) is a federal grant program enacted under the Deficit Reduction Act of 2005 and extended through September 2016 by the Affordable Care Act, which operates in 44 states.129 Enhanced federal funding under MFP has supported the transition of over 90,000 individuals from institutional to home and community-based long-term care settings as of June 2018.130 This includes the transition of older adults, individuals with physical disabilities, individuals with mental illness, and individuals with I/DD. The program has also been a catalyst for development of housing-related activities as states have used these resources to offer new housing-related services and incorporate housing expertise within their Medicaid programs, among other activities to assist in expanding housing options available for individuals who choose HCBS.131 ,132
Although states were set to fully phase-out their MFP programs in federal fiscal year 2020, the Congress acted to provide $254 million in additional funds for a short-term extension of the program (authorized additional funding currently expires December 31, 2019).133 However, without a longer-term reauthorization, the future of the MFP program remains uncertain. In this year’s survey, states were asked about the status of their MFP funding and the services that would be impacted if MFP funds were exhausted and the program is not reauthorized. Thirty-six states reported they have not yet exhausted their MFP funds and most states expect their funding to last through federal fiscal year 2020. In contrast, seven states report having expended all of their MFP dollars.134 In anticipation of the phase-out of MFP, several states indicated they had been able to transition certain MFP services to their State Plan and/or 1915(c) waivers. A greater number of states identified a range of services and key administration activities they would expect to discontinue if/when MFP funding expires. These include certain community transition services; community case management; outreach specialists, housing specialists, and housing relocation assistance; training for family caregivers, care coordinators, and providers; among other activities. Of these, community transition services were most often cited as being at risk once MFP funds are exhausted.
Managed Long-Term Services and Supports (MLTSS)
States have increasingly turned to managed long-term services and supports – in particular, capitated MLTSS models. As of July 1, 2019, 27 states reported having an MLTSS model. Two states reported having a managed fee-for-service MLTSS model while roughly half of states (25 states) covered LTSS through one or more of the following types of capitated managed care arrangements:
- Medicaid MCO covering Medicaid acute care and LTSS (21 states)
- PHP covering only Medicaid LTSS (5 states)
- MCO arrangement for dual eligible beneficiaries covering Medicaid and Medicare acute care and Medicaid LTSS services in a single, financially aligned contract under the federal Financial Alignment Initiative (FAI) (9 states)
Of the 25 states that reported using one or more of these capitated MLTSS models, eight states reported using two models, and one state (New York) reported using all three. Of the states with capitated MLTSS, 18 states offered some form of MLTSS plan on a statewide basis for at least some LTSS populations as of July 1, 2019 (Table 11). Almost every MLTSS state includes both institutional and HCBS in the same contractual arrangement with a few exceptions: Ohio and Michigan report that coverage varies by MLTSS arrangement and Arkansas’ new PASSE program includes only HCBS.
In addition to these capitated models, two states (Alabama and Washington) report managed fee-for-service (FFS) LTSS models. Under these arrangements, states make payments to care coordination entities responsible for managing the care of individuals, while continuing to reimburse providers on a FFS basis for LTSS and other Medicaid services. Washington is the only state that has a managed FFS Financial Alignment Initiative in place (discussed in more detail below). In FY 2019, Alabama began contracting with a provider-led Integrated Care Network (ICN) to provide enhanced case management, education, and outreach services to most Medicaid long-term care recipients in both HCBS and institutional settings. The ICN is paid a per-member per-month (PMPM) payment with a portion of that payment contingent on the entity meeting state-established targets for nursing facility and HCBS mix.
As of July 1, 2019, nine states offered an MCO-based FAI (California, Illinois, Massachusetts, Michigan, New York, Ohio, Rhode Island, South Carolina, and Texas). These initiatives aim to provide more integrated care across Medicare and Medicaid, including LTSS, to dual eligible enrollees. The FAI model involves a three-way contract between an MCO, Medicare, and the state Medicaid program.135 ,136 In April 2019, CMS issued a state Medicaid director’s letter to encourage additional states to participate in an FAI demonstration model.137 Citing a lack of coordinated care for dual eligibles and a disproportionate share of Medicare and Medicaid spending for these beneficiaries, the letter outlined three opportunities for states to consider to test new models for dually eligible individuals – a capitated financial alignment model; a managed FFS model; and an alternative state-designed model. For states currently participating, the letter offered opportunities for multi-year extensions as well as possible revisions to existing FAIs; for example, expansion of the geographic scope of the demonstrations.138
States were asked whether they plan to take advantage of these new opportunities. Of the nine states currently participating in the capitated FAI model, five indicated that they planned to seek an extension and four indicated that a final determination on whether to pursue this opportunity had not been made. Washington also reported an intent to seek an extension to their current managed FFS FAI demonstration. For states without an FAI, only Tennessee affirmatively indicated plans to pursue a state-designed model.
Washington State FAI Demonstration
Implemented in July 2013, Washington was the first state to partner with CMS on a Financial Alignment Initiative that utilized a managed fee-for-service model. Under the demonstration, Washington is building upon its Medicaid health home infrastructure, targeting dual eligible enrollees with chronic health conditions who are identified as high risk. The health homes are the lead local entities responsible for organizing enhanced integration of primary, acute, LTSS, and behavioral health services for Medicare-Medicaid enrollees participating in the demonstration. They are paid a tiered per-member per-month (PMPM) payment based on level and type of enrollee interaction and receive performance-based payments based on rates of engagement with beneficiaries. Results from the first three demonstration years indicate Washington’s FAI has resulted in estimated Medicare savings of more than 11% and evidence of positive beneficiary experience and quality trends.139 ,140
Many states encourage improved coordination and integration of services for the dually eligible population under MCO arrangements outside of the FAI. Under a Memorandum of Understanding (MOU) with CMS, Minnesota operates an administrative alignment demonstration (with no financial alignment) to test ways to streamline processes and better integrate care for dually eligible beneficiaries enrolled in the Minnesota Senior Health Options program. Increasingly, states are also utilizing the existing Medicare Dual Eligible Special Needs Plans (D-SNP) infrastructure as a platform to improve integration and coordination for individuals also enrolled in Medicaid managed care. Overall, 36 states indicated in this year’s survey having a contract with their D-SNPs to support better care coordination for dual eligible beneficiaries. Eleven states141 report that they require Medicaid-contracting MCOs to be Medicare Dual Eligible Special Needs Plans (D-SNPs)142 or Fully Integrated Dual Eligible (FIDE) Special Needs Plans143 in some or all MLTSS models offered in the state. Seven states report that they have or are planning to institute “default enrollment.” Under default enrollment, beneficiaries in a capitated Medicaid managed care plan may be automatically enrolled in an affiliated D-SNP plan when an individual becomes eligible for Medicare. Going forward, states are expected to continue to increase their reliance on D-SNPs as part of their MLTSS approach given recent CMS guidance promoting opportunities to use D-SNPs and new requirements enacted as part of the Balanced Budget Act of 2018 (effective in Calendar Year 2021) for D-SNPs to better integrate care for dual eligibles.144
MLTSS Enrollment
For geographic areas where capitated MLTSS operates, this year’s survey asked whether, as of July 1, 2019, certain populations were enrolled in MLTSS on a mandatory or voluntary basis or were always excluded. On the survey, states selected from “always mandatory,” “always voluntary,” “varies,” or “always excluded” for the following dually eligible and non-dually eligible populations: seniors, persons with I/DD, nonelderly persons with physical disabilities, medically fragile/technologically dependent children, and persons with SMI or SED. Dual eligible and non-dual eligible seniors and persons with physical disabilities were most likely to be enrolled on a mandatory basis (Exhibit 18). Dual and non-dual eligible persons with SMI or SED followed closely behind in terms of mandatory inclusion in these programs. In contrast, dual and non-dual eligible individuals with I/DD and medically fragile children were most likely to be excluded from mandatory enrollment in MLTSS. (Exhibit 18).
| Exhibit 18: MLTSS Enrollment by Populations (# of States) | |||||
| Non-Dual Eligibles | |||||
| Seniors | Persons w/ Physical Disabilities | Persons w/ I/DD | Medically Fragile Children | Persons with SMI/SED | |
| Always mandatory | 15 | 15 | 6 | 9 | 13 |
| Always voluntary | 3 | 3 | 5 | 1 | 2 |
| Varies | 1 | 2 | 8 | 5 | 5 |
| Always excluded | 6 | 5 | 6 | 10 | 5 |
| Dual Eligibles | |||||
| Always mandatory | 15 | 15 | 6 | 9 | 17 |
| Always voluntary | 3 | 3 | 5 | 1 | 4 |
| Varies | 1 | 2 | 8 | 5 | 2 |
| Always excluded | 6 | 5 | 6 | 10 | 2 |
MLTSS Population Changes
In FY 2019 and FY 2020, several states introduced new MLTSS programs or expanded existing MLTSS programs (Exhibit 19).
| Exhibit 19: MLTSS Population Expansions, FY 2019 and FY 2020 | ||
| FY 2019 | FY 2020 | |
| Geographic Expansions | MA, PA | ID, IL, PA |
| New Population Groups Added | OH, VA | TN |
| Implementing an MLTSS program for the First Time | AR | — |
Notable state MLTSS expansions include:
- In FY 2019, Pennsylvania continued to phase in implementation of its Community HealthChoices (CHC) MLTSS program for dual eligibles, older adults, and individuals with physical disabilities. In January 2019, Pennsylvania implemented CHC in the southeastern region of the state, which includes Philadelphia, and is scheduled to complete its statewide expansion in January of 2020.
- In FY 2019, Arkansas introduced a new capitated MLTSS model for persons with I/DD and behavioral health needs. The Provider-led Arkansas Shared Savings Entities (PASSEs) are responsible for managing the comprehensive health care needs, including home and community-based LTSS, of these populations.
- In July 2019, Illinois expanded managed LTSS for dual eligibles statewide beyond the greater Chicago region. HealthChoice Illinois health plans in these areas began managing health care services, including LTSS, for dual eligible beneficiaries not enrolled in the state’s FAI program who are in a nursing facility or are receiving certain HCBS waiver services.145
- In July 2019, Tennessee received CMS approval to add two new benefit groups to its Employment and Community First (ECF) CHOICES program, TennCare’s MLTSS program for individuals with I/DD. The new benefit groups include certain children and adults with I/DD and severe co-occurring behavioral health and/or psychiatric conditions. Tennessee is also proposing to establish a new Katie Beckett-like waiver program with capped enrollment, for children under age 18 with disabilities and/or complex medical needs who would be Medicaid eligible if they lived in an institution but are cared for at home and do not qualify because of their parents’ income. Those children with the most significant disabilities or complex medical needs will receive the full range of Medicaid benefits and home and community-based services through the state’s managed care program.146
Table 10: Long-Term Care Actions to Serve More Individuals in Community Settings in all 50 States and DC, FY 2019 and FY 2020
States | Sec. 1915 (c) or Section 1115 HCBS Waiver | Sec. 1915(i) HCBS State Plan Option | Sec. 1915(k) “Community First Choice” Option | Building Rebalancing Incentives into MLTSS | PACE(* indicates new sites) | Close/ Downsize Institution | Total States with HCBS Expansions | |||||||
2019 | 2020 | 2019 | 2020 | 2019 | 2020 | 2019 | 2020 | 2019^ | 2020 | 2019 | 2020 | 2019 | 2020 | |
Alabama | X | X | X | X | X | |||||||||
Alaska | X | X | X | X | X | X | ||||||||
Arizona | X | X | X | X | ||||||||||
Arkansas | X | X | X* | X | X | |||||||||
California | X | X | X | X | X | X | X | X | X* | X* | X | X | X | X |
Colorado | X | X | X* | X* | X | X | ||||||||
Connecticut | X | X | X | X | X | X | X | X | X | X | ||||
Delaware | X | X | X | X | X | X | X | X* | X | X | ||||
DC | X* | X | ||||||||||||
Florida | X | X | X | X | X* | X* | X | X | ||||||
Georgia | X | X | X | X | X | X | ||||||||
Hawaii | X | X | X | X | ||||||||||
Idaho | X | X | X | X | X | X | X | X | ||||||
Illinois | X | X | X | X | X | |||||||||
Indiana | X | X | X | X | X* | X | X | |||||||
Iowa | X | X | X | X | X | X | X | X | X | |||||
Kansas | X | X | X | X | X | X | ||||||||
Kentucky | ||||||||||||||
Louisiana | X | X | ||||||||||||
Maine | X | X | X | X | ||||||||||
Maryland | X | X | X | X | X | X | X | X | ||||||
Massachusetts | X | X | X | X | X* | X | X | |||||||
Michigan | X | X | X | X | X | X | X* | X* | X | X | ||||
Minnesota | X | X | X | X | X | X | X | |||||||
Mississippi | X | X | X | X | X | |||||||||
Missouri | X | X | X* | X | X | |||||||||
Montana | X | X | X | X | X | X | X | |||||||
Nebraska | X | X | X | X | X | X | ||||||||
Nevada | X | X | X | X | X | X | X | X | ||||||
New Hampshire | ||||||||||||||
New Jersey | X | X | X* | X | X | |||||||||
New Mexico | X | X | X | X | X | X | X | |||||||
New York | X | X | X | X | X | X | X | X* | X* | X | X | X | ||
North Carolina | X | X | X | X | X | X | X | |||||||
North Dakota | X | X | X* | X* | X | X | X | X | ||||||
Ohio | X | X | X | X | X | X | X | X | X | X | ||||
Oklahoma | X | X | X* | X | X | |||||||||
Oregon | X | X | X | X | X | X | X | X* | X | X | ||||
Pennsylvania | X | X | X | X | X* | X | X | X | ||||||
Rhode Island | X | X | X | X | X | |||||||||
South Carolina | X | X | X | X | X | X | X | X | X | X | ||||
South Dakota | X | X | ||||||||||||
Tennessee | X | X | X | X | X | X | ||||||||
Texas | X | X | X | X | X | X | X | X | X | X | ||||
Utah | X | X | X | X | ||||||||||
Vermont | X | X | X | X | ||||||||||
Virginia | X | X | X | X | X | |||||||||
Washington | X | X | X | X | X | X* | X | X | X | X | ||||
West Virginia | X | X | X | X | ||||||||||
Wisconsin | X | X | X | X | X | X | ||||||||
Wyoming | X | X | X | X | X | X | ||||||||
Totals | 39 | 39 | 15 | 13 | 10 | 11 | 23 | 23 | 20 | 21 | 10 | 9 | 48 | 47 |
NOTES: 1915(c) or Sec. 1115 waiver actions include: adopting new waivers; adding and filling more waiver slots; or filling more waiver slots. Actions under 1915(i) and 1915(k) options include adding new 1915(i) or 1915(k) SPAs or serving more individuals through existing 1915(i) or 1915(k) SPAs. Actions under PACE include more individuals served in existing and/or new PACE sites, with “*” indicating which states expect new sites in FY 2019 or FY 2020. ^PA and ND reported adding a PACE site in FY 2019 but did not anticipate this would result in increased enrollment until FY2020. SOURCE: Kaiser Family Foundation Survey of Medicaid Officials in 50 states and DC conducted by Health Management Associates, October 2019. | ||||||||||||||
Table 11: Capitated MLTSS Models in all 50 States and DC, as of July 1, 2019
States | Medicaid MCO | PHP | Financial Alignment Demonstration (FAD) for Duals | Any MLTSS | Statewide |
Alabama | |||||
Alaska | |||||
Arizona | X | X | X | ||
Arkansas | X | X | X | ||
California | X | X | X | ||
Colorado | |||||
Connecticut | |||||
Delaware | X | X | X | ||
DC | |||||
Florida | X | X | X | ||
Georgia | |||||
Hawaii | X | X | X | ||
Idaho | X | X | |||
Illinois | X | X | X | X | |
Indiana | |||||
Iowa | X | X | X | ||
Kansas | X | X | X | ||
Kentucky | |||||
Louisiana | |||||
Maine | |||||
Maryland | |||||
Massachusetts | X | X | X | ||
Michigan | X | X | X | ||
Minnesota | X | X | X | ||
Mississippi | |||||
Missouri | |||||
Montana | |||||
Nebraska | |||||
Nevada | |||||
New Hampshire | |||||
New Jersey | X | X | X | ||
New Mexico | X | X | X | ||
New York | X | X | X | X | X |
North Carolina | X | X | X | ||
North Dakota | |||||
Ohio | X | X | X | ||
Oklahoma | |||||
Oregon | |||||
Pennsylvania | X | X | |||
Rhode Island | X | X | X | X | |
South Carolina | X | X | |||
South Dakota | |||||
Tennessee | X | X | X | ||
Texas | X | X | X | X | |
Utah | |||||
Vermont | |||||
Virginia | X | X | X | ||
Washington | |||||
West Virginia | |||||
Wisconsin | X | X | X | X | |
Wyoming | |||||
Totals | 21 | 5 | 9 | 25 | 18 |
NOTES: States were asked whether they cover long-term services and supports through any of the following managed care (capitated) arrangements as of July 1, 2019: Medicaid MCO (MCO covers Medicaid acute + Medicaid LTSS); PHP (covers only Medicaid LTSS); MCO arrangement for dual eligibles under the Financial Alignment Demonstration (Medicaid MCO covers Medicaid and Medicare acute + Medicaid LTSS). In addition to these capitated models, two states (Alabama and Washington) report managed fee-for-service (FFS) LTSS models. Under these arrangements, states make payments to care coordination entities responsible for managing the care of individuals, while continuing to reimburse providers on a FFS basis for LTSS and other Medicaid services. SOURCE: Kaiser Family Foundation Survey of Medicaid Officials in 50 states and DC conducted by Health Management Associates, October 2019. | |||||
Provider Rates And Taxes
Key Section Findings
A strong economy and state revenue growth allowed most states to implement and plan more fee-for-service (FFS) provider rate increases for FY 2019 (50 states) and FY 2020 (45 states). This holds true across all provider types, including inpatient hospital rates and nursing facility rates. As more states increasingly rely on capitated managed care, however, FFS rate changes are a less meaningful measure of provider payment unless the state establishes MCO payment requirements. Nearly half of MCO states reported doing so: 19 states reported mandating minimum provider reimbursement rates in their MCO contracts for inpatient hospital, outpatient hospital, or primary care physicians and 17 states reported requiring MCOs to change provider payment rates in accordance with FFS payment rate changes for one or more of these provider types. As in prior years, data show that all states except Alaska rely on provider taxes and fees to fund a portion of the non-federal share of the costs of Medicaid. Six states indicate plans for new provider taxes in FY 2020.
What to watch:
- About half of states reported at least one policy related to payment adjustments in place to promote access to hospitals or other providers in rural areas.
- With the addition of California in FY 2019, eight states reported that they have a provider tax on Ground Emergency Medical Transportation, or ambulance providers.
Tables 12 through 14 provide complete listings of Medicaid provider rate changes and provider taxes and fees in place in FY 2019 and FY 2020.
Provider Rates
Provider rate changes generally reflect broader economic conditions. During economic downturns and state revenue shortfalls, states often turn to rate restrictions to contain costs and are more likely to increase rates during periods of recovery and revenue growth. This report examines rate changes across major provider categories: inpatient hospitals, nursing facilities, MCOs, outpatient hospitals, primary care physicians, specialists, dentists, and home and community-based services (HCBS) providers. States were asked to report aggregate rate changes for each provider category in their fee-for-service (FFS) programs. States were also asked about aggregate rate increases for MCOs. Consistent with the strong economies prevailing in most states, more provider rate increases and fewer rate cuts were reported in FY 2019 and FY 2020.
The number of states that made or are planning rate increases exceeds (for FFS and for MCOs) the number implementing or planning such rate restrictions in both FY 2019 and FY 2020. In FY 2019, almost every state implemented rate increases for at least one category of providers (50 states), while fewer states implemented rate restrictions (26 states) (Figure 9 and Table 12).147 For FY 2020, the number of states with at least one planned rate increase (45 states) is more than double the number of states with at least one planned rate restriction (21 states) (Figure 9 and Table 13). The number of states with planned rate restrictions is the lowest since FY 2008.
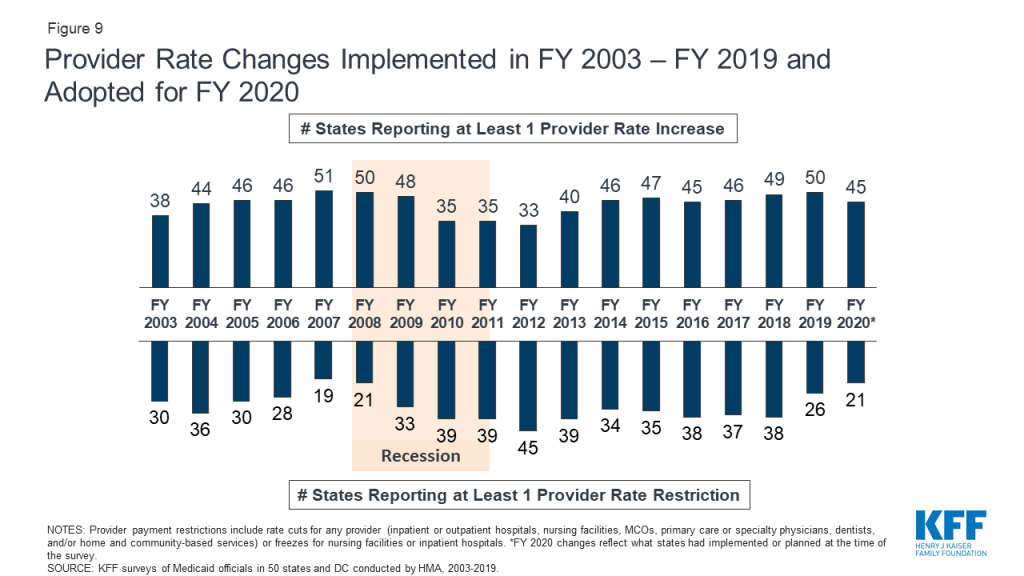
The number of states with rate increases exceeds the number of states with restrictions in FY 2019 and FY 2020 across all major categories of FFS providers and MCOs (Figure 10 and Tables 12 and 13). For the purposes of this report, cuts or freezes in rates for inpatient hospitals and nursing facilities are counted as restrictions.148 Almost all reported rate restrictions for inpatient hospitals and nursing facilities were rate freezes. One state, Alaska, indicated that it would have across-the-board 5% rate cuts in FY 2020 due to fiscal challenges. Nursing facilities received rate increases more often than other categories of providers. In both FY 2019 and 2020, 41 states indicated they have increased or plan to increase nursing facility rates. (In many cases, these increases reflect cost-of-living type adjustments.) HCBS providers were also among those most likely to receive rate increases (39 states in FY 2019 and 34 states in FY 2020) (Figure 10 and Tables 12 and 13).
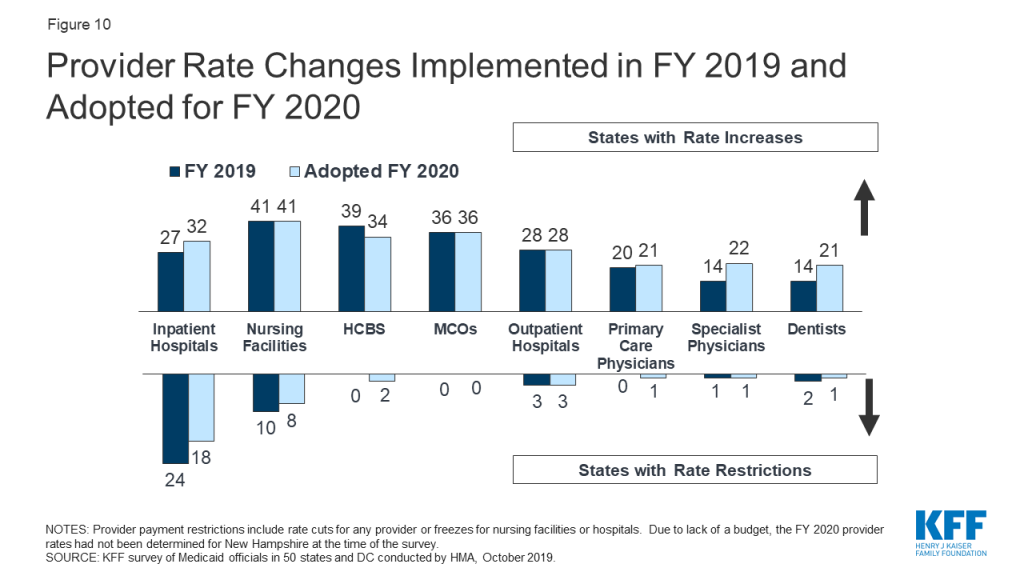
State authority to adjust capitation payments for MCOs is limited by the federal requirement that states pay actuarially sound rates. In FY 2019 and FY 2020, most of the states with Medicaid MCOs (40 states in FY 2019 and 41 states in FY 2020) either implemented or planned increases in MCO rates. No states indicated MCO rate cuts for either FY 2019 or FY 2020.149
Requirements For mco payments to providers
As more states rely on capitated MCO arrangements, FFS provider rate changes are a less meaningful measure of provider payment, unless the state establishes MCO payment requirements. In this year’s survey, states were asked to report by provider category whether their MCO contracts establish minimum rates that the MCOs must pay providers and/or require MCOs to make provider payment changes that match uniform dollar or percent changes made in FFS.
Nearly half of MCO states (19 states) mandate minimum provider reimbursement rates in their MCO contracts for inpatient hospital, outpatient hospital, or primary care physicians (Exhibit 20). Of the 41 states with MCOs in FY 2020, 19 states indicated that they had rate floors in at least one of these three categories of acute care providers. Seven states reported “yes – for the entire category” for all three provider types. Some states indicated that they have rate floors for some but not all providers within a category.
| Exhibit 20: Mandated Minimum Rates MCOs Must Pay Selected Providers | ||||
| Rate Floor | Inpatient Hospital | Outpatient Hospital | Primary Care Physician | For Any Provider |
| Yes – for entire category | 10 | 8 | 7 | 12 |
| Varies – some providers in this category | 6 | 8 | 5 | 9 |
| Total with any minimum rate requirements | 16 | 16 | 12 | 19 |
| MD did not report. | ||||
Just under half of MCO states (17 states) require MCOs to change provider payment rates in accordance with FFS payment rate changes (uniform dollar or percent changes) for inpatient hospital, outpatient hospital, or primary care physicians (Exhibit 21). In many states, MCOs make most of the Medicaid payments to providers. This year’s survey asked states to report whether they require MCOs to make changes to provider payments that follow percent or level changes in FFS rates. Of the 41 states with MCOs in FY 2020, 17 states indicated that they had such a requirement for at least some providers in at least one acute care provider category (inpatient hospital, outpatient hospital, or primary care physician). Five states reported “yes – for the entire category” indicating they require MCOs to make these changes for all three types of providers.
| Exhibit 21: MCO Contracts Required to Match Uniform Changes Made in FFS | ||||
| Uniform Changes | Inpatient Hospital | Outpatient Hospital | Primary Care Physician | For Any Provider |
| Yes – for entire category | 9 | 7 | 6 | 10 |
| Varies – some providers in this category | 6 | 6 | 4 | 8 |
| Total with requirements to match changes in FFS | 15 | 13 | 10 | 17 |
| MD did not report. | ||||
RURAL Payment Adjustments
States were asked if they have payment adjustments in place to promote access to hospitals or other providers in rural areas — about half of states reported at least one policy to support rural providers. While there are federal reimbursement requirements for rural hospitals that meet the definition of a Critical Access Hospital, many states reported policies to promote hospital access in rural areas beyond these statutory requirements. For example, Washington plans to implement in FY 2020 performance-based payments for some Critical Access Hospitals in its Rural Health Access Preservation pilot to increase care coordination and access to care.
Other notable payment initiatives for rural hospitals include using a differential Diagnosis Related Group (DRG) price base, supplemental pools (sometimes through the distribution of Disproportionate Share Hospital (DSH) payments), use of state directed payments for inpatient or outpatient services, and higher reimbursement inflation factors. Some states noted special payment arrangements for Rural Health Centers in particular, and some states reported initiatives targeting other providers in rural areas, including the extension of telehealth services, higher payments for rural dentists, and investment in rural county personal care and rural nursing facilities.
While the focus of the survey question was on payment adjustments to rural providers, two states (Arizona and South Carolina) mentioned funding for rural graduate medical education designed to support the development of residencies and fellowships in rural medicine as a strategy for growth in rural and underserved communities. Tennessee noted a rural hospital initiative beyond payment policies: the state is working with targeted rural hospitals to transform their operations to become more sustainable. One state also noted that Medicaid managed care plans are required to maintain adequate provider panels to ensure access and may therefore choose to make differential payments to rural providers.
Pennsylvania’s Rural Health Model is an alternative payment model that will transition rural hospitals from FFS to global payments, with the goal of increasing rural Pennsylvanians’ access to high-quality care, improving their health, and reducing the growth of hospital expenditures across payers. The model will include Medicaid, but for 2019, five hospitals and five payers (Medicare and four health plans) are participating. The model was designed in partnership with the federal Center for Medicare and Medicaid Innovation.
Provider Taxes and Fees
Provider taxes are an integral source of Medicaid financing. At the beginning of FY 2003, 21 states had at least one provider tax in place. Over the next decade, most states imposed new taxes or fees and increased existing tax rates and fees to raise revenue to support Medicaid. By FY 2013, all but one state (Alaska) had at least one provider tax or fee in place.150
In this year’s survey, states reported continuing or increased reliance on provider taxes and fees to fund a portion of the non-federal share of Medicaid costs in FY 2019 and FY 2020. In FY 2019, 34 states, including DC, had three or more provider taxes in place (Figure 11).
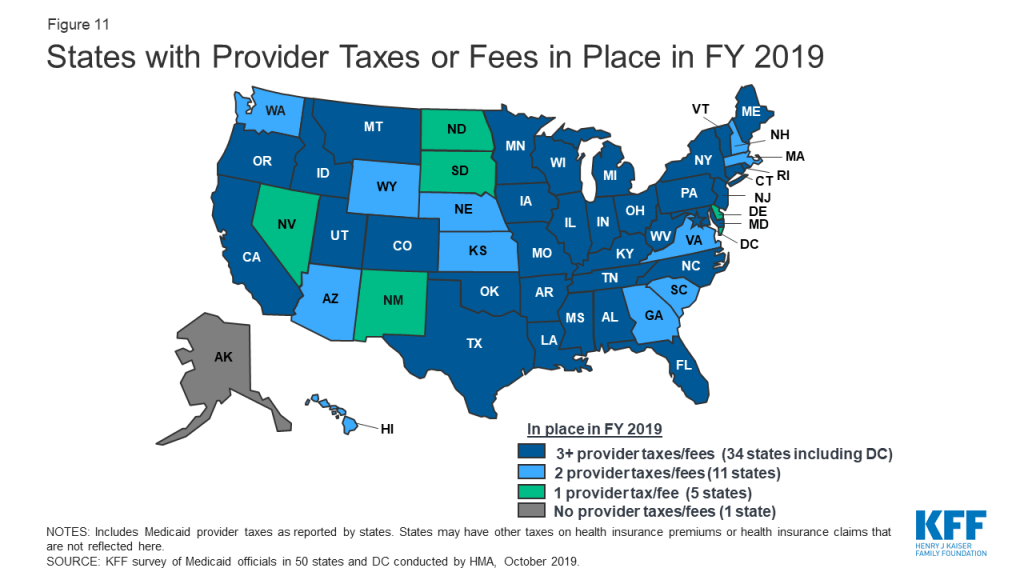
Very few states made or are making any changes to their provider tax structure in FY 2019 or FY 2020 (Table 14). The most common Medicaid provider taxes in place in FY 2019 were taxes on nursing facilities (45 states), followed by taxes on hospitals (43 states) and intermediate care facilities for individuals with intellectual disabilities (ICF-IDs) (35 states). New Mexico plans to implement a tax on nursing facilities, bringing the total number of states with taxes on nursing facilities to 46 states in FY 2020, and a new hospital tax in Texas will increase the total number of states with a hospital tax to 44 states in FY 2020. Four other states reported plans to add new taxes in FY 2020. Three of these are new MCO taxes (Arkansas, California,151 and Illinois) and the fourth is a tax on hospital-based physicians (Wyoming).
Seventeen states reported planned increases to one or more provider taxes in FY 2020, while six states reported provider tax decreases. Thirty-two states reported at least one provider tax that is above 5.5% of net patient revenues, which is close to the maximum federal safe harbor threshold of 6%. Federal action to lower that threshold, as has been proposed in the past, would therefore have financial implications for many states.
Fourteen states report that they have taxes on MCOs as of FY 2019, and two additional states plan to implement new MCO taxes in FY 2020. Federal Medicaid law was changed effective July 1, 2009 to restrict the use of Medicaid provider taxes on managed care organizations such as HMOs.152 Prior to that date, states could apply a provider tax to Medicaid MCOs that did not apply to MCOs more broadly and could use that revenue to match Medicaid federal funds. In recent years, several states have implemented new MCO taxes that tax member months rather than premiums and that meet the federal statistical requirements for broad-based and uniform taxes. As a result, the number of MCO taxes has increased in recent years. In addition to the 16 states reporting implemented or planned MCO taxes, some states have implemented taxes on health insurers more broadly that generate revenue for their Medicaid programs.
An increasingly common provider tax is a tax on Ground Emergency Medical Transportation, or an ambulance tax. California implemented such a tax in FY 2019, bringing the number of states with an ambulance tax to eight states.
Table 12: Provider Rate Changes in all 50 States and DC, FY 2019
States | Inpatient Hospital | Outpatient Hospital | Primary Care Physicians | Specialists | Dentists | MCOs | Nursing Facilities | HCBS | Any Provider | |||||||||
Rate Change | + | – | + | – | + | – | + | – | + | – | + | – | + | – | + | – | + | – |
Alabama | X | — | — | X | X | X | X | |||||||||||
Alaska | X | X | X | X | — | — | X | X | ||||||||||
Arizona | X | X | X | X | X | |||||||||||||
Arkansas | X | X | X | X | X | |||||||||||||
California | X | X | X | X | X | X | X | X | X | |||||||||
Colorado | X | X | X | X | X | X | X | X | X | |||||||||
Connecticut | X | X | X | — | — | X | X | X | X | |||||||||
Delaware | X | X | X | X | X | X | X | X | X | X | ||||||||
DC | X | X | X | X | X | X | ||||||||||||
Florida | X | X | X | X | X | X | X | |||||||||||
Georgia | X | X | X | X | X | X | X | |||||||||||
Hawaii | X | X | X | X | X | X | X | |||||||||||
Idaho | X | X | X | X | — | — | X | X | X | |||||||||
Illinois | X | X | X | X | X | X | ||||||||||||
Indiana | X | X | X | X | X | X | ||||||||||||
Iowa | X | X | X | X | X | X | ||||||||||||
Kansas | X | X | X | X | X | X | ||||||||||||
Kentucky | X | X | X | X | X | X | ||||||||||||
Louisiana | X | X | X | X | X | X | ||||||||||||
Maine | X | X | — | — | X | X | X | |||||||||||
Maryland | X | X | X | X | NR | X | X | X | ||||||||||
Massachusetts | X | X | X | X | X | X | X | |||||||||||
Michigan | X | X | X | X | X | X | ||||||||||||
Minnesota | X | X | X | X | X | X | X | |||||||||||
Mississippi | X | X | X | X | X | X | X | X | ||||||||||
Missouri | X | X | X | X | X | X | X | X | X | X | ||||||||
Montana | X | X | X | X | X | — | — | X | X | X | ||||||||
Nebraska | X | X | X | X | ||||||||||||||
Nevada | X | X | X | X | X | X | X | |||||||||||
New Hampshire | X | X | X | X | X | |||||||||||||
New Jersey | X | X | X | X | X | X | X | X | X | |||||||||
New Mexico | X | X | X | X | X | X | X | |||||||||||
New York | X | X | X | X | X | X | X | X | X | |||||||||
North Carolina | X | X | X | — | — | X | X | X | X | |||||||||
North Dakota | X | X | X | X | X | |||||||||||||
Ohio | X | X | X | X | X | X | ||||||||||||
Oklahoma | X | X | X | X | X | — | — | X | X | X | ||||||||
Oregon | X | X | X | X | X | |||||||||||||
Pennsylvania | X | X | X | X | X | X | ||||||||||||
Rhode Island | X | X | X | X | X | X | X | |||||||||||
South Carolina | X | X | X | X | X | X | ||||||||||||
South Dakota | X | X | X | X | X | — | — | X | X | X | ||||||||
Tennessee | X | X | X | |||||||||||||||
Texas | X | X | X | X | X | |||||||||||||
Utah | X | X | X | X | X | X | ||||||||||||
Vermont | X | X | X | — | — | X | X | X | ||||||||||
Virginia | X | X | X | X | X | |||||||||||||
Washington | X | X | X | X | X | X | X | |||||||||||
West Virginia | X | X | X | X | X | X | X | X | ||||||||||
Wisconsin | X | X | X | X | X | X | X | |||||||||||
Wyoming | X | — | — | X | X | X | X | |||||||||||
Totals | 27 | 24 | 28 | 3 | 20 | 0 | 14 | 1 | 14 | 2 | 36 | 0 | 41 | 10 | 39 | 0 | 50 | 26 |
NOTES: “+” refers to provider rate increases and “-” refers to provider rate restrictions. MCOs: Managed care organizations. HCBS: Home and community-based services. For the purposes of this report, provider rate restrictions include cuts to rates for physicians, dentists, outpatient hospitals, managed care organizations, HCBS, and pharmacy dispensing fees as well as both cuts or freezes in rates for inpatient hospitals and nursing facilities. There are 11 states that did not have Medicaid MCOs in operation in FY 2019; they are denoted as “–” in the MCO column. NR: State did not report. SOURCE: Kaiser Family Foundation Survey of Medicaid Officials in 50 states and DC conducted by Health Management Associates, October 2019. | ||||||||||||||||||
Table 13: Provider Rate Changes in all 50 States and DC, FY 2020
States | Inpatient Hospital | Outpatient Hospital | Primary Care Physicians | Specialists | Dentists | MCOs | Nursing Facilities | HCBS | Any Provider | |||||||||
Rate Change | + | – | + | – | + | – | + | – | + | – | + | – | + | – | + | – | + | – |
Alabama | X | — | — | X | X | X | X | |||||||||||
Alaska | X | X | X | X | X | — | — | X | X | X | ||||||||
Arizona | X | X | X | X | X | |||||||||||||
Arkansas | X | X | X | X | X | |||||||||||||
California | X | X | X | X | X | |||||||||||||
Colorado | X | X | X | X | X | X | X | X | X | |||||||||
Connecticut | X | X | — | — | X | X | X | |||||||||||
Delaware | X | X | X | X | X | X | X | X | X | X | ||||||||
DC | X | X | X | X | X | X | ||||||||||||
Florida | X | X | X | X | X | X | ||||||||||||
Georgia | X | X | X | X | X | |||||||||||||
Hawaii | X | X | X | X | X | X | X | |||||||||||
Idaho | X | X | X | X | — | — | X | X | X | |||||||||
Illinois | X | X | X | X | X | X | X | X | X | |||||||||
Indiana | X | NR | NR | NR | X | |||||||||||||
Iowa | X | X | X | X | x | X | ||||||||||||
Kansas | X | X | X | X | X | X | X | |||||||||||
Kentucky | X | X | X | X | x | X | ||||||||||||
Louisiana | X | X | X | X | X | X | X | X | ||||||||||
Maine | X | X | — | — | X | X | X | |||||||||||
Maryland | X | X | NR | NR | NR | NR | X | X | X | |||||||||
Massachusetts | X | X | X | X | X | X | X | |||||||||||
Michigan | X | X | X | X | X | X | ||||||||||||
Minnesota | X | X | X | X | X | X | X | X | X | |||||||||
Mississippi | X | X | X | X | X | X | X | |||||||||||
Missouri | X | X | X | X | X | X | X | X | X | X | ||||||||
Montana | X | X | X | X | — | — | X | X | X | X | ||||||||
Nebraska | X | X | X | X | X | X | X | X | X | |||||||||
Nevada | X | X | X | X | X | X | ||||||||||||
New Hampshire | TBD | TBD | TBD | TBD | TBD | TBD | TBD | TBD | ||||||||||
New Jersey | X | X | X | X | X | X | X | X | X | |||||||||
New Mexico | X | X | X | X | X | X | X | X | X | |||||||||
New York | X | X | X | X | X | X | X | X | X | |||||||||
North Carolina | X | X | X | X | X | X | ||||||||||||
North Dakota | X | X | X | X | X | X | X | X | X | |||||||||
Ohio | X | X | X | X | X | X | ||||||||||||
Oklahoma | X | X | X | X | X | — | — | X | X | X | ||||||||
Oregon | X | X | X | |||||||||||||||
Pennsylvania | X | X | X | X | X | X | ||||||||||||
Rhode Island | X | X | X | X | X | X | ||||||||||||
South Carolina | X | X | X | X | X | X | ||||||||||||
South Dakota | X | X | X | X | X | — | — | X | X | X | ||||||||
Tennessee | X | X | X | |||||||||||||||
Texas | X | X | X | X | X | |||||||||||||
Utah | X | X | X | X | X | X | X | |||||||||||
Vermont | X | X | X | X | — | — | X | X | X | X | ||||||||
Virginia | X | X | X | X | X | X | X | X | ||||||||||
Washington | X | X | X | X | X | X | X | X | ||||||||||
West Virginia | X | X | X | X | X | X | X | X | ||||||||||
Wisconsin | X | X | X | X | X | X | X | |||||||||||
Wyoming | X | — | — | X | X | |||||||||||||
Totals | 32 | 18 | 28 | 3 | 21 | 1 | 22 | 1 | 21 | 1 | 36 | 0 | 41 | 8 | 34 | 2 | 45 | 21 |
NOTES: “+” refers to provider rate increases and “-” refers to provider rate restrictions. MCOs: Managed care organizations. HCBS: Home and community-based services. For the purposes of this report, provider rate restrictions include cuts to rates for physicians, dentists, outpatient hospitals, managed care organizations, HCBS, and pharmacy dispensing fees as well as both cuts or freezes in rates for inpatient hospitals and nursing facilities. There are 10 states that did not have Medicaid MCOs in operation in FY 2020; they are denoted as “–” in the MCO column. NR: State did not report. SOURCE: Kaiser Family Foundation Survey of Medicaid Officials in 50 states and DC conducted by Health Management Associates, October 2019. | ||||||||||||||||||
Table 14: Provider Taxes in Place in all 50 States and DC, FY 2019 and FY 2020
States | Hospitals | Intermediate Care Facilities | Nursing Facilities | Other | ||||
2019 | 2020 | 2019 | 2020 | 2019 | 2020 | 2019 | 2020 | |
Alabama | X | X | X | X | X | X | ||
Alaska | ||||||||
Arizona | X | X | X | X | ||||
Arkansas | X | X | X | X | X | X | X | |
California | X | X | X | X | X | X | X | X* |
Colorado | X | X | X | X | X | X | ||
Connecticut | X | X | X | X | X | X | X | X |
Delaware | X | X | ||||||
DC | X | X | X | X | X | X | X | X |
Florida | X | X | X | X | X | X | ||
Georgia | X | X | X | X | ||||
Hawaii | X | X | X | X | ||||
Idaho | X | X | X | X | X | X | ||
Illinois | X | X | X | X | X | X | X | |
Indiana | X | X | X | X | X | X | ||
Iowa | X | X | X | X | X | X | ||
Kansas | X | X | X | X | ||||
Kentucky | X | X | X | X | X | X | X* | X* |
Louisiana | X | X | X | X | X | X | X* | X* |
Maine | X | X | X | X | X | X | X | X |
Maryland | X | X | X | X | X | X | X | X |
Massachusetts | X | X | X | X | ||||
Michigan | X | X | X | X | X* | X* | ||
Minnesota | X | X | X | X | X | X | X* | X* |
Mississippi | X | X | X | X | X | X | X | X |
Missouri | X | X | X | X | X | X | X* | X* |
Montana | X | X | X | X | X | X | ||
Nebraska | X | X | X | X | ||||
Nevada | X | X | ||||||
New Hampshire | X | X | X | X | ||||
New Jersey | X | X | X | X | X | X | X* | X* |
New Mexico | X | X | X | |||||
New York | X | X | X | X | X | X | X* | X* |
North Carolina | X | X | X | X | X | X | ||
North Dakota | X | X | ||||||
Ohio | X | X | X | X | X | X | X | X |
Oklahoma | X | X | X | X | X | X | ||
Oregon | X | X | X | X | X | X | ||
Pennsylvania | X | X | X | X | X | X | X* | X* |
Rhode Island | X | X | X | X | X | X | ||
South Carolina | X | X | X | X | ||||
South Dakota | X | X | ||||||
Tennessee | X | X | X | X | X | X | X* | X* |
Texas | X | X | X | X | X | X | X | |
Utah | X | X | X | X | X | X | X | X |
Vermont | X | X | X | X | X | X | X* | X* |
Virginia | X | X | X | X | ||||
Washington | X | X | X | X | ||||
West Virginia | X | X | X | X | X | X | X* | X* |
Wisconsin | X | X | X | X | X | X | ||
Wyoming | X | X | X | X | X | |||
Totals | 43 | 44 | 35 | 35 | 45 | 46 | 24 | 27 |
NOTES: This table includes Medicaid provider taxes as reported by states. Some states also have premium or claims taxes that apply to managed care organizations and other insurers. Since this type of tax is not considered a provider tax by CMS, these taxes are not counted as provider taxes in this report. “*” has been used to denote states with multiple “other” provider taxes. SOURCE: Kaiser Family Foundation Survey of Medicaid Officials in 50 states and DC conducted by Health Management Associates, October 2019 | ||||||||
Challenges And Priorities In Fy 2020 And Beyond Reported By Medicaid Directors And Conclusion
While national attention on health care is focused on broader debates involving prescription drug pricing and the 2020 elections, states continue to administer and make changes to Medicaid programs focusing on payment and delivery system reforms, adapting to state budget and policy priorities as well as new federal Medicaid options.
Over half of states reported that delivery system and payment reforms are a key priority. Efforts to better align payment with quality and improved health outcomes continue to be an important focus area for over half of states. States are pursuing these goals through managed care contract changes focused on value-based payment initiatives and the social determinants of health. In addition, a number of states specifically mentioned transforming their behavioral health systems and/or services, implementing SUD initiatives, and developing maternal, infant and/or child health initiatives.
Nearly a third of states reported information technology (IT) systems projects currently underway or planned as high priorities. Consistent with past surveys, these projects often relate to Medicaid Management Information Systems (MMIS) procurements and eligibility system upgrades and replacements. This year, states also mentioned IT initiatives focused on data analytics and reporting, and implementation of health information exchanges (HIEs). These types of IT initiatives typically support other program objectives related to delivery system reform and value-based purchasing, quality improvement, provider and MCO monitoring, and cost control strategies.
One quarter of states reported that dealing with state Medicaid budget and fiscal challenges remained a top priority. Even when state economic and budget conditions are more favorable, state Medicaid directors remain focused on the task of managing the Medicaid budget with a goal to constrain growth while preserving eligibility, covered services, and provider access. A subset of these states identified managing/responding to high cost prescription drugs and gene therapies or managing pharmacy expenditures as a key priority.
Ten states mentioned implementation or pursuit of new Section 1115 demonstration waivers, waiver amendments, or waiver renewals as key priorities for 2020. Section 1115 Medicaid demonstration waivers provide states an avenue to test new approaches in Medicaid that differ from federal program rules. These waivers, however, require significant administrative time and resources to develop, negotiate with CMS, and implement. Waivers also often necessitate system changes (MMIS and/or eligibility), contracting with new support vendors, MCO coordination (including contract amendments), outreach and engagement of members, providers, and other stakeholders, state regulatory changes, and other administrative tasks.
A few state Medicaid directors reported also tracking broader state coverage initiatives that extend beyond Medicaid. States including Colorado, Idaho, Illinois, Maine, New Mexico, Nevada, and Oregon are exploring potential state-based coverage expansion options. Options mentioned included Medicaid buy-ins, converting to a state-based marketplace, and other public option models. Washington reported on the implementation of a state public option plan.
States reported on a broad array of strategies to prepare for an aging population. By the year 2030, all baby boomers will be at least 65 years old and 1 in 5 US residents will be at retirement age. In preparation for these demographic changes, state reported plans to continue efforts to rebalance LTSS service delivery to reduce reliance on institutional care settings, use managed long-term services and supports, adopt LTSS payment reforms, and better integrate care for Medicare-Medicaid dual eligibles. A few states also mentioned broader state initiatives related to preparing for an aging population:
- Colorado and Vermont have established working groups to examine issues related to aging for the state and for individuals.
- Recognizing that family caregivers provide the majority of LTSS at no cost to the state, the 2019 Oregon legislature directed the Oregon Health Authority and Department of Human Services to examine options to provide family caregiver supports.
- Washington reported that its legislature created the Long Term Care Trust Fund in 2019 – the nation’s first state-operated, payroll tax funded, social insurance program to pay for long-term care. Payroll deductions will begin in 2022 and benefits will first become available in 2025.
A limited number of states expressed interest in a potential Medicaid block grant option and few states had assessed the implications of broader health reforms. CMS is developing waiver guidance for states interested in pursuing a block grant financing model or other types of capped federal financing. The majority of states reported that they were not interested in pursuing such an option, while others were undecided or waiting to review the guidance. Tennessee reported plans to submit a block grant waiver request no later than November 21, 2019 as required by state legislation passed in FY 2019. States were also asked to comment on potential challenges or opportunities for their state Medicaid programs related to proposed federal coverage expansions such as Medicare-for-all, public plan options, or Medicaid buy-in options. While most reported that there were no current efforts to assess the impact of various options, some states noted general concerns about potential state costs, the need for system modifications, provider access challenges, and other potential transition issues for Medicaid enrollees.
Conclusion
State actions in FY 2019 and FY 2020 reflect an innovative, dynamic Medicaid program that is constantly evolving to address the most pressing health care issues facing the nation, including initiatives to control prescription drug spending, improve birth outcomes and reduce maternal mortality, address the opioid epidemic, and allow seniors to age in place. With fewer budget pressures, many states reported expansions or enhancements to provider rates and benefits. While several states implemented, adopted, or continue to debate the ACA Medicaid expansion, a number of states continue to pursue policies promoted by the Trump administration that could restrict eligibility such as work requirements. At the time of the survey, litigation challenging the ACA was pending before the U.S. Court of Appeals for the 5th Circuit that could have complex and far-reaching consequences for Medicaid and the entire health care system if the ACA is overturned.153 Looking ahead, the trajectory of the economy, the direction of federal policies around Medicaid Section 1115 waivers, and the focus of the debate and attention to health care issues in the lead up to the November 2020 elections will also be factors that continue to shape Medicaid in FY 2020 and beyond.
Methods
The Kaiser Family Foundation (KFF) commissioned Health Management Associates (HMA) to survey Medicaid directors in all 50 states and the District of Columbia to identify and track trends in Medicaid spending, enrollment, and policy making. This is the 19th annual survey, each conducted at the beginning of the state fiscal year from FY 2002 through FY 2020. Additionally, eight mid-fiscal year surveys were conducted during state fiscal years 2002-2004 and 2009-2013, when a large share of states were considering mid-year Medicaid policy changes due to state budget and revenue shortfalls. Findings from previous surveys are referenced in this report when they help to highlight current trends. Archived copies of past reports are available on the following page.154
The KFF/HMA Medicaid survey on which this report is based was conducted from June through September 2019. The survey instrument (in the Appendix) was designed to document policy actions in place in FY 2019 and implemented or adopted for FY 2020 (which began for most states on July 1, 2018).155 The survey captures information consistent with previous surveys, particularly for eligibility, provider payment rates, benefits, long-term care, and managed care, to provide some trend information. Each year, questions are added or revised to address current issues.
Medicaid directors and staff provided data for this report in response to a written survey and a follow-up telephone interview. The survey was sent to each Medicaid director in June 2019. All 50 states and DC participated in the survey which typically includes completion of the survey instrument and a follow-up telephone interview discussions between July and September 2019.156 The telephone discussions are an integral part of the survey to ensure complete and accurate responses and to record the complexities of state actions.
The survey does not attempt to catalog all Medicaid policies in place for each state. This report highlights certain policies in place in state Medicaid programs in FY 2019 and policy changes implemented or planned for FY 2020. Experience has shown that adopted policies are sometimes delayed or not implemented for reasons related to legal, fiscal, administrative, systems, or political considerations, or due to delays in approval from CMS. Policy changes under consideration without a definite decision to implement are not included in the survey. The District of Columbia is counted as a state for the purposes of this report; the counts of state policies or policy actions that are interspersed throughout this report include survey responses from the 51 “states” (including DC). Given differences in the financing structure of their programs, the U.S. territories were not included in this analysis.
Appendix A: Acronym Glossary
AAC – Actual Acquisition Cost
ACA – Affordable Care Act
ACO – accountable care organization
AHC – Accountable Health Communities
APCD – all-payer claims database
APM – alternative payment model
ASO – Administrative Services Organization
BH – behavioral health
CAHPS – Consumer Assessment of Healthcare Providers and Systems
CDC – The Centers for Disease Control and Prevention
CFC – Community First Choice
CHIP – Children’s Health Insurance Program
CHIPRA – Children’s Health Insurance Program Reauthorization Act of 2009
CMS – The Centers for Medicare and Medicaid Services
CMMI – Center for Medicare and Medicaid Innovation
COE – Centers of Excellence
CON – Certificate of Need
CSHCNs – children with special health care needs
DBM – dental benefit manager
DEA – Drug Enforcement Authority
D-SNP – Medicare Dual Eligible Special Needs Plans
DRG – Diagnosis Related Group
DSH – Disproportionate Share Hospital
DSRIP – Delivery System Reform Incentive Program
DUR – drug utilization review
EAC – Estimated Acquisition Cost
ECHO, Project – Extension for Community Healthcare Outcomes
ED – emergency department
EMS – emergency medical services
EPSDT – Early and Periodic Screening, Diagnostic, and Treatment
FAD – Financial Alignment Demonstration
FDA – Food and Drug Administration
FFS – fee-for-service
FFY – federal fiscal year
FIDE-SNP – Fully Integrated Dual Eligible Special Needs Plans
FPL – federal poverty level
FQHC – federally qualified health center
FY – state fiscal year
GED – general educational development or diploma
HSA – health savings account
HCBS – home and community-based services
HEDIS – Healthcare Effectiveness Data and Information Set
HIE – health information exchange
HIT – health information technology
HHS – U.S. Department of Health and Human Services
ICF-ID – intermediate care facilities for individuals with intellectual disabilities
I/DD – intellectual and developmental disabilities
IEP – individualized education program
IMD – institutions for mental diseases
LTSS – long-term services and supports
MAGI – modified adjusted gross income
MAT – medication-assisted treatment
MCO – managed care organization
MED – morphine equivalent dose
MFP – Money Follows the Person (federal grant program)
MH – mental health
MLTSS – managed long-term services and supports
MLR – medical loss ratio
MME – morphine milligram equivalent
MMIS – Medicaid Management Information System
MOU – Memorandum of Understanding
NAS – neonatal abstinence syndrome
NADAC – National Average Drug Acquisition Costs
NCQA – National Committee for Quality Assurance
NEMT – non-emergency medical transportation
NF – nursing facility
OT – occupational therapy
OUD – opioid use disorder
P4P – pay for performance
PA – prior authorization
PACE – Programs of All-Inclusive Care for the Elderly
PBM – pharmacy benefit manager
PCA – personal care assistant
PCCM – primary care case management
PCMH – patient-centered medical home
PDL – preferred drug list
PDMP – Prescription Drug Monitoring Program
PHP – prepaid health plan
PIP – performance improvement projects
PMPM – per-member per-month
PT – physical therapy
QAPI – quality assessment and performance improvement
QHP – qualified health plan
RHC – rural health center
RPRC – residential pediatric recovery centers
SAMHSA – Substance Abuse and Mental Health Services Administration
SBIRT – Screening, Brief Intervention, and Referral to Treatment
SED – serious emotional disturbance
SIM – State Innovation Models federal grant program
SMI – serious mental illness
SNAP – Supplemental Nutrition Assistance Program
SOR – State Opioid Response grant
SPA – State Plan Amendment
SSI – supplemental security income
STR – State Targeted Response to the Opioid Crisis grant
SUD – substance use disorder
SUPPORT Act – The Substance Use Disorder Prevention that Promotes Opioid Recovery and Treatment for Patients and Communities (SUPPORT) Act
TPL – third party liability
VBP – value-based purchasing
WIC – Special Supplemental Nutrition Program for Women, Infants, and Children
Appendix B: Survey Instrument
Download the Survey (.pdf)
Endnotes
- Centers for Medicare and Medicaid Services, National Health Expenditure Projections 2018 – 2027 (Washington, DC: Centers for Medicare and Medicaid Services, February 2019), https://www.cms.gov/Research-Statistics-Data-and-Systems/Statistics-Trends-and-Reports/NationalHealthExpendData/NationalHealthAccountsProjected.html. ↩︎
- Centers for Medicare and Medicaid Services, National Health Expenditure Projections 2018 – 2027 (Washington, DC: Centers for Medicare and Medicaid Services, February 2019), https://www.cms.gov/Research-Statistics-Data-and-Systems/Statistics-Trends-and-Reports/NationalHealthExpendData/NationalHealthAccountsProjected.html. ↩︎
- Brian Sigritz, Summaries of FY 2020 Budgets (Washington, DC: NASBO, September 7, 2019) http://budgetblog.nasbo.org/budgetblogs/blogs/brian-sigritz/2019/09/06/summaries-of-fy2020-budgets. ↩︎
- National Conference of State Legislatures, FY 2020 State Budget Status (Washington, DC: NCSL, July 26, 2019), http://www.ncsl.org/research/fiscal-policy/fy-2020-state-budget-status.aspx. ↩︎
- National Association of State Budget Officers, Most States Close Out Fiscal 2019 with Revenue Growth, (National Association of State Budget Officers Budget Blog, September 2019), http://budgetblog.nasbo.org/budgetblogs/blogs/brian-sigritz/2019/07/17/most-states-close-out-fiscal-2019-with-revenue-gro. ↩︎
- Kaiser Family Foundation, 50-State Medicaid Budget Survey Archives (Washington, DC: Kaiser Family Foundation, October 2019), https://modern.kff.org/medicaid/report/medicaid-budget-survey-archives/. ↩︎
- Maryland submitted a completed survey was unable to participate in a follow-up interview. ↩︎
- State fiscal years begin on July 1 except for these states: NY on April 1; TX on September 1; AL, MI and DC on October 1. ↩︎
- Larisa Antonisse and Robin Rudowitz, An Overview of State Approaches to Adopting the Medicaid Expansion (Washington, DC: Kaiser Family Foundation, February 27, 2019), https://modern.kff.org/medicaid/issue-brief/an-overview-of-state-approaches-to-adopting-the-medicaid-expansion/. ↩︎
- MaryBeth Musumeci, Robin Rudowitz, and Cornelia Hall, From Ballot Initiative to Waivers: What is the Status of Medicaid Expansion in Utah? (Washington, DC: Kaiser Family Foundation, September 23, 2019), https://modern.kff.org/medicaid/issue-brief/from-ballot-initiative-to-waivers-what-is-the-status-of-medicaid-expansion-in-utah/. ↩︎
- Utah submitted to CMS its “Per Capita Cap” proposal for a new waiver that would continue a number of provisions already approved as well as a request for the enhanced match for partial expansion and a limit on enhanced federal funding. CMS issued a general statement in late July 2019 and a letter to the state in August 2019 confirming that they would not authorize the enhanced federal match rate for any expansion group smaller than the entire adult expansion group up to 138% FPL. ↩︎
- Centers for Medicare and Medicaid Services, Letter to Utah Governor Herbert from CMS Administrator, Seema Verma (August 16, 2019), medicaid.gov/Medicaid-CHIP-Program-Information/By-Topics/Waivers/1115/downloads/ut/per-capita-cap/ut-per-capita-cap-correspondence-ltr-20190816.pdf. ↩︎
- The Governor said that the state plans to resubmit the application with additional information. CMS, however, specified that even a revised application would not be approved as it could not demonstrate compliance with the deficit neutrality guardrail. ↩︎
- Delaware and Hawaii had retroactive coverage waivers that pre-dated the ACA and may have been associated with achieving the budgetary savings necessary to expand coverage before federal law authorized the use of Medicaid funds for childless adults. ↩︎
- Not referenced in this bullet, in FY 2019, Connecticut increased the income limit from 155% FPL to 160% FPL for parent/caretakers. ↩︎
- Rachel Garfield, Robin Rudowitz, Kendal Orgera, and Anthony Damico, Understanding the Intersection of Medicaid and Work: What Does the Data Say? (Washington, DC: Kaiser Family Foundation, August 8, 2019), https://modern.kff.org/medicaid/issue-brief/understanding-the-intersection-of-medicaid-and-work-what-does-the-data-say/. ↩︎
- Rachel Garfield, Robin Rudowitz, Kendal Orgera, and Anthony Damico, Understanding the Intersection of Medicaid and Work: What Does the Data Say? (Washington, DC: Kaiser Family Foundation, August 8, 2019), https://modern.kff.org/medicaid/issue-brief/understanding-the-intersection-of-medicaid-and-work-what-does-the-data-say/. ↩︎
- Rachel Garfield, Robin Rudowitz, and MaryBeth Musumeci, Implications of a Medicaid Work Requirement: National Estimates of Potential Coverage Losses (Washington, DC: Kaiser Family Foundation, June 27, 2018), https://modern.kff.org/medicaid/issue-brief/implications-of-a-medicaid-work-requirement-national-estimates-of-potential-coverage-losses/. ↩︎
- Wisconsin’s Section 1115 waiver covers childless adults ages 19 to 64 with income up to 100% FPL, without ACA enhanced matching funds. The state has an approved work and reporting requirement waiver for this population. The state plans to implement this provision as soon as CMS approves their implementation plan and when funding is made available for work supports. ↩︎
- In a letter dated September 25, 2019 from the Virginia Secretary of Health and Human Resources to the CMS Administrator, the state indicates it would be unable to move forward with implementation of the work and community engagement requirements without full federal funding for employment supports (requested in its pending Section 1115 waiver application). ↩︎
- MaryBeth Musumeci and Chelsea Rice, Ask KFF: Marybeth Musumeci Answers 3 Questions on Kentucky and Arkansas Medicaid Work and Reporting Requirement Cases, (Washington, DC: Kaiser Family Foundation, April 2, 2019), https://modern.kff.org/medicaid/issue-brief/ask-kff-marybeth-musumeci-answers-3-questions-on-kentucky-arkansas-medicaid-work-and-reporting-requirement-cases/ ↩︎
- Robin Rudowitz, MaryBeth Musumeci, and Cornelia Hall, February State Data for Medicaid Work Requirements in Arkansas (Washington, DC: Kaiser Family Foundation, March 25, 2019), https://modern.kff.org/medicaid/issue-brief/state-data-for-medicaid-work-requirements-in-arkansas/ ↩︎
- Previously, in July 2019, New Hampshire enacted legislation that allowed for the suspension of the work requirement’s implementation up to but not after July 1, 2021, and suspended the work requirement through September 30, 2019. ↩︎
- Government Accountability Office, Actions Needed to Address Weaknesses in Oversight of Costs to Administer Work Requirements (Washington, DC: U.S. Government Accountability Office, October 10, 2019), https://www.gao.gov/products/GAO-20-149 ↩︎
- Tricia Brooks, Lauren Roygardner, and Samantha Artiga, Medicaid and CHIP Eligibility, Enrollment, and Cost Sharing Policies as of January 2019: Findings from a 50-State Survey (Washington, DC: Kaiser Family Foundation, March 2019), https://modern.kff.org/medicaid/report/medicaid-and-chip-eligibility-enrollment-and-cost-sharing-policies-as-of-january-2019-findings-from-a-50-state-survey/view/footnotes/ ↩︎
- Louisiana did not report data in the 2019 Kaiser Family Foundation Medicaid Budget Survey so data from the 2017 survey was used for this analysis. ↩︎
- Alexandra Gates, Samantha Artiga, and Robin Rudowitz, Health Coverage and Care for the Adult Criminal Justice Population, (Washington, DC: Kaiser Family Foundation, September 5, 2014), https://modern.kff.org/uninsured/issue-brief/health-coverage-and-care-for-the-adult-criminal-justice-involved-population/ ↩︎
- Two states did not report: MD, SD ↩︎
- MaryBeth Musumeci, and Jennifer Tolbert, Federal Legislation to Address the Opioid Crisis: Medicaid Provisions in the SUPPORT Act (Washington, DC, Kaiser Family Foundation, October 2018) https://modern.kff.org/medicaid/issue-brief/federal-legislation-to-address-the-opioid-crisis-medicaid-provisions-in-the-support-act/ ↩︎
- Connecticut does not have capitated managed care arrangements, but does carry out many managed care functions, including ASO arrangements, payment incentives based on performance, intensive care management, community workers, educators, and linkages with primary care practices. ↩︎
- Vermont runs a public, non-risk bearing prepaid health plan delivery model under its Section 1115 Global Commitment to Health waiver. In FY 2019, Vermont ended its PCCM program (operated within the waiver) but continues to promote increased participation in the Vermont All-Payer Accountable Care Organization (ACO) model. In CY 2019, approximately 47% of Medicaid enrollees receive services under the ACO model. ↩︎
- In addition to furnishing basic PCCM services, PCCM entities also provide other services such as intensive case management, provider contracting or oversight, enrollee outreach, and/or performance measurement and quality improvement. 42 CFR §438.2. ↩︎
- South Carolina uses PCCM authority to provide care management services to medically complex children but is not counted as a PCCM program for purposes of this report. ↩︎
- Centers for Medicare and Medicaid Services, Medicaid & CHIP Monthly Application, Eligibility Determinations, and Enrollment Reports, (Washington, DC: Centers for Medicare and Medicaid Services, June 2019), https://www.medicaid.gov/medicaid/program-information/medicaid-and-chip-enrollment-data/monthly-reports/index.html. ↩︎
- Maryland reported the MCO penetration rate for all beneficiaries but did not report penetration rates for the individual eligibility categories so penetration rates that the state reported in the 2018 survey were used for this analysis. ↩︎
- Arkansas began an MCO program in FY 2019, but it does not enroll expansion adults. The five Medicaid expansion states without risk-based managed care were Alaska, Connecticut, Maine, Montana, and Vermont. ↩︎
- Massachusetts reported covering 48% of expansion adults in MCOs and Arkansas began an MCO program in FY 2019, but it does not enroll expansion adults. Utah implemented a partial expansion to 100% in FY 2019 (without ACA enhanced matching funds) and reported covering approximately 13% of this population in MCOs, but is not included as a ACA Medicaid expansion state here. ↩︎
- In April 2016, CMS issued a final rule on managed care in Medicaid and CHIP that provided a framework of plan standards and requirements designed to improve the quality, performance, and accountability of these programs. The current administration proposed changes to the final rule in November 2018, however, these have not yet been finalized. ↩︎
- New Mexico reported eliminating the use of quality metrics in its auto-assignment algorithm in its MCO contracts effective December 31, 2018. ↩︎
- National Association of Medicaid Directors, Medicaid Value-Based Purchasing: What Is It & Why Does It Matter? (Washington, DC: National Association of Medicaid Directors, January 2017), http://medicaiddirectors.org/wp-content/uploads/2017/01/Snapshot-2-VBP-101_FINAL.pdf. ↩︎
- For more information on the State Innovation Models (SIM) initiative, see: https://innovation.cms.gov/initiatives/state-innovations/. ↩︎
- Health Care Payment Learning & Action Network, Alternative Payment Model (APM) Framework, Fact Sheet; accessed at http://hcp-lan.org/workproducts/apm-factsheet.pdf. CMS launched the LAN in 2015 to encourage alignment across public and private sector payers by providing a forum for sharing best practices and developing common approaches to designing and monitoring of APMs, as well as by developing evidence on the impact of APMs. ↩︎
- CMCS Information Bulletin, Medicaid Managed Care Regulations with July 1, 2017 Compliance Dates (Baltimore, MD: Centers for Medicare and Medicaid Services, June 30, 2017), https://www.medicaid.gov/federal-policy-guidance/downloads/cib063017.pdf. ↩︎
- DC does not require MLR remittances, but if an MCO’s MLR falls below 85%, they are required to study what has caused the MLR to fall below 85% and take corrective action. DC has discretion to require the MCO to pay a civil monetary penalty for failing to provide covered services, including failing to adhere to acceptable financial practices and standards for operating an MCO. ↩︎
- One of the 28 states reporting a PHP arrangement that is not included in Exhibit 12 is Alabama, which reported having a PHP for maternity care. ↩︎
- Samantha Artiga and Elizabeth Hinton, Beyond Health Care: The Role of Social Determinants in Promoting Health and Health Equity (Washington, DC: Kaiser Family Foundation), https://modern.kff.org/disparities-policy/issue-brief/beyond-health-care-the-role-of-social-determinants-in-promoting-health-and-health-equity/ ↩︎
- Centers for Medicare and Medicaid Services, CMS’ Accountable Health Communities Model selects 32 participants to serve as local “hubs”, (Baltimore, MD: Centers for Medicare and Medicaid Services, April 2017), https://www.cms.gov/Newsroom/MediaReleaseDatabase/Press-releases/2017-Press-releases-items/2017-04-06.html. ↩︎
- Centers for Medicare and Medicaid Services, The Accountable Health Communities Health-Related Social Needs Screening Tool, https://innovation.cms.gov/Files/worksheets/ahcm-screeningtool.pdf. ↩︎
- Centers for Medicare and Medicaid Services, Accountable Health Communities Model, https://innovation.cms.gov/initiatives/ahcm/ (accessed on September 9, 2019). ↩︎
- MD and MI did not report on “Provide enrollees with referrals to social services”; MD did not report on the “Screen enrollees for social needs”; MD did not report on “Partner with community-based organizations or social service providers”; MD did not report on “Employ community health works”; IA, MD, NY did not report on “Track the outcome of referrals to social services; MD, NY did not report on “Encourage or require providers to capture social determinants of health data using ICD-10 Z codes*”. ↩︎
- Healthcare professionals use “ICD-10” diagnosis and inpatient procedure codes to identify and document health conditions in a patient’s electronic health record and for billing purposes. The ICD-10 also includes an expanded set of codes reflecting social characteristics in the form of “Z codes.” For example, Z59.9 is “problem related to housing and economic circumstances unspecified.” ↩︎
- State of Michigan, Sample Medicaid Managed Care Contract, accessed October 10, 2019. https://www.michigan.gov/documents/contract_7696_7.pdf see page 65. ↩︎
- North Carolina Department of Health and Human Services, “NCCARE360”, accessed October 10, 2019. https://www.ncdhhs.gov/about/department-initiatives/healthy-opportunities/nccare360 ↩︎
- Elizabeth Hinton, Samantha Artiga, MaryBeth Musumeci, and Robin Rudowitz, A First Look at North Carolina’s Section 1115 Medicaid Waiver’s Healthy Opportunities Pilots (Washington, DC: Kaiser Family Foundation, May 15, 2019), https://modern.kff.org/medicaid/issue-brief/a-first-look-at-north-carolinas-section-1115-medicaid-waivers-healthy-opportunities-pilots/ ↩︎
- Montana House Bill 599 (signed by Governor May 9, 2019), https://leg.mt.gov/bills/2019/billpdf/HB0599.pdf. ↩︎
- Agency for Healthcare Research and Quality, Pathways Community HUB Manual, (Rockville, MD: Agency for Healthcare Research and Quality, HHS, January 2016), https://innovations.ahrq.gov/sites/default/files/Guides/CommunityHubManual.pdf ↩︎
- Kaiser Family Foundation, How Connecting Justice-Involved Individuals to Medicaid Can Help Address the Opioid Epidemic (Washington, DC: Kaiser Family Foundation, June 2019), https://modern.kff.org/medicaid/issue-brief/how-connecting-justice-involved-individuals-to-medicaid-can-help-address-the-opioid-epidemic/. ↩︎
- In this year’s survey, Georgia and Maryland did not report policies related to care coordination prior to release from incarceration in FFS or Medicaid managed care. Michigan and New Hampshire did not report policies related to care coordination prior to release in Medicaid Managed care. ↩︎
- National Committee on Quality Assurance, “Patient-Centered Medical Home Recognition,” Accessed October 10, 2019. http://www.ncqa.org/Programs/Recognition/Practices/PatientCenteredMedicalHomePCMH.aspx. ↩︎
- Kaiser Commission on Medicaid and the Uninsured, Medicaid Delivery System and Payment Reform: A Guide to Key Terms and Concepts (Washington, DC: Kaiser Commission on Medicaid and the Uninsured, June 2015), http://kff.org/medicaid/fact-sheet/medicaid-delivery-system-and-payment-reform-a-guide-to-key-terms-and-concepts/. ↩︎
- Kaiser Commission on Medicaid and the Uninsured, Medicaid Delivery System and Payment Reform: A Guide to Key Terms and Concept (Washington, DC: Kaiser Commission on Medicaid and the Uninsured, June 2015), http://kff.org/medicaid/fact-sheet/medicaid-delivery-system-and-payment-reform-a-guide-to-key-terms-and-concepts/. ↩︎
- Colorado Department of Health Care Policy and Financing, “Accountable Care Collaborative Phase II,” Accessed October, 10 2019. https://www.colorado.gov/pacific/hcpf/accphase2. ↩︎
- Alexandra Gates, Robin Rudowitz, and Jocelyn Guyer, An Overview of Delivery System Reform Incentive Payment (DSRIP) Waivers (Washington, DC, Kaiser Commission on Medicaid and the Uninsured, September 2014), https://modern.kff.org/report-section/findings-from-the-field-medicaid-delivery-systems-and-access-to-care-in-four-states-in-year-three-of-the-aca-issue-brief/. ↩︎
- In this report, Oregon’s Coordinated Care Organization (CCO) program is counted as an MCO program, but not as an ACO program, consistent with its CMS designation and the state’s survey response. According to the state, “A coordinated care organization is a network of all types of health care providers (physical health care, addictions and mental health care and sometimes dental care providers) who have agreed to work together in their local communities to serve people who receive health care coverage under the Oregon Health Plan (Medicaid).” (Oregon Health Authority website accessed at: http://www.oregon.gov/oha/HPA/Pages/CCOs-Oregon.aspx.) ↩︎
- Connecticut Department of Social Services, “Person-Centered Medical Home Plus (PCMH+)” Accessed October 10, 2019. https://portal.ct.gov/dss/Health-and-Home-Care/PCMH-Plus. ↩︎
- Consumer Assessment of Healthcare Providers and Systems ↩︎
- Centers for Disease Control and Prevention, Pregnancy Mortality Surveillance System (Atlanta, GA: CDC, June, 2019), https://www.cdc.gov/reproductivehealth/maternalinfanthealth/pregnancy-mortality-surveillance-system.htm?CDC_AA_refVal=https%3A%2F%2Fwww.cdc.gov%2Freproductivehealth%2Fmaternalinfanthealth%2Fpmss.html. ↩︎
- Martin JA, Hamilton BE, Osterman MJK., Births in the United States, 2017 (Hyattsville, MD: Centers for Disease Control and Prevention, National Center for Health Statistics, August 2018), https://www.cdc.gov/nchs/data/databriefs/db318.pdf ↩︎
- Medicaid and CHIP Payment and Access Commission, Access in Brief: Pregnant Women and Medicaid, November 2018 Issue Brief; accessed at https://www.macpac.gov/wp-content/uploads/2018/11/Pregnant-Women-and-Medicaid.pdf. ↩︎
- CO, IN, LA, ME, MI, MO, NH, OH, TN, TX, WV ↩︎
- Also, Florida reported that its MCOs offered a number of value-added services for pregnant women including doula services and expanded dental benefits; Indiana reported that a new state “OB Navigator” program will identify women early in their pregnancies, especially Medicaid enrollees, and connect them to home visiting programs; and Pennsylvania reported plans to require its MCOs to coordinate with existing evidenced-base home visiting programs. ↩︎
- Amy Chen, Q&A on Pregnant Women’s Coverage Under Medicaid and the ACA, (Washington, DC: National Health Law Program, September 5, 2018) https://healthlaw.org/resource/qa-on-pregnant-womens-coverage-under-medicaid-and-the-aca/. ↩︎
- Illinois has an approved Section 1115 Waiver to cover evidence-based home visiting services under a pilot program, including postpartum home visits and child home visits to postpartum mothers who gave birth to a baby born with withdrawal symptoms. Implementation is planned for FY 2020. ↩︎
- Texas expanded coverage of telemedicine services to occupational therapy and speech-language pathology provided in a school-based setting in FY 2019. ↩︎
- Minnesota added coverage of telemedicine services provided by community health workers in FY 2020. ↩︎
- Centers for Medicare and Medicaid Services, Medicaid Opportunities in the Emergency Triage, Treat, and Transport (ET3) Model (Baltimore, MD: CMS, August 8, 2019), https://www.medicaid.gov/federal-policy-guidance/downloads/cib080819-3.pdf. ↩︎
- Centers for Medicare and Medicaid Services, State Guidance for Implementation of the Treatment for Infants with Neonatal Abstinence Syndrome in Residential Pediatric Recovery Centers Provisions of Section 1007 of Pub. L. 115-271, the Substance Use-Disorder Prevention that Promotes Opioid Recovery and Treatment (SUPPORT) for Patients and Communities Act (Baltimore, MD: CMS, July 26, 2019), https://www.medicaid.gov/federal-policy-guidance/downloads/cib072619-1007.pdf. ↩︎
- Centers for Medicare and Medicaid Services, State Guidance for Implementation of the Treatment for Infants with Neonatal Abstinence Syndrome in Residential Pediatric Recovery Centers Provisions of Section 1007 of Pub. L. 115-271, the Substance Use-Disorder Prevention that Promotes Opioid Recovery and Treatment (SUPPORT) for Patients and Communities Act (Baltimore, MD: CMS, July 26, 2019), https://www.medicaid.gov/federal-policy-guidance/downloads/cib072619-1007.pdf. ↩︎
- CMS, West Virginia State Plan Amendment #17-0004, https://www.medicaid.gov/State-resource-center/Medicaid-State-Plan-Amendments/Downloads/WV/WV-17-004.pdf. ↩︎
- In FY 2019 Nevada imposed prior authorization requirements for Magnetic Resonance Imaging (MRI), Magnetic Resonance Angiography (MRA), Magnetic Resonance Spectroscopy (MRS), and Positron Emission Tomography. (PET) scan services. In FY 2020 it eliminated the new prior authorization requirements because the administrative cost did not outweigh the savings. ↩︎
- Julia Paradise, Medicaid Moving Forward (Washington, DC: Kaiser Commission on Medicaid and the Uninsured, March 2015), http://kff.org/health-reform/issue-brief/medicaid-moving-forward/. ↩︎
- Samantha Artiga, Petry Ubri, and Julia Zur, The Effects of Premiums and Cost Sharing on Low-Income Populations: Updated Review of Research Findings (Washington, DC: Kaiser Family Foundation, June 1, 2017), https://modern.kff.org/medicaid/issue-brief/the-effects-of-premiums-and-cost-sharing-on-low-income-populations-updated-review-of-research-findings/. ↩︎
- Colorado General Assembly, Senate, Concerning Wholesale Importation of Prescription Pharmaceutical Products from Canada for Resale to Colorado Residents, and, In Connection Therewith, Making an Appropriation, SB 19-005, introduced January 4, 2019, https://leg.colorado.gov/bills/sb19-005. ↩︎
- Substance Abuse and Mental Health Services Administration (SAMHSA), 2016 National Survey on Drug Use and Health: Detailed Tables (Rockville, MD: SAMHSA, September 2017), https://www.samhsa.gov/data/sites/default/files/NSDUH-DetTabs-2016/NSDUH-DetTabs-2016.pdf. ↩︎
- “Understanding the Epidemic,” Centers for Disease Control and Prevention, accessed on September 8, 2019, https://www.cdc.gov/drugoverdose/epidemic/index.html. ↩︎
- Holly Hedegaard, Arialdi M. Miniño, and Margaret Warner, Drug Overdose Deaths in the United States, 1999–2017, (Hyattsville, MD: Center for Disease Control and Prevention, National Center for Health Statistics, November 2018), https://www.cdc.gov/nchs/data/databriefs/db329-h.pdf. ↩︎
- Centers for Disease Control and Prevention, “Understanding the Epidemic,” accessed on September 8, 2019, https://www.cdc.gov/drugoverdose/epidemic/index.html. ↩︎
- Kaiser Family Foundation, Medicaid’s Role in Addressing the Opioid Epidemic (Washington, DC: Kaiser Family Foundation, June 3, 2019), https://modern.kff.org/infographic/medicaids-role-in-addressing-opioid-epidemic/. ↩︎
- Centers for Medicare and Medicaid Services, New Service Delivery Opportunities for Individuals with a Substance Use Disorder (Baltimore, MD: CMS, July 2015), https://www.medicaid.gov/federal-policy-guidance/downloads/SMD15003.pdf. ↩︎
- Centers for Medicare and Medicaid Services, Strategies to Address the Opioid Epidemic (Baltimore, MD: CMS, November 2017), https://www.medicaid.gov/federal-policy-guidance/downloads/smd17003.pdf. ↩︎
- MaryBeth Musumeci and Jennifer Tolbert, Federal Legislation to Address the Opioid Crisis: Medicaid Provisions in the SUPPORT Act (Washington, DC: Kaiser Family Foundation, October 2018), https://modern.kff.org/medicaid/issue-brief/federal-legislation-to-address-the-opioid-crisis-medicaid-provisions-in-the-support-act/. ↩︎
- In 2016, the Centers for Disease Control and Prevention (CDC) published recommendations for prescribing opioids for chronic pain outside of active cancer treatment, palliative care, and end-of-life care. The guidelines address matters such as when to initiate or continue opioids, opioid dosage and duration, and mitigating patient risk factors. Many states have adopted the CDC guidelines or have developed their own opioid prescribing guidelines. ↩︎
- Prospective drug utilization review activities include screening prescription drug claims to identify potential problems related to opioid abuse and overdose risk (e.g., alerts regarding early refills, prescriptions in excess of drug quantity limitations, concurrent utilization of opioids and benzodiazepines) and includes hard and soft safety edits at the point-of-sale. ↩︎
- Step therapy prior authorization criteria involves requiring the use of another agent or therapy prior to the use of a specific opioid. ↩︎
- Retrospective drug utilization examines paid prescription drug claims to identify patterns of fraud, abuse, or misuse. ↩︎
- Prescription Drug Monitoring Programs (PDMPs) are state-run electronic databases that are valuable tools for addressing prescription drug diversion and abuse. Currently, except for Missouri, every state and the District of Columbia operates a PDMP. ↩︎
- Drug lock-in programs restrict beneficiaries to a single prescriber and/or pharmacy when utilization of medical or pharmacy services is identified as excessive or potentially fraudulent. ↩︎
- Centers for Medicaid and CHIP Services, State Guidance for Implementation of Medicaid Drug Utilization Review (DUR) provisions included in Section 1004 of the Substance Use-Disorder Prevention that Promotes Opioid Recovery and Treatment for Patients and Communities Act (Baltimore, MD: Centers for Medicare and Medicaid Services, August 5, 2019), https://www.medicaid.gov/federal-policy-guidance/downloads/cib080519-1004.pdf. ↩︎
- Frequently Asked Questions: SUPPORT for Patients and Communities Act, Section 5042 – Medicaid PARTNERSHIP Act, https://www.medicaid.gov/federal-policy-guidance/downloads/faq051519.pdf. ↩︎
- Substance Abuse and Mental Health Services Administration, “Medication-Assisted Treatment (MAT),” (Substance Abuse and Mental Health Services Administration, last updated 02/07/2018), https://www.samhsa.gov/medication-assisted-treatment. ↩︎
- The Pew Charitable Trusts, Medication-Assisted Treatment Improves Outcomes for Patients With Opioid Use Disorder (Washington, DC: The Pew Charitable Trusts, November 2016), http://www.pewtrusts.org/en/research-and-analysis/fact-sheets/2016/11/medication-assisted-treatment-improves-outcomes-for-patients-with-opioid-use-disorder. ↩︎
- Substance Abuse and Mental Health Services Administration, “Medication-Assisted Treatment (MAT),” Substance Abuse and Mental Health Services Administration, last updated 02/07/2018, https://www.samhsa.gov/medication-assisted-treatment. ↩︎
- Naltrexone does not carry abuse or diversion potential, and any provider licensed to prescribe medications can prescribe naltrexone. However, to prescribe or dispense buprenorphine, physicians must obtain a “waiver”. This process involves 1) registering with the Drug Enforcement Administration (DEA) to dispense controlled substances; 2) certifying intent to treat no more than 30 patients at one time in the first year; and 3) receipt of required training or certification. Physicians may apply to increase the allowable patient caseload, and if approved may treat up to 100 patients in their first year and up to 275 patients in subsequent years. Methadone may only be dispensed by opioid treatment programs certified by the Substance Abuse and Mental Health Services Administration (SAMHSA). Opioid treatment programs may also dispense buprenorphine. ↩︎
- Some states interviewed in this year’s survey expressed concerns that the SUPPORT Act requires coverage of non-rebatable drugs and are awaiting federal guidance on the topic. ↩︎
- Kaiser Family Foundation, Medicaid’s Role in Addressing the Opioid Epidemic (Washington, DC: Kaiser Family Foundation, June 3, 2019), https://modern.kff.org/infographic/medicaids-role-in-addressing-opioid-epidemic/. ↩︎
- Substance Abuse and Mental Health Services Administration, “Naltrexone”, last updated 05/07/19, https://www.samhsa.gov/medication-assisted-treatment/treatment/naltrexone. ↩︎
- 43 states include: 33 states reporting use of in lieu authority in FY 2019 and FY 2020 or just FY 2020 (see Table 9); 8 states with SUD waivers that did not report using in lieu of authority in FY 2020 (AK, CA, KS, MD, NM, PA, VT, WV); and 2 additional states not included in two cohorts above that plan to utilize the SPA option in 2020 (ID, SD). ↩︎
- 81 FR 27497, available at: https://www.gpo.gov/fdsys/granule/FR-2016-05-06/2016-09581. ↩︎
- CMS, SMD #15-003, New Service Delivery Opportunities for Individuals with a Substance Use Disorder (July 27, 2015), https://www.medicaid.gov/federal-policy-guidance/downloads/SMD15003.pdf. ↩︎
- CMS, SMD #17-003, Strategies to Address the Opioid Epidemic (Nov. 1, 2017), https://www.medicaid.gov/federal-policy-guidance/downloads/smd17003.pdf. ↩︎
- Kaiser Family Foundation, “Medicaid Waiver Tracker: Approved and Pending Section 1115 Waivers by State”, last updated October 9, 2019, https://modern.kff.org/medicaid/issue-brief/medicaid-waiver-tracker-approved-and-pending-section-1115-waivers-by-state/. ↩︎
- CMS, SMD #18-011, Opportunities to Design Innovative Service Delivery Systems for Adults with a Serious Mental Illness or Children with a Serious Emotional Disturbance (Nov. 13, 2018), https://www.medicaid.gov/federal-policy-guidance/downloads/smd18011.pdf. ↩︎
- MaryBeth Musumeci and Jennifer Tolbert, Federal Legislation to Address the Opioid Crisis: Medicaid Provisions in the SUPPORT Act (Washington, DC: Kaiser Family Foundation, October 5, 2018), https://modern.kff.org/medicaid/issue-brief/federal-legislation-to-address-the-opioid-crisis-medicaid-provisions-in-the-support-act/. ↩︎
- H.R. 6, § 1012; see also CMCS Informational Bulletin, State Guidance for the New Limited Exception to the IMD Exclusion for Certain Pregnant and Postpartum Women included in Section 1012 of the Substance Use-Disorder Prevention that Promotes Opioid Recovery and Treatment (SUPPORT) for Patients and Communities Act (Pub. L. 115-271), entitled Help for Moms and Babies (July 26, 2019), https://www.medicaid.gov/federal-policy-guidance/downloads/cib072619-1012.pdf. ↩︎
- These states (NM, WV) may have discontinued use of Medicaid managed care “in lieu of” authority in FY 2020 due to approval/implementation of Section 1115 IMD SUD waivers. ↩︎
- As of October 2019, DC, IN, and VT have submitted Section 1115 IMD waivers for services for individuals with SMI or SED. ↩︎
- MD did not report. ↩︎
- Kaiser Family Foundation, “Medicaid Waiver Tracker: Approved and Pending Section 1115 Waivers by State”, last updated October 9, 2019, https://modern.kff.org/medicaid/issue-brief/medicaid-waiver-tracker-approved-and-pending-section-1115-waivers-by-state/. ↩︎
- MD did not report. ↩︎
- MaryBeth Musumeci, Priya Chidambaram, and Molly O’Malley Watts, Medicaid Home and Community-Based Services Enrollment and Spending (Washington, DC: Kaiser Family Foundation, April 4, 2019), https://modern.kff.org/report-section/medicaid-home-and-community-based-services-enrollment-and-spending-issue-brief/. ↩︎
- 22 of the 25 capitated MLTSS states report using rebalancing incentives in their managed care contracts. One additional state, Alabama, reports building rebalancing incentives in its managed FFS MLTSS contract. ↩︎
- Molly O’Malley Watts, MaryBeth Musumeci, and Petry Ubri, Medicaid Section 1115 Managed Long-Term Services and Supports Waivers: A Survey of Enrollment, Spending an Program Policies, (Washington, DC: Kaiser Family Foundation, January 2017), http://modern.kff.org/medicaid/report/medicaid-section-1115-managed-long-term-services-and-supports-waivers-a-survey-of-enrollment-spending-and-program-policies/. ↩︎
- U.S. Senate Commission on Long-Term Care, Report to the Congress, (U.S. Senate Commission on Long-Term Care, September 2013), https://www.gpo.gov/fdsys/pkg/GPO-LTCCOMMISSION/pdf/GPO-LTCCOMMISSION.pdf. ↩︎
- US Department of Health and Human Services, Long-Term Services and Supports: Direct Care Worker Demand Projections 2015-2030 (Health Resources and Services Administration Bureau of Health Workforce, US Department of Health and Human Services, March 2018), https://bhw.hrsa.gov/sites/default/files/bhw/nchwa/projections/hrsa-ltts-direct-care-worker-report.pdf. ↩︎
- MaryBeth Musumeci and Molly O’Malley Watts, Lessons Learned from Eight Years of Supporting Institutional to Community Transitions Through Medicaid’s Money Follows the Person Demonstration (Washington, DC: Kaiser Family Foundation, October 16, 2015), https://modern.kff.org/medicaid/perspective/lessons-learned-from-eight-years-of-supporting-institutional-to-community-transitions-through-medicaids-money-follows-the-person-demonstration/. ↩︎
- Center for Medicaid and CHIP Services Informational Bulletin, Coverage of Housing-Related Activities and Services for Individuals with Disabilities (June 26, 2015) https://www.medicaid.gov/federal-policy-guidance/downloads/cib-06-26-2015.pdf. ↩︎
- Center for Medicaid and CHIP Services Informational Bulletin, Coverage of Housing-Related Activities and Services for Individuals with Disabilities (June 26, 2015) https://www.medicaid.gov/federal-policy-guidance/downloads/cib-06-26-2015.pdf. ↩︎
- Elizabeth Hinton, Samantha Artiga, Mary Beth Musumeci, and Robin Rabinowitz, A First Look at North Carolina’s Section 1115 Medicaid Waiver’s Healthy Opportunity Pilots (Kaiser Family Foundation, May 15, 2019 ) https://modern.kff.org/report-section/a-first-look-at-north-carolinas-section-1115-medicaid-waivers-healthy-opportunities-pilots-issue-brief/. ↩︎
- Oregon is not included in this count. The state terminated its MFP program, effective June 30, 2015. ↩︎
- H. Stephen Kaye, Ph.D., Evidence for the Impact of the Money Follows the Person Program, Community Living Policy Center, Lurie Institute for Disability Policy, Brandeis University, July 2019) https://clpc.ucsf.edu/sites/clpc.ucsf.edu/files/reports/Evidence%20for%20the%20Impact%20of%20MFP_0.pdf ↩︎
- Most of these states are using current Section 1915(c) waivers that provide community transition services and environmental modifications for seniors, individuals with physical disabilities and/or individuals with I/DD , and some states offer housing coordinators or other search services to assist waiver beneficiaries. ↩︎
- Mathematica Policy Research, Money Follows the Person 2015 Annual Evaluation Report, (Submitted to U.S. Department of Health and Human Services Centers for Medicare & Medicaid Services, May 11, 2017) https://www.medicaid.gov/medicaid/ltss/downloads/money-follows-the-person/mfp-2015-annual-report.pdf ↩︎
- After December 2019, with CMS approval, states will have four years in which to expend remaining MFP funds absent additional Federal action to reauthorize the program. ↩︎
- One MFP state (MD) did not report. ↩︎
- The Affordable Care Act (ACA) authorized the Secretary of Health and Human Services to implement the Financial Alignment Initiative to allow state-administered demonstration projects to improve the integration and coordination of services for individuals who are covered under both Medicare and Medicaid. This population, as a group, experiences high rates of hospitalization and use of LTSS and is, on average, a high need, high cost population. See: https://www.cms.gov/Medicare-Medicaid-Coordination/Medicare-and-Medicaid-Coordination/Medicare-Medicaid-Coordination-Office/FinancialAlignmentInitiative/FinancialModelstoSupportStatesEffortsinCareCoordination.html.. ↩︎
- Kaiser Commission on Medicaid and the Uninsured, Health Plan Enrollment in the Capitated Financial Alignment Demonstrations for Dual Eligible Beneficiaries (Washington, DC: Kaiser Commission on Medicaid and the Uninsured, August 2016), http://kff.org/medicaid/fact-sheet/health-plan-enrollment-in-the-capitated-financial-alignment-demonstrations-for-dual-eligible-beneficiaries/. ↩︎
- CMS, SMD #19-002, Three New Opportunities to Test Innovative Models of Integrated Care for Individual’s Dually Eligible for Medicaid and Medicare (April 24, 2019), https://www.medicaid.gov/federal-policy-guidance/downloads/smd19002.pdf. ↩︎
- CMS, SMD #19-002, Three New Opportunities to Test Innovative Models of Integrated Care for Individual’s Dually Eligible for Medicaid and Medicare (April 24, 2019), https://www.medicaid.gov/federal-policy-guidance/downloads/smd19002.pdf. ↩︎
- Edith G. Walsh, Financial Alignment Initiative Washington Health Home MFFS Demonstration: Third Evaluation Report (RTI International, Waltham MA for Centers for Medicare & Medicaid Services Center for Medicare & Medicaid Innovation, August 2019) https://www.cms.gov/Medicare-Medicaid-Coordination/Medicare-and-Medicaid-Coordination/Medicare-Medicaid-Coordination-Office/FinancialAlignmentInitiative/Downloads/WAEvalReport3.pdf. ↩︎
- Ibid, CMS SMD #19-002, April 24, 2019. ↩︎
- Arizona, Hawaii, Idaho, Massachusetts, Minnesota, New Mexico, Pennsylvania, Tennessee, Texas, Virginia, Wisconsin (WI Partnership MCOs are required to contract with FIDE plans, not Family Partnership PHPs). ↩︎
- Dual Eligible Special Needs Plans (D-SNPs) enroll beneficiaries who are entitled to both Medicare and Medicaid and offer the opportunity to better coordinate benefits among Medicare and Medicaid. For more information see: https://www.cms.gov/Medicare/Health-Plans/SpecialNeedsPlans/DualEligibleSNP.html. ↩︎
- Fully Integrated Dual Eligible SNPs were created by Congress in Section 3205 of the Affordable Care Act to promote full integration and coordination of Medicaid and Medicare benefits for dual eligible beneficiaries by a single managed care organization. They must have a MIPPA compliant contract with a State Medicaid Agency that includes coverage of specified primary, acute and long-term care benefits and services under risk-based financing. For more information see: https://www.cms.gov/Medicare/Health-Plans/SpecialNeedsPlans/DualEligibleSNP.html#s3. ↩︎
- CMS, SMD # 18-012, Ten Opportunities to Better Serve Individuals Dually Eligible for Medicaid and Medicare (December 19, 2018), https://www.medicaid.gov/federal-policy-guidance/downloads/smd18012.pdf. ↩︎
- In one of the following HCBS waivers: Supportive Living Program, Persons with Disabilities, Persons with HIV or AIDS, Persons with Brain Injury, and Persons who are Elderly. ↩︎
- TennCare II Demonstration, Amendment 40, Draft for Public Review, August 5, 2019. https://www.tn.gov/content/dam/tn/tenncare/documents2/Amendment40.pdf. ↩︎
- Tennessee is the only state that didn’t indicate any provider rate increases in FY 2019; the state also did not report any rate cuts (although freezes count as a restriction in this survey). Because the Tennessee Medicaid program is 100% managed care, it is not clear how this affects rates to providers in managed care. ↩︎
- Historically, Medicaid reimbursement for hospitals and nursing homes was cost-based, automatically reflecting incurred cost increases. When rates for these providers are frozen, such annual increases do not occur; hence for this report, rate freezes are counted as restrictions. ↩︎
- New Hampshire was not able to report MCO rate changes for FY 2020 due to lack of a budget for FY 2020. ↩︎
- Some states also have premium or claims taxes that apply to managed care organizations and other insurers. Since this type of tax is not considered a provider tax by CMS, these taxes are not counted as provider taxes in this report. ↩︎
- California has had an MCO tax for several years. That tax expired on June 30, 2019, so the state is seeking a new one which will be retroactive to July 1, 2019. ↩︎
- The Deficit Reduction Act of 2005 modified section 1903(w)(7)(A) of the Social Security Act. This statute and the implementing regulations eliminated states’ ability to tax only Medicaid MCOs. ↩︎
- MaryBeth Musumeci, Explaining Texas v. U.S.: A Guide to the 5th Circuit Appeal in the Case Challenging the ACA (Washington, DC: Kaiser Family Foundation, June 3, 2019), https://modern.kff.org/health-reform/issue-brief/explaining-texas-v-u-s-a-guide-to-the-5th-circuit-appeal-in-the-case-challenging-the-aca/. ↩︎
- Kaiser Family Foundation, 50-State Medicaid Budget Survey Archives, (Washington, DC: Kaiser Family Foundation, October 2019), https://modern.kff.org/medicaid/report/medicaid-budget-survey-archives/. ↩︎
- State fiscal years begin July 1 except for these states: NY on April 1; TX on September 1; AL, MI and DC on October 1. ↩︎
- Maryland submitted a completed survey was unable to participate in a follow-up interview. ↩︎