KFF designs, conducts and analyzes original public opinion and survey research on Americans’ attitudes, knowledge, and experiences with the health care system to help amplify the public’s voice in major national debates.
The Centers for Medicare and Medicaid Services (CMS) rates the relative quality of the private plans that are offered to Medicare beneficiaries through the Medicare Advantage program as a way of aiding beneficiaries who are considering enrolling in such a private plan. CMS rates Medicare Advantage plans on a one to five-star scale, with five stars representing the highest quality.
This analysis by Kaiser Family Foundation researchers finds that quality ratings vary by plan characteristics. For example:
Private Fee-For-Service plans and regional Preferred Provider Organizations (PPOs) have below average ratings — significantly lower than HMOs and local PPOs.
Non-profit plans have significantly higher average ratings than for-profit plans.
More experienced plans (with contracts beginning before 2004) have higher ratings than newer ones.
Average quality ratings also vary widely among the largest organizations offering Medicare Advantage plans.
Overall, nearly one in four Medicare Advantage enrollees is in plans with four or more stars. However, the share of enrollees in highly rated plans varies greatly by state — from less than 2 percent in 25 states and Washington D.C. to more than half in Massachusetts, Oregon and Hawaii.
The analysis is based on the ratings posted by CMS on the Medicare Compare Web site, with additional information from the CMS Plan Directory and enrollment files. The analysis examines the summary scores for the plans, which are an overall measure of the quality of care, access to care, responsiveness, and beneficiary satisfaction provided by the plans. It does not attempt to assess the validity of the quality ratings.
The Foundation also has issued a new analysis examining changes in the 2010 health reform law that will reward bonuses to private Medicare Advantage plans based on quality rating. The analysis is available online.
Briefing – A Foundation for Health Reform: Findings of An Annual 50-State Survey of Eligibility Rules, Enrollment and Renewal Procedures and Cost-Sharing Practices in Medicaid and CHIP for Children and Parents During 2009
In 2009, despite the bleakest economic picture in years, states managed to safeguard and in some cases expand health coverage for children and parents in their Medicaid and Children’s Health Insurance Programs, according to the Kaiser Family Foundation’s annual 50-state survey of Medicaid and CHIP eligibility rules, enrollment and renewal procedures and cost-sharing Practices. That was in large part due to the substantial help that states received through the congressional reauthorization of CHIP and the enactment of the American Recovery and Reinvestment Act (ARRA).
However, those gains, which could serve as a base for covering millions more people under health reform, are threatened by the impending end of key federal assistance for Medicaid programs at the end of 2010, the survey found. That in turn raises the prospect that new fiscal shortfalls could cause states to consider significant cuts to Medicaid and CHIP even before health reform coverage would begin.
The Kaiser Family Foundation’s Commission on Medicaid and the Uninsured released its annual 50-state survey and a package of related reports that examine trends and key issues in the coverage of low-income children and adults during a media briefing at the Foundation’s Washington, D.C., office.
A Foundation for Health Reform: Findings of An Annual 50-State Survey of Eligibility Rules, Enrollment and Renewal Procedures and Cost-Sharing Practices in Medicaid and CHIP for Children and Parents During 2009
In 2009, despite the bleakest economic picture in years, states managed to safeguard and in some cases expand health coverage for children and parents in their Medicaid and Children’s Health Insurance Programs, according to the Kaiser Family Foundation’s annual 50-state survey of Medicaid and CHIP eligibility rules, enrollment and renewal procedures and cost-sharing Practices. That was in large part due to the substantial help that states received through the congressional reauthorization of CHIP and the enactment of the American Recovery and Reinvestment Act (ARRA).
However, those gains, which could serve as a base for covering millions more people under health reform, are threatened by the impending end of key federal assistance for Medicaid programs at the end of 2010, the survey found. That in turn raises the prospect that new fiscal shortfalls could cause states to consider significant cuts to Medicaid and CHIP even before health reform coverage would begin.
The Kaiser Family Foundation’s Commission on Medicaid and the Uninsured released its annual 50-state survey and a package of related reports that examine trends and key issues in the coverage of low-income children and adults during a media briefing at the Foundation’s Washington, D.C. office.
As part of the Kaiser Family Foundation’s commitment to help respond to the devastation from Hurricane Katrina, you will find resources related to an ongoing effort to monitor and study the health coverage and needs of the victims. Check back frequently in the coming months for the latest updates.
Webcast and transcript from the AHCJ Annual National Conference session, Katrina Health Impacts [March 18, 2006]
Podcast (downloadable audio file) and transcript from Reporter Teleconference Briefing on Health Coverage After Katrina [September 9, 2005]– Speakers: Ruth Kennedy, Medicaid deputy director of Louisiana, Barbara Edwards, deputy director, Ohio Department of Health & Human Services, Jeanne Lambrew, associate professor, George Washington University, and Diane Rowland, executive vice president of the Kaiser Family Foundation and executive director of the Kaiser Commission on Medicaid and the Uninsured.
Alliance for Health Reform and Kaiser Commission on Medicaid and the Uninsured briefing webcast, Safeguarding the Health of Katrina’s Victims [September 12, 2005]– Speakers include: Surgeon General Richard Carmona, Ray Scheppach of the National Governors Association, Jim Tallon of the United Hospital Fund, and Senator Bill Frist.
Beth Scalco, LCSW, administrative director of the Louisiana HIV/AIDS Program, describes the challenges in re-building the HIV/AIDS program in the aftermath of Hurricane Katrina in this kaisernetwork.org interview. [September 22, 2005]
In inside circles of the health reform debate there has been criticism of the President for not weighing in earlier and publicly on the details of health reform legislation. Does he want the Senate’s approach to employer obligations, or the approach taken in the House? What form of public option does he want: a robust one, a trigger, an opt-in, an opt-out, or none at all? What level of premiums and cost sharing is he willing to see people pay? With financing looming as a make-or-break issue, does he want a tax on insurance companies offering “Cadillac plans,” or does he want a surtax on wealthy Americans? Other than laying down general goals the President has not taken a position on any of these choices—at least not yet. Is this punting to the Congress, or is this a smart strategy?
For one thing, the moment the President takes a specific position on any of these issues it immediately becomes a magnet for media coverage and the target for all opposition attacks. It also makes it more difficult for others within his party to offer their own proposals, and trickier for the President to compromise to get a law passed without appearing to reverse his original stance. Until now, the President’s lack of specificity on key details has kept a much broader coalition of groups in the debate than has ever before been the case in health reform. With the shape of a potential compromise still somewhat unclear and vote counts fluid, the President’s stance may still be the right strategy for now.
Although the President’s strategy left many of the tough tradeoff decisions to the leaders on Capitol Hill, it may have also encouraged buy-in on Capitol Hill. One of the reasons health reform failed last time around was the lack of ownership of the legislation by leadership in Congress. A benefit of the strategy this time is that the leadership is fully engaged. And powerful committee chairs have put aside turf considerations in unprecedented ways—although clearly there will be heavy lifting ahead to blend House and Senate bills together.
Presidential authority, though formidable, is not unlimited. It is always partly real—tangible carrots and sticks a President can wield—and partly the perception of authority. It needs to be husbanded and used judiciously. The decisive moment for public leadership in this debate will likely come when there is a bill in conference; then again when that bill moves from conference to the floor of the House and the Senate and is the focus of intense lobbying and national debate. At that stage the President will need to become not just a health reform advocate-in-chief, but chief sponsor of the legislation itself, embracing its key details. The President will need to save some of his authority for that critical stage in the debate when he will be the only effective counterweight to the opposition to health reform, especially with the public. This is the point in the process when the inside and the outside games come together, and key details are debated not only on Capitol Hill, but in the news media and around the country.
It is obviously important that the President’s staff work behind the scenes to make sure that his goals are protected in the bills that emerge from the House and the Senate; from financing to coverage and affordability, to cost containment and now abortion, and more. That process is, by its nature, opaque and hard to follow from the outside. Sometimes, judiciously, the President will need to send public signals and weigh in as the end game nears.
But it is not self-evident, as the conventional wisdom seems to hold, that it would have been the best strategy for the President to have taken clear positions on all the big health reform issues early on. It would certainly have satisfied the media to have the President’s position, issue-by-issue, to dissect every day. It may have made the leadership’s job on Capitol Hill easier for the President to declare himself earlier on key details of the legislation so they weren’t faced with so many of the tough decisions on their own. But it might also have slowed legislative progress and eroded influence and maneuvering room the President will need when the health reform process reaches its critical final rounds very soon.
Recent polls show that a substantial portion of families worry about whether their incomes will keep pace with rising prices generally and whether they will have to pay more for health care or health insurance.1 This concern about the cost of health insurance may result in part from the rapid increases in the costs of work-based health insurance in recent years: between 1999 and 2009, health insurance premiums rose 131%, a much faster rate of increase than general inflation (28%) or workers earnings (38%).2 Health benefit costs have risen substantially over many years, measured absolutely and as a percentage of total economic activity, or gross domestic product (GDP). Using the same data used by the government to track changes in the U.S. economy over time, the analysis below shows the growth in employer costs for private group health benefits over a relatively long time span and shows the size of these expenses compared with wages and other benefits.3
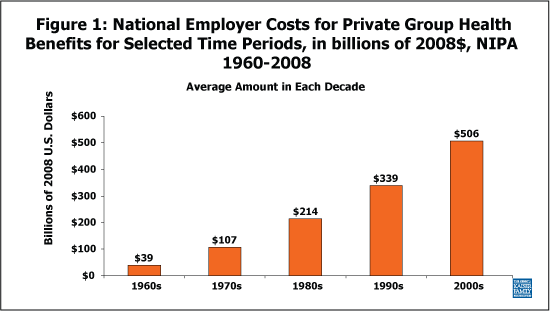
Figure 1 shows, in billions of 2008 dollars4, the total amount spent by employers on group health insurance policies from 1960 to 2008. The amount grew over twenty-fold from $25 billion in 1960 to $545 billion in 2008. This growth has been constant except for a short period between 1995 and 1998, and in 2006 and 2008.
Source: U.S. Department of Commerce, Bureau of Economic Analysis, National Income and Product Accounts, 1960-2008, Tables 6.11B, 6.11C, & 6.11D. Note: Amounts shown are averages of annual figures for each time period.
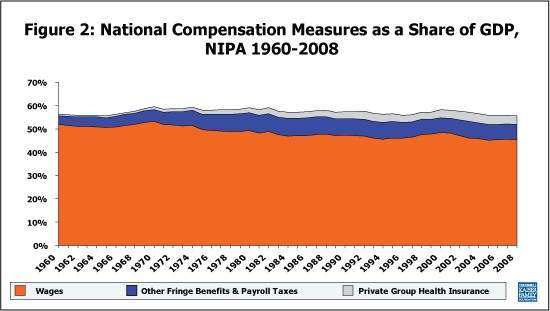
Figure 2 shows total employer costs for three forms of employee compensation as a share of GDP. The three compensation types we consider are: private group health benefits (the upper-most shaded region), wages/salaries (the bottom-most region), and other (non-private group health) benefits and payroll tax contributions (the middle region).5 Total compensation as a share of GDP is denoted by the topmost line and is a fairly stable over the period, ranging from about 56 percent to 59 percent. Although wages are consistently the largest component of worker compensation, the shares paid to employees for health benefits and other fringe benefits/payroll taxes have increased as a share of GDP, while the amount paid as wages has fallen. Health benefit costs have increased from 0.6 percent of GDP in 1960 to 3.8 percent in 2008. Fringe benefits other than health care and payroll taxes have also increased over this period, ranging from 3.8 percent of GDP in 1960 to 6.6 percent in 2008. Wages, meanwhile, have fallen from 51.8 percent of GDP in 1960 to 45.3 percent in 2008.
Source: U.S. Department of Commerce, Bureau of Economic Analysis, National Income and Product Accounts, 1960-2008, Tables 1.1.5, 2.1, 6.11B, 6.11C, & 6.11D.
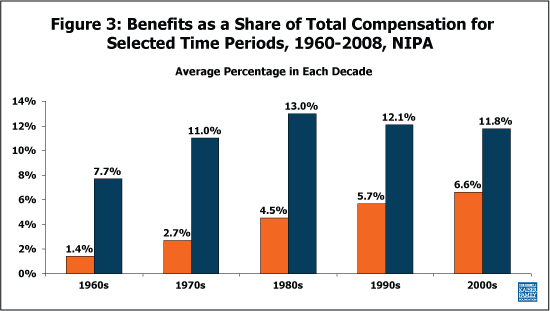
Figure 3 focuses on employer costs for private group health benefits and for non-health benefits as percentages of total compensation (i.e., benefits plus wages) to show more clearly the changes over time. Non-health benefits increased as a share of total compensation from the 1960s to the 1980s, but have fallen modestly since. On the other hand, employer payments for health benefits have increased as a share of total compensation in every decade, reaching 6.8 percent of compensation in 2008.
Source: U.S. Department of Commerce, Bureau of Economic Analysis, National Income and Product Accounts, 1960-2008, Tables 1.1.5, 2.1, 6.11B, 6.11C, & 6.11D. Note: Percentages shown are averages of annual shares for each time period.
Conclusion
Many people feel the burden of health care costs directly when they use medical goods and services. However, another way these expenses may affect families’ well-being is by slowing the increase in their paychecks each year. These figures show that the share of employee compensation going to health benefits has risen substantially over time, while the share going to wages has fallen. Absent fundamental change in cost growth, these trends seem likely to continue.
The snapshot was prepared by Paul Jacobs, Kaiser Family Foundation, 2007 and updated in November 2009 by Bianca DiJulio. Figure 2 largely reproduces an exhibit presented at several briefings and meetings by Len Nichols, Ph.D., of the New America Foundation. We thank Dr. Nichols for permitting us to reuse and expound upon his work.
2. Kaiser Family Foundation/Health Research & Educational Trust, Employer Health Benefits 2009 Annual Survey, September 2009. Available online at: http://www.kff.org/insurance/7936/index.cfm.
3. The data were obtained in November of 2009 from the U.S. Department of Commerce, Bureau of Economic Analysis, National Income and Product Accounts (NIPA) for the years 1960 to 2008. The data are available online at: http://www.bea.gov/national/nipaweb/SelectTable.asp. Note that the Bureau of Economic Analysis periodically updates published values, which may explain differences for data obtained after November of 2009, or differences between this version and the previous version published in February 2008 with data for 1960 through 2006.
4. In Figure 1, employer contributions towards private group health insurance are converted to 2008 dollars using the consumer price index for urban consumers. U.S. Department of Labor, Bureau of Labor Statistics, Consumer Price Index, All Urban Consumers (Current Series). Available online at: http://www.bls.gov/cpi/. For Figures 2 and 3, the data are shown as a percentage of nominal GDP, so they have not been adjusted.
5. Other benefits include employer contributions for: private pension and profit-sharing plans, publicly administered government employee retirement plans, private group life insurance plans, privately administered workers’ compensation plans, and supplemental unemployment benefit plans (denoted as “Employer contributions for employee pension and insurance funds” in the NIPA), as well as old age, survivors, and disability insurance (social security), hospital insurance (Medicare), unemployment insurance, railroad retirement, pension benefit guaranty, veterans life insurance, publicly administered workers’ compensation, military medical insurance, and temporary disability insurance (denoted as “Employer contributions for government social insurance” in the NIPA). For more information, see, U.S. Department of Commerce, Bureau of Economic Analysis, “A Guide to the National Income and Product Accounts of the United States,” September 2006. Available online at: http://www.bea.gov/methodologies/index.htm.
This document contains the chartpack from the November Health Tracking Poll. The survey was designed and analyzed by public opinion researchers at the Kaiser Family Foundation and was conducted November 5 through November 12, 2009, among a nationally representative random sample of 1,203 adults ages 18 and older. Telephone interviews conducted by landline (802) and cell phone (401, including 112 who had no landline telephone) were carried out in English and Spanish. The margin of sampling error for the total sample is plus or minus 4 percentage points. For results based on subgroups, the margin of sampling error is higher.
This issue brief explains key elements of the Congressional Budget Office’s estimates of the major health reform bills pending in Congress, the Affordable Health Care for America Act (H.R. 3962) and the Patient Protection and Affordable Care Act (H.R. 3590).
Throughout the health reform debate, CBO has analyzed these and other bills and provided projections of the costs and savings to the federal government associated with the plans over a 10-year period, as well as estimates of how the sources of insurance coverage would change.
The CBO acknowledges the uncertainty inherent in trying to assess the implications of major changes to the health care system. Still, the nonpartisan office’s work informs the legislative process in important ways and helps to provide an understanding of how different bills would affect the federal budget and the health coverage that people receive.
State Medicaid Coverage of Family Planning Services: Summary of State Survey Findings
Over the past two decades, Medicaid has played a central and growing role in financing and providing access to family planning services for low-income women. About two-thirds of women covered by Medicaid are of child-bearing age, and for this group of women, access to family planning services fills a key health need.
This report highlights findings from the 2007/2008 State Survey of Reproductive Health Services Under Medicaid, conducted jointly by the Kaiser Family Foundation and George Washington University School of Public Health and Health Services.
Although federal law requires state Medicaid programs to cover family planning services and supplies for beneficiaries of child-bearing age, states vary considerably in level of coverage of these services. The report presents state-by-state policies on coverage of key areas in reproductive health for low-income women, including contraception, preconception care, screenings for sexually transmitted diseases and coverage within special state Medicaid family planning programs.
The November Kaiser Health Tracking Poll shows little movement in measures of public opinion about health reform from recent months.
Among the new findings is a ranking of the public’s top priorities from among a list of elements of the legislation. There were both similarities and differences in priorities across partisan groups: while assuring the availability of affordable plans ranked in the top three priorities for Democrats, Republicans and independents, deficit neutrality ranked in the top three priorities for Republicans and independents and providing enough government financial help so as many uninsured people as possible can get health insurance ranked in the top three for Democrats. Creating a public option ranked near the bottom of this list among all three groups. Even so, when asked if they favor or oppose having a public plan to compete with private insurers, a substantial a majority of Americans (59%) say they support the idea.
The poll asked supporters and opponents of reform to give their reasons in their own words and then tallied the results. When asked to explain their support for reform in their own words, backers were most likely to express concerns about access, followed by concerns about the cost of health care and a belief that we need to fix the health care system. Opponents also cited costs, fearing that they would go up as a result of reform, the belief that other national priorities were more important, and concerns about the government becoming too involved in health care, among other reasons for their opposition.
The poll also found that for the first time this year, more people report having seen anti-reform ads over the previous week than report seeing pro-reform ads.
The November poll, the eighth in a series designed and analyzed by the Foundation’s public opinion survey research team, examines voters’ specific health care issue interests and experiences and perceptions about health care reform.