Getting into Gear for 2014: An Early Look at Branding and Marketing of New Health Insurance Marketplaces

Published: Sep 24, 2013

As of September 2013, states and the federal government are on the eve of their October 1st launch of open enrollment for the new Health Insurance Marketplaces, where consumers will be able to shop for and purchase private coverage and potentially receive subsidies to lower the cost of that coverage. Achieving adequate enrollment through these Marketplaces will be important for fulfilling the Affordable Care Act’s (ACA’s) goal of reducing the nation’s uninsured rate. Moreover, sufficient enrollment, particularly among younger and healthy individuals, will be important for ensuring the financial sustainability of the Marketplaces over time. Recognizing the importance of enrollment, the federal government and the 17 states operating State-based Marketplaces have invested resources and conducted extensive consumer research to inform the branding and marketing campaigns for their Marketplaces. Based on a review of publicly available materials as of September 2013, this brief provides an examination of the Marketplace branding strategies, websites, and marketing materials, providing insight into how consumers will be introduced to the Marketplaces and some of the key messages and approaches the Marketplaces will utilize to encourage individuals to enroll.

Helping Hands: A Look at State Consumer Assistance Programs under the Affordable Care Act

Published: Sep 24, 2013

The Affordable Care Act (ACA) creates several programs to provide outreach and enrollment assistance to individuals, families, and small businesses seeking to obtain health insurance coverage through the coverage expansions that will take effect in January 2014. Two key programs, the Navigator program and the In-Person Assister (IPA) program, are taking shape as the October 1st open enrollment deadline arrives. To date, 15 states operating a State-based Marketplace and three states engaging in a Consumer Assistance Partnership Marketplace have awarded Navigator and IPA grants. The Department of Health and Human Services (HHS) has also awarded Navigator grants in states opting for a Federally-facilitated Marketplace. This brief identifies the states that have awarded assister grants, highlights key differences in how these programs are funded and structured, and discusses some of the challenges these enrollment assisters are facing as they prepare to begin helping consumers.

Getting into Gear for 2014: Insights from Three States Leading the Way in Preparing for Outreach and Enrollment in the Affordable Care Act

Published: Sep 24, 2013

Fall 2013 will begin to usher in the key health insurance coverage expansions of the Affordable Care Act (ACA), with open enrollment in new health insurance Marketplaces beginning on October 1, 2013, and Medicaid expanding to adults in states moving forward with the ACA Medicaid expansion as of January 1, 2014. During summer 2013, with open enrollment rapidly approaching, many states were in high gear to finalize preparations for outreach and enrollment efforts to help translate these new coverage options into increased coverage for millions of currently uninsured individuals. This report provides insight into preparations in Maryland, Nevada, and Oregon -three states that have established a State-based Marketplace, are moving forward with the Medicaid expansion, and are among the states leading the way in preparing for outreach and enrollment. The findings provide an overview of where these three states are in establishing their Marketplaces; preparing for the Medicaid expansion; planning for marketing, outreach and enrollment; and establishing enrollment assistance resources. They also highlight the challenges that states have encountered and overcome, the successes they have achieved, and the key lessons that may help inform implementation efforts moving forward.

Providing Outreach and Enrollment Assistance: Lessons Learned from Community Health Centers in Massachusetts

Authors: Julia Paradise, Sara Rosenbaum, Peter Shin, Jessica Sharac, Carmen Alvarez, Julia Zur, and Leighton Ku
Published: Sep 24, 2013

Executive Summary

Six years ago, Massachusetts implemented a broad expansion of health coverage to the uninsured population in the state. Understanding that outreach and enrollment assistance would be essential to the success of the expansion, state policymakers provided for public education campaigns, but also for person-to-person, hands-on assistance, especially in communities with large numbers of uninsured people. Community health centers play a central role in this effort. As states and communities gear up to provide outreach and enrollment assistance under the ACA, the experience of the Massachusetts health centers offers lessons that can help inform current efforts to reach and enroll millions of low-income, uninsured Americans in health insurance. Recent interviews conducted with a sample of Massachusetts health centers point to four key findings:

Finding #1: Intensive outreach and enrollment assistance is crucial to connect low-income, uninsured people with coverage.

Finding #2: Assistance is not a one-time matter – it is needed at all stages of the enrollment process and to ensure continued coverage.

Finding #3: Immediate access to enrollment assistance boosts the effectiveness of outreach efforts.

Finding #4: Even when health reform is mature, the need for aggressive outreach and enrollment assistance remains high and the resource demands remain significant.

The Massachusetts health center experience demonstrates that, in addition to broad public education about affordable insurance options and how to enroll, intensive one-on-one assistance is a vital complement to help disadvantaged populations and communities obtain and keep coverage that meets their needs. The intensive support they require, and ongoing rather than occasional needs for assistance, suggest the importance of sustained investment in outreach and enrollment efforts conducted by health centers and other organizations.

Issue Brief: Introduction

In 2006, major health care reform legislation was enacted in Massachusetts. In many ways a prototype for the Affordable Care Act (ACA), the Massachusetts law required nearly all state residents to obtain health insurance, and made insurance accessible and affordable by reforming the health insurance market and providing subsidies for coverage through expansions of Medicaid and CHIP and a new program for low-income adults who are not eligible for Medicaid, known as Commonwealth Care. The law also created the “Connector,” which, like the ACA’s health insurance Marketplaces, is designed to facilitate and simplify access to insurance for individuals, families, and small businesses. In addition, the law established a Health Safety Net (HSN) Fund that finances health care for residents who remain uninsured permanently or on an intermittent basis.

Understanding that outreach and enrollment assistance would be essential to the health reform law’s success, Massachusetts policymakers launched high-profile public education campaigns, but they also provided for person-to-person, hands-on assistance, especially in low-income communities with large numbers of uninsured residents, many of whom have no previous experience signing up for insurance subsidies or selecting and enrolling in a health plan. Community health centers – a critical source of comprehensive primary health care and many other services for medically underserved populations and communities in Massachusetts – have played a central role in this outreach and enrollment effort.

To help inform current outreach and enrollment efforts associated with the ACA’s coverage expansion, the Kaiser Commission on Medicaid and the Uninsured asked researchers at The George Washington University to examine the enrollment assistance experience of Massachusetts health centers six years into that state’s health reform program.1  Because of their safety-net role, health centers are uniquely aware of and knowledgeable about the challenges and requirements of assisting uninsured individuals and communities disadvantaged by poverty, minority race/ethnicity, poor health status, language barriers, homelessness, and other factors. As states and communities nationwide gear up to provide outreach and enrollment assistance for the first time under the ACA, the experience of Massachusetts health centers offers valuable lessons to health centers nationally, and to other community-based efforts to reach and enroll millions of low-income uninsured Americans in health coverage.

Issue Brief: Methods

Telephone interviews were conducted with staff at a sample of nine health centers, selected to capture diversity in the location and size (total patients) of the 36 health centers in Massachusetts, as well as variation in the number of their patients who were uninsured in 2007 (the year that coverage was expanded in the state), and variation in the change in the uninsured rate over the period 2007-2011. Data from the Uniform Data System (UDS), which health centers that receive Section 330 funding from the federal Health Resources and Services Administration must file annually, were used to identify the sample of health centers.2  Interviews were conducted August 12-20, 2013 with health center CEOs or COOs and staff who oversee health centers’ outreach and enrollment efforts. Key staff were identified with the assistance of the Massachusetts League of Community Health Centers. The open-ended interviews were guided by questions developed in consultation with the League.

Issue Brief: Findings

Finding #1: Intensive outreach and enrollment assistance is crucial to connect low-income, uninsured people with coverage.

The individuals and communities served by health centers face a host of poverty-related disadvantages that pose unique challenges to enrollment efforts. Poverty frequently translates into residential instability or homelessness, which can make the generally easy task of documenting a place of residence difficult. Limited access to Internet service curtails the potential of online strategies to connect low-income people with coverage. Low literacy and large immigrant populations best served in a language other than English (one health center reported 75 distinct languages) also present special challenges to providing assistance.

Separate from the barriers associated with socioeconomic disadvantages, health center staff underscored the fact that many of the people they assist have no experience with health insurance and do not understand concepts like premiums and deductibles, provider networks, formularies, or coverage exclusions and limitations – all important considerations in selecting a health plan. Making the concept of provider networks even more difficult to grasp is health plan information that is so general that consumers cannot ascertain whether their physicians are included in a given network. Further, in Massachusetts, a health plan name may appear as a coverage option even if it has no network in the community in which a person lives. At a loss to assess the confusing array of health plans and trade-offs, overwhelmingly, health center patients tend to focus more narrowly on comparing plans’ monthly premiums. One-on-one help is essential to overcome the challenges of connecting people who lack resources and familiarity with health insurance to coverage that meets their needs.

Finding #2: Assistance is not a one-time matter – it is needed at all stages of the enrollment process and to ensure continued coverage.

Health center staff emphasized that intensive assistance is necessary on an ongoing basis to help individuals and families navigate the process of enrolling in coverage and later renewing it. They highlighted multiple points at which these processes can break down, such as when enrolling in a subsidy program, selecting a plan, and providing documentation to verify current eligibility for coverage.

    • Application. Applying for subsidized coverage is challenging because of the amount of documentation required to verify eligibility. Consumers need assistance securing and filing documents, responding to requests for additional documentation, and restarting the process if an initial application failed for lack of documentation. Health center staff noted the importance of having direct access to documents (e.g., wage information from employers) that require special training in privacy and confidentiality. The investment of time required to assist individuals with the application for a subsidy program alone was reported to range from 15 minutes in a simple case, to more than one hour in the case of families, in which eligibility may vary by family member, multiplying the complexity of the task.
    • Official notices. Assistance with reading and interpreting official correspondence is crucial. Staff at one health center reported that their enrollment assisters routinely advise clients not even to attempt to read the official letters they receive concerning their subsidy applications. They cited dense and obscure language that is particularly difficult for those with low literacy, and wording that suggests a negative disposition of the application even though virtually every low-income uninsured resident can qualify for one of the state’s four subsidy programs. For example, one standard notice begins with the words “not eligible” on page 1, and only on page 4 states that the applicant has been found eligible for another subsidy program. To prevent clients from tossing notices out after reading page 1, health center staff instruct them to bring in the correspondence they receive. The notices are complicated and confusing as well. One health center that conducted a systematic review of 530 state letters brought in by patients reported that roughly half of them involved denials under one or more subsidy eligibility categories, and staff counted 36 separate bases of denial pertaining to one or more members in a family (different family members may be eligible through different eligibility pathways).
    • Managing delays. Health center staff widely agreed that calls to the Commonwealth’s call center created problems because of extremely long waits to speak to a call center staff person (a finding also noted by other researchers in a recent study).3  Also, many applicants experience lengthy delays in obtaining coverage because, according to health center staff, it can take the state anywhere from a few days to several months to process an application. Respondents reported that these delays necessitated frequent contacts with state officials, especially in the case of clients with significant health problems at the time of application who are in more urgent need of coverage.
    • Plan selection and enrollment. Following enrollment in insurance, many clients must select and enroll in a health plan. In Massachusetts, those who qualify for Medicaid are automatically assigned to a plan, and individuals covered by the HSN program obtain their care from a designated network of hospitals and clinics. But those eligible for coverage through the Connector must select a plan. Because, as discussed earlier, many clients have no prior health insurance experience, one-on-one assistance with plan selection can become as important as assistance with applying for a subsidy. Educating individuals about how to consider and compare plan features other than premiums – in particular, provider networks and cost-sharing requirements, which have important implications for their access and out-of-pocket exposure – is both challenging and time-intensive.
    • Renewal/redetermination. Special vigilance, including intensive counseling, is needed to avert breaks in coverage that often occur at redetermination time. Some provisions of the ACA can be expected to ease renewal and reduce lapses in coverage. In particular, the use of “passive redetermination,” which permits automatic renewal of coverage if household circumstances have not changed, is expected to improve retention. At interview time, Massachusetts was in the midst of a major overhaul of its renewal process, but training had not yet begun and the paper-based system still in place involves many of the same documentation, notice, and other issues that impede initial application and enrollment. These persistent challenges, along with the fact that low-income people experience substantial income volatility that can change their subsidy eligibility, point to the importance of maintaining intensive assistance over time.

Finding #3: Immediate access to enrollment assistance boosts the effectiveness of outreach efforts.

Health center staff stressed that the ability to deploy enrollment technology in community locations is important to the effectiveness of outreach and communications campaigns. Without the means to enroll people where they are, the impact of public information efforts is likely to be dampened.

    • Mobile technology. To broaden the reach of their enrollment assistance efforts to include not only their own patients but also the larger community, some health centers were “pushing out” their enrollment assistance into the community through the use of mobile technology, for instance, by bringing wheeled computers or laptops into emergency departments. Mobile technologies were viewed as especially valuable in settings that attract many potentially eligible people, such as health fairs, clinics embedded in places such as college campuses, homeless shelters, job training programs, unemployment offices, and other strategic locations.
    • Self-serve kiosks. One health center is exploring the potential of self-serve kiosks to expand the reach of enrollment efforts. These kiosks might be attractive to applicants who have online skills but lack Internet access. Staff noted, though, that it is not clear how much kiosks would reduce the need for one-to-one assistance because the application and enrollment process is complex, especially when subsidies are involved, and does not lend itself to the simple types of functions that kiosks are good tools for carrying out.
    • Educational materials. To address low literacy and low health literacy, some health centers have prepared special client education materials as part of their assistance efforts. For example, one center had developed a 4-page picture pamphlet that depicts each stage of the process and other helpful information in a non-verbal format.

Finding #4: Even when health reform is mature, the need for aggressive outreach and enrollment assistance remains high and the resource demands remain significant.

Health center staff were unanimous in their praise for the major impact of health reform – a sharp reduction in the uninsured rate among Massachusetts residents, including health center patients. They emphasized, though, that realizing the potential of the coverage expansion to reach a largely low-income population that faces an array of challenges has required intensive outreach and enrollment assistance, even as the program has matured. Multiple coverage pathways, documentation requirements, opaque and discouraging correspondence from subsidy programs and insurers, and the surpassing complexity of health insurance itself, pose significant barriers to participation in coverage, especially for the poor. As the experience in Massachusetts demonstrates, those barriers can be surmounted with robust in-person assistance. With an uninsured rate among Massachusetts health center patients still exceeding 20%, and the risks of coverage loss at renewal time, intensive assistance will continue to play a vital role in expanding coverage, and sustained investment to support this effort will be needed.

Issue Brief: Conclusion

The Massachusetts experience points to the importance of several of the ACA’s most far-reaching reforms, including a single, streamlined application form for all subsidy programs, simplified documentation requirements, passive renewal, and investment in outreach and enrollment assistance. But it also reveals the vital role of in-person help to navigate what remains a new and unfamiliar process for many and an important process for all. Broad public education about affordable insurance options and how to enroll is essential to the success of the ACA’s expansion of coverage. In addition, for medically underserved populations and communities disadvantaged by poverty and other hardships – who stand to benefit most from coverage – one-on-one assistance is a crucial complement. The intensive support they require, and ongoing rather than occasional needs for assistance, suggest the importance of sustained investment in outreach and enrollment efforts conducted by health centers as well as other organizations.

This brief was prepared by Sara Rosenbaum, Peter Shin, Jessica Sharac, Carmen Alvarez, Julia Zur, and Leighton Ku of The George Washington University, and Julia Paradise of the Kaiser Family Foundation’s Commission on Medicaid and the Uninsured. Additional support for this issue brief was provided by the RCHN Community Health Foundation

Endnotes

  1. A previous study examined the early experiences of health centers following implementation of the Massachusetts health reform law. See Ku LK, Jones E, Finnegan B, Shin P, and Rosenbaum S, How is the Primary Care Safety Net Faring in Massachusetts? Community Health Centers in the Midst of Health Reform, Kaiser Commission on Medicaid and the Uninsured, Kaiser Family Foundation, March 2009. http://modern.kff.org/health-reform/report/how-is-the-primary-care-safety-net/ ↩︎
  2. George Washington University, IRB #071357 ↩︎
  3. Siefert R and Littell-Clark A, Enrollment Volatility in MassHealth: A Progress Report (Massachusetts Medicaid Policy Institute, April 2013) http://bluecrossmafoundation.org/publication/enrollment-volatility-masshealth-progress-report. Accessed online September 7, 2013. ↩︎
News Release

Kaiser/UNAIDS Study Finds No Real Change In Donor Funding For HIV

Published: Sep 23, 2013

Donor Disbursements In 2012 Totaled US$7.86 Billion

Washington, D.C. – As world leaders prepare to meet to review progress towards the Millennium Development Goals, a report from the Kaiser Family Foundation and the Joint United Nations Programme on HIV/AIDS (UNAIDS) evaluates international efforts to finance the response to the AIDS epidemic. The annual funding analysis finds donor governments disbursed US$7.86 billion toward the AIDS response in low-and middle-income countries in 2012, essentially unchanged from the US$7.63 billion level in 2011 after adjusting for inflation.

Overall, donor government funding for HIV has stayed at about the same level since 2008 – a plateau that followed a period of dramatic growth that saw donor nation support increase more than six-fold between 2002 and 2008. This flattening mirrors a similar trend in development assistance more generally, reflecting the economic and fiscal constraints of the post-financial-crisis period.

The United States government remains the largest donor to HIV efforts, contributing US$5 billion in 2012 towards the AIDS response in low-and middle-income countries and to the Global Fund, up slightly from the US$4.5 billion in 2011. The U.S. increase results from a quickened disbursement rate of previously approved funding.

“After years of sharp increases in donor government support which led to significant progress in the fight against the HIV epidemic, funding flattened after the worldwide recession and is likely to remain flat for the immediate future,” said Kaiser Family Foundation President and CEO Drew Altman.

“We are at a critical moment in the AIDS response,” said Luiz Loures, Deputy Executive Director, Programme, UNAIDS, “Scientific advances and new guidelines are providing opportunities to accelerate action and expand access to lifesaving HIV services. To take full advantage of these opportunities all efforts must be made to ensure the response to HIV is fully funded.”

Five donor governments – Australia, Canada, Japan, Sweden, and the U.S. – reported increased total assistance for HIV in 2012, with U.S. assistance increasing by just more than $500 million. Six decreased funding in 2012: Denmark, France, Ireland, the Netherlands, the U.K., and the European Commission. Three donor governments – Germany, Italy, and Norway – stayed constant in their support in 2012. The report found that the great majority, $6 billion, of international HIV assistance is provided bilaterally.

The United States accounted for nearly two-thirds (63.9%) of disbursements from donor governments bilaterally and multilaterally. The United Kingdom was the second largest donor (10.2%), followed by France (4.8%), Germany (3.7%), and Japan (2.7%). When viewed as a share of national economies, Denmark provided the highest amount of resources for HIV in 2012, followed by the U.K, Sweden, the U.S., and Ireland.

The new report, produced as a partnership between the Kaiser Family Foundation and UNAIDS, provides the latest data available on donor funding based on data provided by governments.

This report is based on analysis of data of 24 donor government members of the Organization for Economic Co-operation and Development’s Assistance Committee. It includes their combined bilateral assistance to low- and middle-income countries, and contributions to the Global Fund to Fight AIDS, Tuberculosis and Malaria, as well as to UNITAID.

The full analysis is available online.

The Kaiser Family Foundation, a leader in health policy analysis, health journalism and communication, is dedicated to filling the need for trusted, independent information on the major health issues facing our nation and its people. The Foundation is a non-profit private operating foundation, based in Menlo Park, California.

The Joint United Nations Programme on HIV/AIDS (UNAIDS) leads and inspires the world to achieve its shared vision of zero new HIV infections, zero discrimination and zero AIDS-related deaths. UNAIDS unites the efforts of 11 UN organizations—UNHCR, UNICEF, WFP, UNDP, UNFPA, UNODC, UN Women, ILO, UNESCO, WHO and the World Bank—and works closely with global and national partners to maximize results for the AIDS response. Learn more at unaids.org and connect on Facebook and Twitter.

Financing the Response to HIV in Low- and Middle-Income Countries: International Assistance from Donor Governments in 2012

Authors: Jennifer Kates, Adam Wexler, and Eric Lief
Published: Sep 20, 2013

Executive Summary

As the United Nations General Assembly prepares to meet in New York in September 2013, with progress towards the Millennium Development Goals (MDGs) and the 2011 Political Declaration on HIV/AIDS on the agenda, it is important for the global HIV community to take stock of international efforts to finance the response to the epidemic. The world has marshaled significant resources to address HIV over the past decade, helping to achieve incredible results — since the MDGs were first launched in 2001, the number of people newly infected with HIV has dropped by 20% and access to antiretrovirals has increased more than 20-fold, reaching 9.7 million by the end of 2012.1,2 

While funding from all sources — multilateral institutions, the private sector, charities, foundations, religious organizations, low- and middle-income country governments, and households and individuals — is integral to financing the response to HIV, international assistance from a subset of government donors has been critical to this effort. The Joint United Nations Programme on HIV/AIDS (UNAIDS) and the Kaiser Family Foundation have been tracking donor government assistance for HIV in low- and middle-income countries since 2002 and this report presents the most recent data available. As it shows, after a decade of significant growth, funding began to flatten with the onset of the global economic crisis in 2008 and, despite a slight increase this year, future funding levels are uncertain. In addition, there still remains a gap between available resources and estimated need.

Key findings include:

  • In 2012, the most recent year for which there are data, donor government assistance for HIV totaled US$7.85 billion3 and, in real terms, remained essentially flat compared to 2011 (US$7.63 billion) continuing a trend of flat funding that began in 2008 (see Figure 1). This flatlining mirrors a similar trend in development assistance more generally, reflecting the economic and fiscal constraints of the post-financial-crisis period.4 
  • A slight rise in total nominal spending between 2011 and 2012 (3%) was driven largely by an increase in bilateral disbursements from the U.S. (10%) as well as increased contributions to the Global Fund to Fight AIDS, Tuberculosis and Malaria (the Global Fund) in fulfillment of replenishment commitments. These increases, however, are temporary and not expected to continue; in fact, commitments (enactments), fell in 2012. Thus, the future could show further flattening or even declines.
  • Five of the 14 governments assessed (Australia, Canada, Japan, Sweden, and the U.S.) increased total assistance for HIV in 2012, while six others decreased funding (Denmark, France, Ireland, the Netherlands, the European Commission, and the U.K.), and three (Germany, Italy, and Norway) remained constant (after exchange rate fluctuations are taken into account).5
  • The U.S. was the largest donor in 2012 (US$5 billion) accounting for nearly two-thirds of total donor government assistance for HIV. The U.K. was the second largest donor (10.2%) followed by France (4.8%), Germany (3.7%), and Japan (2.7%). The top five donors have generally accounted for most (approximately 80%) of total donor assistance for HIV over the last several years.
  • In 2012, several donor governments provided a greater share of funding to HIV than their share of the world’s GDP:  the U.S., the UK, the Netherlands, Sweden, Denmark, and Ireland. However, when standardized by the size of their economies (GDP per US$1 million), Denmark ranks first followed by the U.K., Sweden, the U.S., and Ireland.
  • Most (nearly $6 billion or 76%) international assistance is provided bilaterally, although channels of assistance vary by donor, with some providing most of their funding through multilateral mechanisms. In 2012, for example, four donor governments provided a majority of funding through the Global Fund and UNITAID: Canada (65%), the European Commission (70%), France (85%), and Japan (90%).
  • UNAIDS estimated that global HIV funding from all sources (donor governments, domestic spending, multilateral organizations, and private institutions) totaled US$16.8 billion in 2012, of which 51% was provided by domestic resources, an X% increase above 2011 levels. Despite this increase, total resources available in 2012 were well below the UNAIDS estimated US$22 to US$24 billion in annual funding that will be needed by 2015 to address the impacts of HIV.

  1. UNAIDS, 2012 UNAIDS Report on the Global AIDS Epidemic, November 2012. ↩︎
  2. UNAIDS, Treatment 2015, July 2013. ↩︎
  3. UNAIDS estimates that international assistance for HIV from all sources – donor governments reporting to the DAC, other donor governments, multilateral organizations, and private philanthropies – totaled US$8.9 billion in 2012 ↩︎
  4. OECD, Aid to poor countries slips further as governments tighten budgets, April 2013. ↩︎
  5. The U.K. decrease is largely attributable to a 2011 pre-payment of its 2012 Global Fund contribution. Otherwise, U.K. assistance for HIV remained essentially flat between 2011 and 2012. Similarly, the Japan increase in 2012 reflects a pre-payment of its 2013 Global Fund contribution and would have also remained essentially flat had the pre-payment not occurred. ↩︎

Wide Disparities in the Income and Assets of People on Medicare by Race and Ethnicity: Now and in the Future

Authors: Gretchen Jacobson, Jennifer Huang, Tricia Neuman, and Karen Smith
Published: Sep 20, 2013

Executive Summary

Executive Summary

People on Medicare, including seniors and younger adults with disabilities, often live on fixed incomes supplemented by the savings they accumulated during their working years.1 ,2   A person’s ability to build wealth depends on many factors, including their education, health status, marital status, number of work years, household income, periods of unemployment, years of homeownership, access to employer retirement benefits, inheritance, and other financial supports.  These financial experiences for individuals during their working years differ by race/ethnicity, which in turn leads to differences across race/ethnicity in income and wealth in retirement.3 ,4   

Many people on Medicare live on limited incomes, and have relatively modest savings and home equity.5   In 2012, half of all Medicare beneficiaries had less than $22,500 in income and half had less than $63,100 in savings.6   Further, the outlook for the next generation of Medicare beneficiaries is not expected to be much brighter.  The increase in Social Security’s full retirement age from 65 to 67 means that Social Security will replace a smaller portion of the income of future seniors claiming benefits at the same age as current seniors.  The historic shift from defined benefit pensions to defined contribution pensions means that fewer future Medicare beneficiaries will have guaranteed, defined benefit pension income from former employers, and more will rely on less secure sources of income, particularly if investments in employer-sponsored defined contribution plans (e.g., 401K plans) are tied to fluctuations in the economy and stock market.7   Between 1988 and 2012, the share of employers that offered retiree health benefits fell from 66 percent to 25 percent.8   If this trend continues, fewer future Medicare beneficiaries will have retiree health benefits and more will be responsible for paying Medicare premiums and out-of-pocket costs.  Furthermore, rising budget deficits will increase pressure to reduce spending, increase taxes, or both.  Numerous deficit reduction packages have included reductions in Medicare spending and Social Security benefits, and increases in out-of-pocket health care costs for Medicare beneficiaries, which could further erode the economic security of many vulnerable Americans.

This report includes important distributional information about the means of current and future Medicare beneficiaries.  It updates and complements our prior work in this area by focusing on differences in the income and assets of people on Medicare by race/ethnicity, using data from the DYNASIM microsimulation model developed by researchers at the Urban Institute.  A table summarizing the income and assets of Medicare beneficiaries in 2012 and 2030, by selected demographic characteristics, is included in Table A1.  Data are rounded to the nearest $50 and are presented on a per person basis, rather than per household; for married people on Medicare, income and assets are divided equally between spouses to calculate per capita income, savings, and home equity.  More information about the methodology can be found in the Appendix. This analysis provides new information about disparities in incomes and assets among the Medicare population by race and ethnicity to inform ongoing discussions about potential changes to Medicare, Medicaid, Social Security and other policy proposals that could have important implications for the economic security of current and future Medicare beneficiaries.

Key Findings

Income and Assets among Medicare Beneficiaries in 2012, by Race/Ethnicity

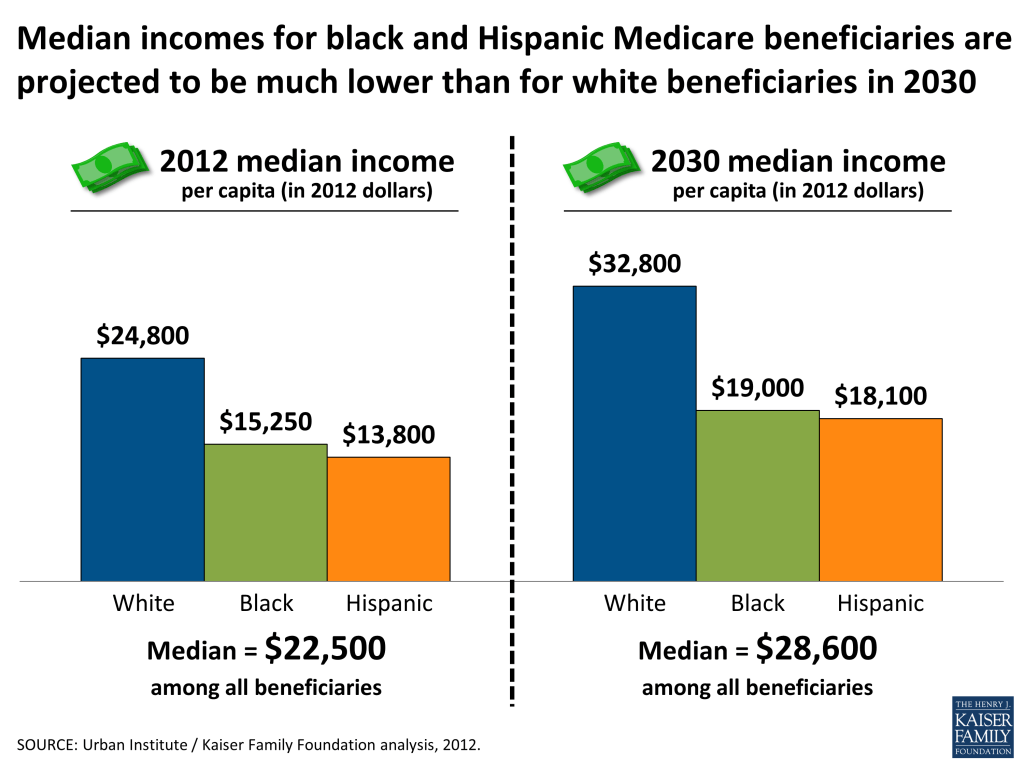
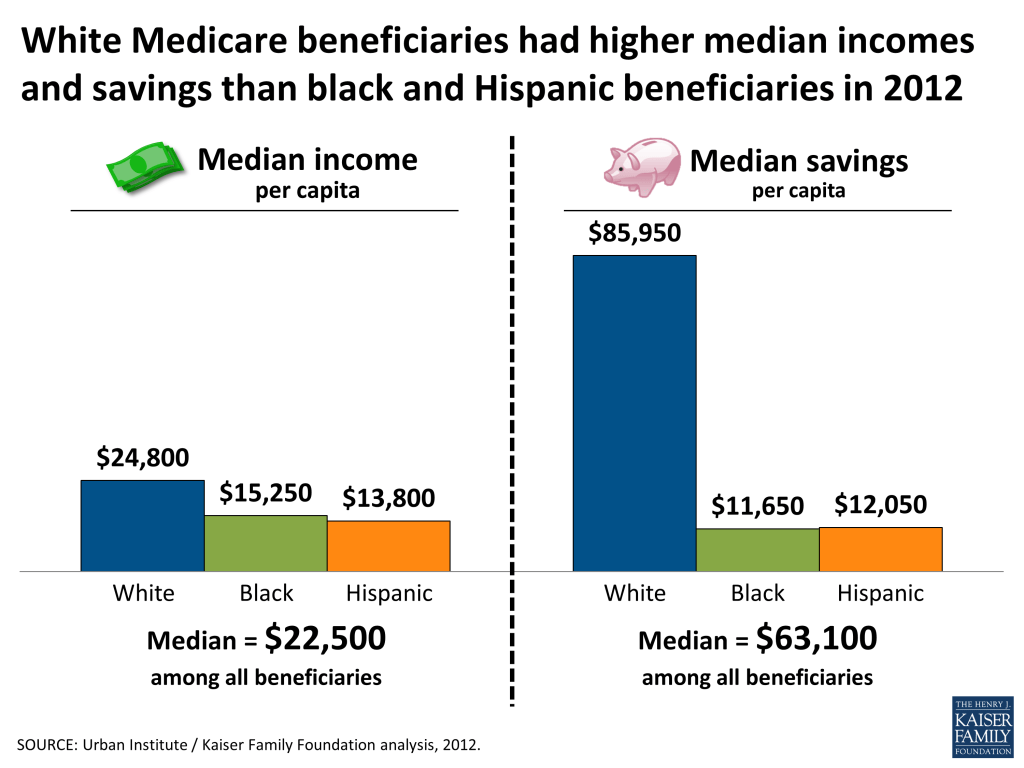
  • Half of all Medicare beneficiaries had annual incomes below $22,500 in 2012; median income was considerably lower among black and Hispanic Medicare beneficiaries ($15,250 and $13,800, respectively) than among white beneficiaries ($24,800).
    • While the top 10 percent of black and Hispanic beneficiaries had incomes above $43,900 and $44,550, respectively, the top 10 percent of white beneficiaries had incomes above $70,000 in 2012.
    • Even among Medicare beneficiaries with a college degree, median income was substantially lower among black and Hispanic beneficiaries ($29,200 and $34,800, respectively) than among white beneficiaries ($41,400).
White Medicare beneficiaries had higher median incomes and savings than black and Hispanic beneficiaries in 2012
  • Nearly all (92%) Medicare beneficiaries had some savings (such as retirement account holdings and other financial assets), but rates were higher among white beneficiaries (95%) than among black and Hispanic beneficiaries (80% and 81%, respectively) in 2012.  In other words, about one in five black and Hispanic beneficiaries had no savings or were in debt.
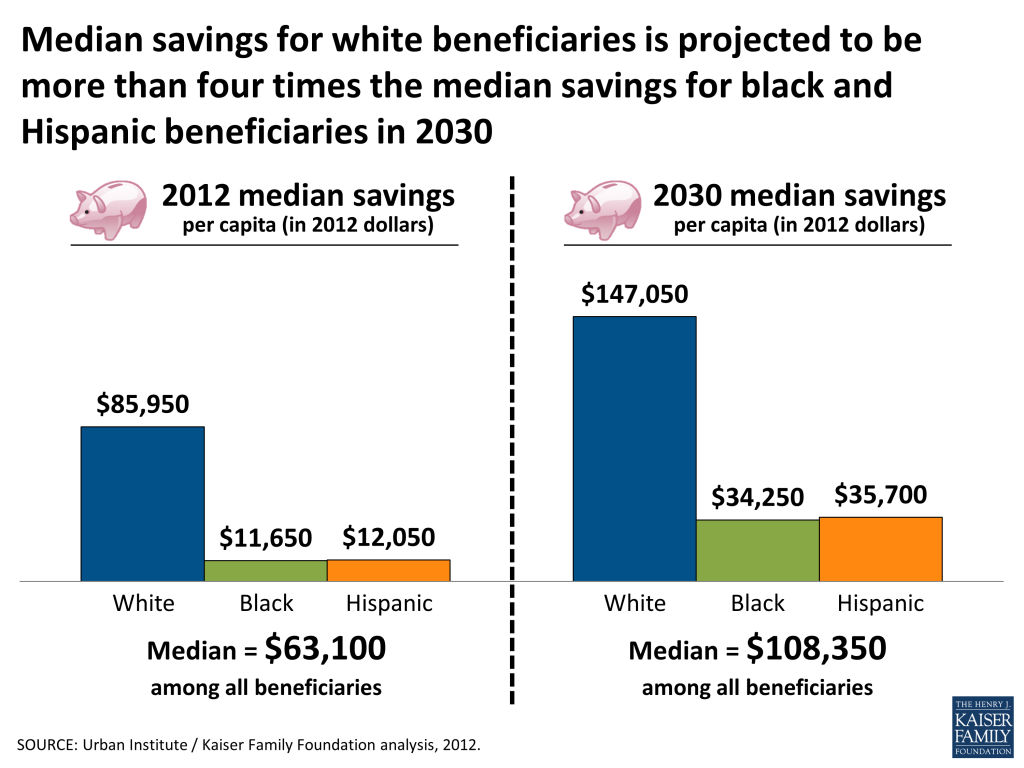
    • Half of all beneficiaries had less than $63,100 in savings in 2012; median savings for white beneficiaries ($85,950) were more than seven times the median savings for black beneficiaries ($11,650) and Hispanic beneficiaries ($12,050).
    • Among beneficiaries with savings, half had less than $77,500 in savings in 2012; median savings for white beneficiaries ($95,900) were nearly five times the median savings for black beneficiaries ($19,700) and nearly four times the median savings for Hispanic beneficiaries ($25,150).
  • The majority (78%) of Medicare beneficiaries had some home equity, but the share was lower among black and Hispanic Medicare beneficiaries (61% and 60%, respectively) than among white beneficiaries (83%) in 2012.
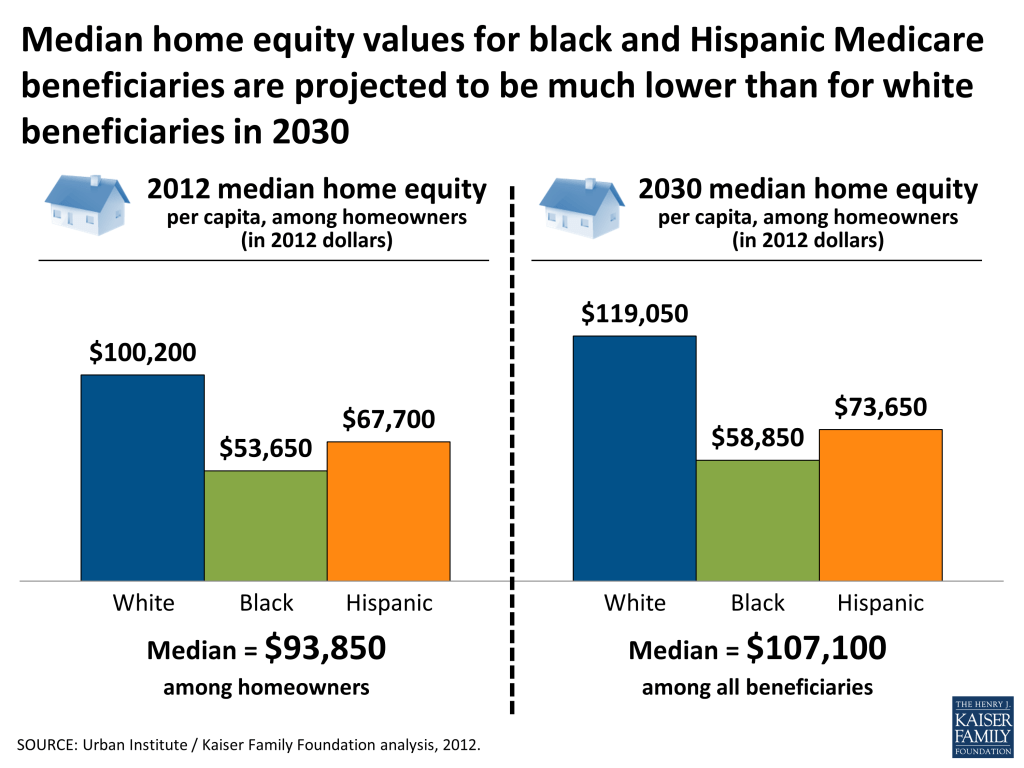
    • Among beneficiaries with home equity, half had less than $93,850 in home equity in 2012; the median home equity values were substantially lower among black and Hispanic beneficiaries ($53,650 and $67,700, respectively) than among white beneficiaries ($100,200) in 2012.

Projected Growth in Income, Savings, and Home Equity, by Race and Ethnicity, 2012-2030

  • In 2030, median incomes for black and Hispanic beneficiaries ($19,000 and $18,100, respectively) are projected to be substantially lower than for white Medicare beneficiaries ($32,800), in inflation-adjusted 2012 dollars.
Median incomes for black and Hispanic Medicare beneficiaries are projected to be much lower than for white beneficiaries in 2030
  • Savings rates, and median savings, are projected to rise for white, black, and Hispanic beneficiaries so that by 2030, a higher share of each racial/ethnic group will have some savings.
    • However, median savings for white beneficiaries ($147,050) is projected to be more than four times higher than for black and Hispanic beneficiaries ($34,250 and $35,700, respectively) by 2030, in inflation-adjusted dollars.  Median savings among those with savings is projected to be more than three times higher for white beneficiaries ($156,650) than for black and Hispanic beneficiaries ($44,500 and $48,400, respectively) in 2030.
Median savings for white beneficiaries is projected to be more than four times the median savings for black and Hispanic beneficiaries in 2030
  • In 2030, the share of white beneficiaries with any home equity (85%) is projected to continue to be higher than the share among black and Hispanic beneficiaries (67% and 65%, respectively).
    • Median per capita home equity values, among beneficiaries with home equity, are projected to be substantially higher for white beneficiaries ($119,050) than for black and Hispanic beneficiaries ($58,850 and $73,650, respectively) in 2030.
Median home equity values for black and Hispanic Medicare beneficiaries are projected to be much lower than for white beneficiaries in 2030

Discussion

These findings present a sobering story. Building on prior research documenting modest income and assets for many Medicare beneficiaries, with wealth concentrated among a very small share of the Medicare population, this analysis reveals significant disparities in income, savings, and home equity among Medicare beneficiaries by race and ethnicity. Looking to the future, the Medicare population of 2030 is projected to have somewhat higher incomes and savings than the current generation, but at the median, the gains are predicted to be modest for the overall Medicare population, especially for black and Hispanic beneficiaries. A clear understanding of the economic realities of the Medicare population provides an important context for designing and assessing Medicare, Social Security, Medicaid and other policy proposals that could strengthen or weaken the economic security of older Americans.

Report: Section 1: Income

This section describes the income of the Medicare population in 2012 across race/ethnicity. Income takes into account Social Security, pensions, earnings, and other income sources, including income from assets, rental income, and retirement account (IRA) withdrawals. Income is presented on a per person basis; for married people, income is divided equally between spouses to calculate per capita income.

Key Findings:

  • Half of all Medicare beneficiaries had annual incomes at or below $22,500 in 2012, with significant variation across race/ethnicity. Median income in 2012 was lower for black and Hispanic beneficiaries ($15,250 and $13,800, respectively) than for white beneficiaries ($24,800).
  • The distribution of income for the Medicare population differed by race/ethnicity. While the top 10 percent of black and Hispanic beneficiaries had incomes above $43,900 and $44,550, respectively, the top 10 percent of white beneficiaries had incomes above $70,000 in 2012.
  • Social Security accounted for the largest source of income for all beneficiaries in 2012.  Among beneficiaries in the middle of the income distribution, Social Security accounted for a larger share of income among black (80%) and Hispanic (76%) beneficiaries than among white beneficiaries (57%).  Conversely, investment income (interest, dividends, rental income, and IRA withdrawals) accounted for a larger share of income among white middle income beneficiaries (16%) than among black (4%) or Hispanic (4%) middle income beneficiaries, and defined benefit pensions accounted for twice the share of income among white (14%) than among black (7%) or Hispanic (7%) middle income beneficiaries.
  • Median income increased with years of education, but racial/ethnic differences in median income persisted at all education levels. Among college graduates, the median income of white beneficiaries was $41,400 — nearly $7,000 higher than the median income of Hispanic beneficiaries ($34,800), and more than $12,000 higher than the median income of black beneficiaries ($29,200) in 2012.
  • Racial/ethnic disparities in income were evident in all age groups, and were most pronounced among beneficiaries between the ages of 65 and 74. Among beneficiaries between the ages of 65 and 74, median income among white beneficiaries ($31,100) was about twice as high as median incomes among black or Hispanic beneficiaries ($17,550 and $14,900, respectively) in 2012. Income differences by race/ethnicity were smaller for beneficiaries under the age of 65 and beneficiaries ages 85 and older.
  • Median per capita income was higher among married beneficiaries ($26,500) than divorced, widowed, or single beneficiaries ($19,950, $19,200, and $13,850, respectively), with racial/ethnic differences in median income across all marital groups. Among married beneficiaries, per capita median income for white beneficiaries ($28,550) was about $10,000 higher than per capita median incomes for black and Hispanic beneficiaries ($18,550 and $15,950, respectively) in 2012.

 Executive Summary                                                                                                                     Section 2: Financial Assets and Savings  

Report: Section 2: Financial Assets And Savings

This section describes the total savings of the Medicare population across race/ethnicity in 2012. Total savings include retirement account holdings (such as IRAs or 401Ks) and other financial assets, including savings accounts, bonds and stocks. Savings are presented on a per person basis; for married people, savings are divided equally between spouses to calculate per capita savings.

Key Findings:

  • Nearly all (92%) Medicare beneficiaries had some savings, but rates were higher among white beneficiaries (95%) than among black and Hispanic beneficiaries (80% and 81%, respectively).  Similarly, one in 20 white beneficiaries did not have savings or were in debt compared to nearly one in five black beneficiaries and Hispanic beneficiaries.
  • Half of all Medicare beneficiaries had less than $63,100 in savings in 2012.  Median savings for white beneficiaries ($85,950) were more than seven times the median savings for black beneficiaries ($11,650) and Hispanic beneficiaries ($12,050).
  • Among beneficiaries with savings, half had less than $77,500 in savings in 2012; median savings for white beneficiaries ($95,900) were nearly five times the median savings for black beneficiaries ($19,700) and nearly four times the median savings for Hispanic beneficiaries ($25,150) in 2012.
  • While the top 10 percent of all black and Hispanic beneficiaries had savings above $137,200 and $215,550, respectively, the top 10 percent of white beneficiaries had savings above $723,200 in 2012.
  • The share of beneficiaries with any savings and the median savings among beneficiaries increased with income, with large racial/ethnic differences in savings across all income levels. Among beneficiaries who had incomes over 400 percent of the federal poverty level, median savings for white beneficiaries ($239,050) was nearly five times the median savings for black beneficiaries ($48,550) and more than three times the median savings for Hispanic beneficiaries ($71,400).
  • Median savings were higher among beneficiaries with more years of education, but differences in savings by race/ethnicity were evident across all education groups with the greatest disparities among beneficiaries with the most years of education. Among college-educated beneficiaries, median savings for white beneficiaries ($253,550) was nearly five times the median savings for black beneficiaries ($52,250) and more than four times the median savings for Hispanic beneficiaries ($57,000) in 2012.
  • Median savings were lowest among those age 85 and older ($40,900) and those under age 65 ($27,050), but median savings differed across race/ethnicity for all age groups.  Among beneficiaries between the ages of 65 and 74, median savings among white beneficiaries ($118,400) was about six times the median savings among black and Hispanic beneficiaries $19,700 and $17,500, respectively) in 2012.
  • Median per capita savings were higher among married beneficiaries ($84,550) than among divorced, widowed, or single beneficiaries ($53,750, $41,450, and $19,300, respectively), with racial/ethnic differences in median savings across all marital groups. Among married beneficiaries, median per capita savings among white beneficiaries was $107,350, between five and six times the median savings among black and Hispanic beneficiaries ($18,800 and $19,650, respectively) in 2012.

 Section 1: Income                                                                                                                                                        Section 3: Home Equity  

Report: Section 3: Home Equity

This section describes the home equity of the Medicare population across race/ethnicity in 2012, including the share of beneficiaries with home equity, and the home equity values among beneficiaries who have any home equity.  As with income and savings, home equity values are divided equally between spouses to calculate per capita home equity.  The home equity values shown account for any decrease in home equity values that occurred as a result of the mortgage crisis; it has been estimated that more than 1.5 million Americans over age 50 lost their homes between 2007 and 2011.9 

Key Findings:

  • In 2012, most Medicare beneficiaries (78%) had some home equity, with higher rates among white beneficiaries (83%) than among black or Hispanic beneficiaries (61% and 60%, respectively).
  • Among beneficiaries who had home equity, half of all beneficiaries had less than $93,850 in home equity in 2012; median home equity values were significantly higher among white beneficiaries ($100,200) than black or Hispanic beneficiaries ($53,650 and $67,700, respectively) in 2012.
  • Among homeowners, the distribution of home equity values differed by race/ethnicity; while the top 10 percent of black beneficiaries had home equity exceeding $181,750, this was more than $100,000 less than the home equity of the top 10 percent of Hispanic beneficiaries ($285,400) and the top 10 percent of white beneficiaries ($325,200) in 2012.
  • The share of beneficiaries with home equity and the median amount of home equity increased with income, with racial/ethnic differences in home equity across all income levels.  Among beneficiaries with home equity who had incomes over 400 percent of the federal poverty level, median home equity for black beneficiaries ($65,150) was almost $40,000 less than the median home equity among Hispanic beneficiaries ($103,850) and more than $50,000 less than the median home equity among white beneficiaries ($119,750) in 2012.
  • Median home equity was higher among beneficiaries with more years of education, but median home equity differed across race/ethnicity for all education groups. Among beneficiaries with college degrees who had home equity, median home equity among white beneficiaries ($146,550) was almost $60,000 higher than the median home equity among black beneficiaries ($86,950) and more than $30,000 higher than the median home equity among Hispanic beneficiaries ($115,250) in 2012.
  • Median home equity values were lowest among those under the age of 65 ($50,300), but home equity values differed across race/ethnicity for all age groups. Among beneficiaries between the ages of 65 and 74 who had home equity, median home equity among white beneficiaries ($109,350) was more than $45,000 higher than the median home equity among black beneficiaries and Hispanic beneficiaries ($58,700 and $63,950, respectively) in 2012.
  • Among beneficiaries with home equity, median home equity was highest among married beneficiaries, but on a per capita basis, median per capita home equity values were higher among divorced beneficiaries ($130,800) than among married, widowed, or single beneficiaries ($81,400, $94,200, and $92,150, respectively) in 2012; moreover, more than 40 percent of widowed beneficiaries and more than 60 percent of single beneficiaries had no home equity, and racial/ethnic differences in home equity values were evident across all marital groups. Among divorced beneficiaries, median per capita home equity among black beneficiaries ($86,750) was about $33,000 lower than the median per capita home equity among Hispanic beneficiaries ($120,050) and almost $50,000 lower than the median per capita home equity of white beneficiaries ($135,700) in 2012.

 Section 2: Financial Assets and Savings                        Section 4: Projected Growth in Income, Assets, and Home Equity 

Report: Section 4: Projected Growth In Income, Assets, And Home Equity

This section presents projections of income, assets, and home equity for the Medicare population in 2030, and examines changes during the period between 2012 and 2030, to explore the extent to which future generations of Medicare beneficiaries will be more economically secure than the current generation. Data in this section are adjusted for inflation; all dollar amounts are in 2012 per capita dollars.

Key Findings

  • In 2030, the Medicare population is projected to have somewhat higher incomes than current beneficiaries; median per capita income is projected to rise from $22,500 in 2012 to $28,600 in 2030, with income increasing unevenly across race/ethnicity. In 2030, median income is projected to be substantially higher for white beneficiaries ($32,800) than for black and Hispanic beneficiaries ($19,000 and $18,100, respectively).
  • By 2030, the racial/ethnic differences in shares of beneficiaries with savings are projected to narrow, with the share of black and Hispanic beneficiaries with savings projected to grow to 89 percent and 88 percent, respectively, but remaining slightly lower than the rate among white beneficiaries (97%).
  • The gap in savings across race/ethnicity is projected to widen by 2030; while median savings for white beneficiaries is projected to increase by about $61,100, this is more than double the absolute dollar increase in median savings for black and Hispanic beneficiaries ($22,600 and $23,650, respectively) between 2012 and 2030. The increase in savings for future generations largely reflects the higher prevalence of retirement account pensions among these beneficiaries during their working years compared to current beneficiaries. These higher savings amounts (that result in higher IRA withdrawals) are largely offset by lower pension incomes compared to current beneficiaries.
  • The share of Medicare beneficiaries with home equity and the median home equity value among those with home equity is expected to increase between 2012 and 2030. However, among beneficiaries with home equity, the growth in median home equity  is projected to be higher for white beneficiaries ($18,850) than black and Hispanic beneficiaries ($5,200 and $5,950, respectively) between 2012 and 2030, leading to widening racial/ethnic disparities in home equity values among the next generation of Medicare beneficiaries.

 Section 3: Home Equity                                                                                                                                                                         Appendix  

Appendix

Methodology:

Asset and income projections are based on the Urban Institute’s Dynamic Simulation of Income Model (DYNASIM3). DYNASIM3 is a dynamic microsimulation model that projects the population and analyzes the long-run distributional consequences of retirement and aging issues.  The model starts with a representative sample of individuals and families and ages the data year by year, simulating demographic and economic events including all key components of retirement income. The model integrates many important trends and differences among groups in life course processes, including birth, death, schooling, leaving home, first marriage, remarriage, divorce, disability, work, retirement, and earnings. Projections of fertility, disability, mortality, net immigration, employment, average earnings, and price changes are aligned to be consistent with 2011 OASDI Trustees projections. Projections of assets are aligned to the Survey of Consumer Finance (SCF). For a fuller description of DYNASIM3, see Karen E. Smith. February 2012. “Projection Methods Used in the Dynamic Simulation of Income Model (DYNASIM3),” Program on Retirement Policy, The Urban Institute.

 Section 4: Projected Growth in Income, Assets, and Home Equity

Endnotes

  1. Meschede, Tatjana, Thomas M. Shapiro, and Jennifer Wheary. Living Longer on Less: The New Economic (In)Security of Seniors. Institute on Assets and Social Policy and Dēmos, by a Thread Report no. 4. May 2009. ↩︎
  2. Kaiser Family Foundation, “Key Issues in Understanding the Economic and Health Security of Current and Future Generations of Seniors,” March 2012. ↩︎
  3. Shapiro, Thomas, Tatjana Meschede, and Sam Osoro. The Roots of the Widening Racial Wealth Gap: Explaining the Black-White Economic Divide. Brandeis University Institute on Assets and Social Policy, Research and Policy Brief. February 2013. ↩︎
  4. McKernan, Signe-Mary, Caroline Ratcliffe, Eugene Steuerle, and Sis Zhang, “Less Than Equal: Racial Disparities in Wealth Accumulation,” April 2013. ↩︎
  5. Kaiser Family Foundation, “Projecting Income and Assets: What Might the Future Hold for the Next Generation of Medicare Beneficiaries?” June 2011. ↩︎
  6. Kaiser Family Foundation, “Medicare at a Glance: Fact Sheet,” November 2012. ↩︎
  7. Butrica, Barbara, Howard Iams, Karen E. Smith, and Eric Toder. The Disappearing Defined Benefit Pension and Its Potential Impact on the Retirement Incomes of Boomers. Social Security Bulletin, 69(3): 1-27. January 2009. ↩︎
  8. Kaiser Family Foundation, “2012 Employer Health Benefits Survey,” September 2012. ↩︎
  9. Trawinski, Lori, “Nightmare on Main Street: Older Americans and the Mortgage Market Crisis,” AARP Public Policy Institute, July 2012. ↩︎

Los YouToons se preparan para Obamacare

Published: Sep 19, 2013

En Español

Antes del inicio del período de inscripción abierta, el 1 de octubre, la Kaiser Family Foundation presenta un video en español para que el público comprenda mejor los cambios que vienen próximamente bajo la Ley de Cuidado de Salud a Bajo Precio (Affordable Care Act o ACA, en inglés). “Los You Toons Se Preparan para Obamacare” explica las nuevas opciones que tendrán los estadounidenses para obtener seguro médico en el año 2014. Vea el vídeo en español, y utilícelo para iniciar una conversación con su familia, amigos y colegas acerca de Affordable Care Act. Las organizaciones e individuos pueden integrar el video en sus sitios web gratis directamente de YouTube (haga clic en el mismo enlace Share sobre la descripción del vídeo, y luego haga clic en Embed para obtener el código). Los visitantes también puede solicitar una descarga gratis del video para incorporarlo a eventos en persona y esfuerzos de alcance uno a uno.

English

Before the October 1 start of open enrollment, the Kaiser Family Foundation presents a Spanish-language video as part of its continuing efforts to increase the public’s understanding of upcoming changes under the Affordable Care Act (ACA). Based on the previously released English-language video, “Los YouToons Se Preparan Para Obamacare” explains the basic changes in how Americans can obtain health coverage in 2014. Watch the video in English or in Spanish, and use it to start a conversation with family, friends, and colleagues about the Affordable Care Act. Organizations and individuals are welcome to embed the video on their websites for free directly from YouTube (click the Share link above the description of the video, and then click Embed to grab the code). Viewers may also request a free download of the video (see form below) to incorporate it into in-person events and one-on-one outreach efforts.