KFF designs, conducts and analyzes original public opinion and survey research on Americans’ attitudes, knowledge, and experiences with the health care system to help amplify the public’s voice in major national debates.
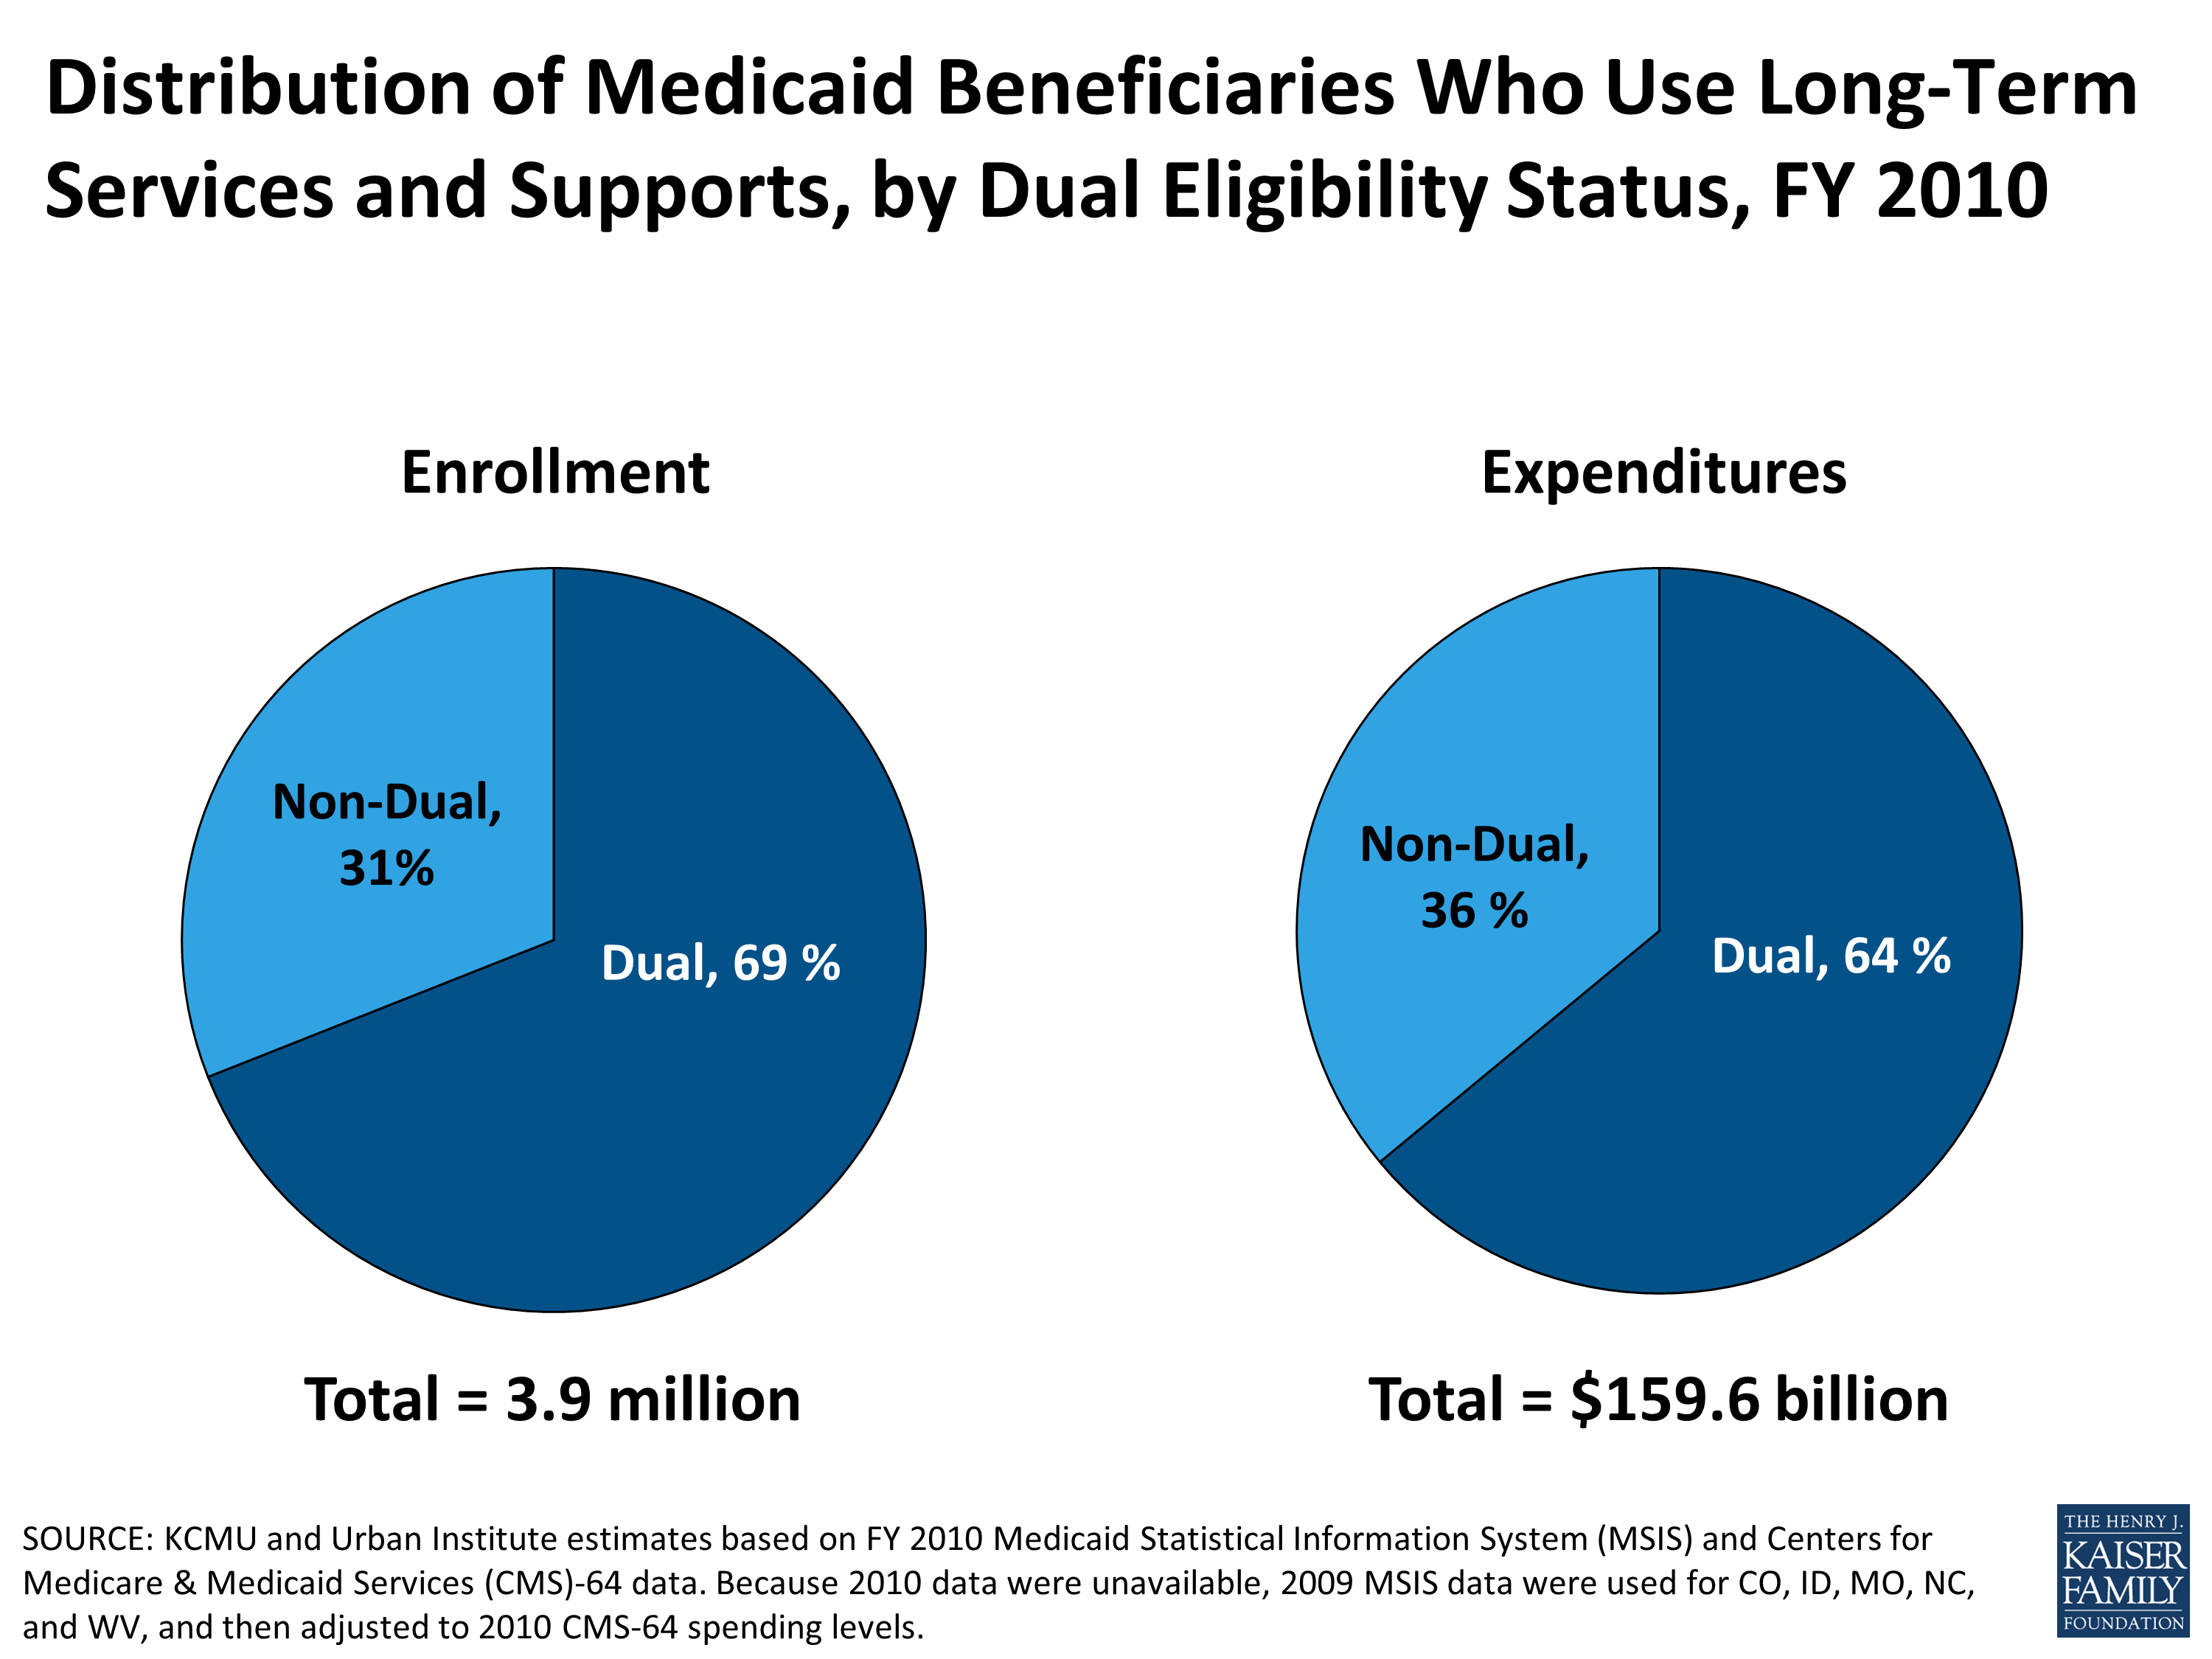
KCMU and Urban Institute estimates based on FY 2010 Medicaid Statistical Information System (MSIS) and Centers for Medicare & Medicaid Services (CMS)-64 data. Because 2010 data were unavailable, 2009 MSIS data were used for CO, ID, MO, NC, and WV, and then adjusted to 2010 CMS-64 spending levels.
Final update made on October 10, 2013 (no further updates will be made)
Establishing the Marketplace
On June 17, 2011, Governor John Kitzhaber (D) signed SB 99 into law establishing the Oregon Health Insurance Exchange Corporation.1 That same month, the Governor signed SB 91, which specified requirements of health insurance carriers offering coverage in the state.2 On March 6, 2012, the legislature passed HB 4164 to approve the final version of the Marketplace’s business plan.3 On October 1, 2012, the Marketplace announced that its new name would be Cover Oregon.
Structure: The legislation defines Oregon’s Marketplace as a quasi-governmental organization, specifically a “public corporation performing governmental functions and exercising governmental powers.”
Governance: Cover Oregon is governed by a nine-member board, including two ex officio members (or their designees): the Director of the Oregon Health Authority and the Director of the Department of Consumer and Business Services. The Governor appoints seven members who are subject to confirmation by the Senate, with expertise or experience in individual insurance purchasing, business, finance, sales, health benefits administration, individual and small group health insurance, or the use of a health insurance marketplace. Also, at least two appointed members must be individual or small business consumers of the Marketplace. No more than two appointed members can be employed by, consultant to, or members of a board of directors of the following organizations: an insurer or third-party administrator; an insurance producer; a health care provider, facility, or clinic; or a trade association for these parties. Board members must declare any conflicts of interest and abstain from voting on related issues.
The Oregon Senate confirmed the Governor’s nominees to the Health Insurance Marketplace Board on September 23, 2011.4 They are:
Liz Baxter (Chair), Oregon Public Health Institute
Teri Andrews (Vice-Chair), CG Industries
Ken Allen, Oregon American Federation of State and County Municipal Employees (AFSCME) Council 75
Aelea Christofferson, ATL Communications
Dr. George Brown, Legacy Health Systems
Jose Gonzales, Tu Casa Real Estate Corporation
Gretchen Peterson, Hanna Anderson
The Board appointed an Executive Director on October 6, 2011.5 Cover Oregon also has four advisory committees that meet regularly and report to the Board of Directors: the Consumer Advisory Committee, Board Development Committee, Finance and Audit Committee, and Personnel and Compensation Committee.
Contracting with Plans: Cover Oregon is authorized to act as an active purchaser when contracting with plans, specifically to “limit the number of qualified health plans (QHP) that may be offered through the Marketplace as long as the same limit applies to all insurers.” While Cover Oregon will not negotiate rates, it will set requirements for QHPs that are stronger than the outside market in several areas. These standards will be the same for all carriers, and carriers’ plans must meet these elevated standards to participate. Carriers may choose to participate in either or both the Individual Marketplace and the SHOP, and are not required to participate in the same markets inside and outside the Marketplace. Carriers participating in Cover Oregon are required to offer a standard bronze, silver-, and gold-level plan in each service area of each market – individual and small employer – in which they participate. Carriers offering plans at any metal level must also offer a child-only plan at that level. In addition to the standard plans, carriers have the option to offer the following plans: two non-standard plans; two additional plans that demonstrate innovation in the use of networks, wellness programs or other options not related to premiums or benefits; three platinum plans; and/or one catastrophic plan. However, each carrier may only offer up to three plans in each metal tier, including the standard plans at the bronze, silver, and gold levels.6 Catastrophic plans may only be sold in Cover Oregon’s individual market to specific populations stipulated in the ACA: individuals under age 30, individuals for whom coverage is unaffordable, and individuals with a hardship.7 Cover Oregon will allow rating factors of age, geography, and tobacco use.
The Department of Consumer and Business Services created an Advisory Committee to develop standards for bronze- and silver-level plans to help the state monitor and compare plans.8 In addition, information on carrier and plan quality ratings will be available to consumers on Cover Oregon’s website. The website will display quality information about the participating carriers, including an aggregated experience score based on CAHPS data (Consumer Assessment of Healthcare Providers and Systems) that plans already collect and two encounter-based utilization scores.9 Cover Oregon anticipates that displayed quality information will change in later years to include measures of patient experience or the impact on disparities in access to care. Cover Oregon has also developed a quality rating system for health plans that will start during October 2013 open enrollment. The Marketplace will use 13 measures that fall into three categories (preventive care, patient experience, and complex care) to help users shop for plans based on quality and value.10
In October 2012, Cover Oregon released a Request for Applications to health insurance carriers interested in offering benefit plans through the individual and/or small group Marketplace.11 The state later adopted regulations related to certification of QHPs.12 The Oregon Insurance Division approved all of the medical and dental plans filed by carriers. There are currently 11 carriers participating in the individual market, 8 carriers in the small group market, and 9 carriers offering dental plans.13 These carriers submitted QHPs and proposed rates for 2014 to the Insurance Division,14 which held two weeks of public hearings on the proposed rates and conducted analysis of the carrier’s rate justifications. On July 10, 2013 the Insurance Division released the plans’ approved rates.15 The Insurance Division lowered rates for individual plans from a few percentage points to 30 percentage points. For small employers, the Insurance Division reduced rates from requested amounts up to 12 percentage points.16 Plans are required to offer the same rates inside and outside of the Marketplace.17 In the rating area of Oregon’s largest city, Portland, 32 silver plans will be offered and 27 bronze plans will be offered.18
Carrier certification occurs once every two years, and carriers that did not apply initially must wait until 2015 to apply (for the 2016 plan year). Changes to existing QHPs can be made annually, and the plan and rates must be approved by the Insurance Division and certified by Cover Oregon. Carriers may add plans mid-year, but cannot exceed three plans in each metal tier in a service area.
Dental and Vision Benefits: QHPs with embedded dental benefits, QHPs without dental benefits, and stand-alone dental plans may be sold on the Marketplace. Medical carriers offering plans through Cover Oregon may decide whether to include pediatric dental benefits in a medical offering, and plans that include pediatric dental will be displayed alongside plans that do not. The inclusion or exclusion of pediatric dental benefits will be indicated in the plan details, in the same way as other non-mandatory benefits. Cover Oregon will offer stand-alone dental plans as a separate offer after a medical selection is made. All standalone dental plans must cover the pediatric dental essential health benefit at the high (85%) or low (70%) actuarial value.
Within the individual Marketplace, all consumers will be given the option to shop for a dental plan, but will not be required to purchase. Within SHOP, an employee will be given the option to shop for a dental plan only if the employer has agreed to sponsor a dental option. The effective date for the dental plan must align with medical coverage and carriers are limited to offering three standalone dental plans in each of the individual and small group markets. There is a separate out of pocket maximum for standalone dental issuers, and the “reasonable out of pocket limit” for Pediatric Dental EHB through Cover Oregon will be $1,000 per member.19
Risk Adjustment, Reinsurance, and Risk Corridors: OnJuly 29, 2013, legislation was signed into law that established the Oregon Reinsurance Program, which will be administered by the Oregon Medical Insurance Pool Board. The program is temporary and is set to run through December 31, 2016.20
Consumer Assistance and Outreach: Oregon identified a subcontractor to create a brand identity for the Marketplace and develop a multi-phased communications plan based on market research and the results of focus groups. Cover Oregon’s logo and website were unveiled in October 2012, along with an online calculator for individuals to find out how much financial assistance they might be eligible for when purchasing coverage in 2014. The website offers information and resources in Spanish, Russian, Vietnamese, Korean, and Chinese. In March 2013, Cover Oregon identified a contractor to implement the marketing and communications plan.21 The contract will run through December 2014, and may be extended for a maximum of five years.22
In April 2013, Cover Oregon finalized an intergovernmental agreement with the Oregon Health Authority (OHA) to expand OHA’s existing outreach and application assistance program, which utilizes a network of providers who offer enrollment assistance in public programs.23 The state will use community partners, which are local organizations that are cultural experts on their community. Staff at these organizations will be known as “application assisters,” a term which encompasses Navigators, In-Person Assisters, and application counselors. Application assisters will conduct eligibility and enrollment for public and private health coverage. Training and certification is required for all application assisters, including paid staff and volunteers, and must be renewed annually. In-person and web-based training will be provided free of charge. Application assisters must pass a background check and will receive an identification number.
Community partners will be eligible to receive performance-based grants, though funding will not be available to support all community partners. Funding opportunities are available through OHA and posted on the state’s procurement website, the Oregon Procurement Information Network (ORPIN). Additionally, the U.S. Department of Health and Human Services (HHS) announced in May 2013 that 29 federally qualified health centers in Oregon would be eligible for an additional $2.8 million in outreach and enrollment grants.24 Community partners not receiving a grant will be permitted to provide application assistance as long as they sign an agreement with OHA.
Cover Oregon announced the first round of Community Partner grantees on September 13th. Thirty community-based organizations from around the state received $3.16 million to help individuals and families enroll in health insurance. The grantees include groups that serve diverse populations, remote communities, people living with mental illness and a wide range of social service agencies. Community Partners will be available to help individuals enroll in health insurance starting Oct. 1. Later in October, individuals will be able to enroll online as well. Cover Oregon has trained more than 1,200 employees at community-based organizations to be application assisters and nearly 1,600 insurance agents. Three additional grant opportunities for small business outreach, provider outreach, and general outreach, funded by Cover Oregon, will be announced in the coming weeks. Obtaining assistance from Community Partners is free for Oregonians, and consumers can be connected to certified Community Partners through Cover Oregon’s website.25
Application assisters may help consumers with enrolling in a QHP; however, if consumers need information on QHPs beyond what is available through the website, assisters must refer the consumers to an agent.26 Agents and brokers will not participate as Navigators, but will be involved in a separate Agent Management program, which utilizes a network of licensed health insurance producers to improve outreach to all geographic areas of the state and to hard-to-reach populations.27 Insurance producers will be trained annually, be affiliated with the Cover Oregon as certified agents and, when appropriate, coordinate and collaborate with the Navigators. Cover Oregon will collect and pass through any carriers’ commissions or bonus payments to the agents.
Cover Oregon is also operating a Customer Service Center (call center) to offer assistance to individuals wishing to speak with representatives over the phone. The call center went live in June, and was averaging 40 calls a day, with call volume increasing. The Service Center has over 50 full-time employees and plans to hire approximately 100 supplemental staff who speak a variety of languages to meet the anticipated call volume of the initial open enrollment period.28
On July 8, Cover Oregon launched a $20 million statewide marketing and outreach campaign (“Long Live Oregonians!”) that features TV, radio and online ads created by local Oregon musicians and artists, and an on-the-ground outreach effort in partnership with agents, community organizations, Tribes, providers, business associations, state agencies and other key partners.29 Cover Oregon plans to use an integrated marketing campaign that includes marketing materials, community meetings, research, paid media, earned media, online outreach, and statewide and grassroots partners over a phased marketing process (Awareness and Education, Enrollment, Retention/Awareness, and Enrollment). The campaign will gear advertisements to specific audience segments, persona types, and influencers/supporters.30 Cover Oregon is also using social media to advertise the Marketplace, through Facebook, Twitter, You Tube, Linked In, and Google+.
Small Business Health Options Program (SHOP) Marketplace: Oregon has decided to restrict the SHOP Marketplace to businesses with 50 or fewer employees in 2014 and 2015, and to 100 of fewer employees beginning in 2016. Oregon has previously required that small group premiums be determined on a tiered-composite rating basis. The state will incorporate federally-required per-member rating methodology, but maintain its tiered-composite rating requirement, both inside and outside of the Marketplace starting in 2014.31 Cover Oregon has developed four options for small employers to offer their employees through SHOP:
Traditional: The employer chooses one insurance company and plan in which their employees must enroll.
Plan Bundling: The employer chooses one insurance company but allows their employees to select from all plans offered by that company.
Multiple Companies/One Plan: The employer selects a benefit plan level and the employees can select a plan from all companies.
Broad Choice: Employees can select from several companies and plans.32
Financing: Cover Oregon conducted a significant amount of budgeting and forecasting work in the first quarter of 2013 to set an administrative fee on Qualified Health Plans (QHPs) for 2014. Cover Oregon underwent a public rule-making process to establish the fee, and also provided for public input at both Finance and Audit Committee meetings and Board meetings. At its March 2013 meeting, the Board of Directors adopted an administrative fee on health insurers offering QHPs through the Marketplace of 2.68% of premium, or $9.38 per member per month (PMPM), for 2014. The fee, along with a $15 million charge on public programs, will generate $32 million in reserves in 2014 (half of Cover Oregon’s 2015 budget of $64 million).33 Cover Oregon also established a monthly administrative fee of $0.93 PMPM on insurers offering standalone dental plans through the Marketplace in 2014.
Essential Health Benefits (EHB): The Affordable Care Act requires that all non-grandfathered individual and small-group plans sold in a state, including those offered through a Marketplace, cover certain defined health benefits. Governor Kitzhaber created an EHB workgroup to recommend a benchmark plan for the individual and small group market. The workgroup, jointly chartered by the Oregon Health Policy Board and Cover Oregon presented the final recommendation of Small Group PacificSource Preferred CoDeduct plan to the Marketplace Board and the Oregon Health Policy Board in mid-2012.34 In addition, the federal BlueVision “High Plan” package was defined as the pediatric vision benefit and the state’s CHIP plan as the pediatric dental benefit.
Evaluation Plan: Cover Oregon has developed a draft evaluation plan to measure how well Cover Oregon is achieving its goals and identify operational adjustments that will help to achieve its goals more effectively. Cover Oregon has identified 12 key goals that fall into three categories: (1) Engaging partners and raising consumer awareness, (2) A seamless eligibility and enrollment process and excellent customer service, and (3) Improving accessibility and affordability of coverage and care and the health of Oregonians. For each of these three categories, Cover Oregon’s Evaluation Team will collect and analyze data in program design, implementation, and outcomes. Data will be collected through an Evaluation Database that will store enrollment data from Cover Oregon’s IT system and data from consumer surveys, and join these data for analysis. The Evaluation Team will also conduct focus groups with individual market consumers, employers, Service Center staff, agents, and community partners. Evaluation findings will be disseminated within Cover Oregon and to the public through annual reports, briefs, online data exploration tools, and ad hoc reports.35
Marketplace Funding
Oregon has received multiple federal grants: the Exchange Planning grant of $1 million, the Early Innovator grant of $48.1 million and a supplement of $11.8 million to build a modular and reusable IT system, a Level One Establishment grant of $9 million to support the final design and implementation of the Marketplace’s business and operations plans through August 2012, a second Level One Establishment grant of $6.7 million to continue to support the planning process through May 2013, and a Level Two Establishment grant of $226.4 million to cover costs associated with testing and implementation of the IT user interface, staffing the call center, and developing multi-media marketing materials.36 Cover Oregon estimates annual start-up costs between 2011 and 2013 to total approximately $27 million, excluding the development of the IT infrastructure and website which will be funded with the Early Innovator Grant.
In addition, Oregon, along with nine other states, is receiving technical assistance from the Robert Wood Johnson Foundation through the State Health Reform Assistance Network; this assistance includes help with setting up health insurance Marketplaces, expanding Medicaid to newly eligible populations, streamlining eligibility and enrollment systems, instituting insurance market reforms and using data to drive decisions.37
Next Steps
On December 7, 2012, Oregon received conditional approval from the U.S. Department of Health and Human Services (HHS) to establish a state-based Marketplace.38 The Cover Oregon Marketplace began accepting paper applications on October 1st. The online portal is expected to be operational by mid-October and will begin enrolling qualified individuals, families, and small businesses into coverage at that point. Customers can currently contact community partners for help enrolling in coverage.
Final update made on October 15, 2013 (no further updates will be made)
Establishing the Marketplace
While Governor Pat Quinn (D) had considered establishing a state-based marketplace via executive order, he began moving in the direction of a state-federal partnership marketplace in July 2012.1,2 While the state has established a Partnership Marketplace, the administration still intends to transition to a fully State-based Marketplace in 2015 and will continue with the necessary planning. Illinois will be performing both plan management and consumer assistance functions in the Partnership Marketplace. The Illinois Marketplace has been branded Get Covered Illinois.
In 2011, the Governor signed SB 1555 into law declaring the state’s intent to establish the Illinois Health Benefits Exchange and created the Health Benefits Exchange Legislative Study Committee.3 Legislation establishing a state-based health insurance exchange remains pending (HB 3227).4
Contracting with Plans: In December 2011, Illinois hired a subcontractor to propose a process for qualified health plan (QHP) certification, recertification, and decertification.5 The Department of Insurance also solicited input from carriers on the implementation of QHP standards. In March 2013, the Department of Insurance released guidelines for QHPs that included application guidelines and checklists.6 The guidelines specified that QHPs must offer silver and gold level plans, as well as a child-only plan. Issuers may offer multiple QHPs within metal tiers, but they must offer meaningful differences in plan designs. The bulletin also included requirements related to benefit standards, network adequacy, quality reporting, and rating standards (QHPs will be allowed to adjust their rates based on age (3:1), tobacco use (1.5:1), and 13 geographic rating areas). QHPs will be certified for one year.
On May 1, 2013, Governor Quinn announced the Department of Illinois received applications from six health insurance carriers seeking to provide 165 Qualified Health Plans through the Marketplace.7 Rates were announced in September 2013 and were lower than the Department of Health and Human Services had predicted.8
Dental and Vision Benefits: Stand-alone Dental Plans are offered through the Marketplace and are Qualified Health Plans.9 Dental benefits are also included in some comprehensive health insurance plans through the marketplace.10
Risk Adjustment, Reinsurance, and Risk Corridors (RRR): The Department of Insurance hired subcontractors in December 2011 to evaluate options for the state’s RRR programs. The final report will provide the state with a comprehensive work plan for the implementation of risk adjustment mechanisms. Based on preliminary results, the state has decided to defer to the federal risk adjustment program for 2014 (also a necessity for state-federal partnership exchanges); however the state is evaluating its capacity to run reinsurance at the state level in 2014.11
Consumer Assistance and Outreach: As a Partnership Marketplace, Illinois is prohibited from funding a Navigator program, but is required to establish an In-person Assister program. In May 2013, the state released the Request for Applications (RFA) for the In-person Counselor (IPC) program. On July 17, 2013, the state awarded grants totaling $27 million to 44 community organizations to serve as IPCs to conduct outreach and education, and facilitate enrollment in QHPs through the Marketplace and in Medicaid.12 IPCs must complete a training program designed to prepare them to educate consumers about the ACA and their health care options and pass a certification exam.
The IPC program will operate alongside a federally-funded Navigator program. On August 15, 2013, the Centers for Medicare and Medicaid Services selected 11 navigator organizations in Illinois to receive $3.1 million. The Navigators will perform any of the same roles as the IPCs. Also in August 2013, Governor Quinn signed a bill specifying certification requirements for Navigators.13 These federally-funded Navigators must be certified before performing any of their duties. In addition, they are prohibited from providing advice on which plans individuals should sign up for and must refer consumers who had previously worked with a producer back to that producer unless the producer is not authorized to sell QHPs in the Marketplace or the consumers choose not to receive assistance from the producer. Insurance Brokers are authorized to sell individual insurance plans within the Marketplace, but must be registered with CMS.14
On September 25, 2013, Illinois Health Insurance Marketplace announced “Get Covered Illinois” as the official brand name.15 The brand and logo are part of a larger statewide advertising campaign by Downtown Partners, Chicago that will gradually build through the fall and winter of 2013. Both the website and the official call center, Get Covered Illinois Help Desk, launched on October 1, 2013. The Marketplace includes plans from eight major insurance companies and at least 75 plans are offered in each county.16
Small Business Health Options Program (SHOP) Exchange: In December 2011, the state hired subcontractors to assist with SHOP-specific functions and anticipates deliverables including possible SHOP models and a work plan for the development of a SHOP Marketplace. The state also conducted a survey with potential users of the SHOP Marketplace to identify market conditions and services and features important to potential users.17 Currently, the SHOP Marketplace is facilitated by the federal government through HealthCare.gov. For plan year 2014, employers will select one health insurance plan for their employees. In subsequent years, employees will have more plan choice and employers will be able to select a fixed contribution amount and tier of coverage from which an employee can choose any plan.18
Coordination with Medicaid: Governor Quinn approved SB 26 in July 2013 to expand Medicaid to all adults with incomes below 138% of the federal poverty level (FPL).19 Individuals will answer several questions on the Get Covered Illinois website, and will either be directed to the Marketplace or to ABE, the state’s smart online application system where consumers can apply for Medicaid, nutrition, and income assistance.20
Essential Health Benefits (EHB): The Affordable Care Act (ACA) requires that all non-grandfathered individual and small-group plans sold in a state, including those offered through the Marketplace, cover certain defined health benefits. States must decide whether to benchmark their EHB plan to one of ten plans operating in the state or default to the largest small-group plan in the state. The Illinois Health Care Reform Implementation Council accepted public comments and recommended the BlueCross BlueShield of Illinois BlueAdvantage small group plan supplemented by the federal BlueVision package and the AllKids dental package as the benchmark package.21
Marketplace Funding
In September 2010, the Illinois Department of Insurance received a federal Marketplace Planning grant of $1 million. The Department has also received three federal Level One Establishment grants-one for $5.1 million awarded in August 2011, a second for $32.8 million in May 2012, and a third for $115.8 million in February 2013.22 The grants are used to conduct research on risk adjustment, reinsurance, the navigator program, the certification of QHPs, and the SHOP Marketplace as well as to build the Governor’s health reform website.23 The state will use the majority of the funds to support the design, building, establishment, and maintenance of the IT systems required for the Marketplace. Funds will also be used to set up a design management team, continue the development of a consumer assistance portal, and continue the development of a Navigator education and training program.
Next Steps
On February 13, 2013, Illinois received conditional approval from the U.S. Department of Health and Human Services (HHS) to establish a Partnership Marketplace.24 The state has pursued both plan management and consumer assistance functions. Enrollment in the Marketplace began on October 1, 2013.
Illinois is also continuing its planning efforts to transition to a fully State-based Marketplace in 2015. In January 2013, the Health Care Reform Implementation Council released a survey, available to the public through the Illinois health care reform website, to seek stakeholder input on the functions of a State-based Marketplace.25
This second of three case studies examining key operational aspects of coordinated care initiatives in Medicaid focuses on the Transitional Care Program (TCP), part of Community Care of North Carolina (CCNC), the state Medicaid program’s medical home system. The Transitional Care Program provides robust discharge and transition planning for high-risk Medicaid inpatients, including aged and disabled beneficiaries and those with multiple chronic conditions, to arrange and support sound transitions of these individuals back to the community, and reduce the risk of emergency department use and hospital readmission. Transition planning revolves around the use of hospital-based care managers who coordinate with care managers in medical home practices; centralized health information technology that provides real-time data on Medicaid admissions to the hospital-based care managers, the CCNC regional networks, and practices; and standard care management training and tools statewide.
Section:
0/0
Executive Summary
This second of three case studies examining key operational aspects of coordinated care initiatives in Medicaid focuses on Community Care of North Carolina’s (CCNC) Transitional Care Program (TCP). CCNC is a medical home program that serves 83% of all North Carolina Medicaid beneficiaries. Individuals are enrolled in a practice that participates as a medical home in their community. Regional networks provide practice support to improve care management, with training, data, and tools provided by the central CCNC office, and hire care management staff, who are assigned to the medical home practices. The TCP, which is an enhancement of CCNC, identifies high-risk CCNC enrollees when they are admitted to a hospital, and plans, coordinates, and arranges their transition back to the community. The idea is that robust discharge and transition planning for patients with complex needs can reduce their risk of emergency department use and readmission. The TCP has three main elements. CCNC’s Informatics Center provides the regional networks and medical home practices with real-time data on Medicaid inpatient admissions and the characteristics and utilization history of the patients. The networks receive additional funding to hire hospital-based “embedded” care managers to coordinate transition planning with the CCNC care managers who staff the medical home practices. Training and tools support the embedded care managers.
Key Themes
The CCNC infrastructure provided the foundation for the TCP. Implementation of the TCP was relatively rapid because much of the infrastructure was already in place, including medical home practices and regional networks supported by data analytics and training. The state added a new cadre of hospital-based care managers, expanded central office functions and financing for data and information capability, and developed new models of care and training to support the system.
Obtaining timely hospital data is critical, but challenging. CCNC worked with the state hospital association to get hospitals to provide real-time feeds of admissions data to the Informatics Center. Regional networks must make agreements with individual hospitals that do not participate in the Informatics Center exchange to obtain their Medicaid admissions data, which are often transferred through paper records that are hard to manipulate and sort. Diagnostic information on admissions records may not be complete or accurate.
A strength of the TCP is the blend of common program features and local customization. While CCNC guidance and training on key aspects of the transitional care model apply statewide, regional flexibility is also built in. Care managers are hired locally by the regional networks, which can adapt the program and innovate based on local conditions. CCNC’s convening function facilitates sharing of lessons across regions.
The TCP enjoys strong support. Care managers view the TCP as an integral part of CCNC. In addition, the TCP has catalyzed interaction among community groups that share its goals. Hospitals, individual practices, and community organizations that serve the same patients work closely with regional network staff to manage transitions.
Looking Ahead
A recent evaluation shows that the TCP has had considerable success in reducing readmissions among beneficiaries who receive transitional care. As policymakers seek effective approaches to delivering coordinated care, especially for Medicaid beneficiaries and others with high needs and costs, North Carolina’s TCP demonstrates that a robust network of primary care practices that operate as medical homes, supported by health information technology, care managers, and care management tools, can expand the reach of patient-centered care beyond the walls of the doctor’s office and the hospital into the community, reducing hospitalizations for high-risk individuals.
Issue Brief
IntroductionIn recent years, a growing number of states have undertaken major delivery system reforms in Medicaid, seeking to improve care coordination and health outcomes for Medicaid beneficiaries and reduce spending growth in the program. To help inform the development of such initiatives in other places, the Kaiser Commission on Medicaid and the Uninsured (KCMU) worked with Mathematica Policy Research (Mathematica) to examine key operational features of coordinated care initiatives in Medicaid in three states – Colorado, North Carolina, and Rhode Island.
This issue brief focuses on Community Care of North Carolina (CCNC) – specifically, on the Transitional Care Program, which is designed to reduce hospital readmissions by supporting the transition of high-need Medicaid beneficiaries who are being discharged from the hospital back to the community. The information and perspectives presented here are based on a review of CCNC and Transitional Care Program documents, one-hour telephone interviews with program managers at the state level, and key staff in two of the 14 CCNC regional networks across the state.
Overview of Community Care in North Carolina
Community Care of North Carolina is North Carolina’s widely recognized statewide, community-based Medicaid medical home and care management system. Expanded and enhanced over the last 25 years from an original pilot in a single rural county, CCNC now serves some 1.3 million Medicaid beneficiaries, or 83 percent of all beneficiaries in the state.1 Beneficiaries are enrolled in one of approximately 1,800 participating primary care or group practices statewide that serves as a medical home in their community. Fourteen regional Community Care networks are funded by the state to support the practices as well as coordination with the other local health and social service providers. The regional networks are supported, in turn, by a central, statewide CCNC office that provides them with training, data, and tools to help them work with practices to improve care management and outcomes. State Medicaid funds for care management flow through the central CCNC office to the regional networks, which each hire their own care management staff, including a clinical director, care managers who are assigned to specific practices or are shared across several of them, a pharmacist, a psychiatrist, a behavioral health coordinator, a palliative care coordinator, and other clinical experts and support staff. Each individual practice also receives an enhanced per member, per month fee from the state directly to support their practice’s medical home efforts, to include care management and quality improvement activities.
The Transitional Care Program
In 2008, the state legislature expanded CCNC to include aged and disabled Medicaid beneficiaries (excluding those who are also enrolled in Medicare, known as “dual eligible” beneficiaries). This population has a high prevalence of multiple chronic physical and mental health conditions as well as an array of socioeconomic disadvantages that make them high-risk for gaps in coordination of their care and for multiple hospitalizations. While these individuals make up only one-quarter of North Carolina Medicaid beneficiaries, they account for more than 40% of all Medicaid inpatient admissions, two-thirds of all potentially preventable hospitalizations, and 80% of total Medicaid costs.2
Recognizing the need to ensure coordination and continuity of care in the community for aged and disabled beneficiaries, CCNC decided to strengthen its care management model for this population as well as for those with multiple chronic conditions who were already enrolled in CCNC. The newly created Transitional Care Program (TCP) identifies high-risk CCNC members at the time they are admitted to a hospital, and plans for, coordinates, and arranges their transition from the hospital back to the community. The idea is that robust discharge and transition planning, supported by both a care manager workforce dedicated to this activity, and data analytics and data sharing, can reduce the risk of emergency department (ED) use and hospital readmission for Medicaid patients with complex needs, improve health outcomes, and reduce costs.3 The transitional care program is now statewide. In 2013, it handled approximately 30,000 discharges.
The TCP is not freestanding; it is an overlay on the existing CCNC infrastructure, involving additional capacity and resources aimed specifically at managing the fragile transition of high-need Medicaid beneficiaries from the inpatient hospital setting back to the community. The main elements of the program are:
Centralized health information technology that provides the Community Care networks and practices with real-time data on Medicaid admissions to North Carolina hospitals, along with background on the characteristics and utilization history of each patient;
Additional funding for the regional networks to hire hospital-based, “embedded” care managers to coordinate the discharge and care management of high-risk beneficiaries returning to the community with the care managers already staffing CCNC practices; and
Guidance on care management for embedded care managers, including training and tools to carry out specific functions of their job.
Health Information Technology
The TCP is supported by real-time (twice daily) data feeds from North Carolina hospitals that show new Medicaid admissions and the associated diagnoses. The CCNC Informatics Center combines this information with data it already has on these hospitalized patients from the Medicaid claims data warehouse it maintains. These additional data show the risk status of the patient, the conditions for which he or she is being treated, and the individual’s historical utilization of services. Based on this information, it is possible to identify the newly hospitalized Medicaid beneficiaries who meet the criteria for transitional care, which include a history of multiple ED and inpatient visits, multiple medications, lack of contact with a primary care provider, specified medical conditions, and high costs. Hospital-based care managers (discussed next) receive a real-time report when a Medicaid beneficiary in their regional network is admitted to their hospital as an inpatient. The care managers use the risk information (so called “flags”) to identify the Medicaid patients who have priority for their services. The patient data are also made available to CCNC medical home practices and community-based providers in the region through the CCNC data portal.
The CCNC Informatics Center collaborated with North Carolina hospitals to develop the centralized data exchange on admissions because Medicaid claims data are not timely enough for the TCP’s purposes, and the alternative of having each regional network collect information individually from each of its hospitals would have been burdensome. The collaborative effort initially included a subset of hospitals that were already reporting real-time ED data for public health surveillance purposes through a common vendor, facilitated by the North Carolina Hospital Association.
By 2013, close to 60 hospitals, accounting for more than two-thirds of all Medicaid discharges statewide, were participating in the centralized data exchange on admissions, including major medical centers and referral regions. The regional networks are responsible for obtaining information from hospitals that do not participate in the centralized exchange through the Informatics Center. Non-participating hospitals tend to be small and their data are often transferred through paper records.
Embedded Care Managers
The monthly per member fee that the regional networks receive for each patient gives the networks funding to hire care managers, who are embedded in high-volume hospitals and share responsibility for lower-volume hospitals. Large hospitals can have multiple care managers to handle the system’s volume. Embedded care managers work closely with both hospital staff and community-based health and social service providers. They review new hospital admissions to identify any Medicaid beneficiaries who meet CCNC priority criteria, have a targeted chronic condition, or are appropriate candidates for intensive care management. These patients receive visits from the embedded care manager at least once before they are discharged from the hospital, as well as a home visit, ideally within three business days of their discharge, with a focus on medication reconciliation. Embedded care managers also ensure that a follow-up physician visit is scheduled prior to discharge and verify later that it occurred. Further, care managers can do whatever seems necessary or important to enhance the care of their Medicaid patients, tailoring their efforts to individuals’ needs and preferences.
Because CCNC, including the Informatics Center, operates on a statewide basis, high-risk Medicaid patients who are admitted to hospitals outside their regional network still receive transitional care planning for their return to their local community. The TCP also provides limited services for non-high-risk patients, for example, ensuring that a follow-up appointment is scheduled with their provider before they are discharged.
Care Management Training and Tools
Care management in the TCP follows a standardized, statewide plan that emphasizes team work with patients and their providers; patient self-management, including motivational interviewing and patient education about “red flags” that may warrant a doctor visit post-discharge; medication management; and medical care follow-up (see Appendix). The goal is to meet patients’ care goals and preferences while planning post-hospital care that limits or prevents the need for ED use or re-hospitalization. The hospital-based care managers work with patients for up to four weeks from the time of their admission, and coordinate their transition to community-based care management services for longer-term follow-up when appropriate.
The central CCNC office trains care managers on care management processes and specific techniques and tools (e.g., motivational interviewing), but the regional networks have flexibility to apply them in ways that accommodate local needs and conditions. To illustrate, one regional network has a team of 20 care managers, three or four of whom are embedded in the larger hospitals in the eight-county region served by the network. An embedded care manager reviews the daily feed of data on Medicaid admissions and available claims-based information on each patient’s prior use and risk status. The care manager makes bedside visits to the patients who are high-priority for attention. If a patient has not previously received care management in the community, the care manager introduces the model and explains how it works in the practice in which the patient is enrolled, tells the patient who the care manager in the community is, and walks through what will happen when the patient leaves the hospital. In the case of patients with specified triggers (e.g., a history of readmission), the care manager seeks to identify problems that might have contributed, such as lack of transportation or lack of money for medication, and arrange assistance designed to avoid similar problems following the patient’s discharge from the hospital. The embedded care manager is in communication with the community-based care manager and together they coordinate the patient’s follow-up care.
Key Themes
The existing CCNC infrastructure provided the foundation for the TCP.
North Carolina could implement the TCP in CCNC relatively rapidly because much of the infrastructure required to support it was already in place. Medical home practices and regional networks already had the support of data analytics, training, and program guidance provided centrally by CCNC. The regional networks already supported the practices with patient information based on claims history, practice-based care managers, specialized personnel, such as pharmacists and psychiatrists, and linkages to other providers in the community. The TCP could be implemented by funding CCNC to add some new components to this infrastructure – a new cadre of hospital-based care managers; expanded central office functions and financing to build out CCNC’s existing information support (i.e., combining real-time feeds of admission data and related risk-assessment information); development of new models of care; and training necessary to support the system. In states lacking such a foundation, it would be necessary to develop an infrastructure along the lines of CCNC’s before a comparable program of transitional care could be implemented.
In addition to the direct costs of the TCP, there are other costs states should expect when medical home programs like CCNC are expanded to include the aged and disabled. Expanding CCNC to this population required increased funding to support both the caseload growth and higher per member per month fees paid to medical home practices to reflect the greater needs of aged and disabled individuals for services such as psychiatry and pharmacy services and other support. The inclusion of aged and disabled Medicaid beneficiaries also added to the work of state agencies because it increased the need for coordination and information-sharing among health and social service programs serving the same people.
Obtaining timely hospital data is critical, but challenging.
Timely data on hospitalizations are essential for the transitional care model to work. CCNC worked with the state hospital association to gain hospital agreement to provide the twice-daily feeds of admissions data to the CCNC Informatics Center. CCNC decided to start with hospitals that were already reporting real-time data to a common vendor, as mentioned earlier. This way, the technical challenges were lowered and, with permission, those data could now also be transferred to CCNC.
The regional networks still rely on one-to-one agreements with individual hospitals that are not in the CCNC system to obtain information on their Medicaid admissions; most such information is sent by fax and in printouts. Although data in these formats are much harder than electronic data to manipulate and sort, the networks report that this additional information is useful to them and to the central CCNC Informatics Center. At the same time, CCNC observed that the automated data received from hospitals are only as useful as the input they reflect. The diagnostic information reported by hospitals at the time of admission may not be complete or accurate. Other information that care managers may want, like patients’ room numbers, are not reported on the feeds. CCNC is now assessing what kinds of improvements might enhance the value of the information it receives. Thus, systems like this may be best seen as evolving tools that can benefit from review and improve over time.
A strength of the TCP is the blend of common program features and local customization.
CCNC has articulated guidance and expectations that apply to the TCP statewide. State guidance outlines the minimum intensity of care manager contact with hospitalized patients, the risk factors that should be used to prioritize patients for care management, and the timeframes in which different activities are to take place. Also, all care managers – both practice-based and hospital-based – are trained on the transitional care model and the role of the embedded care managers. Such training builds shared expectations as well as important relationships. For example, hospital- and community-based care managers learn how to work together most efficiently. They also understand how expectations change for a care manager who shifts settings or carries out care management functions in both settings, which sometimes occurs. The statewide training program also fosters relationships among the staff of regional networks across the state. Regional CCNC staff say that, because care managers across the regions know one another and have a common understanding of program expectations, they are better able to serve patients from other regions who may become hospitalized in their region.
But while the TCP is a statewide program, it also builds in regional flexibility. In particular, all hiring of care managers is handled locally by the regional networks, which are also responsible for the formal job description and assignments. Also, regional networks can adapt the program as appropriate to respond to local conditions. For example, in some urban areas, care managers may be able to make home visits to four or five patients quickly if they reside in the same housing complex, whereas care managers in rural areas with longer travel times likely require more time to visit the same number of patients. Similarly, care managers in urban areas with large numbers of hospitalized Medicaid patients may spend all their time on a particular hospital floor working with the discharge staff, whereas, in rural areas, where volume is lower and more dispersed, program efficiency may require that a care manager divide his or her time among the clinic, the hospital, and the patient’s home.
Regional networks also have latitude to innovate, and CCNC’s convening function facilitates the sharing of lessons learned from their innovations. To illustrate, it is helpful to consider how one region’s approach to a universal challenge – the small number of patients whose very high utilization drives a large share of total spending – was scaled up. Staff of this region adopted the strategy of identifying individual high-utilizing patients in the network’s largest hospital and having the entire care management team meet. The patient’s social worker, practice-based care manager, psychiatric provider, and hospital-based care manager come together in these meetings to discuss the individual’s specific circumstances and develop a workable care plan designed to enhance his or her quality of life and prevent ED visits and readmissions. Then, if the patient comes into the hospital, this care plan gets triggered. Because the regional network staff view the intensive meeting strategy as a success, they are now expanding it to other hospitals in the region, and they have also presented it to other regional networks in statewide CCNC sessions. Within the CCNC structure, there is the opportunity to share experiences more broadly. The capacity for innovation within a common framework appears to be a strength of the program.
The TCP appears to enjoy strong support from the regional networks and care managers as well as community-based organizations.
Care managers view the TCP as an integral part of CCNC. In addition, the TCP has catalyzed interaction among diverse community groups that share its goals. Staff of one regional network stressed that primary care providers cannot plan and implement smooth transitions by themselves – broader participation is key. Hospital staff, individual practices, and community organizations that serve the same patients are all reported to work closely with regional network staff. At the same time, it was noted, it is challenging to develop and carry out transitional care plans in a system with many stakeholders with different concerns, and to establish all the channels of communication needed to make the program work.
Conclusion
A recent evaluation of the Transitional Care Program shows that the model has had considerable success.4 In particular, it documents that Medicaid beneficiaries with complex chronic conditions who received transitional care were 20 percent less likely to experience a readmission during the subsequent year, compared to clinically similar patients who received usual care, and that they were also less likely to have multiple readmissions. As state and federal policymakers seek effective approaches to delivering coordinated care, especially for Medicaid beneficiaries and others with the greatest needs and costs, North Carolina’s TCP demonstrates that a robust network of primary care practices that operate as medical homes, supported by health information technology, care managers, and care management tools, can expand the reach of patient-centered care beyond the walls of the doctor’s office and the hospital into the community, reducing hospitalizations for high-risk individuals.
This issue brief was prepared by Marsha Gold and Winnie Wang of Mathematica Policy Research and Julia Paradise of the Kaiser Family Foundation’s Commission on Medicaid and the Uninsured (KCMU).
The authors express their appreciation to Jennifer Cockerham, Wendy Sause, Carolyn Smith, Tork Wade, Jennifer Wehe, and Dr. Tom Wroth, all of Community Care of North Carolina, whose expertise and insights were invaluable to this project.
Appendix: CCNC Transitional Care Functions
Face-to-face patient encounters
Embedded care manager/regional network is notified of all admissions and their risk status.
Care manager visits high-risk patients at the bedside (at a minimum) and works with the patient, family, and hospital discharge staff to plan for smooth and timely discharge.
Home visit arranged post-discharge; goal is home visit within 3 days of discharge for high-risk patients.
Practice-based care manager works with patient at home, office, or community to assess needs and reconcile medications.
Patient education and self-management
For high-risk patients with particular conditions, care manager provides individualized patient education and a self-management notebook that serves as a personal health record and communication tool.
Care manager teaches patient and family to identify “red flags,” or complications requiring a call to the doctor to avoid an ED visit/readmission.
Care manager uses motivational interviewing and other education strategies to foster good patient outcomes.
Medication management
CCNC works to gather, organize, and share information on medication use with community-based providers to identify and resolve issues (i.e., drug duplication, interactions, adverse events, sub-optimal use, etc.)
Care manager and/or pharmacist reviews medications with patient and/or caregiver at home, in the clinic, or by telephone, helps the patient obtain needed prescription drugs, and educates him or her on proper use. Pharmacist conducts a global review of medication regimen and drug history to identify and address complex topics.
Follow-up calls and contacts
Case manager works to ensure timely follow-up appointment(s) with primary care provider/specialists following hospital discharge, and addresses barriers to patient follow-through.
Case manager helps patient prepare questions, a notebook, and other information for the follow-up visit.
Transitional care follow-up may continue for 30 days. After 30 days, patient may require continued care through general/primary care management.
DuBard C, J Cockerham, and C Jackson, “Collaborative Accountability for Care Transitions: The Community Care of North Carolina Transitions Program,” North Carolina Medical Journal 73(1), April 5, 2012. ↩︎
Jackson C, T Trystad, D DeWalt, and C DuBard, “Transitional Care Cut Hospital Readmissions for North Carolina Medicaid Patients with Complex Chronic Conditions,” Health Affairs 32(8): 1407-1415, August 2013. ↩︎
As a woman, it is especially important for you to understand how the Affordable Care Act (ACA) will change healthcare in 2014. Your healthcare needs differ from men’s and you are often the main healthcare decision maker for your family. Obamacare broadens the range of many services that are important to women that health plans now must cover, some without any co-pay. In addition, it expands access to coverage through Medicaid and the new state health marketplaces. Changes important to women include:
No More Pre-Existing Condition Limits
Plans will no longer be allowed to deny coverage to pregnant women or those who have been diagnosed with depression or experienced domestic violence.
Equitable Insurance Pricing for Men and Women
If you get your insurance on the individual market or through the new insurance marketplaces, your plan can no longer charge you a different premium than it would charge a man of the same age. This practice was called gender-rating and is no longer permitted.
Preventive Services
If you have private insurance and you or your family needs a vaccine, a health screening, or a number of other recommended preventive services– deemed “highly effective” in preventing health problems–your insurance plan probably covers it without any cost sharing. These include mammography, Pap smears, HPV vaccines, STI screening, and annual well woman visits.
Contraceptives
If you need birth control, you probably no longer have to pay anything out of pocket for it if you have private insurance. The new law requires most private plans to cover all forms of prescription birth control (but not all brands) without any co-pay. Women with Medicaid also get birth control covered without cost-sharing.
Maternity Care
Obamacare requires that plans in the individual market and the new state marketplaces cover maternity services including childbirth, prenatal visits, and well-baby care. Most employer plans were already required to cover maternity care, but now you will also get prenatal visits and screenings, breast pump rentals, and breastfeeding counseling without any co-pay because they are considered preventive services.All state Medicaid programs cover maternity care as well, but the specific services may vary from state to state. If you are nursing and work for a large employer (50 or more employees), you now have access to a private room and break time to express milk for your baby.
Abortion
Many private insurance plans cover abortion. If you’re signing up in your state’s new marketplace, your coverage for abortion services will depend on where you live and the plan you choose. Some states have banned abortion coverage from all plans in the marketplace while some allow it. You’ll have to check the details of your policy to see if it covers the procedure. State Medicaid programs typically limit abortion coverage to pregnancies that are a result of rape or incest or in cases when the pregnancy is a threat to a woman’s life. Some state Medicaid programs may cover abortion under other circumstances.
Direct Access to Ob-Gyns
If you have private insurance, most plans now must allow you to choose an ob-gyn as your primary provider or see an ob-gyn for basic care without a referral.
To find out more about how the ACA could affect you, visit www.healthcare.gov.
This fact sheet is also available in Spanish: en español.
The Centers for Medicare & Medicaid Services (CMS) recently released information about the Medicare Part D stand-alone prescription drug plans (PDPs) that will be available in 2014.1 Of the 36 million beneficiaries enrolled in Part D plans, about 63 percent (22.7 million) are in PDPs; the others are enrolled in Medicare Advantage drug plans.2 This Medicare Part D Spotlight provides an overview of the 2014 stand-alone PDP options and key changes from prior years.3
Summary of Key Findings
Medicare Part D continues to be a marketplace with an array of competing plans offered at a wide range of premiums and benefit designs.
In 2014, Medicare beneficiaries will have a choice of 35 stand-alone PDPs, on average, up by four from 2013. The average premium (weighted by enrollment) is expected to increase by 5 percent across all PDPs from 2013 to 2014 unless many new or current enrollees select lower-priced plans. As in prior years, the average monthly premium for 2014 masks a significant amount of variation across plans. Enrollees in two of the most popular PDPs will experience 50-percent premium increases if they stay in the same plans in 2014, while enrollees in three other popular PDPs will see lower premiums.
Beneficiaries receiving Low-Income Subsidies (LIS) will have access to a modestly higher number of plans for no monthly premium in 2014 compared to 2013, but some plans have lost their so-called “benchmark” status for 2014, which will require enrollees to switch plans to maintain the full value of their subsidies.
The majority of plans offered in 2014 will offer no gap coverage beyond that which is required by the Affordable Care Act (ACA) of 2010, which phases out the coverage gap by 2020. Under current law, for 2014, manufacturer prices for brand-name drugs purchased in the gap will be discounted by 50 percent (with plans paying 2.5 percent and enrollees paying the other 47.5 percent), and plans will pay 28 percent of the cost for generic drugs in the gap (with enrollees paying 72 percent).
Notable trends for 2014 include a growing share of PDPs using preferred pharmacy networks and adopting more formulary cost-sharing tiers. For example, a majority of PDPs now use preferred pharmacy networks where cost sharing is lower when enrollees use preferred pharmacies and higher outside the preferred network. In 2006, few PDPs used this type of pharmacy network.
Key Findings
Part D Plan Availability
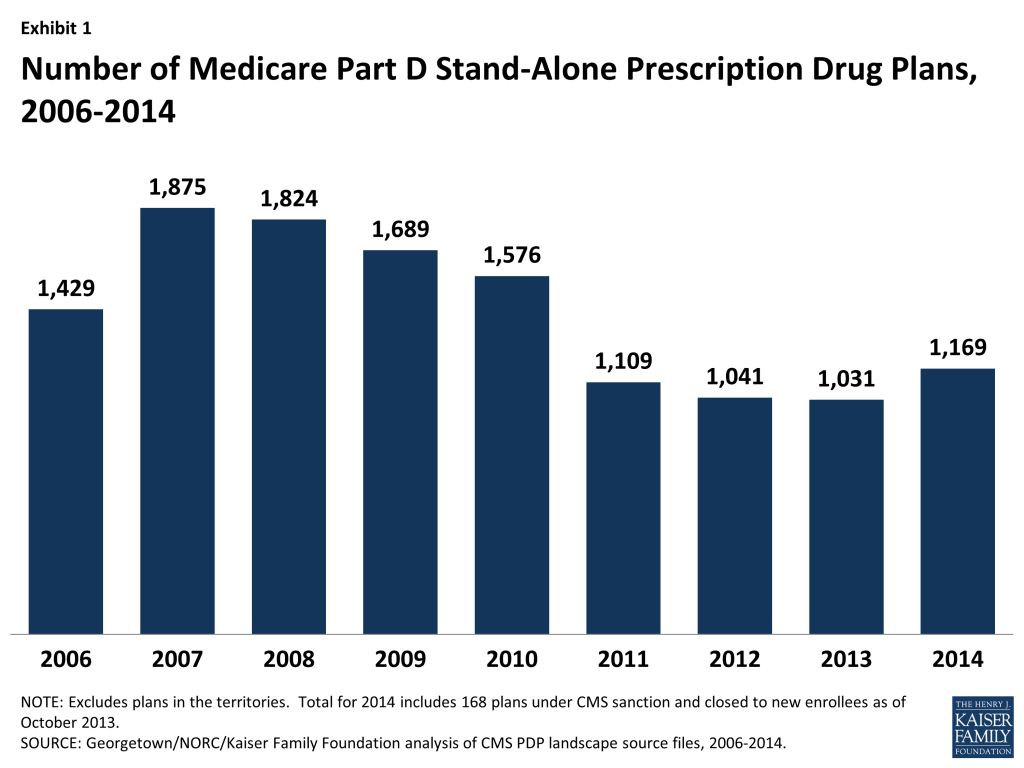
In 2014, a total of 1,169 PDPs will be offered nationwide, up by 13 percent from the 1,031 PDPs offered in 2013.
Despite the increase in PDPs available in 2014, this total represents 706 fewer PDPs than the peak level in 2007 of 1,875 plans. (Exhibit 1)
Exhibit 1. Number of Medicare Part D Stand-Alone Prescription Drug Plans, 2006-2014
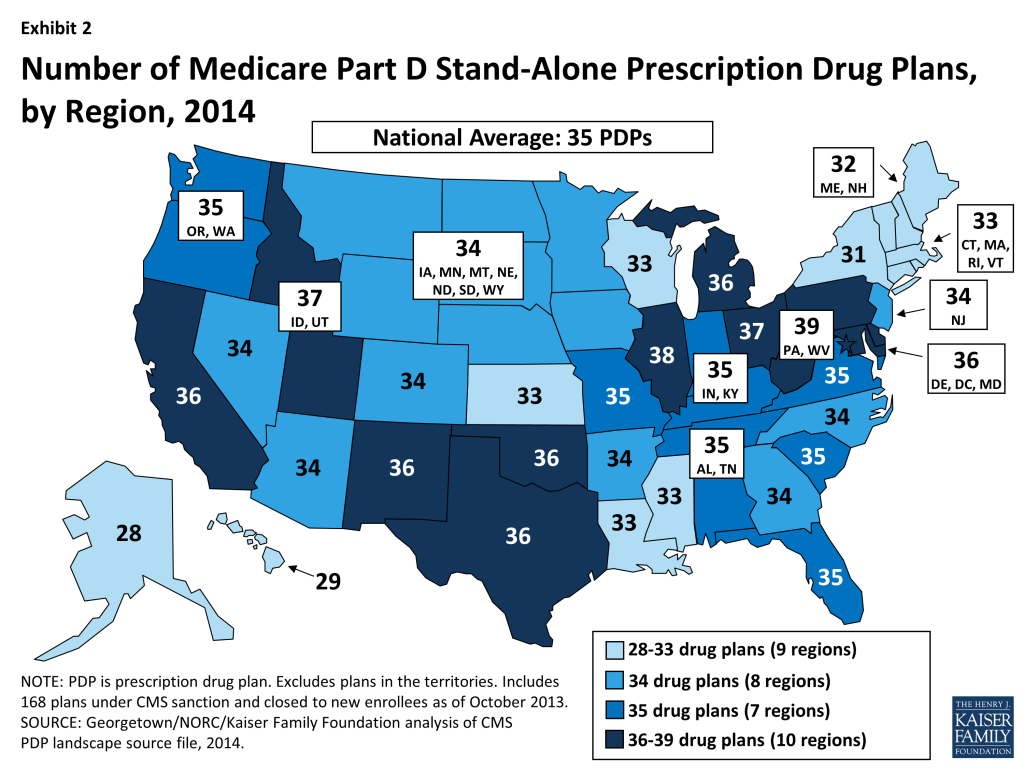
Beneficiaries across the country continue to have a substantial number of Part D plan choices. The average beneficiary will have a choice of 35 stand-alone PDPs in 2014.
The number of PDPs per region in 2014 will range from a low of 28 PDPs in the Alaska region to a high of 39 PDPs in the Pennsylvania/West Virginia region. The number of plans is higher in every region compared to 2013; for example, up by five in Alaska and by one in Pennsylvania/West Virginia. (Exhibit 2; Appendix 1, Table A1)
Exhibit 2. Number of Medicare Part D Stand-Alone Prescription Drug Plans, by Region, 2014
Inside the Part D marketplace in 2014, 212 new PDPs entered the market and 46 PDPs exited the market entirely. Most of the plan exits are from one company (EnvisionRx), which eliminated its enhanced plan option that currently has only about 7,300 enrollees across 34 regions. Of the new PDP entrants, about half are PDPs offered by plans sponsors new to the PDP market, while others are new offerings by existing plan sponsors; 28 are replacing PDPs offered by the same sponsor.
Two new plan sponsors are entering the program with a broad set of 2014 plan offerings: Smartbridge Life Insurance Company will offer two Transamerica MedicareRx PDPs in all regions except New York; and Symphonix Heath has a new PDP in 30 regions, co-branded with RiteAid pharmacies in 18 regions.
Humana is reorganizing its PDP offerings for 2014 by discontinuing the Humana Complete PDPs, which have been in the program since 2006; rebranding the Humana Walmart-Preferred PDPs, introduced in 2011, as Humana Preferred Rx Plans; and introducing a set of new PDPs: the Humana Walmart Rx Plans, priced at $12.60 per month in most regions (the lowest-priced plan nationwide, excluding the territories). Both PDPs will use preferred pharmacy networks.4
Cigna has restructured its PDP offerings and added offerings so that three PDPs are available in each region. In addition, Cigna offers a fourth PDP in each region as a result of its 2012 acquisition of HealthSpring; these PDPs have been rebranded as Cigna-HealthSpring Rx PDPs.
Both the SilverScript PDPs, offered by CVS Caremark in all 34 regions with 3.4 million enrollees, and the SmartD Rx PDPs, a new national PDP offering in 2013 with about 88,000 enrollees, were placed under sanctions that ban any new enrollment and all marketing activities. CVS Caremark has indicated that it expects to remain under sanction throughout this year’s annual enrollment period. SmartD was acquired by Express Scripts in September.
Monthly Premiums
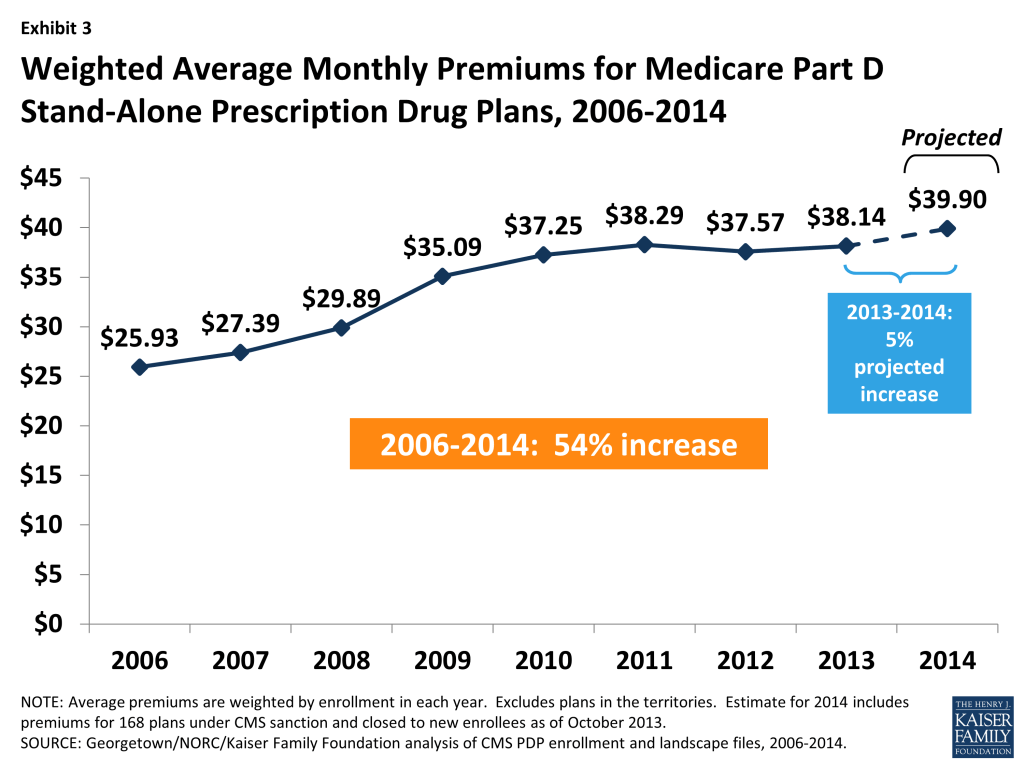
The projected average monthly PDP premium for 2014 will be $39.90 (weighted by 2013 enrollment, assuming beneficiaries remain in their current plan).5 This is a 5 percent increase ($1.76) from the weighted average monthly premium of $38.14 in 2013, and a 54 percent increase from $25.93 in 2006, the first year of the Medicare Part D drug benefit. Average monthly premiums (weighted by enrollment) for PDPs have risen every year since 2006, except for a modest drop between 2011 and 2012. (Exhibit 3)
Exhibit 3. Weighted Average Monthly Premiums for Medicare Part D Stand-Alone Prescription Drug Plans, 2006-2014
CMS has reported that the average premium for standard Part D coverage offered by PDPs and Medicare Advantage drug plans between 2013 and 2014 is increasing by about $1; the higher premium increase reported here is based on PDPs only, excluding Medicare Advantage drug plans, and also includes PDPs offering enhanced coverage, which typically have higher premiums. For PDPs offering only the basic benefit in both years, the 2014 premium is projected to be 1 percent lower than in 2013 (based on current enrollment patterns), whereas premiums for enhanced PDPs are projected to rise by about 10 percent. Enrollment changes during the annual enrollment period—in particular, switches to newly available lower-premium PDPs—are likely to reduce modestly the weighted average increase reported here.
Underneath these overall program trends, there is wide variation across plans in premium changes from 2013 to 2014, with a greater share of enrollees projected to pay more per month if they stay in their current plans than the share expected to pay less or a similar amount.
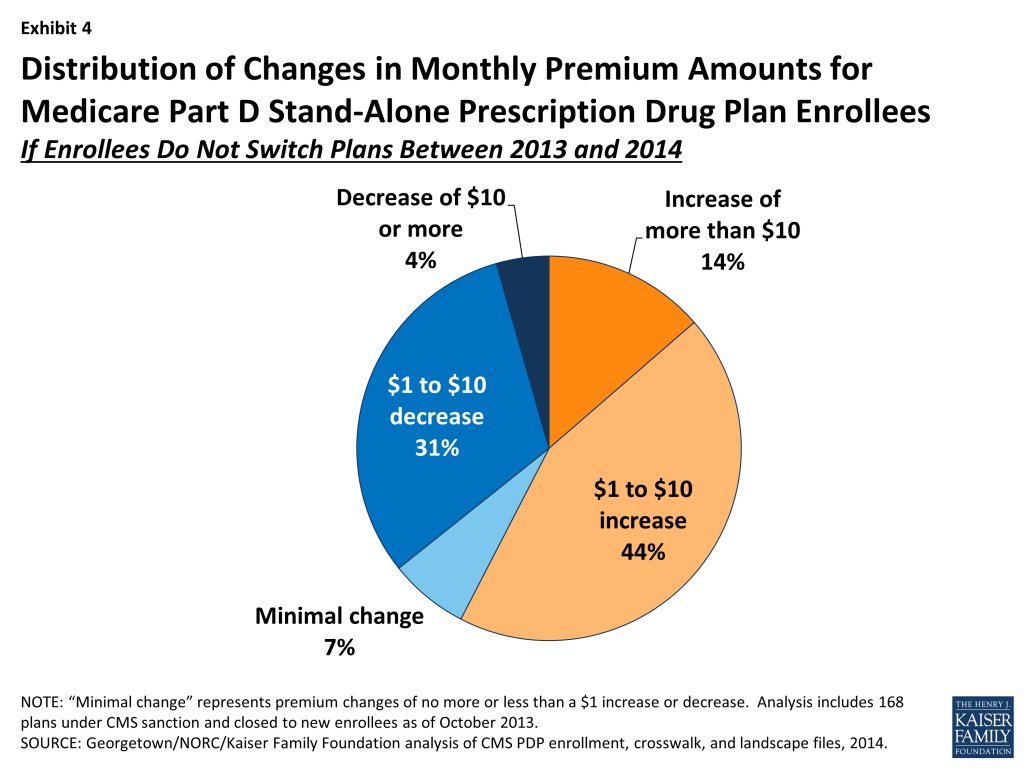
A majority of all PDP enrollees (58 percent) are projected to pay at least $1 more per month if they stay in their current plans; this includes 14 percent (2.5 million beneficiaries) who will experience an increase of more than $10 in their monthly plan premium in 2014 unless they select a less expensive plan and another 44 percent who would pay from $1 to $10 more if they remain in their current plan in 2014.6(Exhibit 4)
Exhibit 4. Distribution of Changes in Monthly Premium Amounts for Medicare Part D Stand-Alone Prescription Drug Plan Enrollees
By contrast, 35 percent of all PDP enrollees are projected to see a decrease of $1 per month or more if they stay in their current plans in 2014; this includes 4 percent of PDP enrollees (approximately 800,000 beneficiaries) who would see premium reductions of at least $10 if they stay with their current PDPs, and another 31 percent who would experience a premium decrease of between $1 and $10.
The remaining 7 percent of PDP enrollees will face a nominal change in their monthly premium (no more or less than a $1 increase or decrease) if they stay in their current plan in 2014.
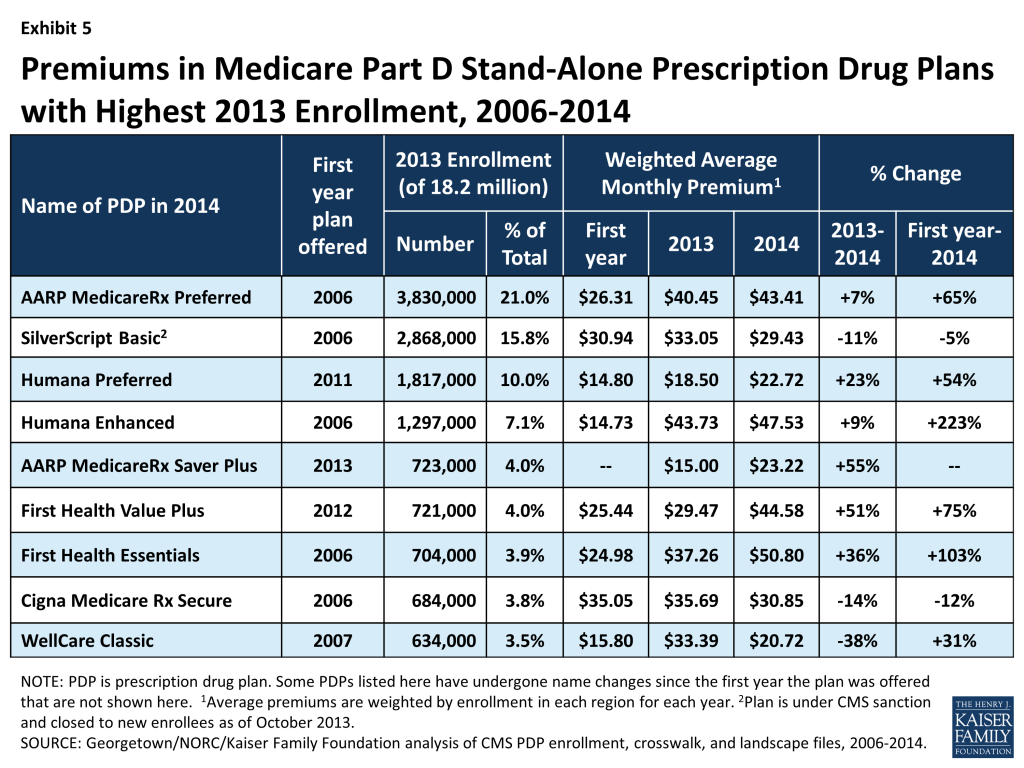
Changes to premiums from 2013 to 2014, averaged across regions and weighted by 2013 enrollment, vary widely across some of the most popular Part D PDPs. (Exhibit 5)
Exhibit 5. Premiums in Medicare Part D Stand-Alone Prescription Drug Plans with Highest 2013 Enrollment, 2006-2014
Premiums for two of the largest PDPs will increase by more than 50 percent next year. United HealthCare’s AARP Medicare Rx Saver Plus, which was new to the market in 2013 and had the lowest premium in all regions, is increasing its average monthly premium by 55 percent from $15.00 to $23.22—still well below the national average but no longer the nation’s least expensive PDP. First Health Value Plus, which was new to the market in 2012 and now operated by Aetna, is increasing its average premium by 51 percent from $29.47 to $44.58.
Enrollees in two other large PDPs will face a double-digit percentage increase, on average, in their monthly premium between 2013 and 2014 if they stay in the same plan: First Health Essentials (formerly First Health Premier), with a 36 percent increase (from $37.26 to $50.80), and Humana Preferred Rx Plan (formerly Walmart-Preferred), with a 23 percent increase (from $18.50 to $22.72).
By contrast, enrollees in another three of the largest PDPs will experience a double-digit percentage decrease, on average, in their monthly premium if they stay in the same plan: Wellcare Classic (38 percent lower, from $33.39 to $20.72), Cigna Medicare Rx Secure (formerly Plan One) (14 percent lower, from $35.69 to $30.85), and SilverScript Basic (11 percent lower, from $33.05 to $29.43).
Looking at the weighted average premium changes over the longer term in the most popular PDPs that have been available since the start of the Part D program in 2006:
The average premium for Humana PDP Enhanced, although up just 9 percent over 2013, is more than three times as large as it was in 2006, having increased from $14.73 to $47.53.
The average premium for the PDP with the most enrollees in 2013, UnitedHealth’s AARP Preferred MedicareRx PDP, has increased 65 percent since 2006 (from $26.31 to $43.41), close to the program’s overall average premium increase of 54 percent.
By contrast, the monthly premium for SilverScript Basic, operated by CVS Caremark, is 5 percent lower in 2014 ($29.43) than it was in 2006 ($30.94).
Average PDP monthly premiums, weighted by 2013 enrollment, will vary widely in 2014 across regions, ranging from $27.99 per month for PDPs in the New Mexico region (one of only four regions with an average under $35) to $46.53 per month for PDPs in the Idaho/Utah region and $45.04 in South Carolina. (Appendix 1, Table A2)
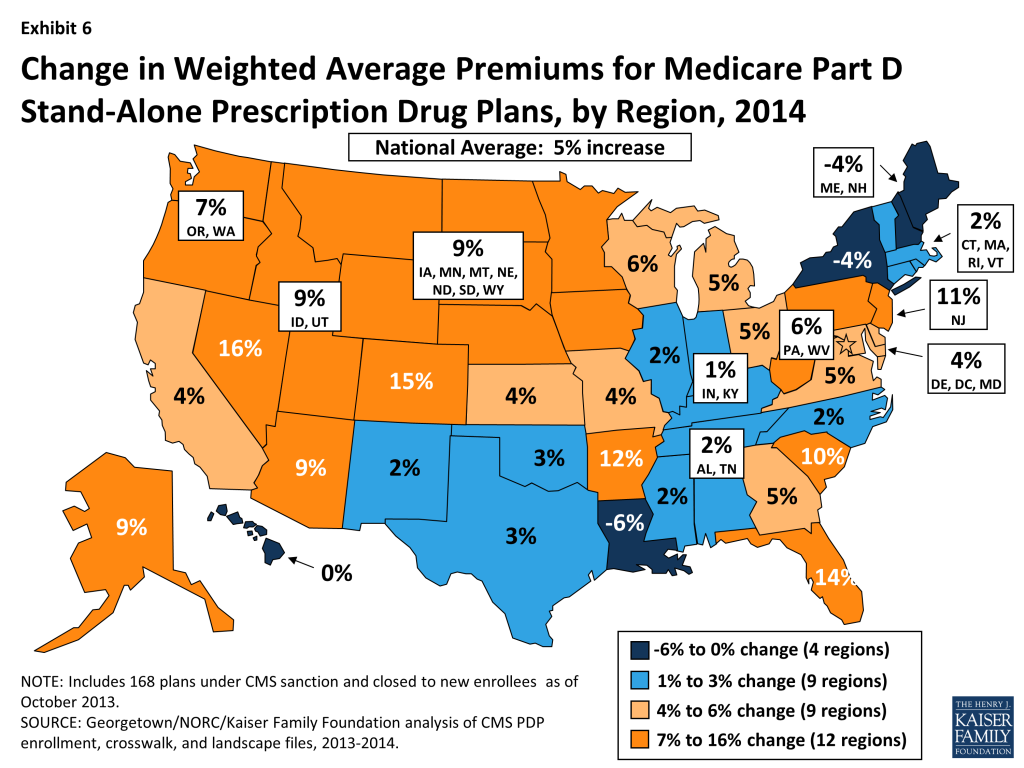
Premium changes from 2013 to 2014 vary considerably by region. For example, average premiums in four regions are projected to fall slightly, whereas the highest average premium increases across regions will be 16 percent and 15 percent in Colorado and Nevada, respectively. (Exhibit 6)
Exhibit 6. Change in Weighted Average Premiums for Medicare Part D Stand-Alone Prescription Drug Plans, by Region, 2014
The regional variation in projected premium changes is influenced by regional differences in which PDPs have the highest share of enrollment and by decisions of plan sponsors to adjust premiums differently from region to region. For example, monthly premiums for the three PDPs with the most enrollees in Florida (which has a statewide premium increase of 14 percent) are increasing by double-digit percentages, whereas premiums for the three largest PDPs in New York (which has a statewide premium decrease of 4 percent) are either increasing by less than $1 or decreasing. More specifically, the premium for the AARP MedicareRx Preferred PDP—the plan with the most enrollees in both regions—increased by 11 percent in Florida, but by only 1 percent in New York.
These average and plan-level premium amounts do not take into account the income-related Part D premium that took effect in 2011 for Part D enrollees with higher annual incomes ($85,000/individual and $170,000/couple). Established by the ACA, the income-related Part D premium requires higher-income enrollees to make an additional payment to the government for Part D coverage, regardless of the plan selected. In 2014, the monthly surcharge will range from $12.10 to $69.30, depending on income, in addition to the monthly premium payment for the specific Part D plan.7 An estimated 5 percent of Part D enrollees are required to make these additional payments in 2013.8 Under current law, the income thresholds are not indexed to increase annually until 2020, which will result in an increasing share of Part D enrollees paying the income-related premiums over the next several years.
Benefit Design: The Coverage Gap and Deductibles
All beneficiaries who reach the coverage gap, or “doughnut hole,” in 2014 will pay less than the full cost of the price of their drugs, as a result of changes made by the Affordable Care Act. For 2014, manufacturer prices for brand-name drugs purchased in the gap will be discounted by 50 percent, with plans paying an additional 2.5 percent and enrollees paying the remaining 47.5 percent. Plans will pay 28 percent of the cost for generic drugs in the gap, with enrollees paying 72 percent. In 2014, the coverage gap begins after an enrollee incurs $2,850 in total drug spending and ends after an enrollee has spent a total of $4,550 out of pocket (or $6,691 in total drug costs under the standard benefit).9 At that point, catastrophic coverage begins, where enrollees generally pay only 5 percent of drug costs. (Appendix 2)
Most Part D plans will offer little or no gap coverage in 2014 beyond what is required by the ACA under the standard benefit. With all Part D enrollees now getting coverage for a share of their costs in the gap, the value of additional gap coverage offered by plans, beyond what the law requires, will become lower each year approaching 2020, when beneficiaries will only be responsible for 25 percent of their total drug costs in the gap.
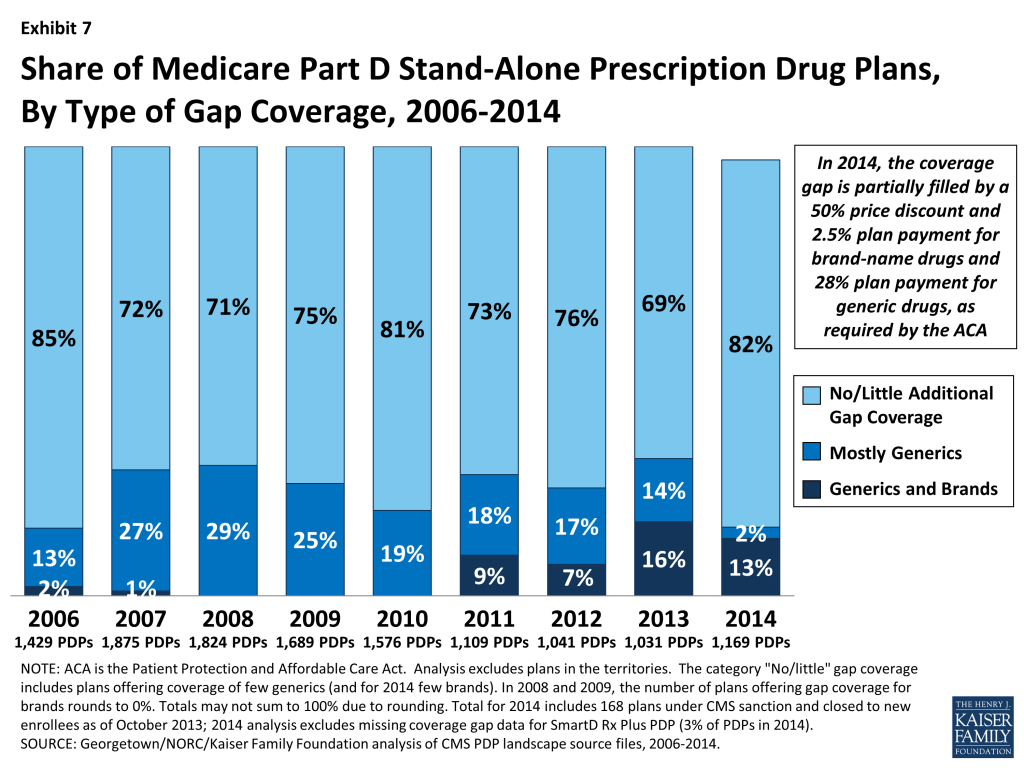
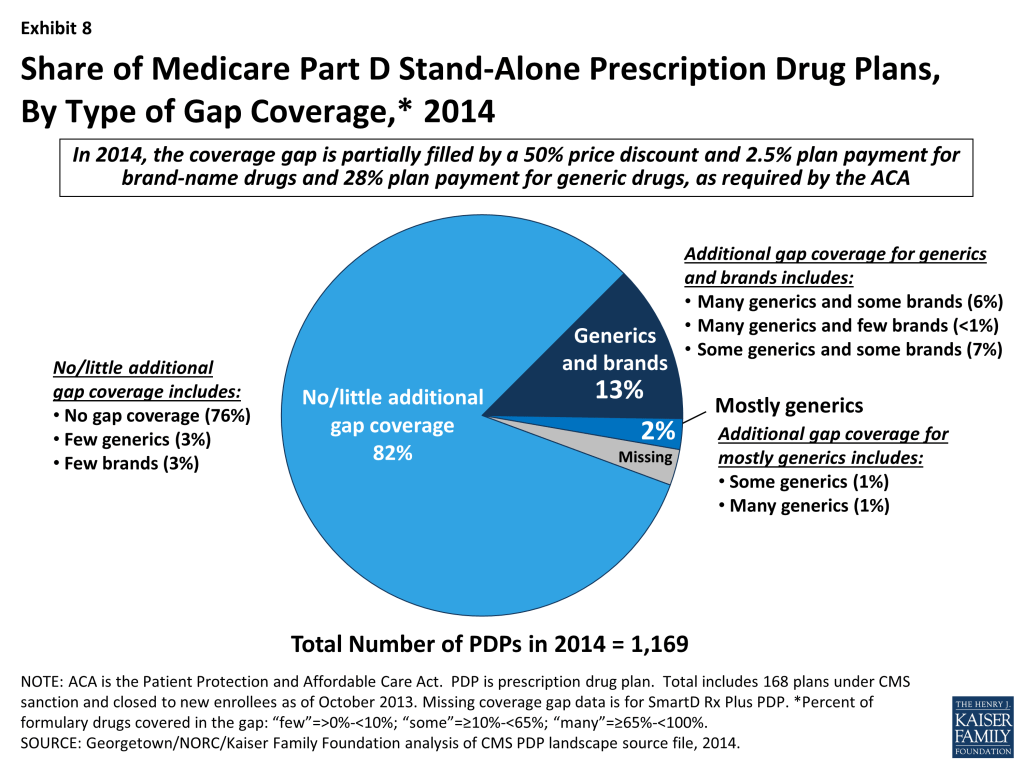
In 2014, about 82 percent of all PDPs will offer either no or very limited gap coverage—76 percent of plans will offer nothing beyond what the ACA requires and 6 percent will cover fewer than 10 percent of the drugs on their formulary.10 This is an increase from 2013, when 69 percent of PDPs were offering no or limited additional gap coverage—meaning a somewhat smaller share of plans will offer some gap coverage beyond what the ACA requires in 2014 than in 2013. (Exhibits 7 and 8; Appendix 1, Table A3)
Exhibit 7. Share of Medicare Part D Stand-Alone Prescription Drug Plans, By Type of Gap Coverage, 2006-2014Exhibit 8. Share of Medicare Part D Stand-Alone Prescription Drug Plans, By Type of Gap Coverage, 2014
Among the 15 percent of PDPs offering additional gap coverage in 2014 beyond what the law requires (defined as covering more than a “few” generics or brands), a very small share of PDPs (2 percent) limit gap coverage to generic drugs, with no additional gap coverage for brand-name drugs. (Exhibit 8)
In 2014, 13 percent of PDPs (115 PDPs, including those offered by Cigna, Coventry/First Health, Silverscript, UnitedHealth, and some Blue Cross plans) will cover “some” brand-name drugs (defined as between 10 percent and 65 percent of the brand-name drugs on the plan’s formulary) in the coverage gap, about twice the level in 2012. No PDP will offer full gap coverage for all drugs on their formulary in 2014.
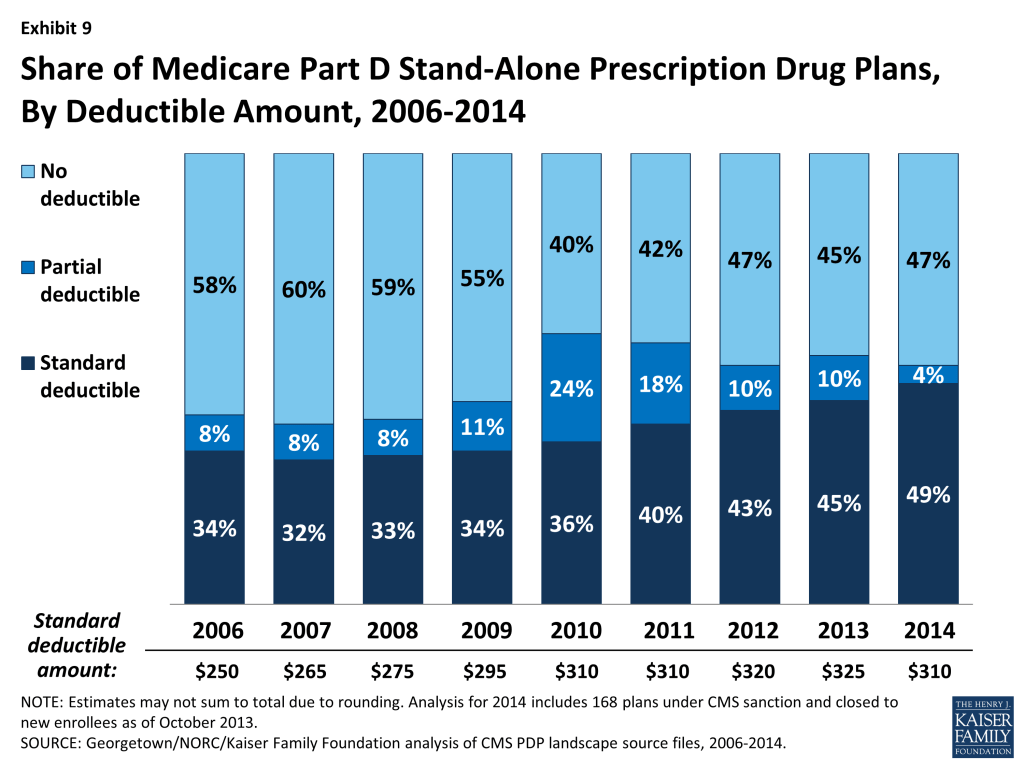
A majority of PDPs (53 percent) will charge a deductible in 2014, the same as in 2013. Most PDPs with a deductible will charge the standard $310 amount (which is down somewhat from the standard amount of $325 in 2013 as a result of lower per-capita costs in Part D11 ). Among PDPs that charge a deductible, the share with a deductible below the standard amount has declined substantially from 2010 to 2014 (from 24 percent to 4 percent). (Exhibit 9)
Exhibit 9. Share of Medicare Part D Stand-Alone Prescription Drug Plans, By Deductible Amount, 2006-2014
Low-income Subsidy (“Benchmark”) Plans
The total availability of benchmark plans—PDPs available for no monthly premium to Low-Income Subsidy (LIS) enrollees—will be somewhat greater in 2014 than in the five previous years.
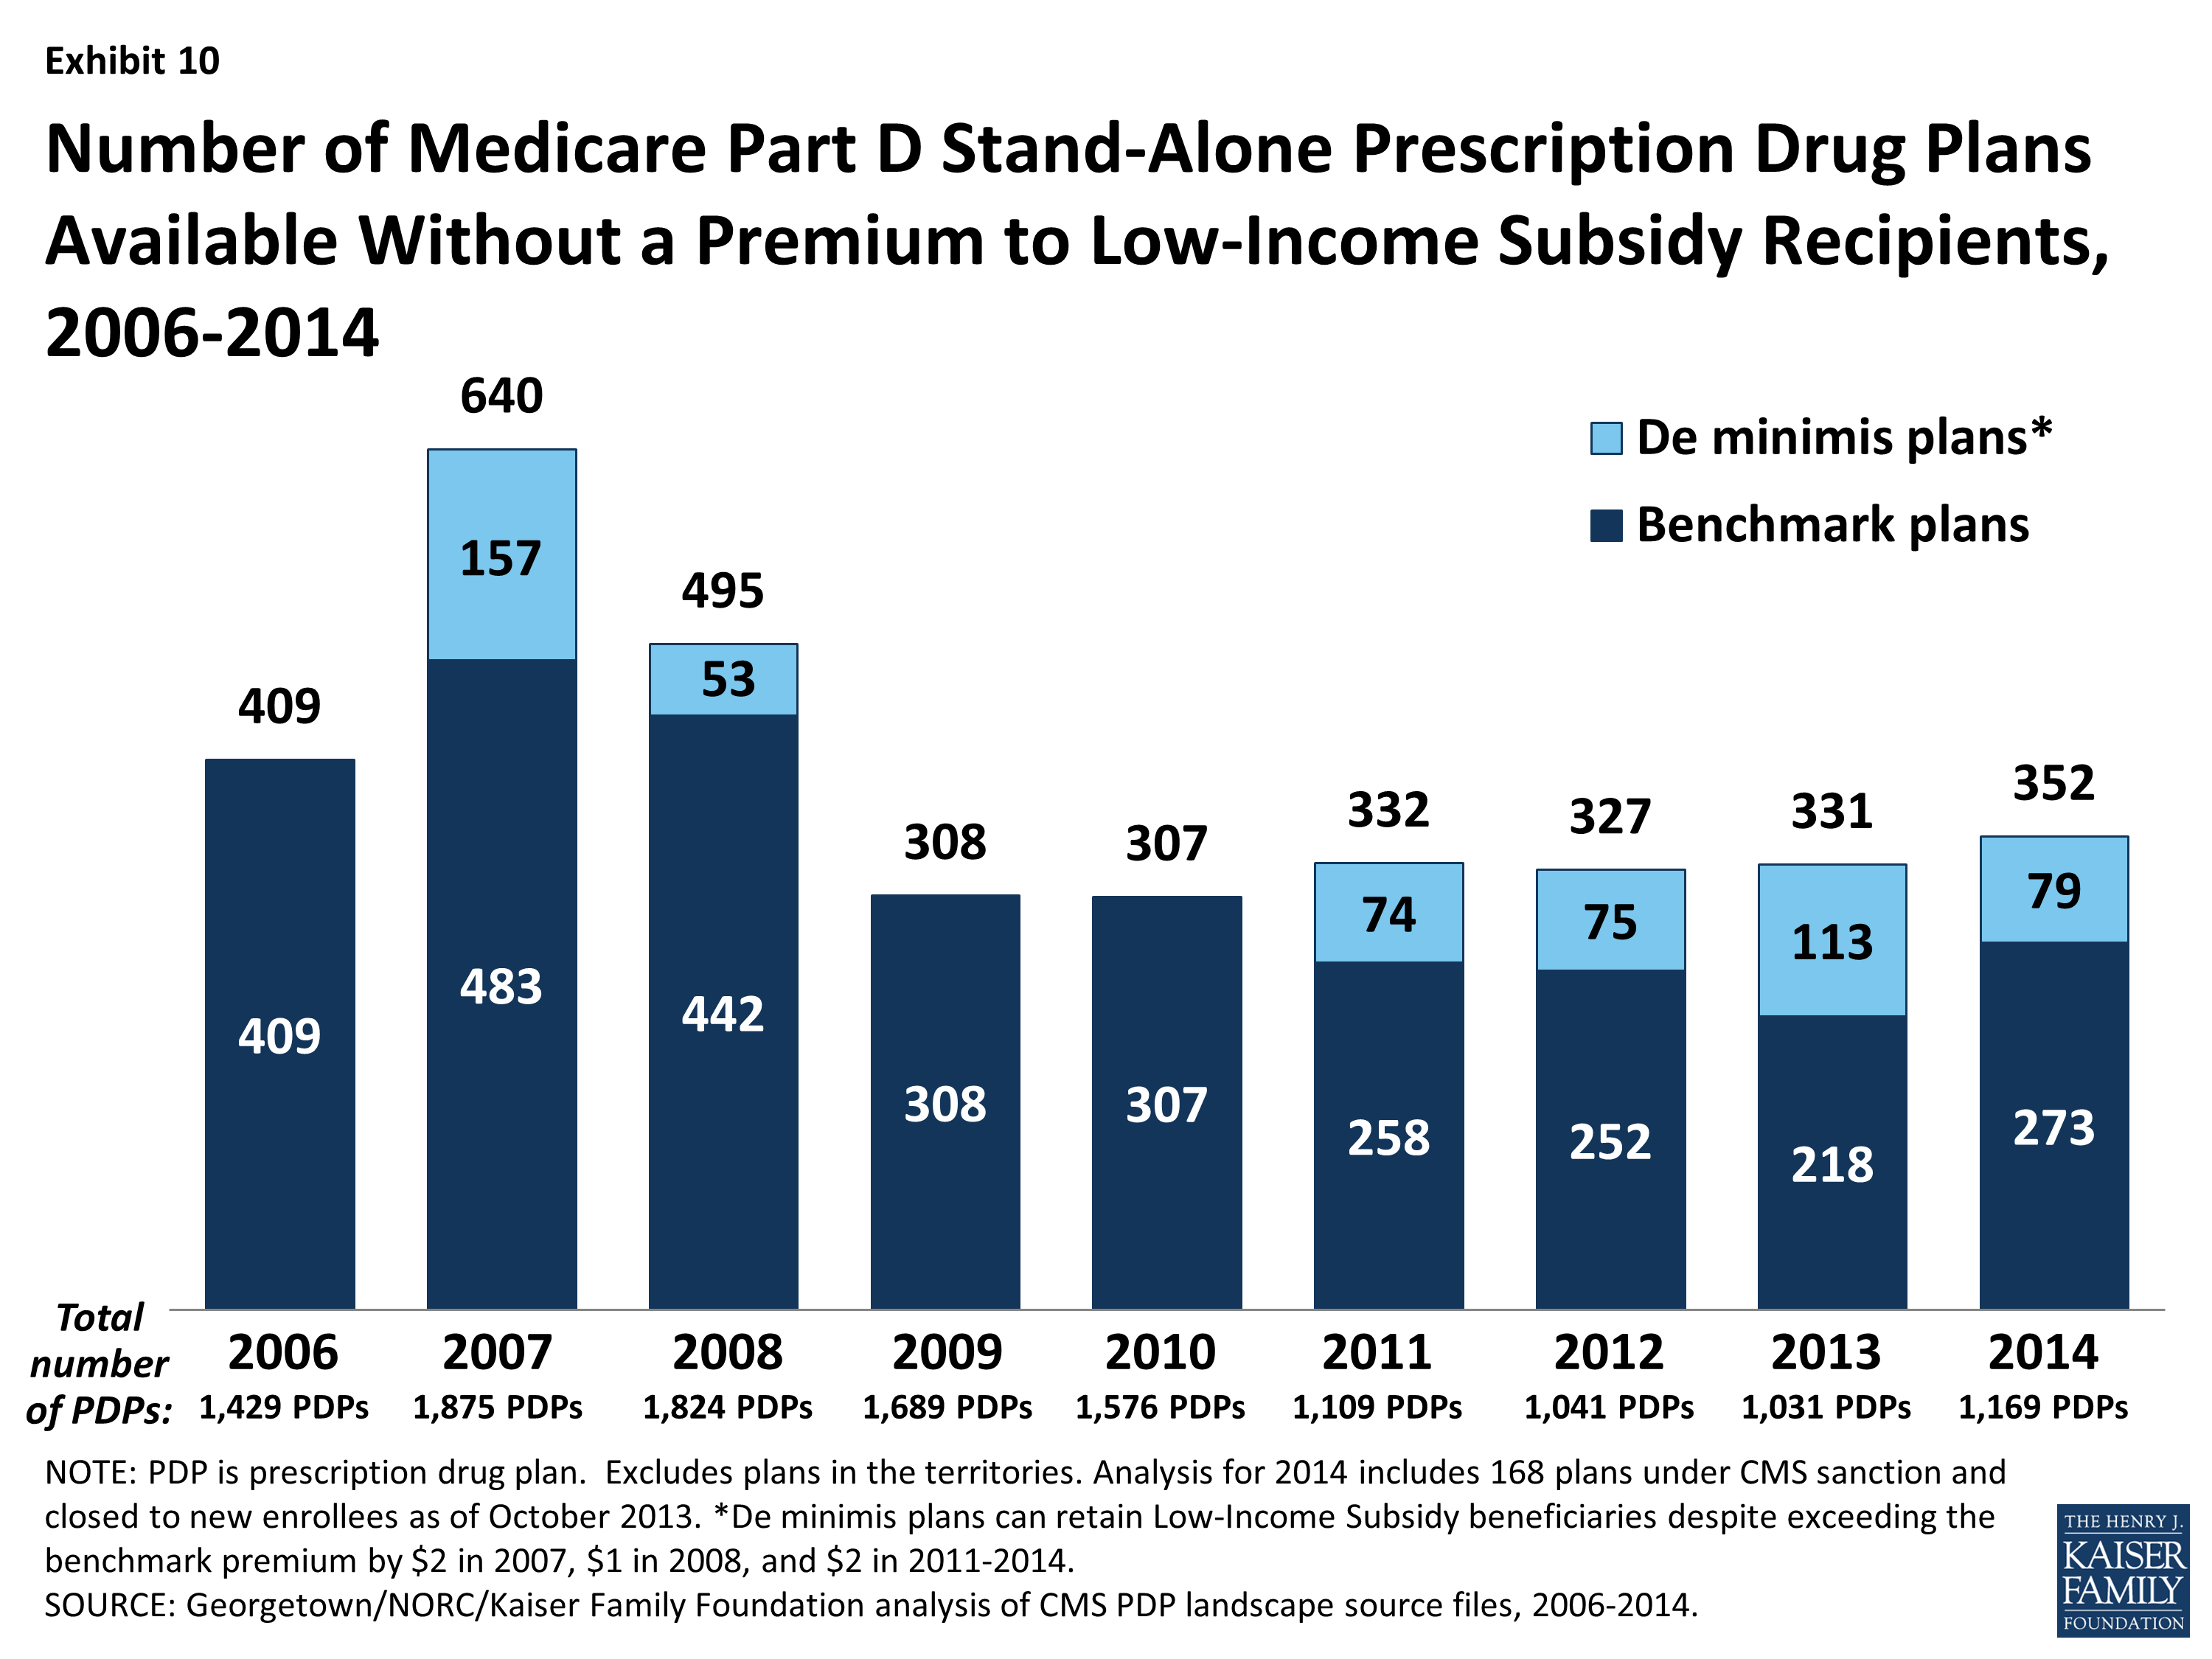
In 2014, 352 plans will be available for enrollment of LIS recipients for $0 premium. This represents a 6 percent increase in plans for LIS recipients, or 31 more plans than in 2013. (Exhibit 10; Appendix 1, Table A4)
Policies adopted by CMS in previous years make it easier for PDPs to qualify as benchmark plans, including the “de minimis” policy that allows plans to waive a premium amount of up to $2 in order to retain their LIS enrollees.12 Of the 352 benchmark plans in 2014, about one in four (79 plans) qualify through the “de minimis” policy—fewer than the 113 “de minimis” plans in 2013.
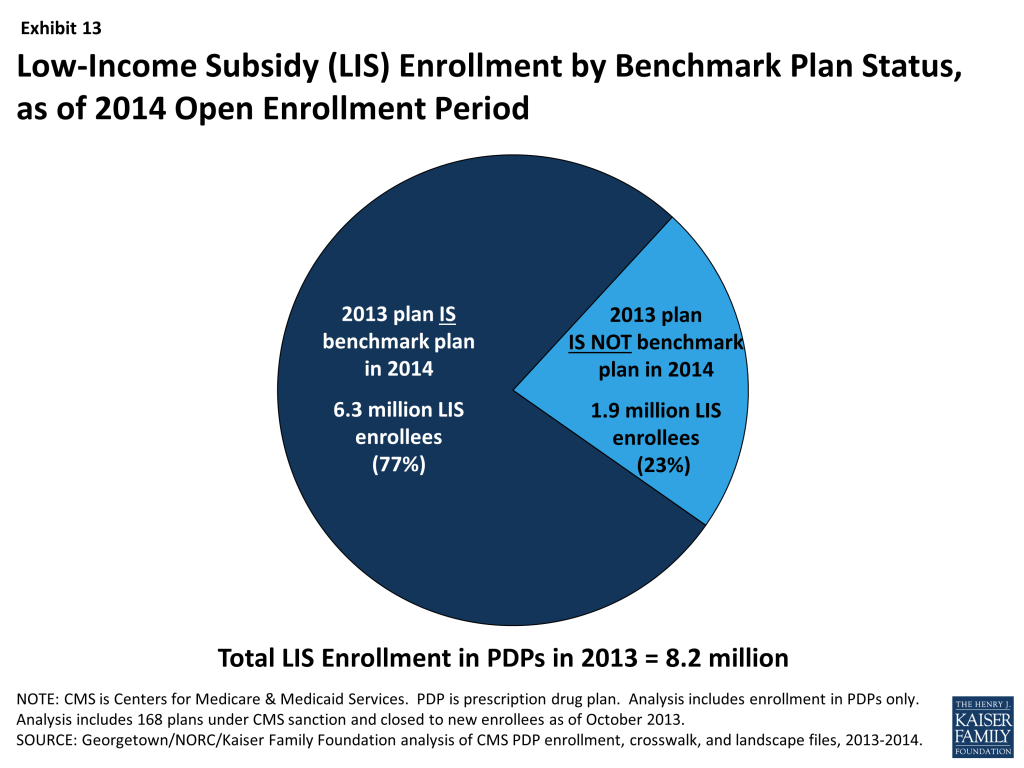
Among the 2013 benchmark plans that will continue to participate in Part D in 2014, 60 PDPs have lost their benchmark status due to either higher premiums in 2014 or to a lower regional benchmark in 2014. About 517,000 LIS beneficiaries (6 percent of LIS enrollment in 2013) are enrolled in these plans—a potential source of disruption to their coverage.
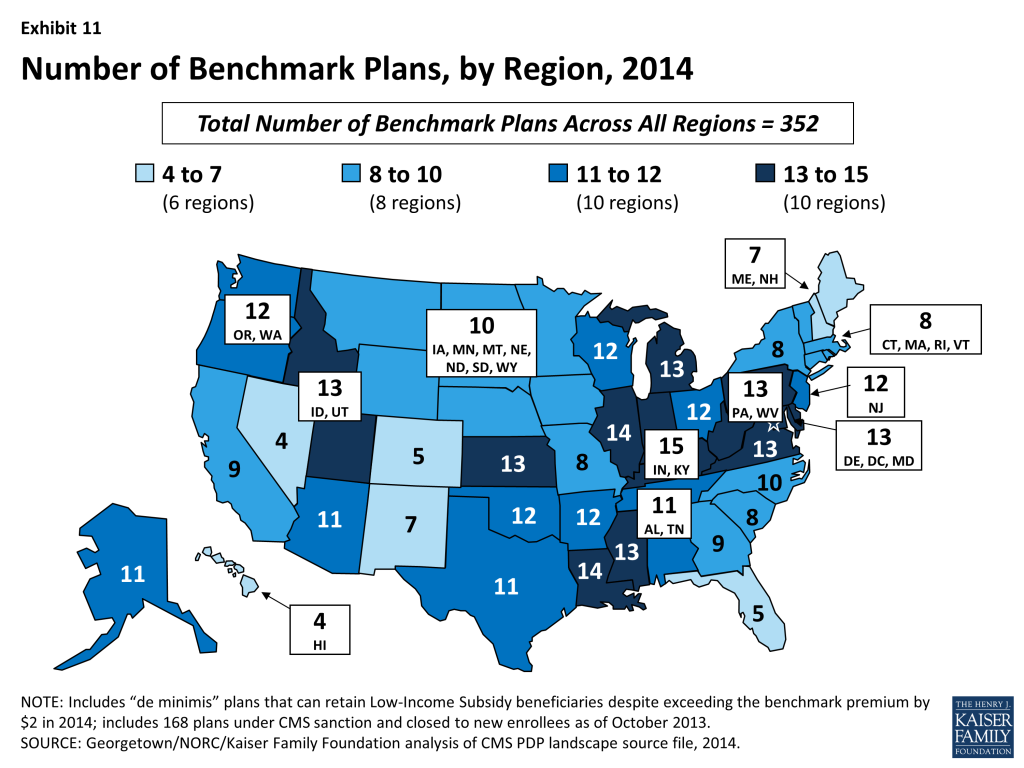
The number of benchmark plans available in 2014 will vary by region, from 4 benchmark PDPs in the Hawaii and Nevada regions (out of 29 and 34 PDPs, respectively) to 15 benchmark PDPs in the Indiana/Kentucky region (out of 35 PDPs). (Exhibit 11)
Exhibit 11. Number of Benchmark Plans, by Region, 2014
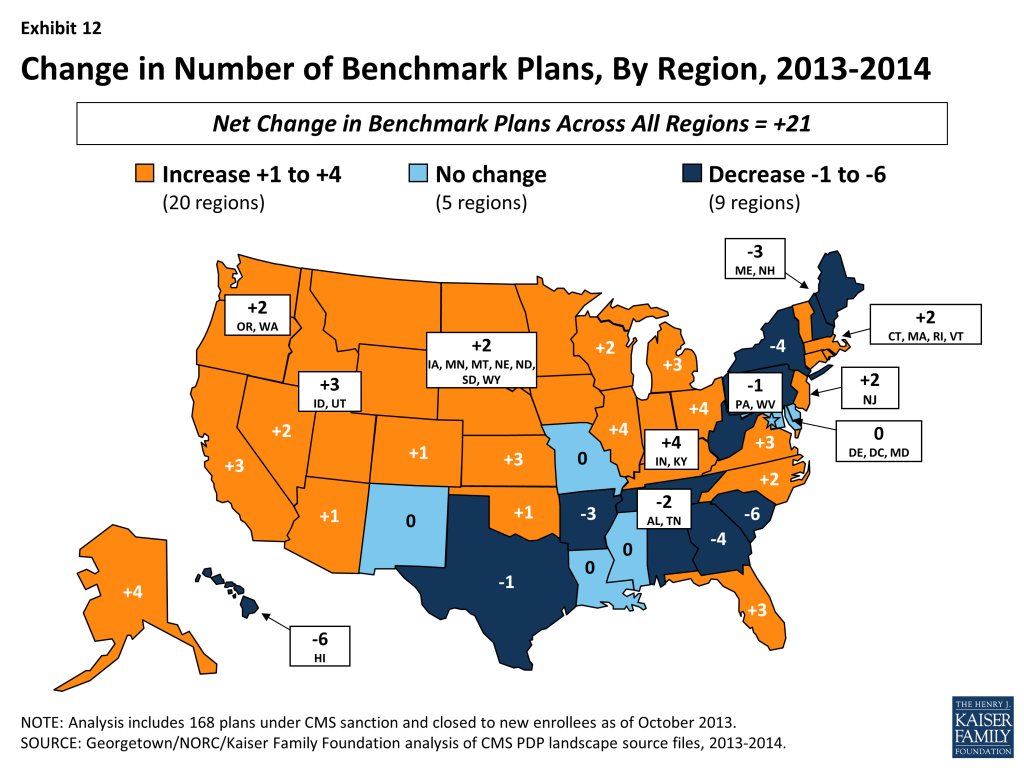
Benchmark plan availability will decline in 9 of 34 regions between 2013 and 2014, while more LIS plans will be available in 20 regions. Year-to-year changes in most regions are relatively modest; the largest changes are the loss of six benchmark plans in the Hawaii and South Carolina regions. (Exhibit 12)
Exhibit 12. Change in Number of Benchmark Plans, By Region, 2013-2014
About 1.9 million people—about one in four LIS beneficiaries (23 percent)—are enrolled in PDPs in 2013 that will not qualify as benchmark plans in 2014 (Exhibit 13). This group includes 517,000 beneficiaries who were in benchmark plans in 2013; the remaining three-quarters (72 percent) of these beneficiaries are currently enrolled in non-benchmark plans and thus paid a premium in 2013. In fact, about 470,000 LIS enrollees will pay premiums of at least $20 per month and nearly 81,000 LIS enrollees will pay premiums of at least $50 per month if they do not switch to other PDPs.
Exhibit 13. Low-Income Subsidy (LIS) Enrollment by Benchmark Plan Status, as of 2014 Open Enrollment Period
The number of LIS beneficiaries who will potentially pay a premium in 2014 unless they enroll in (or are switched to) benchmark plans (1.9 million) is down considerably from the 2.7 million LIS beneficiaries who were in a similar situation at the time of last year’s open enrollment period.
CMS will reassign a subset of these LIS enrollees, specifically those who were randomly assigned by CMS to their current plan (last year, one-third of those scheduled to pay a premium were reassigned), and several states will help reassign those enrolled in their state pharmacy assistance programs (SPAPs).13 But many other LIS beneficiaries not scheduled to be in benchmark plans in 2014 must switch plans on their own or pay a premium if they remain in their 2013 plan. Those in the latter group will not be reassigned because in the past they or someone assisting them made a choice to switch plans. Most affected LIS beneficiaries will receive a letter from CMS or their SPAP either informing them of their reassignment or reminding them that they can choose a different plan and avoid paying a premium.
The number of benchmark plans offered by the major Part D organizations has fluctuated substantially during the program’s five years. This year, nine PDP sponsors will have benchmark plans in at least half of the 34 regions, including one of the companies new to the program (Symphonix).
In 2013, about 70 percent of LIS enrollees in PDPs are in plans operated by just four plan sponsors (CVS Caremark, Humana, UnitedHealthcare, and Cigna). Each of these sponsors has PDPs that qualify as benchmark plans in 2014 in at least 27 of the 34 PDP regions, although each sponsor has had at least one previous year when it qualified in less than half of the regions. Two sponsors (Humana and UnitedHealthcare) have benchmark plans in all 34 regions in 2014. (Exhibit 14)
Exhibit 14. Number of Benchmark Plans Offered by Four Major Part D Organizations, 2006-2014
Although these four sponsors have PDPs that qualify as benchmark plans in most regions, their LIS enrollees may be split between benchmark plans and other plans operated by these sponsors. For example, 71 percent of UnitedHealthcare’s LIS enrollees are in non-benchmark PDPs and thus pay premiums. Most of them are in the AARP Medicare Rx Preferred PDP, which was a benchmark PDP in the program’s earlier years. By contrast, only 5 percent of Cigna’s LIS enrollees and only 2 percent CVS Caremark’s LIS enrollees are in those sponsors’ non-benchmark PDPs.
Notable Trends for 2014
Two other notable trends characterize the Part D program for 2014:
In contrast to the program’s first years, a growing number of PDPs are using preferred pharmacy networks, whereby enrollees pay lower cost sharing for their prescriptions when they use preferred pharmacies (although cost-sharing differences vary considerably across the plans). This trend has gained prominence in recent years with the market entry of co-branded PDPs featuring relationships with specific pharmacy chains, such as the Humana Walmart-Preferred Rx PDP (new in 2011) and the Aetna CVS/Pharmacy PDP (new in 2012). In 2006, there were some co-branding relationships between PDPs and pharmacy chains, but in general they were not accompanied by lower cost sharing at the pharmacy chains. About 72 percent of all PDPs in 2014 will have a preferred pharmacy network with lower cost-sharing levels when prescriptions are filled at preferred pharmacies. For example, in the AARP Medicare Rx Saver Plus PDP, the copayment for a preferred brand drug will be $20 in a preferred pharmacy and $30 in another network pharmacy. Copayments in the new Humana Walmart Rx Plan at a preferred pharmacy will be $1 for drugs on the preferred generic tier and $4 for drugs on the non-preferred generic tier, compared to $10 and $33, respectively, at other network pharmacies.
While a majority of Part D plans have adopted some type of tiered cost sharing for their formulary since the program’s first year, there has been a trend toward the use of more cost-sharing tiers. In 2006, some plans had three tiers—generics, preferred brand drugs, and non-preferred brand drugs—and some also added a fourth tier for specialty drugs. By 2013, a five-tier benefit design, with the addition of a second generic tier to the four-tier arrangement, had become the most common, and it will be the dominant formulary design in the 2014 PDP market. Of 31 PDPs offered in at least half of all PDP regions in 2014, 24 (77 percent) have this type of formulary design.
Discussion
In 2014, the number of Medicare Part D stand-alone prescription drug plans offered nationwide will grow modestly with the entry of new PDP offerings by several long-time plan sponsors. The average Medicare beneficiary will have a choice of 35 PDPs in 2014, a slight increase from 2013, and most will also have access to several Medicare Advantage drug plans.
On average, plan enrollees who remain in the same plan will see a modest 5 percent premium increase ($1.76 per month) if they stay enrolled in the same plan in 2014. But moving beyond the overall average change, about one-third of all PDP enrollees will experience a premium reduction in 2014 and about 14 percent of PDP enrollees will see a premium increase of $10 or more. Enrollees in four of the program’s most popular PDPs will experience premium increases of at least 10 percent, and those enrolled in two of these PDPs face increases of 50 percent. By contrast, enrollees in three other popular PDPs will see lower premiums. As in recent years, there is a new PDP offered in all regions at a low premium for 2014, and some enrollees may consider switching from PDPs that are increasing premiums to some of the lower-premium PDPs.
The majority of plans offered in 2014 will offer no gap coverage beyond that which is required by the Affordable Care Act, and the amount of gap coverage available to all plan enrollees will become increasingly more generous as the Medicare Part D “doughnut hole” gradually closes by 2020.
Beneficiaries receiving Low-Income Subsidies will have 21 more plans available to them for no monthly premium in 2014 than in 2013, although nearly one of four LIS beneficiaries will need to change plans between 2013 and 2014 to avoid paying a premium. Although some of the latter group will be reassigned by CMS to benchmark plans, many are likely to end up in non-benchmark plans and pay premiums for drug coverage in 2014, despite having the option to enroll in a zero-premium plan.
This evaluation of the Part D plan landscape for 2014 and changes over time suggests that many PDP enrollees will face some changes in their current plan, whether in the form of higher or lower premiums, deductibles, gap coverage, pharmacy networks, or other benefit design features. While the annual enrollment period is the best opportunity for people on Medicare to evaluate their coverage options and make changes, a recently released study of plan switching by several authors of this analysis showed that about 87 percent of all PDP enrollees stayed in the same plan in annual enrollment periods between 2006 and 2010.14 Even when they were projected to face large premium increases, 72 percent of PDP enrollees with projected increases of $20 or more and 79 percent of those with premium increases of $10 to 20 stayed enrolled in the same plan. Furthermore, evidence from that study indicated that even when PDP enrollees respond to premium changes, enrollees who switch plans do not always end up with lower out-of-pocket costs for their prescription drug purchases. Finding ways to get more Part D enrollees engaged in the act of comparing and reviewing plans and making changes that could save them money remains an ongoing challenge for CMS and policymakers.
Jack Hoadley and Laura Summer are with Georgetown University; Juliette Cubanski is with the Kaiser Family Foundation; Elizabeth Hargrave is with NORC at the University of Chicago.
Appendix
Endnotes
Centers for Medicare and Medicaid Services, “More, higher quality options for seniors in Medicare Advantage,” September 19, 2013; 2014 PDP, MA, and SNP Landscape Source Files and related files are available at http://www.cms.hhs.gov/PrescriptionDrugCovGenIn/. ↩︎
These enrollment counts (September 2013) include 6.1 million Part D enrollees in employer-only plans, not otherwise analyzed for this spotlight. ↩︎
It is unknown at present whether the renamed Humana Preferred Rx Plan will have a broader preferred network beyond Walmart pharmacies. ↩︎
Based on authors’ analysis using the CMS 2014 Part D Crosswalk file. ↩︎
This calculation includes LIS enrollees, who are not necessarily responsible for paying the increased premium (see the LIS section for more information). The share of non-LIS PDP enrollees projected to have a premium increase of at least $1 is even larger—78 percent of all enrollees. Nearly one in five non-LIS enrollees have a projected premium increase of at least $10 per month. ↩︎
Centers for Medicare & Medicaid Services, “Annual Release of Part D National Average Bid Amount and other Part C & D Bid Related Information,” July 30, 2013. ↩︎
Kaiser Family Foundation, “Income-Relating Medicare Part B and Part D Premiums Under Current Law and Recent Proposals: What are the Implications for Beneficiaries?” February 2012, available at http://modern.kff.org/medicare/8276.cfm. ↩︎
This amount corresponds to the estimated catastrophic coverage limit for non-Low-Income Subsidy enrollees ($6,455 for LIS enrollees), which corresponds to True Out-of-Pocket (TrOOP) spending of $4,550 (the amount used to determine when an enrollee reaches the catastrophic coverage threshold. ↩︎
Information is not available for the gap coverage of one PDP, SmartD Rx Plus, offered in all 34 regions. This plan is included in the denominator but not in any of the coverage categories. ↩︎
Centers for Medicare & Medicaid Services, “Announcement of Calendar Year (CY) 2014 Medicare Advantage Capitation Rates and Medicare Advantage and Part D Payment Policies and Final Call Letter,” April 1, 2013. ↩︎
Plans qualifying through the de minimis policy are eligible for new enrollees, but will not receive auto-assigned enrollees. ↩︎
Estimates for the total number of beneficiaries subject to paying a premium are based on plan data from the landscape and crosswalk files, together with CMS enrollment reports. Estimates of the number scheduled to be reassigned are not available from CMS, as of the publication date. ↩︎
Jack Hoadley, Elizabeth Hargrave, Laura Summer, Juliette Cubanski, and Tricia Neuman, “To Switch or Not to Switch: Are Medicare Beneficiaries Switching Drug Plans To Save Money?” Kaiser Family Foundation, October 2013.
↩︎
Each year during the Medicare Part D annual enrollment period that runs between October 15 and December 7, people on Medicare have the opportunity to review and compare the plan options available to them and switch plans if they choose. This analysis examines rates of plan switching among Part D enrollees between 2006 and 2010, focusing on enrollees who do not receive the program’s Low-Income Subsidy. The study finds that relatively few people on Medicare have used the annual opportunity to switch Part D prescription drug plans (PDPs) voluntarily—even though those who do switch often lower their out-of-pocket costs as a result of changing plans. Key findings from this study are:
A small share of all Medicare Part D enrollees voluntarily switch plans during the annual enrollment period—13 percent, averaged across four enrollment periods.
Seven out of ten Medicare beneficiaries enrolled in stand-alone PDPs during all four annual open enrollment periods from 2006 to 2010 did not voluntarily switch plans in any of the four enrollment periods.
The relatively small share of PDP enrollees who switched plans at some point between 2006 and 2010 were more likely than those who did not switch to end up in a plan that lowered their premiums. Nearly half (46 percent) of enrollees who switched plans saw their premiums fall by at least 5 percent the following year, compared to 8 percent of those who did not switch plans. But those who switched plans were only slightly more likely than those who did not switch to face lower out-of-pocket costs for drugs during the year.
Relatively large premium increases for a PDP from one year to the next were associated with higher rates of plan switching between 2006 and 2010; but most enrollees with relatively large premium increases (such as $10 or more per month) did not switch plans in any of the four annual enrollment periods.
Enrollees in PDPs that increased deductibles or dropped coverage of brand-name drugs in the coverage gap were more likely to switch out of these plans than enrollees in PDPs that did not change their benefit design.
.
INTRODUCTION
The Medicare Part D program is structured as a marketplace for prescription drug coverage where all Medicare beneficiaries must be enrolled in a private plan to receive Medicare’s prescription drug benefit. Ideally, beneficiaries will research the array of available drug plans and choose the one that best meets their needs, and further review and compare their options each year during the annual open enrollment period. The annual open enrollment period provides Part D enrollees with an opportunity to review any changes in their current plan, compare the coverage and costs of plans in their area in light of their current drug needs, and assess whether or not to stay in their plan or switch to another plan that would cover the drugs they need at a lower cost. In general, unless enrollees make an active choice to switch plans, they will remain in the same plan from one year to the next.1
The Part D program, which started in 2006, has reduced the share of Medicare beneficiaries without drug coverage, and provided beneficiaries a choice among many plans offered in their area. In 2013, for example, the average Part D enrollee has a choice of 31 stand-alone prescription drug plans (PDPs) and about 20 Medicare Advantage prescription (MA-PD) drug plans.2 Part D plans vary in a number of ways that can affect beneficiaries’ out-of-pocket costs, including premiums, cost-sharing amounts, formulary coverage, gap coverage, deductibles, and utilization management approaches. To assist people on Medicare with comparing and choosing plans, CMS offers an online Plan Finder tool that calculates the expected total cost for any plan for a given drug regimen.
Only a small fraction of enrollees, however, are enrolled in the lowest-cost Part D plan available to them, based on the specific drugs they take.3 Therefore, many Part D enrollees incur higher out-of-pocket costs than would be the case with a different plan selection. This is true especially in situations where the plan premium is not a good indicator of overall value, such as plans that include coverage for generic drugs in the coverage gap or plans with no deductible.4 Part D enrollees often have difficulty with the plan selection process and find the decision-making complicated, especially because of the large number of available plans.5
Each year, Medicare Part D plans can and do make changes in their premiums and in benefit design parameters that affect the total out-of-pocket costs enrollees will pay. While some plans make changes that reflect broad trends in the Part D market, other plans make changes (such as premium increases well above the overall trend) that affect their position in the marketplace. Yet, in a recent survey, only six in ten seniors said they (or someone on their behalf) review their plan options every year; one-fourth said they rarely or never do so.6 Some plan enrollees could be better off financially by reacting to these changes and selecting a different plan, and not doing so can increase the cost difference between the chosen plan and other available alternatives. According to one recent paper, the combined impact of inertia for those staying put and suboptimal choices made by those who do change plans means that the cost of not engaging in the plan review process at all or not choosing the highest-value plan has increased over time.7
This purpose of this study is to determine the extent to which Part D enrollees voluntarily switch plans from one year to the next, and to identify plan and beneficiary characteristics that are associated with higher or lower rates of switching. The study examines enrollment dynamics in Part D during the annual enrollment periods between 2006 and 2010 for beneficiaries who are not enrolled in the program’s Low-Income Subsidy (LIS), focusing primarily on enrollees in stand-alone PDPs. We exclude LIS enrollees entirely and MA-PD plan enrollees from most of the analysis because the enrollment dynamics and factors affecting plan switches are different for these two markets and populations.8 Our study makes a unique and important contribution to understanding of the Part D marketplace because it is the first to take an in-depth look at enrollment dynamics across multiple years since the start of the program and examine plan features associated with higher rates of plan switching. In doing so, it goes beyond the analysis recently published by the Medicare Payment Advisory Commission (MedPAC).9 These findings have implications for efforts to increase the level of private plan participation in the broader Medicare program.
.
DATA AND METHODS
The analysis for this study is based on a 5-percent random sample of Medicare beneficiaries, obtained from the Centers for Medicare & Medicaid Services (CMS), for each year from 2006 to 2010. The sample dataset includes information on the characteristics of beneficiaries and Part D plan information (encrypted at the level of the contract ID and plan ID).
From the five one-year samples, we matched non-LIS beneficiaries across years to build samples of beneficiaries who were enrolled in Part D for each of four two-year periods (2006-07, 2007-08, 2008-09, and 2009-10) and another sample of beneficiaries who were enrolled in the program for the entire 2006-10 period. For the analysis of overall switching rates, sub-samples were created for those who were enrolled in a PDP in the first year of each two-year cycle and those in a MA-PD plan in the first year; most of the analysis reported here uses the PDP sample. For the analysis examining the impact of plan characteristics, we further subset the two-year samples to include only PDP enrollees who remained in a PDP in the second year. Similarly, the five-year sample was restricted to those in PDPs the entire time.
In each two-year sample, we define a plan switch based on enrollment in a different plan in January of the second year, compared to December of the first year, thus focusing on changes in the annual enrollment period; switches in the five-year sample were defined similarly. We do not count plan switches that are involuntary under the following two circumstances: (1) a plan enrollee whose plan changes, but the old plan and the new plan are matched (“crosswalked”) by the plan sponsor, and the enrollee is therefore automatically transferred to the crosswalked plan; and (2) a plan enrollee whose plan exits the program without any crosswalked plan and who therefore must select a new plan to remain in Part D.
For a more detailed discussion of the data and methods, including other limitations, see Appendix 1: Study Methodology. Findings on the impact of individual enrollee characteristics (age, sex, race,10 original reason for Medicare entitlement, and geographic location), measures of beneficiary health status (number of chronic conditions and total Medicare expenditures), and drug spending are available in Appendix 2: Data Tables.
.
KEY FINDINGS
A small share of all Medicare Part D enrollees voluntarily switch plans during the annual enrollment period.
Most Part D enrollees (87 percent, averaged across four enrollment periods), whether in PDPs or MA-PD plans, made no change in their selected plan during any particular year’s annual enrollment period (Exhibit 1).11 Despite the fact that plans typically adjust premiums each year and some also make substantial changes to their benefit designs (gap coverage, deductibles, cost sharing, and formulary coverage), most beneficiaries do not change their current plan. On average, about 1.7 million Part D enrollees out of 13.4 million non-LIS Part D enrollees switched plans voluntarily in each annual enrollment period between 2006 and 2010.
Most Non-LIS Medicare Part D Enrollees Did Not Switch Plans Voluntarily During an Open Enrollment Period, 2006-2010
The percent of enrollees staying in the same plan from one year to the next was nearly the same for PDPs and MA-PD plans (Exhibit 1). Of those beneficiaries enrolled in stand-alone PDPs in any given year between 2006 and 2010, the vast majority (87 percent, on average) stayed in the same PDP from one year to the next. A virtually identical share of beneficiaries enrolled in Medicare Advantage prescription drug plans during these years (88 percent, on average) stayed in the same MA-PD plan from one year to the next.
Switching rates have varied little from year to year (Exhibit 2). There was slightly greater stability in the first annual enrollment period (2006-07), perhaps because it came soon after the original selection of drug plans. There was slightly more switching among MA-PD enrollees in 2010, which may reflect changes unique to the Medicare Advantage market unrelated to the drug benefit, including changes in the availability of private fee-for-service plans.12
Switching Rates Among Non-LIS Part D Enrollees Were Similar Across Four Annual Enrollment Periods and Different Plan Types
There were relatively few differences in the rate of switching by beneficiary characteristics. For example, women switched plans slightly more often than men, and those with more chronic health conditions or with higher drug spending were somewhat more likely to switch plans. Enrollees ages 64 to 74 were slightly more likely to switch than those ages 85 and older. But the observed differences in switching rates based on these characteristics are small and not always consistent from one annual enrollment period to the next. Switching rates varied more across PDP regions, ranging from nearly 20 percent, on average, in the New Jersey and Pennsylvania-West Virginia regions to about 5 percent in New Mexico and Hawaii. The participation of local PDPs and the presence of state pharmacy assistance programs could be partial factors in explaining regional differences. Tables illustrating these comparisons are available in Appendix 2.
Seven out of ten Medicare beneficiaries enrolled in stand-alone PDPs during all four annual open enrollment periods from 2006 to 2010 did not voluntarily switch plans in any of the four enrollment periods.
A large majority (72 percent) of Part D enrollees who were in PDPs continuously over the program’s first five years made no voluntary switch in any of the program’s first four annual enrollment periods (Exhibit 3).13 Another two in ten (19 percent) switched once over the five-year period. A similarly large share (71 percent) of MA-PD plan enrollees never made a switch in any of the enrollment periods.
Among Non-LIS Part D Enrollees Continuously Enrolled in PDPs From 2006 to 2010, 7 out of 10 Never Voluntarily Switched Plans
Of the five-year Part D enrollees who did switch PDPs at least once during the four enrollment periods, about two of every three made only a single switch. A small subset of PDP enrollees (about 3 percent) made frequent use of the opportunity to select a new PDP by switching plans in at least three of the first four annual enrollment periods, if not every year.
PDP enrollees were more than twice as likely to select a different PDP if they had made a switch in at least one previous year (Exhibit 4). Nearly one in five (17 percent) PDP enrollees who had switched plans in one previous annual enrollment period switched plans in 2010, compared to only 7 percent of PDP enrollees who had not switched in any previous enrollment period. Nearly half (46 percent) of those with three prior switches, and one-third (32 percent) of those with two prior switches, again chose a new PDP in 2010.
Switching Rates In 2009-2010 Were Higher Among Non-LIS PDP Enrollees Who Previously Switched Plans and Increased With the Number of Prior Switches
It is not possible to tell from administrative data how many enrollees who did not switch plans researched their options and made an active decision to stay in their original plan. However, these results suggest that some Part D enrollees are more engaged than others in reviewing their plan options every year and making active decisions about their plan choices.
The relatively small share of PDP enrollees who switched plans at some point between 2006 and 2010 were more likely than those who did not switch to end up in a plan that lowered their costs.
Those PDP enrollees who switched to a different PDP tended to face lower costs as a result, yet the effect was greater in terms of reducing the amount they spent on premiums than reducing their total out-of-pocket costs (Exhibit 5). Both switchers and non-switchers alike may face changes in their premiums from one year to the next. During the 2008 annual enrollment period, for example, 92 percent of PDP enrollees faced higher premiums in 2009 if they did not change PDPs, and 27 percent faced an increase of at least $10 per month.14 Our analysis shows that 46 percent of those who switched plans (averaged across the four annual enrollment periods) reduced their premiums by 5 percent or more as a result of switching, whereas only 8 percent of those who did not switch plans experienced the same reduction in their premium. Conversely, 78 percent of those who did not switch plans paid a premium at least 5 percent higher than the year before, compared to only 46 percent of those who did switch plans.
A Larger Share of Non-LIS PDP Enrollees Who Switched Plans Had Lower Costs in Year 2 Than in Year 1, Compared to Non-Switchers, 2006-2010
By contrast, PDP enrollees who switched plans were only slightly more likely than those who did not switch to experience a reduction in the amount they paid out of pocket for drugs during the year (Exhibit 5). In the second year, 47 percent of switchers, compared to 42 percent of non-switchers, lowered their out-of-pocket drug costs (including deductibles, copayments, coinsurance, and costs in the gap, but not premiums) by at least 5 percent. Differences in formularies or cost sharing—whether in a continuing plan or a new plan—were one reason for changes in these costs, but costs also rise and fall as a result of the need for different drugs from one year to the next. If switchers were more likely than non-switchers to experience changes in their prescription drug needs, it would bias this comparison.
Based on a combined measure of total out-of-pocket spending, including premiums and cost sharing for drugs, 44 percent of switchers had overall costs that were at least 5 percent lower, whereas only 28 percent of non-switchers experienced the same level of cost reduction.
The findings from these comparisons are consistent with a conclusion that Part D enrollees achieved lower costs when they selected a different plan during the annual enrollment period. But the findings also suggest that plan choice is driven more by premium changes than by a comparison of total out-of-pocket costs. At least two other recent studies have used Part D administrative and claims data to offer evidence on this distinction and concluded that Part D enrollees overvalue premiums in their plan selection decisions.15 The online Plan Finder offers enrollees the opportunity to look beyond premiums and identify plans with lower overall out-of-pocket costs, to the extent that their drug needs do not change from one year to the next.16 But survey data show that among the small share of beneficiaries who say they themselves have gone online and used the Internet, most have not visited the Plan Finder website (though someone else may have done so for them).17
Relatively large premium increases for a PDP from one year to the next were associated with higher rates of plan switching between 2006 and 2010; but most enrollees with relatively large premium increases did not switch plans in any given year.
Non-LIS Part D enrollees typically see an increase in their plan’s premium if they remain in the same plan from one year to the next. As noted above, 92 percent of PDP enrollees faced higher premiums in 2009 compared to 2008 if they did not switch to a different PDP.18 Most Part D enrollees have PDPs available to them that would charge a lower premium, although the lower-premium PDPs do not always produce lower overall out-of-pocket costs.
PDP enrollees facing a monthly premium increase of $20 or more switched at two to four times the average rate overall. Still, over two-thirds of enrollees in PDPs that raised premiums by at least $20 stayed in that PDP the following year. PDP enrollees who faced especially large monthly premium increases were more likely to change PDPs than those facing lower premium increases (Exhibit 6). For example, 28 percent of PDP enrollees facing a monthly premium increase of at least $20 switched PDPs during the annual enrollment period (averaged across the four enrollment periods between 2006 and 2010). By contrast, only 7 percent of those facing a more modest premium increase (up to $10 or no change in their premium) switched PDPs, while 8 percent of those facing a premium decrease switched PDPs. Still, a significant majority of enrollees stayed with the same PDP regardless of the premium change they were facing in their current plan.
Switching Rates Were Higher Among Non-LIS PDP Enrollees Facing Larger Premium Increases, Compared to Other Enrollees, 2006-2010
Enrollees in PDPs that made changes to their benefit designs, such as increasing deductibles or dropping coverage of brand-name drugs in the gap, were more likely to switch plans than enrollees in PDPs that did not change their benefit design.
Most PDPs retain the same basic benefit design from one year to the next: PDPs with coverage in the gap retain that coverage, those with deductibles continue to use deductibles, and those using cost-sharing tiers continue doing so. But in every year, some plans do make changes to their benefit designs. For example, about one in six PDPs made changes to their deductibles between 2009 and 2010, and a smaller subset of PDPs dropped coverage that they had offered for brand-name drugs in the coverage gap in the years from 2006 to 2008.
Through their plan choices, Part D enrollees who switched plans demonstrated a preference for PDPs with no deductibles or relatively small deductibles. Although most plans tend to make no change in their benefit design from year to year with regard to the deductible, there were more notable changes between 2009 and 2010. In 2009, about 13 percent of PDP enrollees were in plans that were adding or raising the deductible for the 2010 plan year, and another 4 percent were in plans that were lowering or eliminating the deductible. Among PDPs that were increasing the deductible between 2009 and 2010, the weighted average increase in the deductible was $120 (the maximum deductible in 2010 was $310).
PDP enrollees in plans that increased or added a deductible for 2010 were about twice as likely to switch PDPs as those in plans that did not change how deductibles were used or that lowered or eliminated deductibles (Exhibit 7). Furthermore, enrollees in PDPs retaining an existing deductible in 2010 were much more likely to switch to another plan than those in PDPs with no deductible.19 Other evidence supports the idea that beneficiaries tend to overpay (in terms of premiums) for plans without a deductible.20
Switching Rates Were Higher Among Non-LIS PDP Enrollees Facing a Higher Deductible, Compared to Other PDP Enrollees, 2009-2010
Enrollees in plans that dropped coverage of brand-name drugs in the gap in the first two years of the program were more likely to switch plans than enrollees in plans that made no changes to gap coverage, although only a very small share of the PDP population had this generous gap coverage of brand-name drugs, and only a handful of PDPs offered it (Exhibit 8). In 2006 and 2007, most of the small number of PDPs that offered some coverage for brand-name drugs in the coverage gap faced costly adverse selection, whereby the more extensive gap coverage was worth the higher premium only for those who expected to reach the coverage gap. As a result, nearly all of these PDPs elected to modify or drop that coverage (or left the market) for either the 2007 or 2008 plan year.
Switching Rates Were Higher Among Non-LIS PDP Enrollees Who Lost Brand-Name Gap Coverage, Compared to Other Enrollees, 2006-2008
Enrollees whose plans were dropping coverage of brand-name drugs in the gap at the end of 2006 or 2007 switched PDPs at a rate four times greater than the average rate of switching among PDP enrollees. A large share of enrollees in this situation (39 percent in 2006 and 50 percent in 2007) switched out of their plans in those two enrollment cycles, compared to a smaller share (7 percent in 2006 and 11 percent in 2007) of those enrolled in PDPs that made no change in their gap coverage. These counts do not include enrollees forced to pick a new plan because their PDP exited the program entirely. Through the process of adverse selection leading to a “death spiral,” the availability of PDPs with generous gap coverage for brand-name drugs mostly disappeared by 2008.21
DISCUSSION
Our analysis shows that most Part D enrollees did not change their selection of a plan from one year to the next during the annual enrollment period for Medicare prescription drug coverage. Even over a five-year period, most did not change plans outside of special circumstances, such as when a plan sponsor reorganized plan offerings or acquired another company’s plans. The low rate of plan switching in Part D is similar or somewhat higher than those in some other settings, where choice of plans may be more consequential since it involves a full array of health services and may require switching doctors rather than pharmacies. For example, in the Federal Employees Health Benefit Program, about 12 percent of federal employees switched plans annually between 1996 and 2001.22 A similar rate of switching (13 percent) has been reported for all nonelderly Americans with employer-sponsored health insurance, although that rate includes involuntary switching resulting from changes in jobs or in employer plan offerings.23 In some other settings, switching rates have been lower than in Part D. For example, the switching rate in the Massachusetts Commonwealth Care/Health Connector ranged from 2.5 percent to 6.9 percent between 2009 and 2013.24 Although there are no recent published studies of switching in Medicare Advantage, a 1996 survey of Medicare managed care enrollees found that about 7 percent had switched from one Medicare Advantage plan to another in the previous year, and a 2000 survey found that only 4 percent switched Medicare Advantage plans.25
The evidence presented here and in other studies suggests that many Part D enrollees could lower their costs by engaging annually in the process of reviewing and comparing their plan options during the annual enrollment period, and when appropriate, switching to a lower-cost plan.26 The reasons for the low level of switching in Part D are not clear. In one view, enrollment stability could be a sign of enrollees’ satisfaction with their plans. Another view is that beneficiaries avoid “rocking the boat,” by staying in their current plans, preferring the status quo (even at a higher cost) over the unknowns of a new plan.27 Alternatively, the low rate of switching plans could indicate that Medicare beneficiaries are not fully engaged in the Part D program’s choice-based system and that the task of reviewing and comparing plans in the face of many different options may be too difficult or may not seem worth the effort. This view is supported by some qualitative evidence from polls and focus groups, where beneficiaries have reported that they would prefer less choice and a simpler system.28 This view is also supported by behavioral economics research which suggests that decision makers who face a wide range of choices have more difficulty making decisions, make poorer choices, and may in fact fail to make any decision whatsoever.29
Our analysis suggests that higher premiums, higher deductibles, and less generous coverage in the gap are associated with higher than average PDP switching rates, but even with these changes, only a small share of Part D enrollees switched away from PDPs that raised premiums, increased deductibles, or dropped brand gap coverage. Enrollees who switched PDPs were more likely to face lower premiums than those who did not. However, switching plans was much less likely to lead to a reduction in the overall amount that enrollees pay out of pocket for their drugs (excluding premiums). This finding suggests that even those enrollees who undertake the task of reviewing their plan options may not be fully aware of the tools available that would help them compare total costs. For example, if a beneficiary enters their drug regimen into the Plan Finder website developed by CMS, the program will calculate total costs for all plans in the beneficiary’s area and array them in order from least to most costly—simplifying the information the beneficiary needs to review. Some observers have suggested that more availability of one-on-one counseling or more targeted information provided regularly to Part D enrollees could reduce the transaction costs associated with switching plans.30
To the extent that Part D enrollees do not regularly evaluate their plan options or select a new plan even in the face of higher costs, the competitive model inherent to Part D may fall short of expectations. Policymakers may want to consider ways to simplify the required decision making for beneficiaries and provide better decision-support tools. CMS has taken some key steps in the last few years by reducing the number of competing plans and requiring that multiple plan offerings by the same plan sponsor have meaningful differences. CMS has also taken steps since the start of the program to improve the quality of available plan information with enhancements to the online Plan Finder and the availability of better performance measures in the star rating system. Nevertheless, many beneficiaries do not take advantage of these tools on a regular basis, and some are reluctant to initiate research into alternate plan selections because they underestimate the potential savings they could achieve.31 This suggests that more could be done to reduce the number of plan offerings and make it easier for beneficiaries to compare plans, thereby improving the environment for reviewing and selecting plans.32
Our findings have implications beyond Part D, as policymakers debate options for broader Medicare restructuring, including options that would increase the role of private plans in Medicare. The evidence to date from Part D suggests that most beneficiaries, once enrolled, tend to stick with the plans they have chosen, even when they are faced with relatively large premium increases. While this tendency likely reflects a mix of both satisfaction with the status quo and some reluctance to examine alternatives or make a change, it also points to a disconnect between theory and reality in this and potentially other choice-based systems for Medicare. In the face of evidence suggesting that plans will retain most of their enrollees regardless of premium increases or modifications to other plan features, plan sponsors may have less incentive to keep costs down. The result could be higher costs for both beneficiaries and the federal government, because under the structure of Part D, where both the government’s share of the premium and the beneficiary’s premium amount are derived from the average of plan bids, these costs go up as plan bids increase. Results of our study raise questions about the degree to which beneficiaries are willing or able to let cost be their ultimate guide in choosing a plan. As a result, the competitive signal is not sent to plan sponsors, and beneficiaries could miss out on an opportunity to achieve savings.
This issue brief was authored by Jack Hoadley and Laura Summer of Georgetown University; Elizabeth Hargrave of NORC at the University of Chicago; and Juliette Cubanski and Tricia Neuman of the Kaiser Family Foundation.
The authors thank Amanda Tzy-Chyi Yu, Jean-Ezra Yeung, Tianne Wu, and Samuel Stromberg at NORC at the University of Chicago for programming services; Christopher Powers at CMS for assistance in the data acquisition process; Gretchen Jacobson at the Kaiser Family Foundation and Tom Rice at UCLA for additional input and review.
Appendix
APPENDIX 1: STUDY METHODOLOGY
The analysis for this study is based on a 5-percent random sample of Medicare beneficiaries, obtained from the Centers for Medicare & Medicaid Services (CMS), for each year from 2006 to 2010. The sample dataset includes information on the characteristics of beneficiaries from the Master Beneficiary Summary File and Part D plan information from the Part D Plan Characteristics Files (encrypted at the level of the contract ID and plan ID).
From the one-year samples, we matched beneficiaries across years to build a series of samples of beneficiaries who were enrolled in the Part D program for each of four two-year periods (2006-07, 2007-08, 2008-09, and 2009-10) (Table A1). To be included in a two-year sample, beneficiaries (1) must have participated in Part D in both December of the first year of a two-year pair and January of the second year and (2) must have been non-LIS in all months for which they were enrolled in a drug plan. Anyone who died prior to January of the second year is excluded from the analysis. By measuring enrollment in December of year one, we focus the study only on switches occurring in the annual enrollment period. This rule also allows inclusion of beneficiaries who entered the program during the full annual enrollment period for 2006, which extended from November 15, 2005 until May 15, 2006.
Table A1: Number of Part D Enrollees in Two-Year Samples, by Exclusion Criteria
Separate sub-samples were created for those who were enrolled in a stand-along prescription drug plan (PDP) in the first year of each two-year cycle and those who were enrolled in a Medicare Advantage prescription drug (MA-PD) plan in the first year; most of the analysis reported here is based on the PDP sample (Table A2). Part D enrollees in employer-only plans were excluded from the analysis. For the segments of the analysis examining the impact of individual and plan characteristics, we further subset the sample to include only PDP enrollees who remained in a PDP in the second year. By excluding Part D enrollees who are in MA-PD plans before or after the annual enrollment period, we avoid the complications of the larger array of factors related to plan switching in the Medicare Advantage market. This last reduction to the sample eliminates those switching from a PDP to an MA-PD plan, therefore the rate of switching is reduced from 12.9 percent (averaged across the four annual enrollment periods) of the sample of all enrollees in a PDP entering the annual enrollment period to 10.5 percent of enrollees in PDPs both before and after.
Table A2: Number of Part D Enrollees in Two-Year Samples, by Type of Plan Enrollment
We built another sample of beneficiaries who were enrolled in the program for the entire 2006-2010 period (Table A3). To be included in the five-year sample, beneficiaries (1) must have participated in Part D continuously from December 2006 through January 2010 and (2) must have been non-LIS during all these months. We further subset the sample into three groups: those enrolled in PDPs throughout all 38 months of this time period, those enrolled in MA-PD plans for all 38 months, and those enrolled in some combination of PDPs and MA drug plans during the period.
Table A3: Number of Part D Enrollees in the Five-Year Sample (Dec 2006-Jan 2010)
For the non-LIS Part D enrollees in each two-year sample, we define a plan switch based on enrollment in a different plan in January of the second year, compared to December of the first year (plan elections made at any time during the annual enrollment period are effective on January 1). This approach is the same as that which MedPAC uses to assess the rate of Part D plan switching.33 The use of December-to-January to measure change in plans as the definition of a plan switch restricts the analysis to switching that occurs during the annual enrollment period that ends in December of each year, and excludes any plan switching that occurs in the additional open enrollment period available to Part D enrollees at the beginning of the year or other mid-year plan switches. The policy in effect between 2006 and 2010 allowed enrollees the opportunity to make one additional change in health plans in January, February, or March, as long as the change did not involve adding or dropping drug coverage.34 Measuring plan switches that occurred between December of year 1 and January of year 2 means that changes made in this additional open enrollment period were not captured in our analysis. In addition, enrollees may switch plans at any time during the year in special circumstances, such as moving to a new address with different plan options or moving into or out of an institution. As a result, our analysis has underestimated the overall rate of plan switching by some unknown degree. However, an examination of enrollment data in CMS’s monthly enrollment reports suggests that the use of these additional opportunities to switch plans is relatively low and their inclusion would not have a sizeable effect on the overall rates of plan switching measured here.
We do not count plan switches that are involuntary under the following two circumstances: (1) a plan enrollee whose plan (as designated by the contract ID and plan ID combination) changes, but where the old plan and the new plan are matched (“crosswalked”) and who accepts the automatic transfer to the crosswalked plan;35 and (2) any plan enrollee whose plan exits the program without any crosswalked plan and who therefore must select a new plan to remain in Part D.36 For the five-year sample, switches were defined in a comparable manner, taking into account only voluntary switches that occurred between December of one year and January of the next year.
Because the switching analysis presented here is based on individual decisions, the sample of beneficiaries for the analysis of each two-year file excludes newly eligible beneficiaries, beneficiaries who died during the relevant time period, and others who did not participate in Part D in both years. In addition, this analysis excludes from the estimate of switching rates various types of involuntary switches. As a result, the results reported here cannot be used to project the total net enrollment change from one year to the next. The net enrollment change is a product of how many people switch plans voluntarily, those who switch involuntarily as a result of plan exits, new enrollees to Part D, and those who have died or disenrolled from Part D.
The encryption of plan identifiers imposes some limitations on our study. Some plan sponsors operate under multiple contract numbers, often because they acquire the contract number from another plan sponsor through a corporate merger or acquisition. As a result, we cannot reliably distinguish between switches within plans offered by the same sponsor and those across plan sponsors. In addition, the use of encrypted plan identifiers makes it difficult to analyze plan characteristics that are not reported in the plan characteristics files. For example, we cannot look at externally derived measures of plan benefit designs or plan formularies, beyond measures included in the plan characteristics files (especially premiums, gap coverage, and deductibles).
Another limitation, especially for looking at the impact of plan characteristics, is that plans may change in multiple ways from one year to the next. As a result, it may be difficult to determine when a switch is more associated with one factor (such as a premium increase) or another (such as a deductible increase) when many beneficiaries in the sample are enrolled in the same plan. For example, some beneficiaries facing an increased deductible face the same premium change because they are in the same plan. This situation makes it more difficult to disentangle the effects of different plan characteristics and to interpret statistical significance tests. To mitigate this concern, we focused the analysis of changes in plan characteristics on years when changes were more common and where differences in switching rates were larger. We also put the variables measuring changes in plan premiums, deductibles, and gap coverage in a multivariate logistic regression, which should control for simultaneous plan changes. Parameters for all three types of benefit change were statistically significant, and the estimated odds ratios showed that the magnitude of the relationships was substantial.
In addition, the study is limited to the plan and beneficiary characteristics in the Medicare Beneficiary Summary File. We did not obtain for this study the prescription drug events (claims) for beneficiaries or claims from Medicare Parts A and B. Thus, we cannot calculate beneficiary risk scores or use measures of drug spending or other Medicare spending beyond the summary measures available in the Master Beneficiary Summary File. In addition, no measures of income or education are available, and the coding of race and ethnicity (as presented in Appendix 2, Exhibits A1 and A4) in the Medicare files raises issues.37 First, race and ethnicity are not divided into separate variables. For example, Hispanic beneficiaries who are black may be listed as Hispanic but not as black. Second, information on race is self-identified, typically either when someone first applies for a Social Security number or first applies for benefits (with some updating from a postcard survey). To address issues of accuracy and bias in the coding (especially for Hispanic and Asian/Pacific Islander beneficiaries), CMS has a second variable based on an imputation algorithm that largely relies on surnames and increases the number of beneficiaries coded as Hispanic or Asian/Pacific Islander.38 We have used the second variable for the tables in Appendix 2. However, the results based on race and ethnicity should be used with caution.
.
APPENDIX 2: DATA TABLES
Endnotes
Enrollees whose current plan is scheduled to exit the market at the end of the year may be transferred to a new plan if the same sponsor has other plans in the program.u00a0 Otherwise, they are required to select new plans in order to remain in the program.u00a0 In addition, some plan enrollees who receive the programu2019s Low-Income Subsidy (LIS) are transferred to a new plan if their current plans no longer qualify as zero-premium plans for LIS beneficiaries. ↩︎
Jack Hoadley, Laura Summer, Elizabeth Hargrave, and Juliette Cubanski, u201cMedicare Part D Prescription Drug Plans: The Marketplace in 2013 and Key Trends, 2006-2013,u201d Kaiser Family Foundation, forthcoming. ↩︎
Yaniv Hanoch, Thomas Rice, Janet Cummings, and Stacey Wood, How Much Choice is too Much? The Case of the Medicare Prescription Drug Benefit,u201d HSR 44(4):1157-1168, August 2009; Jeffrey R. Kling, Sendhil Mullainathan, et al., u201cComparison Friction: Experimental Evidence from Medicare Drug Plans,u201d Quarterly Journal of Economics 127(1): 199-235, January 2012.; Jason T. Abaluck and Jonathan Gruber, u201cChoice Inconsistencies among the Elderly: Evidence from Plan Choice in the Medicare Part D Program,u201d American Economic Review 101(4): 1180-1210, June 2011; Florian Heiss, Adam Leive, Daniel McFadden, and Joachim Winter, u201cPlan Selection in Medicare Part D: Evidence from Administrative Datau201d (No. w18166), National Bureau of Economic Research, 2012. ↩︎
Chou Zhou and Yuting Zhang, u201cThe Vast Majority of Medicare Part D Beneficiaries Still Donu2019t Choose the Cheapest Plans That Meet Their Medication Needs,u201d Heath Affairs 31(10): 2259-2265, October 2012; Jason Abaluck and Jonathan Gruber, u201cEvolving Choice Inconsistencies in Choice of Prescription Drug Insurance,u201d National Bureau of Economic Research Working Paper 19163, June 2013. ↩︎
Jennifer M. Polinski, Aman Bhandari, Uzaib Y. Saya, et al., u201cMedicare Beneficiariesu2019 Knowledge of and Choices Regarding Part D, 2005 to the Present,u201d Journal of the American Geriatrics Society, 58(5): 950u2013966, May 2010; Hanoch et al. (2009).u00a0 One other study agrees that decision costs are greater with more options, but finds that benefits also increase. M. Kate Bundorf and Helena Szrek, u201cChoice Set Size and Decision Making: The Case of Medicare Part D Prescription Drug Plans,u201d Medical Decision Making, 30(5): 582-593, September/October 2010. ↩︎
Abaluck and Gruber (2013).u00a0 Another study suggested that Part D enrollees dramatically improved their plan choices in the programu2019s second year.u00a0 But because this study uses data from only a single plan manager with a limited range of plan offerings, it is not generalizable to the broader Part D population. Jonathan D. Ketcham, Claudio Lucarelli, et al., u201cSinking, Swimming, or Learning to Swim in Medicare Part D,u201d American Economic Review 102(6): 2639-2673, 2012. ↩︎
Some LIS beneficiaries whose plans will no longer qualify as benchmark plans in the new year, are randomly reassigned to benchmark plans during the annual enrollment period.u00a0 Because the plan choice dynamics are different for LIS beneficiaries, they will be the subject of a separate analysis. ↩︎
Medicare Payment Advisory Commission, Report to the Congress: Medicare Payment Policy, March 2013; Shinobu Suzuki, u201cMedicare Part Du2019s Competitive Design: Do Part D Enrollees Switch Plans?u201d Academy Health, June 2013. ↩︎
See Appendix 1 for a discussion of issues with the race variable in the Medicare data used for this analysis. ↩︎
The 13 percent switching rate exceeds the estimate reported in a CMS press release in January 2008 stating that 6 percent of all non-LIS beneficiaries enrolled in Part D who made a change between 2007 and 2008 (more recent estimates have not been released by CMS).u00a0 CMS press release, January 31, 2008.u00a0 It is unclear what methodology was used by CMS for their 6 percent estimate.u00a0 Our estimate is comparable to numbers reported recently by the MedPAC (Report to the Congress, March 2013; Shinobu Suzuki, u201cMedicare Part Du2019s Competitive Design: Do Part D Enrollees Switch Plans?u201d June 2013) and Andrew Stocking (Congressional Budget Office, u201cCompetition and Bids in Medicareu2019s Prescription Drug Program,u201d Academy Health, June 2013).u00a0 In the March 2013 report, MedPAC reported an overall Part D switching rate of 13.6 percent for 2009-10; separately by plan type, the reported switching rate for 2009-10 was 13 percent for PDPs and 15 percent for MA-PD plans. ↩︎
Despite taking no action to switch PDPs, some ended up in different PDPs because of market changes.u00a0 Several large mergers and acquisitions occurred during these years, and most plan sponsors made at least some adjustments to their array of plan offerings.u00a0 The resulting transfer of enrollees out of existing plans (excluded from the switching definition used in this analysis) meant that some non-switchers still experienced a change in plans. ↩︎
Heiss et al. (2012); Abaluck and Gruber (2013). ↩︎
Marisa Elena Domino, Sally C. Stearns, Edward C. Norton, and Wei-Shi Yeh, u201cWhy Using Current Medications to Select a Medicare Part D Plan May Lead to Higher Out-of-Pocket Payments, Medical Care Research and Review 65(1): 114-126, February 2008. ↩︎
This patternu2014that enrollees in any PDPs that retained an existing deductible were more likely to switch plans than those in PDPs with no deductibleu2014also occurred in earlier annual enrollment periods. ↩︎
Abaluck and Gruber (2013); Heiss et al. (2012). ↩︎
This market reappeared somewhat in 2011 when CMS allowed sponsors to offer a third PDP only if it included brand gap coverage.u00a0 In 2013, 16 percent of PDPs offer gap coverage for some brand drugs (but less extensive than the coverage offered in 2006 and 2007).u00a0 Premiums for this coverage are especially high (nearly triple that of PDPs with no gap coverage), and only 3 percent of PDP enrollees have selected these PDPs.u00a0 Jack Hoadley, Laura Summer, Elizabeth Hargrave, and Juliette Cubanski, u201cMedicare Part D Prescription Drug Plans: The Marketplace in 2013 and Key Trends, 2006-2013,u201d Kaiser Family Foundation, forthcoming; Jack Hoadley, Juliette Cubanski, et al., u201cMedicare Part D: A First Look at Part D Plan Offerings in 2013,u201d November 2012, available at https://modern.kff.org/medicare/report/medicare-part-d-first-look-at-2013-plan-offerings/. ↩︎
Adam Atherly, Curtis S. Florence, and Kenneth E. Thorpe, u2018u2018Health Plan Switching among Members of the Federal Employees Health Benefits Program,u2019u2019 Inquiry 42(3): 255u201365, 2005. ↩︎
Peter J. Cunningham, u201cFew Americans Switch Employer Health Plans for Better Quality, Lower Costs,u201d NIHCR Research Brief No. 12, Center for Studying Health System Change, January 2013.u00a0 Many employers do not offer a choice of health plans; those that do offer only a limited array of choices. ↩︎
These rates also include some involuntary switchers.u00a0 u201cCommonwealth Care Quarterly Update,u201d September 2011. ↩︎
In the 1996 survey, the switching rate is 11 percent if switches to fee-for-service Medicare are included.u00a0 Physician Payment Review Commission, u201cAccess to Care in Medicare Managed Care: Results from a 1996 Survey of Enrollees and Disenrollees,u201d Selected External Research Series, Number 7, November 1996, page 36; Marsha Gold and Natalie Justh, u201cHow Salient is Choice to Medicare Beneficiaries,u201d Monitoring Medicare+Choice: Fast Facts, Number 5, Mathematica Policy Research, January 2001. ↩︎
Hanoch et al. (2009); Kling et al. (2012); Abaluck and Gruber (2013). ↩︎
Elizabeth Hargrave, Bhumika Piya, Jack Hoadley, Laura Summer, and Jennifer Thompson, u201cExperiences Obtaining Drugs under Part D: Focus Groups with Beneficiaries, Physicians, and Pharmacists,u201d Contractor report submitted to the Medicare Payment Advisory Commission, March 2008. ↩︎
Kaiser Family Foundation, u201cChartpack: Seniors and the Medicare Prescription Drug Benefit,u201d November 2006, available at https://modern.kff.org/medicare/poll-finding/chartpack-seniors-and-the-medicare-prescription-drug/; Kaiser Family Foundation, u201cKey Findings from the Kaiser Family Foundation 2012 National Survey of Seniors: Seniorsu2019 Knowledge and Experience with Medicareu2019s Open Enrollment Period and Choosing a Plan,u201d October 2012; Marc Berk, Karen Cheung, Elizabeth Eaton, et al., u201cHow Beneficiaries Learned about Medicare Drug Plans and Made Plan Choices,u201d Contractor report submitted to the Medicare Payment Advisory Commission, Aug. 2007; Florian Heiss, Daniel McFadden, and Joachim Winter, u201cWho Failed to Enroll in Medicare Part D, and Why? Early Results,u201d Health Affairs 25(5) w344-w354, 2006. ↩︎
The broader theory is stated in Sheena Iyengar and Mark Lepper, u201cWhen Choice is Demotivating: Can One Desire Too Much of a Good Thing?u201d Journal of Personality and Social Psychology 79(6):995-1006, December 2000.u00a0 Applications to Part D are available in Hanoch et al. (2009) and Bundorf and Szrek (2008). ↩︎
Kling et al. (2012); Richard H. Thaler and Cass R. Sunstein, Nudge: Improving Decisions about Health, Wealth, and Happiness, New Haven: Yale University Press, 2008. ↩︎
Jack Hoadley, u201cMedicare Part D: Simplifying the Program and Improving the Value of Information for Beneficiaries,u201d The Commonwealth Fund, May 2008. ↩︎
Medicare Payment Advisory Commission (MedPAC), Report to the Congress: Medicare Payment Policy, March 2013. ↩︎
Effective in 2011, this policy was revised to allow Medicare Advantage enrollees, but not PDP enrollees, to change their plan elections during the first 45 days of a year.u00a0 Under the revised policy, they may only make a change back to traditional Medicare and a PDP and not to another Medicare Advantage plan. ↩︎
These are mostly situations where a plan sponsor has reorganized plan offerings as a result of acquiring plans from another sponsor, dropping some of its plans, or adding new plans. ↩︎
These situations have occurred relatively rarely in the Part D program to date. ↩︎
Daniel R. Waldo, u201cAccuracy and Bias of Race/Ethnicity Codes in the Medicare Enrollment Database,u201d Health Care Financing Review 26(2): 61-72, Winter 2004/2005. ↩︎
Celia Eicheldinger and Arthur Bonito, u201cMore Accurate Racial and Ethnic Codes for Medicare Administrative Data,u201d Health Care Financing Review 29(3): 27-42, Spring 2008. ↩︎