Profiles of Medicaid Outreach and Enrollment Strategies: The Cook County Early Expansion Initiative

Author: Samantha Artiga
Published: Apr 7, 2014

Introduction

In late 2012, Illinois obtained a Section 1115 demonstration waiver that allowed the state to get an early start on the Affordable Care Act (ACA) Medicaid expansion for adults in Cook County. Named “CountyCare,” the demonstration was designed to help the state and Cook County Health and Hospitals System (CCHHS) build capacity and experience to support implementation of the expansion in 2014 and get a jump-start on enrollment. Cook County, Illinois encompasses 132 municipalities including the City of Chicago and has a total population of 5.2 million people, accounting for over 40 percent of all Illinois residents.1  Over 618,000 uninsured adults are estimated to be eligible for the ACA’s Medicaid expansion in Illinois, with over 341,000 of them residing in Cook County.2  CCHHS serves as a key safety-net provider for the low-income uninsured population in Cook County and is the third largest public hospital system in the nation.3 

This brief provides an overview of the CountyCare waiver experience, which may help inform continued efforts as the Medicaid expansion is implemented across states. It finds that, in just over 12 months, more than 82,000 Cook County residents successfully enrolled in CountyCare coverage, allowing the state and county to get a significant jump start on the Medicaid expansion (Figure 1).4  Illinois implemented the full Medicaid expansion in January 2014 and automatically transitioned CountyCare enrollees to the expansion. As of March 2014, CountyCare members account for nearly half of the total statewide enrollment of adults into the Medicaid expansion.5 
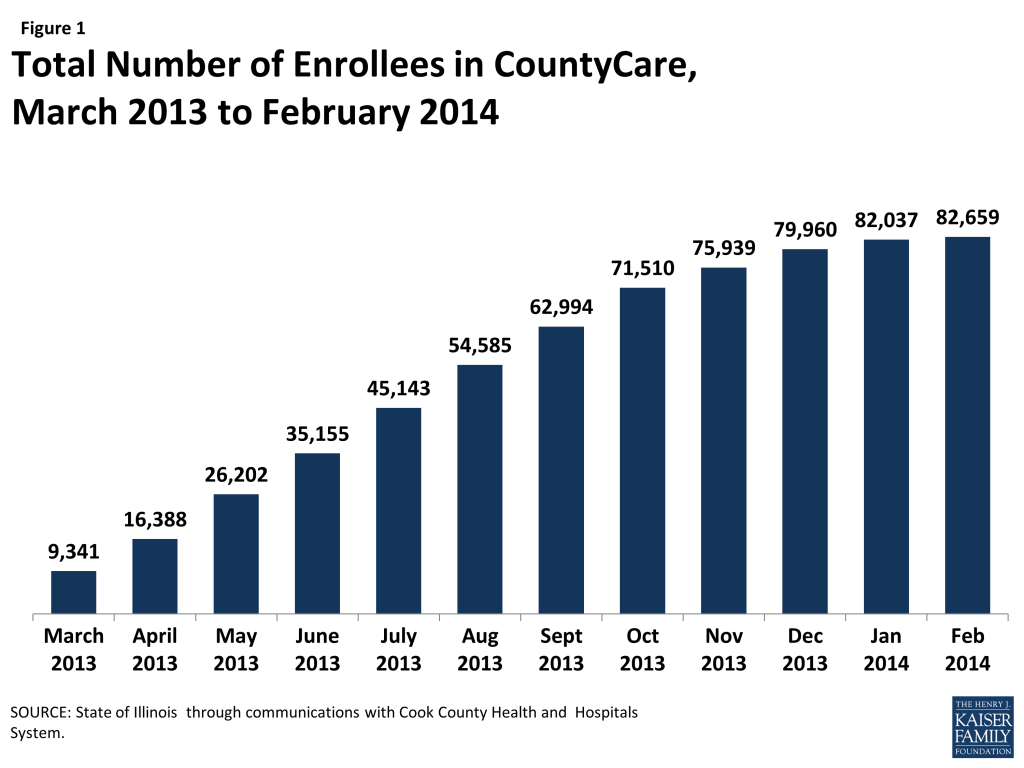
Figure 1: Total Number of Enrollees in CountyCare, March 2013 to February 2014

Overview of the CountyCare Waiver

On October 26, 2012, Illinois received approval from the Centers for Medicare and Medicaid Services (CMS) for its Cook CountyCare Section 1115 demonstration waiver, which allowed the state to expand coverage to adults with income at or below 133% of the federal poverty level (FPL), who reside in Cook County. Eligibility for CountyCare is limited to adults age 19-64, who meet citizenship and immigration status requirements and do not qualify for Medicare or Medicaid or CHIP. When initially implemented, CountyCare members were covered for a broad range of services provided through CCHHS sites and a network of community providers contracted with CCHHS to provide care under the waiver, similar to a managed care plan.

Application and Enrollment

Between February 2013 and February 2014, more than 113,000 applications were submitted for CountyCare, with more than 82,000 approved and approximately 18,000 pending review.6  The remaining applications were denied for a variety of reasons including the applicant having income above the eligibility limit, being eligible for regular Medicaid, or the application missing information needed to process the determination.

To enroll in CountyCare, individuals apply through a CountyCare application assister. Prior to initiating a full application, application assisters ask individuals six screening questions to determine if they will likely be eligible for CountyCare. This pre-screening process contributed to a high approval rate for submitted applications, with over eight in ten (85%) submitted applications for CountyCare approved.7 

Application assisters are available at locations across the county and through a call center. Some 375 CountyCare application assisters are located at 92 geographically dispersed sites throughout the county including CCHHS sites and Federally Qualified Health Centers (FQHCs) contracted to provide services as part of the CountyCare provider network under the waiver.8  In addition, CCHHS established a call center through which individuals can apply for CountyCare, which is open weekdays from 8:00am to 8:00pm and Saturdays from 9:00am to 2:00pm.9  Through the call center, application assisters complete the CountyCare application and then mail a signature page and self-addressed stamped envelope to applicants to return with necessary documentation. Over half of all applications have been initiated through the call center. Over 100 state eligibility caseworkers were hired to process applications submitted for CountyCare. These applications are processed centrally through an Illinois Department of Human Services local eligibility office. Cook County contributes the non-federal share of funding to cover the costs of administering the waiver.

Outreach

Broad outreach for County Care was conducted through a variety of avenues including earned media, primarily through neighborhood newspapers and digests; posters and flyers; and community outreach events. For example, local pastors and community leaders visited over 300 places of worship to educate people about CountyCare. In addition, CountyCare application assisters participated in an event hosted by the City of Chicago that brought together freelance musicians and artists, many of whom were uninsured and eligible for CountyCare.

In addition, targeted outreach was provided to uninsured patients at CCHHS and network health centers who were likely eligible for CountyCare. These patients received recorded calls that advised them about CountyCare and offered to connect them directly to the call center to begin an application. Health center staff also provided information about CountyCare to patients in waiting rooms.

Outreach was also conducted through other areas of Cook County government. For example, information was included with paychecks to CCHHS staff as a general education tool. Probation officers were also provided with information and training on CountyCare eligibility requirements, the application process, benefits, and network to help connect their clients to coverage. Further, local elected officials, including County Commissioners and Chicago Aldermen offices included information about CountyCare in their newsletters and communications to district residents.

An initiative was also established to assist detainees in applying for CountyCare while going through the Cook County Jail intake process. This partnership effort between CCHHS, the Cook County Sheriff, and Treatment Alternatives for Safe Communities, a local non-profit organization,resulted in over 13,700 initiated applications. About 4,400 of these applications have been submitted and over 2,400 individuals have enrolled.10 

Connecting CountyCare Enrollees to Care

Once an individual is determined eligible for CountyCare, he or she receives a welcome call and is asked to select a medical home and make an initial appointment for care. Many individuals enrolling in CountyCare need help understanding how to use their health coverage and the role of their primary care provider since they may not have previous experience with health coverage. Individuals have been enthusiastic about the coverage opportunity, particularly to gain coverage for physician and hospital services and prescription drugs. Overall, there are significant health needs among individuals enrolled in CountyCare, with many requiring case management and supportive services. As more understanding is gained about the health needs of the population, CCHHS intends to develop initiatives for care coordination that will build upon the existing strengths and assets within the CountyCare provider network.

Transition to the 2014 Medicaid Expansion

As of January 2014, Illinois expanded Medicaid under the ACA to include adults with incomes at or below 138% FPL. Prior to the expansion, Illinois already covered parents with incomes up to this level, but other adults without disabilities were not eligible, regardless of their income level.

CountyCare enrollees were automatically transitioned to the Medicaid expansion. Individuals enrolled in CountyCare did not need to reapply for coverage under the expansion as the state obtained federal approval to administratively enroll CountyCare members into the new adult expansion group. Moreover, when the expansion took effect, benefits for CountyCare members were expanded to align with the Medicaid benefits package provided to all expansion adults. Additional services covered under this benefit package include optometry care and eyeglasses, as well as audiology services. In addition, individuals who reside in Cook County and are eligible under the Medicaid expansion now have the option to continue to obtain services through the CountyCare provider network or may opt-out to receive care through any of the state’s Medicaid providers.

CMS approved the state’s request to temporarily extend the CountyCare waiver to June 30, 2014. This extension enables the state to continue using the same per member per month payment methodology it had been using under the waiver for services provided through the CountyCare provider network. The experience with this payment methodology is intended to help inform the state’s preparations to establish capitation rates as it transitions its overall Medicaid population in Cook County to managed care. Beginning as of February 2014 and phasing in over time, Medicaid beneficiaries in Cook County and other counties throughout Illinois will be asked to choose a managed care plan or coordinated care network. Those who do not make an active choice will be auto-assigned into a plan. CountyCare is intended to be available as a plan option as enrollees are transitioned to managed care plans.

CCHHS also is developing several low-cost private insurance plans that will be offered through the new Health Insurance Marketplace. The goal of these plans is to support continuity of care for individuals who move between Medicaid and Marketplace coverage. These private plans will build upon the structure of the current CountyCare network and will be available for purchase during the 2014-2015 open enrollment period.

Conclusion

Overall, Illinois was able to get a significant early jump start on its Medicaid expansion through the CountyCare waiver. Individuals successfully enrolled in coverage by applying both in-person with application assisters and through the call center and were connected to medical homes to help coordinate their care. Looking ahead, the state is seeking to build upon some of the successful CountyCare outreach and enrollment initiatives as it implements the broader ACA Medicaid expansion.

This issue brief is part of a Kaiser Commission on Medicaid and the Uninsured series of profiles on Medicaid and CHIP Outreach and Enrollment Strategies. The author extends her appreciation to Kathy Chan with the Cook County Health and Hospitals System for providing the data and information used in this report.


  1. United States Census Bureau, “State and County Quick Facts,” http://quickfacts.census.gov/qfd/states/17/17031.html and Cook County Clerk, “Municipality Maps,” http://www.cookcountyclerk.com/aboutus/map_room/pages/municipalitymaps.aspx. ↩︎
  2. “Visualizing Health Care Reform,” IllinoisHealthMatters,” http://visualizingreform.illinoishealthmatters.org. ↩︎
  3. “Dr. Raju’s Op Ed in Crain’s,” Press Releases, http://www.cookcountyhhs.org/press-releases/dr-rajus-op-ed-crains/. ↩︎
  4. CCHHS CEO Report to the Board of Directors, February 28, 2014, http://www.cookcountyhhs.org/wp-content/uploads/2013/12/02-28-14-Agenda2.pdf, Item VI, CEO Report. ↩︎
  5. Presentation on ACA adult enrollment numbers statewide at Care Coordination Subcommittee meeting on February 4, 2014 ↩︎
  6. CCHHS CEO Report to the Board of Directors, op cit. Some enrollees were able to receive up to three months of retroactive coverage, so their coverage effectively began as of November 2012. ↩︎
  7. CCHHS Finance Committee November 29, 2013 Meeting Minutes, http://www.cookcountyhhs.org/wp-content/uploads/2013/01/12-06-13-Fin-agenda3.pdf, pg. 3 ↩︎
  8. CountyCare Providers, http://countycare.com/providers.aspx ↩︎
  9. How to Apply, CountyCare, http://countycare.com/about/howtoapply.aspx. ↩︎
  10. State of Illinois through communications with Cook County Health and Hospitals System. ↩︎
How Will the Uninsured Fare Under the Affordable Care Act?

Published: Apr 7, 2014

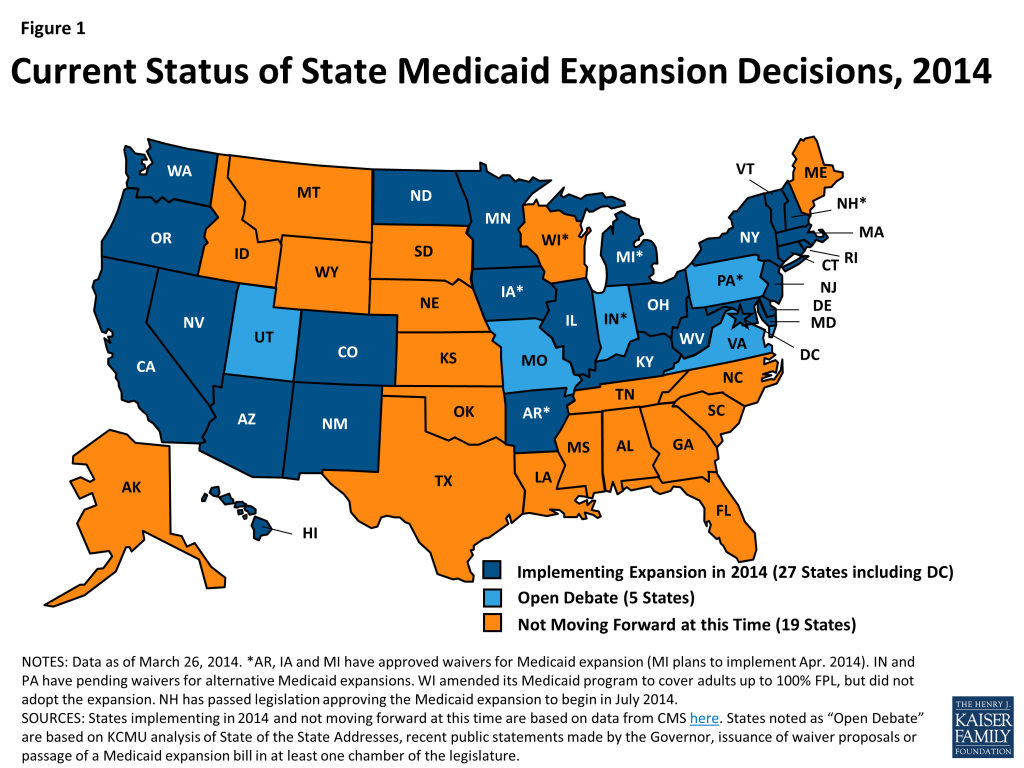
The 2010 Affordable Care Act (ACA) has the potential to extend coverage to many of the 47 million nonelderly uninsured people nationwide. The ACA establishes coverage provisions across the income spectrum, with the expansion of Medicaid eligibility for adults serving as the vehicle for covering low-income individuals and premium tax credits to help people purchase insurance directly through new Health Insurance Marketplaces serving as the vehicle for covering people with moderate incomes. With the June 2012 Supreme Court ruling, the Medicaid expansion became optional for states, and as of March 2014, 27 states, including the District of Columbia, are implementing the Medicaid expansion and 24 states are not moving forward at this time. In 5 of these states, debate about wherther to implment the Medicaid expansion is ongoing (Figure 1). As a result, while many nonelderly uninsured individuals may gain coverage through the expansions in 2014, millions of uninsured adults who would have been newly-eligible for Medicaid will remain without a coverage option. As the ACA coverage expansions are implemented and coverage changes are assessed, it is important to understand the potential scope of the law nationwide.

Figure 1: Current Status of State Medicaid Expansion Decisions, 2014

How Does the ACA Expand Health Insurance Coverage?

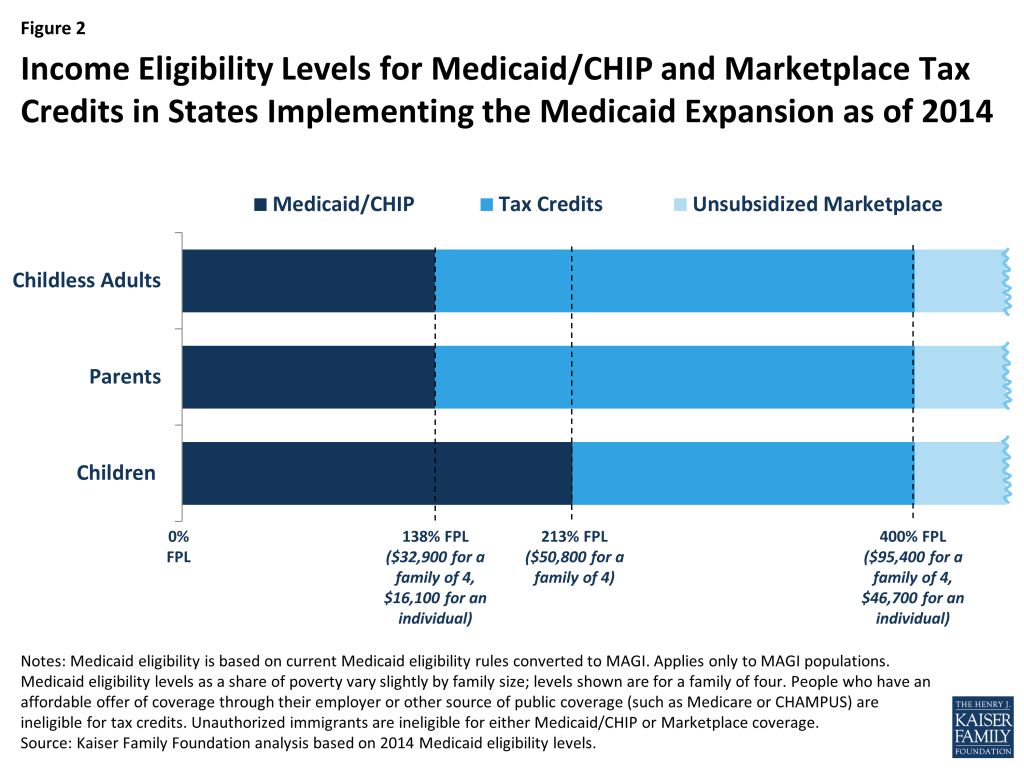
Historically, Medicaid had gaps in coverage for adults because eligibility was restricted to specific categories of low-income individuals, such as children, their parents, pregnant women, the elderly, or individuals with disabilities. In most states, adults without dependent children were ineligible for Medicaid, regardless of their income, and income limits for parents were very low—often below half the poverty level.1  However, some states had expanded coverage to parents at higher income levels or provided coverage to adults without dependent children. The ACA aimed to fill in gaps in coverage by extending Medicaid to nearly all nonelderly adults with incomes at or below 138% of poverty (about $32,900 for a family of four in 2014). In the 27 states that are implementing the Medicaid expansion in 2014, Medicaid covers almost all nonelderly adults with incomes at or below at least 138% of poverty, as shown by the dark blue shading in Figure 2. Connecticut, the District of Columbia, and Minnesota extend coverage to parents and/or childless adults at higher incomes. All states previously expanded eligibility for children to higher levels than adults through Medicaid and the Children’s Health Insurance Program (CHIP), and in the states moving forward with the expansion, the median Medicaid and CHIP eligibility threshold for children in 2014  is 213% of poverty (about $50,800 for a child in a family of four).

Figure 2: Income Eligibility Levels for Medicaid/CHIP and Marketplace Tax Credits in States Implementing the Medicaid Expansion as of 2014

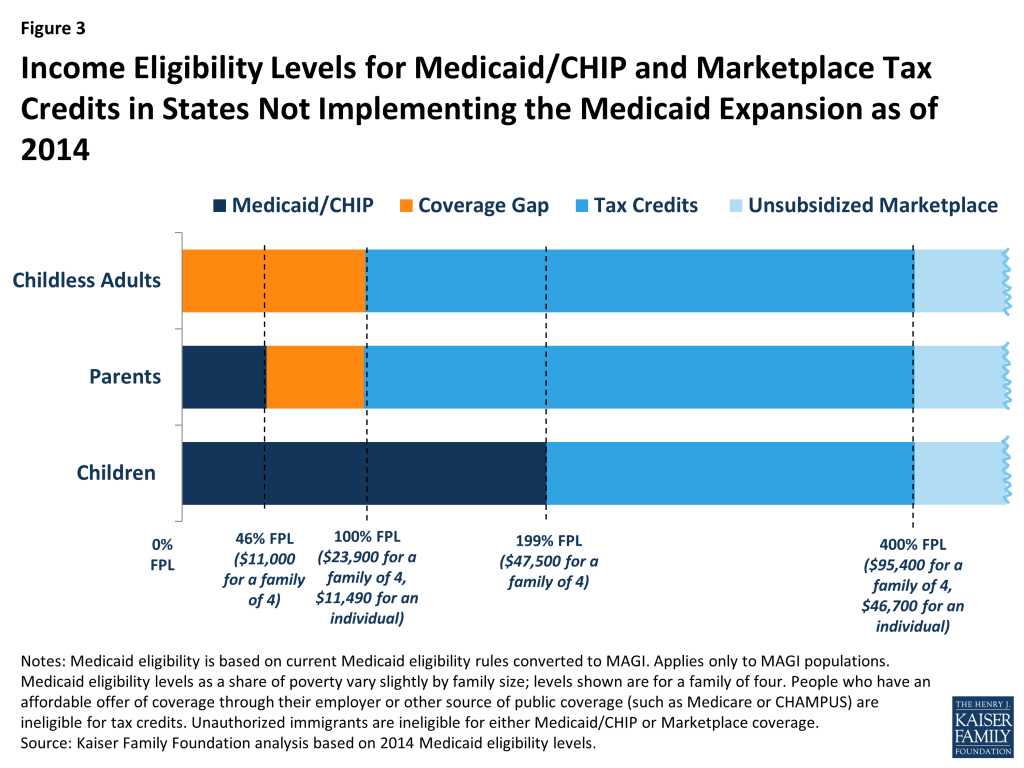
In states that do not implement the expansion, Medicaid eligibility for adults will remain quite limited. As of January 2014, the median Medicaid eligibility limit for non-disabled parents in states not implementing the expansion in 2014 is just 46% of poverty, or about $11,200 a year for a parent in a family of four. In all but one of these non-expansion states (Wisconsin), adults without dependent children remain ineligible for Medicaid regardless of their income. Eligibility levels for children compared to adults in these states remain much higher. As of 2014, the median income eligibility limit for children in Medicaid and CHIP in states not expanding Medicaid is 199% FPL (about $47,500 for a family of four) (Figure 3).

Figure 3: Income Eligibility Levels for Medicaid/CHIP and Marketplace Tax Credits in States Not Implementing the Medicaid Expansion as of 2014

As was the case before the ACA, undocumented immigrants will remain ineligible to enroll in Medicaid in all states, and recent lawfully residing immigrants are subject to certain Medicaid eligibility restrictions.2  Under the ACA, people with incomes between 100% and 400% of poverty may be eligible for premium tax credits when they purchase coverage in a Marketplace, as indicated by the bright blue shading in Figures 1 and 2. The amount of the tax credit is based on income and the cost of insurance, and tax credits are only available to people who are not eligible for other coverage, such as Medicaid/CHIP, Medicare, or employer coverage, and who are citizens or lawfully-present immigrants. Citizens and lawfully-present immigrants with incomes above 400% of poverty can purchase unsubsidized coverage through the Marketplace. Because the ACA envisioned low-income people receiving coverage through Medicaid, people below poverty are not eligible for Marketplace subsidies. Thus, in states not implementing the Medicaid expansion, some adults fall into a “coverage gap” of earning too much to qualify for Medicaid but not enough to qualify for premium tax credits, as shown by the orange shading in Figure 3. People in the coverage gap are ineligible for financial assistance under the ACA, while people with higher incomes are eligible for tax credits to purchase coverage.

How Many Uninsured Are Eligible for Assistance Under the ACA?

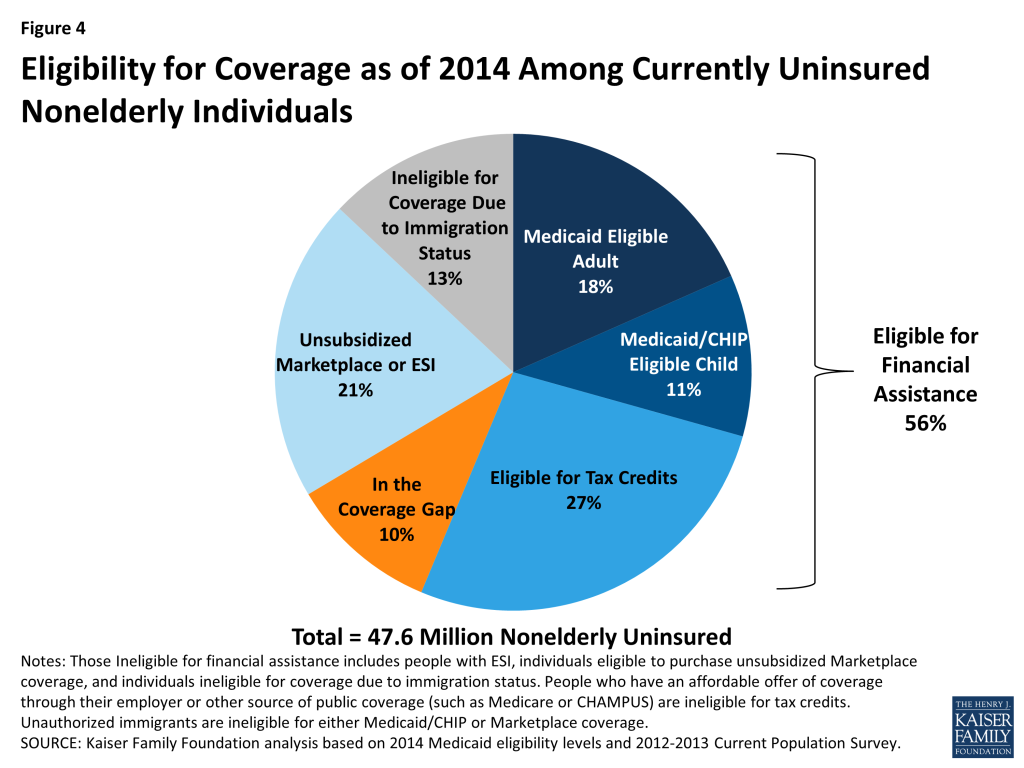
Nationally, over half (56%) of uninsured nonelderly people are eligible for financial assistance to gain coverage through either Medicaid or the Marketplaces (Figure 4). Over one-quarter (27%) of uninsured individuals are eligible for premium tax credits to help them purchase coverage in the Marketplace and approximately three in ten uninsured individuals (29%) are eligible for either Medicaid or CHIP as of 2014.

Figure 4: Eligibility for Coverage as of 2014 Among Currently Uninsured Nonelderly Individuals

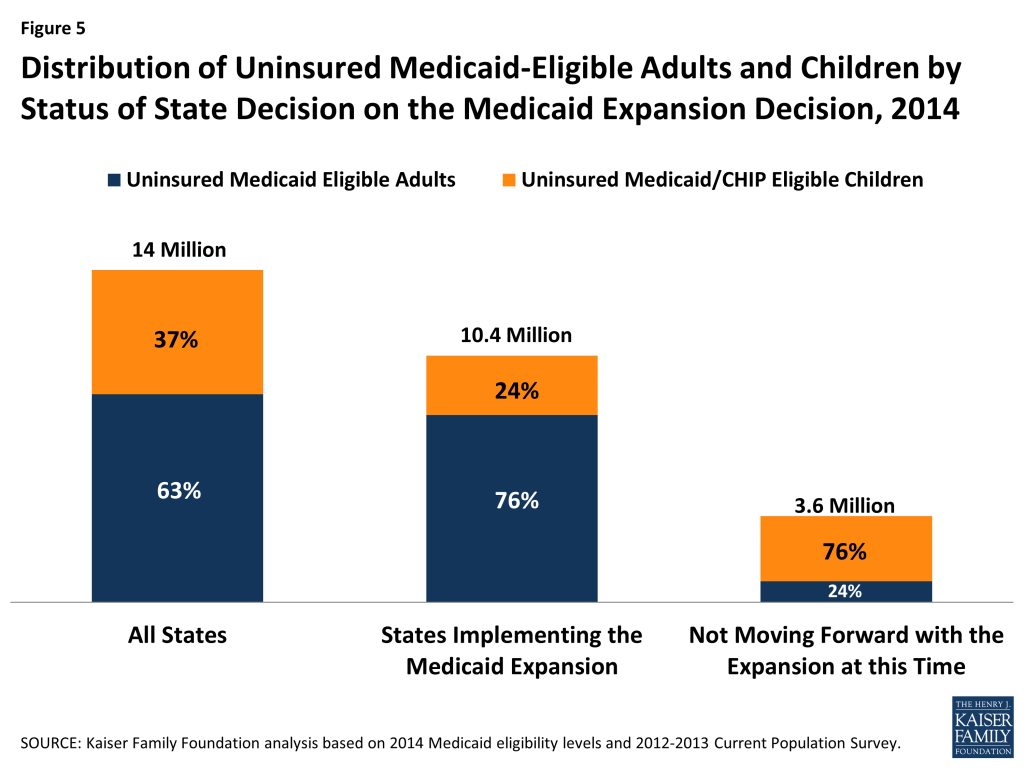
Overall, most (63%) of the 14 million people eligible for Medicaid in 2014 are adults, although the share varies significantly by state (Figure 5). Over three quarters (77%) of Medicaid-eligible people in states that are implementing the expansion are adults. In states that are not currently implementing the Medicaid expansion, some uninsured people (nearly 4 million) are eligible for Medicaid or CHIP under eligibility pathways in place before the ACA. However, reflecting historically higher eligibility levels for children than for adults, the large majority (75%) of uninsured individuals in states not expanding Medicaid are children who are already eligible but not yet enrolled in coverage. Not all Medicaid-eligible individuals are enrolled in the program due to lack of knowledge about their eligibility and historic enrollment barriers. As the ACA coverage expansions are implemented, it is likely that broad outreach efforts and new streamlined enrollment processes will lead to increased enrollment of eligible individuals into Medicaid. Nationally, 4.8 million uninsured adults (10% of the nonelderly uninsured) who would be eligible for Medicaid if their states were to expand, fall into the coverage gap. These adults are all below the poverty line and thus have very limited incomes.  Because they do not gain an affordable coverage option under the ACA, they are most likely to remain uninsured. Two other groups of uninsured individuals are outside the reach of financial assistance for health coverage under the ACA. First, 21% of uninsured people have incomes above the limit for premium tax subsidies or have an affordable offer of coverage through their employer are thus ineligible for financial assistance. Some of these people are still able to purchase unsubsidized coverage in the Marketplace, which may be more affordable or more comprehensive than the coverage they could obtain on their own through the individual market. Second, uninsured undocumented immigrants (about 13% of uninsured) are ineligible for assistance under the ACA and barred from purchasing coverage through the Marketplace. This group is likely to remain uninsured, though they will still have a need for health care services.

Figure 5: Distribution of Uninsured Medicaid-Eligible Adults and Children by Status of State Decision on the Medicaid Expansion Decision, 2014

The ACA will help many currently uninsured individuals gain health coverage by providing coverage options across the income spectrum for low and moderate-income people. However, many who could have obtained financial assistance through the Medicaid expansion will remain outside its reach. Further, in all states, the impact of the ACA will depend on take-up of coverage among the eligible uninsured, and outreach and enrollment efforts are an important factor in determining how the law affects the uninsured rate in the state. The ACA includes a requirement that most individuals obtain health coverage, but some people (such as the lowest income or those without an affordable option) are exempt and others may still remain uninsured. Notably, there is no deadline for state decisions about implementing the Medicaid expansion, and open enrollment in the Marketplaces continues through March 2014. Continued attention to who gains coverage as the ACA is fully implemented and who is excluded from its reach—as well as whether and how their health needs are being met—can help inform decisions about the future of health coverage nationwide.

Table 1: Eligibility for Coverage Under the ACA Among those Uninsured Prior to 2014

Total Uninsured

Medicaid-Eligible Adult

Medicaid/CHIP Eligible Child

Tax credit eligible

In the Coverage Gap

Ineligible for Financial Assistance

United States Total

 47,601,000


18%

11%

27%

10%

34%

Implementing the Medicaid Expansion in 2014 (27  states, including DC)

Arizona

 1,140,000

30%

11%

22%

 –

37%

Arkansas

 510,000

46%

9%

22%

 –

23%

California

 6,993,000

32%

11%

20%

 –

38%

Colorado

 737,000

34%

12%

22%

 –

33%

Connecticut

 286,000

28%

10%

25%

 –

38%

Delaware

 92,000

28%

13%

22%

 –

37%

District of Columbia

 50,000

48%

6%

10%

 –

36%

Hawaii

 102,000

46%

11%

18%

 –

25%

Illinois

 1,772,000

36%

10%

21%

 –

34%

Iowa

 301,000

38%

10%

24%

 –

29%

Kentucky

 647,000

45%

9%

22%

 –

23%

Maryland

 756,000

26%

13%

20%

 –

40%

Massachusetts

 242,000

25%

12%

20%

 –

43%

Michigan

 1,111,000

38%

7%

26%

 –

29%

Minnesota

 462,000

41%

16%

11%

 –

33%

Nevada

 621,000

33%

16%

20%

 –

31%

New Hampshire

 158,000

45%

9%

22%

 –

23%

New Jersey

 1,251,000

27%

10%

26%

 –

37%

New Mexico

 422,000

36%

12%

23%

 –

29%

New York

 2,221,000

32%

11%

24%

 –

33%

North Dakota

 70,000

33%

7%

31%

 –

30%

Ohio

 1,460,000

40%

10%

26%

 –

23%

Oregon

 559,000

38%

8%

23%

 –

30%

Rhode Island

 126,000

35%

7%

24%

 –

33%

Vermont

 47,000

28%

9%

36%

 –

28%

Washington

 948,000

37%

10%

23%

 –

30%

West Virginia

 267,000

42%

11%

23%

 –

23%

Total (Expansion States)

 23,351,000

34%

11%

22%

  –

33%

Not Moving Forward with the Medicaid Expansion at this Time (24 states)

Alabama

 660,000

4%

12%

30%

29%

25%

Alaska

 129,000

10%

12%

36%

13%

29%

Florida

 3,867,000

2%

9%

33%

20%

36%

Georgia

 1,849,000

4%

13%

28%

22%

33%

Idaho

 258,000

2%

12%

34%

21%

31%

Indiana

 801,000

3%

14%

35%

23%

25%

Kansas

 369,000

4%

11%

30%

21%

33%

Louisiana

 866,000

4%

11%

34%

28%

22%

Maine

 130,000

3%

5%

45%

18%

28%

Mississippi

 454,000

4%

12%

34%

30%

19%

Missouri

 834,000

4%

18%

33%

23%

23%

Montana

 178,000

4%

12%

38%

22%

24%

Nebraska

 234,000

3%

13%

32%

14%

38%

North Carolina

 1,593,000

2%

8%

32%

20%

37%

Oklahoma

 632,000

3%

8%

33%

23%

33%

Pennsylvania

 1,426,000

3%

13%

34%

20%

31%

South Carolina

 765,000

4%

13%

32%

25%

25%

South Dakota

 110,000

5%

11%

36%

23%

26%

Tennessee

 850,000

9%

9%

34%

19%

29%

Texas

 6,167,000

2%

12%

28%

17%

40%

Utah

 407,000

2%

13%

31%

14%

39%

Virginia

 1,021,000

3%

7%

34%

19%

37%

Wisconsin

 566,000

25%

11%

34%

 –

30%

Wyoming

 93,000

2%

8%

38%

18%

33%

Total (Non-Expansion States)

 24,250,000


4%

11%

32%

20%

34%

Notes: Those ineligible for financial assistance include people with an offer of ESI, individuals eligible to purchase unsubsidized Marketplace coverage, and individuals ineligible for coverage due to documentation status. “–” In states expanding their Medicaid programs, there is no coverage gap population.

Source: Kaiser Family Foundation analysis based on 2014 Medicaid eligibility levels and 2012-13 Current Population Survey.

  1. Some states had expanded coverage to parents at higher income levels or provided coverage to adults without children. See http://modern.kff.org/medicaid/fact-sheet/medicaid-eligibility-for-adults-as-of-january-1-2014/ for more detail on pre- and post-ACA Medicaid eligibility for adults. ↩︎
  2. For more detail on Medicaid coverage for immigrants, see: http://modern.kff.org/disparities-policy/fact-sheet/key-facts-on-health-coverage-for-low/. ↩︎

The U.S. Global Health Budget: Analysis of the Fiscal Year 2015 Budget Request

Published: Apr 7, 2014

Overview:

The President’s FY15 budget request, which was released on March 4, 2014, proposed $9.4 billion1  in funding for global health programs.  If enacted, this would represent a decline of approximately $350 million (-4%) from levels set in the FY14 Omnibus Appropriation and would essentially be a return to FY13 post-sequestration funding amounts.2 

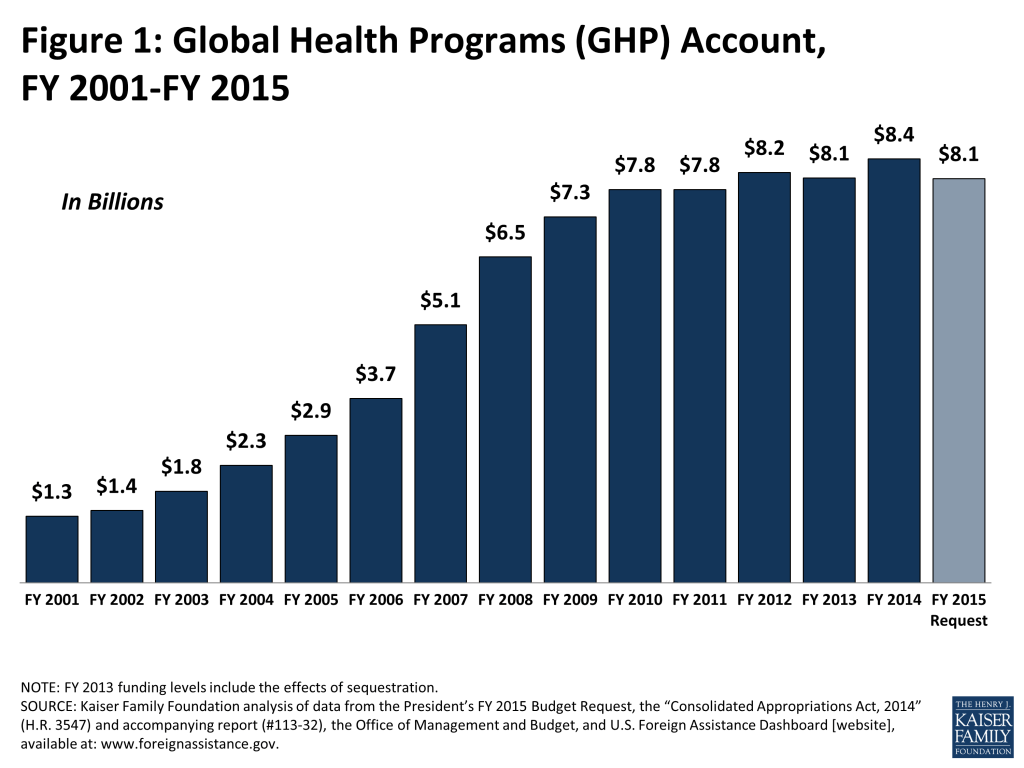
Figure 1: Global Health Programs (GHP) Account, FY 2001-FY 2015

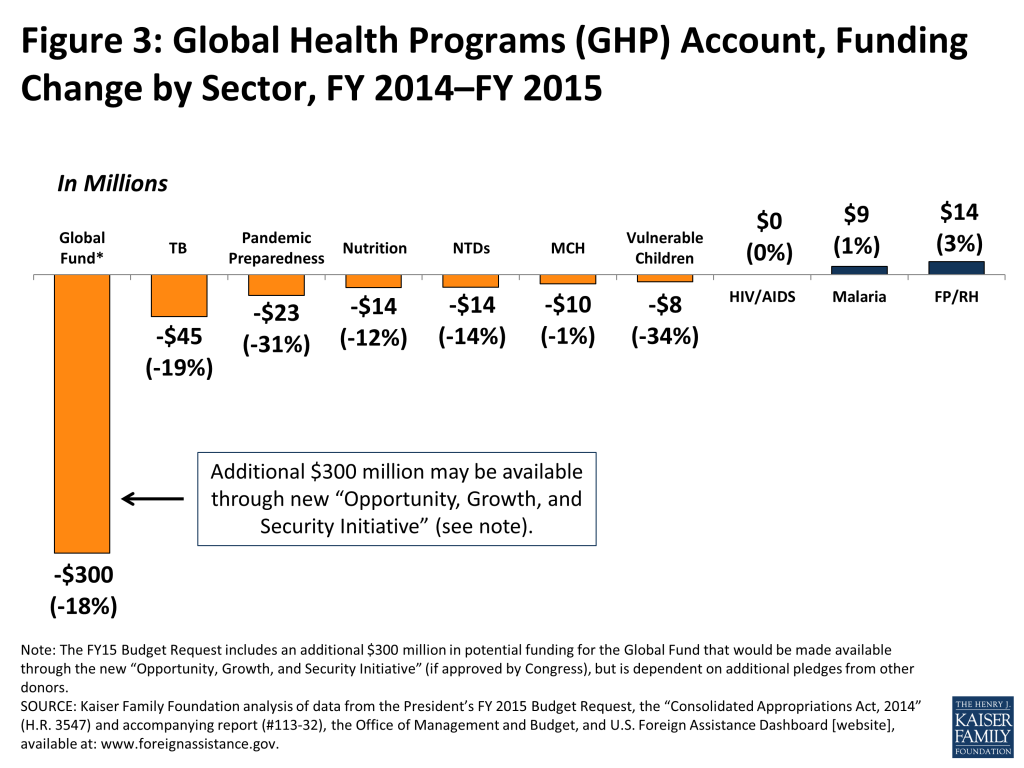
Most of the global health budget ($8.1 billion) specified in the FY15 budget request is provided through the Global Health Programs (GHP) account at USAID and the State Department (see Figure 1 & Figure 2). Within the GHP account, all programs would decline, with the exception of funding for malaria and Family Planning and Reproductive Health (FP/RH), which would both increase slightly; funding for bilateral HIV, through PEPFAR, would remain flat (see Figure 3).  The FY15 budget request includes $1.35 billion as the base U.S. contribution to the Global Fund to Fight AIDS, Tuberculosis, and Malaria (Global Fund), which is $300 million below the FY14 level and would account for a significant share of the total decline in global health funding, although this is in large part due to legislative restrictions on the U.S. contribution to the Global Fund (see Global Fund section below).3   Funding for tuberculosis (TB) efforts would represent the second largest decrease (-$45 million), followed by pandemic influenza (-$22.5 million) and nutrition (-$14 million).

The FY15 budget request includes a newly proposed “Opportunity, Growth, and Security Initiative” that would provide additional funding across many areas, including some for global health activities (e.g. for the Global Fund; see below). However, this new initiative, which proposes an additional $56 billion in discretionary funding (divided evenly between defense and non-defense), would be offset by mandatory spending reforms and higher revenues;4  it therefore, requires Congressional approval and remains uncertain.

If Congress approves the President’s FY15 Budget Request, global health funding would be impacted more than other areas when compared to broader budgetary trends, particularly when compared to final FY13 post-sequestration levels (see Table 1).  For instance, while funding for global health would remain essentially flat between FY 13 and FY 15, funding for international affairs overall would increase by 7%.5   In addition, funding for all non-defense discretionary programs, of which global health is a part, would increase by 3%.6   In both FY13 and FY14, however, Congress approved higher funding levels for global health than those proposed in the President’s budget request. Whether or not Congress continues this trend remains to be seen.

The summary below provides an overview of global health funding levels by program area as proposed in the FY15 Budget Request (unless otherwise stated, all comparisons are to enacted FY14 levels).7 

PEPFAR/Bilateral HIV:

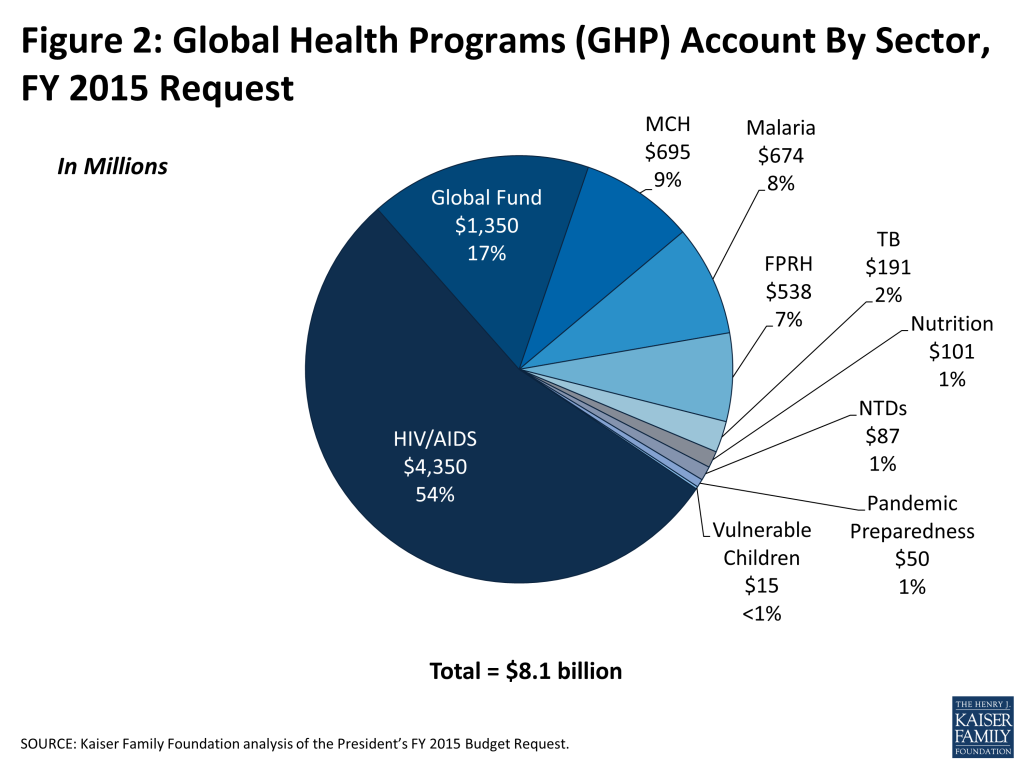
Figure 2: Global Health Programs (GHP) Account By Sector, FY 2015 Request

PEPFAR’s bilateral HIV funding through the GHP account totaled $4,350 million ($330 million at USAID and $4,020 at the State Department) matching the FY14 funding level (Table 2), but more than $600 million below its peak level of $4,959 million in FY10.  Bilateral HIV accounts for the largest share (54%) of the global health portfolio under the GHP account.  The FY15 budget request for HIV includes funding for microbicides research ($45 million), U.S. contributions to IAVI ($28.7 million), the Commodity Fund ($20.3 million), and the Joint United Nations Programme on HIV/AIDS (UNAIDS) ($45 million).

The budget request also includes $375.9 million for HIV research activities at the National Institutes of Health (NIH) and $128.7 million in HIV funding through the Centers for Disease Control and Prevention (CDC); both totals match FY14 levels. Additional funding for HIV programs at the Department of Defense (DoD) is not yet known (in prior years, it has ranged between $8 and $10 million).

Global Fund to Fight AIDS, Tuberculosis and Malaria (Global Fund):

Figure 3: Global Health Programs (GHP) Account, Funding Change by Sector, FY 2014–FY 2015

At the Global Fund’s 4th Replenishment Conference held in December 2013, President Obama announced that the U.S. would contribute $1 for every $2 pledged by other donors. The FY15 budget request proposes $1,350 million in base funding for the Global Fund towards fulfillment of this pledge.8   While base funding for the Global Fund is $300 million (-18%) below the FY14 level, the budget request includes an additional $300 million in potential funding that would be made available through the new “Opportunity, Growth, and Security Initiative” (if approved by Congress), but is dependent on additional pledges from other donors. The Global Fund accounts for the second largest share (17%) of global health funding (in the GHP account).  

Tuberculosis:

Funding for TB through the GHP account totaled $191 million, a $45 million (-19%) decrease below FY14 and would be the lowest level of funding since FY09. TB funding, which includes funding for the TB Drug Facility ($13.5 million), represented the second largest decrease (after the Global Fund) among all areas under the GHP account. Additional tuberculosis funding provided through the Economic Support Fund (ESF) account is not yet known (in prior years, it has ranged between $8 and $20 million).

Malaria:

Malaria funding totaled $674 million in the FY15 budget request and was one of only two program areas under the GHP account (the other being family planning & reproductive health) that increased above FY14 levels ($9 million or 1%). The budget request also includes $150.7 million for malaria research activities at NIH and $10.7 million in malaria funding through the CDC; both totals match FY14 levels. Additional malaria funding through DoD is not yet known (in prior years, it has ranged between $8 million and $30 million).

Family Planning & Reproductive Health (FP/RH):

FP/RH funding totaled $538 million and was one of only two program areas under the GHP account (the other being malaria) that increased ($14.1 million or 3%) from FY14 levels. The FY15 budget request also included $35.3 million for the U.S. contribution to the United Nations Population Fund (UNFPA), essentially matching the FY14 level ($35.0 million).9  Additional FP/RH funding provided through other accounts such as the Economic Support Fund (ESF) is not yet known.

Maternal & Child Health (MCH):

In the FY15 budget request, MCH funding through the GHP account totaled $695, a decrease of $10 million (-1%) below FY14 levels.  This includes $495 million in funding for bilateral programs and a $200 million contribution to GAVI.  Some additional MCH funding provided through other accounts, such as the ESF and Food for Peace (FFP) accounts, is not yet known. The FY15 budget request states that additional MCH funding would be provided through the new “Opportunity, Growth, and Security Initiative” (if approved by Congress), but does not specify an amount. Specific components of MCH funding include:

  • GAVI: The U.S. contribution to GAVI, which is included under MCH funding in the GHP account, totaled $200 million, a $25 million (14%) increase above FY14.
  • Polio: U.S. funding for polio programs is provided through USAID (as part of MCH funding via the GHP and ESF accounts) and CDC. Polio funding through the CDC totaled $161 million, a $10 million (7%) increase above FY14 levels; with the exception of new funding ($45 million) for the recently launched “Global Health Security Initiative” (see below) polio is the only area in the CDC global health budget that increased in the FY15 budget request. Polio funding through the GHP and ESF accounts at USAID is not yet known.
  • United Nations Children’s Fund (UNICEF): The U.S. contribution to UNICEF totaled $116.6 million in the FY15 budget request, a $15.4 million (-12%) decrease below FY14.10 

Nutrition:

Nutrition funding in the request through the GHP account totaled $101 million, a $14 million (-12%) decrease below FY14. Additional nutrition funding provided through other accounts, such as the ESF and FFP accounts, is not yet known.

Vulnerable Children:

Funding for vulnerable children, which is provided via the Displaced Children and Orphans Fund (DCOF), totaled $14.5 million in the GHP account, a $7.5 million (-34%) decrease below FY14. The decrease in funding for vulnerable children was the largest percentage decrease among all areas under the GHP account.

Pandemic Preparedness:

Pandemic Preparedness funding through the GHP account totaled $50 million, a decrease of $22.5 million (-31%) below FY14. The decrease in pandemic preparedness funding was the second largest percentage decrease among all areas under the GHP account. Additional funding provided through other accounts, such as the ESF account, is not yet known.

Global Public Health Protection:

The FY15 budget request for CDC includes $100.3 million in funding for Global Public Health Protection, of which $45.5 million is for Global Disease Detection and Emergency Response, $9.8 million is for Global Public Health Capacity Development, and $45 million is new funding to support the Global Health Security Initiative, a new effort launched in February 2014 aimed at improving global capabilities to prevent, detect, and respond to epidemics and other emerging public health threats.

Other Global Health Funding:

The U.S. provides additional global health funding in support of water, sanitation and hygiene (WASH) activities, for international global health research efforts conducted through the Fogarty International Center (FIC) at NIH, and for multilateral organizations, such as  the World Health Organization (WHO) and the Pan American Health Organization (PAHO), that play an important role in addressing global issues. The FY15 budget request proposes $67.8 for international global health research activities at FIC ($0.2 million or 0.3% above FY14), a $114 million contribution to WHO ($4.2 million or 4% above FY14), and a $66.5 million contribution to PAHO ($0.4 million or 0.6% above FY14); U.S. funding for WASH activities is not yet known.

Other Non-Global Health Funding:

The FY15 budget request also proposed funding for areas and agencies that are not directly focused on U.S. global health, but are related and may impact these efforts including: the Millennium Challenge Corporation (MCC), Feed the Future (FtF), which is the U.S. Government’s Global Hunger and Food Security Initiative, broader food assistance through Food for Peace (FFP) and McGovern-Dole International Food for Education and Child Nutrition (McGovern-Dole), and other funding through the State & Foreign Operations Development Assistance (DA) and ESF accounts. Within the budget request, funding for the MCC  ($1,000 million) increased by more than $100 million (11%) above FY14 enacted levels, while funding for McGovern-Dole remained flat and funding for FtF and FFP declined – FtF declined by approximately $100 million (-9%) and FFP declined by $66 million (-4.5%) (see Table 3). The FY15 budget request proposes additional funding through the new “Opportunity, Growth, and Security Initiative” (if approved by Congress) for the MCC ($350 million) and Feed the Future (additional amount not specified).

Table 1: Comparison of Global Health Funding to International Affairs and Non-Defense Discretionary Funding, FY 2013 – FY 2015
FY13*(millions)FY14(millions)FY15(millions)Difference
FY15 to FY14FY15 to FY13
$(millions)%$(millions)%
Global Health$9,359$9,794$9,441-$352-4%$821%
of which International Affairs$8,395$8,782$8,382-$400-5%-$130%
International Affairs Total**$51,906$50,725$50,011-$714-1%-$1,895-4%
Base (Enduring)***$41,084$44,205$44,098-$1060%$3,0157%
Discretionary Budget(Non-Defense)****$479,000$512,000$492,000-$20,000-4%$13,0003%

*FY13 includes the effects of sequestration.**International Affairs is Function 150 Account only and includes both Base (Enduring) and Overseas Contingency Operations (OCO) funding. OCO has historically included some funding for global health programs, but this amount is not yet known for the FY15 Budget Request.***The majority of U.S. global health funding is provided as part of Base (Enduring) funding.****Discretionary Budget funding amounts are rounded totals.

Back to top

Table 2: U.S. Funding for Global Health Programs, FY 2013 – FY 2015
Department / Agency / AreaFY13 Final (millions)*FY14 Omnibus (millions)FY15 Request (millions)Difference
FY15 – FY14 (millions)FY15 – FY13 (millions)
USAID – Global Health Programs (GHP)
HIV/AIDS$332.9$330.0$330.0$0 (0%)$-2.9 (-0.9%)
Tuberculosis$224.5$236.0$191.0$-45 (-19.1%)$-33.5 (-14.9%)
Malaria$656.4$665.0$674.0$9 (1.4%)$17.6 (2.7%)
Neglected Tropical Diseases (NTDS)$85.6$100.0$86.5$-13.5 (-13.5%)$0.9 (1%)
Pandemic Influenza$55.2$72.5$50.0$-22.5 (-31%)$-5.2 (-9.4%)
Maternal & Child Health (MCH)$627.3$705.0$695.0$-10 (-1.4%)$67.7 (10.8%)
of which GAVI$138.0$175.0$200.0$25 (14.3%)$62 (44.9%)
of which Polio$39.4$51.0Not Yet Known
Nutrition$95.1$115.0$101.0$-14 (-12.2%)$5.9 (6.2%)
Vulnerable Children$16.6$22.0$14.5$-7.5 (-34.1%)$-2.1 (-12.9%)
Family Planning & Reproductive Health (FP/RH)$532.4$524.0$538.0$14.1 (2.7%)$5.6 (1.1%)
Total USAID:$2,626.1$2,769.5$2,680.0$-89.4 (-3.2%)$53.9 (2.1%)
State Department – Global Health Programs (GHP)
HIV/AIDS Bilateral$3,870.8$4,020.0$4,020.0$0 (0%)$149.2 (3.9%)
of which UNAIDS$42.8$45.0$45.0$0 (0%)$2.2 (5.2%)
Global Fund**$1,569.0$1,650.0$1,350.0$-300 (-18.2%)$-219 (-14%)
Total State:$5,439.8$5,670.0$5,370.0$-300 (-5.3%)$-69.8 (-1.3%)
Total GHP – State & USAID
Total USAID & State GHP:$8,065.9$8,439.5$8,050.0$-389.5 (-4.6%)$-15.9 (-0.2%)
State & Foreign Operations – International Organizations & Programs (IO&P)
United Nations Children’s Fund (UNICEF)$125.2$132.0$116.6$-15.4 (-11.7%)$-8.6 (-6.8%)
United Nations Population Fund (UNFPA)$28.5$35.0$35.3$0.3 (0.9%)$6.8 (23.9%)
State & Foreign Operations – Contributions to International Organizations (CIO)
World Health Organization (WHO)$109.9$109.9$114.1$4.2 (3.8%)$4.2 (3.8%)
Pan American Health Organization (PAHO)$65.7$66.1$66.5$0.4 (0.6%)$0.8 (1.2%)
National Institutes of Health (NIH)
HIV/AIDS Research$389.2$375.8$375.9$0 (0%)$-13.3 (-3.4%)
Malaria Research$146.8$151.0$150.7$-0.3 (-0.2%)$4 (2.7%)
Fogarty International Center (FIC)$65.5$67.6$67.8$0.2 (0.3%)$2.2 (3.4%)
Total NIH:$601.5$594.4$594.4$0 (0%)$-7.1 (-1.2%)
Centers for Disease Control and Prevention (CDC)***
Global HIV/AIDS$125.3$128.7$128.7$0 (0%)$3.5 (2.8%)
Global Immunization$159.5$200.9$210.9$10 (5%)$51.4 (32.2%)
Polio Eradication$110.3$150.9$160.9$10 (6.6%)$50.6 (45.8%)
Other Global/Measles$49.1$50.0$50.0$0 (0%)$0.8 (1.7%)
Parasitic Disease and Malaria$23.7$24.4$24.4$0 (0%)$0.7 (2.9%)
Malaria$9.9$10.7$10.7$0 (0%)$0.7 (2.9%)
Global Public Health Protection$54.3$62.8$100.3$37.5 (59.8%)$45.9 (84.5%)
Global Health Security Initiative$45.0$45.0 (NA)$45.0 (NA)
Global Disease Detection & Emergency Response$44.8$45.5$45.5$0 (0%)$0.6 (1.4%)
Global Public Health Capacity Development$9.5$17.3$9.8$-7.5 (-43.4%)$0.3 (2.9%)
Total CDC:$362.8$416.8$464.3$47.5 (11.4%)$101.5 (28%)
Total Global Health Funding
Total Global Health Funding$9,359$9,794$9,441$-352.4 (-3.6%)$81.8 (0.9%)
*FY 2013 Final includes the effects of sequestration.**The FY15 Budget Request includes an additional $300 million in potential funding for the Global Fund that would be made available through the new “Opportunity, Growth, and Security Initiative” (if approved by Congress), but is dependent on additional pledges from other donors.***The FY15 Budget Request for the CDC includes a realignment of funds that has been applied to the FY13 Final and FY14 Omnibus levels.

Back to top

Table 3: Other Related Non-Global Health Funding, FY 2013 – FY 2015
Department / Agency / AreaFY13 Final (millions)*FY14 Omnibus (millions)FY15 Request (millions)Difference
FY15 – FY14 (millions)FY15 – FY13 (millions)
Development Assistance (DA) account (SFOPs)$2,717.7$2,507.0$2,620.0$113 (4.5%)$-97.7 (-3.6%)
Economic Support Fund (ESF) account$5,867.5$4,589.2$5,077.1$487.9 (10.6%)$-790.4 (-13.5%)
of which Overseas Contingency Operations$3,293.9$1,656.2$1,678.4$22.2 (1.3%)$-1,615.5 (-49%) 
Feed the Future (FtF) Initiative$957.1$1,100.0$1,000.6$-99.4 (-9%)$43.5 (4.5%)
Global Agriculture and Food Security Program (GAFSP)**$128.2$133.0
McGovern-Dole International Food for Education and Child Nutrition Program$174.1$185.1$185.1$0 (0%)$11.1 (6.4%)
Food for Peace (FFP-Title II)$1,359.4$1,466.0$1,400.0$-66 (-4.5%)$40.6 (3%)
Millennium Challenge Corporation (MCC)***$852.7$898.2$1,000.0$101.8 (11.3%)$147.3 (17.3%)

*FY 2013 Final includes the effects of sequestration.**If approved by Congress, the new “Opportunity, Growth, and Security Intiative” included in the FY15 Budget Request would provide $80 million in funding for GAFSP.***If approved by Congress, the new “Opportunity, Growth, and Security Initiative” included in the FY 2015 Budget Request would provide an additional $350 million for MCC, “which will support at least one additional compact in 2015 or enhancements to multiple compacts with a focus on enduring partner country policy reforms and sustainable development based on robust and transparent evidence and evaluation.”

Back to top

  1. This total represents funding amounts specified in the Department of State, Foreign Operations, and Related Programs FY 2015 Congressional Budget Justification, the National Institutes of Health FY 2015 Congressional Justification, and the Centers for Disease Control and Prevention FY 2015 Congressional Justification. Additional funding for some global health programs at USAID and DoD are not yet available. ↩︎
  2. Total known FY15 funding is $82 million (<1%) above FY13 post-sequestration levels. Of the $82 million increase, $45 million would support the recently launched Global Health Security Initiative at the CDC. ↩︎
  3. By law, U.S. contributions to the Global Fund may not exceed 33% of total contributions from all donors. During a hearing on the budget request held on March 12, 2014 before the State, Foreign Operations, and Related Programs Subcommittee of the House Committee on Appropriations, Secretary of State Kerry stated that the U.S. was acting to fulfill its pledge based on the existing commitments of other donors. ↩︎
  4. See “Budget of the United States Government, Fiscal Year 2015,” White House Office of Management and Budget (OMB), March 4, 2014. ↩︎
  5. The International Affairs total represents funding through the Function 150 account only and does not include funding for Overseas Contingency Operations (OCO) (see “FY 2015 Congressional Budget Justification – Department of State, Foreign Operations, and Related Programs”). ↩︎
  6. Discretionary funding levels are adjusted (and rounded) baseline totals (see summary tables in “Budget of the United States Government, Fiscal Year 2015,” released by the White House Office of Management and Budget (OMB) on March 4, 2014). ↩︎
  7. Unless otherwise specified, all totals refer to funding amounts under the GHP account. All comparisons are to FY14 levels. ↩︎
  8. By law, U.S. contributions to the Global Fund may not exceed 33% of total contributions from all donors. During a hearing on the budget request held on March 12, 2014 before the State, Foreign Operations, and Related Programs Subcommittee of the House Committee on Appropriations, Secretary of State Kerry stated that the U.S. was acting to fulfill its pledge based on the existing commitments of other donors. ↩︎
  9. U.S. funding for UNFPA and UNICEF is provided through the International Organizations and Programs (IO&P) account. ↩︎
  10. U.S. funding for UNFPA and UNICEF is provided through the International Organizations and Programs (IO&P) account. ↩︎
News Release

Paying a Visit to the Doctor: Current Financial Protections for Medicare Patients When Receiving Physician Services

Published: Apr 7, 2014

As the Congress continues to work on reforming Medicare payments for physician services, a new Kaiser Family Foundation brief examines key provisions in current law that help provide safeguards and financial protections for beneficiaries when they visit their doctor, and explains how potential changes could affect beneficiaries, providers, and the Medicare program. These provisions include:

  • The participating provider program encourages physicians and other practitioners to charge no more than Medicare fees for services provided to their Medicare patients, helping to limit the amount beneficiaries are required to pay for a visit to their doctor.  Today, 96% of physicians and practitioners who are registered with Medicare are “participating providers.”
  •  Limitations on balance billing cap the amount “non-participating providers” can bill their patients above and beyond Medicare’s standard fees for each service, again limiting beneficiaries’ exposure to high cost sharing for physician services.  Such balance billing has shrunk substantially over the past few decades, decreasing the total cost to beneficiaries from $2.5 billion in 1983 to $40 million in 2011.
  • Conditions on private contracting provide safeguards when physicians “opt out” of Medicare and privately contract with Medicare patients. The provisions are designed to make patients more aware of their financial obligations under these arrangements, and to protect beneficiaries and Medicare from fraud and abuse. Less than 1 percent of practicing physicians have “opted-out” of Medicare and see Medicare patients only through private contracts.

Read Paying a Visit to the Doctor: Financial Protections for Medicare Patients online.

The Kaiser Family Foundation, a leader in health policy analysis, health journalism and communication, is dedicated to filling the need for trusted, independent information on the major health issues facing our nation and its people. The Foundation is a non-profit private operating foundation, based in Menlo Park, California.

State Fiscal Conditions and Medicaid: 2014 Update

Authors: Laura Snyder and Robin Rudowitz
Published: Apr 4, 2014

Executive Summary

Executive Summary

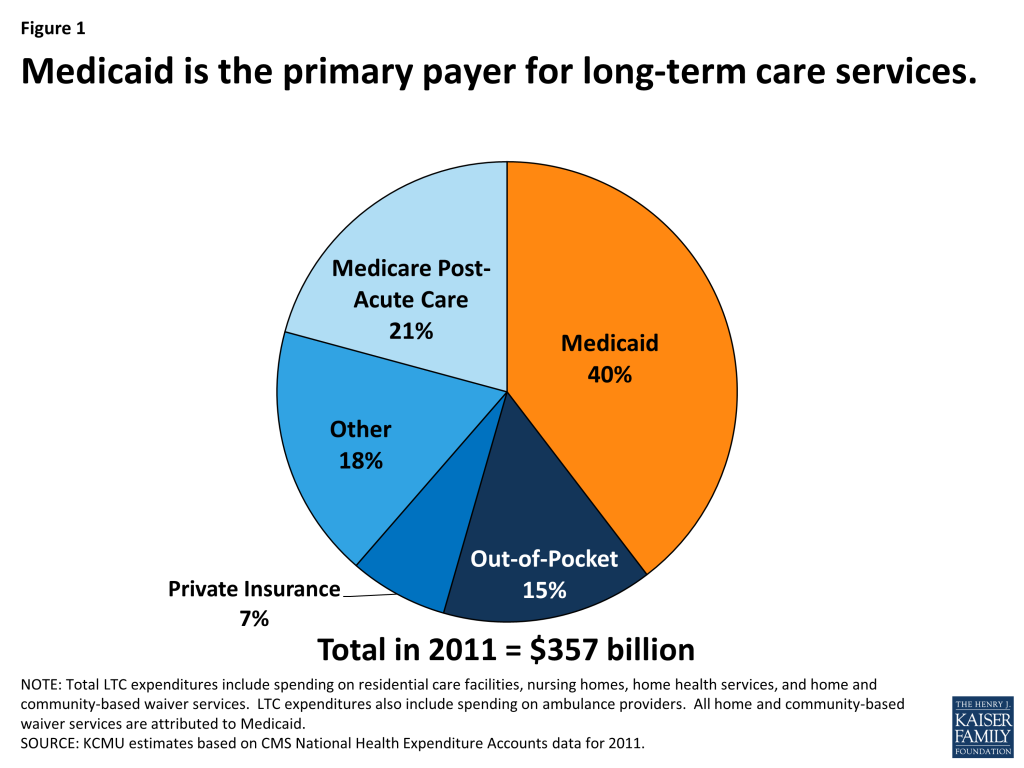
Medicaid plays an important role in supporting states’ ability to finance health coverage for their low-income populations; Medicaid has helped finance coverage of over 66 million low-income Americans across the country, including over 9.5 million low-income Medicare beneficiaries.1  The program is the primary payer for long-term care services and a major source of revenue for safety-net providers. This issue brief provides an overview of Medicaid financing, Medicaid’s role in state budgets, the relationship between Medicaid and the economy and how the ACA and the Medicaid expansion could affect state budgets. Key findings include:

  • State lawmakers must balance competing spending and revenue priorities. Medicaid’s role in state budgets is unique; it is jointly financed by states and the federal government. States receive at least $1 of federal funds for every $1 of state funds spent on the program. This financing structure means that Medicaid acts as both an expenditure and the largest source of federal revenue in state budgets.
  • Economic conditions have a substantial effect on Medicaid spending and enrollment. During economic downturns demand for Medicaid rises which increases program spending at the same time, state tax revenues fall.  In response, Congress has twice passed temporary increases to the FMAP rates to help support states during economic downturns, most recently in 2009. These increased federal funds resulted in declines in state Medicaid spending for the first time in the program’s history.
  • More recently, states are beginning to see slow, but sustained economic improvements following the worst recession since the Great Depression. States have now seen 16 consecutive quarters of tax revenue growth while unemployment continues to slowly decline. As economic conditions continue to improve, pressure on Medicaid enrollment and state budgets has lessened, allowing for some restorations. States have also engaged in more fundamental transformations to Medicaid payment and delivery systems to control costs and improve care delivery particularly for high-cost populations.

The ACA played a significant role in state budget decisions about Medicaid for FY 2014. Required changes to streamline and coordinate enrollment as well as broader ACA outreach were expected to result in increased enrollment (and thus increased spending) in all states. States also weighed decisions on the Medicaid expansion. For those that expand Medicaid, the federal government will pay 100 percent of the costs of those newly eligible from 2014-2016; it then phases down to and stays at 90 percent by 2020 (well above regular match rates.) In addition to substantial new federal revenues and increases in coverage, state budget savings within and outside of Medicaid as well as broader economic effects have also been projected in a number of studies. States that do not adopt the expansion will forgo substantial federal revenues and poor adult residents may fall into a “coverage gap”.

Issue Brief

Overview of Medicaid Financing Before the ACA

Medicaid Financing Structure

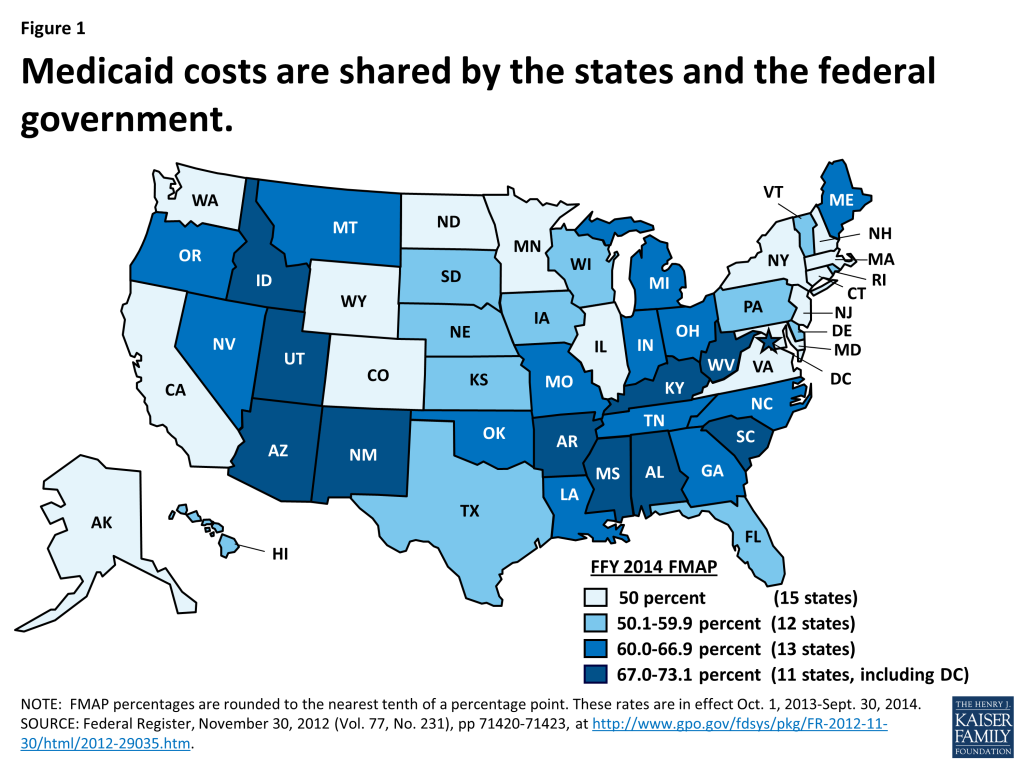
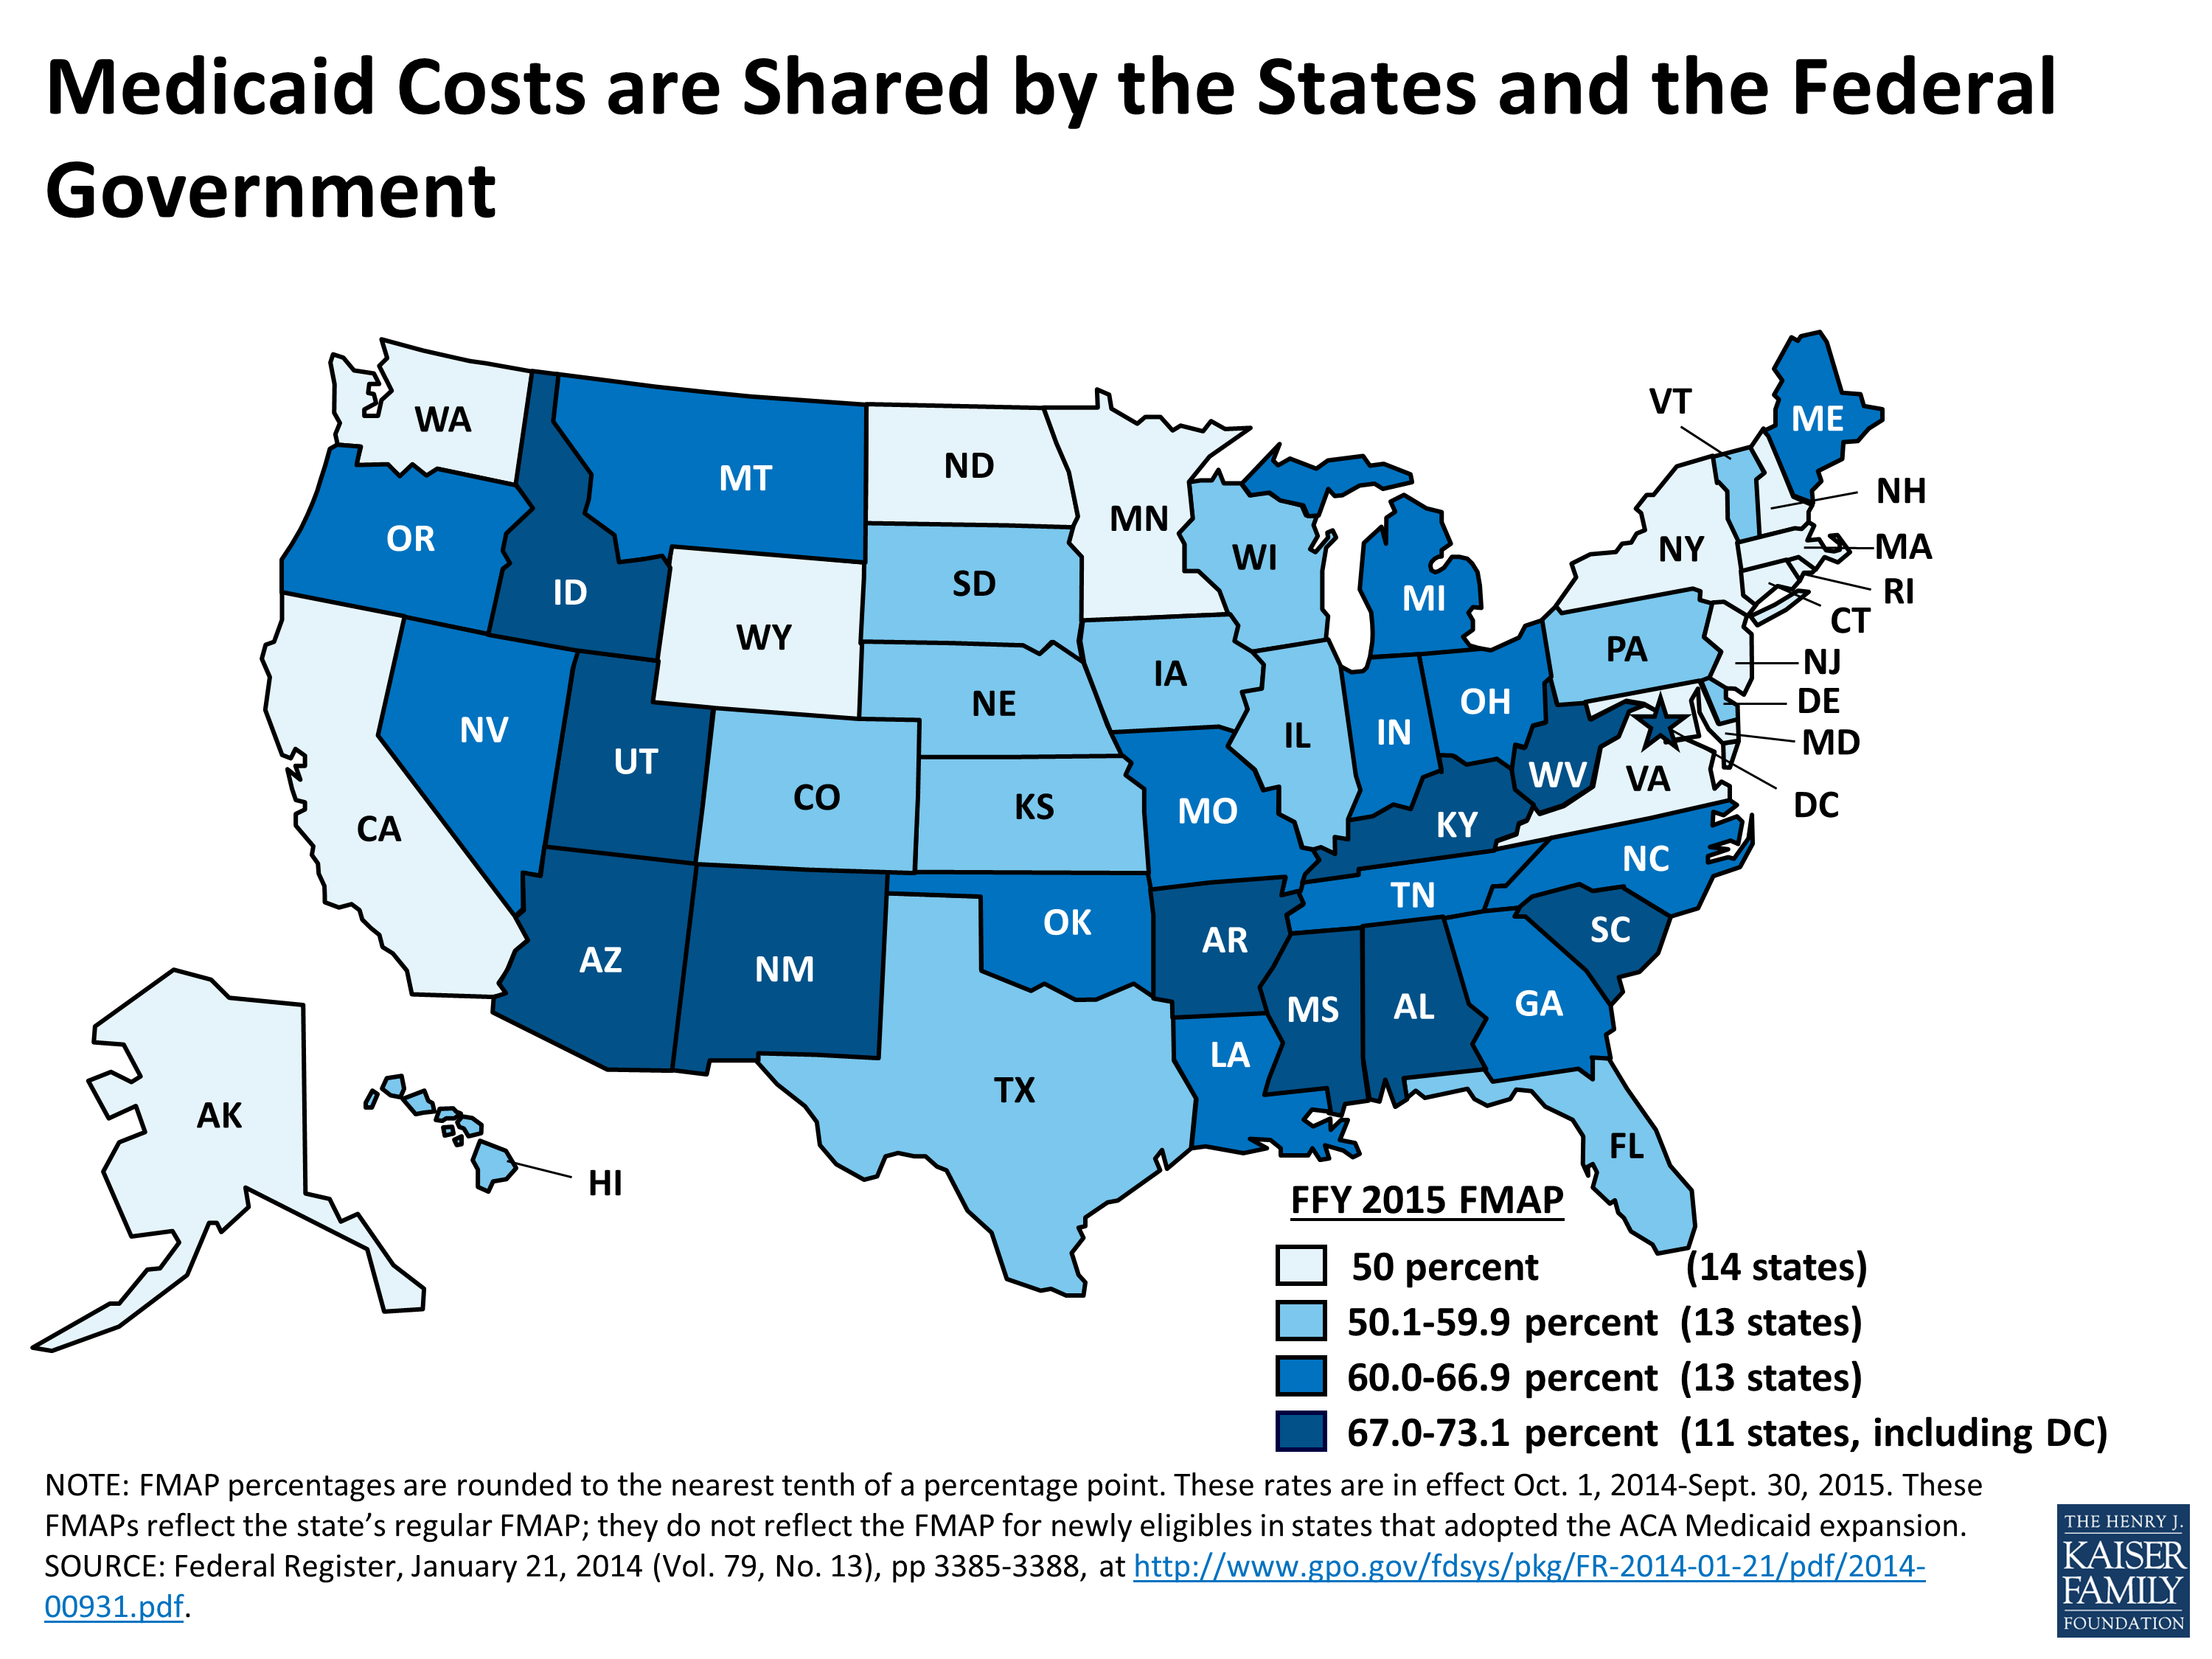
The Medicaid program is jointly funded by states and the federal government. In federal fiscal year (FFY) 2012, Medicaid expenditures (both state and federal spending) totaled over $415 billion. The federal government guarantees matching funds (FMAP) to states for qualifying Medicaid expenditures (payments states make for covered Medicaid services provided by qualified providers to eligible Medicaid enrollees.) The FMAP is calculated annually using a formula set forth in the Social Security Act which is based on a state’s average personal income relative to the national average. States with lower average personal incomes have higher FMAPs. Personal income data are lagged, so data used for FFY 2014 FMAPs are from the three years of 2009 to 2011. According to the statutory formula, for FFY 2014, the FMAP varies across states from a floor of 50 percent to a high of 73.05 percent. (Figure 1)  This means that every $1 of state spending on the program is matched with at least $1 of federal funds, ranging up to $2.71 for every state dollar spent on Medicaid.2 

Figure 1

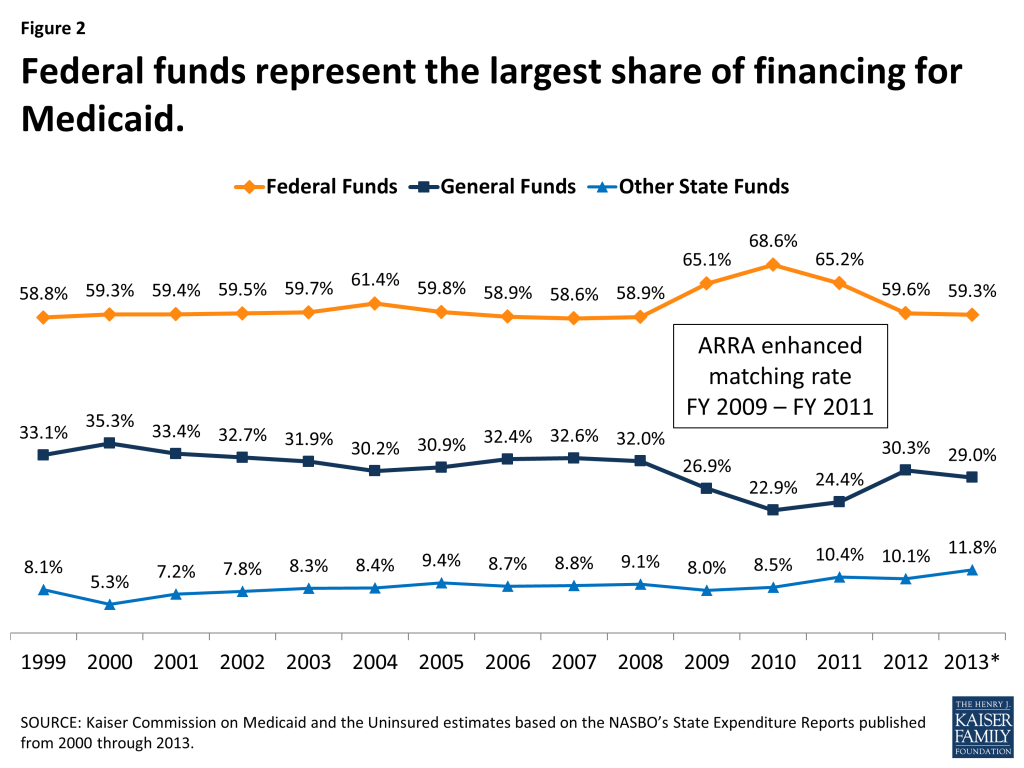
The remaining share of Medicaid funding comes from state sources, primarily appropriations from state general funds.  States also fund Medicaid with “other state funds” which may include funding from local governments or revenue collected from provider taxes and fees. Because of the statutory requirement that the federal share never falls below 50 percent, federal funds have always represented the largest share of Medicaid financing covering about 6 out of 10 dollars spent on Medicaid. (Figure 2) The only recent exception was at the height of the economic downturn, when the federal government assumed a larger share of Medicaid financing to support states as their own revenues declined.

Figure 2

Over the past decade, states’ use of other funds has increased slightly but steadily. (Figure 2) This is likely tied to states’ increased reliance on provider taxes to finance the state share of Medicaid with all but one state having at least one provider tax that helps to finance their share of Medicaid spending.3 

Medicaid’s Role in State Budgets

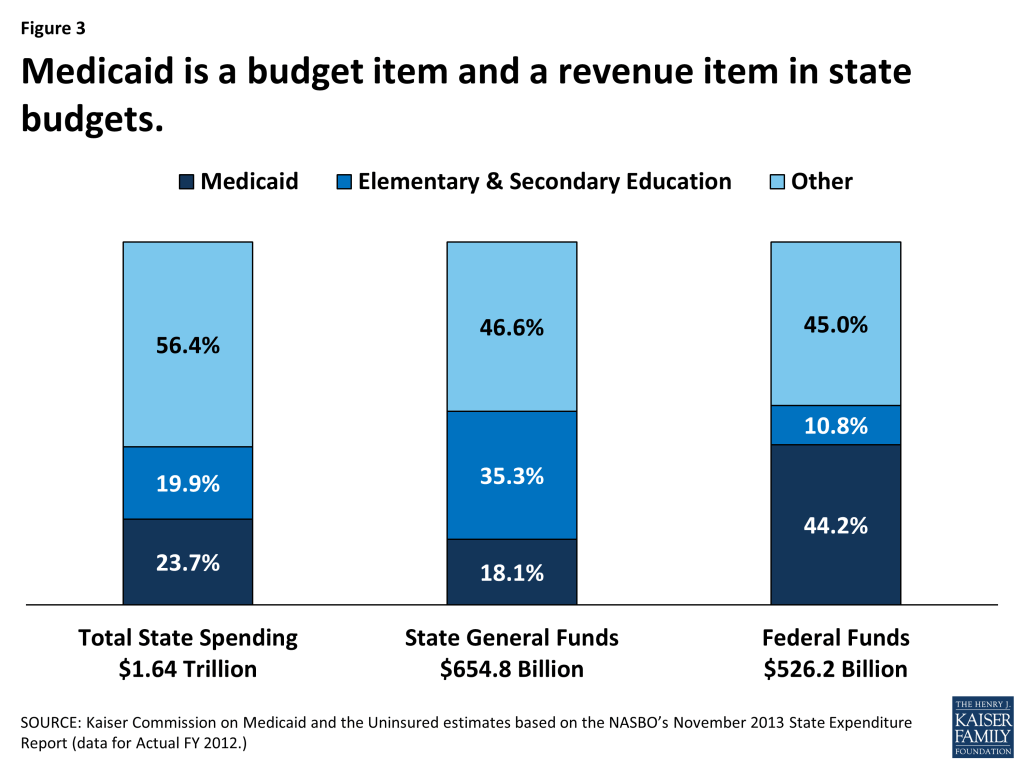
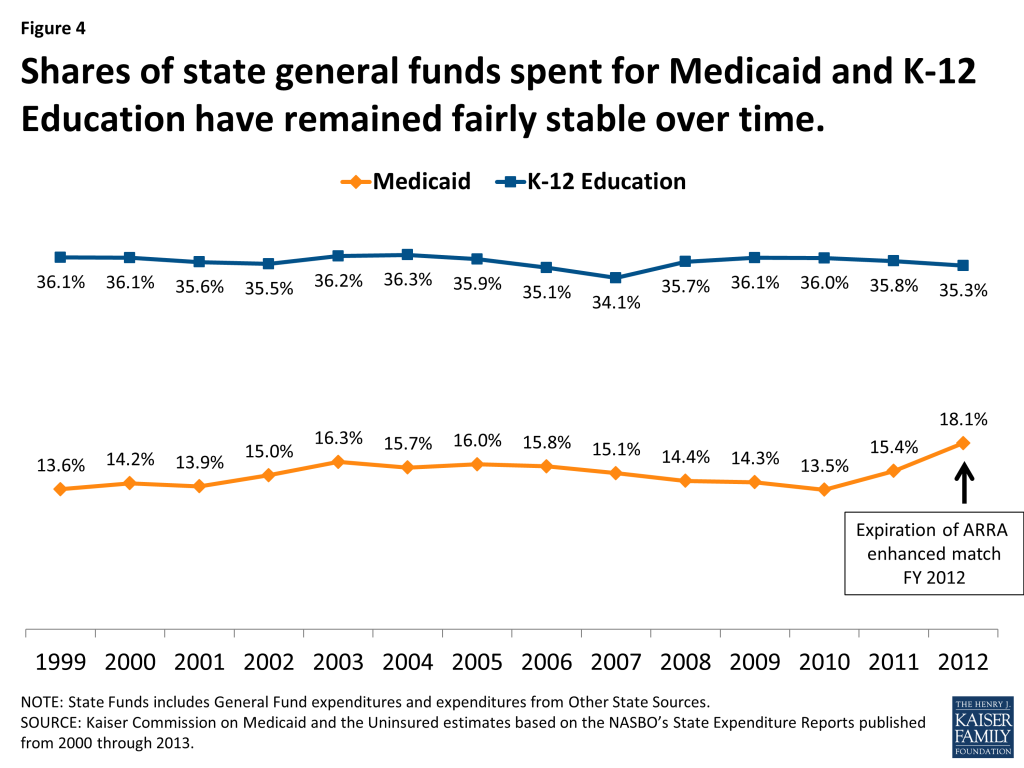
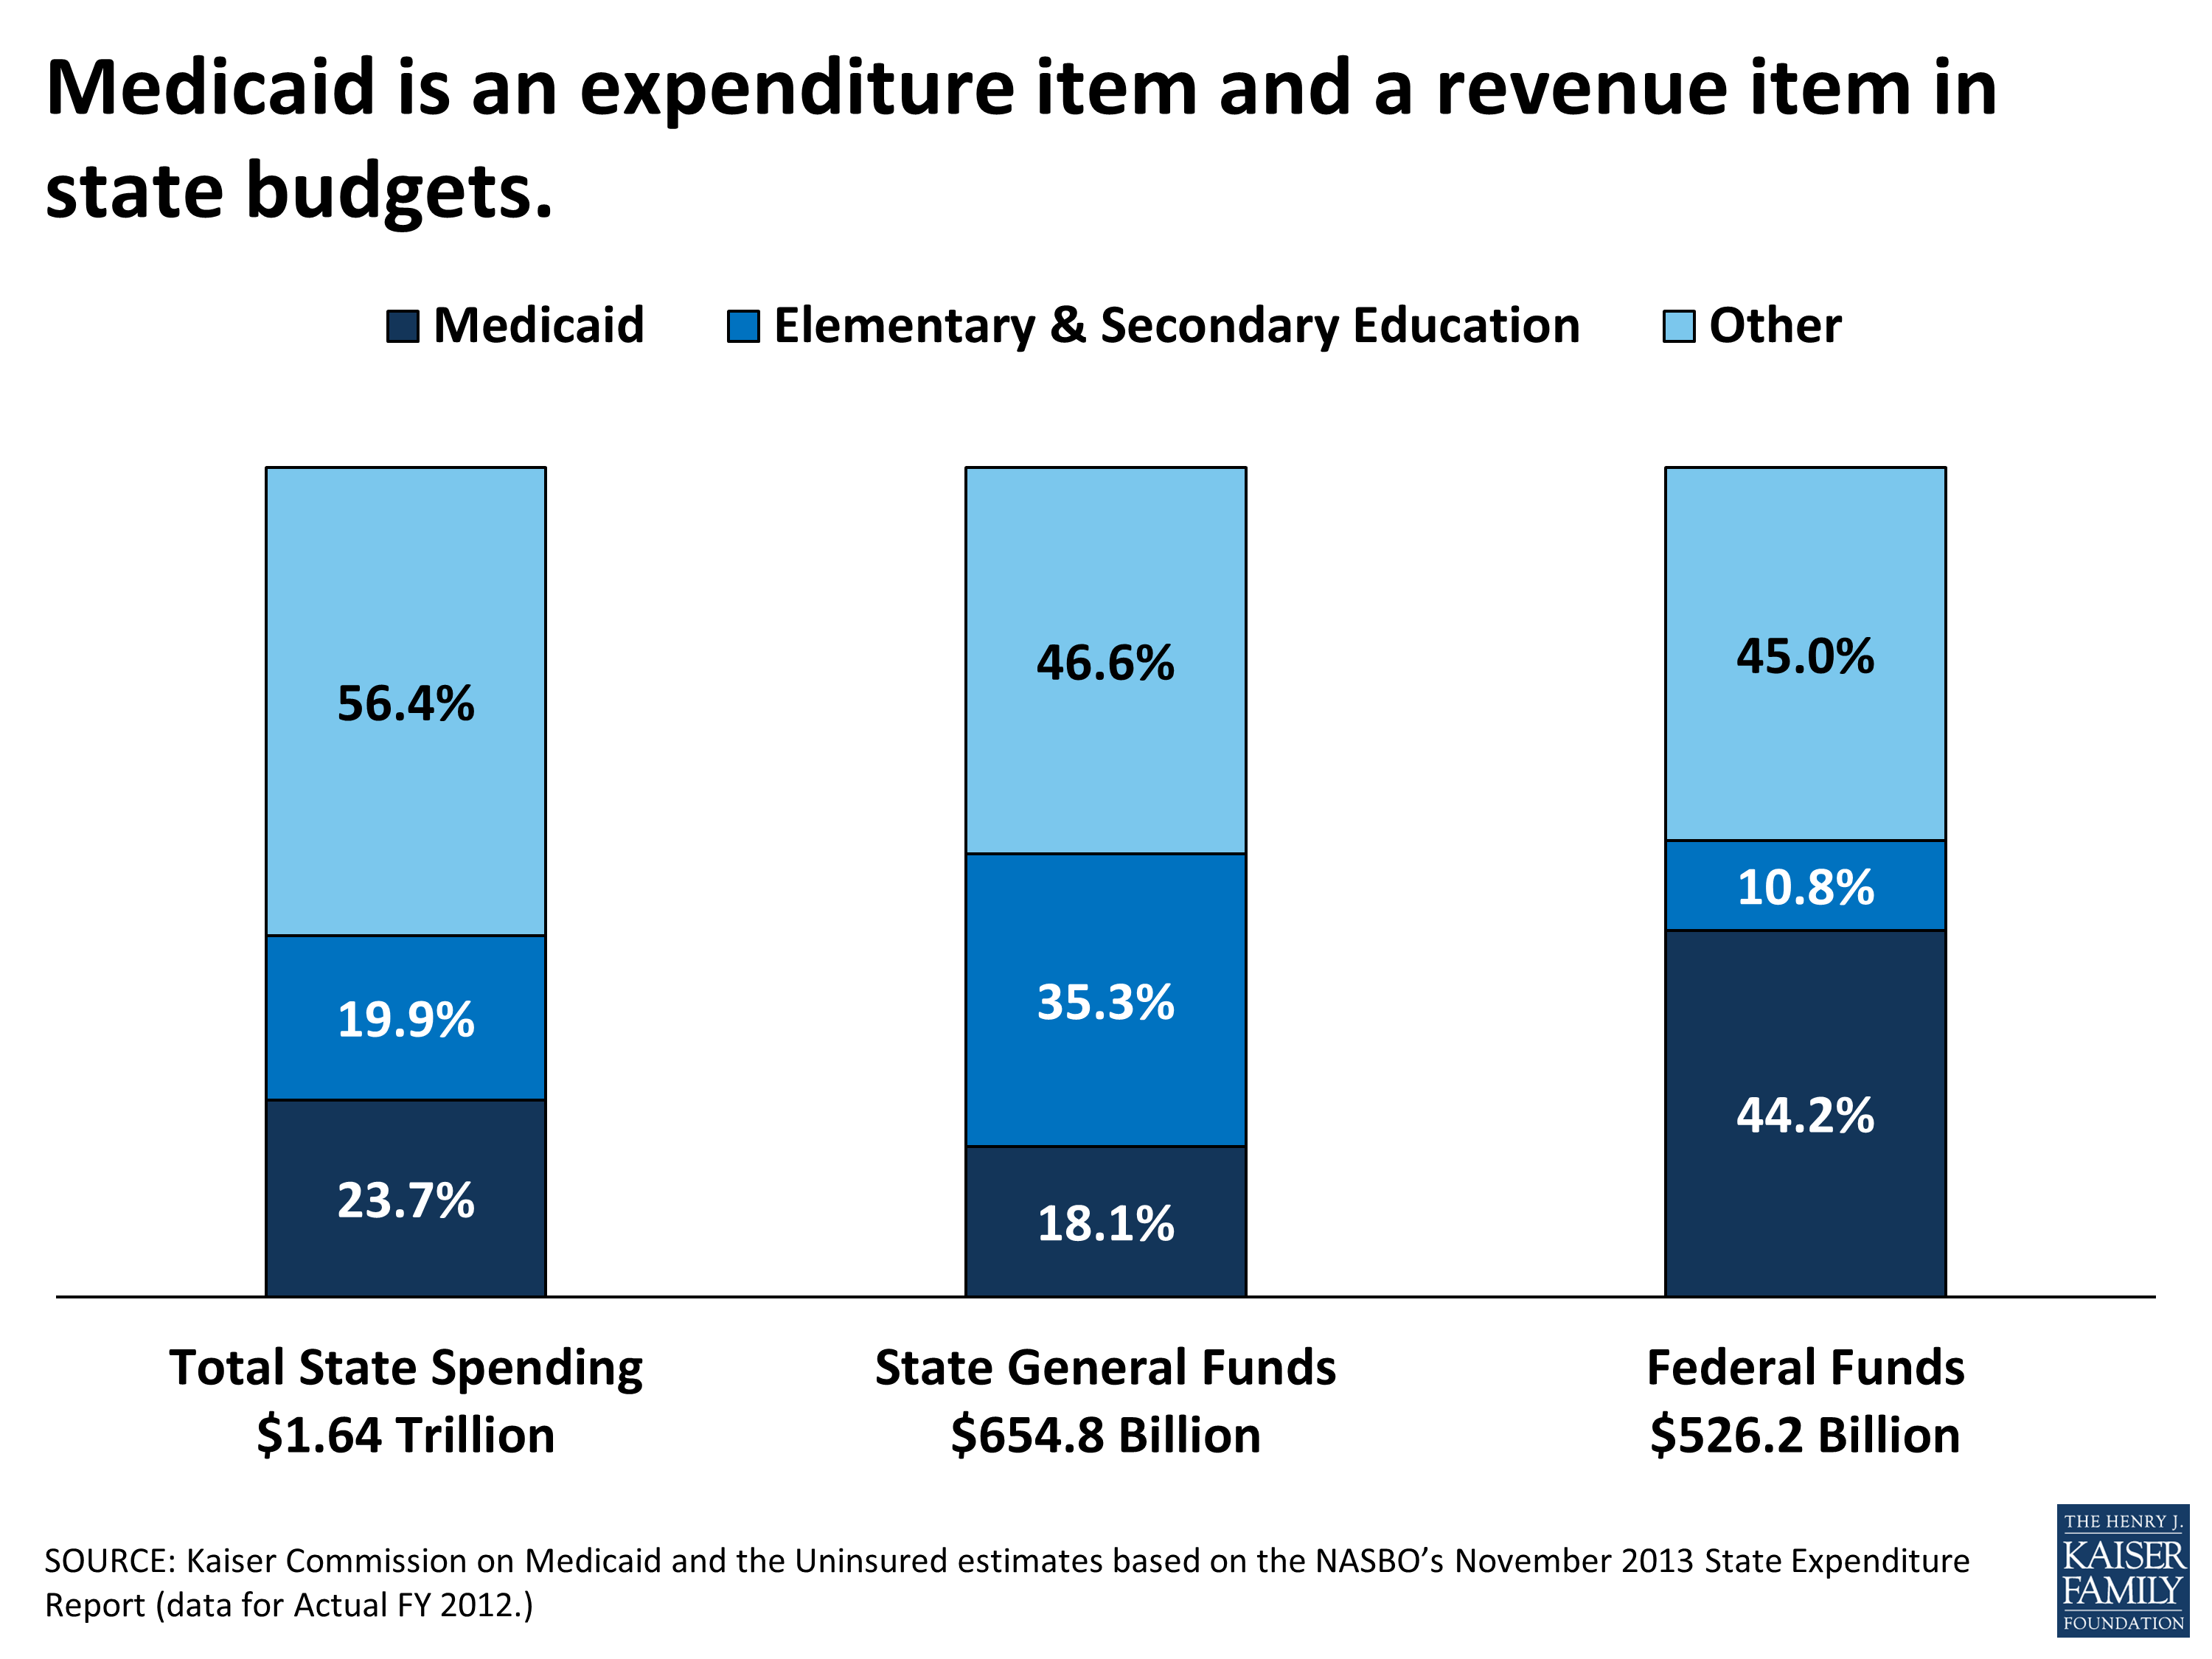
Unlike the Federal government, states generally have balanced budget requirements, taking into account the amount of revenue coming in from a state’s own resources as well as federal revenues. State lawmakers must balance competing priorities across budget expenditure categories. They also face decisions about the amount of revenue to collect from their own resources, which affect the amount of funding available to finance these priorities. Even in years of economic growth, state lawmakers face this pressure of balancing priorities. When looking at the different expenditure categories, Medicaid’s role in state budgets is unique. Medicaid acts both an expenditure item and a source of federal revenue in state budgets. When looking at total spending for FY 2012, Medicaid exceeded total spending on K-12 education and is projected to do so in FY 2013.4   Total spending includes state expenditures of federal funds as well as expenditures of states’ own resources.  Due to the financing structure and federal matching dollars tied to Medicaid spending, the Medicaid program is the largest source of federal funds for states, accounting 44.2 percent of all federal funds for states in FY 2012.States spend a smaller share of their general fund resources on Medicaid. In FY 2012, Medicaid accounted for 18.1 percent of all state general fund spending a far second to spending on K-12 education, which accounted for 35.3 percent of all state general fund spending. These shares of state general fund spending have remained fairly constant over the past decade with a slight uptick in the share of general fund spending on Medicaid in recent years in part due to the expiration of the enhanced match enacted under ARRA.  (Figures 3 and 4)

Figure 3
Figure 4

Medicaid and the Economy

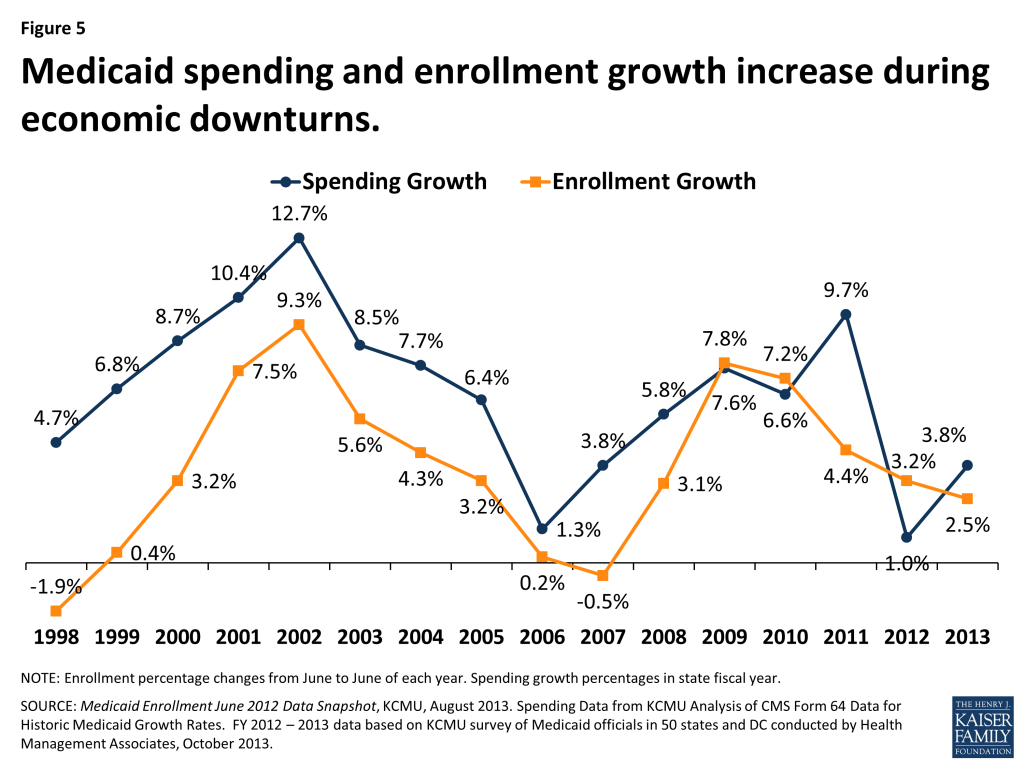
Economic conditions, in addition to policy changes, have a substantial effect on Medicaid spending and enrollment. Medicaid is a counter-cyclical program. During economic downturns individuals lose jobs, incomes decline, and more people qualify and enroll in Medicaid which increases program spending. Figure 5 shows these increases during the economic downturn in 2001-2003 and again in 2009-2011. At the same time, economic downturns negatively impact state tax revenues. This places additional pressure on state budgets as demand for other forms of assistance (i.e. food stamps and unemployment benefits) also increases. During economic downturns, states face difficulty balancing these pressures and affording their share of Medicaid spending increases.

Figure 5

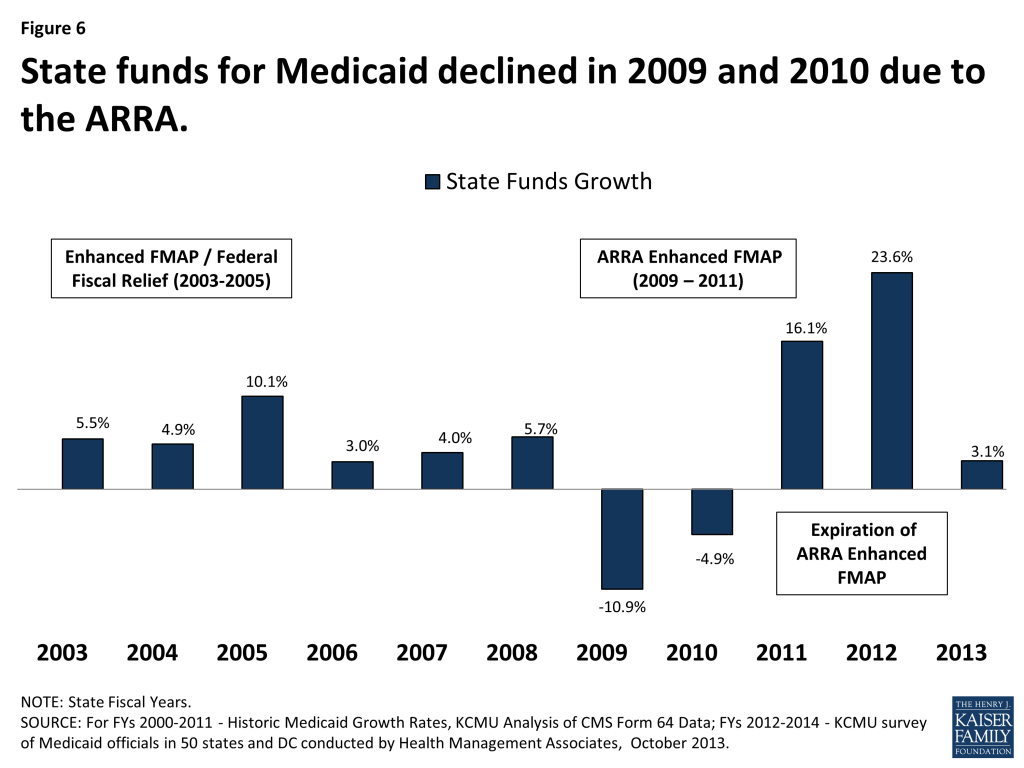
In response, Congress has twice passed temporary increases to the FMAP rates to help support states during economic downturns, most recently in 2009 as part of the American Recovery and Reinvestment Act (ARRA.)  The most significant source of fiscal relief to states in the ARRA was a temporary increase in the federal share of Medicaid costs. To be eligible for the ARRA funds, states could not restrict eligibility or tighten enrollment procedures in Medicaid or CHIP.  The ARRA-enhanced matching rates provided states with over $100 billion in total funds over 11 quarters, ending in June 2011. The increased federal funds resulted in declines in state Medicaid spending for the first time in the program’s history.  (Figure 6) State spending on the program increased substantially in FY 2012 due to the expiration of the enhanced-matching rate.

Figure 6

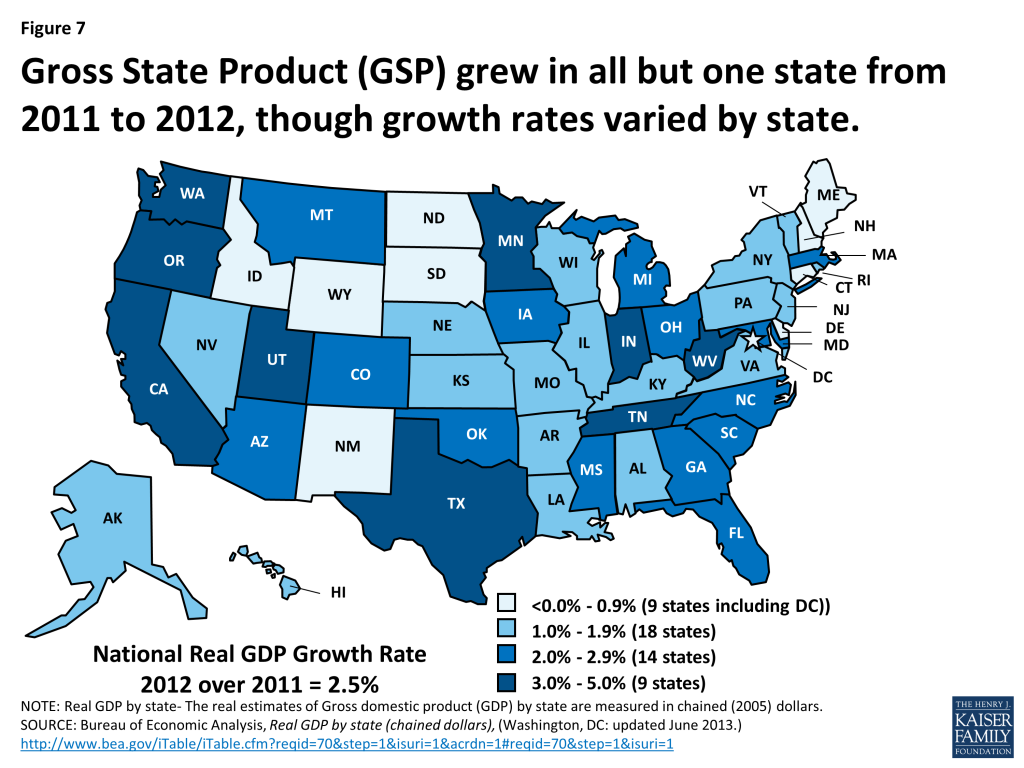
States are beginning to see slow, but sustained improvements in the economy following the worst recession since the Great Depression. Gross State Product (GSP,) a measure of a state’s economic activity, has shown annual growth for the past three years nationally. All but one state (Connecticut) showed positive GSP growth from 2011 to 2012, ranging from 0.2% up to 4.8%. (Figure 7)

Figure 7

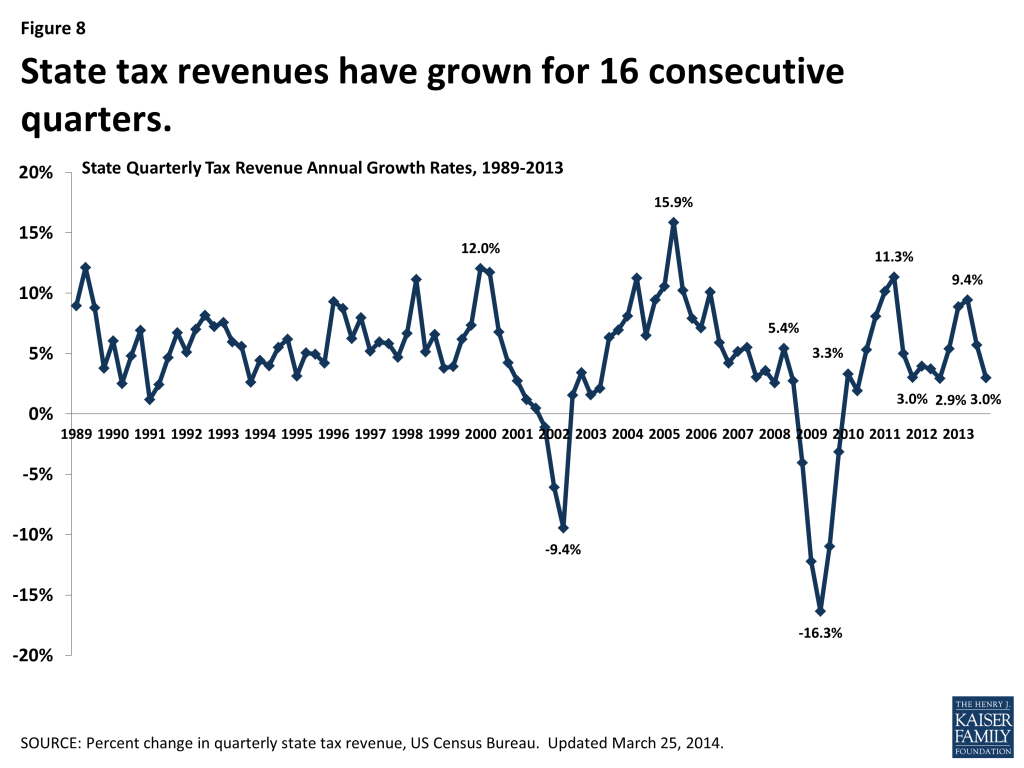
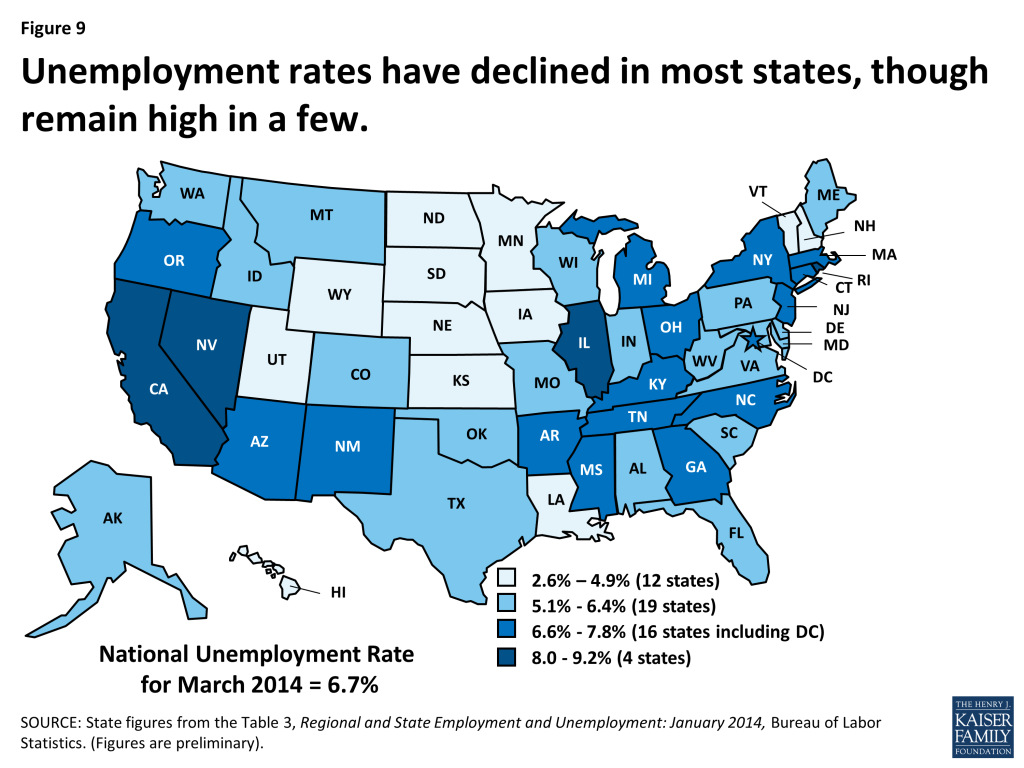
Data from the US Census Bureau show continued growth in state tax collections through the end of calendar year 2013, marking 16 consecutive quarters of year over year growth. As anticipated, tax revenue collections in the third and fourth quarters of 2013 continued to grow but at a slower rate than in the first and second quarters of the year.5  (Figure 8)  At the same time, the national unemployment rate has continued to slowly decline. In December 2013, the unemployment rate fell below 7.0 percent for the first time since November 2008. Since December, the rate has remained around 6.7 percent.6  After 49 months of private-sector job growth, private sector employment now exceeds levels reported at the start of the Great Recession. However, there were still 422,000 fewer jobs in March 2014 than when the Great Recession began due to continued declines in government employment. An estimated 10.5 million people are unemployed, over one-third of whom are long-term unemployed (those actively looking for work for 27+ weeks.7 ) While unemployment has declined in most states, four had rates at or above eight percent in January 2014. (Figure 9)

Figure 8
Figure 9

As economic conditions continue to improve, pressure on Medicaid enrollment and state budgets has lessened. According to data collected through the KCMU/HMA annual Medicaid budget survey, Medicaid enrollment growth slowed to 2.5 percent in FY 2013, the lowest rate of growth in six years.  Total Medicaid spending increased on average by 3.8 percent across states, relatively modest compared to historical growth rates and on target with original legislative appropriations.8 States make policy decisions about Medicaid in the context of changes in the economy and the overall budget picture.  During economic downturns, states face extraordinary budget pressures as demand for Medicaid increases but so do pressures to control costs, often by reducing provider payment rates, increasing or imposing new provider taxes, and restricting benefits.  As economic conditions improve, states often make restorations of these reductions as was seen in FY 2013.9  More recently, states have been engaged in more fundamental transformations to Medicaid payment and delivery systems as a way to both control costs and improve care delivery particularly for high-cost populations.  States continue to expand managed and are also implementing an array of care coordination initiatives including health homes, patient-centered medical homes, and Accountable Care Organizations as well as other quality related initiatives. 10 

The ACA, Medicaid, and State Budgets

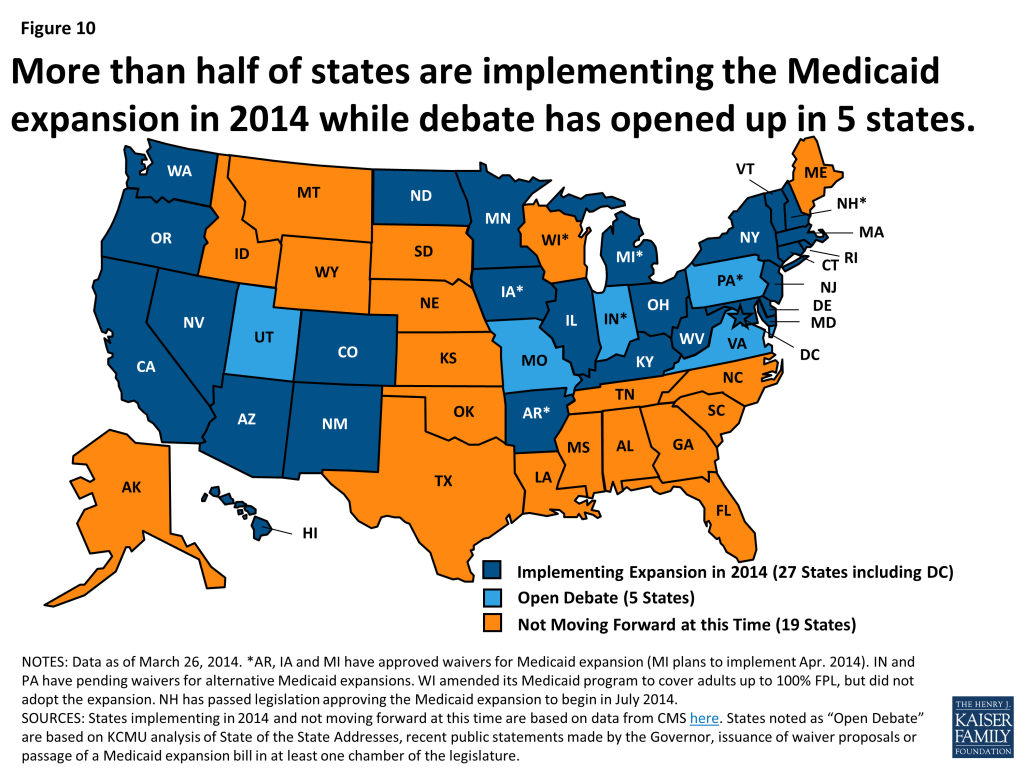
In addition to expanding options for affordable coverage through the creation of new Marketplaces, instituting reforms to private insurance, and providing additional funding for workforce and public health investment, the Affordable Care Act (ACA) builds on many of Medicaid’s current roles by expanding coverage with additional federal financing for the newly eligible population and by adding additional options for providing long-term care supports and for coordinating care of dual eligible beneficiaries. Many of the changes under the ACA will affect state budgets, but the one many state legislators are currently focused on is the Medicaid expansion.As enacted in the ACA, Medicaid’s role was broadened to become the foundation of coverage for nearly all low-income Americans with incomes up to 138 percent of the federal poverty level (FPL) ($16,105 per year for an individual in 2014). However, the Supreme Court ruling on the ACA effectively made the decision to implement the Medicaid expansion an option for states. As of March 2014, 27 states (including the District of Columbia) were implementing the Medicaid expansion, 19 states were not implementing in 2014 and 5 states were engaged in open debate.  (Figure 10)  For states that expand Medicaid, the federal government will pay 100 percent of the costs of those newly eligible for Medicaid from 2014 to 2016 and then that contribution phases down to and remains at 90 percent by 2020 (well above traditional Medicaid matching rates).

Figure 10

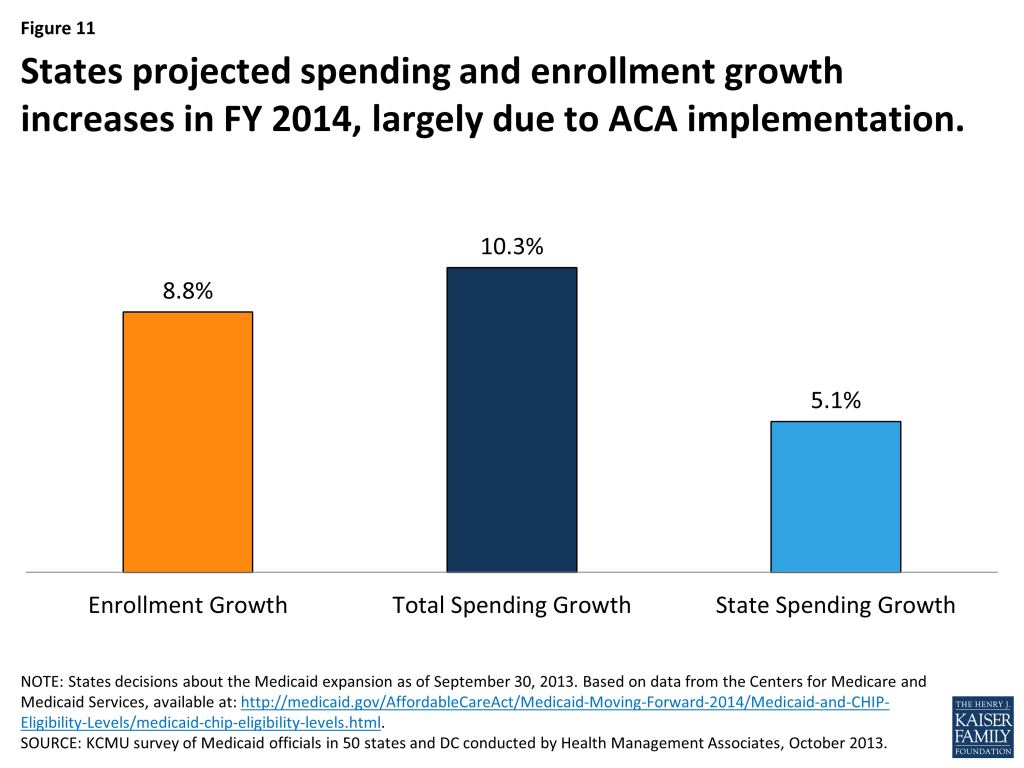
At the start of FY 2014, July 2013 for most states, enrollment for the fiscal year was projected to grow on average by 8.8 percent across all states. Total spending was expected to increase by 10.3 percent and state spending by 5.1 percent.  All states were anticipating increases in participation among those currently eligible but not enrolled due to enrollment simplifications and outreach for new coverage in the ACA. (Figure 11)  However, states moving forward with the expansion were anticipating higher enrollment growth and higher spending growth tied to large increases in federal funds.

Figure 11

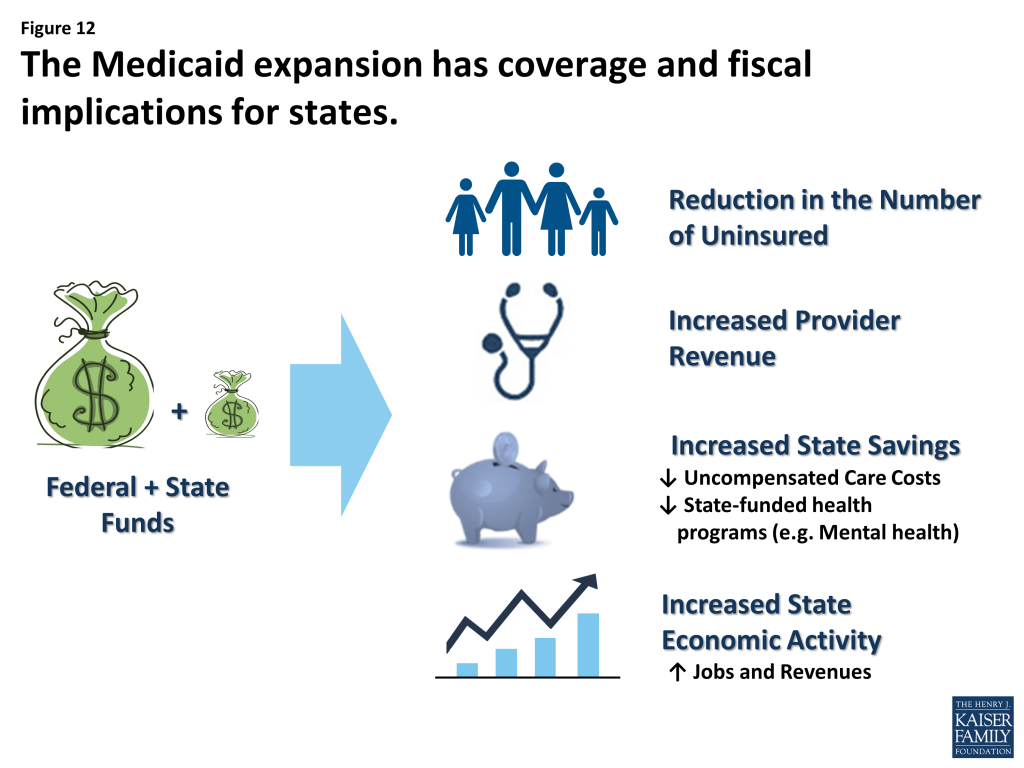
State decisions about implementing the Medicaid expansion have important coverage and fiscal consequences for states. Those that expand are expected to see increases in coverage and federal funds as well as reductions in the uninsured. While states will continue to face tradeoffs when deciding how to allocate funds across budget categories, the Medicaid expansion provides the opportunity for substantial federal revenues not otherwise available. A recent study found that the amount of federal funds estimated to come into states by 2022 if they decided to expand will be substantially higher (1.35 times higher on average) than the amount of federal funds estimated to flow into states through the federal highway program.11  The increased federal funds and reductions in the number of uninsured are also expected to result in potential state budget savings both within and outside of Medicaid, such as reductions in the need for uncompensated care costs and other indigent care (i.e. mental health and substance abuse programs) funded with state-only funds.12 Studies have historically shown that Medicaid spending and the influx of federal funds have a positive effect on state economies and jobs. Medicaid funds directly support tens of thousands of health care providers across the country, including hospitals, health centers, and nursing facilities. The funds indirectly support other businesses and affect jobs, household spending, and state and local tax collections.  This effect is magnified by the large increases in federal funds tied to the Medicaid expansion. (Figure 12)  A number of studies have been published examining the impact of the Medicaid expansion on state economies, budgets, changes in insurance coverage and broader economic effects. A recent review of 32 studies across 26 states found that the Medicaid expansion is projected to generate increased state economic activity, such as increases in state output, gross state product, and state and local revenues in those states expanding.13 

Figure 12

Alternatively, states that do not expand Medicaid will forgo large amounts of federal funds and adults in these states may face large gaps in coverage. However, these states can also expect an uptick in enrollment of those previously eligible for Medicaid but not enrolled at the regular match rate, not the enhanced match rate, which will bring continued Medicaid budget pressure without offsetting federal funds.

Looking Ahead

Fiscal conditions for states continue to improve, somewhat reducing the pressure on state budgets experienced during the recession.  Looking ahead, the implementation of the ACA will have significant coverage and budgetary effects for state budgets.  The underlying entitlement and financing structure is maintained and broadened to increase coverage of low-income uninsured state residents and the availability of substantial federal funds under the ACA.  These changes will also expand the role of Medicaid in state budgets as both an expenditure as well as a significant source of revenue for states.  State Medicaid programs are dynamic and evolving, but never more so than now. The scope and volume of change related to the implementation of the ACA, payment and delivery system reforms as well as controlling costs create enormous opportunities and challenges.

Endnotes

  1. State Health Facts, Total Medicaid Enrollment, FY 2010, (Washington, DC: Kaiser Family Foundation,) downloaded March 2014. https://modern.kff.org/medicaid/state-indicator/total-medicaid-enrollment/. ↩︎
  2. State Health Facts, Federal Medical Assistance Percentage (FMAP) for Medicaid and Multiplier, (Washington, DC: Kaiser Family Foundation,) downloaded March 2014. https://modern.kff.org/medicaid/state-indicator/federal-matching-rate-and-multiplier/. ↩︎
  3. Smith, Vernon et al. Medicaid in a Historic Time of Transformation: Results from a 50-State Budget Survey, (Washington, DC: Kaiser Family Foundation,) October 2013. https://modern.kff.org/medicaid/report/medicaid-in-a-historic-time-of-transformation-results-from-a-50-state-medicaid-budget-survey-for-state-fiscal-years-2013-and-2014/. ↩︎
  4. Kaiser Commission on Medicaid and the Uninsured estimates based on the NASBO’s November 2013 State Expenditure Report (data for Actual FY 2012.) ↩︎
  5. The first two quarters of tax revenue growth were driven by significant increases in personal income tax revenue growth; experts noted that this significant growth appeared to be artificially driven by changes in federal tax policy. While personal income tax growth slowed in the third and fourth quarters of 2013, sales tax revenue growth has remained fairly constant (over 5 percent each quarter) during the 2013 calendar year. Lucy Dadayan and Donald J. Boyd, State Tax Revenues Slip Back to Slower Growth, (Albany, NY: The Nelson A. Rockefeller Institute of Government,) March 11, 2014. http://www.rockinst.org/pdf/government_finance/state_revenue_report/2014-03-11_Data_Alertv3.pdf. ↩︎
  6. Bureau of Labor Statistics, The Employment Situation – March 2014.(Washington, DC: Bureau of Labor Statistics,) April 4, 2014. http://www.bls.gov/cps/. ↩︎
  7. Ibid. ↩︎
  8. Smith, Vernon et al. Medicaid in a Historic Time of Transformation: Results from a 50-State Budget Survey, (Washington, DC: Kaiser Family Foundation,) October 2013. https://modern.kff.org/medicaid/report/medicaid-in-a-historic-time-of-transformation-results-from-a-50-state-medicaid-budget-survey-for-state-fiscal-years-2013-and-2014/. ↩︎
  9. Ibid. ↩︎
  10. Ibid. ↩︎
  11. Sherry Glied and Stephanie Ma, How States Stand to Gain or Lose Federal Funds by Opting In or Out of the Medicaid Expansion. (New York City, NY: The Commonwealth Fund,) December 2013. http://www.commonwealthfund.org/Publications/Issue-Briefs/2013/Dec/Federal-Funds-Medicaid-Expansion.aspx. ↩︎
  12. John Holahan, Matthew Beuttgens, Caitlin Carroll and Stan Dorn, The Cost and Coverage Implications of the ACA Medicaid Expansion: National and State-by-State Analysis. (Washington, DC: Kaiser Commission on Medicaid and the Uninsured,) November 2012. https://modern.kff.org/health-reform/report/the-cost-and-coverage-implications-of-the/. ↩︎
  13. Kaiser Commission on Medicaid and the Uninsured, The Role of Medicaid in State Economies and the ACA. (Washington, DC: Kaiser Family Foundation,) November 2013. https://modern.kff.org/medicaid/issue-brief/the-role-of-medicaid-in-state-economies-and-the-aca/. ↩︎

Medicaid is an Expenditure Item and a Revenue Item in State Budgets

Published: Apr 1, 2014

Source

SOURCE: Kaiser Commission on Medicaid and the Uninsured estimates based on the NASBO’s November 2013 State Expenditure Report (data for Actual FY 2012.)

Poll Finding

After the Wars: Survey of Iraq and Afghanistan Active Duty Soldiers and Veterans

Authors: Bianca DiJulio, Claudia Deane, Jamie Firth, Peyton Craighill, Scott Clement, and Mollyann Brodie
Published: Mar 29, 2014

This partnership poll from The Washington Post and the Kaiser Family Foundation explores the views and experiences of adults who served in the Iraq or Afghanistan wars as members of the U.S. military in the period after the terrorist attacks of Sept. 11, 2001. The majority of veterans of these conflicts say that Americans appreciate their service and that gestures of support are genuine, but many report a number of challenges, including economic struggles, worse physical and mental health than prior to their engagement, and feeling disconnected from civilian life. The survey also includes findings on attitudes towards the government and the military, views on women serving in combat roles, and insight into the physical and mental toll the war has taken on these soldiers. This survey is the 27th in a series of surveys dating back to 1995 that have been conducted as part of The Washington Post/Kaiser Family Foundation Survey Project. Read The Washington Post’s reporting, graphics and videography which amplify the survey results, and give voice to our soldiers who served in Iraq and Afghanistan can be viewed here.

How Will the Uninsured in New Hampshire Fare Under the Affordable Care Act?

Published: Mar 28, 2014

The 2010 Affordable Care Act (ACA) has the potential to extend coverage to many of the 47 million nonelderly uninsured people nationwide, including the 158,000 uninsured people from New Hampshire. The ACA establishes coverage provisions across the income spectrum, with the expansion of Medicaid eligibility for adults serving as the vehicle for covering low-income individuals and premium tax credits to help people purchase insurance directly through new Health Insurance Marketplaces serving as the vehicle for covering people with moderate incomes. With the June 2012 Supreme Court ruling, the Medicaid expansion became optional for states, and as of March 2014, New Hampshire was planning to implement the expansion in July 2014.1  As a result, the ACA will be fully implemented in New Hampshire, and almost all nonelderly uninsured, most of whom are adults, will be eligible for coverage expansions.  As the ACA coverage expansions are implemented and coverage changes are assessed, it is important to understand the potential scope of the law in the state.

How Does the ACA Expand Health Insurance Coverage in New Hampshire?

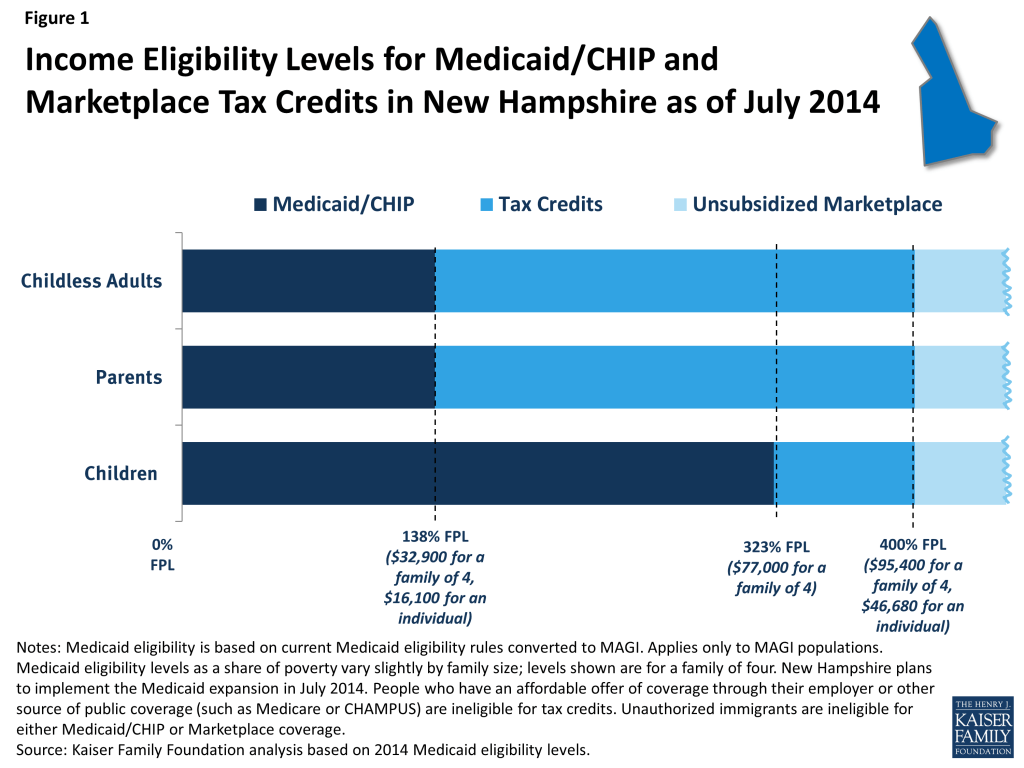
Historically, Medicaid had gaps in coverage for adults because eligibility was restricted to specific categories of low-income individuals, such as children, their parents, pregnant women, the elderly, or individuals with disabilities. In most states, adults without dependent children were ineligible for Medicaid, regardless of their income, and income limits for parents were very low—often below half the poverty level.2  The ACA aimed to fill in these gaps by extending Medicaid to nearly all nonelderly adults with incomes at or below 138% of poverty (about $32,900 for a family of four in 2014).  As of July 2014, Medicaid eligibility in New Hampshire will cover almost all nonelderly adults up to 138% of poverty, as shown by the dark blue shading in Figure 1.3  All states previously expanded eligibility for children to higher levels than adults through Medicaid and the Children’s Health Insurance Program (CHIP), and in New Hampshire, children with family incomes up to 323% of poverty (about $77,000 for a family of four) are eligible for Medicaid. As was the case before the ACA, undocumented immigrants remain ineligible to enroll in Medicaid, and recent lawfully residing immigrants are subject to certain Medicaid eligibility restrictions.4 

Figure 1

Under the ACA, people with incomes between 100%-400% of poverty may be eligible for premium tax credits when they purchase coverage in a Marketplace, as indicated by the bright blue shading in Figure 1. The amount of the tax credit is based on income and the cost of insurance, and tax credits are only available to people who are not eligible for other coverage, such as Medicaid/CHIP, Medicare, or employer coverage, and who are citizens or lawfully-present immigrants. Thus, the effective lower income limit for tax credits in New Hampshire will be 323% of poverty for children and 138% of poverty for adults, as indicated by the bright blue shading in Figure 1. Citizens and lawfully-present immigrants with incomes above 400% of poverty can purchase unsubsidized coverage through the Marketplace.

How Many Uninsured people from New Hampshire Are Eligible for Assistance under the ACA?

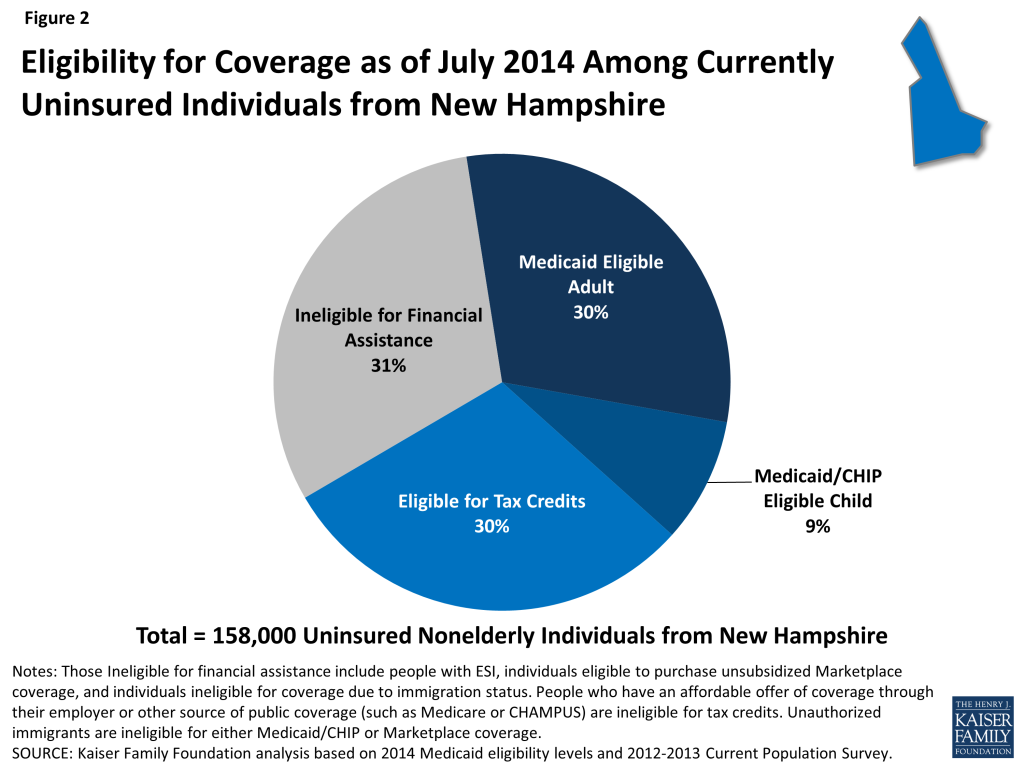
With New Hampshire deciding to implement the Medicaid expansion, seven in ten (69%) uninsured nonelderly people in the state will be eligible for financial assistance to gain coverage through either Medicaid or the Marketplaces (Figure 2). Given the income distribution of the uninsured in the state, the main pathway for coverage will be Medicaid, with four in ten (39%) uninsured individuals from New Hampshire eligible for either Medicaid or CHIP as of July 2014. While some of these people (such as eligible children) are eligible under pathways in place before the ACA, most adults will be newly-eligible through the ACA expansion.  Three in ten (30%) of all uninsured people in New Hampshire are eligible for premium tax credits to help them purchase coverage in the Marketplace.

Figure 2

About three in ten (31%) uninsured individuals from New Hampshire may gain coverage under the ACA but will not receive direct financial assistance. These people include those with incomes above the limit for premium tax subsidies or who have an affordable offer of coverage through their employer. Some of these people still will be able to purchase unsubsidized coverage in the Marketplace, which may be more affordable or more comprehensive than coverage they could obtain on their own through the individual market. Lastly, uninsured people in New Hampshire who are undocumented immigrants are ineligible for financial assistance under the ACA and barred from purchasing coverage through the Marketplaces. This group is likely to remain uninsured, though they will still have a need for health care services.

***

The ACA will help many currently uninsured people from New Hampshire gain health coverage by providing coverage options across the income spectrum for low and moderate-income people. While almost all of the uninsured in New Hampshire are eligible for some type of coverage under the ACA, the impact of the ACA will depend on take-up of coverage among the eligible uninsured, and outreach and enrollment efforts will be an important factor in decreasing the uninsured rate. The ACA includes a requirement that most individuals obtain health coverage, but some people (such as the lowest income or those without an affordable option) are exempt and others may still remain uninsured. There is no deadline for enrolling in Medicaid coverage under the ACA, and open enrollment in the Marketplaces continues through March 2014. Continued attention to who gains coverage as the ACA is fully implemented and who is excluded from its reach—as well as whether and how their health needs are being met—can help inform decisions about the future of health coverage in New Hampshire.

  1. New Hampshire passed legislation approving the Medicaid expansion that is expected to be signed by the Governor in March 2014. While the state plans to seek a waiver at a later date, the legislation calls for the expansion to begin July 1, 2014. This fact sheet updates the January 2014 fact sheet of the same name to reflect this policy change. ↩︎
  2. Some states had expanded coverage to parents at higher income levels or provided coverage to adults without children. See http://modern.kff.org/medicaid/fact-sheet/medicaid-eligibility-for-adults-as-of-january-1-2014/ for more detail on pre- and post-ACA Medicaid eligibility for adults. ↩︎
  3. New Hampshire does not plan to implement the Medicaid expansion until July 2014. ↩︎
  4. For more detail on Medicaid coverage for immigrants, see: http://modern.kff.org/disparities-policy/fact-sheet/key-facts-on-health-coverage-for-low/. ↩︎

Medicaid Beneficiaries Who Need Home and Community-Based Services: Supporting Independent Living and Community Integration

Authors: MaryBeth Musumeci and Erica L. Reaves
Published: Mar 27, 2014

To provide insight into the unique experiences of Medicaid beneficiaries who need home and community-based services (HCBS), this report profiles nine seniors and people with disabilities residing in Florida, Georgia, Kansas, Louisiana, North Carolina, and Tennessee. They include people with a range of developmental disabilities, such as autism and intellectual disabilities; physical disabilities, such as cerebral palsy and multiple sclerosis; multiple chronic health conditions; Alzheimer’s disease and aging-related dementia, and physical functional limitations associated with the aging process.  Based on a series of telephone interviews conducted in 2013 by the Kaiser Commission on Medicaid and the Uninsured, these profiles illustrate how beneficiaries’ finances, employment status, relationships, well-being, independence, and ability to interact with the communities in which they live – in addition to their health care – are affected by their Medicaid coverage and the essential role of HCBS in their daily lives.  We extend our appreciation to the beneficiaries and their families who so generously took the time to share their stories.

Section:
0 / 0

Introduction

Introduction

Medicaid is an important source of health insurance for seniors and people with disabilities.  In addition to covering a variety of medical care, such as doctor visits, behavioral health services, and prescription drugs, Medicaid also is the primary payer for long-term services and supports (LTSS), including nursing facility care and home and community-based services (HCBS) (Figure 1).1    HCBS provide assistance with activities of daily living (such as eating, bathing, and dressing) and instrumental activities of daily living (such as preparing meals and housecleaning) for people with physical or cognitive functional limitations that result from age or disability.  HCBS include a range of benefits, such as residential services, adult day health care programs, home health aide services, personal care services, and case management services, among others.2   HCBS may be delivered through a self-directed service model in which beneficiaries select, train, and dismiss their providers and/or control the allocation of funds among particular services in their individual budgets.3 

Figure 1: Medicaid is the primary payer for long-term care services

To provide insight into the unique experiences of Medicaid beneficiaries who need HCBS, this report profiles nine seniors and people with disabilities residing in Florida, Georgia, Kansas, Louisiana, North Carolina, and Tennessee.4   They include people with a range of developmental disabilities, such as autism and intellectual disabilities; physical disabilities, such as cerebral palsy and multiple sclerosis; multiple chronic health conditions; Alzheimer’s disease and aging-related dementia, and physical functional limitations associated with the aging process.  Based on a series of telephone interviews conducted in 2013 by the Kaiser Commission on Medicaid and the Uninsured, these profiles illustrate how beneficiaries’ finances, employment status, relationships, well-being, independence, and ability to interact with the communities in which they live – in addition to their health care – are affected by their Medicaid coverage and the essential role of HCBS in their daily lives.  We extend our appreciation to the beneficiaries and their families who so generously took the time to share their stories.

Background

Nearly 3.2 million people received Medicaid HCBS in 2010, with expenditures totaling $52.7 billion.5   Historically, the Medicaid program has had a structural bias toward institutional care because state Medicaid programs must cover nursing facility services, whereas most HCBS are provided at state option.6   While states can choose to offer HCBS as Medicaid state plan benefits, the majority of HCBS are provided through waivers.7   Unlike Medicaid state plan benefits, which must be available to all beneficiaries as medically necessary, waiver enrollment can be capped, resulting in waiting lists when the number of people seeking services exceeds the amount of available funding.   In 2012, nearly 524,000 people were on HCBS wavier waiting lists nationally, with the average waiting time exceeding two years; waiting lists vary both across states and within states among waiver target populations.8 

Over the last several decades, states have been working to rebalance their long-term care systems by devoting a greater proportion of spending to HCBS instead of institutional care.  These efforts are driven by beneficiary preferences for HCBS, the increased population of seniors and people with disabilities who need HCBS, and the fact that HCBS typically are less expensive than comparable institutional care.  The U.S. Supreme Court’s 1999 Olmstead decision, finding that the unjustified institutionalization of people with disabilities violates the Americans with Disabilities Act, also has heightened the state and federal focus on community integration efforts.9   While the majority of Medicaid LTSS spending still goes toward institutional care, the proportion of Medicaid LTSS spending on HCBS continues to increase relative to spending on institutional services.  In FY 2011, HCBS accounted for 45 percent of total Medicaid LTSS spending nationally, up from 32 percent in FY 2002 (Figure 2).

Figure 2: Growth in Medicaid Long-Term Services and Supports Expenditures, 2002 – 2011

Key Themes

The nine Medicaid beneficiaries profiled in this report illustrate the diversity of medical conditions, personal circumstances, and needs for services and supports among seniors and people with disabilities who rely on HCBS.  At the same time, their stories suggest some common themes underlying the important role of Medicaid HCBS in their lives:

  • Medicaid HCBS increase independent living and community integration opportunities for seniors and people with disabilities.  The beneficiaries profiled in this report uniformly express their desire to increase or maintain their independence to the maximum extent possible and emphasize the vital role of Medicaid HCBS in enabling them to do so.  Mary B., a senior with dementia, was able to move from a facility to an apartment where Medicaid provides the home health aide services and medical supplies necessary to support her safely at home while her daughter is at work.  Margot, a woman with cerebral palsy, and Mary A., a senior with physical functional limitations, both valued the increased independence they experienced when they were able to have their aides accompany them in the community to assist with grocery shopping and errands.  Beneficiaries who have spent time waiting for services describe the transformative impact that receiving HCBS has had on their quality of life.  Curtis, a young man with developmental disabilities, is now improving his independent living skills and participating in the community in an age-appropriate manner with the support of Medicaid attendant care services.  Nicholas, an adult with multiple sclerosis, hopes to receive a car attachment to transport his power wheelchair as a Medicaid home and community-based waiver service, which will decrease the barriers he faces in physically accessing the community.
  • Medicaid HCBS support people with disabilities who work.  Several of the beneficiaries profiled in this report are working or are able and want to be employed, and Medicaid HCBS play an important role in supporting these efforts by ensuring that beneficiaries’ daily self-care and functional needs are met.  Mark, a man with autism, is proud of his job as a grocery store courtesy clerk, a position that he has held for a dozen years; a group home placement would ensure that he will continue to have the necessary self-care supports that he needs to continue working as his aging parents become less able to provide for his daily needs.  Margot, a woman with a master’s degree in social work, wants to be employed and could do so with sufficient home health aide hours to manage her daily physical needs as a result of functional limitations due to cerebral palsy.  Aubrey, a teenager with autism, improved his social interaction and independent living skills with the help of Medicaid HCBS to the extent that he now is enrolled in college and majoring in mechanical drafting.
  • Medicaid HCBS fill needs of seniors and people with disabilities that would otherwise go unmet due to beneficiaries’ limited financial resources.  The profiles relate the struggles of people with low incomes trying to pay out-of-pocket for costly services while facing the competing demands of paying for housing, food, and other necessities.  Patricia, a woman with multiple chronic conditions, and Mary A., a senior with physical functional limitations, both need assistance with cooking, cleaning, and grocery shopping so that they can continue to live independently in their homes.  Patricia worries about her susceptibility to falling, and Mary A. needs help with bathing and dressing.  At various points, both women have tried to pay out-of-pocket for services but have been unable to do so on a sustained basis on budgets limited to Social Security benefits and food stamps.
  •  Medicaid HCBS play a vital role in ensuring a safe stable source of care because beneficiaries’ needs often outstrip the assistance that family and friends can provide.  The beneficiaries profiled in this report receive a range of informal assistance from relatives and friends, which may not be a sustainable solution for people who need long-term HCBS or those with intense care needs.  Families often provide a great deal of care, and beneficiaries and their caregivers report stress in meeting on-going or deteriorating needs for services and supports.  Irene’s daughter moved cross-country to provide full-time care, but as Irene’s Alzheimer’s disease progresses, her needs are becoming too great for her daughter to handle alone.  Curtis and Mark are adults with developmental disabilities whose need for constant supervision and supports is likely to outlast their parents’ ability to provide that care.   
  • Medicaid HCBS are cost-effective as a less expensive alternative to institutional care and as preventive care to avoid more expensive deteriorations in health status.  Beneficiaries emphasize their preference to live in the community instead of a nursing home not only because they feel that community living improves their quality of life and independence but also as a cost-saving measure.  They also cite examples of the role of HCBS in avoiding more costly inpatient hospitalizations and emergency room visits.  Nicholas, who required emergency room treatment for injuries sustained during a fall while transferring from his wheelchair to the bathroom, hopes that a Medicaid HCBS waiver will provide home modifications to make his apartment physically accessible so that he can remain living there safely.  Margot believes that some of her inpatient hospitalizations were potentially avoidable if she received additional home health aide services to address functional and self-care limitations resulting from cerebral palsy.

The stories presented in this report illustrate the time, energy, dedication, and patience required to obtain and coordinate the services necessary to ensure independent safe community living for seniors and people with disabilities.  As a result of their experiences accessing HCBS, these individuals offer concrete ideas about how the system can be improved for others, such as:

  • Simplifying the application process, which beneficiaries can find confusing and at times difficult to navigate.  Specifically, beneficiaries envision a streamlined system through which seniors and people with disabilities can learn about and sign up at once for all of the various services that may be needed, including Medicaid HCBS, self-directed service options, subsidized housing, and transportation.
  • Minimizing the number of times that applicants must “tell their story” and provide the same information again when seeking services.
  • Providing easily accessible, accurate, timely updates about beneficiaries’ status, such as through a website, while waiting for services.
  • Offering additional supports to beneficiaries who move inter-state to help navigate delays and additional barriers in arranging for the medically necessary care they need to transition to their new communities.

Despite some challenges, these stories confirm the essential role of Medicaid HCBS in improving beneficiaries’ daily lives by providing the physical and social functional supports necessary to access and benefit from community living.  As these profiles make clear, seniors and people with disabilities have unique contributions to offer the communities in which they live, and Medicaid HCBS facilitate their integration into community life.  For the beneficiaries profiled in this report and the many others who receive HCBS, Medicaid is a true safety net as it is often the only available source of these essential services to support community living.

Report: Curtis, Age 20, Topeka, Kansas

8568 - Curtis 200 x 200Medicaid attendant care services help young man with developmental disabilities improve independent living skills.

Curtis lives with his mother and legal guardian, Rhonda. He is diagnosed with autism, intellectual disabilities, and sensory integration issues. Curtis functions on the level of a 2nd to 3rd grader and has recently started to read. While he has a very easy-going personality, he cannot be left alone and needs help with shaving, bathing, and taking medication.

Curtis started receiving attendant care services through a Medicaid HCBS waiver about two years ago. His attendant accompanies him to the library, to get his hair cut, to community events, and to the book store where his favorite activity is looking at picture books. His attendant also helps him with basic life skills at home, such as making his bed and dusting his room. Rhonda locates, trains, and schedules Curtis’ attendants.

There is a desperate need for services for adolescents so that they can develop independent living skills in age-appropriate settings with peers.”
-Curtis’ mother, Rhonda

Rhonda says that attendant care services have enabled Curtis to interact with the community in an age-appropriate way as a young adult. She believes that receiving services earlier during adolescence would have helped Curtis develop greater independence at that time with getting his own breakfast or an after-school snack and getting on and off the school bus. Curtis was on the Medicaid HCBS waiver waiting list for 12 years, from ages six to 18, when Rhonda says they were in “desperate need” of services. As a single parent, Rhonda was able to work only because she found childcare providers who would supervise Curtis when he was a teenager; however, this arrangement meant that Curtis was with infants at a childcare center rather than in an age-appropriate setting with peers. Rhonda paid out-of-pocket about $50 per week for before- and after-school care and whenever she needed to go to an appointment or meeting by herself. Rhonda says that respite care at $25 per hour was unaffordable for her.

Looking ahead, Rhonda says that Curtis wants to continue to live with her, but eventually he will have to transition to a residential placement because she “will not live forever,” and he needs constant supervision. She hopes that he can move into a group home around age 25. She also would like him to attend a day program after he finishes high school at age 21, although that involves another waiting list. Rhonda describes the waiting list system as “confusing” and “a lot of work to orchestrate.” She found it difficult to learn how to get Curtis’ name onto the HCBS waiver waiting list and was frustrated during the wait because “no one can tell you where you are on the list.” Rhonda suggests that the system could be improved if people could look up their place on the list on a website while they are waiting for services.

Report: Margot, Age 38, Charlotte, North Carolina

8568 - Margot 200 x 200Home health aide services would support woman with cerebral palsy with working and living independently in the community.

Margot has her master’s degree in social work and wants to be employed. However, since relocating from New York to North Carolina to live closer to family after a divorce, she has been unable to find a job because attending to her living and health care situation has taken up so much of her time. Margot has cerebral palsy and spastic quadriplegia. She can feed herself but needs help with preparing meals and all other activities of daily living, especially her morning and evening routines. Margot is dually eligible for Medicaid and Medicare.

Although Margot started researching services before moving, she still has run into barriers. Most home health agencies said that she had to move first rather than getting services in place before relocating, as her disability requires. If Margot had not found an agency that was willing to work with her, she would have been stuck in New York. That agency estimated Margot would spend about four months on the HCBS waiver waiting list, so she decided to move and rent a room in a friend’s house because her family and friend thought that they could “make things work” temporarily. However, Margot has been on the waiting list much longer than anticipated, since April 2012.

A nursing facility would be a terrible alternative for my quality of life and would cost more than providing care at home.”
-Margot, age 38

Margot now receives 80 home health aide hours per month through the Medicaid state plan benefits package, which is less than the 66 home health aide hours per week that she received before moving. Her current hours are insufficient to meet all of her needs. Her family is now physically unable to provide most of her care, and Margot’s friend’s work obligations leave her friend unable to provide all the care Margot needs. Since moving, Margot has been hospitalized at least six times, some of which might have been avoided if she received more aide hours. The HCBS waiver would provide additional hours, but she has learned that the waiver waiting list can be as long as 15 years. There is also a separate two year waiting list for the program to self-direct services. Before relocating, Margot lived in her own apartment and could take her aide out to assist her while shopping for groceries or clothing. Currently, Margot is not permitted to do errands with her aide, which restricts her independence. Margot prefers to live on her own and does not want to live in a nursing home.

Transportation also is a challenge. Because Margot does not live within ¾ of a mile of a bus stop, she is placed on “standby” and does not learn if she will be picked up until the night before a scheduled trip. This is not workable because, she says, “the way my disability is, I have to plan ahead.” Another challenge is housing. Even if she were receiving enough home health aide hours to live on her own, the waiting list for a subsidized apartment is two to three years long. Margot learned about services “piecemeal” so she did not get onto all of the different waiting lists at the same time. She recommends that there should be a single place to find out about all services at once.

Report: Irene, Age 79, Valrico, Florida

Medicaid HCBS will help daughter continue to care for mother with Alzheimer’s disease at home.

Irene has Alzheimer’s disease, and her condition has worsened significantly over the last six to 12 months. Irene needs help with dressing, preparing meals, and using the bathroom at night. She cannot be left alone and wakes up at night confused and crying. Irene lives with her 45 year old daughter, Julia, in a single family house. Julia moved from Colorado to Florida to care for her mother about five years ago. Julia says that “she’s not my mom anymore mentally,” but physically, Irene is healthy. Irene always was very independent, raising four children as a single mother. She was athletic well into her 60s, engaging in swimming, diving, tennis, softball, and whitewater rafting.

At this point, anything helps. . . in retrospect, I would have applied for services earlier rather than later.”
-Irene’s daughter, Julia

Irene has Medicare and is about to receive Medicaid, including 10 hours per week of in-home care. For the last six months, Julia has paid out-of-pocket for a companion aide, four hours a day, three days a week, to help with Irene’s care. However, Julia has concerns about her ability to continue to afford the companion aide because she left her job in Colorado to care for her mother full-time.

Julia says that her family always had talked about having Irene remain at home instead of going into a nursing home when Irene got older. Initially, Julia thought that she could handle Irene’s care but says that it has been very stressful, and her own health has deteriorated as a result – she has gained weight and her blood pressure has gone up. Julia’s plan is to keep Irene at home “as long as possible” but says that a lot depends on her continued ability to provide Irene’s care. Julia says that this has become increasingly difficult as Irene’s disease has progressed, and there is a “time when you want to give up.”Julia also believes that her mother now needs more care than the companion aide can provide. For example, Julia worries that Irene may start falling because she has started to “shuffle” while walking and is “wobbly.” Irene also has started wandering from the house. Julia installed door alarms, but recently Irene got out of the house, climbed over a fence, fell, and rolled down a slope in the front yard. Julia now needs to ask a neighbor to watch her mother while Julia walks her dog.

Julia started applying for Medicaid home and community-based waiver services for Irene about a year ago, after learning about the program at a local Alzheimer’s support group. She suggests that the application process could be streamlined to avoid the “exact same interview with three different people.” Julia says that she initially was “nervous” about applying for services because she thought that there were “probably people worse off” but now thinks that she was “in denial” about how difficult it had become for her to handle Irene’s care. Now that Irene has been approved for Medicaid HCBS, her case worker is “trying to rush things” to get services in place.

Report: Mark, Age 43, Nashville, Tennessee

8568 - Mark 200 x 200A group home placement would increase independence for working man with autism and ease the burden on his elderly parents.

Mark has autism and intellectual disabilities. He has lived with his parents for his entire life. Mark’s mother, Jackie, always has been his primary caregiver, but it is becoming increasingly difficult for his parents to care for him now that they are getting older and developing their own health issues.

Mark has worked as a grocery store courtesy clerk for 12 years and enjoys having a “real job” outside of a sheltered workshop. He is very rigid about his daily schedule and will not deviate from his routine, such as the time he goes to bed, which can be difficult and limiting for his family. Jackie thinks that Mark probably could be more independent than he is. For example, he might be able to learn to get his own breakfast and do his own laundry. He bathes and dresses himself but needs help with shaving because he will not look into a mirror. He also will not talk on the telephone so his parents never leave him alone because he would be unable to call for help in an emergency. Jackie says that Mark needs 24/7 supervision, and ideally, she would like him to live in a small group home. She would like Mark’s move to happen while she is able to assist with his adjustment during the transition.

Receiving waiver services would give us a lot of peace of mind… I don’t want to be at a crisis point to receive services… I want to be able to help with the transition…”
-Mark’s mother, Jackie

Mark wants to live on his own because he wants to be like other adults his age, and Jackie says that he used to perseverate about having his own place to live. On the day of his initial interview for Medicaid waiver services, he stood in the driveway for a long time waiting for the caseworker to arrive. Now, Jackie feels that Mark has “sort of given up,” probably because he has been waiting for so long: Mark has been on the HCBS waiver waiting list for 20 years.

Mark is dually eligible for Medicare and Medicaid, but he is not currently receiving any HCBS due to the waiver waiting list. Jackie says that she has “no hope” of ever receiving waiver services because Mark’s case is not considered “urgent.” She receives an annual letter from the state confirming that Mark is still on the waiting list and asking if he still wants waiver services. She no longer calls the office because she says she “never get[s] any answers” and instead is “passed around from person to person.” Jackie does not even know who Mark’s caseworker is at this point. Jackie never expected to have to wait this long for services. She is frustrated and says she “has just about given up.”

Jackie also wishes that Mark had a social outlet and friends his age. She believes that moving to a residential placement would help Mark with this aspect of his life as well. She says that Mark only has his job and his family for social interaction now. Receiving Medicaid home and community-based waiver services “would make all the difference in the world” for Mark and his family and provide peace of mind for his parents.

Report: Nicholas, Age 33, Winston-salem, North Carolina

8568 - Nicholas 200 x 300Medicaid HCBS will make apartment physically accessible for man with multiple sclerosis.

Nicholas was diagnosed with multiple sclerosis (MS) at age 29, and the disease is advancing. He uses a motorized wheelchair and cannot walk more than a few feet. His hearing and vision are impaired, and he wears hearing aids. He also has difficulty using his hands and holding things. He receives a monthly drug infusion that reduces some symptoms. He recently developed a new symptom, trigeminal neuralgia (a nerve condition that causes intense facial pain), which he describes as “blindingly painful,” and for which he is taking a new medication. Nicholas says that he is in “a lot of pain” daily and has been “dealing with pain forever” as a result of MS.

Nicholas’s mother provides a lot of his care. She helps him with getting into bed, administering his medications, and putting lotion on his legs. She also does his laundry, cooking, and grocery shopping, and provides his transportation.

I would have waited as long as it took to get services.”
-Nicholas, age 33

Nicholas lives in an apartment with his mother that is physically inaccessible. His wheelchair does not fit through the bathroom doorway so he must transition out of his wheelchair to enter the bathroom, and the shower also is inaccessible. In September 2013, Nicholas had to go to the emergency room after he fell while home alone and trying to transfer from the bathroom to his wheelchair. His leg bent the wrong way, and he became wedged against the wall. He was screaming for help, but none of his neighbors was home at the time. His mother found him when she returned. He did not break any bones but says he had a long painful recovery.

Nicholas recently learned that he is about to start receiving Medicaid home and community-based waiver services. Nicholas already receives Medicaid state plan benefits, which cover his medications, doctor visits, and power wheelchair. He expects that the waiver will offer additional services, such as making his shower accessible, maintaining his power wheelchair, providing home-delivered meals, and supplying a car hook-up for his power wheelchair so that he can go out more easily in the community. Currently, he has a manual wheelchair that fits into his mother’s car but which is difficult for him to use as he needs someone to push him. As a result, he only goes where he “really need[s] to go,” such as doctor appointments.

Nicholas found out about the waiver from a friend and some internet research. When he learned that enrollment was capped, he initially decided to “set it aside.” Then, his therapist explained that there is a waiting list. Nicholas was on the waiting list about seven months. He was told that the wait might be a year or more so he was “excited” that the list moved more quickly. He is happy with his waiver case plan and hopes that the waiver will “clue [him] in to other services that may be available.”

Report: Oscar, Age 11, And Aubrey, Age 19, Dalton, Georgia

8568 - Oscar and Aubrey 300 x 200Teenager overcame deficits in social interaction skills due to autism with the help of Medicaid HCBS, while waiting lists and an interstate move have delayed services for his brother.

Aubrey and Oscar are brothers who are both diagnosed with autism. They lived together with their parents in Georgia until their father’s job was transferred to Kansas in 2008. Both boys were receiving Medicaid HCBS in Georgia at that time, and because Aubrey was doing so well, the family decided to have him remain in Georgia, living with a relative, so he could continue to receive services and avoid the Medicaid HCBS waiver waiting list in Kansas. Although this meant that the family had to be separated, which was a hardship, Aubrey’s mother Angelina says that Aubrey “blossomed” socially as a result of the services he received. Medicaid HCBS provided Aubrey with opportunities to model typical peers and learn social and independent living skills. Aubrey also received eight hours of respite care per month through the waiver, which Angelina believes helped to keep her marriage intact as a result of the stresses associated with caring for children with disabilities. Aubrey improved to the point that he no longer qualified for special education services by the time he was a high school senior, and he is now in college majoring in mechanical drafting.

My two sons are very similar in terms of their functional abilities… Aubrey’s progress has been fantastic as a result of the services he received, while Oscar has languished on the waiting list…”
-Aubrey and Oscar’s mother, Angelina

Due to his young age, Oscar moved with his parents to Kansas, where his mother says he waited 4 ½ years for HCBS. As a result, Oscar has not had as many opportunities to develop social interaction skills, and the family has not had respite care, which has been stressful. Angelina also believes that Oscar could benefit from anger management therapy because he has not yet learned how to self-regulate his emotions.

Recently, the boys’ father lost his job, and the family returned to Georgia, where Oscar must start over again at the bottom of the HCBS waiver waiting list. Oscar has not yet been able to get onto the list because the family must provide a letter from a doctor in Georgia for his application to be considered complete. However, Angelina is unable to take Oscar to a doctor in Georgia until his application for Medicaid state plan services is approved, which can take up to 45 days. Angelina says that families of children with disabilities should be prepared to wait multiple years for services and worries that Aubrey and Oscar will have very different outcomes due to the different amount of services they each have received.

Report: Mary A., Age 79, Winston-salem, North Carolina

Medicaid HCBS help senior with physical functional limitations continue to live independently in her own apartment.

Mary lives alone in a subsidized apartment building for senior citizens. She has diabetes, atrial fibrillation, and chronic obstructive pulmonary disease and was hospitalized for four days in February 2013 due to congestive heart failure. She had surgery for breast cancer in 2010, and continues to have follow-up tests. She sometimes has to use oxygen during the day because she gets out of breath when she “tries to do too much,” and she uses oxygen connected to a continuous positive airway pressure machine at night to keep her airway open. She also takes “a whole list” of medications and has frequent doctor appointments. Mary is dually eligible for Medicaid and Medicare and receives Social Security benefits and food stamps.

I almost gave up and learned to do without while I was waiting for waiver services and unable to do things for myself.”
-Mary, age 79

Mary currently receives certified nursing assistant (CNA) services for an hour and 45 minutes a day, five days a week, and she recently learned that she will start receiving additional Medicaid home and community-based waiver services in two to three weeks. Presently, the CNA comes in the afternoons to help Mary with bathing and dressing. If there is any extra time, the CNA will help make her bed if she was unable to do so in the morning and fix her something to eat, but Mary says there is not much time for cooking because the CNA is there such a short time.

Mary needs help cleaning her apartment because she can no longer do any heavy work or lifting. She used to pay someone to help with cleaning, but she can no longer afford it. It is difficult for her to reach up to get a can down from the top shelf in her kitchen, and she also needs help grocery shopping. She says that the CNA used to be able to take her out for an “errand day” once a week, but CNAs are no longer permitted to do so. It is hard for Mary to find someone to take her shopping; when she does, she needs to pay the person about $20 for gas, and she doesn’t have much more than that to spend on her groceries. All of her money goes to rent, utilities, and food, and she can hardly afford anything extra like haircuts.

Mary says that she does not fully understand the Medicaid HCBS waiver program. She was on the waiting list for one year and was “about to give up.” Mary does not want to live in an assisted living facility or a nursing home and says that receiving Medicaid home and community-based wavier services will “make a whole lot of difference” in her life.

Report: Patricia, Age 57, Logansport, Louisiana

Medicaid home health aide services would ensure that woman with multiple chronic conditions can remain safely at home.

Patricia lives alone in a two bedroom house. She is very hard of hearing and has advanced chronic obstructive pulmonary disease, type II diabetes, high blood pressure, a left rotator cuff injury, and dizziness. She uses oxygen 24 hours a day and takes multiple medications. Patricia has had problems with retaining fluid and recently experienced facial numbness and a skin problem that required medication. She uses a wheelchair and worries about falling. When she has fallen in the past, someone has had difficulty helping her to get up.

“I don’t understand why Medicaid will pay for nursing facility care when it would be cheaper to have care in my home.”
-Patricia, age 57

Patricia presently receives a home nurse visit every two weeks to check her vital signs. Her ex-husband helps her with yard work and home repairs, but she still needs help with cleaning, changing her sheets, cooking, and showering. Patricia cannot stand for long periods of time and says that cooking, sweeping, or mopping “takes a lot out of [her].” When Patricia is alone, she eats sandwiches or microwaved meals. She also needs transportation to get to doctor appointments and the grocery store because she is physically unable to drive. One of her doctor’s offices is over an hour away, and she must pay someone to drive her there. She also would like companionship because she is mostly by herself and has no one with whom she can talk.

Patricia receives Social Security benefits, food stamps, Medicare, and Medicaid only to help with her Medicare out-of-pocket costs. Patricia has paid out-of-pocket for home health aide services in the past, but she only can afford to pay $90 for 12 hours of help per week, which people tell her is not enough money, and she has difficulty finding people who can reliably help her. She has to find friends or friends of friends through word of mouth to help her, and they are not trained. She would prefer to have services from someone who is properly trained and would know what to do if she fell.

Patricia’s initial application for Medicaid home and community-based waiver services was denied because she was told that she did not qualify for a nursing home level of care. However, she had difficulty hearing what was said because the assessment was done by phone. She thinks that the assessment should have been done in person in her home. She appealed the denial but also had difficulty understanding what was said during the telephone hearing. Finally, she called an advocate for help, and since July 2013, she has been on the waiver waiting list. At that time, she was told that there is a three year wait for services, and she has not had any subsequent updates about her status. Patricia was told that she could receive HCBS if she first went into a nursing facility, but she does not think that would make sense financially. She also fears that, if she were to go into a nursing facility, she would “never come home again.”

Ideally, Patricia would like to have home health aide services for four to six hours per day, three to four days per week. She says that she sometimes is concerned about her ability to continue to live at home and having Medicaid home and community-based waiver services would change her life “greatly” and would “make a big difference to [her].”

Report: Mary B., Age 72, Kernersville, North Carolina

Medicaid HCBS enable senior with dementia to return home.

When Mary was diagnosed with dementia a couple of years ago, she decided to move into an assisted living facility. Since then, her dementia has worsened. Mary can remember her name and birth date and recognizes her daughter, Karen. She sometimes remembers the current date and day of the week. Mary also has renal failure, diabetes, and a history of high blood pressure and strokes. Mary uses a wheelchair if she needs to do a lot of walking, and at other times, she uses a walker. Mary is dually eligible for Medicare and Medicaid, which pay for her doctor visits and medications.

Waiver services help me take care of my mother better and make her life as comfortable and easy as possible.”
-Mary’s daughter, Karen

Some time ago, Mary asked Karen if she could return home to live with her. Karen agreed, and Mary spent about a year on the Medicaid HCBS waiver waiting list because services needed to be in place before she could move. During the time that Mary was waiting for services, Karen says that Mary was eager to come home. Karen felt badly because Mary would ask whether she could come home yet, and Karen would have to say no. Karen describes the wait as “kind of stressful.”

About two weeks ago, everything “fell into place,” and Mary was able to move into Karen’s apartment. The waiver provides 47 hours of home health aide services per week for Mary while Karen is at work. The aide helps Mary with preparing breakfast and lunch, dressing, and bathing. The waiver also paid for Mary’s bedside commode, bath bench, and wheelchair and provides supplies, such as pull-ups. Mary is currently on a waiting list for home-delivered meals, and Karen was told that that wait will be about a month. Karen also is looking into a day program for Mary through the waiver.

Karen believes that Mary is receiving better care at home than she did in the assisted living facility. She feels that the home health aide provides Mary with “more one-on-one attention” and that Mary is “receiving the correct attention” at home. At the assisted living facility, Mary had some falls, including one resulting in a bad gash on her forehead, because no one was around to watch her or help her use the bathroom.

Karen takes Mary out to family dinners and trips to the zoo. They spend a lot of time sharing stories and jokes and doing crossword puzzles with each other and Mary’s aide. Besides the services provided by the waiver, Karen provides additional care for Mary. She takes her to the bathroom every two hours overnight, helps with her personal hygiene, prepares her dinner, and helps get her ready for the day. Karen says that she is happy to have her mother at home because she gets to spend more time with her, and having waiver services has made Mary’s return home possible.

Endnotes

  1. See generally Kaiser Commission on Medicaid and the Uninsured, Five Key Facts About the Delivery and Financing of Long-Term Services and Supports (Sept. 2013), available at https://modern.kff.org/medicaid/fact-sheet/five-key-facts-about-the-delivery-and-financing-of-long-term-services-and-supports/. ↩︎
  2. For additional examples of HCBS, see Victoria Peebles and Alex Bohl, CMS/Mathematica Policy Research, The HCBS Taxonomy: A New Language for Classifying Home and Community-Based Services (Aug. 2013), available at http://www.mathematica-mpr.com/publications/PDFs/health/max_ib19.pdf?spMailingID=7043783&spUserID=MTg0ODk4MzU1MwS2&spJobID=90194295&spReportId=OTAxOTQyOTUS1. ↩︎
  3. See 42 U.S.C. § 1396n (j), (k). ↩︎
  4. Pseudonyms have been used at an individual’s request. ↩︎
  5. Kaiser Commission on Medicaid and the Uninsured, Medicaid Home and Community-Based Services Programs:  2010 Data Update (March, 2014), available at https://modern.kff.org/medicaid/report/medicaid-home-and-community-based-service-programs/.  These figures reflect enrollment and expenditures for Medicaid state plan home health and personal care services and § 1915(c) waivers.  States also may provide Medicaid HCBS through § 1115 waivers, the Balancing Incentive Program, the Community First Choice state plan option, and § 1915(i). ↩︎
  6. For more information, see Kaiser Commission on Medicaid and the Uninsured, Medicaid Long-Term Services and Supports:  An Overview of Funding Authorities (Sept. 2013), available at https://modern.kff.org/medicaid/fact-sheet/medicaid-long-term-services-and-supports-an-overview-of-funding-authorities/. ↩︎
  7. Kaiser Commission on Medicaid and the Uninsured, Medicaid Home and Community-Based Services Programs:  2010 Data Update (March, 2014), available at https://modern.kff.org/medicaid/report/medicaid-home-and-community-based-service-programs/. ↩︎
  8. Id. ↩︎
  9. Olmstead v. L.C. 527 U.S. 581 (1999), available at http://www.law.cornell.edu/supct/html/98-536.ZS.html. ↩︎