KFF designs, conducts and analyzes original public opinion and survey research on Americans’ attitudes, knowledge, and experiences with the health care system to help amplify the public’s voice in major national debates.
On Monday, July 28 from 1 p.m. to 2:00 p.m. EDT, the Kaiser Family Foundation will hold an interactive web briefing to examine the experiences and lessons of four states – Colorado, Connecticut, Kentucky, and Washington – that each established state-based Marketplaces, expanded their Medicaid programs, and successfully enrolled eligible individuals into Medicaid and Marketplace coverage under the ACA.
The briefing will draw upon a new issue brief released today by the Foundation’s Kaiser Commission on Medicaid and the Uninsured (KCMU), What Worked and What’s Next? Strategies in Four States Leading ACA Enrollment Efforts. Based on interviews with key stakeholders in each state — including Medicaid and Marketplace officials, consumer advocates, enrollment assisters and providers – the brief identifies the key strategies that contributed to the four states’ success in the inaugural ACA open enrollment period and highlights the states’ priorities looking forward.
Samantha Artiga, an associate director of the KCMU, will present findings on key strategies that contributed to the open enrollment successes in these four states related to marketing and branding, outreach and enrollment, consumer assistance and enrollment system design and program operations.
Panelists from each of the four study states will highlight current and future priorities to continue to build upon their enrollment success and connect newly covered people to care. Panelists will include:
Kevin Counihan, CEO, Access Health CT
Lisa Lee, Deputy Commissioner, Kentucky Department for Medicaid Services
Taylor Roddy, Marketing & Communications Manager, Connect for Health Colorado
Rudy Vasquez, Managed Care Operations Director, Sea Mar Community Health Centers of Washington
The web briefing is free and open to the public. Those who wish to register must RSVP by clicking here. Shortly after registering, each participant will receive a confirmation email that contains information about how to join the web briefing.
States have taken different approaches to implementing the Affordable Care Act (ACA) and have had varied enrollment experiences to date. This brief highlights the experiences of four states—Colorado, Connecticut, Kentucky, and Washington—that established a State-based Marketplace (SBM), implemented the ACA’s Medicaid expansion, and achieved success enrolling eligible individuals into coverage. Based on interviews with key stakeholders in each state, it identifies effective strategies that contributed to enrollment and current priorities looking forward. Key themes are summarized below; details on specific strategies and approaches utilized by the states are described in the full report.
Lessons Learned
Marketing and Branding
Broad marketing campaigns by the SBMs in all four states raised public awareness of new coverage options. Stakeholders identified several aspects of the campaigns that contributed to their success, including:
Branding the coverage expansions as state initiatives;
Conducting statewide marketing across diverse channels; and
Providing promotional materials, like reusable shopping bags, to consumers.
Outreach and Enrollment Initiatives
Building on the broad branding and marketing efforts, local level outreach and enrollment efforts played a pivotal role in educating consumers and encouraging them to enroll into coverage. Stakeholders highlighted several successful aspects of the study states’ outreach and enrollment efforts, including:
Conducting extensive outreach through numerous local avenues;
Reaching large groups of people through events and local media;
Going mobile with outreach and establishing walk-in enrollment sites;
Utilizing existing data to facilitate enrollment; and
Engaging providers in outreach and enrollment efforts.
CONSUMER ASSISTANCE
Given that consumers often require significant time and education to enroll, stakeholders agreed that one of the most important elements of enrolling people into coverage is one-on-one assistance provided through trusted individuals in the community. Lessons learned about consumer assistance efforts included:
Recruiting a diverse group of assisters with ties to local communities;
Developing strong relationships between assisters and brokers;
Coordinating assistance through a regional hub and spoke structure;
Providing readily available support to consumer assisters; and
Expanding call center capacity and creating tiered assistance levels.
Systems and Operations
The effectiveness of the study states’ enrollment systems and their ability to quickly respond to technological glitches contributed to their enrollment successes. In addition, certain aspects of state policies and operations helped promote coverage efforts. Elements highlighted by stakeholders included:
Developing close relationships between staff and contractors and setting realistic expectations for systems;
Building effective enrollment systems with consumer-friendly features;
Implementing workarounds and incremental fixes to quickly address system problems; and
Using data and feedback loops to identify and respond to needs as they were identified.
Current and Future Priorities
The states were looking ahead to make continued improvements and focus on helping newly covered people access care. Stakeholders identified a range of key priorities looking forward including the following:
Enrollment and renewal
Educating consumers about continued Medicaid enrollment and Special Enrollment Periods;
Reaching remaining eligible but uninsured;
Supporting continuity of coverage; and
Continuing enrollment system upgrades and enhancements.
Consumer Assistance
Enhancing training and support for assisters; and
Ensuring adequate networks of consumer assistance are available.
Access and Utilization of Care
Increasing health insurance and health care literacy among consumers;
Connecting individuals to sources of care; and
Maintaining safety-net provider capacity.
Issue Brief: Introduction & Background
As of summer 2014, states are reflecting on their experiences during the first open enrollment period for the new Health Insurance Marketplaces established by the ACA and looking forward to the next open enrollment period, which begins on November 15, 2014. States faced many challenges over the past year as they planned for and implemented the ACA coverage expansions. All State-based Marketplace (SBM) websites, as well as the Federally-facilitated Marketplace (FFM) website, HealthCare.gov, faced technological glitches and limitations during initial implementation, although the extent of these problems varied widely across states. States also faced the task of implementing major changes in policies and programs within a limited timeframe and coordinating and collaborating across programs, agencies, and stakeholders. Despite these challenges, as of April 2014, over 8 million Americans were enrolled in new Marketplace coverage and total Medicaid enrollment had grown by an estimated 6 million individuals since just before the start of open enrollment.1, 2 States have taken different approaches to implementing the ACA and have had varied enrollment experiences to date. This brief highlights the experiences of four states—Colorado, Connecticut, Kentucky, and Washington—that each established their own SBM, implemented the ACA’s Medicaid expansion, and achieved success enrolling eligible individuals into coverage. It identifies key strategies that contributed to their success during open enrollment and highlights their current and future priorities. It is based on in-person interviews conducted during May 2014 with a range of stakeholders in each state, including Medicaid and Marketplace officials, advocates, enrollment assisters, and providers.
Background
The two primary ways the ACA increases coverage are through the creation of new Health Insurance Marketplaces that offer health insurance plans and advanced premium tax credits to help offset the cost of coverage for moderate-income individuals and the expansion of Medicaid to low-income adults. States have options with regard to how they implement these expansions. They can establish their own SBM, default to the FFM, or build a Marketplace in partnership with the federal government. As enacted, the ACA also required all states to expand Medicaid to nearly all adults with incomes at or below 138% FPL ($27,310 for a family of three in 2014) beginning January 2014, but the June 2012 Supreme Court ruling on the ACA effectively made this expansion a state option. As of July 2014, 27 states including the District of Columbia are implementing the Medicaid expansion in 2014.3
Regardless of their implementation choices for the ACA coverage expansions, all states must also implement streamlined Medicaid enrollment processes that offer individuals multiple options to apply (including online, by phone, in person, and by mail), rely on electronic data to verify information, and seek to provide real-time eligibility determinations. These processes are designed to be coordinated across Medicaid, the Children’s Health Insurance Program (CHIP), and Marketplace coverage to create a “no wrong door” enrollment system. Whether an individual applies directly to Medicaid or through a Marketplace, he or she is to be enrolled in the program for which he or she is eligible. To implement these new processes, many states have needed to make significant upgrades to antiquated Medicaid enrollment systems or build new systems.
The four study states—Colorado, Connecticut, Kentucky, and Washington—vary geographically and demographically (See Appendix Table 1). However, all four states elected to build their own SBM4 and implemented the full Medicaid expansion as of January 2014, with three of the four states (Colorado, Connecticut, and Washington) using available options to get an early start on extending Medicaid to adults. Moreover, all four states achieved significant enrollment in both their Marketplace and Medicaid programs over the course of the 2014 open enrollment period. Medicaid gains, in particular, were very strong, far exceeding the national average and outpacing some of the states’ growth estimates. As discussed below, stakeholders credit this enrollment success to a range of strategies employed for their marketing and branding campaigns; outreach and enrollment initiatives; consumer assistance networks; and overall systems, operations, and leadership. Looking ahead, the study states are focused on an array of future priorities and continued improvements to further build upon their successes to date.
Issue Brief: Lessons Learned
Marketing and Branding
Broad marketing campaigns conducted by the SBMs in all four study states raised public awareness of new coverage options. Stakeholders identified several aspects of the campaigns launched within the study states that contributed to their success, including:
Branding the coverage expansions as state initiatives.Employing lessons learned from the implementation of CHIP, the four study states used state-specific branding for their Marketplaces, which helped detach the coverage expansions from the ACA or “Obamacare” (Figure 1). This state-specific branding proved important, especially in Kentucky and in portions of the other three states, where many residents are distrustful of government programs and not politically supportive of the ACA. Kentucky directed all residents seeking health insurance to “kynect, Kentucky’s Health Care Connection.” It also created animated characters that were representative of different types of Kentuckians who could benefit from the new coverage options, to which stakeholders felt consumers responded well (Figure 2). Stakeholders in Washington indicated that its Marketplace name, “Healthplanfinder,” was intended to sound like a commercial product, which research showed would attract broad interest. Connecticut focused on making its Marketplace, “Access Health CT,” stand out from other entities by choosing orange as a brand color instead of blue, which is used by other entities in the state, including the University of Connecticut and the state seal. Connecticut and Washington also have state-specific names for their Medicaid programs. Connecticut named its Medicaid program for adults Husky D, and Washington changed the name of its Medicaid and CHIP program for children, “Apple Health for Kids,” to “Washington Apple Health” when it expanded to adults.
Figure 1: State-Specific Branding of Marketplaces
“I think the approach that the governor took on this whole thing was to not talk about it in terms of Obamacare or the Affordable Care Act. He talked about it in terms of…Kentucky’s health…This is not about President Obama, it’s not about Governor Beshear, it’s not about politics, it’s not about any of these things. It’s about improving the health of our state, so that kind of takes the argument out of it.” –Kentucky Marketplace Official
Figure 2: Examples of Kynect Animated Characters
Conducting statewide marketing across diverse channels. All four states began extensive statewide marketing campaigns for the coverage expansions early and used diverse channels, including television, radio, print, billboards, and social media. Messaging during the early part of open enrollment conveyed a simple, straightforward message about the availability of new coverage options and focused on raising brand awareness of the new Marketplace. Some messaging emphasized the opportunity to improve residents’ health and the availability of financial assistance. Most messaging did not distinguish between Medicaid and Marketplace coverage options.
Adapting messaging over time. In all four study states, messaging evolved toward the latter end of open enrollment to focus on the March 31st enrollment deadline and to highlight how consumers have benefited from new coverage options (Figure 3). For example, Connect for Health in Colorado launched a digital billboard that counted down the days until the end of open enrollment. Connecticut created a “Because I Got Covered” print campaign in English and Spanish to disseminate stories about how gaining health insurance helped a variety of different people and to encourage individuals to enroll before the deadline. Stakeholders in Washington also noted that they sought to create a sense of urgency to enroll by running new ads toward the end of open enrollment.
“I think the idea of creating a sense of urgency is always important if you want to get people to take action, especially on something where there’s a deadline…And a lot of our earned media outreach had to do with the deadline and pushing news out there about the deadline and we got our lead organizations out there pushing news on the deadline.” –Washington Marketplace Official
Figure 3: Messaging on Enrollment Deadline and the Benefits of Gaining Coverage.
Providing promotional materials for consumers. Stakeholders also noted that promotional materials were helpful tools to garner consumer interest and increase brand awareness for the Marketplaces. For example, Kentucky distributed reusable shopping bags that were extremely popular among consumers. The state gave away over 100,000 bags during open enrollment, including 22,000 bags over the course of 12 days at the state fair. The bags were branded with the kynect logo and caricatures, and had Marketplace contact information, including the website and call center phone number. Kentucky also gave away branded napkins and fans. During the summer before open enrollment, Connecticut Marketplace staff distributed sunscreen on the state’s beaches that had the Access Health CT logo and website address.
Outreach and Enrollment Initiatives
Broad branding and marketing efforts helped raise consumer awareness of new coverage options, and local level outreach and enrollment efforts played a pivotal role in educating consumers and encouraging them to enroll into coverage. Stakeholders highlighted several successful aspects of the study states’ outreach and enrollment efforts, including:
Conducting extensive outreach through numerous local avenues.Stakeholders in the four study states stressed the importance of conducting a broad range of outreach and enrollment initiatives at the local level and identified a variety of avenues where they successfully reached consumers, including churches, college campuses, beauty and barber shops, local grocery or community stores, libraries, extension centers, small businesses, and even people’s homes. They noted the importance of developing trust when reaching consumers through these avenues and of finding a local champion within each community to support outreach efforts. For example, in Connecticut, Navigators worked to engage local small businesses in outreach. To reach consumers in a rural farming community in Kentucky, one assister had a local farmer discuss the importance of insurance. The farmer’s ability to reference specific accidents that might happen on a farm for which it would be important to have health coverage resonated with the community. A number of community-based organizations noted that they promoted health coverage enrollment as part of a broader array of services they offer. In Washington, for example, one organization that provides meals and other services, such as counseling and employment referrals, to homeless and at-risk youth integrated healthcare enrollment into the package of services offered. Because of their existing relationships serving the community, these organizations were often viewed as credible messengers by consumers.
“We built teams of really highly performing assistors that were really good at enrollment and outreach. And we built these teams around our most critical zip codes…These teams would then do zip code specific outreach to small businesses. They hit every barber shop, every nail salon…every PTA meeting. They went to car dealerships and pizza shops and every little mom and pop shop in their zip code.” –Connecticut Marketplace Official . “You need to… find that local champion; so, for example, in my community where I grew up, that was my mother …. She set up for me to speak at her church and then stay afterwards and answer anyone’s questions. …Where my grandma lives, we set up an enrollment day at my grandma’s house…” –Kentucky Assister
Developing customized outreach materials and resources. Assisters indicated that they developed customized outreach materials and resources to better connect with the specific communities they serve and meet their specific cultural and linguistic needs. For example, in an area of Connecticut with a large Portuguese-speaking immigrant population, brokers and assisters created fact sheets in Portuguese. Similarly, an assister in Colorado who serves the African American community developed informational materials that focus on the importance of obtaining health coverage to address some of the specific health problems faced by African Americans. Assisters also developed customized tip sheets and checklists to help ensure that individuals had all the information they needed to enroll when they started an application.
“…In one of our flyers that we created just to advertise our site, we would list things that would help; please bring… your Social Security card, your driver’s license, your last pay stub, citizenship status….” –Colorado Assister
Reaching large groups of people through events and local media.In all four study states, local community events such as fairs and sporting events served as valuable opportunities for states and assisters to efficiently reach large numbers of people. For example, in Washington, the Marketplace built a phone charging station at a popular music festival and stationed assisters by it to reach out to young adults. The state also sponsored roller derby, minor league hockey, and select league soccer and football games. In Kentucky, Marketplace and Medicaid officials and assisters attended festivals and events throughout the state, including the state fair, where they distributed information about new coverage options and encouraged people to enroll (See Box 1). States and assisters also created their own enrollment events. For example, in Kentucky, the Marketplace promoted a “Sign-up Saturday” event at local libraries, during which assisters helped people enroll using the library computers. Assisters in Colorado also hosted group enrollment appointments at local schools and libraries. Additionally, in some cases, assisters used local media outlets to reach large numbers of consumers. For example, some assisters in Kentucky participated in a weekly call-in show on the local news station, during which consumers could call in with questions about coverage options.
Box 1: Using the State Fair to Promote Outreach and Branding in Kentucky
The state fair in Kentucky has been a tradition for over 100 years. The fair is held in August at the Kentucky Exposition Center and attracts about 600,000 people annually. The 2013 state fair and other festivals and large sporting events across the state served as a key opportunity to provide information about new coverage options to large numbers of people. Marketplace and Medicaid officials and assisters hosted informational booths at these events to raise awareness about the new coverage options available through kynect and initiate one-on-one conversations with interested consumers (Figure 4). Officials and assisters found that starting with the question, “Do you know somebody that doesn’t have health insurance?” was a highly effective way to initiate conversations with individuals at these events. In addition, one successful way they engaged consumers at these events was by giving away reusable kynect shopping bags. These popular, colorful bags included the kynect logo and the caricatures that appeared in ads and other kynect marketing and have been credited with successfully raising awareness of kynect and initiating a marketing buzz. In total about 100,000 bags were given away during open enrollment with 22,000 given out in the 12 days of the 2013 state fair. Replicating the logo and characters on t-shirts and even hot air balloons made it difficult to go anywhere in the state without hearing about kynect.
Figure 4: Kynect Informational Booth at the State Fair
“[The bags] were like gold. I mean they were just really pretty, colorful, and instead of us sitting there talking about healthcare, we’d say, ‘have you heard about kynect, let me tell you about kynect’ and then people would stop and listen, and ‘do you have health insurance,’…and if they said ‘yes, I have health insurance,’ ‘well do you have a child or do you have somebody that you know that doesn’t have?’ We made those connections and I think that that was one of our biggest success factors…. The state fair is getting ready to come up again in August. We’ll have a presence there. We’ll have a big booth.” –Kentucky Medicaid Official
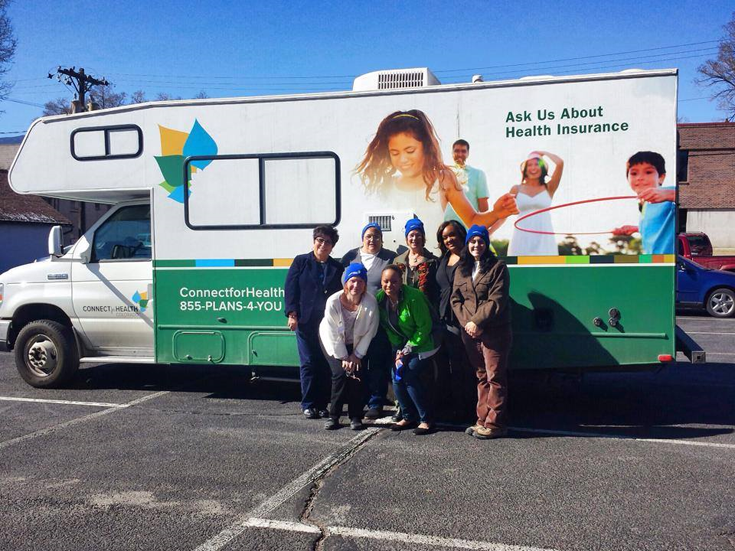
Going mobile with outreach.The four study states employed a number of successful mobile outreach and enrollment strategies to reach uninsured consumers in places where they live, work, and play. Marketplace staff in Colorado and Kentucky travelled across their respective states in branded Marketplace RVs to promote coverage and get people enrolled (Figure 5). Washington and Colorado also deployed street outreach teams to do targeted outreach. Staff from the King County Public Health Department in Washington used tablets to find and collect information from uninsured homeless individuals and submitted Medicaid applications on their behalf. In Colorado, outreach street team members used tablets to collect contact information from young adults and Latinos in heavily populated areas. They then forwarded the information to the Marketplace staff, which would follow up with individuals about next steps to enroll. Consumers who spoke with a street team member also immediately received a thank you email with information on where to obtain enrollment assistance. The outreach street teams in Colorado spoke with over 64,000 people in more than 230 locations, including community events, shopping areas, theaters, gyms, coffee shops, and on streets with heavy foot traffic. In Connecticut, Marketplace staff conducted outreach at grocery stores and other retail outlets prior to open enrollment. Contact information was collected from those who stopped by booths in these locations, and individuals were subsequently sent information on enrollment assistance and enrollment events in their area. The state ultimately enrolled about 25 percent of those with whom they spoke at the retail outreach sites.
Figure 5: Connect for Health Colorado Mobile Van
“So what we learned from the RV campaign was that when you did publicity, because we did press releases and we used our paid media channel, when we could promote the fact that we were going to be in certain communities for these opportunities…. people showed up, there were lines…” –Colorado Marketplace
Establishing walk-in enrollment sites.Marketplaces in Colorado and Connecticut provided additional opportunities for individuals to enroll in their communities by establishing walk-in enrollment sites. Access Health CT built storefronts in densely-populated urban areas to encourage people to walk in, collect information about coverage options, and obtain enrollment assistance from assisters or brokers. Data suggest that approximately 15,000 people visited the enrollment storefronts during open enrollment, and nearly 8,000 of them enrolled in coverage on the spot. Others obtained educational materials and often enrolled later. In March, Colorado opened five temporary walk-in enrollment sites in heavily populated areas that were staffed by Connect for Health Colorado and Medicaid agency staff, enrollment assisters, and insurance brokers. Nearly 3,000 people received help through these sites during the three weeks they were open.
Utilizing existing data to facilitate enrollment.Colorado, Connecticut, and Washington took up opportunities to get an early start on expanding Medicaid to adults prior to full implementation of the Medicaid expansion to adults in January. When the full Medicaid expansion took effect in January 2014, they automatically transitioned adults from these early expansion programs to the expansion. Colorado also enrolled more than 40,000 adults who were on the waitlist for the early expansion, which had limited enrollment. After enrollment began, Colorado also used data generated from the Connect for Health Colorado enrollment system to target outreach and enrollment efforts. Staff made outbound calls to individuals who started an account or application but did not complete enrollment to encourage them to enroll and refer them to local sources of enrollment assistance or a local enrollment event (See Box 2).
Box 2: Coordinating Targeted Outreach Campaigns with Local Enrollment Events in Colorado
In Colorado, Marketplace officials noted that one of their most successful outreach and enrollment initiatives was a series of targeted outbound campaigns from the Marketplace that directed individuals who had created a Marketplace account to local enrollment events. Over the course of open enrollment, the Marketplace generated lists of individuals who created an account but did not yet complete their enrollment into coverage. The Marketplace then conducted a series of outbound campaigns to these account holders to remind them to complete enrollment and direct them to sources of local assistance. When the Marketplace held an enrollment event in a specific community, it would reach out to account holders who had not completed in their enrollment in that community prior to the event to let them know about the event. They also used these campaigns to direct people to the temporary walk-in enrollment sites that were created in March and local enrollment events hosted by community partners and assisters. In total, the Marketplace made over 100,000 calls and sent over 500,000 emails to individuals who had created an account.
“What we would do is if we had an event that, say a broker group or an assistant site was having in a community, we would reach out directly to our account holders in that community and tell them about that… event. So, we did targeted outreach to our account holders and to potential customers to let them know about where they could get local assistance, when there was local assistance available.” –Colorado Marketplace Official
Engaging providers in outreach and enrollment efforts. Safety net providers were key partners in outreach and enrollment efforts since a large share of their patient populations are uninsured and eligible for the coverage expansions. Stakeholders noted that hospitals and community health centers played an important role in enrollment because they have existing relationships with their patients and their staff is often well-versed and experienced in communicating with their patients and with enrolling people into Medicaid and CHIP coverage. For example, in Kentucky, federally-qualified health centers conducted extensive “in-reach” to their uninsured patients to help enroll them in coverage. In addition, they helped enroll other uninsured individuals in the community. Similarly, a community health center in Washington reached out to uninsured patients in its service area by phone and email to encourage them to visit the clinic for help enrolling.
“The community health centers [sent letters] to their patient population that they knew were uninsured…they have this… audience that they know is uninsured… and they know who they are and they know how to reach them and they have staff who speak their language who are skilled in doing enrollments.” –Connecticut Assister
Consumer Assistance
Stakeholders in all four study states agreed that one of the most important elements of getting people successfully enrolled into coverage is personalized, one-on-one assistance provided through trusted individuals in the community. Within the study states, stakeholders identified a number of lessons learned about successful consumer assistance efforts including:
Recognizing that enrollment often requires time and education.Stakeholders noted that in order to develop trust and overcome misperceptions or fears about the ACA, individuals often require time and multiple touches from an assister. This was especially true among rural populations and immigrants. Since many newly enrolling consumers have limited experience with insurance, stakeholders indicated it is important to educate individuals about insurance and allow them time to familiarize themselves with what insurance is, what their costs would be, and various plan options. Given these consumer needs, successful enrollment of an individual or family sometimes requires multiple touches or visits with an assister.
“…Rarely does somebody walk in and an hour and a half later they walk out with a plan. It’s typically a series of many different appointments and hours spent.”–Colorado assister . “I think we acknowledged very early on… this… wasn’t going to be a big ad blitz and people were just going to miraculously sign up. People were going to really want to have their hand held…You can do some of that through the call center but I think people distinctively wanted to have the opportunity to do this in person.” –Connecticut Marketplace Official . “I think we achieved really good geographic distribution and then we also managed to really help serve specific targeted populations, which was also a goal…And then I was really happy to see that most of the state’s rural areas, they were all very much aware of the need for bilingual assistance and …looking at those vulnerable populations and rural areas as well.” –Colorado Marketplace official
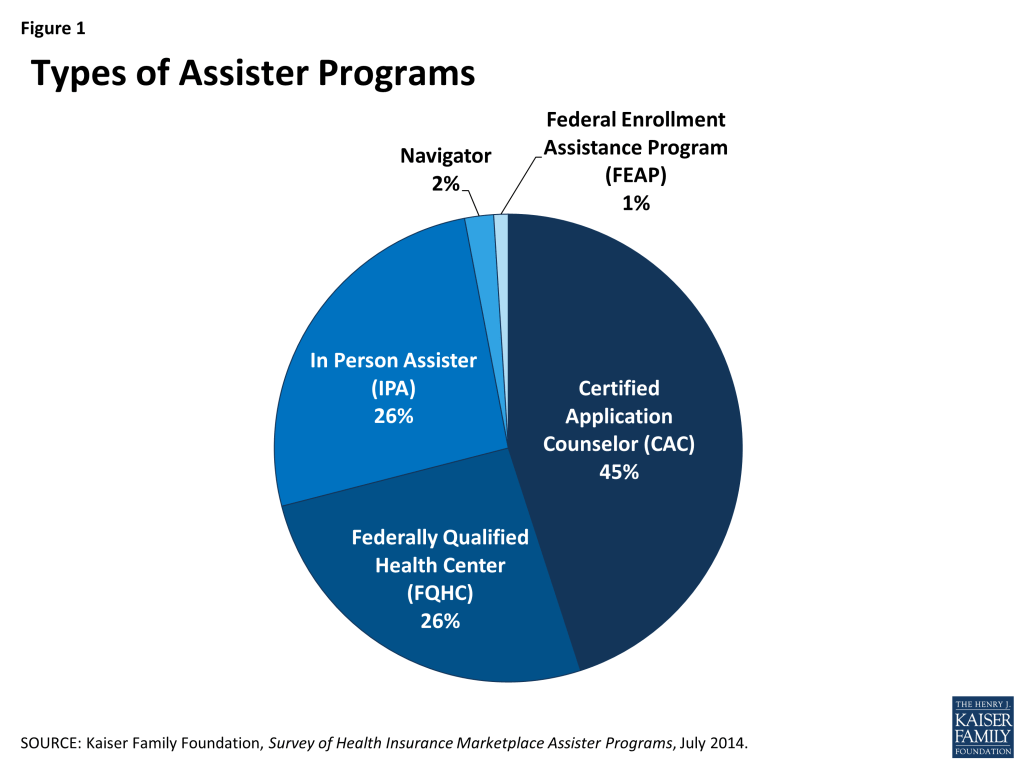
Recruiting a diverse group of assisters with ties to local communities. The study states established extensive consumer assistance networks that often drew on existing networks of assistance, including those providing Medicaid and CHIP enrollment assistance, health clinics, community-based organizations, hospitals, and advocacy organizations. Several different types of paid and volunteer assisters supported outreach and enrollment efforts, including Navigators, In-Person Assisters, and Certified Application Counselors.5 Assisters had varied backgrounds and were able to provide personalized assistance to the communities they served. In Connecticut and Washington, assister organizations were required to have bilingual staff that spoke the predominant languages of the areas in which they worked and who identified with the communities’ culture. For example, in Connecticut, the Hispanic Health Council was the lead assistance organization in a region with a predominantly Hispanic population. Some assisters also said that because of their personal ties to the community, local organizations, schools, and other groups were often willing to work closely with them and sometimes offered resources, such as space and equipment, to support enrollment.
Developing strong relationships between assisters and brokers.In addition to enrollment assisters, insurance brokers played an important role in enrollment. Washington estimates that brokers enrolled over 100,000 people into coverage during open enrollment, including one in ten new Medicaid enrollments. In Kentucky, roughly 40 percent of enrollments into qualified health plans were facilitated by insurance brokers. The Marketplaces in all four states undertook significant efforts to engage brokers in enrollment and, despite some early fears and concerns among brokers, a large number of brokers in the four study states were certified and often worked collaboratively with assisters to enroll uninsured people. For example, in a hospital in Connecticut, brokers and enrollment assisters worked together closely, with the brokers referring Medicaid questions to the enrollment assisters and the assisters often relying on the brokers to share details of plans or private coverage options. Similarly, in Colorado, where over 1,500 brokers and agents were trained and certified by the Marketplace, stakeholders noted that having brokers and enrollment assisters attend enrollment events together strengthened their efforts. An assister could help an individual complete the application and then a broker could help that individual make a plan choice. Some assisters noted that brokers were particularly helpful in assisting individuals with specific health needs such as HIV and diabetes. Because they often had more familiarity with the plans, brokers were well-equipped to advise consumers about which drug formularies and services were covered in each plan.
“Agents felt very threatened about it, so very early on, both the Commissioner of Insurance and our folks assured agents that they’re going to have a role and they’re going to have a very important role. And so when we set up the advisory broad, we established several subcommittees and one of them was a subcommittee called Agents and Navigators. …The idea was that we were going to put the two competing forces…together and see if we couldn’t work out some kind of agreed to relationship.” –Kentucky Marketplace Official
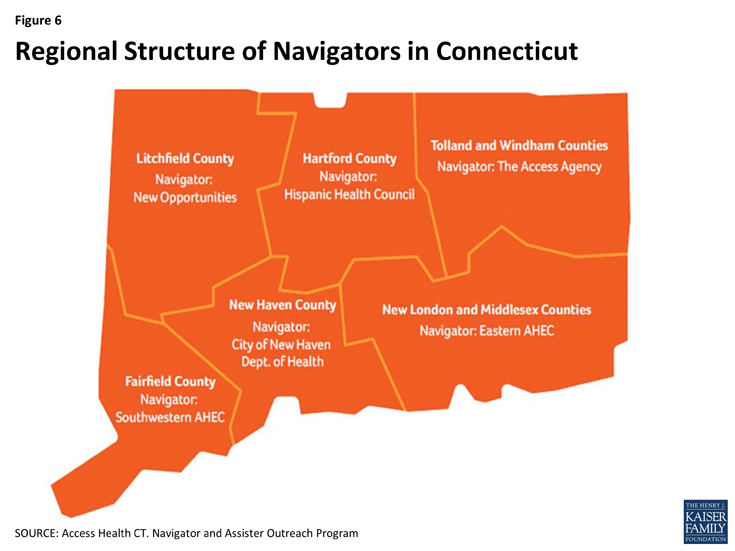
Coordinating assistance through a regional hub and spoke structure.All four states utilized a regionally-based hub and spoke structure to organize and coordinate assister activities. Within this model, several lead regional organizations helped organize and coordinate activities of assisters in their area, disseminate updates and information from the state to assisters, and provided feedback on implementation to the state. For example, Access Health CT divided the state into six regions and assigned Navigator organizations to oversee the work of assisters in each area (Figure 6). In some states, broader coalitions of stakeholders also helped coordinate and organize activities. For example, in Louisville, the local Board of Health established an outreach and enrollment coalition that coordinated efforts, shared best practices, and provided feedback on experiences in the field to the state. Similarly, in Colorado, an existing statewide coalition served as a liaison between on-the-ground assisters and the Medicaid agency and Marketplace. The coalition was valuable for sharing information between assisters and state officials to help address issues that arose during open enrollment. Assisters in Kentucky and Connecticut also used shared online calendars to indicate where and when they were planning events, which helped prevent gaps and overlaps in outreach and enrollment efforts.
Figure 6: Regional Structure of Navigators in CT
“We had a lead organization run point on that region of the state. And within those lead organizations that were selected for the respective regions…they had to demonstrate how they were going to set up a network that was going to be able to help them reach goals as it related to enrollment and assistance and outreach…and it had to include outreach [in] different languages, different backgrounds, depending on where they were…There was a lot of creativity provided by these lead organizations and they did a really good job.” –Washington Marketplace Official
Providing readily available support to consumer assisters.All four study states established resources for assisters and brokers to obtain support when they had questions or needed assistance while helping a consumer. Assisters had dedicated telephone lines to reach call center staff, which helped reduce long waits when they needed support. Colorado and Connecticut had several Marketplace staff members dedicated to addressing assister needs and questions. At the launch of open enrollment, the staff held daily phone calls with assisters to provide updated information on processes and obtain feedback, which was used to continually improve processes and systems. The staff was also readily available by phone or email to help assisters with complex cases, website problems, and other issues. In Connecticut, the Marketplace placed staff, called Navigator Coordinators, in each of the regional lead consumer assistance organizations. These coordinators had greater access to the eligibility system than Navigators or assisters and could help troubleshoot technical problems. Marketplace staff in Connecticut also organized monthly meetings of regionally-based assisters to share best practices, coordinate events, and discuss strategies for reaching particular populations. In Washington, the Marketplace sent weekly emails to lead assistance organizations to communicate key lessons, responses to questions, and the status of system fixes and also hosted weekly calls. Kentucky also maintained close and regular communication with assisters to both share updates and information and receive feedback on implementation.
“I really love the people that work with Assistance Network of Connect for Health Colorado; they are really responsive, they are really open, and they know their stuff…. During open enrollment they hosted weekly support calls with all the health coverage guides and application counselors and… whenever somebody had a question or an issue it got resolved right then and… whenever I send them an email… it always gets responded even when if it’s.. 8 pm or 10 pm….” –Colorado Advocate
Expanding call center capacity and creating tiered assistance levels.Stakeholders in all four study states noted that their Marketplace and Medicaid call centers were an important resource for consumers. Because of early technological challenges with the enrollment portals, the call centers became a primary resource to answer consumer questions, take phone applications, and work through glitches. Consumer demand for the call centers exceeded expectations early during open enrollment. In Washington, for example, the Marketplace call center anticipated receiving about 2,500 calls per day but averaged between 8,000 and 10,000 calls daily. The states enhanced capacity to respond to this increased demand by training and hiring more staff, contracting with additional vendors, extending call center hours, and creating tiered levels of assistance so calls could be directed based on what type of assistance a caller was seeking. For example, consumers seeking information would be routed to different staff than those attempting to complete enrollment via the phone.
“…Nobody, I mean nobody anticipated the demand or volume of calls or even the length of the calls.”–Kentucky Marketplace Official
Systems and Operations
The study states took different approaches to building their enrollment systems and faced varying degrees of early technological challenges. The effectiveness of the study states’ enrollment systems and the states’ ability to quickly respond to technological challenges also contributed to their enrollment successes. In addition, stakeholders identified certain aspects of state policies and program operations that helped promote coverage efforts. Elements highlighted by stakeholders included:
Developing close working relationships between staff and contractors and setting realistic expectations for the system builds. Stakeholders stressed that close collaboration among policy staff, IT systems staff, and contractors were vital during both the initial builds of the system and on an ongoing basis to manage systems and quickly resolve problems. Connecticut had Marketplace staff dedicated to working with contractors to monitor their work and track their progress. In all four states, contactors were co-located on site with state policy and IT staff to facilitate close and constant communication. Moreover, stakeholders stressed the importance of setting reasonable expectations for system capabilities, recognizing that enhanced features can continue to be added over time. For example, Access Health CT limited the extent of features it planned to include halfway through its system build to focus on core functions.
“It’s an excellent relationship. I mean [the IT contractor] is right here in this building…they got 45 staff here that work with our staff…and we’re all located here in this building, which is very important so if we have an issue… we just go down the hall to see what’s going on, and we meet with them regularly, so they’ve been a great partner.” –Kentucky Marketplace official . “Creating disciplined processes [was important]. So figuring out what you can do well and what you can’t….For example, in January of 2013, we rolled back by 30 percent what we had originally asked [the contractor] to build for us in the fall of 2012. That was the most important decision we made. If we had kept with our original plan, I’m not sure we would have been up and running. –Connecticut Marketplace official
Building effective enrollment systems with consumer-friendly features. Kentucky and Washington built single, integrated eligibility systems for Medicaid and Marketplace coverage. This allowed for a streamlined enrollment process that did not require any transfers of applications between programs. Moreover, consumers only receive a single notice of their determination rather than separate notices from each program, which minimized confusion. Stakeholders indicated that, while these systems faced some early technological glitches, and the states continue to work through problems, they worked well for most consumers, particularly toward the end of open enrollment. The systems are also able to make real-time determinations for most cases and can handle complex situations in which members of a family may be eligible for different types of coverage. Colorado and Connecticut maintained two separate systems for Medicaid and Marketplace coverage and faced some challenges coordinating enrollment between the two systems. However, as described below, through workarounds and ongoing system improvements, they were still able to enroll people successfully. Stakeholders also highlighted certain features of systems that proved particularly valuable. For example, in Kentucky and Connecticut, stakeholders highlighted a pre-screen feature that allows consumers to anonymously shop for coverage after answering a few quick questions, as well as the ability to electronically upload documentation when it is required.
“It’s a one stop shop. You know, it takes maybe 30 to 45 minutes. You enter your information. If you’re Medicaid eligible, you pick a Medicaid managed care organization. If you’re QHP eligible, you pick a qualified health plan. So, certainly that one stop shop streamlined application process I think really attributed to our success.” –Kentucky Marketplace Official
Implementing workarounds and incremental fixes to quickly address enrollment system problems. Stakeholders noted that although all of the study states faced early problems with their enrollment systems, they implemented workarounds and solutions that allowed them to continue to enroll people. For example, in Washington, assisters used paper applications during the early part of open enrollment while the system was experiencing problems. Similarly, in Colorado, consumers were redirected to the call center to complete applications during the initial launch of open enrollment as full functionality for the Marketplace system was still being established. Connecticut is still continuing to work to improve the process to transfer applications from the Marketplace to Medicaid, but in the interim is sending notifications to providers advising them that individuals determined eligible for Medicaid through the Marketplace can access services before they receive a benefit card. All states also created workarounds to address system glitches that affected some immigrant families, people formerly involved in the criminal justice system, and those in other complex family situations. Beyond implementing workarounds, the states made ongoing improvements to their systems throughout open enrollment to fix problems as they were identified. For example, the Medicaid agency in Colorado established a flexible contract with its vendor that provided dedicated time for system fixes to be implemented each week.
“One thing that I think [the Medicaid enrollment system] did really well is that, when they realized that there was some sort of… problem or barrier for people, they changed things.” –Colorado Advocate
Using data and feedback loops to identify and respond to needs as they were identified.Medicaid and Marketplace officials in the study states received frequent enrollment data updates that helped them identify any problems with their enrollment systems and target outreach and enrollment efforts. For example, in Connecticut, the Marketplace shared regular data updates on enrollment by zip code with regionally-based assisters to help them target their community-based outreach efforts. Similarly, the study states obtained regular feedback from assisters and community-based organizations and quickly responded to any implementation issues they identified. For example, Colorado launched a statewide brand awareness campaign in English and Spanish, but learned that the Spanish messaging was not resonating with consumers. In response, the Marketplace quickly organized a stakeholder group meeting and brought in the translation firm to create revised materials that would better connect with the Spanish-speaking community.
“…We had staff… that monitored the system. We had what we called our command center…where we would watch all the statistics so, how many applications, is the system up, what’s our capacity? We even monitored the call center at the command center…. The first of order of business was to determine if there is some kind of a system error that’s going on here; is this a user error that’s going on so, and as we got complaints about things…you build up this tracking system or this ability to see what kind of changes need to be made.” –Kentucky Marketplace official
Collaboration and Leadership
Promoting coverage efforts through strong leadership. Stakeholders in the study states noted that there was strong leadership for their coverage efforts. For example, in Kentucky, the Governor made successful implementation of the coverage expansions a priority, and this leadership carried down through state officials. Stakeholders reported that Marketplace and Medicaid officials were highly engaged and personally committed to achieving success and were often present at outreach and enrollment events. Similarly, stakeholders in Colorado and Washington noted that implementation of the ACA built on earlier state health reform efforts that created streamlined Medicaid enrollment policies and helped establish a culture of coverage in the state.
Collaborating with key stakeholders. In addition to strong leadership, the study states cited close collaboration between stakeholders as a key contributor to their success. In Kentucky, all state agencies involved in health reform implementation, including Medicaid, the Marketplace, and the Department of Insurance are peer agencies housed within the Kentucky Cabinet for Health and Family Services. Stakeholders indicated that this structure helped promote strong working relationships among the agencies and that they worked hand-in-hand throughout planning and implementation of the coverage expansions. Stakeholders in Colorado also indicated that close collaboration between the Medicaid agency, Marketplace, and Department of Insurance was important and noted that an interdepartmental website was developed to share information with consumers. In addition, in all four states, advocates and community-based organizations were engaged early and often throughout planning processes and implementation. For example, in 2012, Connecticut began a series of town hall meetings called “Healthy Chats” and invited advocates, insurance carriers, and other relevant stakeholders to learn about progress in implementation and share feedback.
“We have weekly stakeholder meetings over at [the Marketplace]. It gets us all in a room and it’s a lot harder to fuss when you’re looking at somebody because we’re all peer agencies. We’re all under the same umbrella but it’s easy to get frustrated. If you all get in a room once a week it’s hard to stay frustrated because you just ask the questions and work through things. I think they’ve been very effective.” –Kentucky Medicaid Official . “I would say the foundations of our success from an outreach, communications, and marketing standpoint are that we had a strong foundation of working with stakeholders and we continued to be committed to that process to today. So every policy decision that the Board made, we had stakeholder discussions…before they made their decisions. So from a policy prospective, from an operational prospective, but also from an outreach and communications prospective they were at the table.” –Colorado Marketplace Official
Issue Brief: Current And Future Priorities
To build on their successes and lessons learned from the past open enrollment period, the study states were looking ahead to make continued improvements and focus on new priorities related to helping newly covered people understand how to use their health insurance and access needed care.
Enrollment and renewal
Educating consumers about continued Medicaid enrollment and Special Enrollment Periods for Marketplace coverage. Stakeholders indicated that now that open enrollment has ended, they are focused on making sure that consumers know they can still enroll in Medicaid and may qualify for a Marketplace special enrollment period. Assisters are playing a key role in spreading this message and some of the states are conducting outreach with this information (Figure 7). Medicaid and Marketplace staff also noted plans to continue outreach to groups such as graduating students and new mothers who may be Medicaid eligible or able to enroll through a special enrollment period.
Figure 7: Messaging on the Special Enrollment Period in Washington
Reaching remaining eligible but uninsured. Although all four study states successfully enrolled a large number of people in coverage, stakeholders recognized that there remain eligible individuals that they were not able to reach and enroll and are focused on identifying strategies to reach these consumers. In all states, Medicaid and Marketplace staff indicated that they are in the process of collecting more detailed information on who enrolled, including data on race, ethnicity, and language. Some also are conducting surveys to learn about consumers’ experiences enrolling. Staff indicated that they plan to analyze data to gain a better sense of who the remaining eligible but uninsured are in their state and determine the best strategies to reach them. Stakeholders highlighted several hard-to-reach groups whom they plan to target through specific outreach efforts during the next open enrollment periods, such as veterans, the LGBTQ community, individuals with limited English proficiency, young adults, and justice-involved populations. Marketplace staff in all states are also focused on increasing enrollment of small businesses in their Small Business Health Options Program (SHOP).
“Once we get a firm sense for sort of who we just enrolled, that leads to the next question which is, well, who’s still left? And we’d like to go back out to the Marketplace and then try to assess what the uninsured rate currently looks like and then who those people are.” –Connecticut Marketplace Official
Supporting continuity of coverage. Stakeholders are also focused on ensuring that individuals who enrolled in coverage maintain it. Connecticut, Kentucky, and Washington are already conducting Medicaid renewals through their new integrated enrollment systems. Based on early data that suggested that the renewal rates in Washington after this change were lower than expected, the state implemented a multi-pronged renewal reminder system, which helped raise renewal rates to pre-ACA implementation levels (See Box 3). Medicaid staff in Colorado indicated that they are still in the process of determining how they will conduct Medicaid renewals and are seeking to make the process as automated as possible. State officials in Colorado noted that they provided enrollees a pre-populated renewal form prior to ACA implementation and would continue to renew based on existing information unless a consumer reported a change in circumstances. The states are also exploring options to remind consumers about maintaining coverage. Connecticut began doing robo-calls to individuals not paying premiums, and Washington is considering sending text and email renewal reminders for Medicaid beneficiaries.
Box 3: Facilitating Retention in Washington through a Multi-Pronged Reminder System
In late 2013, the Washington Health Care Authority implemented a multi-pronged renewal reminder system to promote retention among Medicaid and CHIP enrollees and facilitate the transfer of their electronic accounts into the new Washington Healthplanfinder eligibility system. In 2014, all Medicaid and CHIP enrollees in Washington must complete their annual renewals by submitting a new simplified application to the Healthplanfinder online, through the mail, or in person. The Washington Health Care Authority, concerned that enrollees may not be familiar with this new process, began sending reminder letters 60, 40, and 20 days prior to enrollees’ scheduled renewal date with information about how to renew and how to obtain help from community-based organizations. Enrollees also receive a reminder call. Individuals who do not successfully renew by their renewal date receive a letter explaining that to continue receiving coverage, they may mail in a tear-off stub at the bottom of the letter using a self-addressed postage pain envelope (included with the letter), send an email, or call a designated toll-free hotline.
As of March 2014, nearly 417,000 renewals had been successfully completed in the new Washington Healthplanfinder portal and renewal rates have not reached a level consistent with what they were pre-ACA implementation. State officials credit the multi-pronged approach with increasing public awareness of the need to renew coverage and are looking forward to 2015, when most renewals occur through electronic matches with existing data sources and without the need for consumers to take any action.
“I think we all knew to a degree, that this conversion was a big lift…The renewal process of the future is going to be a much simpler, more passive process for the enrollee, with the auto data match capacity of the Exchange.” –Washington Medicaid Official
Continuing enrollment system upgrades. All four study states continually improved the functionality of their enrollment systems throughout the open enrollment period and plan continued improvements and enhancements moving forward. Colorado is planning to move to a single integrated system for Medicaid and Marketplace determinations and to add more features, including electronic uploads of documentation. Kentucky is moving all Medicaid determinations, including disability-based determinations, as well as those for other social service programs, to its new system. It also plans to enhance the plan browsing experience for consumers by incorporating estimated premium tax credit subsidies into the prices they view. Washington is building the ability for Medicaid enrollees to enroll in a managed care plan through the Marketplace portal instead through the separate Medicaid system. Connecticut is continuing work to upgrade its Medicaid system to allow for greater coordination with the Marketplace. The Connecticut Marketplace also recently launched an enrollment app for smartphones and tablets, based on data collected indicating that large shares of individuals enrolled on smartphones and tablets. Colorado launched its mobile app in 2013 and is working to enhance its functions for the next open enrollment period.
Consumer Assistance
Enhancing training and support for assisters. Stakeholders in all four study states generally indicated that it will be important to enhance and improve training for assisters for the next enrollment period to address gaps in knowledge and improve their ability to handle complex cases. For example, some assisters emphasized a need for more hands-on training with the eligibility portal. Given that a large number of assisters in Connecticut had prior experience in Medicaid, some suggested they would benefit from increased training on private coverage and strategies to convey information about premiums and cost sharing to enrollees. Conversely, brokers and other assisters indicated a desire for more training on Medicaid, and, in Colorado, both Medicaid and Marketplace officials indicated that they plan to incorporate more information on Medicaid into the training sessions. Some stakeholders also suggested that combined training sessions with assisters and brokers would beneficial and allow them to share tips and other information. Finally, a few assisters noted that, because many consumers are continuing to rely on them for other types of assistance beyond enrollment, it would be helpful to incorporate additional professional development training into curricula, including modules on effective documentation, conflict resolution, cultural competency, and how to access other social services. Beyond enhanced training, stakeholders also indicated that it will be important to continue to develop the technical assistance and support made available to assisters to make sure they have readily available access to help that can answer questions, assist with complex cases, and help resolve any technological related enrollment problems.
Ensuring adequate consumer assistance. Stakeholders also agreed that one-on-one in-person assistance will remain essential for the next open enrollment period, especially for targeting hard-to-reach populations. However, there are uncertainties about future funding for existing assisters, and contracts in some states have ended or are scheduled to end in early 2015. Several of the assister groups stressed that it would be important to recertify and continue to fund organizations that played a central role in assistance during the first open enrollment period given that they have already developed trusted relationships with individuals in the community and learned many lessons that they could employ in the future. Because assisters are also providing significant post-enrollment assistance to consumers, advocates noted that continued funding, training, and support for these individuals will be important to ensure that newly enrolled individuals are able to access care and renew coverage. While decisions about funding for assisters are not yet final, Marketplace staff in Connecticut indicated that they are trying to collect best practices from the most successful assisters to disseminate more broadly. Both state officials and advocates also noted that brokers will also likely continue to play an important role in helping individuals enroll into coverage. Looking ahead to the next open enrollment period, states are also planning for larger call center capacity and developing strategies that will allow them to adjust capacity to accommodate surges in enrollment.
Access and Utilization of Care
Increasing health insurance and health care literacy. Stakeholders in all four study states heavily stressed that one of the biggest priorities they are facing is helping newly covered individuals gain a better understanding of how health insurance works and how to access needed care. In Colorado, Medicaid and Marketplace officials are developing messaging and videos for consumers to educate them on how to use benefits as well as seasonal messaging related to health and wellness. Medicaid staff in Washington developed a First Timers Guide to Washington Apple Health, which instructs new enrollees on how to use their benefit cards and how a health plan works, and includes answers to some frequently asked questions, including how to find a primary care provider or make an appointment. In Connecticut, Marketplace officials are working with local foundations to develop some materials relating to health insurance literacy and launch a campaign encouraging people to “own their own health.” Assisters and brokers also have developed their own materials, including pamphlets and flyers in languages appropriate for the specific populations they serve and indicated that they continue to help consumers understand their plans, benefits, and notices they receive from Medicaid and the Marketplace.
“There’s a responsibility we have to get people to understand what insurance is; what it does; what it means. Stop the average person on the street, they don’t know what a co-pay is; they don’t know what a deductible is…So we’re going to be doing a lot of messaging around that because what we realize is we’re creating a whole new group of consumers who maybe don’t have a true understanding of what they’ve gotten or how to use it.” –Connecticut Marketplace Official . “The education around using your coverage, accessing care, getting assigned a primary care provider, how to work with your plan when it’s appropriate and how to work with us when it’s appropriate. That will continue…It is going to be an ongoing, continual process.” – Washington Medicaid Official
Supporting access to care for the newly insured. Stakeholders in the study states also noted that they are focused on ensuring that the gains in coverage lead to improvements in access to care. In Kentucky, early insights show that newly insured individuals have increased access to specialist care, prescription drugs, and behavioral health and substance abuse services. Kentucky also broadened Medicaid coverage for behavioral health and substance use disorder services, which stakeholders noted will be key services for many newly covered individuals. Medicaid officials in Colorado noted that they currently are heavily focused on provider recruitment for increase access for its growing base of enrollees. Moreover, some providers in the study states indicated that they are engaged in efforts to help get newly enrolled individuals connected to primary care services. For example, one community health center in Washington established a tracking system that allows have health center staff to schedule a primary care appointment for individuals as soon as they enroll. Using funding from internal reserves, the health center is also modifying assisters’ roles to allow them to call and conduct follow-up and home visits with enrollees about missed appointments to determine if there are other barriers such as lack of transportation that prevent them from obtaining preventive care. Similarly, an assister in Washington that serves at-risk youth recently received grant funding for a pilot project to help homeless youth enroll in coverage and select a health plan, and then provide staff to accompany individuals to their first doctor’s visit to help with care coordination. Further, the primary hospital system in Waterbury, Connecticut, which served as one of the largest assisters in the region, has implemented a system to coordinate care for newly enrolled beneficiaries (Box 4, next page).
Box 4: Coordinating Enrollment and Care Among Providers in Waterbury, Connecticut
The Waterbury hospital system serves the greater Waterbury area, which includes 19 towns in the eastern region of Connecticut and has among the highest uninsured rates in the state. During open enrollment, the hospital system built upon its previous experience serving the uninsured by enrolling uninsured patients in new health insurance coverage options and connecting them to care. In 2004, the hospital received grant funding to hire case managers to coordinate care for the uninsured, develop a shared database, and enroll eligible individuals into Medicaid and CHIP. Under the ACA, the hospital trained additional staff in two emergency rooms, a federally-qualified health center, and two hospital outpatient clinics to identify uninsured patients as they seek care and provide one-on-one enrollment assistance. Assisters also conducted outreach in homeless shelters and churches in the region.
During open enrollment, assisters within the Waterbury hospital system enrolled more than 1,000 people into coverage, and as patients enrolled in coverage, case managers provided education about using services and helped connect them to primary care. Now that open enrollment has ended, assisters continue to help uninsured patients enroll into Medicaid and CHIP and are collecting information on those who missed the Marketplace open enrollment period but may be eligible to purchase private coverage to do targeted outreach to them during the next open enrollment period
“It wasn’t just signing up people for insurance …we really say when we engage someone is; we want you to be able to get healthcare and get it in the right way.” –Assister in Waterbury Hospital, Connecticut
Maintaining safety net provider capacity. Safety net providers are facing significant changes as the ACA coverage expansions are implemented. As a result of the coverage expansion many of the patients they serve may gain coverage, which will increase their ability to obtain reimbursement for services. However, as patients gain coverage and access to a broader array of providers, safety net providers also indicated the need to adopt strategies to remain competitive and maintain their patient base, such as upgrading facilities and rebranding themselves. Moreover, with the increases in coverage, they face new demands to enhance their administrative capacity to bill to multiple insurers. Some stakeholders also noted concerns about potential decreases in grants and other sources of funding for safety net providers, since funders may believe there is a decreased need for these funding sources because of increased reimbursements stemming from coverage gains.
Conclusion
Although all states faced challenges during the first open enrollment for new Marketplace coverage, data show that as of April 2014 over 8 million individuals had enrolled in coverage through the Marketplaces and more than 6 million were added to the Medicaid program from before open-enrollment. While all states took different approaches to implementing the ACA, this report highlighted experiences in four states that achieved significant success in reaching and enrolling individuals into coverage, which provide important lessons learned and guidance for other states.
Each state implemented innovative approaches that contributed to this success; however, it is also clear that there was not one single strategy, but rather a combination of strategies related to marketing and branding, outreach and enrollment, consumer assistance, and systems and operations that supported successful coverage efforts. Underlying all of these strategies, strong leadership and close collaboration across stakeholders were also hallmarks for success. Finally, the ability to be nimble and make adjustments along the way as issues and problems were identified and recognized was an important lesson learned. From marketing to staffing call centers to reaching the uninsured to launching new enrollment systems, nearly all states hit some road blocks, but one of the keys to success in these states was the ability to quickly implement adjustments, fixes and workarounds.
Looking ahead, states have a number of consistent priorities for their current work and the next open enrollment period. Key priorities include a continued focus on enrollment and renewal, particularly related to education about ongoing Medicaid enrollment and special enrollment periods for the Marketplaces, maintaining coverage for those that have successfully enrolled, reaching those who remain uninsured, and maintaining an adequate network of consumer assistance. These states also are planning continued upgrades and enhancements to their enrollment systems and consumer assistance training programs to address outstanding limitations and gaps. However, one of the most significant priorities currently facing states is increasing consumer knowledge and understanding of health insurance and supporting access and utilization of care among the many individuals who have newly gained coverage.
This brief was prepared by Samantha Artiga, Jessica Stephens, and Robin Rudowitz from the Kaiser Family Foundation and Michael Perry from PerryUndem Research and Communication. The authors extend their deep appreciation to the state officials and other stakeholders for sharing their time and experiences to inform this project.
Appendix
Appendix Table 1: Selected Data on Demographics and Health Coverage in Colorado, Connecticut, Kentucky and Washington
COLORADO
CONNECTICUT
KENTUCKY
WASHINGTON
POPULATION & DEMOGRAPHICS
Total Nonelderly Population (2011-12)1
4.5 million
3.0 million
3.7 million
6.0 million
Distribution of Nonelderly Population by Race/Ethnicity (2010-11)1
White
69%
69%
84%
68%
All People of Color
31%
31%
16%
32%
Black
4%
10%
8%
4%
Hispanic
21%
14%
4%
4%
Asian
3%
6%
1%
10%
Other Race/Ethnicity
2%
1%
2%
6%
Nonelderly Non-Citizens (2010-11)1
9%
13%
5%
14%
Nonelderly with Limited English Proficiency, 20112
6%
8%
2%
8%
Share of Total Population Living in a Non-Metropolitan Area1
Data Not Available
4%
43%
6%
Share of Total Population Living in Poverty, (2011-12)1
16%
21%
19%
19%
Median Annual Household Income (2009-11)3
$59,803
$67,165
$42,331
$59,370
UNINSURED
Uninsured Rate Among Nonelderly (2011-12)1
17%
15%
24%
17%
Nonelderly Uninsured (2012-13)4
737,000
286,000
647,000
948,000
Share Eligible for Medicaid4
46%
38%
54%
47%
Share Eligible for Tax Credit Subsidies4
22%
25%
22%
23%
Share Ineligible for Financial Assistance4
33%
38%
23%
23%
MEDICAID & CHIP
Medicaid/CHIP Eligibility Limits as a Share of the FPL5
2013
2014
2013
2014
2013
2014
2013
2014
Children
250%
265%
300%
323%
200%
218%
300%
317%
Pregnant Women
250%
265%
250%
263%
185%
200%
185%
198%
Parents (in a family of three)
106%
138%
191%
201%
57%
138%
71%6
138%
Childless Adults (for an individual)
20%
138%
70%
201%
0%
138%
0%6
138%
Change in Medicaid and CHIP Enrollment, Summer 2013 to April 20147
263,452
Data Not Available
265,091
364,724
34%
32%
33%
MARKETPLACE
Marketplace Name
Connect for Health CO
Access Health CT
Kynect
WA Healthplanfinder
Portal Languages
English and Spanish
English
English and Spanish
English and Spanish
SHOP Marketplace in 2014?
Yes
Yes
Yes
In 2 counties
Number of Insurers Participating in Individual Marketplace8
10
3
3
8
Number of Individuals Who Selected a Plan, as of April 20149
125,402
79,192
82,747
163,207
Marketplace Enrollees as Share of Potential Marketplace Population, as of April 201410
25%
37%
27%
32%
1KCMU/Urban Institute estimates based on 2011-2012 ASEC Supplements to the CPS.2 KCMU/Urban Institute analysis of 2010 American Community Survey.3U.S. Census Bureau, Current Population Survey, 2009 to 2011 Annual Social and Economic Supplements.4 Kaiser Family Foundation analysis based on January 2014 Medicaid eligibility levels and 2012-13 CPS.5 Eligibility limits for parents and other adults include income disregards for 2013 and the standard 5 percentage point of the FPL disregard for 2014. Based on a national survey conducted by the KCMU and the Georgetown University Center for Children and Families, 2013 and Based on data from the Centers for Medicare and Medicaid Services (CMS), State Medicaid and CHIP Income Eligibility Standards Effective April 1, 2014.2014.6 In Washington, prior to the ACA, adults with income up to 133% FPL were eligible for more limited coverage under the state’s’ Basic Health waiver.7CMS, Medicaid & CHIP Monthly Applications, Eligibility Determinations, and Enrollment Reports: March 2014 (Updated) and April 2014; accessed June 4, 2014.8Kaiser Family Foundation analysis of insurance company rate filings.9KCMU analysis of Health Insurance Marketplace: Enrollment Reports. Office of the Assistant Secretary for Planning and Evaluation (ASPE), Department of Health and Human Services (HHS); November 2013 – April 2014.10Based on data from Health Insurance Marketplace: March Enrollment Report, October 1, 2013 – April 19, 2014, Office of the Assistant Secretary for Planning and Evaluation (ASPE), Department of Health and Human Services (HHS); May 1, 2014 and State-by-State Estimates of the Number of People Eligible for Premium Tax Credits Under the Affordable Care Act, Kaiser Family Foundation, November 5, 2013.
Endnotes
KCMU analysis of Health Insurance Marketplace: Enrollment Reports. Office of the Assistant Secretary for Planning and Evaluation (ASPE), Department of Health and Human Services (HHS); November 2013 – April 2014 ↩︎
CMS, Medicaid & CHIP Monthly Applications, Eligibility Determinations, and Enrollment Reports: March 2014 (Updated) and April 2014; accessed June 4, 2014. ↩︎
CMS, Medicaid Moving Forward. State Medicaid and CHIP Eligibility Standards as of April 1, 2014. ↩︎
In addition, Connecticut, Colorado, and Kentucky established small business Marketplaces (SHOP) for businesses with 50 or fewer employees to search for plans for their employees. As of 2014, the Washington SHOP Marketplace was only available to individuals in small businesses in two counties. ↩︎
For more information, see: KFF, Helping Hands: A Look at State Consumer Assistance Programs Under the Affordable Care Act. September 2013. ↩︎
2013 brings a mixed story for donor government funding to address the HIV epidemic in low- and middle-income countries. Funding commitments fell to US$8.07 billion, a 3% drop from 2012. The drop is primarily due to decreasing annual commitments by the United States government, the largest donor to HIV in the world. At the same time, disbursements (resources made available to the field) increased in 2013 to US$8.46 billion (8% over 2012), largely the result of a 2013 spending acceleration by the U.S. government of accumulated prior-year funding commitments (the U.S. is the only government carrying such substantial balances forward); without this acceleration, disbursements would have been essentially flat. Several donor governments also increased their contributions to the Global Fund to Fight AIDS, Tuberculosis and Malaria (Global Fund), representative of a recent shift from bilateral HIV to multilateral channels. Even with increasing disbursements in 2013, there still remains a gap between available resources and estimated need. In addition, future funding remains uncertain – U.S. bilateral HIV commitments have declined in recent years, and are currently below 2008 levels, and there is a diminishing pipeline of prior-year funding.
The Joint United Nations Programme on HIV/AIDS (UNAIDS) and the Kaiser Family Foundation have been tracking bilateral donor government assistance for HIV in low- and middle-income countries as well as contributions to the Global Fund and to UNITAID by the 29 donor government members of the Organization for Economic Co-operation and Development’s (OECD) Development Assistance Committee (DAC) since 2002 and this report presents the most recent data available.
Key findings include:
In 2013, the most recent year for which there are data, donor government commitments for HIV fell to US$8.07 billion, a 3% drop from 2012. The drop is primarily due to decreasing annual bilateral funding commitments by the U.S. government. At the same time, disbursements for HIV increased by nearly US$600 million (an 8% increase) to US$8.46 billion (see Figure 1), largely the result of the U.S. accelerating disbursement of bilateral funding from prior years. Without the U.S. increase, disbursements would have remained essentially flat.
In addition to the U.S., four of the 14 governments assessed (Australia, Denmark, France, and the U.K.) also increased disbursements for HIV in 2013, compared to 2012, although increases by Denmark, France and the U.K. follow prior year declines bringing their 2013 totals back to earlier funding levels. Five donor governments (Germany, Ireland, Norway, Sweden, and the European Commission) remained constant (after exchange rate fluctuations are taken into account), and three other governments decreased funding (Canada, Italy, and Japan). While HIV assistance from the Netherlands also decreased, it was due to a shift in support from bilateral HIV funding to the Global Fund.
The U.S. was the largest donor in 2013 (US$5.6 billion) accounting for approximately two-thirds (66.4%) of donor government disbursements for HIV. The U.K. was the second largest donor (10.0%) followed by France (4.8%), Germany (3.4%), and Denmark (2.3%).
While most international assistance for HIV is provided bilaterally (US$6.4 billion or 76%), five donor governments provided a majority of funding in 2013 through multilateral channels (Global Fund and UNITAID): France (88%), European Commission (81%), Canada (70%), Japan (69%), and Germany (53%). Looking more broadly over the past several years, many donors appear to be shifting an increasing share of their HIV assistance from bilateral programs to the Global Fund. As the Global Fund provides support for three diseases – HIV, TB, and malaria – this could result in a decreasing share of funding for HIV over time.
In 2013, several donor governments provided a greater share of funding to HIV than their share of the world’s GDP: the U.S., the U.K., Sweden, and Denmark. However, when standardized by the size of their economies (GDP per US$1 million), Denmark ranks first followed by the U.S., the U.K., Sweden, and Ireland.
UNAIDS estimates that global HIV funding available from all sources – domestic public and private spending, donor government bilateral assistance, multilateral organizations and private philanthropic aid disbursements – totaled US$19.14 billion in 2013.1 However, this remains well below the projected need to address HIV of US$22 to US$24 billion by 2015.2
UNAIDS, preliminary estimate of resources available from all sources, 2014. This estimate includes domestic expenditures (public and private) for all low- and middle- income countries, including five countries that transitioned into high income levels in 2013. ↩︎
UNAIDS, 2013 UNAIDS Report on the Global AIDS Epidemic, September 2013. ↩︎
What’s Trending in Health Care? Conservative Ideas
In his latest column for The Wall Street Journal’s Think Tank, Drew Altman cuts through the political debate and reviews how some ideas conservatives like are taking hold in the American health system.
Programs in States Running Their Own Marketplaces Helped People at Twice the Rate as Those in Federal Marketplace States
An estimated 10.6 million people nationally received personal help from navigators and assisters during the Affordable Care Act’s first open enrollment period, finds a new Kaiser Family Foundation survey of navigators and assister programs nationally.
The survey estimates that the 4,400 assister programs operating nationally had an estimated 28,000 full-time staff and volunteers, suggesting each assister would have helped more than 370 people on average during the six-month open enrollment period that ran from October 1 through March 31.
The 2014 Kaiser Family Foundation Survey of Marketplace Assister Programs is the first nationwide assessment of the number and type of assister programs and the number of people they helped. It examines the kinds of issues assisters helped consumers with, their experiences with the enrollment process, and their thoughts for improving such efforts during the 2015 open enrollment period.
Assister programs in states with their own marketplaces provided help directly to 325 people per 1,000 uninsured residents, about double the ratio helped in states relying on the federal marketplace (162 people per 1,000 uninsured), and somewhat more than in states with a state-federal partnership marketplace (276 people per 1,000 uninsured residents). The gap reflects significant differences in the number of assisters across states.
About one in eight (12%) assister programs said consumer demand for their help far outpaced their capacity throughout the open enrollment period. That share grew to one in four (24%) during the surge at the end of March as open enrollment ended.
Almost 90 percent of assister programs said that most consumers who sought their help were uninsured, and three quarters of programs say most struggled to understand health insurance terms such as “deductible” or “network service.”
Programs typically spent between one and two hours helping each consumer. Often, consumer questions about health plans couldn’t be answered by information posted on marketplace websites, and wait times for call-center assistance also slowed the process.
At least four out of five assister programs reported that most or nearly all the 10.6 million consumers they served sought help because of their limited understanding of the ACA, because they needed help understanding their plan choices, and because they did not feel they could apply on their own.
Assister programs also reported challenges in answering consumer questions or resolving problems. The challenges reported as most difficult to resolve by the largest share of programs include helping consumers with online technical difficulties, helping consumers understand plan choices, and helping consumers with a limited understanding of the ACA.
The survey was designed and analyzed by researchers at the Kaiser Family Foundation and was conducted online from April 24 through May 12 among assister programs nationwide, included navigators, certified application counselors, federally qualified health centers and other recognized programs; 843 out of 4,445 programs responded. The margin of sampling error is plus or minus 4 percentage points for the full sample. For results based on subgroups, the margin of sampling error may be higher.
The Affordable Care Act (ACA) provides for a substantial new infrastructure of consumer assistance in health insurance. All state Marketplaces are required to have Navigators and other similar Assister Programs to help consumers understand their coverage options, apply for assistance, and enroll. In addition, comprehensive State Ombudsman or Consumer Assistance Programs (CAPs) are established under the ACA to provide a full range of help – outreach and enrollment assistance as well as help with post-enrollment problems such as appealing denied claims – to all state residents in all types of group and non-group health plan coverage. Throughout the first Open Enrollment period, public attention focused on the number of people who would enroll in qualified health plans (QHPs) offered through the Marketplace and in Medicaid. People will continue to enroll in coverage throughout the year, and even more people are projected to enroll next year, but the close of Open Enrollment affords an opportunity to examine the role of Assister Programs in helping people to enroll and remain enrolled in coverage.
This report is based on findings from the 2014 Kaiser Family Foundation survey of Health Insurance Marketplace Assister Programs. This internet survey was conducted from April 24 to May 12, 2014, shortly after the first Open Enrollment period concluded. Federal and state-operated Marketplaces provided email contact information for directors of their Assister Programs, all of whom were invited to participate. This report examines the experience of Assister Programs across the states in conducting outreach and enrollment assistance during the first Open Enrollment period for health insurance Marketplaces established by the ACA. Based on responses to this survey extrapolated to the total number of Assister Programs, this report offers the first nationwide assessment of the number and type of Assister Programs and the number of people they helped. This report also examines the nature of help consumers needed, both pre- and post-enrollment, and the extent to which Assister Programs could meet consumer needs. In addition, it discusses key factors that impacted the effectiveness of Assister Programs at the outset and the outlook for consumer assistance in the future.
More than 4,400 Assister Programs, employing more than 28,000 full-time-equivalent staff and volunteers, helped an estimated 10.6 million people during the first Open Enrollment period.
Assistance resources were not evenly distributed across states. In states with State-based Marketplaces (SBM) and Consumer Assistance Partnership Marketplaces (FPM), there were about twice as many Assisters available per 10,000 uninsured, compared to states with a Federally-facilitated Marketplace (FFM). The number of people helped per 1,000 uninsured was also greater in State and Partnership Marketplaces; SBMs helped about twice as many people relative to the uninsured population compared to FFMs, while FPMs helped about 1.5 times as many relative to the uninsured population. Some people who were helped enrolled in new QHPs, and some in Medicaid and CHIP. Others who sought help didn’t enroll in coverage, for example, if they were ineligible for both Medicaid and premium tax credits.
During the first year more than 70% of Assister Programs were supported privately or by a federal safety net clinic program.
Under the ACA, Marketplaces are required to support consumer assistance through operating revenue. All Marketplaces did directly support Assister Programs in 2013-2014, but of all Assister Programs established in the first year, most were funded by sources other than Marketplaces. Certified Application Counselors (CAC) Programs, which generally receive no Marketplace funding, and Programs sponsored by federal health centers funded by grants from the Health Resources and Services Administration (HRSA) together account for 71% of all Assister Programs and account for more than 60% of people who received help.
Overwhelmingly, Assister Programs report people sought help because they simply do not understand the ACA or health insurance and lacked confidence to apply on their own.
Many consumers in search of health insurance sought a more human touch to find their way through the enrollment process. Over 80% of Assister Programs report most or nearly all consumers who sought help didn’t understand the ACA or the coverage choices offered them or simply lacked confidence to apply on their own. Almost 90% of Programs report the majority of consumers they helped were uninsured. Almost three-quarters of Programs say most consumers who sought help struggled to understand even basic health insurance terms such as “deductible” or “network service.” Balky web sites also drove consumers to Assister Programs, as did the application process itself, which can require understanding of the tax code, immigration rules, or family law, depending on a person’s circumstances. Also, because most Marketplaces have not yet completed the single streamlined application that determines eligibility for all forms of subsidized coverage, many consumers sought help obtaining Medicaid eligibility determinations.
Helping consumers was not always an efficient process and took a significant amount of time per case.
Sixty-four percent of Assister Programs reported spending between one and two hours helping each consumer, on average. Explaining rules and options to people with limited understanding of the ACA and health insurance took time. So did waits on hold with Marketplace call centers and frozen computer screens. Programs also report that often consumer questions about health plans couldn’t be easily answered by information posted on Marketplace web sites.
Ninety percent of Assister Programs have already been re-contacted by consumers with post-enrollment questions and problems.
Post-enrollment problems range from consumers not having received their insurance card, to not understanding how to use new health insurance or how to appeal a denied claim. Most Marketplace Assisters are not trained to help consumers appeal denied claims or resolve problems with insurers. Instead, they are supposed to refer consumers to state ombudsman or CAPs, also established by the ACA. CAPs are funded by federal grants, though the last grants were awarded in 2012 and, as a result, some CAPs have stopped providing services and some others are operating at reduced levels. Many Marketplace Assister Programs appear to be unfamiliar with CAPs, even where they are still operating. When Assister Programs encounter post-enrollment problems they can’t help with, they mostly refer consumers to the Marketplace call center or back to their health plan.
Assister Programs believe some key changes could help them work more effectively.
Assister Programs that collaborated with others reported this coordination to be very helpful, though more than half of Assister Programs seldom or never coordinated with other Programs. When coordination did take place, it was most often initiated by Assister Programs themselves or facilitated by outside groups, less often by the Marketplaces. Programs report coordination was useful for directing consumers to the nearest Program with available appointments, in strategic planning of enrollment and outreach events, in sharing specialized staff (such as those who could provide interpreter services), and in troubleshooting and problem solving on complex cases. Some State-based Marketplaces also made dedicated call centers for Assisters, and built Assister portals into their online application system so that Programs could track clients’ status. Programs reported that these features also helped them to work more efficiently.
Three-quarters of Assister Programs say it is very likely they will continue to provide Marketplace assistance next year.
Prior to the first Open Enrollment, 30% of Assister Programs had no prior experience helping consumers and just 16% had experience helping consumers enroll in private health plans. Because so many Assister Programs expect to continue operating next year, the level of experience will likely increase going forward. If Marketplaces continue to invest in resources to support Assister Programs, there could develop a profession of expert Assisters who understand consumer needs and how ACA rules and coverage options apply to them.
Assister Programs will likely play a key role in determining how much enrollment grows in 2015.
The Congressional Budget Office has projected that 13 million people could enroll in Marketplace health plans in 2015, 5 million more than signed up during the first Open Enrollment period. Increasing enrollment will first require maintaining coverage for current enrollees. Many people may need help re-applying for coverage or subsidies. Others with post-enrollment problems may need help resolving them in order to decide if coverage is worth maintaining. Some Assister Programs were already stretched to capacity in 2014. For the first Open Enrollment period overall, most Programs could help most of the people who sought help most of the time. Close to 40% of Programs, though, said they could not help all who sought assistance, with 12% saying demand far outpaced capacity. During the final weeks of Open Enrollment almost half of Assister Programs had to turn away at least some consumers.
Enrolling millions of new consumers also presents challenges. Public understanding of the ACA remains limited. If the first wave of enrollment in 2014 was comprised of those consumers who were the most resourceful and motivated to seek coverage, then investment in consumer assistance will be all the more key in the year to come.
About the Assister Programs Described in this Report
Several types of Assister Programs provide outreach and enrollment assistance to individuals, families, and small businesses seeking to obtain health insurance coverage through new Health Insurance Marketplaces and through the Medicaid expansion available in some states. In this report, we use the following terms to describe different types of Assister Programs.
Navigator refers to Assister Programs that contract directly with the U.S. Centers for Medicare & Medicaid Services (CMS) to provide free outreach and enrollment assistance services to consumers in FFM and in FPM states.1,2 Under the ACA, Navigators must conduct public education and outreach, help consumers apply for subsidies, facilitate enrollment in qualified health plans (QHP), and provide consumers with fair and impartial information about their QHP options. In addition, Navigators must refer consumers to applicable state ombudsman or Consumer Assistance Programs (CAPs) for help with any grievance, complaint or question about coverage once enrolled. Navigators must complete 20-30 hours of federal training to become certified; in some states additional state training requirements apply. CMS also requires Navigators in FFM and FPM states to periodically report data on their activities and performance. Under the ACA, Navigators must be funded by grants from Marketplace operating revenue. However, because there was no operating revenue as of the first Open Enrollment period, CMS funded Navigators out of their pool of other implementation funds. For Fiscal Year 2014, CMS awarded $67 million in federal grants to federal Navigators in 34 states (29 FFM and 5 FPM states).
In Person Assister (IPA) refers to Assister Programs that contract directly with SBMs or FPMs to provide free outreach and enrollment assistance. The duties and standards for IPAs generally mirror those of Navigators. This category of Assister Program was created through federal regulations to allow SBMs and FPMs to use federal exchange establishment grants to fund Assistance Programs.3 In later years, these Marketplaces, like all others, will be required to fund Navigator Programs out of Marketplace operating revenue. Unlike Navigators, which operate under a standard set of rules across states, there is more variation in the size, structure, and functions of IPA Programs. In some states, IPAs are paid on a per-enrollment basis, while in other states they are funded through grants. Additionally, in some states IPAs provide both outreach and enrollment assistance while in other states their primary responsibility is enrollment assistance. In some states, IPA Programs are also called Navigators; however, for purposes of this report, they are categorized as IPAs. For Fiscal Year 2014, 17 SBM and 5 FPM states together allocated over $100 million for their IPA Programs.
Certified Application Counselor (CAC) refers to an Assister Program that is recognized by a Marketplace as a trained Assister but that does not receive direct funding from a Marketplace. CACs also must provide assistance to consumers free of charge. Under federal rules, the duties of CACs are less extensive than that of Navigators or IPAs. In particular, CACs are not required to engage in outreach, though many do. Training requirements for CACs are also less extensive than for Navigators or IPAs. States have flexibility to require additional standards for CACs. CAC Programs must register with the Marketplace and must ensure that their individual Assisters follow applicable standards. Although not funded by the Marketplaces, many CAC Programs received funding from outside sources.
Federally Qualified Health Center (FQHC) refers to Assister Programs operated by health centers that receive federal funding to provide comprehensive primary care services. These health centers have a mission to treat anyone regardless of their ability to pay; as a result, their patients are primarily low-income and many are uninsured. Health centers also have a long history of helping patients apply for Medicaid, the Children’s Health Insurance Program (CHIP), or other coverage. In July 2013, HRSA awarded $150 million to 1,159 health centers in every state and DC to facilitate enrollment of uninsured people into new coverage options available under the ACA. In December 2013, HRSA awarded an additional $58 million in one-time funding to support the anticipated surge in demand for enrollment assistance. In addition, HRSA awarded $6.4 million to state and regional Primary Care Associations (PCA) to provide technical assistance and other support to FQHC Assister Programs. Some FQHC Assister Programs also applied to be Navigators or IPAs and received additional direct funding from Marketplaces. For purposes of this report, all FQHCs are categorized as FQHC Assister Programs even if they also served as Navigators or IPAs.
Federal Enrollment Assistance Program (FEAP) refers to Assister Programs that contracted with CMS to provide supplemental enrollment assistance services within FFM and FPM states in select communities with large numbers of uninsured. Duties and requirements of FEAPs are similar to those of federal Navigators, except that FEAPs provide “surge” assistance. Most have rolled back staff and operations since Open Enrollment ended. In the fall of 2013, CMS awarded contracts totaling $37.5 million to two organizations to establish FEAPs in 13 states.4 FEAP contracts were for one year, with an option for CMS to elect a second year of work by the end of July 2014.
In addition to Marketplace Assister Programs, the ACA authorized creation of state-based ombudsman programs, also called Consumer Assistance Programs, or CAPs. CAPs offer eligibility and enrollment assistance to all state residents, those seeking to enroll through Marketplaces as well as people covered under large employer plans and other non-Marketplace coverage. CAPs also help consumers resolve questions and problems with health coverage once they are enrolled – including appealing denied claims on consumers’ behalf – and health plans must include notice about CAP help on all explanation of benefit (EOB) statements. Under the ACA, Navigators and other Marketplace Assister Programs are required to refer consumers to CAPs for help with such post-enrollment problems. Thirty-five state CAPs were established with federal grants in 2010. Subsequent funding awards were made in 2011 and 2012, but none since. Many CAPs continue to operate, though some at reduced levels. In addition, some CAPs are working as Navigators, IPAs, and CACs. This report discusses coordination with CAPs by other Assister Programs.
Key Findings: Section 1: Characteristics Of Assister Programs
In all, more than 4,400 Marketplace Assister Programs were established to help consumers during the first Open Enrollment. This total is based on Program data provided by all state and federal Marketplaces. Certified Application Counselor Programs (CACs) account for the largest number of Assister Programs, representing 45% of the total Programs and operating in most states. These Programs are likely most numerous because they faced fewer requirements to get started, needing only to complete the online training and register with the Marketplace. Programs sponsored by Federally Qualified Health Centers (FQHCs) accounted for 26% of total Assister Programs and operated in every Marketplace. Another 26% of Assister Programs are In Person Assisters (IPAs) operating in states with State-based Marketplaces (SBMs) and Consumer Assistance Federal Partnership Marketplaces (FPMs). While Navigators, which operated in states with a Federally-facilitated Marketplace (FFM), represented only 2% of the total number of Assister Programs, they were more likely to subcontract with other organizations. As a result, the total number of organizations that operated as Navigators is likely somewhat greater than this figure suggests (Figure 1).
Figure 1: Types of Assister Programs
Health care providers, including FQHCs and hospitals, along with non-profit community-based organizations sponsored the majority of Assister Programs. Although a variety of organizations decided to develop and implement Assister Programs, FQHCs and other health care providers sponsored 43% of Assister Programs nationwide. Provider organizations have long played a role in connecting consumers to coverage so it is perhaps not surprising that they signed up in large numbers. Nonprofit community service organizations sponsored another 38% of Assister Programs nationwide. State and local agencies make up about 8% of Assister Programs, though these mostly operate in states that elected to expand Medicaid eligibility. Churches, legal aid organizations, colleges and universities, and trade associations also sponsored Assister Programs (Figure 2).
Figure 2: Types of Organizations that Sponsored Assister Programs
Most Assister Programs (70%) report having some prior experience providing consumer assistance. Two-thirds of Programs had experience helping people enroll in Medicaid and CHIP prior to Open Enrollment. Just over one-quarter of Programs had helped consumers with post-enrollment health coverage problems, such as denied claims. Only 16% of Programs had previously helped consumers enroll in private health insurance. Nine percent reported experience helping with tax preparation or filing for tax subsidies (Figure 3).
Figure 3: Programs with Prior Experience Helping Consumers
Most Assister Programs served specific geographic areas or targeted population groups. Just 13% of Assister Programs operated in a statewide service area, the rest served more targeted regions or populations.5 Programs that contracted directly with Marketplaces (Navigators, IPAs and FEAPs) were somewhat more likely to report statewide service areas. This is likely because Marketplaces sometimes favored applicants who would operate statewide. Most Assister Programs also operated independently, but one-in-five worked as part of a formal network or coalition of sub-contracting organizations. Navigators, IPAs and FEAPs were more likely to operate as part of a formal coalition (Table 1).
Assister Programs varied in size and in the number of consumers they helped. The majority of Programs have a small staff; 71% have five or fewer full-time-equivalent (FTE) staff (paid or volunteer), while 5% of Programs have more than 20 FTE staff. CACs were more likely than other Assister Programs to have small staffs, with 81% reporting fewer than five FTEs. CACs were also more likely to rely primarily on volunteers (18% vs. 2% for FQHCs and 9% for other Programs).
Almost half of all Assister Programs report providing eligibility and enrollment assistance to no more than 500 people during Open Enrollment, with 20% of Programs helping 100 or fewer people. The CAC Programs were most likely to report helping smaller numbers of people; only 19% of CAC Programs said they helped more than 1,000 people. By contrast, 67% of FQHC Programs and 36% of other Marketplace Assister Programs reported helping more than 1,000 people during Open Enrollment.
Table 1. Assister Programs by Size, Service Area, and Numbers of People Helped
Program Characteristics
All Assister Programs
Program Type
CAC
FQHC
IPA, Navigator, and FEAP
Independent vs. part of a coalition
Independent
72%
76%c
73%c
64%
Part of a coalition
20%
16%
17%
28%ab
Don’t know/No answer
8%
8%
9%
8%
Statewide vs. specific geographic service area
Statewide
13%
12%
8%
18%ab
Specific area within state
85%
86%
88%
81%
Other
2%
2%
4%
2%
Paid staff vs. volunteer
Most/all volunteers
11%
18%bc
2%
9%b
Most/all paid staff
89%
82%
98%
91%
Number of full-time-equivalent staff and volunteers
5 or fewer
71%
81%bc
63%
64%
6-10
16%
9%
25%ac
18%a
11-20
7%
6%
6%
9%
21-50
3%
1%
3%
6%a
More than 50
2%
<1%
1%
4%b
Don’t know/No answer
1%
1%
1%
<1%
Number of consumers helped during Open Enrollment
100 or fewer
20%
33%bc
1%
17%b
101-500
29%
35%b
16%
31%b
501-1,000
14%
14%
15%
14%
1,001-2,500
17%
10%
33%ac
13%
2,501-5,000
10%
6%
17%ac
9%
More than 5,000
10%
3%
17%a
14%a
No answer
1%
<1%
1%
<1%
a indicates a statistically significant difference from CAC, p<.05b indicates a statistically significant difference from FQHC, p<.05c indicates a statistically significant difference from IPA, Navigator, FEAP, p<.05NOTE: Numbers may not sum to 100% due to rounding.
Assister Program budgets were mostly modest. Thirty percent of all Assister Programs report having an annual budget of $50,000 or less.6 Almost as many Programs (26%) had annual budgets between $50,000 and $200,000. Only 5% of Programs reported annual budgets larger than $500,000. CACs tended to have the smallest Program budgets compared to other types of Assister Programs7 (Table 2).
CACs were most likely to rely on re-programmed resources from their sponsoring organization or on other private sector support. FQHCs relied more heavily on grants from HRSA, while Marketplace Assister Programs (IPAs, Navigators and FEAPs) relied more heavily on direct payments from the Marketplaces.
Table 2. Assister Program Budgets and Sources of Funding, FY 2014
All Assister Programs
by Program Type
CAC
FQHC
IPA, Navigator, FEAP
FY 2014 Program budget
Up to $50,000
30%
46%bc
9%
25%b
$50,001 – $200,000
26%
16%
45%ac
25%a
$200,001 – $500,000
9%
3%
13%a
15%a
$500,001 – $1,000,000
4%
1%
2%
11%ab
More than $1,000,000
1%
0%
1%
3%
Don’t know/No answer
29%
33%
29%
22%
a indicates statistically different from CAC, p<.05b indicates statistically different from FQHC, p<.05c indicates statistically different from IPA, Navigator, FEAP, p<.05Numbers may not sum to 100% due to rounding.
Programs receiving most (>50%) of budget from this funding source*
Grants or other direct payment from Marketplace
24%
20%†b
7%
51%ab
Grants from HRSA, other federal agency
30%
14%c
81%ac
4%
Grants or payments from other state agencies
8%
6%
4%
19%ab
Grants from private foundations
6%
8%
1%
4%
Grants from other outside private sources
2%
5%
0%
0%
Funds re-programmed from sponsoring organization’s own budget
22%
41%bc
5%
14%b
† Though not required to do so, some SBMs provided funding for CAC Assister Programs.a indicates a statistically significant difference from CAC, p<.05b indicates a statistically significant difference from FQHC , p<.05c indicates a statistically significant difference from IPA, Navigator, FEAP, p<.05*Percentages reflect Programs responding. Numbers do not sum to 100% because not all Programs received most funding from single source.
Assister Programs engaged in a range of activities during Open Enrollment. Virtually all Assister Programs reported providing eligibility and enrollment help to consumers, helping them apply for private health insurance and subsidies, as well as Medicaid and CHIP coverage when these options were available. Over 80% of Programs also provided outreach and education to individuals and families. These outreach efforts were important to making sure consumers understood what their coverage options were and how to apply for financial assistance.
After eligibility and enrollment assistance and outreach to individuals, the next most-often named activity (named by 77% of Programs) was helping consumers with post-enrollment questions and problems, such as denied claims. More than half of Programs also reported helping people appeal eligibility determinations. Only about one-third of Assister Programs engaged in outreach and enrollment assistance to small businesses (Table 3).
Table 3: Assistance Activities Conducted by Assister Programs
Activity
% Programs
Help individuals apply for premium tax credits and cost sharing subsidies
91%
Help individuals apply for Medicaid/Children’s Health Insurance Program
88%
Help individuals compare private health insurance plan (QHP) options
83%
Outreach and public education to individuals and families
82%
Help individuals with post-enrollment questions and problems (e.g., denied claims)
77%
Help individuals with appeals of eligibility determinations
59%
Help individuals apply for exemptions from the individual responsibility requirement
50%
Help other Assister Program staff resolve questions or problems for their clients
49%
Help individuals apply for other public benefits and services
47%
Outreach and public education to small businesses
31%
Help employees of small businesses enroll in health coverage
28%
Key Findings: Section 2: How Many Assisters Are There And How Many People Did They Help?
Based on numbers of staff reported by Assister Programs, we estimate all Programs combined employed at least 28,000 full-time equivalent (FTE) staff and volunteers to provide assistance across the country. In addition, we estimate this cadre of trained Assisters together helped 10.6 million people apply for coverage and financial assistance during the Open Enrollment period from October 1, 2013 through the end of April, 2014. These estimates were derived by extrapolating survey responses (on how many full time equivalent staff worked for Assister Programs and how many people Programs helped) to data on the number of Assister Programs nationwide collected from the Marketplaces.
The estimated number of consumers helped includes those who ultimately enrolled in QHPs as well as those determined eligible for Medicaid and CHIP, both in states that expanded Medicaid coverage and in states that did not. This number also includes individuals who received assistance applying for coverage even if they fell into the “coverage gap” in states not expanding Medicaid – meaning they had income too low to qualify for premium tax credits (which are only available at incomes between 100% and 400% of the federal poverty level) and were also not eligible for Medicaid – and others who did not enroll in coverage for other reasons (Appendix Table 1).
Key Findings: Section 3: How Assistance Was Distributed Across State Marketplaces
Of the estimated 28,000 Assisters, 47% worked in the 16 states and the District of Columbia with an SBM, 45% worked in the 29 states with a FFM, and 9% worked in the five states with a FPM. The distribution of the U.S. uninsured population across state Marketplaces is somewhat different. Only 33% of the uninsured live in SBM states, while 62% live in FFM states, and 6% live in FPM states (Figure 4).
Figure 4: Distribution of Assisters vs. Uninsured Population Across Marketplaces
As a result, FFM states, on average, had about half the number of Assisters per 10,000 uninsured compared to FPM states and SBM states (Figure 5).
Figure 5: Number of Assisters Relative to Uninsured Population across Marketplace Types
The number of people helped by Assister Programs was similarly distributed across Marketplaces. We estimate a total of 5.0 million people were helped in SBM states, 4.8 million in FFM states, and 0.8 million in FPM states. Expressed relative to the uninsured population in these types of Marketplaces, an estimated 325 people received help per 1,000 uninsured living in SBM states and 276 people per 1,000 uninsured in FPM states. By contrast, 162 people per 1,000 uninsured are estimated to have received help in FFM states (Figure 6).
Figure 6: Number of People Helped Relative to Uninsured Population across Marketplace Types
Key Findings: Section 4: Why Did Consumers Seek Help?
Many consumers in search of health insurance sought a more human touch to find their way through the enrollment process. Assister Programs report that, in large numbers, consumers sought help because they didn’t understand the ACA, didn’t understand health insurance, or lacked confidence to apply for coverage and financial assistance on their own. Assister Programs also report that consumers struggled with web site outages, subsidy eligibility rules based on the tax code, and breakdowns in communication between Marketplace systems and Medicaid agencies. Marketplace call centers couldn’t resolve all problems over the phone and significant numbers of consumers lacked internet service at home (Figure 7). For these and other reasons, consumers sought help from Assister Programs.
Figure 7: Top 10 Reasons Consumers Sought Help
Most who sought help were uninsured. Almost 90% of Assister Programs say most or nearly all of their clients were uninsured at the time they sought help (Figure 8).
Figure 8: Consumers Seeking Help Who Were Uninsured
Many who sought help also had limited health insurance literacy. About three-quarters of Assister Programs said that most or nearly all clients who considered buying private coverage needed help understanding basic insurance terms and concepts such as “deductible” and “in-network service” (Figure 9).
Figure 9: Consumers Needing Help Understanding Basic Insurance Concepts
Eligibility and enrollment assistance is time-intensive. More than 60% of Programs report that eligibility and enrollment assistance required, on average, one to two hours per person. For another 23% of Programs, the average time spent helping an individual exceeded two hours. Only 13% of Programs report taking less than one hour, on average, to help each person (Figure 10).
Figure 10: Average Time Assister Programs Spent Helping Each Client
Demand for consumer assistance sometimes exceeded capacity. For the first Open Enrollment period overall, most Assister Programs found they had enough staff and other resources to help most people who sought help most of the time. Close to four in ten Assister Programs, though, report they could not help all who sought assistance; 12% said the demand for help far exceeded their capacity to provide it.
In the last few weeks of Open Enrollment, when over three million people enrolled in QHPs, capacity was further strained.8 One in four Assister Programs report demand for help far outpaced their capacity to provide it during the final two weeks of Open Enrollment (Figure 11).
Figure 11: Demand for Consumer Assistance vs. Assister Program Capacity
Helping consumers overcome web site problems posed the greatest challenge for Assister Programs. Just like consumers, Assister Program staff often had difficulty overcoming Marketplace web site problems. Sometimes Assisters could figure out workarounds to bypass online glitches. (For example, faced with persistent problems getting clients through the online application identity verification process, Assisters learned that entering a client’s data in all capital letters could often resolve the problem.) Even so, Assister Programs faced many online technical difficulties. Figure 12 shows the consumer problems and questions Assister Programs found most difficult to resolve.
Figure 12: Consumer Problems Identified by Assister Programs as Most Difficult to Resolve
Shortcomings in available health plan information hindered the ability of Assister Programs to help consumers evaluate QHPs. Another common challenge had to do with the quantity and quality of health plan information available through the Marketplace. Eighty-nine percent of Assister Programs report that at least some of their clients who considered QHPs had questions that weren’t easily answered by information posted on the Marketplace web site; 41% said this was often or almost always a problem for their clients (Figure 13). This finding varied little by Marketplace type or Program type.
Figure 13: QHP Questions Not Answered by the Marketplace Website
To provide better support for consumers evaluating QHP options, 39% of Assister Programs would like to receive more training on the health plans offered in their Marketplace (Appendix Table 2). In response to open ended questions, Programs also expressed hope that Marketplaces will develop more health plan rating tools and online plan comparison tools. Some Assister Programs reported that they received briefings by insurance companies on the health plans they offer and found this very helpful. Other Programs recommended that Marketplaces provide Assisters with more comprehensive QHP information (or require insurers to provide it), and that Marketplaces require insurance companies to make dedicated help lines available to Assister Programs. Some Programs partnered with insurance brokers and agents, who often have access to additional plan information and marketing materials; Programs that did so reported these types of partnerships were helpful.
Explaining ACA requirements to consumers was most difficult for one in four Assister Programs. This likely reflects the complexity of new ACA eligibility rules and processes, generally. It may also reflect unique complexities for populations targeted by some Assister Programs – for example, immigrant populations or families with mixed-eligibility status. Some Programs sought help from outsiders with specialized expertise – for example, tax preparers, immigration advocates, or family lawyers – and when they did so, generally found these partnerships very helpful.
Immigration verification and other identity verificationproblems were encountered less often by Assister Programs, but when these problems arose they could be challenging. Twenty-two percent of Programs cited immigration-related problems as the most difficult to help with. For example, some immigrants who did not have established credit ratings had difficulty proving their identity and establishing a Marketplace account. Others encountered “the yellow screen of death,” a term Assisters used to describe a web site crash triggered when Marketplace computers and Department of Homeland Security computers could not communicate effectively. Some low-income immigrants who had been living in the U.S. less than five years had difficulty applying for coverage when the Marketplace determined they should be eligible for Medicaid, even though immigrants in this situation cannot enroll in Medicaid and are supposed to be offered premium tax credits instead. Eventually CMS established a “limited circumstances special enrollment period (SEP)” for immigrants who received incorrect eligibility determinations due to system errors so that they would have a chance to re-apply for private coverage and subsidies.9
Programs also report difficulty resolving identity verification problems for consumers. Nearly one in five Assister Programs reported these cases were the most difficult to help. (Figure 12) Such problems could arise among young adults with no established credit history. The Marketplaces relied on a commercial credit rating company to automatically verify consumer identification; if people with no credit history could not pass the online system, they would have to provide paper documents to prove their identity before they could complete applications.
Problems with Medicaid and CHIP eligibility determinations also proved challenging for some Assister Programs. Though the ACA requires a single, streamlined application system for all insurance affordability programs – whether private plan subsidies, Medicaid, or CHIP – this was not operational in most states for the first Open Enrollment period. In addition, the FFM had ongoing technical difficulties transmitting consumers’ application data to state Medicaid programs.10
Nine in ten Assister Programs have already seen clients with post-enrollment problems. Within days after the first Open Enrollment ended, nearly all Assister Programs reported consumers were already returning to seek help with post-enrollment problems. Some of these problems had to do with consumers not yet having received their new insurance cards or their first premium invoice from the health insurer. But other post-enrollment problems related to consumers not understanding how coverage works. Programs have also been contacted for help resolving denied claims, out-of-network claims, or deductible and co-pay expenses that consumers can’t afford to pay (Figure 14).
Figure 14: Percent of Assister Programs Observing Post-enrollment Problems as of Early-May
Nearly all Assister Programs report they will try to help consumers with denied claims, disputes with insurers, and other such post-enrollment problems, even though most lack training in this area (Appendix Table 2), and even though they are not required to do so. The ACA requires Marketplace Assisters (Navigators, IPAs, and FEAPs) to refer consumers with post-enrollment problems to state CAPs.
Under the ACA, State Consumer Ombudsman or CAPs are established to provide comprehensive services to all state residents, including people in employer plans or other non- Marketplace coverage. Like other Marketplace Assisters, CAPs are required to conduct public education and outreach, help people apply for subsidies, and answer questions. In addition, CAPs are required to help consumers resolve disputes and appeal denied claims. Furthermore, all health plans are required to include on all claims statements contact information for the state CAP and a notice that CAPs can file appeals on behalf of consumers.
The ACA appropriated $30 million in initial CAP funding and authorized future appropriations at “such sums as may be necessary,” but to date no new appropriations have been legislated. Thirty-five state CAPs were established in 2010 with the initial appropriation, and the last round of CAP grants were awarded in 2012.11 Pending additional federal funding, some CAPs remain operational, albeit at reduced levels.
For the most part, Marketplace Assister Programs do not refer consumers with post-enrollment problems to CAPs. Instead, when they encounter a post-enrollment problem they can’t resolve themselves, 81% say they refer consumers to the Marketplace call center, while 60% refer consumers back to their health plan (Figure 15).
Figure 15: Where Assister Programs Refer Consumers with Post-enrollment Problems
Key Findings: Section 6: What Improvements Do Assister Programs Seek?
In response to open ended questions, Assister Programs identified key resources that helped them be more effective in helping consumers. For example, 40% of Program directors cited training provided by the Marketplaces – in particular, trainings provided throughout the Open Enrollment period as Marketplaces modified online applications to improve functionality, as well as more in depth training modules on key issues covered in initial training sessions. Almost 40% of Assister Programs also said the Marketplace call center helped them to be more effective. The ACA requires all Marketplaces to operate a toll-free call center, and Assister Programs relied on this resource when faced with technical online problems and to resolve more complex consumer problems (Appendix Table 10).
Assister Programs also identified a number of improvements they believe are important to help them assist consumers more effectively.
Assister Programs want more and more timely training. All Assister Program staff undergo initial training to be certified by Marketplaces. Assisters in the FFM had to complete between 5 and 30 hours of training before they could begin helping consumers. In some states, federally certified Assisters were required to complete additional state-required training, which could take up to 3-4 more weeks to complete, before they could begin work. In order to be re-certified next year, Assister Programs recommend that revised training courses be available sufficiently ahead of the start of the next Open Enrollment.
The content of initial training varied depending on the Assister Program. CAC training developed by the federal Marketplace was the most basic, covering information about the individual mandate, assistance available through the Marketplace, the application process, and rules about protecting clients’ personally identifiable information. Federal training for Navigators was somewhat more detailed. Regardless of their initial training, though, 92% of Assister Programs say they would like to receive additional, more in-depth training on specific topics. Training on post-enrollment problems and tax-related issues top the list, followed by immigration-related issues and more training on QHP features and differences (Appendix Table 2). In response to open ended questions, some Assister Programs also recommended training on the online application system itself (Appendix Table 10).
Assister Programs suggest strengthening Marketplace call centers. Virtually all Programs relied heavily on their Marketplace call center to answer questions and resolve problems, though with mixed success. Assister Programs gave Marketplace call centers lower marks for helpfulness (only 69% of Assister Programs rate Marketplace call centers as very or somewhat helpful). In response to an open ended question about what Marketplaces should improve, half of Programs cited their call center. Programs say it could be difficult to get through to call center operators, particularly during peak enrollment periods. They also cited shortages in bilingual call center staff. In addition, some complain that call center representatives didn’t always provide accurate or consistent information (Appendix Table 9 and 10).
Programs in Marketplaces that provided a dedicated call center line for Assisters reported this technical assistance was more effective. Programs in Marketplaces without a dedicated Assister help line expressed the need for one. (Appendix Table 10)
Assister Programs acknowledged the value of coordination among Programs. Assister Programs that coordinated efforts reported improved efficiency in a number of areas, though not all Programs coordinated. Almost one-quarter of Assister Programs report they coordinate with other Programs often and on a regular basis. Another 22% coordinated often but on an ad hoc basis, while 54% of programs report they never coordinated with other Programs or did so only infrequently (Figure 16).
Figure 16: Coordination Among Assister Programs
When Programs did coordinate with each other, most often they said coordination was initiated by Assisters themselves or facilitated by an outside entity other than the Marketplace. Less than 20% of Programs said their Marketplace facilitated coordination among Assisters. However, in SBM states, regular coordination among Assister Programs was more often initiated by the Marketplace (Figure 17).
Figure 17: Who Initiated Coordination of Assister Programs?
Overall, Programs that did coordinate said this was very or somewhat important to their effectiveness in planning outreach events and activities (80%), and in resolving consumers’ complex questions and problems (81%).
Most regularly-coordinating Programs also said it was important in scheduling appointments. In North Carolina, for example, Assister Programs operated a centralized scheduling system. Residents of that state could call a single number and be referred to the nearest Assister Program with available appointments. Programs that coordinated with each other could also share bilingual staff and contractors, and so found it easier to make interpreter services available to consumers (Appendix Table 3). In response to open ended questions, several Programs from states that facilitated coordination also noted the importance of being able to offer real-time feedback to Marketplace officials.
Assister Programs that coordinated regularly with each other tended to engage in a wider range of activities, including outreach and public education, helping small employers, helping individuals with post-enrollment problems, and appeals of eligibility determinations. Coordinating Assister Programs also were much more likely to report helping other Assister Programs (Appendix Table 4).
Other improvements were also suggested by Programs in response to open ended questions. These include:
Web Site Reliability
Programs emphasized the need for better surge capacity to reduce web site slow-downs and repairs of other glitches. They also recommended improvements to Marketplace web site functionality, including development of online chat systems to answer consumer questions, pop-up windows with more detailed instructions on how to complete the online application, better plan comparison tools, and translation of web sites into more languages. Some Programs also urged that consumers not be required to submit an email address in order to apply online.
Assister portal to access the Marketplace enrollment system
In some states Assisters could log into the Marketplace web site through a secure portal, then help consumers complete online applications and track their status. Programs with such access emphasized its usefulness to case management. They could contact the Marketplace about pending verifications and eligibility determinations, and they could re-contact consumers to remind them of needed follow up. Without a portal, case management could be more difficult. For example, 30% of Assister Programs said they did not know the enrollment outcome for a majority of their clients. If consumers delayed picking a plan to a later time, it could be impractical for Assisters to follow up to offer reminders and additional help. Assister portals also facilitated data collection, helping both Marketplaces and Assister Programs, themselves, track performance patterns and the need for further training and technical assistance.
More Marketplace resources for Assisters
In response to an open ended question about suggested improvements, 12% of Programs recommended increasing Marketplace resources, including increased funding for Assister Programs. Some Programs also urged that Marketplaces pay directly for more media advertising and sponsor more outreach and public education events. In addition, some Programs want Marketplaces to make more consumer information resources available, such as handouts explaining ACA requirements and health insurance terms. Some stressed the need for materials translated into other languages and urged that the accuracy of translation needs to be improved in some cases (Appendix Table 10).
Privacy and security standards
Most Programs were satisfied with Marketplace rules for safeguarding clients’ personally identifiable information (PII), but 40% said safeguards were so rigid as to interfere with Assisters’ ability to track client cases and provide follow up assistance (Appendix Table 5). Programs often developed workarounds – for example, all Marketplaces required Assisters to obtain signed consent to provide assistance, and some Programs designed consent forms to also include other key information, such as the client’s eligibility determination, needed follow up steps, and contact information. Other Programs created worksheets for consumers to take with them that recorded account numbers, passwords, information about the plan selected, next-step instructions, and other key information consumers would need to keep and track on their own.
Other Assister Program best practices
In an open ended question about best practices, Programs also recommended strategies they followed to improve the assistance process. For example, 10% of Programs described “pre-screening” procedures they used while making appointments to advise consumers on the kinds of information they might need during the application process. This helped the actual assistance appointment to proceed more smoothly. Some Programs also designated staff to “pre-assist” consumers by helping them set up an email account in advance if they didn’t already have one.
Thirty-three percent of Programs also described partnerships with others in their community who could help with effective outreach or key resources such as meeting space or computer labs. Programs also formed strategic partnerships with tax assisters, insurance brokers, and others offering specialized expertise.
In addition, Programs emphasized the importance of in-house coordination, including regular meetings to share information and seek peer advice. Programs also adopted creative approaches to staff specialization, designating the most expert staff to consult on complex cases and mentor new hires, scheduling specialists to pre-screen clients and ensure availability of interpreter services or accessible assistance when needed, and training specialists assigned to monitor all Marketplace updates and trainings and ensure information was imparted to colleagues (Appendix Table 10).
Key Findings: Section 7: Looking Ahead
The vast majority (84%) of Assister Programs say they will continue operating this year after Open Enrollment has closed (Figure 18). People eligible for Medicaid and CHIP can enroll throughout the year, and enrollment in small group health plans is also open to small businesses year round. In addition, millions will qualify for Special Enrollment Periods (SEP) enabling them to enroll in plans outside of Open Enrollment.12
Figure 18: Programs That Will Continue Providing Assistance Until Next Open Enrollment Period
Three-quarters of Programs say it is very likely they will continue offering consumer assistance in the next Open Enrollment Period and into 2015 (Figure 19). This seems to vary based on Programs’ perception of their funding continuity. For example, nearly 90% of FQHCs say they’ll likely continue working next year (Appendix Table 6). HRSA enrollment assistance funds to FQHCs will be ongoing and have been built into health center budgets. FEAPs signed a two-year contract with CMS, though CMS has until later this summer to exercise the option for the second year and had not yet done so when this survey was fielded. CMS announced the availability of funding for FFM Navigators after this survey had closed. At that time, a number of state based Marketplace funding decisions for 2015 were also still pending.
Figure 19: Likelihood Programs Will Provide Assistance Next Year
Among Programs reporting they were likely to continue operating, 65% say they expect nearly all of their paid staff and volunteers to continue (Appendix Table 7). This suggests some Assister Programs will need to engage in significant new hiring and certification of staff before the fall. But it also reveals the establishment of a new foundation of assistance capacity in many Programs that, if built upon, can develop into a profession of individuals who understand what consumers need and have the expertise to help them get it.
Key Findings: Implications
The establishment of extensive new consumer assistance resources under the ACA is a significant development in the insurance system. Many consumers have traditionally relied on insurance agents and brokers to help enroll in private coverage and answer insurance-related questions. Even so, consumers have long faced challenges understanding how to navigate coverage options, and have had difficulties understanding their coverage and how to use it once enrolled. And now, for millions of consumers, applying for coverage also requires a new process of applying for financial assistance. Professional Assisters not only can help consumers answer questions, apply for help, and connect to coverage, they can serve as an interface between consumers and Marketplace officials and regulators, providing feedback on what consumers need and how well Marketplaces and health plans are working.During the first Open Enrollment, Assister Programs played a key role in achieving first year enrollment results that exceeded most expectations. In the second year, when Open Enrollment (November 15, 2014 to February 15, 2015) is only half as long, the demand for consumer assistance may very well increase. The Congressional Budget Office projects 13 million people will enroll in QHPs in 2015, compared to 8 million who enrolled during the first Open Enrollment.13 Increasing enrollment will depend first on retention of those already enrolled. Many who are already enrolled may require help renewing their coverage and subsidies, particularly if they experience a change in income or family size that affects their eligibility for subsidies. In addition, nearly all Assister Programs report seeing post-enrollment problems, such as denied claims, missed premiums, or inability to afford cost sharing. Such problems, if not addressed, could prompt some consumers to drop coverage.Ramping up enrollment will also require reaching millions of new people, educating them about what the ACA offers and requires, and getting them enrolled. If it is the case that first year enrollment included people who were most highly motivated or aware of the ACA, then the next increment of enrollment could be somewhat harder to achieve. Assister Programs already working at capacity may be stretched even further in light of these potential increases in consumer demand. In FFM states, especially, where there were fewer Assisters relative to the size of the uninsured population, continued investment in consumer assistance will matter.
Marketplaces can take a number of steps to improve the overall efficiency of Assister Programs. Officials can be encouraged that so many Assister Programs and staff intend to stay on the job. Experience can only enhance Assister efficiency. Marketplaces can seek other ways to foster the professional development of Assisters so that they continue this work over the long term. In addition, Marketplaces can take steps improve their web sites and call centers to reduce delays for both consumers and Assisters. Building Assister portals into online Marketplace application systems could reduce Assister time on hold with call centers and enhance ability to follow up with clients and ensure completed enrollments. Marketplaces can also expand training and technical assistance resources to enhance efficiency of Assister Programs.
Financial support of Assister Programs will also surely matter. The ACA requires that all Marketplaces establish Navigator Programs and pay for them out of Marketplace operating revenues – in effect, building the cost of consumer assistance into the overall cost of coverage. Because Marketplaces did not have operating revenues in time for the first Open Enrollment, this is not how most Programs were financed in the first year. Instead, about $100 million in funding came from Exchange establishment grants, another $208 million came from HRSA grants to FQHCs, and $105 million came from CMS ACA implementation funds.
In fiscal year 2015, CMS expects to collect about $1.2 billion in operating revenue through an assessment on insurers that participate in FFM states.14 For the 2014-2015 cycle, CMS has announced that $60 million will be available for grants to Navigators in FFM states, 90% of the first year total. CMS has not specified the source of this funding or indicated whether an ongoing portion of Marketplace operating revenue may be set aside for consumer assistance or in what amounts.15 In addition, no decision has yet been announced on whether to continue funding for FEAPs for a second year. Most states have yet to announce what the amount or source of their Marketplace Assister Program funding will be for next year. For 2015, HRSA anticipates that health center funding for outreach and enrollment will continue at about the level awarded in July 2013 ($150 million). The level of financial resources for Marketplace Assister Programs (and for CAPs tasked with addressing post-enrollment problems) available in the future remains to be seen.
Methods
The Kaiser Family Foundation (KFF) Survey of Health Insurance Marketplace Assister Programs was designed and analyzed by KFF researchers and administered by Davis Research.The survey was conducted through an online questionnaire from April 24 through May 12, 2014 among Assister Programs nationwide. State- and federal-Marketplaces were asked to provide contact information for all of their Assister Programs. All organizations received an initial email inviting the director of the Assister Program to participate and included a link to the survey. In the event the person receiving the survey was not the appropriate person to complete it, they were asked to provide the contact name and email for someone else with their organization or at an affiliated organization. The survey included Navigators, Certified Application Counselors (CACs), Federally Qualified Health Centers (FQHCs), In-Person Assisters (IPAs), and Federal Enrollment Assistance Programs (FEAPs). To compile the contact information for these Assister Programs, we asked officials from the Federal Marketplace, each of the State-based Marketplaces, and states with a Consumer Assistance Partnership Marketplace to provide names and email contact information for all of their Assister Programs. In addition, we requested contact information for the FQHCs from the Health Resources and Services Administration (HRSA).Although we attempted to include the universe of Assister Programs in the survey, there were some challenges associated with compiling a comprehensive set of Programs. Some Program contacts we collected from the FFM did not include email address information, so we were unable to invite these Programs to participate in the study. As a result, our study may have slightly undercounted the number of Assister Programs in FFM states. It is also important to note that one-in-five respondents (including 28% of IPAs and 42% of Navigators) reported that they operate as part of a coalition of Assister Programs that subcontract with each other. Though respondents were invited to answer survey questions on behalf of their entire Program, most of these coalition respondents told us they provided information only about their member Program within the coalition. As a result, we may have underrepresented IPAs and Navigators for some states in our sample.In analyzing the results, we grouped the Assister Programs by type using the categorization provided to us by the FFM or by the states for Assister Programs in SBMs or FPMs, with the exception of FQHCs. We created a separate category for FQHCs and identified them using the contact list provided by HRSA. All FQHCs, regardless of any other categorization they may have had, were placed in the FQHC category. Because IPAs and Navigators performed similar functions in SBMs and were funded with state resources, we further grouped IPAs and Navigators in these states into a single IPA category. In FPMs, where IPAs were funded with state grants and Navigators funded through federal grants, we kept the Navigator and IPA categories distinct.
A total of 4,445 programs were invited by email to participate in the study, and 843 programs responded and were included (for a response rate of 19%). Some program types were more likely to respond than others, so the data was weighted to reflect the distribution of programs in the initial sample by program type and Marketplace type (SBM, FPM, or FFM). Weighted and unweighted proportions of the final sample by program type are shown in the table below.
Unweighted % of total
Weighted % of total
FFM CAC
22%
33%
FFM FQHC
18%
14%
FFM Navigator/FEAP
6%
3%
FPM CAC
2%
4%
FPM FQHC
2%
2%
FPM Navigator/IPA/FEAP
4%
2%
SBM CAC
8%
8%
SBM FQHC
12%
10%
SBM Navigator/IPA
26%
24%
The number of Assister staff nationwide was estimated by analyzing self-reported figures given by survey respondents. Survey participants were asked to provide the number of full-time equivalent Assisters in their Program by selecting from a range of staff sizes on the questionnaire. For respondents who selected a range response, the midpoint of the range was used. When respondents selected the range, “less than five” a response of 1 was estimated. When respondents selected the range “more than 75” a response of 76 was estimated. For respondents who did not provide a response, staff size was imputed based on the Assister Program type.
The number of consumers helped nationwide was likewise estimated by analyzing self-reported figures given by survey respondents. For respondents who provided a numeric value for the number of people their Program helped, either in person or by phone, those responses were used. For respondents who gave an answer by selecting a range, the midpoint of the range was used. For respondents who did not provide a response, the number of consumers helped was imputed based on the Assister Program type.
All statistical tests of significance account for the effect of weighting. The sample size and margin of sampling error (MOSE) for the total sample and key subgroups are shown in the table below.
Group
N (unweighted)
MOSE
Total
843
+/-4 percentage points
CAC
274
+/-6 percentage points
FQHC
265
+/-6 percentage points
Navigator, IPA, and FEAP
304
+/-6 percentage points
Appendix Tables
Table A1. Eligibility Determinations Observed by Assister Programs
Proportion of clients with eligibility determination
Eligible for qualified health plan (QHP) and premium tax credit (PTC)
Eligible for QHP, income too high to qualify for PTC
Eligible for Medicaid or CHIP
Income too high for Medicaid and too low for PTC (“coverage gap”)
Income too high for Medicaid and too low for PTC (“coverage gap”)
Few or none
10%
65%
16%
41%
41%
Some, but less than half
40%
26%
33%
36%
36%
Most
38%
3%
38%
12%
12%
All or nearly all
8%
0%
6%
1%
1%
DK/NA
5%
5%
6%
10%
10%
Table A2. Topics on which Assister Programs Would Like Additional Training
Topic
% Programs
Assisting people with post-enrollment questions about their health plan
41%
Tax filing issues
41%
Immigration-related eligibility
39%
Qualified health plan features and how to distinguish differences between plan options
39%
Appeals
36%
Medicaid and Children’s Health Insurance Program (CHIP) eligibility
35%
Medicare-related issues
34%
Low health insurance literacy
34%
Exemptions
33%
Eligibility for premium tax credits and cost sharing reductions
32%
Special enrollment periods
27%
Using the on-line application system
26%
Availability of employer sponsored coverage
25%
Assisting people who need translation services
12%
Providing culturally competent assistance
11%
Using the paper application
11%
Accessibility for people with disabilities
8%
Privacy and security
6%
There are no additional topics or issues for which we would like additional training
8%
Other
7%
Table A3. Importance of Coordination to Effectiveness of Assistance Activities
Importance of Coordination
Planning Outreach Events
Developing Consumer Information Material
Scheduling Appointments for Enrollment Assistance
Resolve complex questions and problems
Assure availability of translation services
Assure accessible services for people with disabilities
Very important
50%
38%
29%
50%
25%
25%
Somewhat important
30%
32%
23%
31%
22%
22%
Not very important
10%
16%
22%
8%
20%
20%
Not at all important
5%
9%
22%
8%
24%
25%
DK/NA
4%
5%
4%
3%
8%
8%
Table A4. Percentage of Programs Conducting Assistance Activities
Activity
Programs that Never Coordinated
Programs that Coordinated a Few Times
Programs that Coordinated Numerous times on Ad Hoc Basis
Programs that Coordinated Numerous Times on Regular Basis
Outreach to individuals and families
50%
81%a
91%ab
94%abc
Help with post-enrollment problems
67%
74%
78%
86%ab
Help with appeals of eligibility determinations
45%
53%
65%ab
71%ab
Help other Assister Programs
20%
40%a
63%ab
66%abc
Outreach to small businesses
11%
30%a
34%a
41%ab
a indicates a statistically significant difference from “Never”, p<.05b indicates a statistically significant difference from “A few times”, p<.05c indicates a statistically significant difference from “Numerous, ad hoc”, p<.05
Table A5. How Assister Programs View Balance of Privacy Rules and Ability to Conduct Assistance
Level of Balance
% Programs
The balance was about right
58%
The balance tipped too much in favor of privacy and security, limiting ability to track clients and provide follow up assistance
40%
The balance tipped too much in favor of Assister access to PII, reducing privacy and security of client information
2%
Table A6. Likelihood Assister Programs Will Continue for 2014-2015 Open Enrollment
Likelihood
All Programs
CAC
FQHC
IPA, Navigator, FEAP
Very likely
76%
71%
88%ac
72%
Somewhat likely
8%
10%b
5%
8%
Somewhat unlikely
2%
3%
0%
2%
Very unlikely
3%
2%
1%
5%b
Not sure
11%
14%
5%
12%
a indicates a statistically significant difference from CAC, p<.05c indicates a statistically significant difference from IPA, Navigator, FEAP, p<.05
Table A7. Number of Assister Programs that Expect Staff to Continue Working During 2014-2015 Open Enrollment
Assister Staff Who Will Continue
% Programs
Almost all will continue
65%
Most will continue, some will not
20%
Some will continue, most will not
7%
Almost none will continue
1%
DK/NA
7%
Table A8. Reasons Consumers Sought Help and Problems Assister Programs Found Most Difficult to Help With
Reason
% Programs who say most/nearly all clients sought help for this reason
% Programs who say this reason was the most difficult to help with
Limited understanding of ACA
87%
27%
Help understanding/evaluating plan choices
83%
37%
Lack of confidence to apply on one’s own
80%
—
Online technical difficulties
65%
55%
Problems persisting after contacting call center
49%
—
Questions relating to household income
49%
13%
Medicaid eligibility questions
49%
16%
Questions relating to defining household members
44%
8%
Lack of internet access at home
41%
17%
Tax-related question
26%
14%
Need translation assistance
18%
13%
Question related to verifying immigration status
10%
22%
Help filing exemption
10%
7%
Questions related to ESI/COBRA
8%
17%
Other ID proofing question (not immigration related)
7%
19%
Help with disability
5%
3%
Table A9. Sources and Usefulness of Technical Assistance for Assister Programs
Technical Assistance Offered by Marketplace
Outside Sources of Technical Assistance
Resource
% Programs Using Resource
% Rating Very or Somewhat Helpful*
Resource
% Programs Using Resource
% Rating Very or Somewhat Helpful*
Online resources, tips, updates for Assisters
57%
90%
State primary care association
15%
94%
Newsletter for Assisters
51%
88%
Other Assister Programs
27%
93%
Webinars for Assisters
66%
87%
HRSA
15%
93%
Periodic networking meetings with other Assisters
31%
84%
Technical Assistance offered by other private entities
9%
92%
Regular calls with Marketplace staff
37%
82%
Brokers and agents
13%
92%
Ad hoc calls with Marketplace staff
19%
82%
State insurance department
11%
90%
Help line dedicated for Assisters
43%
77%
Tax preparation organizations
6%
81%
State Marketplace call center
46%
69%
Health insurance company help lines
18%
79%
Federal Marketplace Call Center
50%
69%
State Medicaid agency
36%
73%
* percentage based on respondents who used the resource
Table A10. Assister Program Responses to Open Ended Questions about What Worked Well and What Changes Would Help them be More Effective
Feature or Resource
Percent of Assister Programs
Briefly describe up to 3 things the Marketplace did that helped make the work of your Assister Program more effective
Training (net)
40%
Updated training/webinars
25%
Initial training
9%
Call Center (net)
39%
Call center was helpful, generally
25%
Dedicated line for Assister Programs
12%
Assister Resources (net)
18%
Consumer materials by Marketplace
10%
Online resources for Assisters
6%
Funding for Assisters
2%
Marketplace Website
16%
Online application
8%
Live “chat” feature
2%
QHP “window shopping” feature
2%
Coordinating Assisters (net)
14%
Regular calls to share information
10%
Formal networking of Assister Programs
3%
Marketplace staff responsiveness
5%
Outreach by Marketplace (net)
5%
NA
11%
Briefly describe up to 3 things the Marketplace might change to help make the work of your Assister Program more effective
Call Center (net)
48%
Strengthen staff training
25%
Provide dedicated line for Assisters
16%
More call center staff
12%
Website (net)
42%
Fix website glitches
22%
Create portal for Assister online access
11%
Create live “chat” functionality
5%
Training (net)
27%
Make available for initial certification, updates
14%
More in-depth training on specific topics
7%
Training version of online application
6%
Assister Resources (net)
12%
More funding for Assister Programs
6%
More printed resources for consumers
5%
Increase number of Assister Programs
2%
Policy Changes (net)
8%
Improve Marketplace staff responsiveness
2%
Conduct appeals of eligibility denials
1%
Clearer consumer notices
1%
Improve Coordination with Medicaid
7%
Increase Outreach by Marketplace
6%
Coordinate Assister Programs
5%
NA
6%
Briefly describe up to 3 practices of your Assister Program that you would recommend as best practices to others
Model Work Practices
50%
Scheduling strategies
20%
Pre-screen clients to prepare for their appointment
10%
Professional standards
10%
Periodic meetings to coordinate Program staff
6%
Hiring practices
6%
Specialization of Assister staff
4%
Strategic Partnerships
33%
Community partners for outreach
26%
Community partners for expertise
6%
Counseling Skills
11%
Training
11%
Develop Helpful Forms/Worksheets
10%
Casework Strategies
7%
NA
13%
Endnotes
Under the ACA, if a state does not elect to operate a health insurance Marketplace, the federal government must do so. A third option, created by regulation, allows states to take on some of the Marketplace functions in partnership with the federal government. In this report, Partnership Marketplace refers to one where they state has agreed to provide consumer assistance services. In these Marketplaces, states must use exchange establishment grant resources to help finance Assister Programs. The federal government also assumes some responsibility for financing Assister Programs in FPMs. In this report, state grant-funded Assister Programs in FPMs are referred to as IPAs, while federally-funded Assister Programs in FPMs are referred to as Navigators. ↩︎
or 2014 the FFM states are Alabama, Alaska, Arizona, Florida, Georgia, Indiana, Iowa, Kansas, Louisiana, Maine, Michigan, Mississippi, Missouri, Montana, Nebraska, New Jersey, North Carolina, North Dakota, Ohio, Oklahoma, Pennsylvania, South Carolina, South Dakota, Tennessee, Texas, Utah, Virginia, Wisconsin, and Wyoming. Iowa and Michigan are considered Partnership Marketplaces, but not with respect to consumer assistance duties.
The Consumer Assistance FPM states are Arkansas, Delaware, Illinois, New Hampshire, and West Virginia.
The SBM states are California, Colorado, Connecticut, DC, Hawaii, Idaho, Kentucky, Maryland, Massachusetts, Minnesota, Nevada, New Mexico, New York, Oregon, Rhode Island, Vermont, and Washington. ↩︎
The ACA makes available to states a program of grants to finance the establishment of exchanges, or Marketplaces. These exchange establishment grants are unlimited in amount and are available through the end of 2014. To date more than $4.6 billion in state exchange establishment grants has been awarded. Establishment grants may not be used to finance Navigators, per se, but can be used to support other Assistance resources in the early years of state Marketplace operations. ↩︎
During the first Open Enrollment period, FEAPs operated in Arizona, Florida, Georgia, Indiana, Louisiana, Montana, North Carolina, New Hampshire, New Jersey, Ohio, Pennsylvania, Texas and Wisconsin. ↩︎
Some organizations sponsored Assister Programs in multiple states. In such cases, respondents were asked to answer survey questions with respect to a single state and were invited to re-take the survey to answer with respect to the other state(s) in which they operated. ↩︎
Budget refers to the annual resources for the Assister Program, not the budget for the sponsoring entity as a whole. ↩︎
Questions about Assister Program budgets produced the highest non-response rate; 29% of survey respondents did not supply an answer to this question. ↩︎
The funding announcement says, “HHS expects to award $60,000,000 to recipients pending the availability of funds. If additional funds become available at the end of FY 2014 to award the Navigator cooperative agreements, HHS may award funds in excess of $60 million to applicants applying through this FOA…” See US Department of Health and Human Services, “Cooperative Agreement to Support Navigators in Federally-facilitated and State Partnership Marketplaces,” Initial Announcement, Funding Opportunity Number: CA-NAV-14-002, CFDA: 93.332, June 10, 2014.” ↩︎
In January 2014, the major coverage provisions of the 2010 Affordable Care Act (ACA) went into full effect. While millions have gained coverage under the law, many remain outside its reach. In Texas, which had the highest uninsured rate in the nation prior to the ACA and has opted not to expand its Medicaid program, many uninsured residents remain. Much attention has recently focused on the population that is newly-enrolled in coverage, but a focus on the uninsured population, their needs, and the consequences they face because they lack coverage can also inform ongoing policy development in the state. This report uses findings from the 2013 Kaiser Survey of Low-Income Americans and the ACA to explore who the uninsured in Texas are and to understand their ongoing health care and health coverage needs.
Key Findings
Characteristics of Uninsured Adults in Texas
While the population without health insurance coverage in Texas includes people from a range of backgrounds, most uninsured Texan adults are low-income workers: nearly 70% of uninsured adults are in a working family, and 40% live below the poverty level. Uninsured adults in the state are also, on average, younger and more likely to be people of color than those who have insurance. In addition, 20% of uninsured adults in Texas are undocumented immigrants, who remain outside the reach of many provisions of the ACA.
Patterns of Coverage Among Adults in Texas
While some people lack health insurance coverage during short periods of unemployment or job transitions, for most uninsured adults in Texas, lack of coverage is a chronic problem. Over half of uninsured adults in the state (53%) reported being uninsured for five years or more, including 31% of the uninsured who reported that they have never had coverage in their lifetime. In addition, many Texans experience spells of uninsurance throughout the year, and coverage among those with insurance may not be stable. Among Texan adults who were insured at the time of the survey, 8% reported being uninsured at some point in the past year, and 11% had coverage for the full year but had a change in their coverage source.
Access to Coverage Among Uninsured Adults in Texas
Many uninsured adults in Texas report trying to obtain insurance coverage in the past, but most did not have access to affordable coverage. Most (84%) uninsured adults in Texas report that they do not have access to employer-sponsored coverage through either their job or a spouse’s job. Of the 16% who do have access to coverage through an employer, the majority report that the coverage offered to them is not affordable. In addition, uninsured adults report problems accessing Medicaid, which is not surprising given the limited eligibility for this group in Texas. More than one fifth (21%) of uninsured adults said they tried to sign up for Medicaid in the past 5 years, but the vast majority were told they were ineligible. Some who applied for Medicaid also reported challenges with the application process, with 57% who applied to Medicaid (including those who enrolled) indicating that some part of the process—was somewhat or very difficult. Last, uninsured Texans report problems in finding affordable coverage on their own: prior to the ACA, 15% tried to purchase a plan directly from an insurer, but most said that the policy offered to them was too expensive.
Access to Health Care Services Among Uninsured Adults in Texas
A large segment of uninsured adults in Texas have little or no connection to the health care system.Only 48% of uninsured adults report that they have a usual source of care, or a place to go when they are sick or need advice about their health, and only 28% of uninsured adults say they have a regular doctor at a usual source of care, less than half of the rate of insured adults in Texas. This lack of a connection to the health care system leads many uninsured adults to go without care. Fifty-six percent of uninsured adults in Texas reported at least one health care visits in the past year, compared to 89% of Medicaid beneficiaries and 85% of adults with employer coverage. Still, many uninsured Texans have health needs.Uninsured adults are less likely than those with employer coverage to report receiving care for an ongoing health condition. About half (47%) of the uninsured and half (50%) of Medicaid beneficiaries in Texas report needing but postponing care, compared to 31% of adults with employer coverage. The most common reason for postponing care among the uninsured is cost.
Financial Security Among Uninsured Adults in Texas
Health care costs pose a challenge for poor and moderate-income families in Texas, particularly if they are uninsured. Health care costs translate to medical debt for many poor adults. Over a third (36%) of uninsured adults in Texas have outstanding medical bills. These medical bills can cause serious financial strain. In addition, the vast majority of uninsured Texas adults across all income groups reported that they lack confidence in their ability to afford health care, given their current finances and health insurance situation. Difficulty or worry about paying for health care translates to expenses in other areas as well, and almost six in ten uninsured adults below poverty (59%) reported that they feel generally financially insecure. This general financial insecurity translates to concrete financial difficulties in making ends meet. Patterns across coverage groups indicate that this issue is common among people in poverty, regardless of insurance.
Policy Implications
The survey shows that affordability and access are major challenges to obtaining coverage for adults in Texas. Though most uninsured adults or their spouses work, most still live on very limited means and are unlikely to be able to afford coverage on their own.
For those who are eligible for coverage, the ACA can help facilitate access to affordable coverage by requiring employers to offer coverage, making available tax credits for Marketplace coverage, and prohibiting denials of coverage. These provisions could address barriers that Texans have faced in accessing private coverage, such as not having coverage through a job, not being able to afford coverage, or having a health condition that might price them out of the market. Further, provisions to simplify Medicaid application and enrollment may lead to smoother enrollment and renewal in the Medicaid program.
Open enrollment has ended for Marketplace coverage in 2014, but as of November, people can sign up for Marketplace plans to begin in 2015. In addition, the survey findings reveal that many Texans lose and gain coverage throughout the year because of job changes, income fluctuations, or problems at renewal. Thus, enrollment is an ongoing process, and ongoing efforts to enroll and keep people in coverage will influence the number of people who gain coverage. A substantial share of the uninsured population has been outside the insurance system for quite some time and may require targeted outreach and education efforts to link them to the health care system and help them navigate health insurance should they gain coverage.
However, because Texas is not expanding Medicaid, over a million uninsured Texans who would have been eligible for Medicaid under the ACA instead fall into the coverage gap. They are not eligible for the Marketplace subsidies and tax credits, most do not have access to coverage through a job, and they likely are unable to afford coverage on their own. These remaining uninsured adults are likely to continue to face access barriers and financial hardship due to health care costs. These individuals will continue to have health care needs and may continue to lack a usual source of care, forego preventive care, and face cost barriers to using services. As attention shifts to the newly-insured population, the uninsured in the state will still need care, and clinics and health centers will continue to help serve the poor and moderate-income population.
Report: Introduction
In January 2014, the major coverage provisions of the 2010 Affordable Care Act (ACA) went into full effect. These provisions include the creation of a new Health Insurance Marketplace where moderate-income families can receive premium tax credits to purchase coverage and, in states that opted to expand their Medicaid program, the expansion of Medicaid eligibility to low-income adults. In Texas, the federal government operates the Marketplace, as the state opted not to run its own. In addition, as of June 2014, Texas had not expanded its Medicaid program, leaving many low-income uninsured adults in Texas who would have been newly-eligible for Medicaid without a coverage option. With very limited Medicaid eligibility for adults, and with only 23% of the eligible Marketplace population enrolling as of April 19, 20141 , many uninsured remain in Texas.While much attention has recently focused on the population that is newly-enrolled in coverage, a focus on the uninsured population, their needs, and the consequences they face because they lack coverage can inform ongoing efforts to meet the needs of this population and implementation of the ACA in the state. This report uses findings from the 2013 Kaiser Survey of Low-Income Americans and the ACA to explore who the uninsured in Texas are and understand their ongoing health care and health coverage needs. The survey, conducted between July and September 2013, is a nationally representative survey that also includes a state-representative sample of over 1,800 nonelderly (ages 19-64) adults in Texas. While the data were collected prior to national ACA implementation, early enrollment reports indicate that the vast majority of people who were uninsured in the state prior to the ACA still lack coverage. Thus, the survey can provide insight into the challenges that the uninsured in Texas face and how the ACA will shape coverage in the state. More detail on the survey and methods underlying the analysis in this report can be found in the Appendix.
Background
Lack of insurance coverage has been a longstanding policy challenge both nationwide and especially in Texas. Prior to the ACA, the uninsured rate in Texas was 27%, the highest in the nation and well above the national rate of 18%.2 This high uninsured rate reflects limited availability of both private and public coverage. Private coverage is closely tied to employment, but not all workers are offered affordable coverage through their jobs. In particular, people who work in certain industries (such as service or agriculture), who work part-time, or who earn low wages are less likely to be offered coverage than other workers.3 Private coverage purchased directly from insurers (nongroup coverage) was not guaranteed in Texas prior to the ACA, and insurance companies could charge higher premiums for sicker or older individuals, making coverage unaffordable for many uninsured adults.4 Last, Medicaid eligibility in the state has historically been very limited for adults. While children in the state may be eligible for Medicaid or CHIP if their family income is below 206% of poverty (about $40,800 for a family of three in 2014), parents must have income below 20% of poverty, or about $3,900 a year for a family of three, to qualify for coverage. Further, adults without dependent children and undocumented immigrants are ineligible for Medicaid in Texas, regardless of their income.5
To address the challenge of the uninsured, the Affordable Care Act (ACA) includes an expansion of Medicaid and the creation of new Health Insurance Marketplaces. With the Supreme Court ruling in June 2012, the Medicaid expansion essentially became optional for states, and as of June 2014, Texas had opted not to expand its Medicaid program. This decision has created a “coverage gap” among low-income adults. Under the ACA, people with incomes between 100% and 400% of poverty may be eligible for premium tax credits when they purchase coverage in a Marketplace. Because the ACA envisioned low-income people receiving coverage through Medicaid, people below poverty are not eligible for Marketplace subsidies. Thus, some poor adults in Texas will fall into a “coverage gap” of earning too much to qualify for Medicaid but not enough to qualify for premium tax credits. People in the coverage gap, all of whom have incomes below 100% of poverty, are ineligible for financial assistance under the ACA, while people with higher incomes will be eligible for tax credits to purchase coverage.
While the state is not expanding Medicaid eligibility under the ACA, there are some ACA-related changes to the state’s Medicaid program. Changes to the Medicaid enrollment process occurred in 2014, regardless of expansion decisions. Texas must make Medicaid determinations based on new modified adjusted gross income (MAGI) eligibility levels. The ACA also established a streamlined enrollment process for all states that allows people to use one single application for Marketplace or Medicaid coverage. Individuals are able to apply for coverage through HealthCare.gov, the state Medicaid/CHIP website, in person, on the phone, or through the mail. In addition, Medicaid eligibility determinations will now use verification based on existing data sources such as Social Security Administration data, rather than requiring families to provide paper documentation.6
Report: Characteristics Of Uninsured Adults In Texas
While the population without health insurance coverage in Texas includes people from a range of backgrounds, most uninsured Texan adults are low-income workers. Uninsured adults in the state are also, on average, younger and more likely to be people of color than those who have insurance. In addition, while most uninsured adults are citizens or legal immigrants, a notable share of uninsured adults in Texas are undocumented immigrants, who remain outside the reach of many provisions of the ACA.
Most uninsured adults are in low-income working families.
Uninsured adults in Texas are more likely than other residents to be low-income. For example, 40% of uninsured adults are poor (that is, living below the poverty level) in contrast to 5% of adults with employer coverage (Figure 1 and Appendix Table A1). People living below the poverty level live on limited resources: In 2014, the poverty level for a family of three is less than $20,000 a year.7 In Texas, most poor uninsured adults are ineligible for coverage expansions under the ACA. Adults with Medicaid are the most likely of any coverage group to be poor, reflecting the fact that adult income eligibility is limited to those with very low incomes.8
Figure 1: Income Distribution Among Adults in Texas, By Insurance Coverage
About half of uninsured adults in Texas have family incomes between 100 and 400% of poverty (Figure 1), the income range for premium tax credits for Marketplace coverage. Some of these people may be not be able to obtain tax credits due to their immigration status or because they have an offer coverage from an employer. However, most are potentially eligible for financial assistance in purchasing coverage.
Though they are primarily low-income, most uninsured Texans are in a working family. Nearly seven in ten (69%) uninsured Texan adults live in families where they or their spouse are working either full or part-time (Figure 2). These workers may be employed by someone else or may be self-employed. Few adults who meet the limited income levels for Medicaid eligibility in the state are in a working family (23%), as even limited earnings are likely to make adults ineligible. However, not surprisingly, most adults with employer coverage are in a working family, which is the main pathway to their coverage.
Figure 2: Family Work Status Among Adults in Texas, By Insurance Coverage
The data on the income and work status of uninsured Texas adults indicates that the challenge of extending coverage may be linked more to affordability and access than to lack of jobs. Though most uninsured adults or their spouses work, most still live on very limited means and are unlikely to be able to afford coverage on their own.
Demographic characteristics of uninsured adults could inform outreach efforts.
Uninsured adults in Texas also differ from insured adults with regards to demographic characteristics, often reflecting an association with income or work status. For example, uninsured adults are likely to be younger than insured adults, as younger adults have lower incomes and looser ties to employment than older adults. Nearly seven in ten (69%) uninsured adults in Texas are ages 19-44 compared to 55% of adults with employer coverage and 44% with Medicaid (Appendix Table A1). There also are significant racial and ethnic differences in health coverage among nonelderly adults in the state, primarily reflecting differences in income by race/ethnicity. For example, uninsured adults are more likely to be Hispanic (56%) than adults with employer coverage (24%).
Most (62%) uninsured adults in Texas are U.S. citizens. Of those who are not citizens, however, many are undocumented immigrants. The survey estimates that undocumented immigrants make up 20% of the uninsured adult Texas population.9 Under federal law, undocumented immigrants are not eligible for Medicaid. As a result, even if Texas were to expand the Medicaid program, a sizeable number of Texas residents would remain uninsured. Further, many Texas families include both documented and undocumented immigrants, and these families often see government-run programs through the prism of protecting immigration status information about their family members.
Understanding the demographic characteristics of the remaining uninsured population in Texas can inform efforts to reach, educate, and enroll individuals into health coverage under the ACA and to continue to serve the uninsured in the state. Information on how to navigate the health care system can be tailored to specific age groups or ethnic groups to reach them more effectively. Conveying how the ACA does or does not tie into immigration may be important for outreach and communication with the immigrant community.
Report: Patterns Of Coverage Among Adults In Texas
Health insurance coverage is dynamic, and every year thousands of Texans gain, lose, or change it. However, for most uninsured adults in Texas, lack of coverage is a long-term issue that spans many years. In addition, many insured Texans face unstable coverage that puts them at risk for becoming uninsured.
For most uninsured adults in Texas, lack of coverage is a long-term issue.
While some people lack health insurance coverage during short periods of unemployment or job transitions, for many uninsured adults in Texas, lack of coverage is a chronic problem. Over half of uninsured adults in the state (53%) reported being uninsured for five years or more, including 31% of the uninsured who reported that they have never had coverage in their lifetime (Figure 3). Of note, over 4 in 10 (44%) poor uninsured adults (<100% FPL) reported never having coverage in their lifetime, and over 6 in 10 poor uninsured adults have been uninsured for at least five years. These adults will likely remain uninsured without a Medicaid expansion (see Appendix Table A2). A smaller share of moderate-income (100-400% FPL) uninsured Texan adults are long-term uninsured, but at 24%, a sizeable share of the latter still has never had health insurance.
Figure 3: Length of Time without Coverage, Among Currently Uninsured Adults in Texas
The data on length of time uninsured indicate that many uninsured adults in the state are likely to remain uninsured for extended periods without a substantial change in the availability of coverage. While some may move into coverage after a brief period of uninsurance, most are likely to remain uninsured. In addition, the uninsured in Texas have varying levels of experience with the insurance system. While some previously had coverage, a substantial share has been outside the insurance system for quite some time. The long-term uninsured may require targeted outreach and education efforts to link them to the health care system and help them navigate health insurance should they gain coverage.
Many Texans will experience spells of uninsurance throughout the year, and coverage among those with insurance may not be stable.
For most insured adults in Texas, coverage is continuous throughout the year and over time. However, when accounting for both insured people with a gap in their coverage and uninsured people who had only recently lost coverage, the survey indicates that sizeable shares of adults in Texas lose or gain coverage over the course of a year. Among Texan adults who were insured at the time of the survey, 8% reported being uninsured at some point in the past year (see Table 1), and those who had a gap in coverage were uninsured for close to half a year (5.7 months) on average (data not shown).
Even for those who have coverage throughout the entire year, coverage may not be stable. Among adults with insurance coverage, 11% had coverage for the entire year but reported that they had a change in their coverage (Table 1). Coverage changes may be due to a number of different factors including changes in employment, changes in eligibility for public programs, or simply a change in plan or insurance carrier. The most common reasons for a change in coverage appear to be related to changes in employment or changes in plans during open enrollment, as most Texans with a coverage change reported changing from an employer plan to another employer plan.
Table 1: Coverage Dynamics Among Insured Adults in Texas, by Income and Current Coverage
All
By Income
By Current Coverage
%
<100% FPL%
100-400% FPL%
>400% FPL%
Employer%
Medicaid%
Insured Adults
100%
100%
100%
100%
100%
100%
Gap in Coverage in Past Year
8%
—
14%
—
7%
—
Changed Coverage During Year
11%
—
8%
15%
14%
—
Same Coverage for Full Year
80%
78%
78%
83%
79%
80%
NOTES: Don’t Know and Refused responses not shown.”–“: Estimates with relative standard errors greater than 30% or sample size too small for analysis are not provided.SOURCE: 2013 Kaiser Survey of Low-Income Americans and the ACA.
In addition, a small number of insured adults in Texas (5%) reported challenges in either renewing or keeping their coverage, another indication of instability in coverage throughout the year (data not shown). In regards to Medicaid, eligibility is closely tied to income, and adults’ income may fluctuate throughout the year; adults must report changes in income that may affect their eligibility throughout the year, and poor and moderate-income people are very likely to have part-time or seasonal work that leads to income fluctuations over the course of a year. In addition, adults must renew their Medicaid coverage either in person, by phone, or online annually.
The survey findings on changes in insurance coverage during the year have implications for ongoing ACA implementation in the state. Though open enrollment is over, people may still enroll in Marketplace coverage during “special enrollment periods,” such as loss of job-based coverage, marriage, birth of a child, or another change in family circumstance.10 Further, while Medicaid eligibility is limited, as adults’ income fluctuates, they may gain Medicaid eligibility, and people who are eligible can gain coverage at any point during the year. Survey findings demonstrate that people frequently move around within the insurance system throughout the year, and many are likely to find themselves in a situation where they could gain ACA coverage. Conversely, people may lose coverage—either due to loss of a job or changes income that lead to loss of Medicaid— and find that they fall into the coverage gap.
Report: Access To Coverage Among Uninsured Adults In Texas
Many uninsured adults in Texas report trying to obtain insurance coverage in the past, but most did not have access to affordable coverage. Prior to the ACA, options for coverage—particularly for the poor or moderate-income—were very limited. For most poor adults in the state, coverage options continue to be limited under the ACA.
Very few uninsured Texans have access to affordable coverage through an employer.
The vast majority of uninsured adults in Texas do not have access to employer coverage. More than eight in ten (84%) uninsured adults in Texas report no access to employer coverage, either because no one in their family is working for an employer, their or their spouse’s employer does not offer coverage, or they are ineligible for that coverage (Table 2). For example, 41% of uninsured adults in Texas are in a family without an employer, meaning both they and their spouse (if married) are either not working or are working but are self-employed. Over a third (38%) of uninsured adults are in a family that has an employer who does not offer coverage to any workers, and one in twenty (5%) are in a family that works for an employer who offers coverage but they are ineligible for that coverage. Most are ineligible because they work part-time or are in a waiting period.
Table 2: Access to Employer Health Coverage Among Uninsured Adults in Texas
All
By Income
<100% FPL
100-400% FPL
%
%
%
No Access to ESI
84%
90%
81%^
No one in family has an employer1
41%
41%
41%
Firm doesn’t offer coverage
38%
44%
34%
Not eligible for coverage
5%
—
—
Access to ESI
16%
10%
19%^
Cannot afford premium
12%
8%
14%
Don’t think need coverage
—
—
—
Some other reason
3%
—
—
NOTES: Don’t Know and Refused responses not shown.1 Individuals who are self-employed without other employment are treated as not having an employer.”–“: Estimates with relative standard errors greater than 30% or sample size too small for analysis are not provided.^ Estimate statistically significantly different from <100% FPL at the 95% confidence level.SOURCE: 2013 Kaiser Survey of Low-Income Americans and the ACA.
About one in six (16%) uninsured adults in Texas does have access to coverage through an employer, but the majority report that the coverage offered to them is not affordable. Notably, lack of access to employer coverage is particularly high among poor, uninsured adults (90%), a group that generally will not be eligible for financial assistance in gaining coverage under the ACA.
Some of the barriers to employer-sponsored coverage that the uninsured have reported facing in the past are addressed by the ACA. In the future, large employers (>50 workers) will face penalties if they do not offer affordable coverage to their workers.11 Additionally, private premiums can only vary based upon age, location, and tobacco use; health plans may not use annual or lifetime spending caps; and plans must allow dependents on the plan until age 26. However, many uninsured adults in the state may not be captured by these provisions and will continue to lack access to coverage through a job.
low-income adults reported limited access to coverage through Medicaid.
While the state had expanded eligibility to children through Medicaid and the Children’s Health Insurance Program, Medicaid eligibility for adults in Texas remains very limited. To qualify for Medicaid in Texas, parents must have incomes less than 20% of the poverty level. Adults without dependent children are generally ineligible for Medicaid in Texas unless they qualify due to having a disability. In addition, some individuals eligible for Medicaid remain uninsured because they are not aware that they are eligible for coverage or they face application or enrollment barriers.
The gaps in Medicaid eligibility for adults and difficulties with the enrollment process pose barriers for many low-income adults seeking coverage. Twenty-one percent of uninsured adults in Texas reported trying to sign up for Medicaid in the past five years (Figure 4). Most uninsured adults in Texas who unsuccessfully tried to enroll in Medicaid (15% of the uninsured) were told they were ineligible (Figure 4). Most of the adults who were told they were ineligible will likely remain ineligible for public coverage, barring a change in their income.
Figure 4: Uninsured Texan Adults’ Attempts to Enroll in Medicaid or Nongroup Coverage in the Past 5 Years
Ineligibility is likely the most substantial barrier that uninsured Texas adults will face in accessing Medicaid coverage. However, enrollment barriers may pose a challenge to enrollment for the small share that are eligible for coverage. Adults in Texas who currently have Medicaid or who have attempted to enroll in the past five years reported little difficulty in enrolling in Medicaid. Over 4 in 10 adults (43%) who applied to Medicaid said the entire process was very or somewhat easy. However, the rest found at least one aspect of the process – finding out how to apply, filling out the application, assembling the required paperwork, or submitting the application – to be somewhat or very difficult. The most commonly reported difficulty was assembling the required paperwork, which over a third (35%) of Texans who enrolled or applied said was somewhat or very difficult (Figure 5).
Figure 5: Views of Medicaid Enrollment Process Among Adults Who Signed Up or Attempted to Sign Up for Medicaid in Texas
About a quarter of Texan adults (24%) who applied to Medicaid in the past five years reported that they did so through traditional routes—that is, in person at a state or county office—and only 17% reported using an online application (Figure 6). The ACA includes provisions to further simplify the application, enrollment, and renewal process for coverage in all states, regardless of whether they expand their Medicaid programs under the ACA. These requirements include the adoption of a single streamlined application that is available online, by phone, and on paper and that screens for all health coverage options; electronic transfers of accounts between agencies to facilitate transitions across health coverage programs; and reliance on trusted sources of electronic data, rather than requesting paper documentation, to verify eligibility criteria.12
Figure 6: Mode of Application Among Adults in Texas Who Signed Up or Attempted to Sign Up for Medicaid
Once simplified enrollment processes are fully implemented, it is possible that people applying for Medicaid in Texas will experience a smoother application and enrollment process than applicants have in the past. However, with Texas not expanding Medicaid and with the state having very low income eligibility for parent coverage, many poor uninsured adults will remain ineligible. Further, as was the case before the ACA, undocumented immigrants remain ineligible to enroll in Medicaid or Marketplace coverage, and recent lawfully residing immigrants are subject to certain Medicaid eligibility restrictions.
Prior to the ACA, there were also barriers to obtaining coverage on the nongroup, or individual, market.
Uninsured Texans also report trying to obtain nongroup coverage in the past. Before the ACA, nongroup coverage was not guaranteed in Texas, and insurance companies could charge higher premiums for sicker or older individuals, making coverage unaffordable for many uninsured adults.13 Fifteen percent of uninsured adults in Texas reported trying to obtain nongroup coverage in the past five years. Most of these Texans (9% of the uninsured) did not purchase a plan because the policy they were offered was too expensive (Figure 4 and Appendix Table A2).
Under the ACA, thousands of uninsured families are now able to purchase coverage in the Marketplace and receive premium tax credits to reduce the cost. In addition, insurers are no longer able to deny coverage based on health status and are limited in what they charge people based on age, location, and tobacco use status. However, as of April 2014, just over 23% of the potential Marketplace population in Texas had enrolled in coverage, lower than the national average of 28%.14 People who have attempted to obtain coverage in the past may have been unaware that rules and costs have changed under the ACA. Indeed, 71% of uninsured Texas adults in the income range for premium tax credits reported knowing only a little or nothing at all about the Marketplace prior to open enrollment.15 Further, there is anecdotal evidence that misinformation about the ACA was pervasive in Texas.16 In more recent months, media coverage of the rocky start to the open enrollment period may have led Texas residents to become more familiar with the presence of the federal marketplace. In the future, outreach and education could help inform people that eligibility rules have changed and that financial assistance is available to offset the cost of coverage.
Report: Access To Health Care Services Among Uninsured Adults In Texas
Uninsured adults in Texas generally do not seek or receive health care services at the same rate as insured adults, even when they have a need for care. Many uninsured adults have substantial health care needs that are not monitored by a physician. Cost is the main reason uninsured Texans do not receive care when needed, and many lack a regular provider to facilitate follow-up or ongoing care. When uninsured adults do receive care, they often have limited options. As coverage expands under the ACA, some uninsured adults are likely to get care more frequently and establish relationships with providers, yet many uninsured adults will remain without a coverage option and continue to have unmet need for care.
A large segment of the uninsured in Texas has little or no connection to the health care system.
While some uninsured adults in Texas do report receiving health care services, most report few connections to the health care system. Less than half of uninsured adults in Texas (48%) report that they have a usual source of care, or a place to go when sick or need advice about their health (not including the emergency room). Having a usual source of care is an indicator of being linked in to the health care system and having regular access to services. In comparison, nearly all insured adults in Texas —78% of those with employer coverage and 74% of those with Medicaid coverage— have a usual source of care (Figure 7). In addition, uninsured adults in Texas are less likely to have a regular doctor at their usual source of care, with 28% of uninsured adults reported having a regular doctor, well below the rate of insured adults. Notably, poor uninsured adults in Texas, most of whom fall in the coverage gap, are the least likely to have a usual source of care or a regular physician (Table 3).
Figure 7: Share of Adults in Texas with a Usual Source of Care or Regular Provider, by Insurance Coverage
This lack of a connection to the health care system leads many uninsured adults in Texas to go without care. About six in ten uninsured adults in Texas (56%) reported a health care visit—including hospital visits, doctor’s office or clinic visits, mental health services, or trips to the emergency room— in the past year, compared to 89% of Medicaid beneficiaries and 85% of adults with employer coverage (Figure 8). Of particular concern is the lack of preventive visits among uninsured adults in Texas. Three in ten (31%) of uninsured adults reported a preventive visit with a physician in the last year, compared to 73% of adults with employer coverage and 71% of adults with Medicaid (data not shown).
Figure 8: Receipt of Health Care Services by Texas Adults in the Last Year, by Insurance Coverage and Income
Table 3: Share of Adults in Texas with Usual Source of Care or Regular Provider,by Income and Coverage
Uninsured
Insured
Employer
Medicaid
Has a usual source of care1
All
48%
78%*
74%*
By Income
<100% FPL
43%
59%
82%*
100-400% FPL
48%
76%*
61%
>400% FPL
—
81%
—
Has a regular provider at usual source of care1
All
28%
67%*
68%*
By Income
<100% FPL
24%
49%*
79%*
100-400% FPL
28%
63%*
51%*
>400% FPL
—
72%
—
NOTES: Don’t Know and Refused responses not shown.”–“: Estimates with relative standard errors greater than 30% or sample size too small for analysis are not provided.15% of adults who report the emergency room as their regular source of care are reclassified as not having a usual source of care.*Estimate is statistically significantly different from uninsured estimate at the 95% confidence level.SOURCE: 2013 Kaiser Survey of Low-Income Americans and the ACA.
The survey findings reinforce conclusions based on prior research: having health insurance affects the way that people interact with the health care system, and people without insurance have poorer access to services than those with coverage.17,18,19 The remaining uninsured in Texas are likely to continue to face many of the barriers to health care that they had encountered previously, including a lack of usual sources of care, and a lack of preventative care.
Many uninsured Texans have health needs, many of which are unmet or are being met with difficulty.
Texans who lack health insurance still have health care needs. About three in ten (33%) uninsured adults reported an ongoing health condition, compared to 74% with Medicaid (Figure 9). Medicaid beneficiaries are most likely to report having an ongoing health condition of all coverage groups, which reflects Medicaid’s role in caring for people with substantial health needs, such as individuals with disabilities or people who become impoverished due to high health care expenses. These findings hold across income groups (Table 4).
Figure 9: Share of Adults in Texas with an Ongoing Health Condition, by Insurance Coverage
Table 4: Health Status of Adults, by Income and Coverage
Uninsured
Insured
Employer Coverage
Medicaid
Fair or Poor Overall Health
All Incomes
40%
11%*
67%*
<100% FPL
50%
—
75%*
100-400% FPL
34%
17%*
55%
Fair or Poor Mental Health
All Incomes
16%
6%*
28%*
<100% FPL
22%
—
42%*
100-400% FPL
12%
11%
—
Have ongoing health condition that needs to be monitored regularly or needs regular care
All Incomes
33%
33%
74%*
<100% FPL
31%
—
84%*
100-400% FPL
29%
30%
60%*
Take prescription medication on regular basis1
All Incomes
31%
44%*
69%*
<100% FPL
33%
—
80%*
100-400% FPL
27%
42%*
50%*
NOTES: Don’t Know and Refused responses not shown.”–“: Estimates with relative standard errors greater than 30% or sample size too small for analysis are not provided. 1Excludes birth control.*Estimate statistically significantly different from uninsured estimate at the 95% confidence level.SOURCE: 2013 Kaiser Survey of Low-Income Americans and the ACA.
While uninsured Texans with an ongoing health condition are more likely than those without to report receiving services (Figure 10), they are still less likely than their insured counterparts to receive care. Less than half (43%) of uninsured adults without an ongoing health condition say they received health care services in the last year, and more than eight in ten (83%) uninsured adults with a health condition received health care services. However, the latter rate is still lower than adults who have a health condition and have employer coverage or Medicaid, nearly all of whom (97% and 97%, respectively) reported receiving medical services over the course of the year.
Figure 10: Receipt of Health Care Services by Texas Adults in the Last Year, by Insurance Coverage and Health Status
When uninsured Texans do receive care, they sometimes receive free or reduced-cost care, though the majority does not. Among adults in Texas who reported that they received a health care service in the past year, 24% of uninsured adults in Texas reported receiving free or reduced cost care, versus just 3% of those with employer coverage (Figure 11). Notably, 49% of adults with Medicaid who received services reported that they received free or reduced cost care. They may have done so during a period of uninsurance in the previous year or may associate the fact that they pay little or no costs when they see a provider as receiving “free or reduced cost” care. Uninsured adults in Texas who received care were much more likely than their insured counterparts to be asked to pay up front for care: one-third (33%) reported being asked to pay for the full cost of medical care (not counting copayments) before they could see the doctor or provider, compared to just 18% of those with employer coverage. Adults with employer coverage may have experienced these issues during a period in the past year when they lacked coverage or when using a service not covered by their insurance.
Figure 11: Paying for Health Care Services by Texas Adults in the Last Year, by Insurance Coverage
Although some uninsured and insured adults in Texas reported receiving free or reduced cost health care services, a larger share reported an unmet need for care. Nearly half (47%) of the uninsured and Medicaid (50%) beneficiaries in Texas reported needing but postponing care, compared to 31% of adults with employer coverage (Figure 12).
Figure 12: Share of Adults in Texas with an Unmet Need for Care, by Insurance Coverage
The most common reason for postponing care among uninsured Texans is cost (75%). Adults with employer coverage (44%) or Medicaid (35%) are less likely to report cost as a reason for postponing care because presumably their insurance pays most or all of that cost (Figure 13). However, adults with employer coverage or Medicaid may report postponing care due to cost if their health insurance does not cover a specific treatment that they need. Appointment availability was also reported as a significant reason for postponing care. Almost four in ten adults with Medicaid (39%) and nearly three in ten uninsured adults (29%) reported postponing care because they could not get an appointment soon enough. A quarter of adults with employer coverage reported that the office not being open when they could get there as a reason for postponing. Many physicians do not have hours outside of the normal workday, so some working adults may need to take time off to get care.
Figure 13: Reasons for Postponing Needed Care Among Adults in Texas, by Insurance Coverage
As resources and attention shift to the newly-insured population, individuals left out of coverage expansions (such as poor adults) will continue to have health needs. The ACA included funds to expand service capacity in medically underserved areas, including expansion of community health centers, nurse-managed health centers, and school-based clinics. To meet the health care needs of both insured and uninsured individuals, these systems will be challenged to develop flexible treatment times and new models of care to accommodate people’s availability and to expand capacity in areas where low-income individuals reside or seek care.
Many uninsured Texans reported limited options for receiving health care when they need it.
Uninsured adults in Texas are less likely than their insured counterparts to receive care in a private physician’s office. Uninsured adults in Texas are also more likely to go to a clinic or health center than a private physician’s office when receiving care. Nearly four in ten (39%) uninsured Texas adults who have a regular source of care reported that it is a physician’s office or HMO, compared to over seven in ten (71%) of adults with employer coverage (Figure 14). Meanwhile, 45% of uninsured adults in Texas who have a regular source of care reported clinics or health centers as their usual source of care, nearly twice as high as adults with employer coverage (23%). Notably, 17% of uninsured adults in Texas reported the emergency room as their usual source of care – substantially higher than adults with private insurance (data not shown).
Figure 14: Type of Place Used for Usual Source of Care for Adults in Texas, by Insurance Coverage
Uninsured adults in Texas are more likely than other adults to report that they have limited options for their usual source of care. Among people with a usual source of care, 37% of the uninsured reported that they chose their usual source of care because it is affordable, compared to 2% with employer coverage (Figure 15). Adults with employer coverage are more likely to choose a site of care based on the ability to see their preferred provider compared to uninsured adults. Most of those who say they chose their usual source of care based on cost chose to go to a clinic or health center, reflecting the fact that these providers often have a mission to serve low-income populations and offer services with sliding scale fees.20
Figure 15: Reason for Choosing Usual Source of Care for Texas Adults, by Insurance Coverage
Report: Financial Security Among Uninsured Adults In Texas
Poor and moderate-income families in Texas face multiple financial challenges on a daily basis, but a major challenge is the cost of health care. Poor and moderate -income adults without coverage are particularly vulnerable, facing even more financial strain than their insured counterparts. Both insured and uninsured adults in Texas struggle with medical bills and debt. Coverage expansions, assistance with premium costs, and limits on out-of-pocket costs under the ACA have the potential to ameliorate the financial issues associated with the cost of health care, but many uninsured adults, primarily poor adults, will be left without any assistance.
Health care costs pose a challenge for poor and moderate-income families in Texas, particularly if they are uninsured.
Health care accounts for a major budget item for low-income families, and affordability is a concern for many. Health care costs translate to medical debt for many poor adults. Over a third (36%) uninsured adults in Texas have outstanding medical bills (Figure 16). Notably, many insured Texas adults also report having medical bills that are unpaid or being paid off over time. However, given that the uninsured use less care than the insured, the high rates of medical debt among the uninsured indicate particular financial burden of having to pay the full cost of care on their own.
People may report medical debt but not have a problem paying that debt. However, when asked directly whether they had problems paying medical bills in the past year, notable shares of uninsured adults (18%) and adults with Medicaid (16%) reported that they did (Figure 16). In many cases, the problems people had paying medical bills were severe. Many reported that medical bills caused them to either use up all or most of their savings, have difficulty paying for necessities, borrow money, or be contacted by a collection agency.
Figure 16: Medical Debt and Problems with Medical Bills Among Adults in Texas, by Insurance Coverage
In addition to many poor adults in Texas reporting that they experienced financial strain or difficulty with health care costs, many live with worry about their ability to afford costs in the future. The vast majority of uninsured Texas adults across all income groups reported that they lack confidence that they can afford either the cost of care for services they typically require (Figure 17) or the cost of care should they face a major illness (Figure 18). While not surprising, this finding indicates that uninsured adults in Texas are aware of the high cost of health care services, as even those with moderate or high incomes do not believe they can afford these costs.
Figure 17: Lack of Confidence Among Texas Adults in Affording Usual Health Care Costs, by Insurance Coverage and IncomeFigure 18: Lack of Confidence Among Texas Adults in Affording Major Illness, by Insurance Coverage and Income
Affordability provisions in the ACA could ameliorate some of the challenges that poor insured Texans face in affording care. Under the law, qualified health plans must cover preventive services with no cost sharing and are prohibited from placing annual or lifetime caps on the dollar value of insurance coverage. In addition, plans may not exclude coverage for pre-existing conditions, which often were excluded from nongroup plans in the past and may have led to high out-of-pocket costs for insured individuals. Last, Texans who purchase coverage through the Texas Marketplace and have incomes up to 400% FPL receive tax credits to help them pay for their premiums, and those with incomes up to 250% FPL also receive subsidies to help with cost sharing under their plans. However, given survey findings that many poor insured people continue to face financial challenges related to health care, people may perceive even limited out-of-pocket costs to be unaffordable. It will be important to track whether there are ongoing financial barriers as people enroll in coverage and seek care. Further, many poor uninsured adults in the state will remain ineligible for financial assistance and are likely to continue to face financial hardship due to health care costs.
Uninsured adults living in poverty face fragile financial circumstances.
Difficulty or worry about paying for health care translates to expenses in other areas as well, and poor and moderate-income adults across coverage groups reported not being financially secure. However, adults in Texas who are poor and uninsured or covered by Medicaid are particularly vulnerable to financial insecurity even outside of health care. Among those with incomes <100% FPL, almost six in ten uninsured adults (59%) reported that they feel generally financially insecure (Figure 19). Notably, there are no significant differences across coverage groups among poor adults. This pattern may reflect the tenuous financial situation of adults with incomes below 100% FPL, regardless of insurance.
Figure 19: Lack of Confidence Among Texas Adults in Affording Major Illness, by Insurance Coverage and Income
General financial insecurity translates to concrete financial difficulties in making ends meet. Uninsured adults and those enrolled in Medicaid are more likely than those with employer coverage to have difficulty paying for other necessities, such as food, housing, or utilities, with 58% and 67%, respectively, reporting such difficulty, compared to 20% of those with employer coverage (Table 5). While poor adults (<100% FPL) in Texas across the coverage spectrum reported high rates of difficulty paying for necessities, those with employer coverage reported the lowest rates in this income group. These individuals may have the stronger or more stable ties to employment than their counterparts with other or no insurance coverage. A similar pattern holds for people’s ability to get ahead financially, either saving money or paying off debt.
Large shares of adults across income and coverage groups have also reported that they have taken on debt or taken money out of their savings to pay bills in the past year. About a third of uninsured adults and of those enrolled in Medicaid report changing their living situation or postponing marriage or children for financial reasons (Table 5).
Table 5: Financial Difficulty Among Adults in Texas, by Income and Coverage
Uninsured
Insured
Employer
Medicaid
Has difficulty paying for necessities
All incomes
58%
20%*
67%
<100% FPL
68%
53%
84%*
100-400% FPL
54%
24%*
53%
>400% FPL
—
14%
—
Has difficulty saving money
All incomes
84%
49%*
83%
<100% FPL
89%
83%
85%
100-400% FPL
80%
57%*
86%
>400% FPL
—
40%
—
Has difficulty paying off debt
All incomes
58%
37%*
53%
<100% FPL
62%
71%
65%
100-400% FPL
55%
41%*
48%
>400% FPL
—
31%
—
Taken on debt or took money out of savings to pay bills
All incomes
47%
40%
36%
<100% FPL
41%
41%
23%*
100-400% FPL
51%
44%
57%
>400% FPL
—
38%
—
Changed living situation or postponed marriage/children for financial reasons
All incomes
33%
21%*
31%
<100% FPL
34%
42%
35%
100-400% FPL
33%
21%*
—
>400% FPL
—
18%
—
Notes: “–“: Estimates with relative standard errors > 30% or sample size too small for analysis are not provided.*Estimate statistically significantly different from uninsured estimate at the 95% confidence level.SOURCE: 2013 Kaiser Survey of Low-Income Americans and the ACA.
Though it is not surprising that many poor families are in a precarious financial situation, it is notable that poor adults who lack insurance coverage or who were covered by Medicaid before the ACA are more financially unstable than their privately-insured counterparts. This finding is of particular concern given many poor adults remain ineligible for Medicaid in the state. In Texas, Medicaid coverage for adults is targeted to those with the greatest need, and this role is reflected in the fact that they face similar financial challenges as their uninsured counterparts. While insurance coverage can provide financial protection in the event of illness or injury, it is not curative of all of the financial burdens faced by poor families. Given their overall situation, health insurance alone may not lift poor people out of poverty, and many poor adults may continue to face financial challenges even after gaining coverage. Coverage under the ACA may help address some of the consequences of financial instability among moderate-income families, and linking adults with other support systems may help address the broader financial challenges that they face.
Report: Policy Implications
The survey findings have implications for early implementation of the ACA in Texas and for ongoing policy development in the state. Uninsured adults in Texas are generally in low-income, working families and have lacked insurance coverage for quite some time. Most do not have access to coverage through their jobs, and many have unsuccessfully tried to enroll in coverage in the past. Many uninsured adults in Texas have substantial health care needs but have only loose ties to the health system, facing considerable barriers in trying to access care when they need it.
Removing Some Barriers to Health Insurance and Care
Many ACA provisions may facilitate moderate-income adults’ access to health insurance in Texas. Large employers will face penalties if they do not provide coverage to their workers, and insurers may not deny coverage based on health status and history. In addition, private premiums can only vary based upon age, location, and tobacco use, and health plans may not use annual or lifetime spending caps. Texans who purchase health plans through the Marketplace, and have incomes between 100% and 400% of the federal poverty level, may receive tax credits to help them pay for premiums, with those who have incomes between 100% and 250% of the federal poverty level also eligible for subsidies to aid with the cost sharing. The survey results indicate that these provisions may address many of the barriers that Texans have faced in accessing coverage, such as not having coverage through a job, not being able to afford coverage, or having a health condition that might price them out of the market. While open enrollment has ended for Marketplace coverage in 2014, as of November people can sign up for Marketplace plans to begin in 2015.
Not expanding Medicaid limits the coverage options for poor Texans. Because Texas is not expanding Medicaid, over a million uninsured Texans who would have been eligible for Medicaid fall into the coverage gap. They are not eligible for the Marketplace subsidies and tax credits, most do not have access to coverage through a job, and they likely are unable to afford coverage on their own. These remaining uninsured adults are likely to continue to face the access to care issues that they currently face by being unlinked to the health care system. The survey shows that currently less than half of the uninsured have a usual source of care, and even uninsured Texans with an ongoing health condition face barriers to receiving care compared to their insured counterparts.
Although Texas is not expanding Medicaid, the ACA does include other provisions that affect low-income Texas residents who were already eligible for Medicaid. The survey shows that 35% of adults who attempted to sign up for Medicaid found assembling the paperwork difficult. The ACA included provisions to simplify the Medicaid application, enrollment, and renewal processes. These requirements included implementing a single application that is available online, by phone, and on paper; electronic transfers of accounts between health coverage programs; and reliance on electronic data to verify eligibility, rather than requiring paper documents. These provisions may lead to smoother enrollment and renewal in the Medicaid program.
Reaching Eligible Uninsured Adults
There are many challenges to reaching uninsured adults who are eligible for coverage under the ACA. Some uninsured adults in Texas may be hard to reach as part of outreach efforts: many do not speak English, and the eligible population is very diverse. Over half (56%) of the uninsured identify as Hispanic and 40% are under age 35. Additionally, many families have mixed citizenship status, and effectively reaching these families and building enough trust to enroll the eligible in health insurance is a challenge. Many uninsured Texan adults have been outside the insurance and health care system for quite some time and may not be easily reached through traditional avenues.
Outreach and enrollment is an ongoing process. While there was much focus on the initial push to enroll people in coverage under the ACA, enrollment is not a “one shot” effort that will be completed in the first few months of implementation. The survey findings reveal that nearly one in five (19%) of Texans lose and gain coverage throughout the year because of job changes, income fluctuations, or problems at renewal. Thus, implementing the ACA is an ongoing effort to enroll and keep people in coverage.
The Continuing Role of Safety Net Providers in Texas
Many people will remain without coverage in Texas. Uninsured residents access health care less frequently than insured individuals, often forgoing preventive care measures. The survey shows that nearly half (47%) of the uninsured postponed needed care in the previous year, and three quarters of those uninsured who postponed care did so because of the cost. The low-income uninsured are particularly vulnerable, as they face even more financial strain when they do get sick than their insured counterparts. Many uninsured adults rely on federally qualified health centers and public hospitals when they do access care. However, many health centers are already operating at capacity, and these facilities are generally not equipped to provide specialty care. Additionally, DSH funding will be reduced in next several years. It will be important to monitor how well the safety net in Texas is able to meet the continuing and growing demand for services in this context.
Methodology
This report is based on findings from the Texas component of the 2013 Kaiser Survey of Low-Income Americans and the ACA. This survey, conducted by the Kaiser Family Foundation (KFF), examines health insurance coverage, health care use and barriers to care, and financial security among insured and uninsured adults across the income spectrum, with a focus on populations targeted for coverage expansions under the Affordable Care Act (ACA). The survey provides a baseline against which future surveys can assess the impact of the ACA on low- and moderate-income adults. The 2013 Kaiser Survey of Low-Income Americans and the ACA includes a national sample as well as three state-specific samples in California (conducted with support the Blue Shield of California Foundation (BSCF)), Missouri (conducted with support from Missouri Foundation for Health (MFH)), and Texas.
The survey was designed and analyzed by researchers at KFF, with feedback on the California and Missouri state-specific components from BSCF and MFH, respectively. Social Science Research Solutions (SSRS) collaborated with KFF researchers on sample design and weighting; SSRS also supervised the fieldwork.
The survey was conducted by telephone from July 24 through September 29, 2013, from a representative random sample of Texas residents between the ages of 19-64. In total, 1,809 interviews were completed with respondents living in Texas. Computer-assisted telephone interviews (CATI) conducted by landline (892) and cell phone (917) were carried out in English and Spanish by SSRS.
Because the study was designed to focus on the low-income population, the sample was designed to over-sample this group. To efficiently reach lower-income respondents, the sample was stratified based on the estimated income level of geographic areas within the state. This process was done separately for the landline and cell phone sampling frames. For the landline sample, strata were defined based on the median income within telephone exchanges; for the cell phone sample, strata were defined based on the household income associated with the billing rate-center to which the cell phone number is linked. The exact criteria for distinguishing between the strata varied from state to state. In addition, a small number of interviews (<1% of the total sample) were conducted with respondents who were previously interviewed by SSRS as part of omnibus surveys of the general public and indicated they were ages 19-64, resided in the state, and reported annual income of less than $25,000. These previous surveys were conducted with nationally representative, random-digit-dial landline and cell phone samples.
Screening for the survey involved verifying that the respondent (or another member of the household for the landline sample) met the criteria of: 1) being 19-64 years old; and 2) providing income information that allowed them to be classified by family income. Respondents were classified by family income as a share of the federal poverty level (FPL) based on their family size and total annual gross income.21 Poverty level groups included income < 138% of FPL (the income range for the Medicaid expansion), income of 139-400% FPL (the income range for Marketplace tax credits), and income of over 400% FPL (eligible only for unsubsidized coverage). For the landline sample, if two or more people met the criteria, a respondent was randomly selected by the CATI program. Selected respondents were asked to confirm their state of residence.
A multi-stage weighting approach was applied to ensure an accurate representation of the various income groups ages 19 to 64. The weighting process involved corrections for sample design as well as sample weighting to match known demographics of the target populations in order to correct for systematic non-response along these parameters. The base weight accounted for the oversamples used in the sample design, as well as the likelihood of non-response for the re-contact sample, number of eligible household members for the landline sample, and a correction to account for the fact that respondents with both a landline and cell phone have a higher probability of selection. Demographic weighting parameters were based on population estimates for the 19-64 year old poverty-level population in the state based on the U.S. Census Bureau’s 2011 American Community Survey (ACS). The weighting parameters for each poverty-level group were: age, education, race/ethnicity, presence of own child in the household, marital status, region, and phone-status. All statistical tests of significance account for the effect of weighting.
The number of respondents and margin of sampling error (including the design effect) for the entire Texas sample and for subgroups based on income are shown in Table A. For results based on other subgroups, the margin of sampling error may be higher. Sample sizes and margin of sampling errors for other subgroups are available by request. In reporting results, any estimate with a relative standard error (standard error divided by the point estimate) greater than 30% is considered unreliable and not reported. Note that sampling error is only one of many potential sources of error in this or any other survey.
Table A: Number of Respondents and Margin of Sampling Error for Texas Sample
N
Margin of Sampling Error
Texas Total
1,809
+/- 4 percentage points
<138% FPL
754
+/- 6 percentage points
139% – 400% FPL
753
+/- 5 percentage points
>400% FPL
302
+/- 8 percentage points
In analyzing results, we group respondents into the mutually exclusive insurance categories of: Uninsured (report that they are not covered by health insurance), Employer Coverage (report that they have a plan through their own employer, a spouse’s employer, or a parent’s employer), and Medicaid (including people who are dually eligible for Medicare coverage). In capturing Medicaid coverage, the state-specific program name was used. A small number of people report that they are covered by other sources, including Medicare (<5%), a government program besides Medicaid or Medicare (<3%), or some other source such as the VA, school-based coverage, or an unnamed source (<3%). We do not report results for people covered by these other coverage categories, as sample sizes were generally too small for reliable estimates.
Because eligibility for two of the law’s main coverage provisions– the Medicaid expansion and tax credits to purchase insurance through Marketplace– is based on an individual’s family income relative to the federal poverty level (FPL), we report survey results by FPL categories that match eligibility levels under the ACA. In Texas, these categories are 1) those with incomes under 100% FPL or less (roughly $20,000 a year for a family of 3); 2) those with incomes of 100 to 400% FPL (roughly $20,000-$79,000 for a family of 3), the income range for tax credits in the Marketplace; and 3) those with incomes above 400% FPL, who are not be eligible for financial assistance in gaining coverage. These classifications are not intended to fully capture eligibility, as not everyone in these income ranges will be eligible for coverage under the ACA. For example, undocumented immigrants are ineligible for coverage under the ACA, and recent legal immigrants with incomes below poverty can purchase subsidized coverage through the Texas Marketplace. In addition, some people may be ineligible for premium subsidies through the Texas Marketplace because they have access to affordable employer coverage. However, the income categories provide a picture of the population targeted by various expansions, rather than a picture of the specific population eligible under the law.
We define undocumented immigrants as those who reported 1) they were born outside the United States, 2) are not a citizen, 3) did not have a green card when they arrived in the United States, and 4) have not received a green card or become a permanent resident since arriving. This measure may be subject to error in several ways. First, it relies on self-reporting, and respondents have an incentive not to reveal unlawful immigration status. Second, those that did not answer all questions in the series of immigration status items (3 respondents) were not able to be categorized and were therefore included; if they are in fact undocumented, then the results may differ slightly. Third, a small number of people may have a legal status besides permanent residency or green card (such as refugees, asylees or other humanitarian immigrants). Unfortunately, due to time constraints, the survey was not able to fully explore all of these immigration pathways.
This report includes analysis of findings from the survey that may inform early challenges in implementing health reform. It does not include a full reporting of all the findings from the survey. Survey toplines with overall frequencies for all items in the questionnaire are available upon request.
Appendix
Additional Tables
Table A1: Demographics of Adults in Texas, by Insurance Coverage
Uninsured
Insured
Employer
Medicaid
Income
<100% FPL
40%
5%*
51%
100-400% FPL
54%
39%*
42%
>400% FPL
6%
56%*
—
Family Work Status
Working Family
69%
92%*
23%*
Non-Working Family
31%
8%*
77%*
Age
19-25
16%
14%
—
26-34
24%
19%
—
35-44
29%
22%
26%
19-44
69%
55%*
44%*
45-64
31%
45%*
56%*
Health Status
Ongoing Health Condition
33%
33%
74%*
No Ongoing Health Condition
66%
67%
25%*
Fair or Poor Health Status
Excellent/Very Good/Good
59%
89%*
33%*
Fair or Poor
40%
11%*
67%*
Race
White, Non-Hispanic
30%
58%*
28%
Hispanic
56%
24%*
50%
Black, Non-Hispanic
11%
10%
15%
Citizenship
Citizen
62%
94%*
86%*
Non-Citizen
38%
6%*
—
Notes: Don’t Know and Refused responses not shown.”–“: Estimates with relative standard errors greater than 30% or sample size too small for analysis are not provided.* Estimate statistically significantly different from uninsured estimate at the 95% confidence level.Source: 2013 Kaiser Survey of Low-Income Americans and the ACA.
Table A2: History of Uninsurance and Attempts to Gain Coverage Among Currently Uninsured Adults in Texas, by Income
All
By Income
<100% FPL
100-400% FPL
Length of Time Uninsured
< 3 months
6%
—
6%
3 Months to Less than a Year
11%
9%
11%
1 Year to 5 years
29%
22%
33%^
5 Years or More
22%
18%
25%
Have Never Had Coverage
31%
44%
24%^
Attempts to Gain Coverage
Applied for Medicaid in past 5 years
22%
25%
20%
Applied for Medicaid but did not enroll
16%
16%
15%
Applied for Medicaid but told ineligible
15%
13%
15%
Tried to purchase nongroup coverage in past 5 years
15%
12%
16%
Tried to purchase nongroup coverage but did not purchase policy
11%
8%
13%
Tried to purchase nongroup coverage but too expensive
9%
6%
11%
NOTES: Don’t Know and Refused responses not shown.”–“: Estimates with relative standard errors greater than 30% or sample size too small for analysis are not provided.NA: Not applicable. Estimates not shown for >400% as estimates do not meet criteria for statistical reliability.^ Estimate statistically significantly different from <100% FPL estimate at the 95% confidence level.SOURCE: 2013 Kaiser Survey of Low-Income Americans and the ACA.
Based on data from the Centers for Medicare and Medicaid Services (CMS), State Medicaid and CHIP Income Eligibility Standards Effective April 1, 2014. ↩︎
Centers for Medicare and Medicaid Services, Texas Medicaid. ↩︎
Adults who qualify through a disability pathway may have higher income levels than adults who qualify through a parent pathway. ↩︎
These percentages are possibly over-estimates, as the survey is unable to differentiate between undocumented immigrants and residents with refugee or asylee status. ↩︎
On February 10, 2014, the Obama Administration delayed penalties associated with this Employer Responsibility Provision until 2015. U.S. Department of the Treasury, “Treasury and IRS Issue Final Regulations Implementing Employer Shared Responsibility Under the Affordable Care Act for 2015” (February 10, 2014). http://www.treasury.gov/press-center/press-releases/Pages/jl2290.aspx. ↩︎
Institute of Medicine, Committee on the Consequences of Uninsurance, Board on Health Care Services “Coverage Matters: Insurance and Health Care” (Washington DC: National Academy Press: Institute of Medicine, 2001). ↩︎
In capturing family size, we include all members of the respondents’ immediate family, including themselves, spouse (if married), and any dependents, as well as parents if the respondent is a dependent. These groupings mimic “health insurance units” that are used to determine eligibility for Medicaid and Marketplace coverage. ↩︎
June Poll Finds No Change in Public’s Overall View of the Affordable Care Act
Most in Military Households Say VA Problems Are Systemic and Care Not As Good As What Other Americans Receive
As many employers begin to expand their wellness programs under new guidelines set forth by the Affordable Care Act (ACA), the latest Kaiser Health Tracking Poll finds workers oppose programs that make them pay higher premiums if they fail to participate or meet specific health goals.
Overall, a large majority (76%) of the public says it is appropriate for employers to offer wellness programs to promote healthy behaviors among their workers, but most (62%) also say it is not appropriate for employers to require workers to pay more for their health insurance premiums if they don’t participate in those programs. Even more (74%) say it is inappropriate for employers to require that workers pay more if they are unable to meet certain health goals.
The results are similar among working-age adults who get their insurance through an employer. A large majority (80%) is supportive of wellness programs themselves, but most oppose requiring workers to pay higher premiums if they don’t participate (62%) or if they don’t meet certain health-related goals (75%).
For many years, employers have offered a wide range of wellness programs to their workers, and some have recently started using financial rewards or penalties as incentives to get workers to participate and to meet specific health outcomes such as lose weight or meet a body-mass index target. The Affordable Care Act includes provisions that permit certain financial incentives and penalties related to health outcomes as part of employer wellness programs, and federal rules published last year set standards for such programs.
Overall public opinion of the ACA remains about the same as it has for the last several months, with a somewhat higher share of the public continuing to express an unfavorable view of the law (45%) than a favorable one (39%). Views continue to be polarized by political party, with a large majority of Democrats having a favorable view (66%), a large majority of Republicans unfavorable (74%), and independents in the middle but mostly negative (31% favorable, 53% unfavorable).
While a majority (53%) says the law hasn’t had much impact on their own families, this share has declined from 62 percent in January, perhaps indicating more people are starting to see the law having a direct or indirect impact on them and their families. The share saying that the law has left their family better off increased from 12 percent in January to 18 percent this month, but remains smaller than the share saying the law has left their families worse off (26%).
In addition, this month’s Health Policy News Index finds more than six in 10 (62%) say they followed news about long waiting lists for those seeking care at Veterans Affairs (VA) medical facilities closely. That makes the VA story the most closely followed health story in the first half of 2014, with slightly more people following it than followed several ACA enrollment stories earlier this year.
When asked their impressions of the quality of care veterans receive from VA medical facilities, more than twice as many people say it is worse than the care they would receive from private doctors and hospitals (44%) as say it is better (20%). Similarly, far more say the VA care is worse than what most Americans receive (47%) than say it is better (17%).
That finding is perhaps not surprising given negative media coverage, however, among those who have served in the U.S. military or have a veteran in their household, even larger shares say the care at VA medical facilities is worse than most Americans receive (53%) and worse than veterans would receive from private doctors and hospitals (53%).
Most of the overall public (63%) say the long waiting lists for veterans are signs of widespread problems throughout the VA system, with a much smaller share (22%) saying the problem is limited to a few facilities. People in military households are even more likely than the general public to believe the problems are widespread (71%).
The survey was designed and analyzed by public opinion researchers at the Kaiser Family Foundation and was conducted from June 12-18 among a nationally representative random digit dial telephone sample of 1,202 adults ages 18 and older. Interviews were conducted in English and Spanish by landline (601) and cell phone (601). The margin of sampling error is plus or minus 3 percentage points for the full sample. For results based on subgroups, the margin of sampling error may be higher.