Medicaid Health Homes: A Profile of Newer Programs

Authors: Julia Paradise and Mike Nardone
Published: Aug 6, 2014

Executive Summary

Section 2703 of the Affordable Care Act (ACA) established a new state option in the Medicaid program to implement “health homes” for individuals with chronic conditions, giving states a new tool to develop models of care designed to improve care coordination and reduce costs for high-need populations. The ACA also provided a 90% federal match rate for health home services during the first two years an approved health home program is in effect. As of this writing, 15 states have at least one health home program in place. In August 2012, the Kaiser Commission on Medicaid and the Uninsured (KCMU) issued a brief examining the first six health home programs. This update profiles health home programs in the nine states that have taken up the option in the intervening two years – Alabama, Idaho, Maine, Maryland, Ohio, South Dakota, Washington, Wisconsin, and Vermont. States implement their health home programs in their own ways, reflecting different targeting priorities, underlying delivery and payment systems, and visions of delivery system reform, as well as other state-level factors. Both diversity and themes can be seen in key areas of the more recent health home programs, as follows:

  • Geographic Scope. While the first health home states generally implemented their initiatives statewide, several states with newer programs limited their initiatives to selected counties initially. Local factors such as the existing provider infrastructure or geographic concentration of the target population may support a more limited approach.
  • Target Population. The newer health home states have used health homes to target both Medicaid beneficiaries with a broad cross-section of chronic conditions and narrower Medicaid populations defined by a particular chronic condition. Consistent with the vision of health homes as a tool for better integrating physical and behavioral health services for people with mental health conditions, the one constant among almost all health home states is the inclusion of individuals with serious mental illness in their target populations.
  • Health Home Providers. States whose programs serve a Medicaid population with a particular condition typically designate a narrower set of health home provider entities with significant experience serving that population. States targeting beneficiaries with a broader spectrum of chronic conditions generally rely on their existing network of primary care providers to provide health home services, with the health home structure and payment bolstering their capacity to serve people with complex chronic care needs. Two states also make separate payments to community-based or regional care coordination teams that support primary care practices operating as health homes.
  • Payment. While payment approaches vary, states generally pay health homes a per member per month (PMPM) rate based on the intensity of beneficiary needs and the staff resources required to meet them. Several states tier their payment rates to reflect different levels of beneficiary acuity and different interventions, and one state is implementing a payment withhold designed to incentivize provider-patient engagement and the development of care plans for health home beneficiaries. As health home programs become more firmly established and the parameters of what is approvable by CMS are more clearly defined, more states are likely to move in the direction of value-based payment.
  • Fee for service vs. managed care. Most of the nine states profiled in this brief are implementing their health home initiatives in a fee-for-service environment, in contrast to some of earlier states, which integrated health homes into their capitated managed care programs. This shift may, in part, reflect some of the complexities inherent in sorting out roles and responsibilities between managed care plans and health homes and preventing duplication of services and payment on behalf of health home enrollees.
  • HIT. Health home providers’ use of HIT to support care coordination and other health home services varies greatly by state, reflecting variation across states in the current capacity of providers, as well as in states’ ability to support health homes with HIT and their progress in developing a state HIE.

Looking Ahead

In a recent 50-state survey of Medicaid directors conducted by the KCMU, 21 states indicated that they planned to adopt or expand their use of health homes, evidence of the popularity of this new state plan option with enhanced federal financing. As state Medicaid programs continue to take action to improve health care delivery, the 90% federal match remains available for new health home programs, expansions of existing programs, and additional programs in states that already have health home programs in place. Later in 2014, the HHS Secretary is due to submit an interim Report to Congress on the five-year evaluation of the health home program required by the ACA. In the meantime, these state profiles of the health home programs now in operation illustrate how the option can be adapted to states’ diverse priorities and capacities, and inform their efforts to provide better care for Medicaid beneficiaries, advance health outcome goals, and spend Medicaid dollars more effectively.


Key Dimensions of Newer Medicaid Health Home Programs
Target PopulationProvidersPaymentGeographic ScopeEnrollment*
Alabama2 chronic conditions; one & risk for another; or SMI. ACA conditions, cancer, HIV, sickle cell anemia, organ transplant, others.Existing Enhanced PCCM practices & Primary Care Networks of  AlabamaPMPM4 regions covering 21 of 67 counties.70,206
IdahoDiabetes & asthma; or diabetes or asthma & risk for another condition; or SMI or SED.PCCM PCPs, if required  infrastructure & provider capabilities are in place.PMPMStatewide9,179
Maine2 chronic conditions or one & risk for another; & SMI or SED (not yet approved by CMS) . ACA conditions, tobacco use, COPD, HBP, hyperlipidemia, DD or autism spectrum disorders, acquired brain injury, others.Qualified PCCM practices in partnership with Community Care Teams or, for SMI/SED population, in partnership with behavioral health home organizations.PMPM. Higher rate for more complex patients.Statewide42,958
MarylandSMI or SED; or opioid substance use disorder and risk for another condition.Licensed psychiatric rehabilitation programs, mobile treatment services, & opioid treatment programsOne-time payment for intake & assessment, & PMPM.Statewide2,516
OhioSMI or SED.Community Behavioral Health Centers (CBHC)PMPM5 counties initially; statewide expansion planned10,312
South Dakota2 chronic conditions; one & risk for another; or SMI or SED. ACA conditions, COPD, HBP, others.Primary care physicians, PAs, advanced practice NPs, FQHCs, Indian Health Service Units, Rural Health Centers, & CMHCsTiered PMPMStatewide5,655
VermontOpioid addiction.Opioid Treatment Programs & physicians licensed to prescribe buprenorphine in Office-Based Opioid Treatment settings,  with PCMHs & Community Health TeamsPMPMStatewide (in 3 phases)2,949
Washington1 chronic condition & risk for another. Most ACA conditions, cancer, chronic respiratory conditions, dementia/Alzheimer’s, GI conditions, HIV/AIDS, intellectual disabilities, others.Regional health home lead entities contract with community-based care coordination organizations (CCOs) to provide health home services.One-time payment for outreach/care plan development, 2 PMPM levels, & incentives.Statewide except for Duals demonstration counties (King & Snohomish)22,792
WisconsinHIV/AIDS & another chronic condition or risk for another.AIDS Service OrganizationsOne-time payment for initial assessment/care plan development, & PMPM.4 counties with highest prevalence of HIV/AIDS188
* Source: http://www.medicaid.gov/State-Resource-Center/Medicaid-State-Technical-Assistance/Health-Homes-Technical-Assistance/Approved-Health-Home-State-Plan-Amendments.html

Issue Brief

INTRODUCTION

The Medicaid, the nation’s largest public health insurance program, serves more than 66 million low-income beneficiaries, many of whom have complex and chronic health care needs. Of the more than 9 million people who qualify for Medicaid based on a disability, research indicates that almost one-half suffer from mental illness and 45% have three or more diagnosed chronic conditions.1   Section 2703 of the Affordable Care Act (ACA) authorized a new state option in the Medicaid program, under a new section 1945 of the Social Security Act, to implement “health homes” for individuals with chronic conditions, giving states a new tool to develop more person-centered models of care that improve care coordination and potentially reduce costs for this high-need population. To promote health homes in Medicaid, the ACA also provided enhanced federal funding for states that take up the option. States receive a 90% federal match for health home services during the first two years an approved health home State Plan Amendment (SPA) is in effect.

As states seek to improve care delivery in Medicaid and grapple with ongoing budget pressures, the health home option has attracted significant state interest. As of this writing, 15 states have at least one approved SPA to provide health home services.2  In August 2012, the Kaiser Commission on Medicaid and the Uninsured (KCMU) issued a brief examining the first six approved Medicaid health home programs, with a focus on the first four states to receive CMS approval – Missouri, Rhode Island, New York, and Oregon – but also including Iowa and North Carolina. This brief provides an update describing the health home programs established in nine states that have taken up the option since then.

Key Health Home Parameters

Under the ACA, Medicaid beneficiaries, including individuals who are dually eligible for both Medicare and Medicaid, can potentially qualify for health home services if they have at least two chronic conditions, have one chronic condition and are at risk for another, or have one serious and persistent mental health condition. The ACA specifies a list of qualifying chronic conditions – mental health condition, substance use disorder, asthma, diabetes, heart disease, and obesity (Body Mass Index (BMI)>25) – but also authorizes the HHS Secretary to approve other health conditions that state may wish to target.

Health home services are defined to include:

  • comprehensive care management;
  • care coordination and health promotion;
  • comprehensive transitional care from inpatient to other settings;
  • patient and family support;
  • referral to community and social support services; and
  • use of health information technology (HIT) to link services, as feasible and appropriate.

States have broad latitude to determine the providers or entities that can serve as health homes. Under the ACA, health home services may be provided by a “designated provider,” which may be a physician, practice, clinic, or other entity or provider; a team of health professionals linked to a designated provider; or a community health team. All health home providers must have the necessary systems and infrastructure to provide health home services and meet quality standards established by the Secretary. They must have the ability to provide cost-effective and culturally appropriate person-centered services, and to develop a care plan for each individual that coordinates and integrates all the clinical services and non-clinical health supports that he or she needs. They must also use HIT to link services and foster communication among team members to the extent possible, establish a continuous quality improvement program, and report data to support program evaluation. States have considerable flexibility in establishing their payment methodologies for health home services, but must detail their payment methodology in their SPA.

Recently Approved Medicaid Health Home Programs

Since this time two years ago, nine states without previous health home programs have received CMS approval of their health home SPAs and implemented them – Alabama, Idaho, Maine, Maryland, Ohio, South Dakota, Washington, Wisconsin, and Vermont.3  These states’ programs provide new illustrations of ways that health home programs can be structured and tailored to support chronic care management for Medicaid beneficiaries. They include models that serve beneficiaries with a range of different chronic conditions, including conditions not on the ACA list, as well as models that more narrowly target to individuals with certain conditions. They also include models that use a state’s primary care case management (PCCM) infrastructure as the platform for its health homes, as well as one model distinguished by its reliance on a diverse set of administering organizations that are responsible for the provision of health home services to people with wide-ranging chronic health care needs. Following is a summary of the Medicaid health home programs in the nine states that have adopted the ACA option most recently.

Alabama

Target Population. Alabama’s health home program, which took effect in July 2012, targets Medicaid beneficiaries who have two chronic conditions, or one and a risk of developing another, or a serious mental illness (SMI). Building off the ACA list of chronic conditions, Alabama also included cancer, HIV, cardiovascular disease, chronic obstructive pulmonary disease, sickle cell anemia, and receipt of an organ transplant as qualifying conditions. As both Missouri and North Carolina did earlier, Alabama gained CMS approval to provide health home services to beneficiaries with just one of these chronic conditions based on data indicating that such individuals are per se at high risk of a second chronic condition.

According to the SPA, Alabama will identify individuals with a chronic condition on a monthly basis through analysis of Medicaid claims and/or Alabama Department of Mental Health payment data for the previous 18 months. In addition, the Primary Medicaid Provider (described below) or local hospital may refer a patient for enrollment. The health home program is limited to four geographic regions of Alabama that encompass 21 of its 67 counties, including Mobile and Madison Counties, two of the three largest counties in the state. Although the term of the enhanced match for health home services is set to expire in July 2014, Alabama recently submitted a Section 1115 waiver proposal to CMS that would expand health homes statewide as a bridge to implementation of capitated Regional Care Organizations, Alabama’s version of accountable care organizations. These organizations would be responsible for providing health home services for Medicaid enrollees with chronic conditions, as well as care coordination and case management for all Medicaid enrollees as needed.4 

Providers. Alabama is using its Enhanced Primary Care Case Management (EPCCM) program as a platform for providing health home services. Since 1997, under the state’s Patient 1st PCCM program, most Medicaid beneficiaries have been assigned to a Primary Medicaid Provider (PMP) who serves as their medical home and is responsible for providing necessary medical care to them either directly or through referral to other providers. Alabama subsequently enhanced its PCCM program by establishing regional Primary Care Networks of Alabama (PCNAs) to support PMPs’ care coordination and other medical home activities. PCNAs have a clinical team that includes a physician clinical director, a chronic care nurse, a nurse or social worker care coordinator, and a pharmacist. The clinical teams are also required to include an individual with behavioral health expertise to serve as a liaison between PMPs and community mental health and substance abuse providers. PMPs and PCNAs are required to have agreements with the state and each other to ensure that they meet state health home standards related to access to care, comprehensiveness and continuity of care, population data management and use of HIT, and capacity to provide culturally appropriate and person- and family-centered services.

Payment. Alabama pays both PMPs and PCNAs a per member per month (PMPM) amount for each beneficiary who is enrolled with a PMP and identified as eligible for health home services. To receive a PMPM payment, a PMP must document in the care management system that, at a minimum, he or she has monitored an eligible patient’s care management for treatment gaps or provided another health home service. The PMPM payment to the PCNA is intended to cover the cost of the health home services provided by PCNA clinical team members, including the review of individual-level data provided by the state on a monthly basis, to identify potential service gaps and take appropriate action.

HIT. Under a previous federal grant, the Alabama Medicaid agency developed an electronic health record (EHR) and clinical support tool called QTool. Also, the state contracts with the University of South Alabama to support Patient 1st through a web-based secure data management system called Real Time Medical Electronic Data Exchange (RMEDE), which provides timely reports on selected clinical measures, based on claims data. The Medicaid agency is responsible for developing the state Health Information Exchange (HIE) and will initially encourage the use of the HIE by implementing the federal voluntary EHR incentives, and will monitor utilization to determine whether additional steps may be necessary to encourage its adoption by PMPs.

Idaho

Target Population. Idaho received CMS approval to implement its statewide health home initiative in January 2013. Idaho’s program is an outgrowth of other state efforts to foster medical homes, including the Governor’s Idaho Medical Home Collaborative established in 2010. Idaho’s health home program targets Medicaid beneficiaries who have a serious and persistent mental illness (SPMI) or serious emotional disturbance (SED); diabetes and asthma; or either diabetes or asthma and are at risk for another condition. Those with diabetes or asthma are considered to be at risk for another condition if they have BMI>25, abnormal lipid levels, hypertension, or diseases of the respiratory system, or use tobacco. Medicaid beneficiaries who meet these criteria are automatically enrolled in a health home. They can also self-refer to a health home or be referred by any service provider.

Providers. Like Alabama, Idaho is using its PCCM program, Healthy Connections, as the foundation of its health home program. Specifically, designated health home providers must be Healthy Connection primary care providers, including physicians, clinical group practices, rural clinics, community health centers, community mental health centers, and home health agencies. However, to be designated providers, these primary care providers must have the infrastructure to provide health home services and submit an assessment ensuring that they have adequate provider capabilities. They must also meet requirements related to access, quality improvement, care coordination, and outreach and follow-up, and have achieved or be pursuing NCQA Level 1 recognition as a patient-centered medical home (PCMH).

Payment. Idaho pays health home providers a PMPM amount to cover the costs associated with delivering the full range of health home services. In setting the PMPM rate, the state took into account the composition of the team of health care professionals required to provide health home services, including a primary care provider, registered nurse, behavioral health professional, and clerical staff and medical assistant, as well as the provider costs associated with achieving Level 1 NCQA accreditation.

HIT. Idaho has developed a set of initial and final HIT standards for health home providers. Initially, health homes must have a structured information system in place to populate a disease management database and track and manage patients with chronic conditions. They must develop a plan to achieve the final HIT standards within 24 months, which include: having a systematic process for follow-up on tests, treatments, services, and referrals in the patient’s care plan; having HIT capacity such that information on patient health and care is accessible and adequate to permit identification of gaps in care and management of population health; and employing HIT and accessing members’ data through the Idaho Health Data Exchange, the state’s HIE, to conduct other processes necessary to provide health home services, to the extent feasible.

Maine

Target Population. MaineCare, Maine’s Medicaid program, implemented “Stage A” of its statewide health home initiative in January 2013, targeting individuals with a wide range of chronic conditions. The state added the following chronic conditions to those listed in the ACA: tobacco use, chronic obstructive pulmonary disease, hypertension, hyperlipidemia, developmental disabilities or autism spectrum disorders, acquired brain injury, seizure disorders, and cardiac and circulatory congenital abnormalities. For the most part, individuals with one of the qualifying conditions are considered per se at risk for another chronic condition based on research evidence cited in the SPA. “Stage B” of Maine’s health home program targets adults with SMI and children with SED. Stage B implementation began in April 2014, although CMS has not yet approved the SPA. MaineCare identifies beneficiaries who are eligible for health home services based on claims data. In addition, practices can notify MaineCare of beneficiaries who, though not identified through the analysis of claims data, appear eligible for health home services based on the practice’s clinical EHR documentation.

Providers. For beneficiaries with chronic conditions, health home practices (HHP) and Community Care Teams (CCT) together constitute Maine’s health home teams. HHPs build on the primary care practices in Maine’s existing PCCM program; to qualify as an HHP, a primary care practice must meet a set of additional requirements, which include having NCQA recognition as a PCMH (or a commitment to achieving this status), a fully implemented EHR, and a Memorandum of Understanding with a CCT; and to enroll eligible beneficiaries, they must confirm to the state that they will be participating in the health home initiative. Within one year, HHPs must also certify that they meet ten “Core Expectations” established by the state, which include, among others, a team-based approach to care, population risk stratification and management, inclusion of patients and families in implementation of the PCMH model, connections to community resources, and integration of HIT to support plans of care, evidence-based practices, and monitoring of outcomes.

CCTs are locally based multi-disciplinary groups of health professionals that work in partnership with HHPs to identify high-cost, high-risk patients, and provide wrap-around services and supports to help HHPs manage their care, including planning and coordinating referrals for community and social supports, as needed. Generally, about 5% of an HHP’s health home enrollees are offered the more intensive care coordination services provided by CCTs. Patient eligibility criteria for CCT services include a high number of inpatient admissions or (ED) visits, use of 15 or more medications for chronic care and/or multiple high-risk medications (e.g., insulin, Coumidin), high social service needs (e.g., homelessness), or identification by MaineCare as a high-risk/high-cost Medicaid enrollee. A CCT comprises a CCT manager who provides leadership and oversight, and a designated care management director and medical director. Care managers include nurses and social workers and/or behavioral health social workers, and lead care coordinators are matched to health home enrollees based on patients’ individual needs. Additional CCT staff may include nutritionists, case managers, pharmacists, community health workers, and others. Currently, ten CCTs have received state approval to provide health home services.

For beneficiaries with SMI or SED, Behavioral Health Home Organizations (BHHOs) that partner with primary care practices make up health home teams. BHHOs are licensed community mental health providers that also meet other criteria established by the state. As of March 2014, Maine had approved 27 Behavioral Health Homes.

Payment. HHPs receive higher PMPM payments for their health home-eligible patients. (They receive lower PMPM payments for PCCM patients who are not eligible for health home services.) To receive the health home PMPM, HHPs must, at a minimum, monitor their health home patients for treatment gaps or conduct outreach and engagement activities with health home enrollees assigned to a practice. CCTs also receive PMPM payments for the health home patients they serve and must document that they have engaged or reached out to these individuals or provided a health home service consistent with the individual’s care plan. In determining the PMPM amounts for HHPs and CCTs, the state estimated the staff costs associated with providing health home services, including both clinical and non-clinical staff. Given the more complex needs of the CCT patients, the health home PMPM for CCTs is considerably higher than the one for the HHPs. BHHOs and HHPs providing health home services for beneficiaries with SMI or SED also receive PMPM payments, tiered similarly to the PMPM payments for health homes for beneficiaries with chronic physical conditions.

HIT. As noted, HHPs are required to have fully implemented an EHR. In some cases, the HHP and CCT share a common EHR; otherwise, the HHP and CCT are expected to communicate using standardized direct secure messaging. The state has developed a Health Home Enrollment System (HHES) that both HHPs and CCTs can access to view their enrolled patients, refer new patients to health homes, attest that their patients have received the minimum required contact or services, and view reports indicating gaps in care. HHP and CCT teams can also access patient information through HealthInfoNet, Maine’s HIE.

South Dakota

Target Population. South Dakota’s health home SPA took effect in July 2013. The chronic conditions that qualify for health home services include all those identified in the ACA, as well as chronic obstructive pulmonary disease, hypertension, and musculoskeletal and neck and back disorders. Beneficiaries with a diagnosed SMI are also eligible for health home services. Tobacco use, pre-diabetic condition, cancer, hypercholesterolemia, depression, and use of six or more medications are all considered risk factors for another chronic condition

The state uses the Chronic Illness and Disability Payment System (CDPS) index to sort beneficiaries who have been determined eligible for health home services into four tiers based on their risk scores. Individuals with the lowest risk scores are offered the opportunity to receive health home services but are not assigned to a health home provider. Those with higher risk scores are assigned to a health home provider with whom they have an existing relationship or, absent such a relationship, are offered an opportunity to select a health home provider. In addition, health home providers can contact the state to identify beneficiaries they think should be considered eligible for health home services. Individuals who do not choose a health home provider within 30 days are auto-assigned to one.

Providers. In South Dakota, designated health home providers include state-licensed and Medicaid-enrolled providers who practice as primary care physicians, physician assistants, advanced practice nurse practitioners working in a clinical or group practice, federally qualified health centers (FQHC), Indian Health Service Units, rural health centers (RHC), and mental health professionals working in a community mental health center (CMHC). Providers must attest that they meet the health home provider standards set forth in the SPA and complete a health home orientation before Medicaid beneficiaries can be attributed to them. A designated health home provider leads a team that may include a behavioral health provider, a health coach/care coordinator, a pharmacist, support staff, and others as appropriate.

Payment.  South Dakota pays health home providers on a PMPM basis, with PMPM amounts based on their beneficiaries’ tiers as determined by the CDPS score. The state developed four payment tiers based on the estimated “Uncoordinated Care Costs” for individuals in each tier. These costs include claims for non-emergent use of EDs, all-cause readmissions, and hospital admissions for ambulatory care-sensitive conditions. To receive a PMPM payment, a health home provider must provide at least one health home service per quarter to an attributed member, and the service must be documented in the health home’s EHR and reported to the state.

HIT. Health home providers are required to have an EHR. As an interim step, while the state develops its HIE, the Medicaid program is sharing monthly claims data with health home providers. These data enable them to: analyze paid claims over a two-year period for their attributed members; view the dates and providers of their inpatient, ED, and other services; and review laboratory data.

Washington State

Washington’s health home program is somewhat distinctive in that it encompasses Medicaid beneficiaries with a broad range of chronic conditions and relies on diverse organizations that serve as administering entities and subcontract with community-based care coordination organizations to provide health home services.

Target Population. Washington began the roll-out of its health home initiative in July 2013, targeting individuals with one chronic condition and at risk for another. The qualifying chronic conditions include those listed in the ACA statute (except BMI >25) as well as: cancer; cerebrovascular disease; chronic respiratory conditions; coronary artery disease; dementia/ Alzheimer’s disease; gastrointestinal conditions; hematological conditions; HIV/AIDS; intellectual disability or disease; musculoskeletal conditions; neurological disease; and renal failure. A person is considered “at risk” for a second chronic condition if he or she has a CDPS risk score of at least 1.5, indicating that his or her expected Medicaid spending is 50% higher than expected spending for beneficiaries with disabilities who qualify for Washington’s Medicaid program based on their eligibility for SSI.

The first phase of Washington’s health home initiative was limited to three areas comprising 14 counties located primarily in the southern part of the state. In October 2013, the state expanded the program to three additional areas that include the remaining counties except King County (Seattle) and Snohomish County. (Washington has received CMS approval to move forward with a capitated financial alignment demonstration for dual eligible beneficiaries in those two counties and is not implementing health homes there.)

Fee-for-service (FFS) beneficiaries who are eligible for health home services are identified by the state based on their chronic condition and risk score, and enrolled with a designated health home provider based on zip code and provider capacity. Providers can also refer potentially eligible beneficiaries by contacting the state. Designated FFS health home providers assign their health home enrollees to one of their network-affiliated Care Coordination Organizations (CCO), described below, and the CCO, in turn, assigns the beneficiary to a Care Coordinator. For Medicaid beneficiaries enrolled in managed care, managed care organizations (MCOs) that are qualified as health homes, or that contract with a health home, identify eligible beneficiaries based on their chronic condition and risk score and automatically enroll them into their health homes. Again, the health home assigns the beneficiaries to one of its network-affiliated CCOs, which then assigns each one a Care Coordinator.

Providers. Washington used a Request for Applications (RFA) process to qualify entities to serve as health home providers, referred to as “health home lead entities,” in each of the six geographic areas in the state. Health home lead entities are required to maintain a network of community-based care coordination organizations (CCOs) with the capacity to serve at least 1,000 to 2,000 beneficiaries, and to subcontract with these organizations to provide health home services directly to beneficiaries. CCO responsibilities include assigning care coordinators to eligible beneficiaries, ensuring beneficiary engagement in the development of a Health Action Plan, monitoring care and outcomes, initiating changes in care, and addressing the full needs of the beneficiary consistent with his or her plan of care. In addition to maintaining and overseeing a network of CCOs, each health home lead entity must be able to carry out key administrative functions, such as staffing a toll-free hotline, reporting to the state on financial, health status, and performance and outcome metrics, and paying CCOs based on the services they provide. Washington has selected four to five health home lead entities in each of the six coverage areas. They include physical health managed care organizations, behavioral health managed care organizations, two regional Area Agencies on Aging serving the northwest and southeast parts of the state, and a health care consortium composed of regional health care organizations in north central Washington.

Payment. Washington has three different payment tiers for different sets of health home services, as follows: Outreach, Engagement, and Health Action Plan Development; Low-Level Health Home Care Coordination; and Intensive Health Home Care Coordination. The Outreach payment is a one-time payment to the health home lead entity, triggered by the submission to the state of a Health Action Plan for an eligible beneficiary and documentation that a health home service has been provided to that person. The other two payments reflect different levels of service intensity. Lower payments are made for Low-Level Health Home Care Coordination, which relies more heavily on telephonic than in-person encounters between providers and beneficiaries. Higher payments are made for Intensive Health Home Care Coordination, which involves a higher ratio of FTEs to health home beneficiaries.

In the Medicaid FFS program, Washington makes PMPM payments for both these levels of care coordination to health home entities, which must provide at least one health home service to an eligible individual to claim reimbursement. Both payment amounts include a withhold equal to roughly 2% of the overall PMPM amount. Although the withhold will not be applied in Year 1 of the program, in future years a health home lead entity must meet target health home participation rates, defined as the share of beneficiaries assigned to a health home who have an Outreach encounter, to receive the full PMPM payment. With respect to health home-eligible beneficiaries who are enrolled in Washington’s Medicaid managed care program, health home services are included in the contracts between the state and managed care plans, and the costs of these services are built into the overall capitation rates paid to plans. Finally, in most of Washington, health home services will be provided to dual eligible beneficiaries as part of the managed FFS Fiscal Alignment Demonstration that the state has developed in partnership with CMS. Washington is eligible to share in savings realized from the demonstration if it can meet quality metrics contained in its agreement (i.e., Memorandum of Understanding) with CMS.

HIT. Washington provides health homes with access to its Predictive Risk Intelligence System (PRISM), a secure, web-based clinical support tool. PRISM uses predictive modeling to support identification of Medicaid beneficiaries most in need of care coordination, integrates information from medical, social, behavioral health, and long-term care data systems, and provides beneficiary health and demographic information from Medicaid administrative data sources. This resource is intended to complement existing provider-specific EHRs; information-sharing is facilitated by the Washington State’s HIE, OneHealthPort.

More Targeted Health Home Initiatives

Several states have developed health home initiatives that more narrowly target beneficiaries with a single specified chronic condition and rely on a narrower group of providers with expertise in serving the targeted population.

The ACA’s explicit inclusion of behavioral health conditions in the list of health home qualifying conditions and the health home program’s emphasis on person-centered care management that integrates physical and behavioral health care, reflect the premise that health homes are a promising model for individuals with SMI and/or substance use disorders. Indeed, three of the first states to receive approval of their health home programs (Missouri, Rhode Island, and Iowa) targeted beneficiaries with a behavioral health condition. Maryland, Ohio, and Vermont have now launched programs targeting this population as well. Wisconsin’s health home program is also narrowly targeted, to Medicaid beneficiaries with HIV/AIDS.

Maryland

Target Population. Maryland’s statewide health home program targets Medicaid beneficiaries who have a SMI or SED, and those who have an opioid substance use disorder (SUD) and are at risk of another chronic condition. Individuals who are diagnosed with an opioid SUD are eligible for health home services if they are engaged in opioid maintenance therapy and are determined to be at risk for additional chronic conditions based on current use of tobacco, alcohol or other non-opioid substances, or a history of dependence on such substances. Maryland uses claims data to identify Medicaid beneficiaries who are potentially eligible for health home services. Managed care plans and the state’s behavioral health Administrative Services Organization, or ASO (see below), may also assist the state in identifying and referring potentially eligible individuals from among their own members; behavioral health care is carved out of Medicaid managed care contracts in Maryland. Once they have obtained consent from a beneficiary, the state, managed care plan, or ASO refers the individual to a health home provider near where he or she lives.

Providers. Only providers licensed by the Maryland Department of Health and Mental Hygiene as a Psychiatric Rehabilitation Program (PRP), a Mobile Treatment Services (MTS) provider, or an Opioid Treatment Program (OTP) can serve as health homes. In addition, these entities must be accredited by, or in the process of gaining accreditation from, an approved health home accreditation body – currently, either the Commission on Accreditation of Rehabilitation Facilities’ (CARF) Health Homes Standards or The Joint Commission’s Behavioral Health Homes Certification. To provide health home services to children and youth, entities must also have a minimum of three years of experience serving this population. The SPA details the staffing infrastructure that a PRP, MTS, or OTP must have in place dedicated to health home services and establishes minimum staffing ratios. To be approved as health homes, providers must complete an application documenting that they can perform all core health home services and meet all state-defined provider standards. PRPs, MTSs, and OTPs that apply and meet these standards may enroll Medicaid beneficiaries who are participating in their programs into health home services if the beneficiary consents. The state intends to use claims data and work with its behavioral health Administrative Services Organization (ASO) to identify beneficiaries who could benefit from health home services.

Payment. Maryland pays health home providers a PMPM amount based on the estimated employment costs of the required health home staff. To receive payment, a health home must have provided at least two health home services to an eligible individual in the previous month and documented these services in Maryland’s on-line provider portal. Health homes also receive a one-time payment for completing an initial intake and assessment for each health home enrollee.

HIT. Heath homes have access to Maryland’s e-Medicaid online provider portal through which they can report and review health home enrollees’ intake and assessment information, the staff assigned to them, their clinical baselines and data relating to their chronic conditions, and health home services provided to them. Health home providers also have access to reports generated by e-Medicaid based on these data at both the participant and provider level. Finally, health home providers must be enrolled in the state’s HIE, Chesapeake Regional Information System for our Patients (CRISP), to receive real-time hospital encounter alerts and access pharmacy data.

Ohio

Target Population. Ohio’s health home program targets Medicaid beneficiaries whose condition(s) meet the state’s definition of SPMI, including adults with SMI and children with SED. Ohio intends to implement its program statewide ultimately, but initially rolled it out in five counties, including three contiguous counties in the southern part of the state – Adams, Scioto, and Lawrence Counties – as well as Butler County, and Lucas County (Toledo), beginning in October 2012. Provider readiness and capacity to serve the SPMI population and geographic diversity (i.e., rural, urban, and suburban representation) were among the factors the state cited in selecting these counties to go first.

The designated health home providers are responsible for identifying individuals with SPMI who are currently affiliated with their site. SPMI individuals who are not affiliated with a site that is a health home provider, or who have no routine source of health care, may be identified through referral from another provider or an administrative data review and then connected to a health home to begin the comprehensive care management process.

Providers. Community behavioral health centers (CBHCs) are the designated health home providers in Ohio. To be designated as health homes, CBHCs must be state-certified to provide mental health services, and must also have state-defined core elements that demonstrate their capacity to integrate the full range of physical, behavioral health, and support services. For instance, CBHCs must directly provide certain medical screening and treatment services on site or have written agreements with primary care providers (PCP) to provide these services. CBHCs must also attain accreditation from one of several organizations recognized by the state for certifying integration of physical and behavioral health services.

Although CBHCs have some flexibility in to define their health home teams, the SPA envisions a multi-disciplinary team with certain core members, including a health home leader, an embedded PCP, a care manager, and a health home specialist who assists the care manager with care coordination, referrals, follow-up, family/consumer support, and health promotion services. CBHCs designated as health home providers are also required to establish partnerships with managed care plans in their area because, although most Ohio Medicaid beneficiaries are enrolled in managed care, behavioral health is carved out of the managed care contracts. CBHCs must, among other requirements, identify a single point of contact within the CBHC to work with each managed care plan, notify a plan when one of its members is referred for health home services by the CBHC itself or another provider, and include a managed care plan representative on the care management team for each health home enrollee.

Payment. Ohio pays CBHCs a per member per month (PMPM) rate for health home services, determined on the basis of cost information submitted by the CBHCs. To receive payment, CBHCs must submit a claim for health home services. A claim can be submitted if any of the health home service components are provided to an eligible individual. Ohio intends to incorporate a performance component in its health home PMPM rates once it has sufficient experience and baseline information to do so.

HIT. The state is phasing in HIT requirements. Initially, all CBHC health homes must have the ability to receive utilization data electronically. Within one year of designation as a health home provider, a CBHC must acquire a certified EHR and, by the end of the second year, it must be able to demonstrate that it is using the EHR to support all health home services, including population management. CBHC health homes are also required to participate in the statewide HIE once it is up and running in their area.

Vermont

Target Population. Vermont’s health home program, approved by CMS in March 2014, targets Medicaid beneficiaries who are receiving Medication Assisted Therapy (MAT) for opioid addiction either at regional specialty addictions treatment centers regulated as opioid treatment programs (OTP), or physician offices licensed to prescribe buprenorphine. Based on data showing that individuals with opioid addiction are at high risk of having other substance use disorders and co-occurring mental health conditions, opioid addiction alone is considered sufficient to qualify an individual as being at risk for a second chronic condition and thus eligible for health home services. Most beneficiaries who are potentially eligible for health home services are identified through providers, clinical assessment, the prior authorization process for buprenorphine prescriptions, and enrollment in methadone treatment. Vermont implemented health homes statewide in three regional phases, beginning in January 2013.

Providers. Vermont’s health homes build on the state’s existing provider infrastructure: specialty methadone OTPs; physicians who prescribe buprenorphine in Office-Based Opioid Treatment (OBOT) settings; and local Blueprint for Health PCMHs and Community Health Teams (CHTs) that coordinate care across the primary, acute, behavioral health and long-term care systems and typically comprise nurse care managers, health coaches, social workers, and behavioral health clinicians. Under Vermont’s “Hub and Spoke” approach, each patient in MAT will have one MAT prescriber – either a Hub OTP that provides methadone or buprenorphine to clinically complex patients, or a Spoke physician licensed to provide OBOT using buprenorphine; an established PCMH; and access to nurses and clinicians embedded at the Hub or in a CHT who are responsible for providing health home services. Vermont’s CHTs, which are funded by Vermont’s public and commercial insurers, are programmatically and operationally overseen by a single Administrative Agent (AA) within each of the 14 geographically distinct health service areas in the state.

Payment. Hubs and the AAs overseeing the CHTs receive reimbursement for the added staffing costs associated with the provision of health home services. Hubs are paid an enhanced monthly rate for each eligible health home enrollee to finance the provision of health home services. To submit a claim and receive payment on behalf of a health home patient, a Hub provider must be able to document provision of two services to the individual during the month – a face-to-face treatment encounter and one health home service. The state claims the 90% federal match only for the 30% share of the Hub monthly rate that is attributable to health home services. Payment for Spoke health home services are made to the AAs that oversee the Blueprint CHTs, to fund one RN care manager and one clinician case manager for every 100 buprenorphine patients within the AA’s health service area. The payments, which are made quarterly, are determined based on the average monthly number of unique patients for which Medicaid paid a buprenorphine pharmacy claim during the most recent-three month period.

HIT. The Blueprint for Health utilizes a central clinical registry, Covisint DocSite, a web-based registry that receives feeds of guideline-based data elements from practices and hospitals. Data sources include EMRs, hospital data systems, practice management systems, and data entered directly into the registry through Vermont’s HIE infrastructure. In addition to patient care and population management, the registry supports performance reporting with measures derived from national guidelines on health care quality and outcomes. Both HUB and Spoke health home providers document their health home services in the EMRs currently in use within each facility and practice. Vermont’s goal is that these providers will eventually be linked with the clinical registry and the HIE. Among their responsibilities, the AAs are expected to convene working teams to encourage the exchange of health information from practice-based EMRs through the HIE to the Blueprint central clinical registry.   

Wisconsin

Target Population. Approved in January 2013, Wisconsin’s health home initiative targets beneficiaries with HIV/AIDS who have or are at risk for at least one other chronic condition. An individual is considered to be at risk based on any of the following clinical indicators: a low CD4 cell count; BMI<18.5; elevated blood pressure; elevated fasting blood sugar levels; or hyperlipidemia. The SPA limits health home services to four of the six counties with the highest rates of HIV/AIDS prevalence in the state – Milwaukee, Brown (Green Bay), Dane (Madison), and Kenosha Counties.5  Medicaid beneficiaries in these counties who meet the health home eligibility criteria are automatically enrolled in the program.

Providers. In Wisconsin, AIDS Service Organizations (ASOs) that provide life care services to individuals with HIV/AIDS in the targeted counties are the health home providers. The Division of Public Health in the state’s Department of Health Services is responsible for designating ASOs and defining the geographic regions in which they operate. ASOs must collaborate with local health departments, county human service departments, and community-based organizations in providing HIV/AIDS-related services.

Payment. ASOs receive two health home payments: 1) a fee for the initial comprehensive assessment of each health home enrollee’s needs and the development of an integrated care plan; and 2) a PMPM case rate for providing health home services. The initial fee is paid only for individuals eligible for health home services who consent to participate in the program. The PMPM payment is made only on behalf of beneficiaries who have completed the assessment and care plan development process and have an assigned care manager. In developing the health home payment rates, Wisconsin considered a number of factors, including the costs of developing a core health home team and the acuity and chronicity of eligible beneficiaries’ conditions. The SPA includes assurances that health home payments will not result in duplication of payments or services associated with other Medicaid programs, including managed care.

HIT. ASO health home providers must document all contact with beneficiaries in an EHR. The health home’s care coordinator is responsible for ensuring that patients’ treatment plans are updated in the EHR as needed, and the EHR must be accessible to all members of a patient’s care team.

Observations on Newer Health Home Programs

Each state implements its Medicaid health home program in its own way, reflecting different perspectives on which populations drive state Medicaid costs, specifics of their underlying health care delivery and payment systems and stakeholder environments, the capacity of different providers to provide health home services, different visions of delivery system reform, and other state-level factors. (See the Appendix for a table summarizing key dimensions of the health home programs profiled in this report.) Looking across the more recent programs, both diversity and themes are evident:

  • Geographic Scope. While the first states to establish health home programs generally implemented their initiatives statewide, several of the newer health home states are limiting their initiatives to selected counties, at least initially. Important considerations were their current provider infrastructure (e.g., PCNAs present only in certain regions of Alabama), the geographic distribution of the target population (e.g., the counties with the highest concentration of HIV/AIDS in Wisconsin), and preferred payment/delivery model (e.g., the exclusion of counties included in Washington’s capitated financial alignment demonstration for dual eligible beneficiaries). It may also be that states are proceeding cautiously with statewide implementation because of the time-limited 90% federal match for health home services.
  • Target Population. As did most of the first health home states, several of the nine states profiled in this brief have established a broader set of qualifying chronic conditions than those listed in the ACA. At the same time, several states are more narrowly targeting individuals with particular chronic conditions. Consistent with the vision of health homes as a tool for better integrating physical and behavioral health services for people with mental health conditions, the one constant among almost all 15 health home states is their inclusion of individuals with serious mental illness in their target populations.
  • Health Home Providers. States that have tailored their health home programs to serve a narrower Medicaid population with a particular condition have also designated a narrower set of health home provider entities with significant experience serving that population. States targeting beneficiaries with a broader cross-section of chronic conditions are generally relying on their network of primary care providers to provide health home services, with health home requirements and payments providing mechanisms to bolster their capacity to serve beneficiaries with complex chronic care needs. Two states also make separate payments to care coordination teams that support health home practices in serving high-need members (Alabama and Maine). These approaches are all similar to those taken by the first cohort of health home states. However, Washington took a somewhat distinctive approach, identifying regional health home lead entities that are responsible for maintaining a network of community-based care coordination organizations, and accountable for administering the health home program.
  • Payment. While health home payment varies by state, states generally pay a PMPM rate that is determined based on assumptions about the composition and cost of the care team. Health home PMPM rates within a state may vary based on health home enrollees’ predicted risk and the staff resources required to meet their needs. One state (South Dakota) tiers its PMPM rates based on estimates of the costs associated with uncoordinated care for different beneficiaries. Collectively, these payment practices are similar to those used by some of the earlier health home states. But the array of state payment approaches to achieve different objectives continues to widen. As an illustration, while Iowa (an early state) permits health homes to earn additional payments based on their performance on selected health metrics (e.g., diabetes care), Washington is implementing a payment withhold to incentivize provider-patient engagement and the development of care plans. States are also exploring other strategies to encourage quality and cost control, such as shared savings models. As health home programs become more firmly established and the parameters of what CMS will approve are more clearly defined, more states are likely to move in the direction of value-based payment.
  • FFS vs. Managed Care Context. While several of the earlier health home states implemented their initiatives in a predominantly managed care environment, most of the states in the more recent group are implementing them in a FFS context, including two states (Maryland and Ohio) where the dominant delivery system is managed care, but behavioral health services are largely carved out of managed care contracts, posing barriers to integration of physical and behavioral health care. In part, this observed shift might reflect some of the complexities inherent in sorting out roles and responsibilities between managed care plans and health homes and preventing duplication of services and payment on behalf of health home enrollees.
  • HIT. Health home providers’ use of HIT to support care coordination and other services for health home beneficiaries varies greatly by state, reflecting variation in the current capacity of providers, as well as in states’ ability to support health homes with HIT and their progress in developing a state HIE. A number of the states profiled here specifically require that health home providers use an EHR, or they make web-based tools and health information available to health homes to support better care management for their enrollees. As more states move from development to implementation of statewide HIEs, they could become more prescriptive about health home providers’ use of them.

Looking Ahead

In a recent 50-state survey of Medicaid directors conducted by the KCMU, 21 states indicated that they planned to adopt or expand their use of health homes, evidence of the popularity of this new state plan option with enhanced federal financing.6  The eight-quarter 90% federal match for health home services remains available prospectively to any state that decides to pursue CMS approval of a health home SPA. It also remains available for geographic expansions of current programs and for new health home SPAs in states that already have approved health home programs. As state Medicaid programs continue to improve health care delivery, the health home option is one mechanism they can adopt to advance and finance more person-centered, coordinated systems of care for those with the highest needs and costs. An interim report to Congress on the independent evaluation of the health home program required by the ACA is due in 2014. That report will provide a comprehensive assessment of Medicaid health homes, from early decision-making about their development to their impact on key health and cost outcomes and lessons learned. In the meantime, the nine programs profiled in this brief along with the six implemented earlier on illustrate how states can adapt the option to their particular priorities, needs, and capacities. Taken together, their diverse approaches can help inform the efforts of other states seeking to provide better care for Medicaid beneficiaries, achieve better health outcomes, and spend Medicaid dollars more effectively.

The authors wish to thank the following state officials, who contributed to the descriptions of the health home programs profiled in this brief: Dr. Robert Moon (AL), Matt Wimmer (ID), Michele Probert (ME), Chuck Milligan and Morgan Cole (MD), John McCarthy (OH), Kirby Stone (SD), Kelly Gordon (VT), and Mary Anne Lindeblad and Alice Lind (WA).

Appendix

Appendix:  Key Dimensions of Newer Medicaid Health Home Programs
TargetPopulationChronicConditionsProvidersPaymentMethodologyRelationship to MCOsHITGeographicScopeEnrollment*
AlabamaTwo chronic conditions; one & risk for another; or SMIACA conditions, cancer, HIV, cardiovascular disease, chronic obstructive pulmonary disease (COPD), sickle cell anemia, & organ transplant.Existing Enhanced PCCM Primary Medicaid Providers (PMPs) & Primary Care Networks of Alabama (PCNAs).PMPM paid to both PMPs & PCNAs.N/AUse of state’s Medicaid EHR & clinical support tool is encouraged. Secure, web-based system generates reports based on claims data.Four regions encompassing 21 of 67 counties.70,206
IdahoTwo chronic conditions; one & risk for another; or SMI or SEDSMI or SED; or diabetes & asthma; or diabetes or asthma & risk for another condition. Risk factors include BMI>25, abnormal lipid levels, hypertension, respiratory disease, or tobacco use.PCCM PCPs, including physicians, group practices, rural clinics, CHCs, CMHCs, home health agencies, if required infrastructure & provider capabilities are in place.PMPM based on estimated staffing costs of health home team.N/AInitial standards require information system to support tracking & managing chronic care patients. Final standards require use of HIT for follow-up & referral & population health management, and use of  Idaho HIE as feasible.Statewide9,179
MaineTwo chronic conditions; or one & risk for another; or SMI or SED (not yet approved by CMS)ACA list, plus tobacco use, COPD, hypertension, hyperlipidemia, developmental disabilities or autism spectrum disorders, acquired brain injury, seizure disorders, cardiac & circulatory congenital disorders.PCCM practices qualified as Health Home Providers (HHP) in partnership with Community Care Teams (CCT). For beneficiaries with SMI/SED, PCCM practices in partnership with behavioral health home organizations are health homes.PMPM paid to both HHPs and CCTs based on estimated staff costs; higher PMPMs paid to CCTs reflect more complex needs of CCT patientsN/AHHPs must have fully implemented EHR. HHPs and CCTs have access to state-developed Health Home Enrollment System and Maine’s HIE for patient  information, tracking, & referral.Statewide42,958
MarylandSMI or SED; or one chronic condition & risk for anotherSMI or SED; or opioid substance use disorder (i.e., individuals in opioid maintenance therapy) & risk for another condition. Risk factors include current or previous tobacco, alcohol, or other non-opioid substance use.Licensed psychiatric rehabilitation programs, mobile treatment services, & opioid treatment programs.One-time payment for intake and assessment, and PMPM based on estimated staffing costsBehavioral health care is carved out of managed care contracts.Access to state’s on-line e-Medicaid provider portal, and also must be enrolled in the state HIE to receive real-time hospital encounter alerts & pharmacy data.Statewide2,516
OhioSMI or SEDSMI or SED.Community Behavioral Health Centers (CBHCs)PMPM based on cost information submitted by CBHCsBehavioral health care is carved out of managed care contracts; CBHCs must establish partnership with MCOs.Must be able to receive utilization data electroni-cally. Must acquire certified EHR &, by end of Year 2, use to support all health home services. Must participate in state HIE once operational in their area.Five counties initially; statewide expansion planned10,312
South DakotaTwo chronic conditions; or one & risk for another; or SMI or SEDACA conditions,  COPD, hyperten-ion, & musculo-keletal & neck & back disorders. Risk factors include tobacco use, pre-diabetic condition, cancer, hypercholestero-lemia, depression, & use of >6 medications.Primary care physicians, PAs, advanced practice NPs, FQHCs, Indian Health Service Units, Rural Health Centers, & CMHCsTiered PMPM rates based on patient risk score & estimated “Uncoordinated Care Costs” for enrollees in each tierN/AHealth home providers required to have EHR; State Medicaid agency provides health homes with monthly claims data to manage care.Statewide5,655
VermontOne chronic condition: individuals receiving Medication Assisted Therapy (MAT) for opioid addiction in specified settingsOpioid addiction.Specialty methadone Opioid Treatment Programs (OTP) or physicians licensed to prescribe buprenorphine in Office-Based Opioid Treatment (OBOT) settings, in conjunction with PCMHs & Community Health TeamsPMPM based on added staff costs and paid to regional addictions centers and administering entities for CHTsN/AHub and Spoke providers must document health home services in their EMRs & are eventually to be linked to state’s web-based central clinical registry through state HIE.Statewide (in three phases)2,949
WashingtonOne chronic condition & risk for anotherACA conditions (except BMI >25), cancer, cerebro-vascular disease, chronic respira-tory conditions, coronary artery disease, dementia/  Alzheimer’s, gastrointestinal conditions, hematological conditions, HIV/AIDS,  intellectual disabilities, musculoskeletal conditions, neurological disease, & renal failure. Risk defined as expected costs >150% costs for SSI population.Regional health home lead administrative entities contract with community-based care coordination organizations (CCO) (e.g., group practices, rural clinics, FQHCs, CMHCs, case management agencies, MCOs, hospitals, SUD treatment providers) to provide health home services.3-tiered approach: one-time payment for outreach/ care plan development; different PMPM rates for low level & intensive coordination; also, 2% withhold to incentivize outreach, care plan develop-ment, & provision of health home services.Health home services for eligible beneficiaries in MCOs are built into MCO contracts and capitation rates.Health homes have access to state’s secure, web-based clinical support tool to complement provider-specific EHRs.Statewide except for King (Seattle) and Snohomish counties (location of Dual Eligible Demonstration)22,792
WisconsinOne chronic condition (HIV/AIDS) & another or risk for anotherRisk factors include low CD4 cell count, BMI <18.5, elevated blood pressure, elevated fasting blood sugar level, and hyper-lipidemia.AIDS Service Organizations (ASO)Fee for initial assessment & development of an integrated care plan for each health home enrollee, & PMPM rate for health home services.State assures there will be no duplication of services or payments associated with other Medicaid programs including MCOs.All contacts with beneficiaries must be documented & treatment plans updated in EHR, which must be accessible to all members of care team.Four counties with highest prevalence of HIV/AIDS in state188
*Source: http://www.medicaid.gov/State-Resource-Center/Medicaid-State-Technical-Assistance/Health-Homes-Technical-Assistance/Approved-Health-Home-State Plan-Amendments.html

Endnotes

  1. The Faces of Medicaid III: Refining the Portrait of People with Multiple Chronic Conditions, Kronick R., Bella M., and Gilmer T., Center for Health Care Strategies, October 2009, http://www.chcs.org/media/Faces_of_Medicaid_III.pdf ↩︎
  2. Health Home Information Resource Center, http://www.medicaid.gov/State-Resource-Center/Medicaid-State-Technical-Assistance/Health-Homes-Technical-Assistance/Health-Home-Information-Resource-Center.html, accessed April 27, 2014. ↩︎
  3. Also, although not profiled here, since our last brief, Iowa has added a new health home program for adults and children with SPMI, and Rhode Island has added health homes for treatment of opioid addiction. ↩︎
  4. See Section 1115 Demonstration Proposal: Alabama Medicaid Transformation, submitted by the Alabama Medicaid Agency on May 30, 2014: http://www.medicaid.alabama.gov/documents/2.0_Newsroom/2.7_Topics_Issues/ 2.7.3_RCOs/2.7.3.3_1115_Waiver/2.7.3.3_1115_Waiver_Application_5-30-14.pdf ↩︎
  5. Wisconsin Department of Health Services HIV/AIDS Surveillance Annual Review, April 2014, http://www.dhs.wisconsin.gov/publications/P0/P00484.pdf ↩︎
  6. Medicaid in a Historic Time of Transformation: Results from a 50-State Medicaid Budget Survey for State Fiscal Years 2013 and 2014, Smith V., Gifford K., Ellis E., Rudowitz R., and Snyder L, Kaiser Commission on Medicaid and the Uninsured, October 2013, https://modern.kff.org/medicaid/report/medicaid-in-a-historic-time-of-transformation-results-from-a-50-state-medicaid-budget-survey-for-state-fiscal-years-2013-and-2014/ ↩︎
News Release

A Closer Look at the Courts’ Impact on Health Policy

Published: Aug 4, 2014

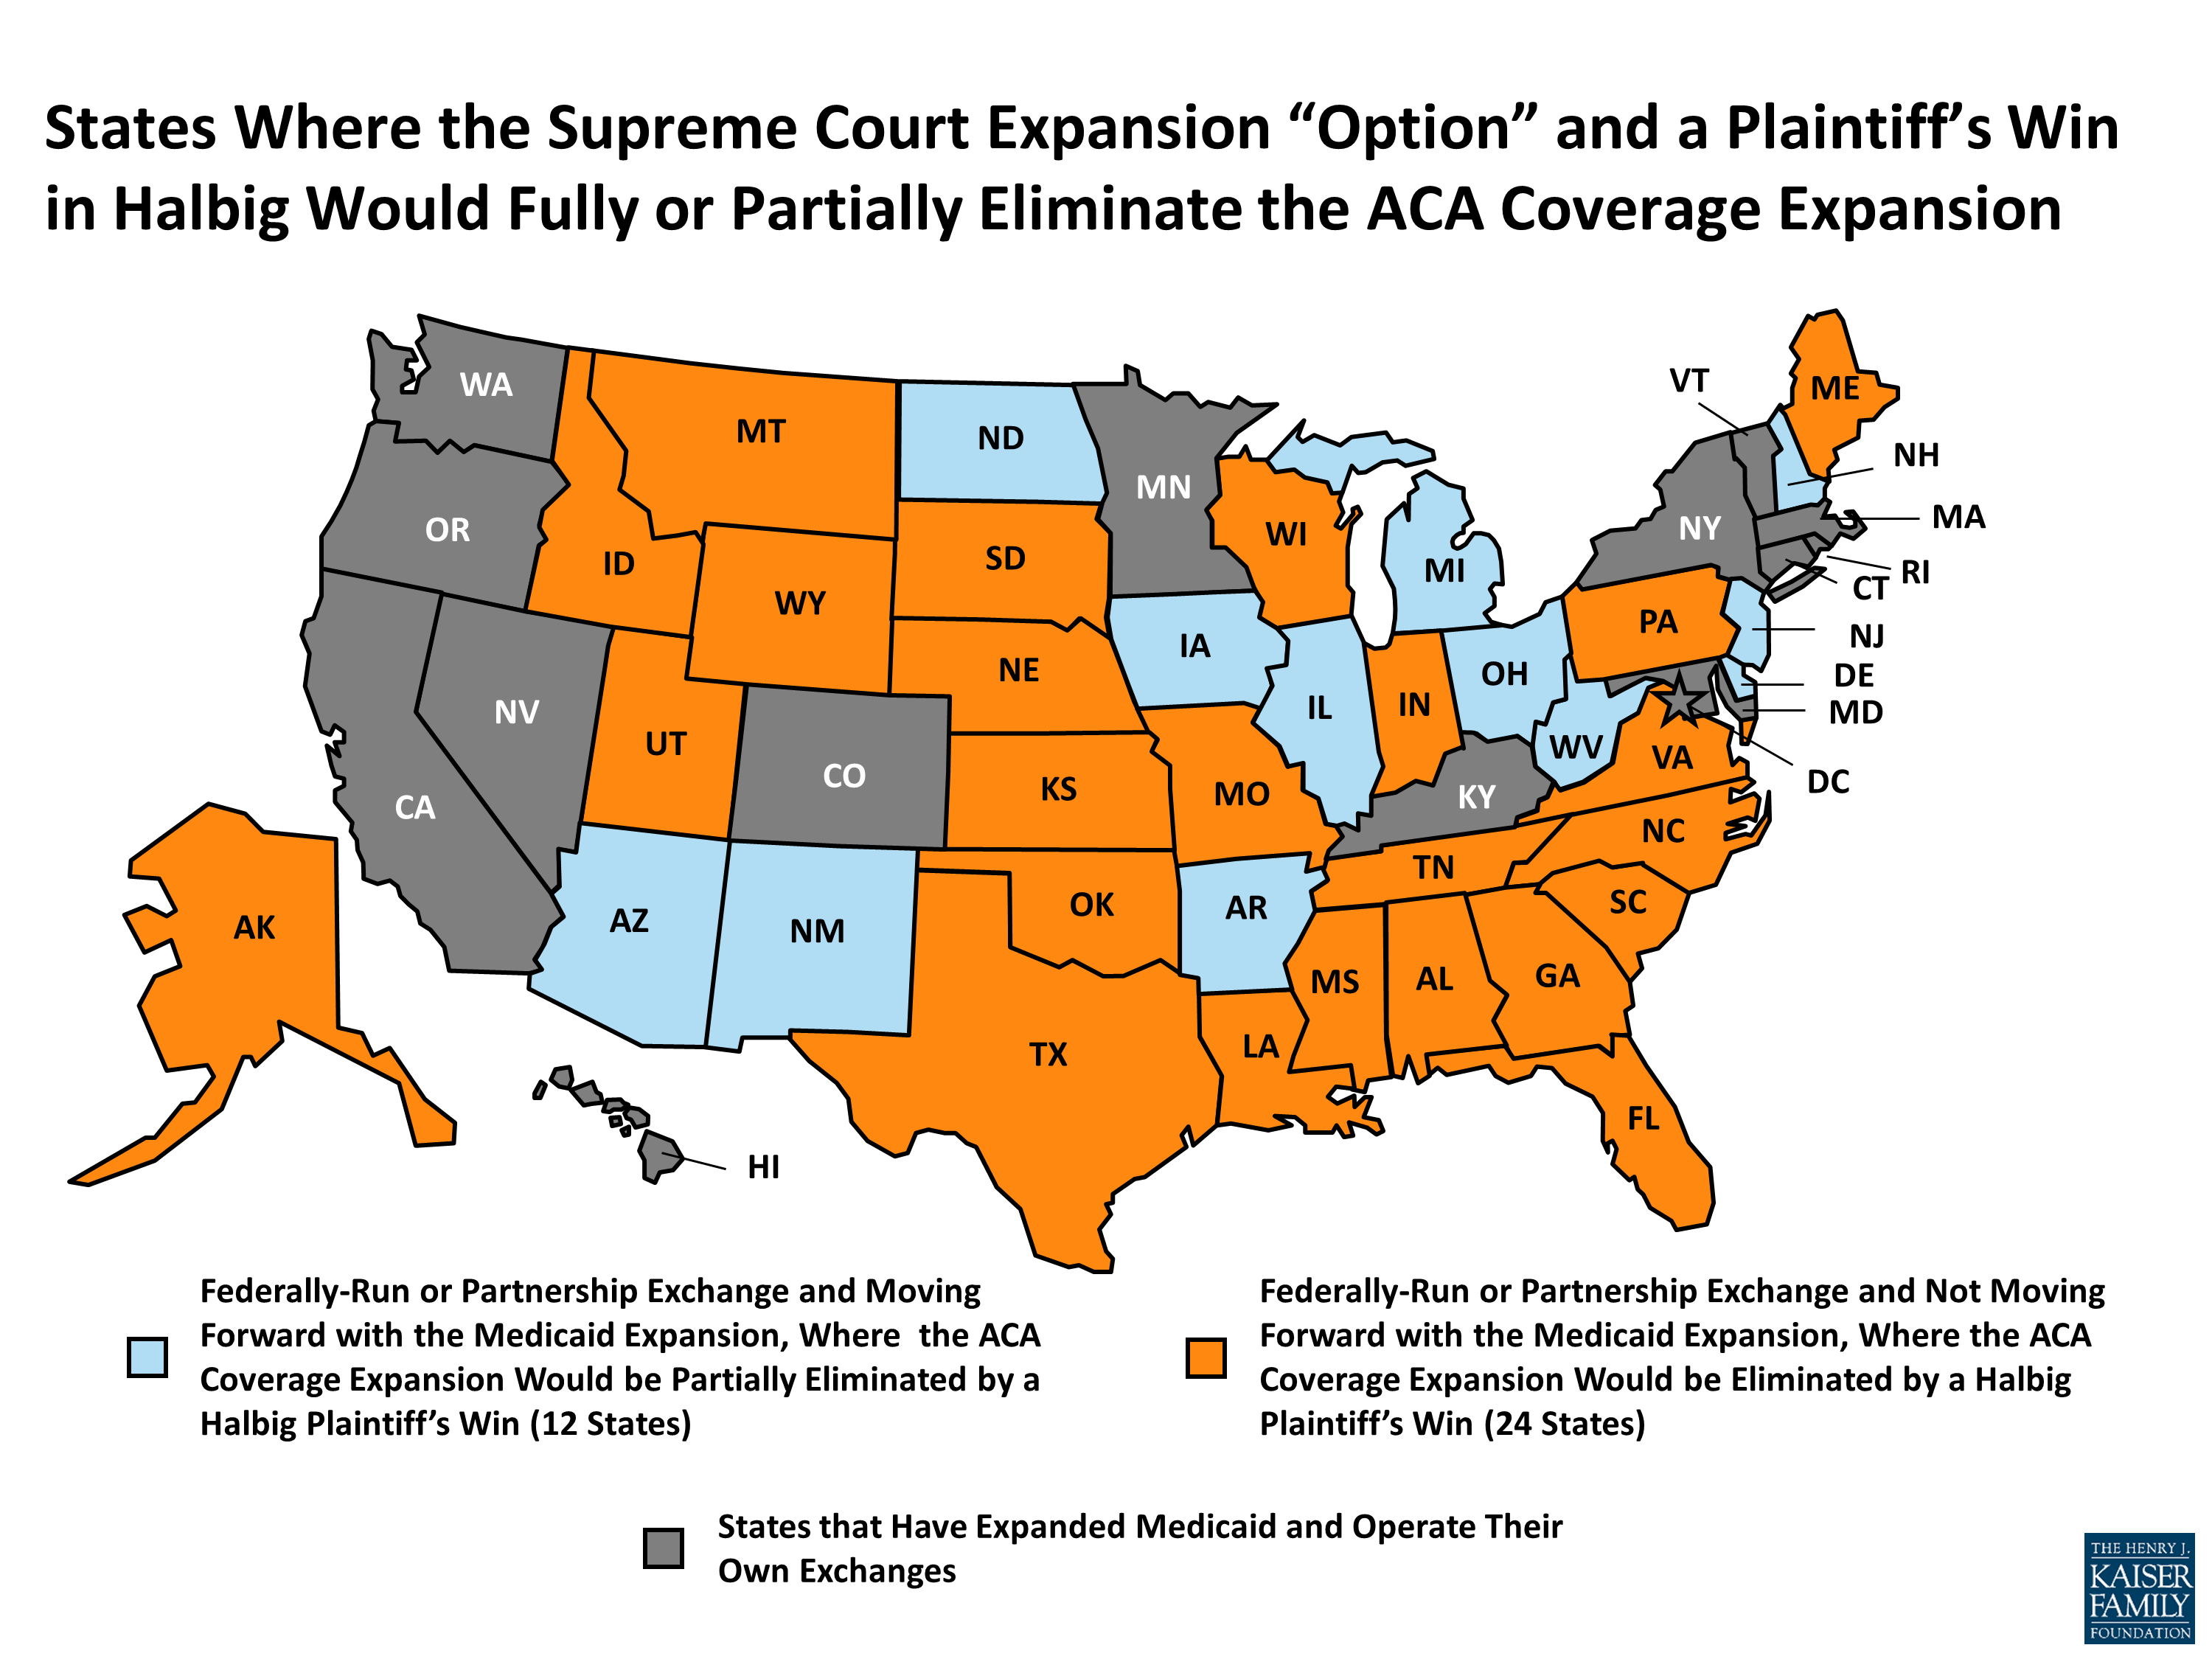
In his latest column for The Wall Street Journal’s Think Tank, Drew Altman maps what the combined impact of the Supreme Court decision on the Affordable Care Act’s Medicaid expansion and a plaintiff’s win in Halbig would look like and discusses the impact of court decisions on health policy.

All previous columns by Drew Altman are available online.

The Ohio Health Care Landscape

Published: Aug 1, 2014

On January 1, 2014, the Affordable Care Act (ACA) went into full effect, ushering in health insurance reforms and new health coverage options that are impacting Americans across the country. Ohio is experiencing changes to its health care delivery system as the state expands Medicaid, targets the uninsured with a federal health insurance marketplace, streamlines health and human services programs, and implements new health care delivery payment systems. This fact sheet provides an overview of the population health, health coverage, and the health care delivery system in Ohio in the era of health reform.

Demographics

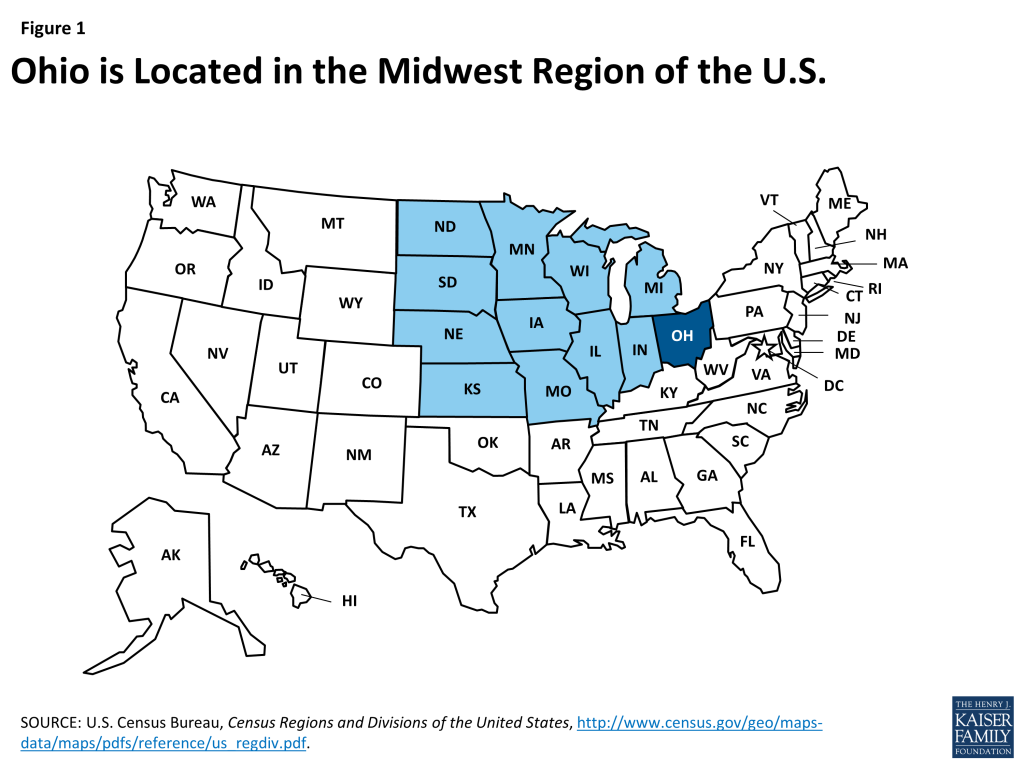
Figure 1: Ohio is Located in the Midwest Region of the U.S.

Home to over 11 million residents, Ohio is the 7th most populous state in the U.S.1  At nearly 41,000 square miles, Ohio is the 35th largest state, but ranks 9th in population density.2  Ohio is one of 12 states located in the country’s Midwest region (Figure 1).3  Ohio’s rolling hills and valleys of the Allegheny Plateau stretch across the far-south as well as the eastern-half of Ohio.4  With over 300 miles of Lake Erie shoreline and thousands of miles of rivers, Ohio is defined by these valuable and useful waterways. The most significant river is the Ohio, as it forms the entire southern border and much of Ohio’s eastern border. Thirty-two counties located in the southern and eastern areas of Ohio are in Appalachia.5 

The majority of Ohioans live in urban areas. Among the state’s 88 counties, 5 had populations that exceeded 500,000 as of July 2013.6  Eighty percent of the state’s population lives in urban areas, including 28% who reside in the state’s three largest counties, which include the cities of Cleveland, Columbus, and Cincinnati. Over half (51%) of nonelderly Ohioans live in the state’s 10 most populous counties (See Figure 12, Appendix). With an unemployment rate of 5.5% in June 2014, Ohio’s rate is lower than the U.S. average of 6.1%.7  The unemployment rate in Ohio has been dropping steadily, decreasing 1.9 percentage points between June 2013 and June 2014.8 

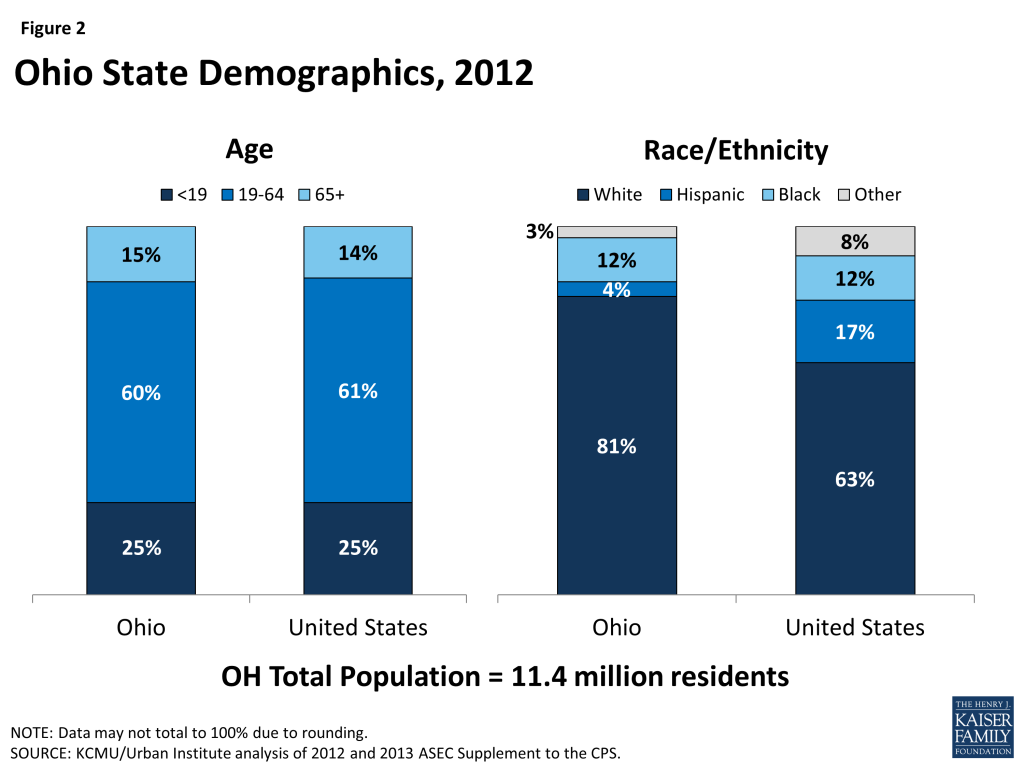
Figure 2: Ohio State Demographics, 2012

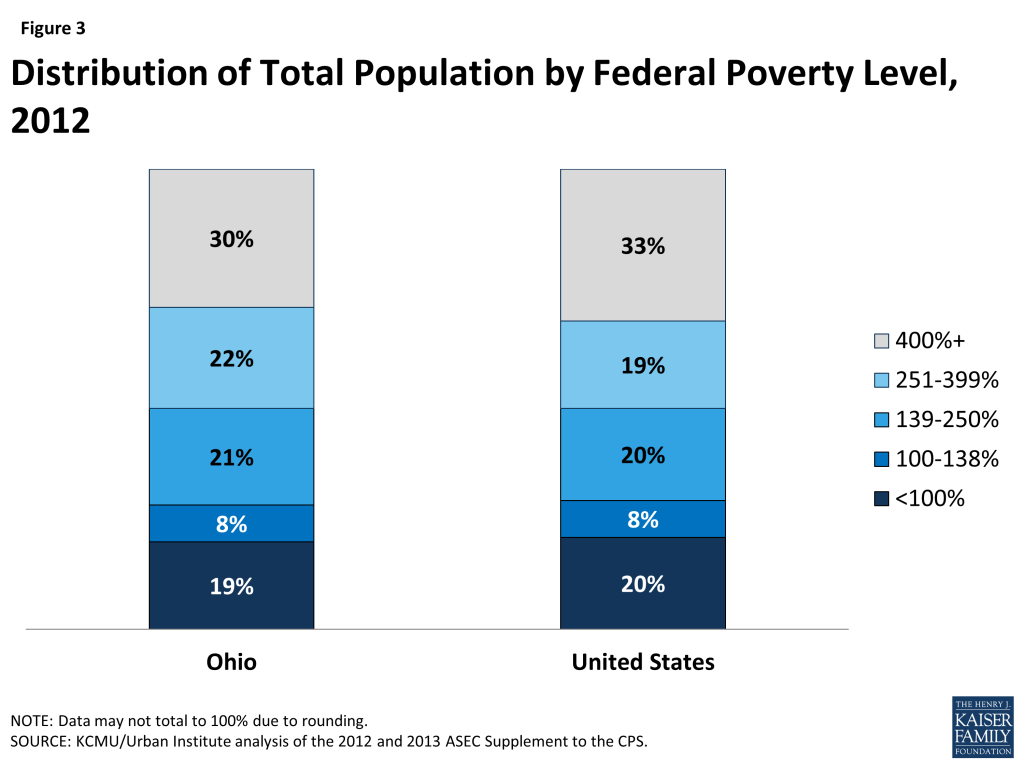
The age distribution of Ohio residents is similar to the U.S. overall, in comparison; people of color make up a smaller share of the state’s population. The age distribution of Ohio residents aligns with that of the U.S. overall (Figure 2). One-quarter of Ohioans are under age 19, while six in ten individuals fall between the ages of 19-64. The remaining 15% of the state population, or about 1.7 million residents, is age 65 and over. Ohio’s population is less racially diverse than the U.S. population overall. Eight out of ten (81%) Ohio residents identify as White, while 12% identify as Black and 4% identify as Hispanic.9  Nearly one in five (19%) Ohioans are living in poverty (have income below 100% of the federal poverty level (FPL) or $11,670 for an individual, $19,790 for a family of 3 in 2014) and seven in 10 have family income levels below 400% FPL (Figure 3).10 

However, poverty rates vary by race/ethnicity and age. Fifteen percent of those who identified as White were living in poverty in 2012, compared to 42% of those who identified as Hispanic and 40% of those who identified as Black. In addition, 26% of children under 19 were living in poverty, while 19% of adults age 19-64 and 10% of adults age 65 and over were living in poverty.11 

Figure 3: Distribution of Total Population by Federal Poverty Level, 2012

State Economy

Ohio’s economy is growing steadily after the recent economic downturn. Like other states across the country, Ohio experienced budgetary challenges during the recent economic downturn. The state faced an $8 billion shortfall over the 2011-2013 biennium and had just 89 cents in its rainy day fund.12  Today, however, the state’s economy continues to improve. Like many other states across the country, Ohio experienced an increase in its real Gross Domestic Product (GDP), growing 2.2% from 2011 to 2012, 1.8% from 2012 to 2013.13  The state ended Fiscal Year (FY) 2014 with a nearly $800 million surplus, and the rainy day fund has been rebuilt to $1.5 billion, the current legal maximum level.14  Manufacturing, finance and real estate, health care, and government are major industries in the state. In 2012, Ohio’s GDP was over $565 billion, which makes it the 7th largest economy in the U.S.15 

Population Health

Overall population health in Ohio is ranked below the national average. Ohio ranked 40 among the 50 states for total population health in the United Health Care Foundation’s report, America’s Health Rankings 2013.16  In 20o9, the life expectancy of an Ohio resident was 77.8 years, below the national average of 78.9 years.17  The rates of diabetes, overweight and obesity, and smoking among adults in Ohio are higher than the national averages, as is the rate of infant mortality.18 ,19 ,20 ,21  In the past year, the prevalence of diabetes has increased from 10% to 11.7% of adults; more than 1 million adults in Ohio have diabetes.22  In contrast, the incidence of cancer in Ohio is lower than in the U.S. overall.23 

Disparities in health and health care access exist in Ohio. Like other states across the country, measures of health status in Ohio vary by race/ethnicity and patterns across these measures in Ohio are similar to national averages. Eighty-seven percent of those who identify as Hispanic and 86% of those who identify as White report being in good or excellent health, compared to 77% of those who identify as Black.24  Sixty-five percent of those who identify as White are overweight or obese, compared to 74% of Blacks and 73% of Hispanics.25  Those who identify as Black are nearly twice as likely (13%) to have diabetes as those who identify as White (7%).26  In addition, those who identify as Black (47%) are more likely to report mental health issues, compared to those who identify as White (37%).27  In addition, while the overall infant mortality rate is high in Ohio, it is twice as high for Blacks as for Whites or Hispanics.28 

Disparities in access to care also exist in Ohio. While 81% of those who identify as White report having a usual source of care, the rate is only 70% for Blacks and 60% for Hispanics. In contrast, 88% of Blacks and 86% of Hispanics report going to the doctor within the past two years, compared to only 77% of Whites, which may reflect greater health needs among these populations.29 

In addition, disparities in health and health access exist across the geographic regions of the state, with nonelderly adults living in Ohio’s Appalachian counties more likely to have unmet health needs and to consider themselves in poor health, than those in more urban counties.30  A 2008 study found that nonelderly adults in the state’s Appalachian and rural counties were more likely to be obese, have high blood pressure, and smoke, than nonelderly adults in other areas of the state and that nonelderly adults in rural counties were more likely than their urban counterparts to have suffered from a significant health event, such as a heart attack.31 

State and local efforts are underway to address health disparities in Ohio. Ohio’s Statewide Health Disparities Collaborative (OSHDC) has brought together individuals and organizations throughout the state to reduce health disparities and to work to achieve health equity.32  OSHDC has developed an Ohio-based action plan to address health disparities and meets periodically throughout the year. The Ohio Commission on Minority Health distributes annual grants to community-based organizations throughout the state that are working on health promotion and disease prevention for minorities.33  The Center for Reducing Health Disparities at Case Western Reserve University is working to address and reduce health disparities throughout Ohio through research and education, and by developing community partnerships.34  In addition, the March of Dimes has partnered with Ohio’s leading universities and hospitals to fund the Prematurity Research Center Ohio Collaborative to provide a multidisciplinary and cross-institutional approach to studying the causes of preterm birth.35 

Coverage

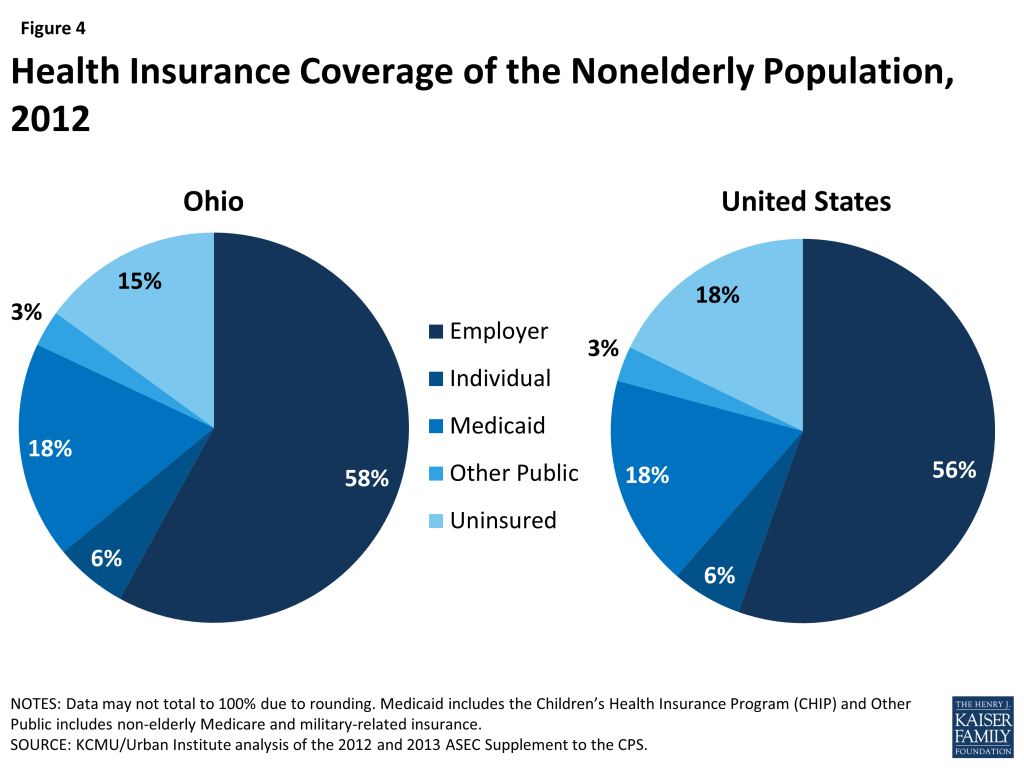
Figure 4: Health Insurance Coverage of the Nonelderly Population, 2012

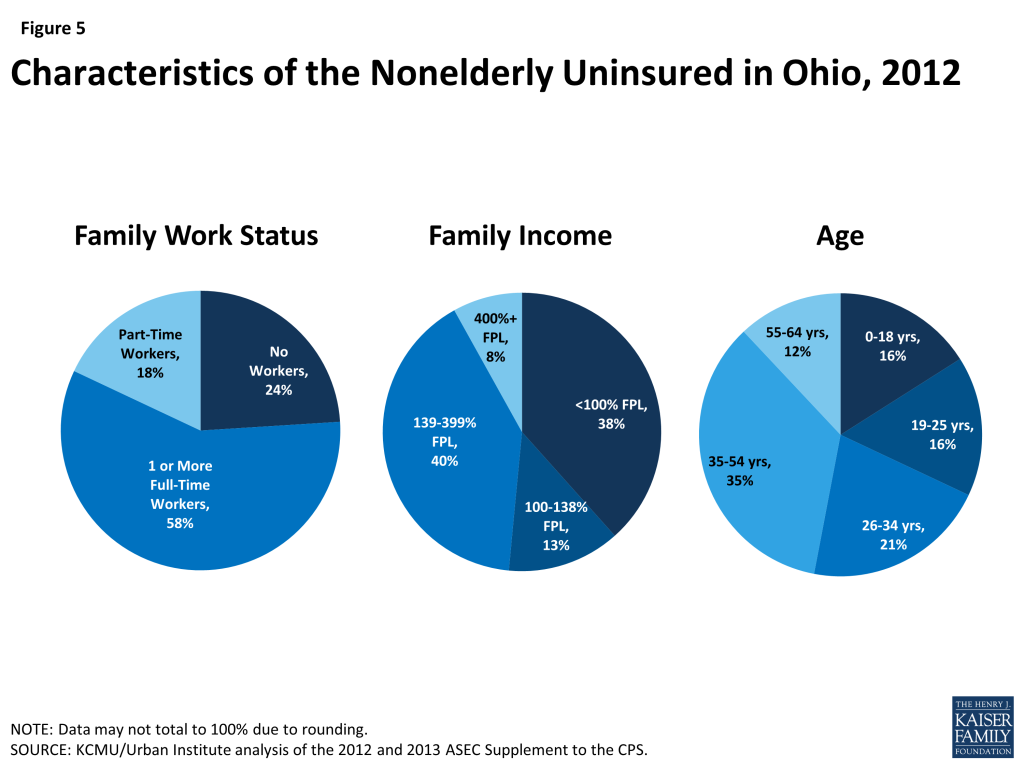
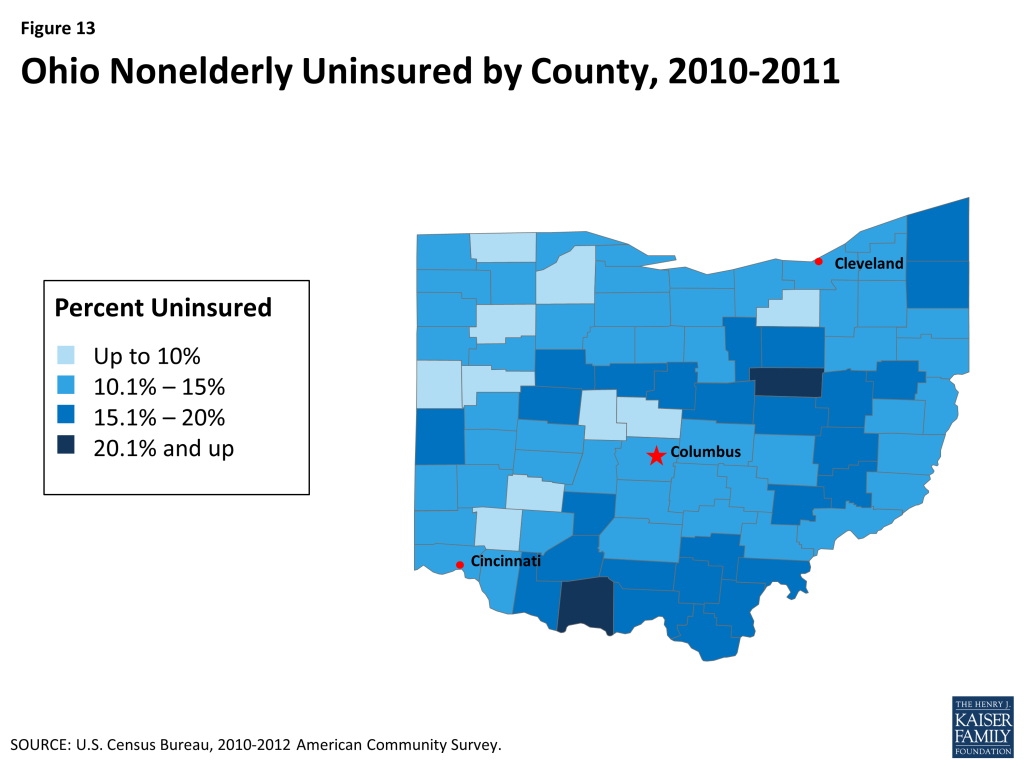
Over 15% of Ohio’s nonelderly population (nearly 1.5 million) was uninsured in 2012. Among the 85% of Ohioans with health insurance, the largest share have employer-sponsored coverage (58%), followed by Medicaid (18%), other public (6%), and individual insurance (3%)(Figure 4).36  Ohio’s nonelderly uninsured rate ranks below the national average of 18%, which reflects the range of uninsured rates across the country from 4% in Massachusetts to 24% in Texas.37  As shown in Figure 13 (Appendix), the nonelderly uninsured in Ohio are not equally distributed across the state’s counties, with the central and southern counties having higher uninsured rates than other areas of the state. As in other states across the U.S., the majority of nonelderly uninsured in Ohio have at least one full-time worker in their households, have income below 400% of the FPL, and are under age 55 (Figure 5). 38 

Medicaid

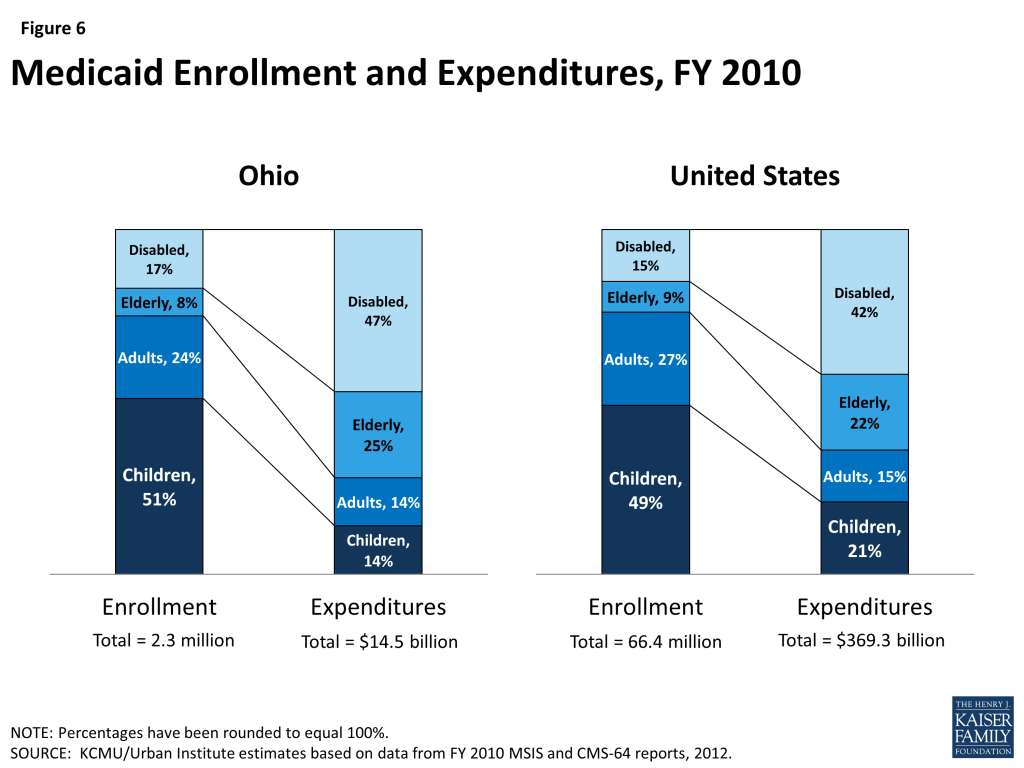
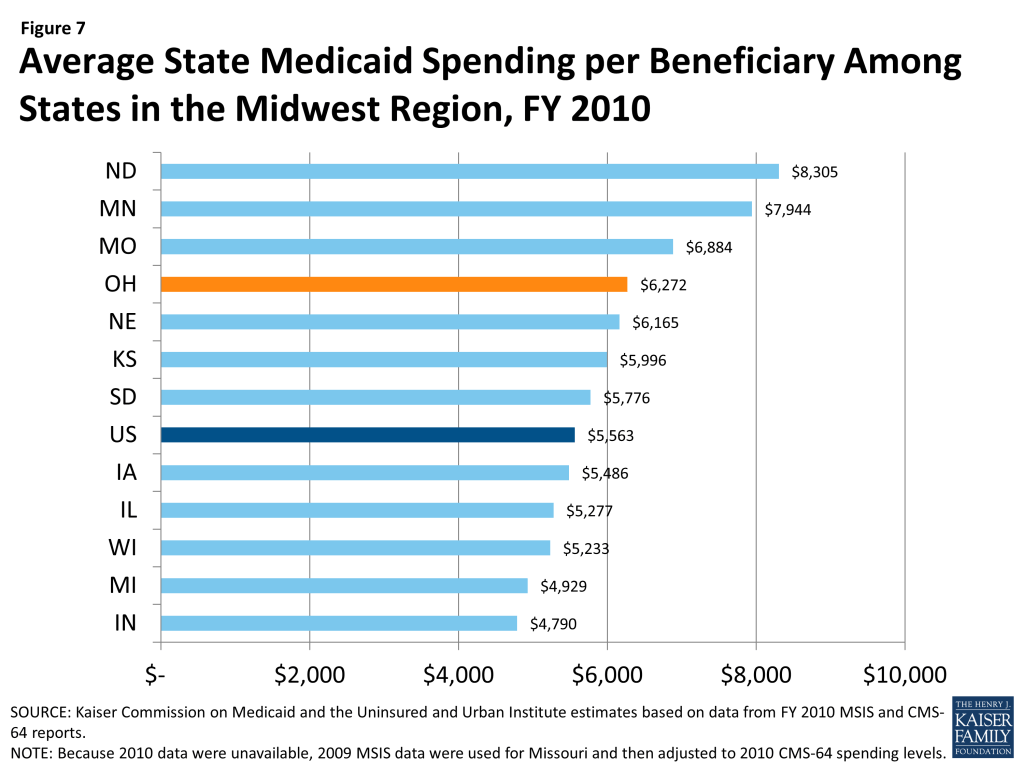
Similar to the national picture, the largest group of Medicaid enrollees in Ohio is children, but the elderly and individuals with disabilities account for the most spending on Medicaid. Based on data for FY 2010, 51% of Medicaid enrollees were children, who accounted for 14% of expenditures (Figure 6).39  One-quarter were elderly or people with disabilities, who accounted for nearly three-quarters (72%) of total program costs. Average spending per beneficiary was $6,272, more than the national average of $5,563 and a number of other states in the Midwest Region (Figure 7).40 

Figure 5: Characteristics of the Nonelderly Uninsured in Ohio, 2012

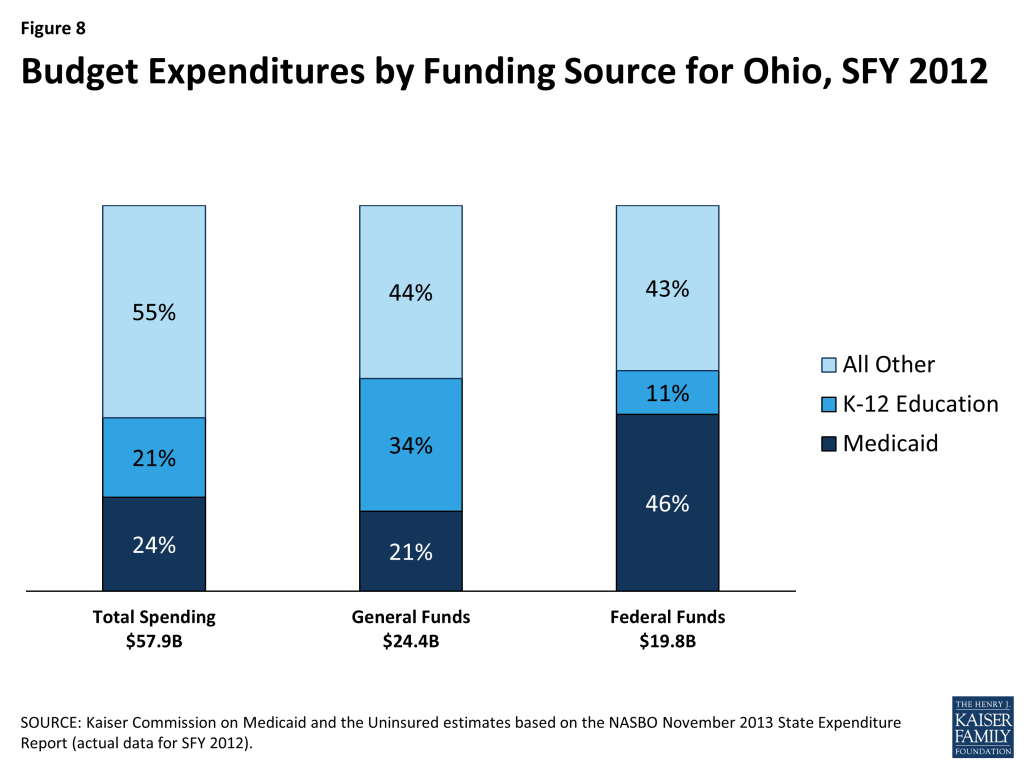
Medicaid costs are shared by the state and the federal government, with the federal government paying 62.6% of the cost of Ohio Medicaid; therefore for every $1.00 that Ohio spends on Medicaid, the federal government will send $1.68 to the state in matching funds.41  The combined federal and state spending on Medicaid in Ohio for FY 2012 was $16.4 billion.42  This accounted for 24% of total state spending, 21% of state general funds, and 46% of state spending of federal funds (Figure 8).43  Medicaid is the second largest source of state general fund spending behind elementary and secondary education, but the largest source of federal revenue flowing into the state.

Governor John Kasich created the Office of Health Transformation (OHT) in January 2011 to modernize Medicaid, streamline health and human services programs, and improve overall health system performance. The Kasich Administration has made slowing the growth of Medicaid a priority.44  In addition to expanding Medicaid to more low-income Ohioans and streamlining Medicaid eligibility determinations, Governor Kasich’s plan to modernize Medicaid included prioritizing home and community services, reforming nursing facility payment, integrating Medicaid and Medicare benefits, creating health homes for people with mental illness, and improving Medicaid managed care.45  In Ohio, 1.6 million Medicaid beneficiaries, or 75% of the total Medicaid population, are enrolled in a managed care delivery system.46  Additionally, the Jobs Budget 2.0 created Ohio’s first ever cabinet-level Medicaid agency, a stand-alone department effective July 2013, to help the Medicaid program become more effective and efficient.47 

Figure 6: Medicaid Enrollment and Expenditures, FY 2010

Ohio is seeking to better coordinate care and control costs for dual eligible beneficiaries, who often have complex and costly health care needs. In 2010, Ohio had 326,249 dual eligible individuals, or those who are eligible for both Medicaid and Medicare. Dual eligible beneficiaries made up 14% of total Medicaid enrollment and accounted for 40% of total Medicaid costs.48  Average spending per dual eligible was $21,415 per year. The majority spending for duals goes toward long-term services and supports (78%) followed by acute care services (15%)(Figure 9). In an effort to better integrate care and align financing for these beneficiaries, CMS is using new authority afforded under the ACA to launch demonstration projects in selected states across the country that test new care coordination and delivery models. Ohio is one of 12 states approved thus far to participate in the duals demonstration projects.49 

Ohio’s financial alignment demonstration, MyCare Ohio, targets an estimated 114,000 full benefit dual eligible beneficiaries over age 18 in 29 counties, grouped into 7 regions.50  Under a capitated managed care model, the state and CMS are contracting with Integrated Care Delivery System (ICDS) health plans, which receive a prospective, payment from CMS for Medicare services and from the state for Medicaid services to provide dual eligible beneficiaries with coordinated, person-centered care. Anticipated program savings are deducted prospectively from CMS and the state’s contributions to the Medicare and Medicaid baseline capitated rates, according to the state’s Memorandum of Understanding with CMS.

Figure 7: Average State Medicaid Spending per Beneficiary Among States in the Midwest Region, FY 2010

ICDS plans will offer care management services to coordinate medical, behavioral health, long-term services and supports (including home and community-based services), and social needs. Benefits include nearly all Medicare and Medicaid services, with the exception of Medicare hospice and Medicaid habilitation services, targeted case management, and home and community-based waiver services for beneficiaries with developmental disabilities. Plans have discretion to offer flexible benefits as appropriate to beneficiary needs. All individuals enrolled in ICDS plans will have an assigned, personal care manager who will seek input from the individual, family/caregiver, and providers to assess the needs of the individual.

Initially, Ohio is passively enrolling beneficiaries eligible for MyCare Ohio into ICDS managed care plans for their Medicaid benefits only. Medicaid managed care enrollment was phased in by region from May through July 2014, and is mandatory for affected beneficiaries. Between May and December 2014, these beneficiaries can choose to have the ICDS plans also manage their Medicare benefits.51   Those who do not opt into the demonstration for their Medicare benefits will be passively enrolled beginning in January 2015, so that the ICDS plan will then manage both their Medicare and Medicaid benefits. However, beneficiaries can choose to opt out of the demonstration for their Medicare benefits and instead continue to receive their Medicare benefits through traditional Medicare fee-for-service or through a Medicare Advantage plan.

Figure 8: Budget Expenditures by Funding Source for Ohio, SFY 2012

Health Reform

The Affordable Care Act (ACA) could extend coverage to 1.5 million uninsured Ohioans. A main goal of the ACA is to extend health coverage to many of the 47 million nonelderly uninsured individuals across the country, including the 1.5 million uninsured Ohioans. The ACA accomplishes this through insurance reforms and by establishing new coverage pathways, including the expansion of Medicaid to cover nearly all nonelderly individuals up to 138% FPL ($16,105 for an individual, $27,310 for a family of 3 in 2014), and by providing premium subsidies to most individuals with incomes up to 400% FPL, who are not eligible for other coverage, to purchase coverage on the Health Insurance Marketplace (Figure 10). As a result of the Supreme Court decision on the ACA, the Medicaid expansion is now effectively a state option.52  Ohio is one of 26 states and DC presently implementing the ACA Medicaid expansion.53  Among previously uninsured nonelderly Ohioans, one-half are eligible for Medicaid or CHIP and one in four (26%) are eligible for premium subsidies under the ACA.54 

Ohio received a Section 1115 Medicaid demonstration waiver to expand coverage prior to the ACA in Cuyahoga County. On February 5, 2013, Ohio received approval from CMS to extend coverage to up to 30,000 nonelderly adults residing in Cuyahoga County (the state’s most populous county that includes the city of Cleveland) with family income up to 133% FPL who were not otherwise eligible for Medicaid.55  The waiver, entitled “MetroHealth Care Plus”, enrolled individuals in a more limited Medicaid benefits package and ran through December 31, 2013, when many of these individuals became eligible for Medicaid under the ACA Medicaid expansion.56 

Figure 9: Medicaid Expenditures for Dual Eligible Beneficairies in Ohio, 2010

Medicaid Expansion

Ohio’s Controlling Board approved the state’s implementation of the Medicaid expansion. After the legislature failed to act on the Governor’s proposal to adopt the Medicaid expansion, Republican Governor John Kasich sought approval from the state’s bipartisan Controlling Board for the Medicaid expansion.57  Under the Medicaid expansion, the federal government pays 100% of the cost of coverage from 2014-2016, phasing down to 90% in 2020 and beyond. On October 22, 2013, with a vote of 5-2, the Board authorized the state to spend federal funds for the Medicaid expansion through July 2015. A lawsuit was filed by Republican House members and two Right to Life groups, but ultimately the Ohio Supreme Court upheld the state’s actions.58  A February 2013 analysis by the Health Policy Institute of Ohio, Ohio State University, the Urban Institute, and REMI show positive state fiscal and economic effects of expanding Medicaid in Ohio, estimating that the state would experience a net fiscal gain of at least $1.8 billion over the 2014–2022 period.59  The analysis also estimated that 27,000 new jobs would be created in Ohio as a result of the Medicaid expansion.

Figure 10: Eligibility for Financial Assistance in Gaining Coverage Among Currently Uninsured Ohioans, As of January 2014

Over 285,000 Ohioans have enrolled coverage as a result of the Medicaid expansion. Ohio’s actuaries estimate that 563,000 previously uninsured Ohioans are newly eligible for coverage under the Medicaid expansion.60  As of June 30, 2014, 285,553 newly eligible Ohioans have enrolled under the Medicaid expansion, including 26,000 individuals previously covered by MetroHealth Plus.61 ,62  As of April 1, 2014, Medicaid eligibility levels in Ohio are 211% FPL for children, 205% FPL for pregnant women, and 138% FPL for parents and other adults (Figure 11).

In addition to expanding eligibility for coverage, Ohio is streamlining and simplifying its enrollment process for health coverage under the ACA. Under the ACA, all states must implement simplified eligibility and enrollment processes. Individuals can apply for both Medicaid and Health Insurance Marketplace coverage through multiple pathways, including in person, over the phone, by mail, and online. Ohio developed a new website, www.benefits.ohio.gov, from which users can access a variety of services including Medicaid, food stamps and cash assistance, and Women, Infants and Children (WIC) nutritional assistance, among others.

Figure 11: Income Eligibility Levels for Medicaid/CHIP and Marketplace Tax Credits in Ohio as of 2014

Health Insurance Marketplace

Ohio is one of 27 states in which the federal government has set up and is running their Health Insurance Marketplace.63  On November 16, 2012, Governor Kasich notified federal officials that Ohio would pursue a Federally-facilitated Marketplace; however, the state would maintain regulatory control over participating insurance providers.64  Ohio is one of seven states to receive approval from the Department of Health and Human Services (HHS) to conduct plan management activities to support certification of Qualified Health Plans (QHPs) in the Federally-facilitated Marketplace.65  The Ohio Department of Insurance (ODI) has the legal authority to oversee certification of QHPs using the System for Electronic Rate and Form Filing (SERFF) to collect, review, and approve plan rate and benefit information. ODI is also ensuring continued plan compliance, manage consumer complaints, and oversee decertification of issuers.66 

In Ohio, 12 insurance providers are offering QHPs in Ohio’s marketplace.67  At $249 per month, Cleveland has the nineteenth lowest monthly premium for a Benchmark QHP among major cities across the country, before premium tax credits.68  Of the anticipated 812,000 Ohioans who might enroll in Marketplace coverage, 544,000 (67%) are estimated to be eligible for premium subsidies to help pay for their coverage.69  Ongoing litigation may potentially impact the availability of premium subsidies in states with Federally-facilitated Marketplaces, such as Ohio; however, these effects remain to be seen.70  Of As of April 19, 2014, 154,668 individuals in Ohio had selected a Marketplace plan, 131,515 of whom are receiving premium subsidies.71 

The Affordable Care Act also provided for the establishment of Consumer Operated and Oriented Plans (CO-OPs). CO-OPs are a new type of non-profit, member-governed health insurance. They may operate locally, state-wide, or in multiple states and must be licensed as issuers in each state in which they operate. They are intended to offer more affordable, consumer friendly, and high quality health insurance options to compete with existing health insurers. CO-OPs may offer insurance both in and outside the state Marketplaces. Ohio is one of 23 states currently offering CO-OPs. The state’s CO-OP, InHealth Mutual, received a $129.3 million loan from HHS in October 2012, but did not receive its license to conduct business from the Ohio Department of Insurance until September 2013, which was too late to receive certification to offer a QHP through the Marketplace in 2014.72 ,73  Consequently, InHealth is only offering products outside the Marketplace in 2014, with the intention of offering individual and small group products through the Marketplace in 2015.

Delivery System Reform

Ohio is in the process of reforming its delivery system to include a statewide patient-centered medical home (PCMH) model and an episode-based payment model. In February 2013, the Ohio Governor’s Office of Health Transformation was awarded a $3 million State Innovation Model (SIM) grant by CMS to design payment models that increase access to patient-centered medical homes and support episode-based payments for acute medical events.74  The PCMH model has the potential to improve quality, outcomes and cost of care by holding a single entity, the medical home, accountable for the coordination of care for patients across the health care delivery system. The episode-based payment model establishes accountability for both outcomes and cost of care, rewarding providers for delivering high quality, guideline concordant care.75  The state will use existing data and health information technology to regularly assess the progress of these models, with the goal of having 80-90% of Ohio’s population in some value-based payment model (combination of episodes and population-based payment) within five years. Initiatives are also underway to provide better-integrated and coordinated care through programs, such as MyCare Ohio, the Balancing Incentive Program,76  and plans to implement Health Homes for individuals with severe and persistent mental illness.

Ohio’s safety net delivery system will continue to play an important role in delivering health care to the state’s vulnerable population. Ohio’s community health centers and hospitals provide access to needed primary, preventive, and acute care services for low-income and underserved residents. Ohio is home to 36 federally qualified health centers (FQHCs) and look-alike health centers, together operating 183 clinic sites throughout the state.77  In 2011, the state’s FQHCs saw over 484,631 patients and had over 1.6 million patient visits.78  Forty-one percent of patients had Medicaid, while 34% were uninsured.79  Nearly three quarters (71%) were below 100% FPL.80 ,81  HHS awarded Ohio’s 36 FQHCs $5.9 million for Fiscal Years 2013 and 2014 to assist with outreach and enrollment under the ACA.82 

Additionally, Ohio’s version of the federally required Disproportionate Share Hospital (DSH) program, called the Hospital Care Assurance Program (HCAP), compensates hospitals that treat the uninsured and underinsured.83  These hospitals will receive an estimated of $433 million in federal funds in fiscal year 2014, the eighth highest amount among all states.84 

Looking Ahead

Home to more than 11 million residents, including nearly 1.5 million who are uninsured, Ohio stands to help many currently uninsured individuals gain health coverage by providing coverage options across the income spectrum for low and moderate-income people. While the majority of residents will continue to receive their health coverage through employer-sponsored coverage, almost all the uninsured in Ohio are eligible for some type of coverage under the ACA. The state’s decision to expand Medicaid has the potential to cover an additional 500,000 Ohioans, and an additional 800,000 individuals are expected to enroll in the state’s Federally Facilitated Marketplace. Still, the impact of the ACA will depend on take-up of coverage among the eligible uninsured. Outreach, enrollment, and education efforts at the state and local level are and will continue to be important to engaging individuals and helping them appropriately access and utilize care.

As the seventh most populous state, Ohio is a diverse testing ground for health care reform. Ohio is home to four major metropolitan areas, while over 20 percent of its population resides in the state’s rural areas. Looking ahead, the Office of Health Transformation will lead activities to reform Ohio’s health care system with ongoing efforts to modernize Medicaid, streamline operations, and implement payment reforms. These and other changes under the ACA will likely impact the health, health care access, and health utilization of Ohioans now and in the future.

Appendix

Figure 12: Ohio Nonelderly Population by County, 2010-2011
Figure 13: Ohio Nonelderly Uninsured by County, 2010-2011
  1. Urban Institute and Kaiser Commission on Medicaid and the Uninsured estimates based on the Census Bureau’s March 2012 and 2013 Current Population Survey (CPS: Annual Social and Economic Supplements). ↩︎
  2. World Atlas, United States, http://www.worldatlas.com/aatlas/infopage/usabysiz.htm. ↩︎
  3. U.S. Department of Commerce, Economics, and Statistics Administration, Census Regions and Divisions of the United States (U.S. Census Bureau), http://www.census.gov/geo/maps-data/maps/pdfs/reference/us_regdiv.pdf. ↩︎
  4. World Atlas, Ohio: Geography, http://www.worldatlas.com/webimage/countrys/namerica/usstates/ohland.htm. ↩︎
  5. Appalachian Regional Commission, Counties in Appalachia, http://www.arc.gov/counties. ↩︎
  6. USDA Economic Research Service, State Fact Sheets: Ohio, 2013 Population (June 4, 2014), http://www.ers.usda.gov/data-products/state-fact-sheets/state-data.aspx?StateFIPS=49&StateName=Ohio#Pf669f4c9093d4b0a843889df2cf5c5a1_2_39iT0 and US Census Bureau, 2013 County Total Population Estimates. ↩︎
  7. Bureau of Labor Statistics, Civilian Labor Force and Unemployment by State and Selected Area, Seasonally Adjusted (July 18, 2014), http://www.bls.gov/news.release/laus.t03.htm and http://data.bls.gov/cgi-bin/surveymost?BLS. ↩︎
  8. U.S. Department of Labor, Regional and State Employment and Unemployment (July 18, 2014) http://www.bls.gov/news.release/laus.toc.htm. ↩︎
  9. Urban Institute and Kaiser Commission on Medicaid and the Uninsured estimates based on the Census Bureau’s March 2012 and 2013 Current Population Survey (CPS: Annual Social and Economic Supplements). ↩︎
  10. Urban Institute and Kaiser Commission on Medicaid and the Uninsured estimates based on the Census Bureau’s March 2012 and 2013 Current Population Survey (CPS: Annual Social and Economic Supplements). ↩︎
  11. Urban Institute and Kaiser Commission on Medicaid and the Uninsured estimates based on the Census Bureau’s March 2012 and 2013 Current Population Survey (CPS: Annual Social and Economic Supplements). ↩︎
  12. Office of Budget and Management, News Release, July 2, 2014, available at: http://obm.ohio.gov/Memos/doc/2014-07-02_FY14_Year-end-Close_News-Release.pdf. ↩︎
  13. Bureau of Economic Analysis, Widespread Economic Growth in 2012 (June 6, 2013), http://www.bea.gov/newsreleases/regional/gdp_state/gsp_newsrelease.htm and Bureau of Economic Analysis, Widespread But Slower Growth in 2013 (June 11, 2014), http://www.bea.gov/newsreleases/regional/gdp_state/gsp_newsrelease.htm. ↩︎
  14. Ibid. ↩︎
  15. Bureau of Economic Analysis, Gross Domestic Product by State 2012 (June 11, 2014). ↩︎
  16. United Health Care Foundation. America’s Health Rankings: State Ranking Overview (2013), http://americashealthrankings.com/OH/2013. ↩︎
  17. Centers for Disease Control and Prevention, National Center for Health Statistics. Mortality – All County Micro-Data File, as compiled from data provided by the 57 vital statistics jurisdictions through the Vital Statistics Cooperative Program. Population counts are from the CDC WONDER Database, , http://www.measureofamerica.org/maps/. ↩︎
  18. In Ohio, 11.7% of adults have been diagnosed with diabetes in 2012, compared to a national average of 10.2% (KCMU analysis of the Center for Disease Control and Prevention (CDC)’s Behavioral Risk Factor Surveillance System (BRFSS) 2012 Survey Results). ↩︎
  19. In 2012, 65.3% of Ohio adults were overweight or obese, compared to 63.4% of adults nationally (KCMU analysis of the Center for Disease Control and Prevention (CDC)’s Behavioral Risk Factor Surveillance System (BRFSS) 2012 Survey Results). ↩︎
  20. In 2012, 23.3% of adults in Ohio smoked, compared to a national average of 18.8% (KCMU analysis of the Center for Disease Control and Prevention (CDC)’s Behavioral Risk Factor Surveillance System (BRFSS) 2012 Survey Results). ↩︎
  21. Ohio’s infant mortality rate for 2007-2009 was 7.7 deaths per 1,000 live births, compared to the national average of 6.6 deaths per 1,000 live births (Matthews, TJ, M.S., et. al. Infant Mortality Statistics from the 2009 Period Linked Birth/Infant Death Data Set. Division of Vital Statistics. National Vital Statistics Report, Vol 61, No. 8, January 24, 2013). ↩︎
  22. United Health Care Foundation. America’s Health Rankings: State Ranking Overview (2013), http://americashealthrankings.com/OH/2013. ↩︎
  23. The 2009 incidence of invasive cancer in Ohio was 448 per 100,000 individuals, compared to the U.S. average of 459 per 100,000 individuals (U.S. Cancer Statistics Working Group. United States Cancer Statistics: 1999-2009 Incidence and Mortality Web-based Report. Atlanta (GA): Department of Health and Human Services, Centers for Disease Control and Prevention, and National Cancer Institute; 2013). ↩︎
  24. 2010 Behavioral Risk Factor Surveillance System (BRFSS). ↩︎
  25. Ibid. ↩︎
  26. Ibid. ↩︎
  27. Ibid. ↩︎
  28. The infant mortality rate for Blacks from 2007-2009 was 14.5 deaths per 1,000 live births, compared to 6.3 deaths per 1,000 live births for Whites and 7.3 deaths per 1,000 live births for Hispanics (Matthews, TJ, M.S., et. al. Infant Mortality Statistics from the 2009 Period Linked Birth/Infant Death Data Set. Division of Vital Statistics. National Vital Statistics Report, Vol 61, No. 8, January 24, 2013). ↩︎
  29. 2010 Behavioral Risk Factor Surveillance System (BRFSS). ↩︎
  30. Health Policy Institute of Ohio, Unhealthy Differences: Regional Health Disparities in Ohio (October 2009), http://a5e8c023c8899218225edfa4b02e4d9734e01a28.gripelements.com/pdf/policybrief_disparitiesregional.pdf. ↩︎
  31. Health Policy Institute of Ohio, Unhealthy Differences: Regional Health Disparities in Ohio (October 2009), http://a5e8c023c8899218225edfa4b02e4d9734e01a28.gripelements.com/pdf/policybrief_disparitiesregional.pdf. ↩︎
  32. Ohio Statewide Health Disparities Collaborative, http://www.ohiohealthdisparitiescollaborative.org/. ↩︎
  33. The Ohio Commission on Minority Health, http://mih.ohio.gov/. ↩︎
  34. Case Western Reserve University, Center for Reducing Health Disparities, http://www.case.edu/med/ccrhd/. ↩︎
  35. March of Dimes Prematurity Research Center Ohio Collaborative, http://prematurityresearch.org/ohiocollaborative/. ↩︎
  36. UI and KCMU estimates based on Census Bureau’s March 2011 and 2012 Annual Social and Economic Supplements to the CPS. ↩︎
  37. UI and Kaiser Commission on Medicaid and the Uninsured estimates based on the Census Bureau’s March 2012 and 2013 Current Population Survey (CPS: Annual Social and Economic Supplements), available at: https://modern.kff.org/other/state-indicator/total-population/. ↩︎
  38. UI and KCMU estimates based on Census Bureau’s March 2011 and 2012 Annual Social and Economic Supplements to the CPS, available at: https://modern.kff.org/state-category/health-coverage-uninsured/. ↩︎
  39. KCMU/Urban Institute estimates based on data from FY 2010 MSIS and CMS-64 reports, 2012. ↩︎
  40. KCMU/Urban Institute estimates based on data from FY 2010 MSIS and CMS-64 reports, 2012. ↩︎
  41. Federal Register, January 21, 2014 (Vol 79, No. 13), pp 3385-3388, http://www.gpo.gov/fdsys/pkg/FR-2014-01-21/pdf/2014-00931.pdf. ↩︎
  42. Urban Institute estimates based on data from CMS (Form 64) (September 16, 2013). ↩︎
  43. Kaiser Commission on Medicaid and the Uninsured estimates based on the NASBO November 2013 State Expenditure Report (actual data for SFY 2012). ↩︎
  44. Ohio Department of Medicaid, http://healthtransformation.ohio.gov/LinkClick.aspx?fileticket=dj6U-u4YCRE%3d&tabid=136. ↩︎
  45. Ohio Governor’s Office of Health Transformation, Transforming Ohio for Jobs + Growth: Fiscal Years 2014-2015 State Budget, http://www.healthtransformation.ohio.gov/LinkClick.aspx?fileticket=fq-wVCfLXak%3d&tabid=136 ↩︎
  46. Medicaid Managed Care Enrollment Report, Centers for Medicare and Medicaid Services, U.S. Department of Health and Human Services, November 2012. Available at: http://www.medicaid.gov/Medicaid-CHIP-Program-Information/By-Topics/Data-and-Systems/Downloads/2011-Medicaid-MC-Enrollment-Report.pdf. ↩︎
  47. Governor’s Office of Health Transformation, Ohio Department of Medicaid,  http://www.healthtransformation.ohio.gov/LinkClick.aspx?fileticket=pLbDpxRNQl4%3d&tabid=145 and http://www.healthtransformation.ohio.gov/LinkClick.aspx?fileticket=Aa0y9c6zC68%3d&tabid=84 ↩︎
  48. Kaiser Commission on Medicaid and the Uninsured and Urban Institute estimates based on data from FY 2010 MSIS, 2013, https://modern.kff.org/medicaid/issue-brief/medicaids-role-for-dual-eligible-beneficiaries/. ↩︎
  49. Kaiser Commission on Medicaid and the Uninsured, State Demonstration Proposals to Integrate Care and Align Financing and/or Administration for Dual Eligible Beneficiaries (Kaiser Family Foundation, July 2014), https://modern.kff.org/medicaid/fact-sheet/state-demonstration-proposals-to-integrate-care-and-align-financing-for-dual-eligible-beneficiaries/. For more information, see: MaryBeth Musumeci, Financial and Administrative Alignment Demonstrations for Dual Eligible Beneficiaries Compared: States with Memoranda of Understanding Approved by CMS (Kaiser Family Foundation, July 2014), https://modern.kff.org/medicaid/issue-brief/financial-alignment-demonstrations-for-dual-eligible-beneficiaries-compared/. ↩︎
  50. Ohio Department of Medicaid, “MyCare Ohio: Annual Report on Integrated Care Delivery System Evaluation,” July 1, 2014, available at:  http://medicaid.ohio.gov/Portals/0/For%20Ohioans/Programs/MyCareOhio/AnnualReport/MyCare-OhioAnnualReport-SFY2014.pdf. ↩︎
  51. Ibid. ↩︎
  52. MaryBeth Musumeci, A Guide to the Supreme Court’s Affordable Care Act Decision (Kaiser Family Foundation, June 2012), https://modern.kff.org/health-reform/issue-brief/a-guide-to-the-supreme-courts-affordable/. ↩︎
  53. State Health Facts, Status of State Action on the Medicaid Expansion Decision, 2014 (March 26, 2014), https://modern.kff.org/health-reform/state-indicator/state-activity-around-expanding-medicaid-under-the-affordable-care-act/. ↩︎
  54. KCMU analysis based on 2014 Medicaid eligibility levels and 2012-2013 CPS. ↩︎
  55. CMS, Ohio “MetroHealth Care Plus” Approval Letter (February 5, 2013), http://www.medicaid.gov/Medicaid-CHIP-Program-Information/By-Topics/Waivers/1115/downloads/oh/oh-metrohealth-care-plus-ca.pdf. ↩︎
  56. Although originally scheduled to end December 31, 2013, MetroHealth Care Plus was extended through April 30, 2014 to smooth the transition of many former beneficiaries to Medicaid. ↩︎
  57. The Ohio Controlling Board is a seven-member panel with authority to adjust spending appropriations and to authorize the spending of federal funds for the ACA Medicaid expansion, once the state’s Medicaid agency had received approval from CMS of its state plan amendment to cover new eligibility groups. ↩︎
  58. State ex rel. Cleveland Right to Life v. State of Ohio Controlling Bd., 138 Ohio St. 3d 57, 2013-Ohio-5632 (Dec. 20, 2013), available at http://www.supremecourt.ohio.gov/rod/docs/pdf/0/2013/2013-Ohio-5632.pdf. ↩︎
  59. Amy Rohling et al., “Expanding Medicaid in Ohio, Analysis of Likely Affects,” The Urban Institute, February 2013, available at: http://www.urban.org/uploadedpdf/412772-Expanding-Medicaid-in-Ohio-Report.pdf ↩︎
  60. Mercer, Fiscal impact of the affordable Care Act on Medicaid Enrollment and Program Cost (State of Ohio, Office of Medical Assistance, February 13, 2013), pages 58 and 60, http://www.healthtransformation.ohio.gov/LinkClick.aspx?fileticket=WFcA5IZ-hak%3d&tabid=136. ↩︎
  61. Ohio Department of Medicaid, Caseload Report: June 2014 (July 10, 2014), http://medicaid.ohio.gov/Portals/0/Resources/Reports/Caseload/2014/06-Caseload.pdf. ↩︎
  62. Governor’s Office of Health Transformation, “Medicaid Applications in Ohio Benefits,” updated June 30, 2014, http://www.healthtransformation.ohio.gov/LinkClick.aspx?fileticket=jrKOicOZiIg%3D&tabid=117. ↩︎
  63. State Health Facts, “State Decisions for Creating Health Insurance Marketplaces, 2014” (May 28, 2013), https://modern.kff.org/health-reform/state-indicator/health-insurance-exchanges/. ↩︎
  64. John Kasich. “Ohio Says No to an Obamacare Health Exchange.” November 16, 2012, http://governor.ohio.gov/exchange.aspx. ↩︎
  65. State Health Facts, “State Decisions for Creating Health Insurance Marketplaces” (Kaiser Family Foundation, May 28, 2013), https://modern.kff.org/health-reform/state-indicator/health-insurance-exchanges/#note-2. ↩︎
  66. Letter from Lieutenant Governor Taylor to Gary Cohen (February 14, 2013), http://www.cms.gov/cciio/index.html. ↩︎
  67. For a listing of participating health insurance companies, see: U.S. News & World Report, “Ohio Exchange Health Insurance Plans” (January 2, 2014), http://health.usnews.com/health-insurance/ohio/marketplace-plans. ↩︎
  68. This is the monthly premium for a single, 40-year-old at 250% FPL. With premium tax credits, the monthly premium drops to $193. To see how Ohio compares to other states, see: State Health Facts, “ 2014 Monthly Premiums for a Single 40-Year-Old at 250 Percent of Poverty in a Major City in Each State” (Kaiser Family Foundation), https://modern.kff.org/other/state-indicator/2014-monthly-premiums-for-a-single-40-year-old-at-250-percent-of-poverty-in-a-major-city-in-each-state/. ↩︎
  69. State Health Facts, State-by-State Estimates of the Number of People Eligible for Premium Tax Credits Under the Affordable Care Act (Kaiser Family Foundation, November 2013), https://modern.kff.org/report-section/state-by-state-estimates-of-the-number-of-people-eligible-for-premium-tax-credits-under-the-affordable-care-act-table-1/. ↩︎
  70. Larry Levitt and Gary Claxton, The Potential Side Effects of Halbig (Kaiser Family Foundation, July 31, 2014), https://modern.kff.org/health-reform/perspective/the-potential-side-effects-of-halbig/. ↩︎
  71. Office of the Assistant Secretary for Planning and Evaluation (ASPE), Profiles of Affordable Care Act Coverage Expansion Enrollment For Medicaid/CHIP and the Health Insurance Marketplace, 10-1-13 to 3-31-14 (Department of Health and Human Services (HHS), May 1, 2014), http://aspe.hhs.gov/health/reports/2014/MarketPlaceEnrollment/Apr2014/Marketplace_StateSum.cfm. ↩︎
  72. The Center for Consumer Information & Insurance Oversight, New Loan Program Helps Create Customer-Driven Non-Profit Insurers (CMS, January 1, 2014), http://www.cms.gov/CCIIO/Resources/Grants/new-loan-program.html. ↩︎
  73. Carrie Ghose, “InHealth Mutual gets Ohio license to sell policies” (Columbus Business First, September 27, 2013), http://www.bizjournals.com/columbus/news/2013/09/27/obamacare-backed-inhealth-mutual-gets.html. ↩︎
  74. Governor’s Office of Health Transformation, “Ohio Receives Federal Grant to Advance Health Care Payment Innovation” (February 21, 2013), http://www.healthtransformation.ohio.gov/LinkClick.aspx?fileticket=r2b-iXyOqCA=. ↩︎
  75. Governor’s Office of Health Transformation, “Transforming Payment for a Healthier Ohio,” Ohio’s State Health Care Innovation Plan, (October 30, 2013), http://www.healthtransformation.ohio.gov/LinkClick.aspx?fileticket=WsSlPFly5GI%3d&tabid=138. ↩︎
  76. The Affordable Care Act created the Balancing Incentive Program (BIP), which provides financial incentives to states that implement certain structural reforms to increase access to community-based LTSS as an alternative to institutional care. Ohio is one of 20 states participating in the Balancing Incentive Program (State Health Facts, Balancing Incentive Program (Kaiser Family Foundation, June 2014), https://modern.kff.org/medicaid/state-indicator/balancing-incentive-program/). For additional information on the Balancing Incentive Program, see: http://www.balancingincentiveprogram.org/. ↩︎
  77. HRSA, Ohio: Health Center Outreach and Enrollment Assistance, http://www.hrsa.gov/about/news/2013tables/outreachandenrollment/oh.html and HRSA, Health Center and Look-alike Sites Facility Directory (April 1, 2014), http://findahealthcenter.hrsa.gov/Search_HCC.aspx?byCounty=1. ↩︎
  78. National Association of Community Health Centers, Incorporated (NACHC) analysis of the 2011 Uniform Data System, Bureau of Primary Health Care, Health Resources and Services Administration, Department of Health and Human Services, Special Data Request, (March 2013), http://www.nachc.com/client//2012%20Key%20data.pdf. ↩︎
  79. NACHC analysis of the 2011 Uniform Data System. ↩︎
  80. National Association of Community Health Centers, Ohio Health Center Fact Sheet, http://www.nachc.com/client/documents/research/OH12.pdf. ↩︎
  81. For additional information about FQHCs in Ohio compared to the rest of the U.S., see: Peter Shin, Jessica Sharac, and Sara Rosenbaum, The Potential Impact of the Affordable Care Act on Uninsured Community Health Center Patients: A Nationwide and State-by-State Analysis (George Washington University School of Public Health and Health Services, October 16, 2013), http://sphhs.gwu.edu/sites/default/files/GG%20uninsured%20impact%20brief.pdf. ↩︎
  82. HRSA, Ohio: Health Center Outreach and Enrollment Assistance, http://www.hrsa.gov/about/news/2013tables/outreachandenrollment/oh.html. ↩︎
  83. Ohio Department of Medicaid, Hospital Care Assurance Program, http://medicaid.ohio.gov/PROVIDERS/ProviderTypes/HospitalProviderInformation/HospitalCareAssuranceProgram.aspx. ↩︎
  84. Federal Register, February 28, 2014 (Vol. 79 No. 40), pp. 11436, http://www.gpo.gov/fdsys/pkg/FR-2014-02-28/pdf/2014-04032.pdf. ↩︎
News Release

Drew Altman: 3 Takeaways From the Medicare Trustees Report

Published: Aug 1, 2014

In his latest column for The Wall Street Journal’s Think Tank, Drew Altman dives into this week’s release of the Social Security and Medicare Trustees Report to discuss the good news that may have been missed.

All previous columns by Drew Altman are available online.

News Release

Share of Americans With An Unfavorable View of the Affordable Care Act Rises in July; Majority Continues To Want Congress To Improve, Not Repeal, The Law

Published: Aug 1, 2014

A Quarter Incorrectly Believes Newly Insured Under ACA Were Enrolled in a Single Government Plan

Majority of the Public Believes the Hobby Lobby Decision Will Trigger New Efforts to Deny Health Coverage On Religious Grounds

After remaining steady for several months, the share of Americans expressing an unfavorable view of the Affordable Care Act rose to 53 percent in July, up eight percentage points from June, according to the latest Kaiser Health Tracking Poll. The poll also finds that a majority of the public continues to prefer that Congress work to improve the health care law (60%) rather than to repeal and replace it (35%).

The share of Americans with a favorable view of the ACA held relatively steady in July at 37 percent, little changed since March. The share of the public who offered no opinion about the ACA fell to 11 percent in July, down from 16 percent in June.

July_2014_email_alert_chart_FINAL

The share of the public preferring to see the law improved rather than repealed has held steady for several months. It was 59 percent in May and 58 percent in April. Similarly, in January 55 percent of the public said opponents should accept that the ACA is the law and work to improve it, while 38 percent said the law’s opponents should continue efforts to repeal it. Even among Republicans (32%) and those with an unfavorable view of the law (36%), about a third would prefer to see the ACA improved rather than repealed and replaced, the July poll finds.

Most unaware that new enrollees under the ACA had a choice of private plans

The July poll also finds that four years after the law’s passage, and following the ACA’s inaugural open enrollment period, misperceptions about the law persist.  For instance, about 1 in 4 Americans (26%) believe that people who got new health insurance under the ACA enrolled in a single government health plan, while 37 percent of the public and 29 percent of the uninsured are aware that people had a choice between private health plans. Thirty-eight percent say they don’t know enough to answer the question.

The poll finds that Republicans (34%) are less likely than Democrats (43%) to say that enrollees had a choice of private health plans. Other groups that are less likely to be aware of this fact include those with an unfavorable view of the law (32%), self-described conservatives (31%), and people ages 65 and older (29%).

Most think Hobby Lobby decision will spill over into other areas

A majority of the public (58%) believes the Supreme Court’s decision in the Hobby Lobby case, in which justices ruled that closely-held corporations can cite religious objections to avoid paying for contraceptive coverage as required under the ACA, is likely to prompt employers to try and use religious grounds to deny their workers coverage of other types of health care services, such as vaccinations or blood transfusions.

The public is evenly split on the Court’s decision, with 47 percent approving of the Hobby Lobby ruling and 49 percent disapproving. A majority of women disapprove of the decision (53% disapprove), while men are somewhat more evenly divided (50% approve vs. 46% disapprove). The bigger division is by partisan identification, with about 7 in 10 Republicans saying they approve of the decision and a similar share of Democrats saying they disapprove.

A majority (60%) of the public continues to support the requirement that private insurance plans cover the full cost of birth control, while about a third (33%) is opposed. Forty-five percent of the public – including 62 percent of women under age 35 — say the Hobby Lobby decision will make it more difficult for women to obtain prescription birth control, while 50 percent disagree. In cases where a woman’s employer does not pay for birth control coverage because of religious objections, about half the public (47%) believes the woman should have to pay for the coverage, while just over a third (36%) believe the insurance company should pay and 14 percent think the government should.

Also available is the July installment of the Kaiser Health Policy News Index, which finds that 59 percent of the public report closely following the Supreme Court’s decision in the Hobby Lobby case, and just over half the public (53%) correctly identifies the Court’s decision in the case. The Index is designed to help journalists and policymakers understand which health policy-related news stories Americans are paying attention to, and what the public understands about health policy issues covered in the news.

Methodology

The July tracking poll was designed and analyzed by public opinion researchers at the Kaiser Family Foundation and was conducted from July 15-21 among a nationally representative random digit dial telephone sample of 1,507 adults ages 18 and older. Interviews were conducted in English and Spanish by landline (753) and cell phone (754). The margin of sampling error is plus or minus 3 percentage points for the full sample. For results based on subgroups, the margin of sampling error may be higher.

Poll Finding

Kaiser Health Tracking Poll: July 2014

Authors: Liz Hamel, Jamie Firth, and Mollyann Brodie
Published: Aug 1, 2014

Kaiser Health Tracking Poll: July 2014

The latest Kaiser Health Tracking Poll finds that over half the public has an unfavorable view of the Affordable Care Act (ACA) in July, up eight percentage points since last month, while the share viewing the law favorably held steady at just under four in ten. A solid majority continues to prefer that Congress work to improve the law rather than repeal and replace it. The uptick in negative views comes at a time when Americans report hearing more negative than positive things about the ACA in advertising and personal conversations, and when large shares of the public want leaders in Washington to pay more attention to other issues like the economy and jobs, the federal budget deficit, education, and immigration. The poll also finds misperceptions about the ACA persist: fewer than four in ten are aware that enrollees in new insurance under the ACA had a choice between private health plans, while a quarter incorrectly believe they were enrolled in a single government plan and another four in ten are unsure.

This month’s poll also explored the public’s reaction to the Supreme Court decision upholding craft store chain Hobby Lobby’s ability to deny workers coverage of certain contraceptives based on the company’s owners’ religious beliefs. The public overall is evenly split between those who approve and disapprove of the Court’s decision, with only a small difference in opinion between women and men, but deep divisions by party identification, ideology, and religious affiliation. In terms of the potential consequences of the decision, a majority believes it is likely to prompt employers to try and deny their workers coverage of other types of health care services on religious grounds, and 45 percent believe the ruling will make it more difficult for women to obtain prescription birth control – a share that rises to more than six in ten among women under the age of 35. Almost half the public feels that if a woman works for an employer who does not pay for birth control coverage because of religious objections, the woman herself should have to pay for the coverage, while about a third think responsibility should lie with the insurance company. While most realize there is a connection between the Hobby Lobby decision and the ACA, just 12 percent see the ruling as a major setback for the law, and a solid majority continues to support the law’s contraceptive coverage requirement in general. Looking ahead to November, only a handful of voters say the Supreme Court decision will make them more likely to vote in the midterm election than they otherwise would have been.

Unfavorable Views Of ACA Increase In July

After remaining steady for several months, the share of the public expressing an unfavorable view of the health care law rose to 53 percent in July, up eight percentage points since last month’s poll. This increase was offset by a decrease in the share who declined to offer an opinion on the law (11 percent, down from 16 percent in June), while the share who view the law favorably held fairly steady at 37 percent, similar to where it’s been since March.1  Republicans continue to be the group with the strongest opposition to the law, but the increase in the share with an unfavorable view between June and July was similar across the political spectrum and different demographic groups. [See Kaiser Health Tracking Poll Interactive]

Figure 1

Majority Continues To Prefer Congress Improve ACA Rather Than Repeal and Replace

Despite the increase in the share with an unfavorable view of the ACA, a strong majority of the public continues to prefer that their representative in Congress work on improving the law (60 percent) rather than working to repeal and replace it with something else (35 percent), shares that have been consistent over the last several months. Even among Republicans and those with an unfavorable view of the law, about a third would prefer to see the law improved rather than repealed and replaced (32 percent and 36 percent, respectively).

Figure 2

Most Unaware That New Enrollees Under ACA Had Choice Of Private Plans

Previous tracking polls have found that misperceptions about the ACA are common among the public, and more than four years after the law’s passage this continues to be the case. The July poll finds that fewer than four in ten Americans (37 percent) are aware that people who got new health insurance under the ACA had a choice between private health plans, while about a quarter (26 percent) think the newly insured were enrolled in a single government plan and about four in ten (38 percent) say they don’t know enough to answer the question.

The survey also finds differences in perceptions on this question by political party identification and other demographic characteristics. For example, Republicans (34 percent) are less likely than Democrats (43 percent) to say that enrollees had a choice of private health plans. Other groups that are less likely to be aware of this fact include those with an unfavorable view of the law (32 percent), self-described conservatives (31 percent), people ages 65 and older (29 percent), and the uninsured (29 percent).

Figure 3

ACA Somewhat Out Of The Limelight, But Personal Conversations and Ads More Negative Than Positive

With other issues dominating the national agenda, the ACA has been somewhat out of the limelight in the past month. About half the public (49 percent) says the amount of news coverage they’ve seen about the law has stayed about the same in the last few months, but more say coverage has decreased (35 percent) than say it has increased (11 percent). The share saying they’ve had personal conversations about the law in the past month has also decreased somewhat (47 percent, down from 55 percent in March), as have the shares who report seeing ads or commercials opposed to the law (34 percent, down from 43 percent in April) or in support of it (27 percent, down from 43 percent in April).

Among the 47 percent who say they have discussed the law with friends or family, far more say they’ve heard mostly bad things rather than mostly good things in these conversations (27 percent versus 6 percent). Similarly, among the 53 percent who say they saw any political ads about the law in the past month, more than twice as many say the ads they saw were mostly in opposition to the law rather than mostly in support of it (19 percent versus 7 percent).

Figure 4

On a more personal note, a majority of the public (56 percent) continues to say they haven’t been directly impacted by the law yet, but almost twice as many feel the law has hurt them and their family (28 percent, mostly through increased health care and health insurance costs) as feel it has helped them (15 percent, mostly through increased access to insurance coverage).

Public Wants President And Congress To Pay More Attention To Issues, But Less So For Health Care And Women’s Health

With the exception of medical care for veterans, health care does not appear to be at the top of the public’s issue agenda at the moment. Large majorities of the public believe the president and Congress are paying too little attention to a variety of issues, including veterans’ health care (71 percent), the economy and jobs (70 percent), the federal budget deficit (68 percent), education (66 percent), Social Security (65 percent), and immigration (61 percent).  In terms of the issues the public is more likely to feel are getting too much attention from the president and Congress, health care (29 percent) tops the list, followed by women’s health issues (28 percent), the situation in Iraq (26 percent), climate change (22 percent), and taxes (20 percent).

Figure 5

When it comes to women’s health issues, including access to birth control, about a third (34 percent) say Congress and the president are paying too little attention, while nearly as many (28 percent) say they are paying too much attention. Men and women give similar responses to this question. However, there is a partisan divide, with Democrats much more likely to want leaders to pay more attention to women’s health issues (49 percent say they are currently paying too little attention and 12 percent say too much), and Republicans more likely to think the issue is already getting too much focus (20 percent say too little attention and 44 percent say too much).

Public Divided On Hobby Lobby Decision

On June 30, the Supreme Court announced its decision in the case brought by craft store chain Hobby Lobby challenging the ACA’s contraceptive coverage requirement. According to the July Kaiser Health Policy News Index, roughly six in ten Americans closely followed news of the Supreme Court’s decision in the Hobby Lobby case, and just over half were aware that the Court decided that closely-held for-profit companies may choose not to pay for coverage of birth control in their workers’ health plans if the company’s owner has religious objections.

Asked their opinion of the Court’s decision, the public is evenly divided, with 47 percent saying they approve and 49 percent disapproving. Intensity of opinion is also similar on both sides, with 12 percent overall saying they feel angry about the Court’s decision and 11 percent saying they feel enthusiastic.

Figure 6

There is a small gender gap in views of the Supreme Court ruling, with a majority (53 percent) of women disapproving of the decision and men more evenly divided (50 percent approve, 46 percent disapprove). The bigger divide in opinion is by partisan identification, with a large majority of Republicans (71 percent) saying they approve of the decision and an equally large share of Democrats (7o percent) saying they disapprove.

Figure 7

As a historical comparison, when the Supreme Court decided in June 2012 to uphold most provisions of the ACA, opinion was also divided (47 percent approved and 43 percent disapproved), but in that case a large majority of Democrats were supportive of the decision and a large majority of Republicans were opposed.

Looking at reactions to the current decision in more detail, besides Republicans in general, the groups most likely to approve of the Court’s ruling are Republican men (79 percent), White Evangelical Protestants (69 percent), self-identified conservatives (65 percent), and Republican women (63 percent). Besides Democrats in general, those most likely to disapprove of the ruling are liberals (76 percent), Democratic women (71 percent), Democratic men (69 percent), and those with no religious affiliation (67 percent). Those most likely to feel enthusiastic about the Court’s decision are White Evangelical Protestants (28 percent), while those most likely to feel angry are women who identify as Democrats (30 percent).

Figure 8

Majority Thinks Hobby Lobby Decision Will Lead Employers To Attempt To Deny Coverage For Other Health Services

Nearly six in ten Americans (58 percent) believe it is “very” or “somewhat” likely that employers will use the Supreme Court’s decision in the contraceptive coverage case to attempt to deny their workers coverage for other types of health care services – such as vaccinations or blood transfusions – on religious grounds, while about four in ten (39 percent) think this is “not too” or “not at all” likely. There is once again a partisan divide on this question, with three-quarters of Democrats (75 percent) believing this is a likely outcome of the decision and six in ten Republicans (59 percent) saying it is not likely.

Figure 9

Public Divided On Whether Court’s Decision Will Impact Women’s Access to Birth Control

The public is also divided in their perceptions of the likely impact of the Court’s decision on women’s access to birth control. Nearly half (45 percent) say the decision will make it more difficult for women to obtain prescription birth control, while the other half (50 percent) disagree. A majority (55 percent) of men believe the decision will not impact women’s access to birth control, while women are more evenly divided (50 percent believe the decision will make it more difficult for women to obtain contraceptives and 46 percent think it will not). Among women under the age of 35, more than six in ten (62 percent) believe the decision will have a negative impact on women’s access to birth control. Not surprisingly, there is also a partisan divide on this question. Sixty-two percent of Democrats (including 69 percent of Democratic women and 55 percent of Democratic men) see the ruling as having a negative impact on women’s contraceptive access, while 70 percent of Republicans (including equal shares of Republican men and women) disagree.

Table 1
Do you think the Supreme Court’s decision in this case will make it more difficult for women to obtain prescription birth control, or not?Yes, will make it more difficultNo, will not make it more difficult
Total Public45%50%
By Gender
  Women5046
  Men4055
Women By Age
  Women ages 18-346235
  Women ages 35-495444
  Women ages 50-644650
  Women ages 65+3356
Democrats
  Total6235
  Women6930
  Men5541
Independents
  Total4649
  Women4946
  Men4353
Republicans
  Total2670
  Women2670
  Men2670

In the case where a woman works for an employer who does not pay for birth control coverage because of religious objections, about half the public (47 percent) believes the woman herself should have to pay for the coverage, while just over a third (36 percent) believe the insurance company should pay and 14 percent think the responsibility should fall on the government. Women and men have similar views of whose responsibility it is to pay for contraception in this situation, but a familiar partisan divide emerges once again, with Republicans more likely to say the woman herself should have to pay and Democrats more likely to place payment responsibility with the insurance company or the government.

Figure 10

Few See Hobby Lobby Decision As Major Setback For ACA, And Public’s General Support For Contraceptive Coverage Requirement Continues

Over half the public (56 percent) is aware that the Supreme Court’s decision in the contraceptive coverage case is related to the ACA, while a third (34 percent) think the case is unrelated to the health care law and one in ten (9 percent) say they don’t know enough to say. Just 12 percent of the public overall sees the decision as a major setback for the law, while a quarter (25 percent) see it as a minor setback and almost one in five (18 percent) say it is not a setback.

Figure 11

News of the Court’s decision does not appear to have made an impact on the public’s general level of support for the ACA’s contraceptive coverage requirement. A solid majority (60 percent) continues to support the law’s requirement that private health insurance plans cover the full cost of birth control, while about a third (33 percent) are opposed to the requirement. This level of support has held steady in Kaiser tracking polls since early 2012.

Few Voters Say Court’s Decision Will Motivate Them To Turn Out In Midterms

The vast majority of registered voters say that the Supreme Court’s decision in the contraceptive coverage case “doesn’t really change their plans” for voting in the midterm election this November, while just 11 percent say the decision will make them more likely to vote than they otherwise would have been and 3 percent say it will make them less likely to turn out. To the extent that the ruling is a motivating factor for a small share of voters, Democrats and those who disapprove of the Court’s decision are somewhat more likely to say the decision will motivate them to vote in November than Republicans, independents, and those who approve of the ruling.

Table 2
Does this decision by the Supreme Court make you more likely to vote this November than you otherwise would have been, less likely to vote than you otherwise would have been, or does it not really change your plans for voting?*Total RVsRegistered Voters By Approval Of Supreme Court DecisionRegistered Voters By Party Identification
ApproveDisapproveDemocratsIndependentsRepublicans
More likely to vote11%9%14%15%8%9%
Less likely to vote314322
Doesn’t really change your plans for voting858981798889
* Don’t know/Refused responses not shown

This Kaiser Health Tracking Poll was designed and analyzed by public opinion researchers at the Kaiser Family Foundation (KFF). The survey was conducted July 15-21, 2014, among a nationally representative random digit dial telephone sample of 1,507 adults ages 18 and older, living in the United States, including Alaska and Hawaii (note: persons without a telephone could not be included in the random selection process). Computer-assisted telephone interviews conducted by landline (753) and cell phone (754, including 419 who had no landline telephone) were carried out in English and Spanish by Princeton Data Source under the direction of Princeton Survey Research Associates International (PSRAI). Both the random digit dial landline and cell phone samples were provided by Survey Sampling International, LLC. For the landline sample, respondents were selected by asking for the youngest adult male or female currently at home based on a random rotation. If no one of that gender was available, interviewers asked to speak with the youngest adult of the opposite gender. For the cell phone sample, interviews were conducted with the person who answered the phone. KFF paid for all costs associated with the survey.

The combined landline and cell phone sample was weighted to balance the sample demographics to match estimates for the national population using data from the Census Bureau’s 2012 American Community Survey (ACS) on sex, age, education, race, Hispanic origin, nativity (for Hispanics only), and region along with data from the 2010 Census on population density. The sample was also weighted to match current patterns of telephone use using data from the July-December 2013 National Health Interview Survey. The weight takes into account the fact that respondents with both a landline and cell phone have a higher probability of selection in the combined sample and also adjusts for the household size for the landline sample. All statistical tests of significance account for the effect of weighting.

The margin of sampling error including the design effect for the full sample is plus or minus 3 percentage points. Numbers of respondents and margin of sampling error for key subgroups are shown in the table below. For results based on other subgroups, the margin of sampling error may be higher. Sample sizes and margin of sampling errors for other subgroups are available by request. Note that sampling error is only one of many potential sources of error in this or any other public opinion poll.

GroupN (unweighted)M.O.S.E.
Total1,507±3 percentage points
Registered Voters(RV)1,241±3 percentage points
Party Identification
   Democrats483±5 percentage points
   Republicans381±6 percentage points
   Independents498±5 percentage points
Opinion of ACA
   Favorable Opinion of the ACA555±5 percentage points
   Unfavorable Opinion of the ACA804±4 percentage points
Party Gender
   Men745±4 percentage points
   Women762±4 percentage points

Endnotes

  1. The change in the share with an unfavorable view may be at least partially attributable to a change in question order in this monthu2019s survey. In the July poll, the ACA favorability question was asked after two questions about national issues, while in the June poll it was the first question on the survey. Itu2019s possible that for some respondents, hearing these preceding questions may have changed the way they interpreted and answered the ACA favorability question. ↩︎
Poll Finding

Kaiser Health Policy News Index: July 2014

Authors: Jamie Firth, Liz Hamel, and Mollyann Brodie
Published: Aug 1, 2014

The Kaiser Health Policy News Index is designed to help journalists and policymakers understand which health policy-related news stories Americans are paying attention to, and what the public understands about health policy issues covered in the news. The most closely followed news stories this month were discussions about how to deal with large numbers of unaccompanied minors arriving in the U.S. from Central America (70 percent say they followed the story “very” or “fairly” closely), military and political conflict between Israel and Hamas (66 percent) and ongoing problems related to Veterans Affairs (or V.A.) medical facilities (64 percent).1  In health policy news, six in ten (59 percent) report closely following the Supreme Court’s decision in a case about whether for-profit companies should be required to cover birth control for women in their workers’ health plans (the Hobby Lobby case), which is higher than the share who say they followed news rulings in two other Supreme Court cases this month. About half of the public is able to correctly identify the Court’s decision in the Hobby Lobby case, including roughly equal shares of men and women.

Figure 1

The stories that captured the attention of the largest shares of the public this month were the debate over how to deal with unaccompanied minors arriving in the U.S. from Central America (70 percent report following this story “very” or “fairly” closely) and the conflict between Israel and Hamas (66 percent). A similar share of the American public (64 percent) report following the ongoing coverage of problems related to Veterans Affairs, or V.A. medical facilities and slightly fewer (59 percent) say they followed the Supreme Court’s decision in the Hobby Lobby case.  Other health policy stories were lower on the public’s news radar this month, with about four in ten (39 percent) following reports about the ACA’s impact on the number of uninsured Americans, three in ten following the release of 2015 health insurance premiums by insurers in some states, and about one in six following debates in Virginia about whether to expand Medicaid (16 percent).  About two in ten (21 percent) say they closely followed the announcement this month that a child who was thought to have been cured of HIV is now showing signs of infection with the virus. This is lower than the share who reported following the original story in March, when 33 percent said they closely followed the news that the child who was treated for HIV as a baby was thought to have been free of the virus at 9 months.

About six in ten Americans (59 percent) report closely following the Supreme Court’s decision in the Hobby Lobby case, a case about whether for-profit companies should be required to cover birth control for women in their workers’ health plans. Smaller shares of the public report following news of Supreme Court rulings in two other cases: one about whether police officers need a warrant to search cell phones (45 percent), and another about whether states can make laws creating buffer zones around abortion clinics (35 percent).

Figure 2

When asked their awareness of the Supreme Court’s decision in the Hobby Lobby case, about half of the public overall (53 percent) correctly say that the Court ruled that for-profit companies may choose not to pay for coverage of prescription birth control in their workers’ health plans if the company’s owner has religious objections.  Two in ten (21 percent) incorrectly believe the Court decided that for-profit companies must pay for coverage of prescription birth control in their workers’ health plans and a quarter (25 percent) say they don’t know. Those who report following the news coverage of the case “very” or “fairly closely” are nearly twice as likely to correctly identify the outcome compared with those who say they followed the story “not too” or “not at all closely” (66 percent versus 35 percent).

Table 1
TotalGenderParty IDAttention To Story
MenWomRepIndDemVery/ Fairly closely followingNot too/ Not at all closely following
As you may know, last month the Supreme Court announced its decision in a case about whether for-profit companies should be required to cover birth control for women in their workers’ health plans. As far as you know, did the Court decide that for-profit companies…?… must pay for coverage of prescription birth control in their workers’ health plans21%21%22%16%23%25%19%24%
…may choose not to pay for coverage of prescription birth control in their workers’ health plans if the company’s owner has religious objections5355526252526635
Don’t know/Refused2525262225241541

Perhaps surprisingly, this month’s Health Policy News Index finds that women are just as likely as men to report closely following the news coverage of the Supreme Court’s decision in the Hobby Lobby case (60 percent of women and 58 percent of men), and women and men are also equally likely to correctly identify the outcome of the case (52 percent of women compared to 55 percent of men).  Similar shares of Republicans, independents and Democrats report closely following the news coverage of the Court’s decision; however, Republicans are somewhat more likely to correctly identify the Court’s decision (62 percent) than Democrats and independents (52 percent each).

NOTE: These questions were asked as part of the July 2014 Kaiser Health Tracking Poll. For more results from that survey, including methods, see: Kaiser Health Tracking Poll: July 2014.

  1. The July Kaiser Family Foundation Health Tracking Poll was conducted July 15-21, 2014. During this time news stories broke that were not included in our questionnaire, such as the federal appeals court case addressing the legality of health insurance subsidies offered through the federal health insurance exchange and the Malaysia Airlines flight shot down over the Ukraine- Russia border. ↩︎

The Potential Side Effects of Halbig

Authors: Larry Levitt and Gary Claxton
Published: Jul 31, 2014

The recent decision of a three-judge panel in the Halbig case, if it prevails, would have a direct effect on the availability of subsidies under the Affordable Care Act (ACA). People buying coverage on their own in insurance exchanges run by the federal government would be ineligible for income-based subsidies. Depending on how you count, that would take premium subsidies away from 4.6 million people in 34 states, or 4.7 million people in 36 states if you count New Mexico and Idaho (which have signaled their intention to operate their own exchanges but are still using the federal marketplace).

Many more people are eligible for subsidies but haven’t yet signed up. We estimate (using the approach described here that a total of 9.5 million uninsured people are eligible for subsidies in federal marketplace states (or, 9.7 million people if you include New Mexico and Idaho).

Since many low and moderate income people would have difficulty affording insurance without the subsidies, this would no doubt alter the extent to which the ACA is reducing the number of Americans who are uninsured, which recent surveys peg at about 8 to 10 million.

But, there would also be two important side effects of the Halbig case.

First, it would nullify the so-called “employer mandate” in states using the federal marketplace. There are two penalties under the employer requirement. The first – which equals $2,000 per employee – is assessed against employers that do not offer coverage at all. However, it only kicks in if at least one of the employer’s workers gets a subsidy in an exchange. If there are no subsidies, there can be no employer penalties. The other penalty applies when an employer offers coverage but that coverage is not affordable for some workers. Any worker who only has access to unaffordable employer-offered coverage is eligible for subsidies in an exchange, and if she gets a subsidy the employer owes a $3,000 penalty. Again, with no possibility of subsidies, there is no employer penalty. (It’s a little trickier with multi-state employers, who still might face penalties even if they operate in a state using the federal marketplace.)

Second, it would make the individual insurance market unstable and potentially unworkable in federal marketplace states. The ACA’s insurance market rules would still be in place, so people with pre-existing conditions would be guaranteed access to insurance and could not be charged higher premiums than healthy individuals of the same age. And, the “individual mandate” would still apply, theoretically providing an incentive for healthy people to buy insurance. However, without subsidies many if not most uninsured people could not afford coverage. And, the effect of the individual mandate would, in fact, be significantly muted because most of the uninsured end up being exempt from its penalties.

The ACA exempts someone from the individual mandate if the lowest-cost insurance available would cost in excess of 8% of income. With subsidies available, less than 3% of uninsured people eligible for subsidies in the 36 federal marketplace states would be exempt. However, if the Halbig case prevails and the subsidies are invalidated in federal marketplace states, we estimate that 8.1 million (or 83%) of those formerly subsidy-eligible uninsured people would end up being exempt from the individual mandate. With the subsidies unavailable and the individual mandate rendered partially ineffective, it might be difficult to attract healthy people into the individual market and premiums could rise significantly in these states. The result could be what is commonly called a “death spiral,” as healthy people exit the market and premiums rise even more. (See here for a description of our eligibility model.)

Even if the Halbig decision is upheld, states could choose to set up exchanges – potentially even using the federal government’s healthcare.gov enrollment and eligibility infrastructure – thus making subsidies available, stabilizing the individual insurance market, and triggering penalties under the employer mandate. However, governors and state legislators in these states would have to want this to happen, and there may be opposition to that on both political and policy grounds in some states, as with the Medicaid expansion. Still, a dozen of the 36 states relying on the federal marketplace this year chose to expand Medicaid, and they would likely be prime candidates to move forward with state exchanges if that were the only way to provide subsidies to their residents.

News Release

Drew Altman: Amid Tensions, Legal Immigrants Fear Signing Up for Obamacare

Published: Jul 30, 2014

In his latest column for The Wall Street Journal’s Think Tank, Drew Altman discusses new Kaiser Family Foundation survey findings about how fear of enforcement of immigration laws may be affecting Latino enrollment in the Affordable Care Act.

All previous columns by Drew Altman are available online