What is behind the recent slowdown in health spending?

Published: Dec 4, 2014

This slideshow charts the recent slowdown in health spending in the United States and other industrialized nations. Some possible causes include economic factors and structural changes to the U.S. health system, such as higher cost sharing in private health insurance and lower payments to providers by Medicare and other public programs.

The slideshow is part of the Peterson-Kaiser Health System Tracker, an online information hub dedicated to monitoring and assessing the performance of the U.S. health system.


How do U.S. healthcare resources compare to other countries?

Published: Dec 4, 2014

This slideshow examines the U.S. health care system and its resources in comparison with other industrialized countries. The data examines the relative number of hospital beds, doctors and nurses in the U.S. and other countries, as well as the availability and use of MRI machines as an example of medical technology.

The slideshow is part of the Peterson-Kaiser Health System Tracker, an online information hub dedicated to monitoring and assessing the performance of the U.S. health system.

News Release

New Interactive Data Tool Tracks Medicaid Managed Care Market

Published: Dec 3, 2014

Web Briefing on December 11 to Demonstrate Interactive Tool’s Potential Uses

More than half of the nation’s 67.9 million Medicaid beneficiaries now receive their health care in comprehensive managed care organizations (MCOs) – and the number and share are growing.  As states expand their use of Medicaid managed care, the Kaiser Family Foundation has launched a new interactive tool to enhance understanding and analysis of this important sector of the Medicaid program.

The Medicaid Managed Care Market Tracker, a new feature of the Foundation’s State Health Facts data center, provides the latest data on key dimensions of risk-based Medicaid managed care for the 39 states that contract with MCOs – these states are home to more than 90 percent of all Medicaid beneficiaries nationwide.  Included in the data are state- and plan-specific information on enrollment and spending; MCO quality; MCO ownership by parent firms; and parent firm participation across insurance markets nationally.  Although MCO enrollment data are available only for the 19 states that publicly report this information, MCO enrollees in these 19 states account for more than 45 percent of all Medicaid beneficiaries nationwide.  Constructed with data from multiple sources, the Tracker gathers and organizes in one place a wide range of information about the Medicaid managed care market in an interactive format that can be used flexibly for national, state-level, MCO-level, firm-level, and insurance market-level analysis.  For example, it can be used to answer questions such as:

  • What share of all Medicaid beneficiaries in my state are enrolled in MCOs?
  • Which Medicaid MCOs are owned by multi-state firms like Aetna and WellPoint?
  • In which states and insurance markets does UnitedHealth Group operate?

On Thursday, December 11 at 12:30 p.m. ET, the Foundation will host an interactive web briefing with Medicaid managed care expert Julia Paradise, an Associate Director of the Foundation’s Kaiser Commission on Medicaid and the Uninsured.  She will discuss and demonstrate how the new tool can be used to retrieve and analyze Medicaid managed care data. Register here for the web briefing. Shortly after registering, participants will receive a confirmation email that contains information about how to join the web briefing.

Also available is a new resource, Key Findings on Medicaid Managed Care: Highlights from the Medicaid Managed Care Market Tracker, which is based on the new online Data Collection and illustrates its scope.

For more information on Medicaid, visit kff.org.

Key Findings on Medicaid Managed Care: Highlights from the Medicaid Managed Care Market Tracker

Author: Julia Paradise
Published: Dec 2, 2014

Introduction

Medicaid, the public health insurance program for low-income people, is the largest public source of health coverage in the nation. In September 2014, the program covered nearly 68 million Americans, or roughly 1 in every 5. Medicaid beneficiaries are a diverse low-income population, including pregnant women and infants, children and families, non-elderly adults without dependent children, individuals with wide-ranging disabilities, and poor seniors. They include many people who are generally healthy, but also many with complex health, long-term care, and social needs.

States design and administer their own Medicaid programs within federal rules, and states and the federal government share Medicaid costs and have shared stakes in the program. One of the most important programmatic decisions that states make is how they will deliver and pay for care for Medicaid beneficiaries. Historically, states purchased services largely on a fee-for-service basis. However, since the early 1980s and particularly in recent years, states have increasingly used various models of managed care. The dominant model is comprehensive risk-based managed care, in which states contract with managed care organizations (MCOs) to provide comprehensive acute care, and in some cases long-term services and supports as well, to Medicaid beneficiaries, and pay the MCOs a fixed monthly premium or “capitation rate” on behalf of each enrollee. This model is called risk-based managed care because, through contracts, states shift the financial risk for serving their Medicaid beneficiaries to MCOs.

Today, 39 states contract with a grand total of about 265 MCOs to provide comprehensive Medicaid services; over 90% of Medicaid beneficiaries live in these 39 states. As of September 2014, more than half of all Medicaid beneficiaries nationwide were enrolled in MCOs, and the role of MCOs in Medicaid continues to grow, as an increasing number of states adopt risk-contracting programs, and states with existing programs expand them to include larger geographic areas and beneficiaries with more complex needs, shift from voluntary to mandatory enrollment in MCOs, and move long-term services and supports into capitated arrangements. In addition, states expanding Medicaid under the Affordable Care Act (ACA) are relying largely on MCOs to serve the millions of newly eligible adults. More broadly, the ACA expansions of both Medicaid and private health insurance are fueling dynamism in the managed care market as MCOs and large managed care companies position themselves to take advantage of new opportunities.

39 state Medicaid programs contract with comprehensive MCOs.

The Kaiser Family Foundation has developed the Medicaid Managed Care Market Tracker, an interactive tool that provides access to key data on numerous aspects of the Medicaid MCO market. The Tracker includes indicators at the state level and the MCO level, and it also links MCOs to their parent firms and information about them, permitting analysis at the firm level and shedding light on the broader managed care market. The Tracker includes Medicaid MCO enrollment data from all the states that publicly report this information. As of September 2014, 19 of the 39 MCO states did so. These 19 states are home to two-thirds of all Medicaid beneficiaries, and Medicaid MCO enrollees in these 19 states account for more than 45% of all Medicaid beneficiaries. Over time, as additional states make their Medicaid MCO enrollment data available, we will include it in the Tracker.

The charts that follow highlight 10 key findings on the Medicaid MCO market based entirely on analysis of data included in the Tracker. The charts provide a partial profile of the market. They also serve to illustrate the kinds of topics and questions the Tracker can be used to explore.

Report

Figure 1: 19 of the 39 MCO states publish MCO enrollment data on their websites.

Not all states that contract with MCOs report MCO enrollment data on their websites. Nineteen of the 39 MCO states have made MCO enrollment data for September 2014 (or another relatively recent month) publicly available, including 18 states that report enrollment at the MCO level. Two-thirds of all Medicaid beneficiaries nationwide reside in the 19 states that provide MCO enrollment data.


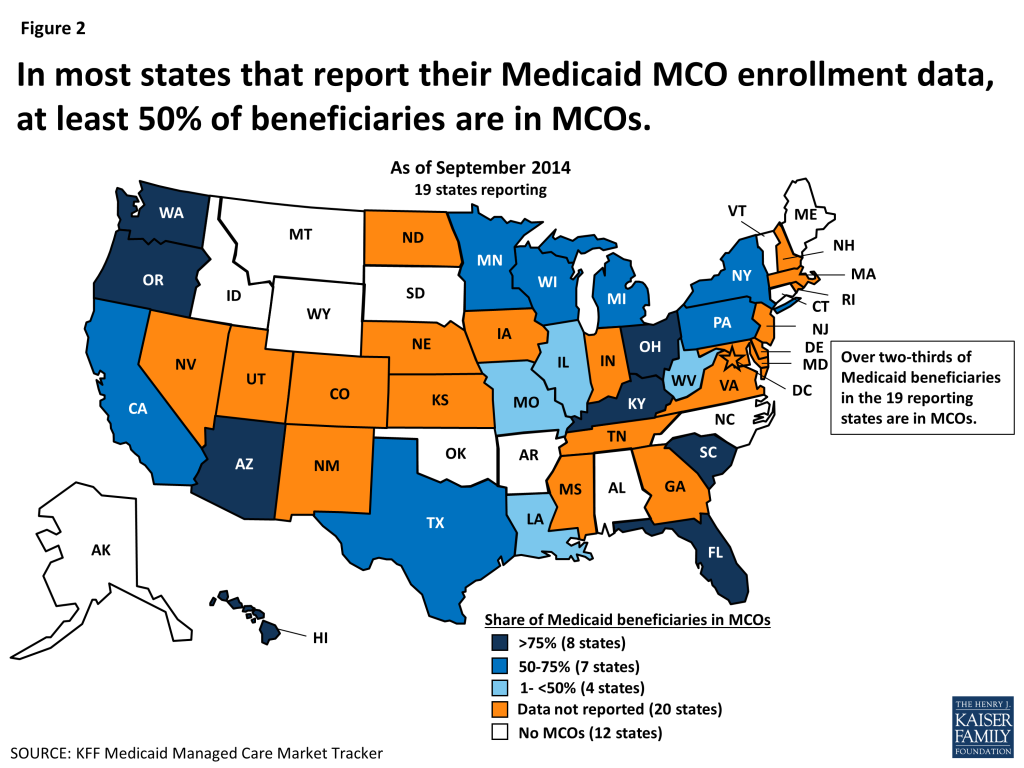
Figure 2: In most states that report their Medicaid MCO enrollment data, at least 50% of beneficiaries are in MCOs.

In 15 of the 19 states that report their MCO enrollment data, over 50% of Medicaid beneficiaries are enrolled in MCOs. Overall in the 19 states, more than two-thirds of all Medicaid beneficiaries are enrolled in MCOs. Notably, the beneficiaries enrolled in MCOs in these 19 states constitute more than 45% of all Medicaid beneficiaries nationwide.


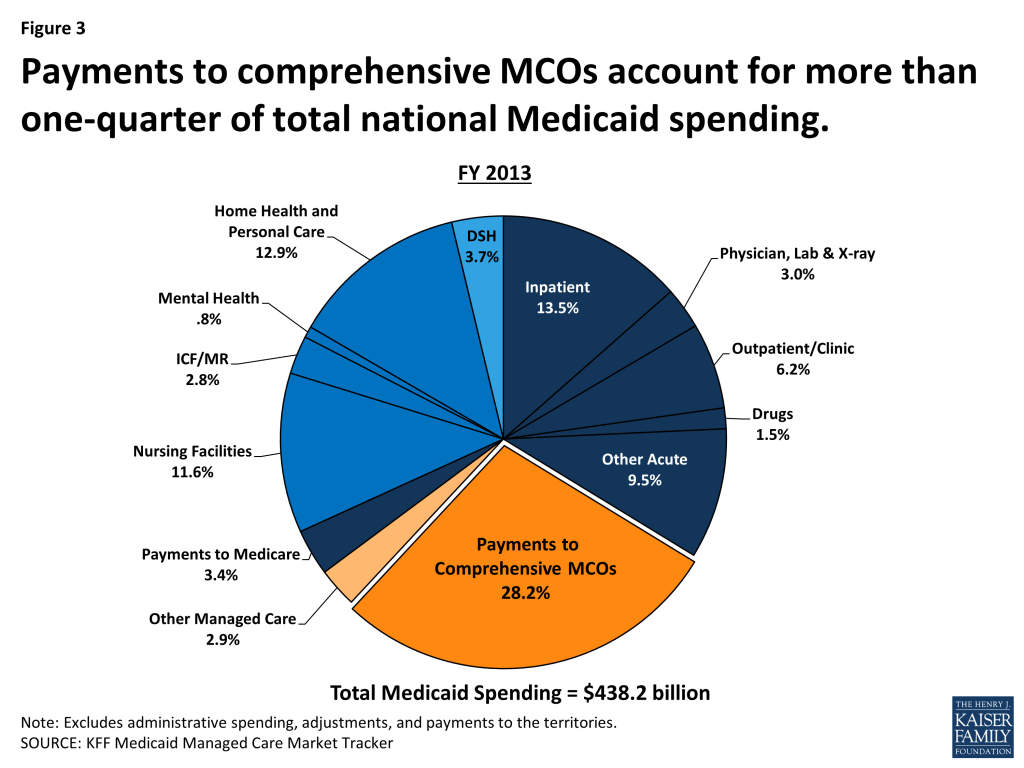
Figure 3: Payments to comprehensive MCOs account for more than one-quarter of total national Medicaid spending.

In FY 2013, premium payments to MCOs accounted for more than one-quarter of total Medicaid spending, and for a slightly higher share of aggregate Medicaid spending in the states with MCOs in that year. In 14 states, including New York, Ohio, Texas, Michigan, Minnesota, and Arizona, MCO payments accounted for at least 35% of total Medicaid spending. As states expand Medicaid managed care to include higher-need, higher-cost beneficiaries, expensive long-term services and supports, and adults newly eligible for Medicaid under the ACA, the share of Medicaid dollars going to MCOs will continue to increase.


Figure 4: But the share of Medicaid spending that goes to MCOs varies widely by state.

Among the states with MCO spending in FY 2013, 31% of total Medicaid spending was attributable to payments to MCOs. However, the MCO share of spending ranged from a low of close to zero in Connecticut to nearly 80% in Hawaii. State-to-state variation reflects many factors, including the proportion of the state Medicaid population enrolled in MCOs; the health profile of the Medicaid population and whether high-cost beneficiaries, such as individuals with disabilities and dual eligible beneficiaries, are included in or excluded from MCO enrollment; and whether long-term services and supports are included in MCO contracts and, thus, in the state’s capitation rates.


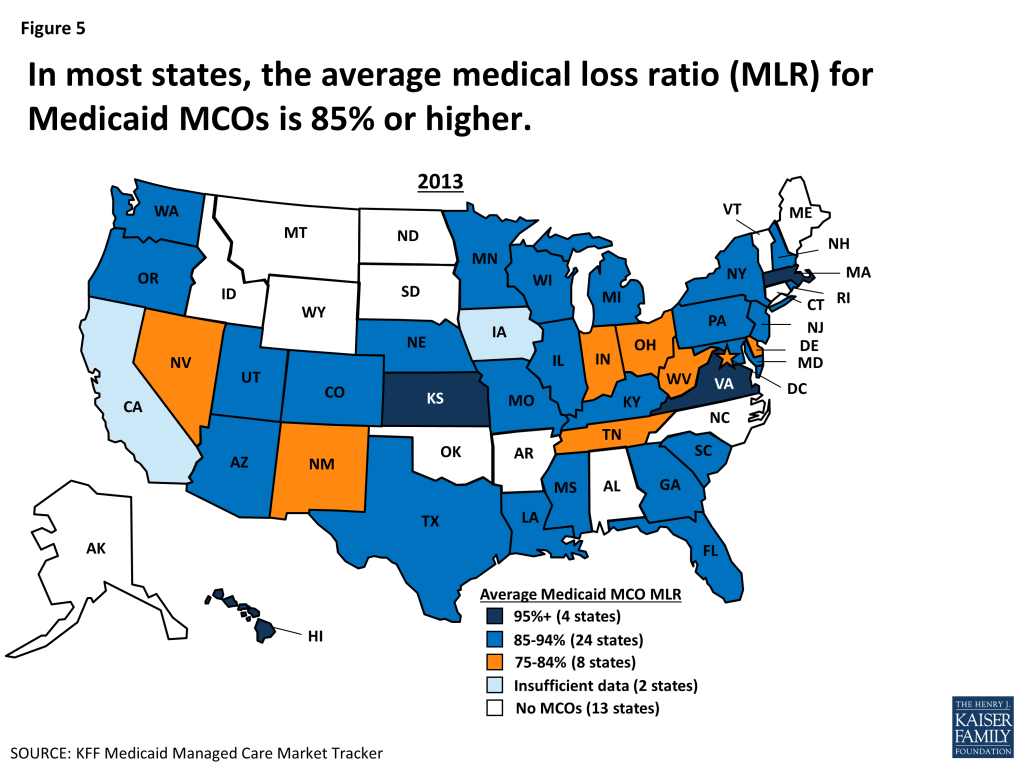
Figure 5: In most states, the average medical loss ratio (MLR) for Medicaid MCOs is 85% or higher.

A medical loss ratio (MLR) is the proportion of premium revenues taken in by an insurer – in this case, by Medicaid MCOs – that is spent on clinical services. While the ACA established a minimum MLR of 80% for insurance plans in the individual and small group markets, and 85% for plans in the large group market, no similar federal minimum standard applies to Medicaid MCOs. Some states have adopted their own minimum MLR requirement for Medicaid MCOs.

In 2013, the average MLR for Medicaid MCOs was 85% or higher in 28 of the 38 states with MCOs in that year. In four states – Hawaii, Kansas, Massachusetts, and Virginia – the average Medicaid MCO MLR was 95% or higher; in eight states, it fell below 85%.


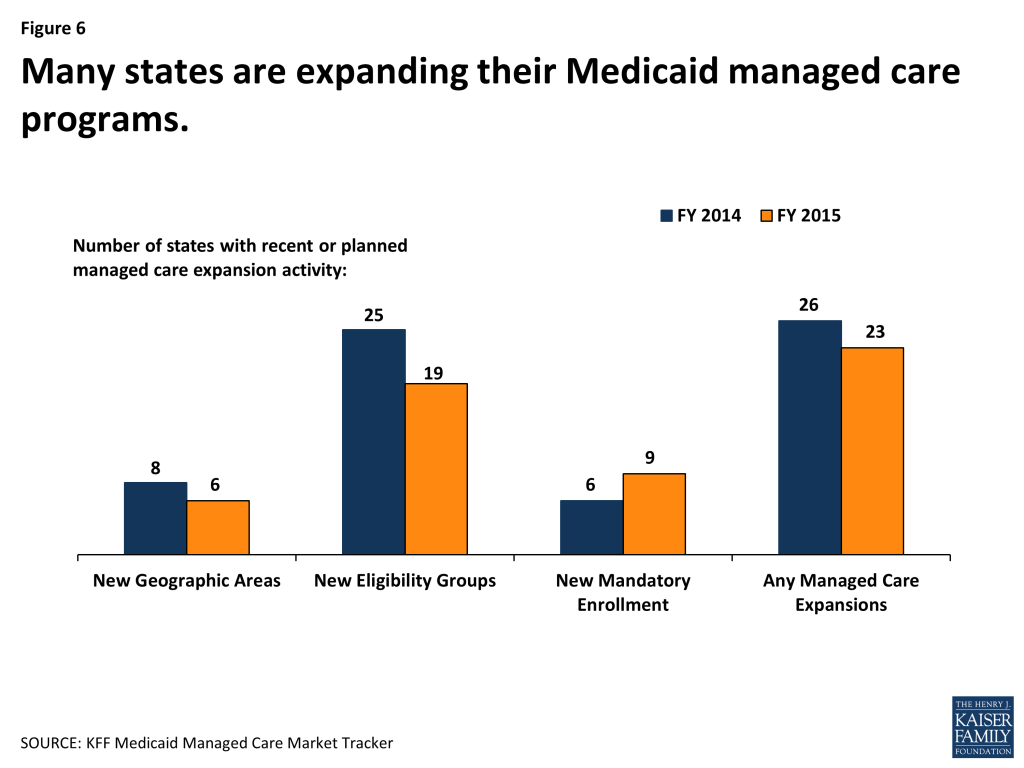
Figure 6: Many states are expanding their Medicaid managed care programs.

Many state Medicaid programs are expanding their reliance on MCOs. In a recent 50-state survey of Medicaid directors conducted by the Kaiser Commission on Medicaid and the Uninsured, half the states reported taking action in 2014 to enroll additional Medicaid eligibility groups in MCOs. These states include California, New York, Texas, Florida, and Illinois – the five states with the largest Medicaid populations. A smaller number of states expanded their managed care programs geographically and/or shifted from voluntary to mandatory MCO enrollment. Nearly half the states plan to expand their risk-based managed care programs in 2015 as well.


Figure 7: Five firms have a wide geographic reach in Medicaid, each with MCOs in 10 or more of the 39 MCO states.

A number of large health insurance companies have a significant stake in the Medicaid managed care market. Currently, 16 firms own Medicaid MCOs in two or more states, including five firms – UnitedHealth Group, WellPoint, Centene, Aetna, and Molina – that have Medicaid MCOs in 10 or more states. Eleven of the 16 multi-state parent firms are publicly traded; eight of these 11, including the five just mentioned, are ranked in the Fortune 500. The other five multi-state parent firms are nonprofit companies.


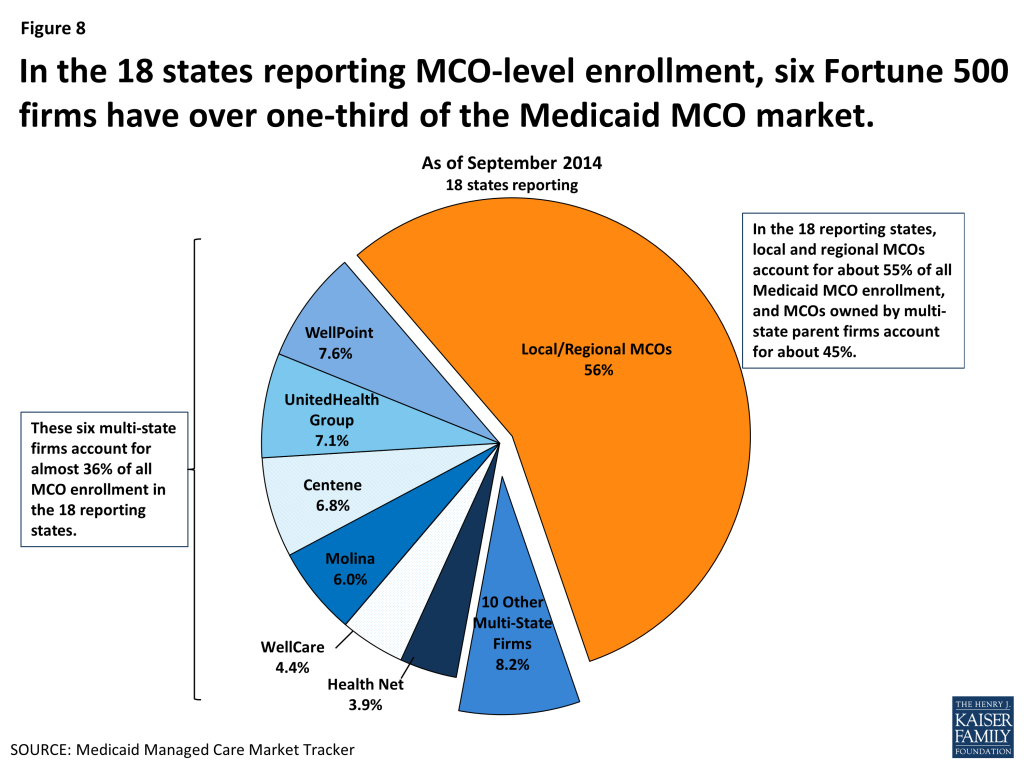
Figure 8: In the 18 states reporting MCO-level enrollment, six Fortune 500 firms have over one-third of the Medicaid MCO market.

In the 18 states that made September 2014 enrollment data at the MCO level available, local and regional MCOs account for over 55% of Medicaid MCO enrollment, and MCOs owned by multi-state parent companies account for almost 45%.

A further breakdown of the market attributable to multi-state firms shows that six companies alone – WellPoint, UnitedHealth Group, Centene, Molina, WellCare, and Health Net – account for over one-third of all Medicaid MCO enrollment in the 18 states reporting data. All six are publicly traded companies and all are ranked in the Fortune 500.


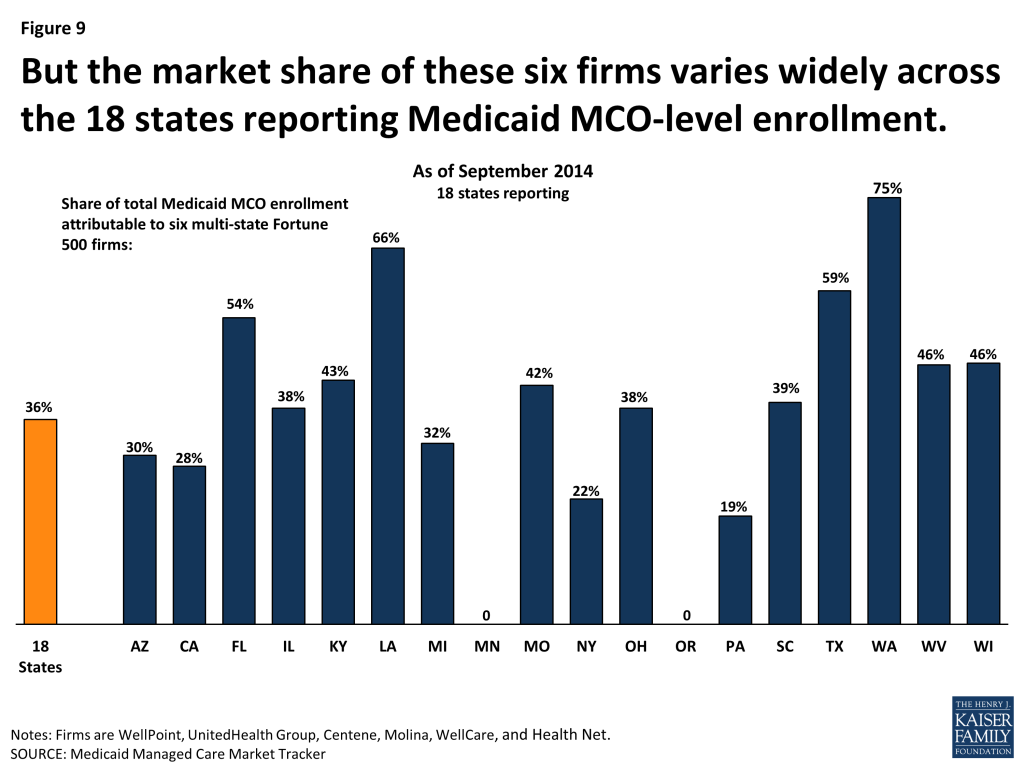
Figure 9: But the market share of these six firms varies widely across the 18 states reporting Medicaid MCO-level enrollment.

The relative role of multi-state companies in the Medicaid MCO market varies widely by state. For example, Minnesota contracts only with local nonprofit MCOs, so multi-state firms have none of the state’s Medicaid market. On the other hand, in most (14) of the other 18 MCO states reporting MCO-level data, 25% or more of all Medicaid MCO enrollees are in plans owned by the six Fortune 500 firms that dominate the Medicaid MCO market. In four states – Florida, Louisiana, Texas, and Washington – the market share of these six firms in the Medicaid managed care market exceeds 50%. In the same way that the market share of these six firms varies by state, so do the market shares of the other 10 parent companies operating in Medicaid, which include both for-profit and nonprofit firms.


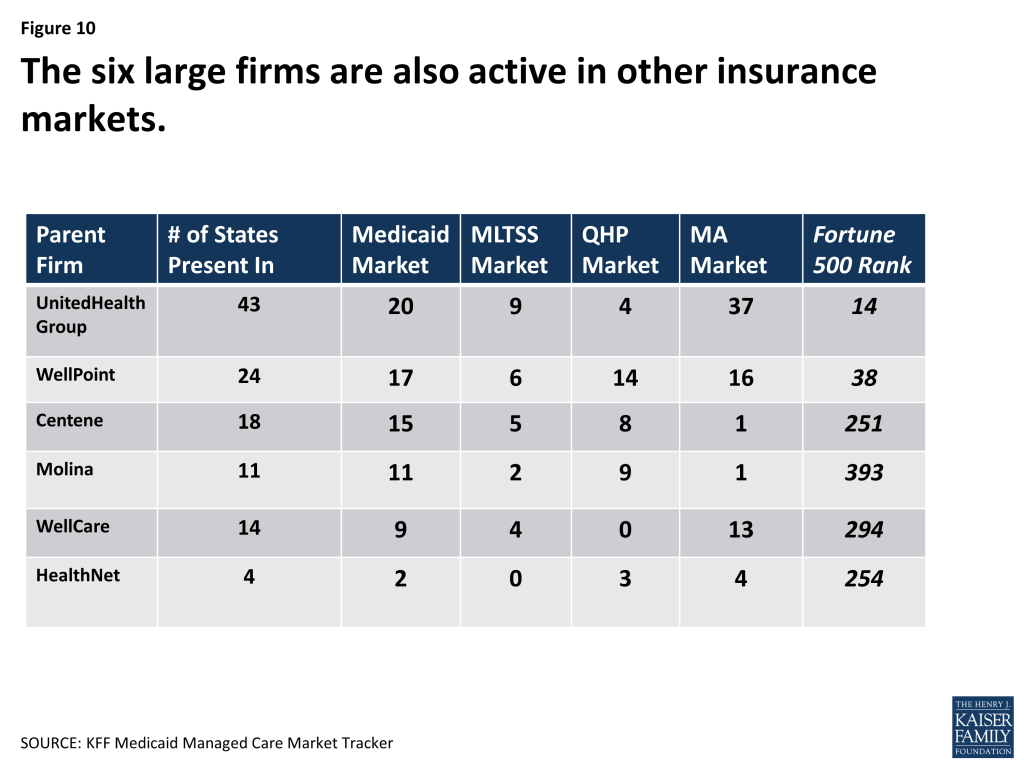
Figure 10: The six large firms are also active in other insurance markets.

The six multi-state firms that account for over one-third of the total Medicaid MCO market in the 18 states reporting MCO-level enrollment data also sell products in the managed long-term services and supports (MLTSS) market, the new QHP market under the ACA, and the Medicare Advantage market. Indeed, each of the six firms sells plans in all these insurance markets, except that WellCare does not sell in the QHP market. UnitedHealth Group has a large presence in the Medicare Advantage market; WellPoint is the most active in the QHP market. Looking across all 16 Medicaid MCO parent firms, nine are in the MLTSS market, 11 are in the QHP market, and 14 are in the Medicare Advantage market.

As the markets for both Medicaid and private insurance expand under the ACA, continued growth in the Medicaid MCO market seems certain in the near term, and shifts in the market also seem likely as MCOs and firms position themselves in response to the dynamic coverage and business environment and changing opportunities.


Looking Ahead

The Medicaid program is in a period of rapid growth and change. As of September 2014, Medicaid and CHIP enrollment had grown by about 9.1 million people relative to average monthly enrollment in the three months leading up to the first ACA open enrollment period. This large new Medicaid market, along with actions by many states to expand their use of risk-based contracting, is a formula for growth in the managed care sector of Medicaid. As MCOs and multi-state health insurance companies assess and respond to the new Medicaid opportunities (as well as the new market opportunities in the ACA Marketplaces), the Medicaid MCO market seems certain to expand.

The research on risk-based Medicaid managed care provides evidence of both better and worse access and quality of care compared to fee-for-service Medicaid, and evidence of both higher and lower costs. This mixed evidence underscores the importance of knowing more about Medicaid managed care, particularly given the stakes for Medicaid beneficiaries, who have greater health care needs and face higher barriers to access than the general population, and given the billions of dollars at stake for states and the federal government.

The new Medicaid Managed Care Market Tracker is designed to help meet the growing need for data and analysis regarding Medicaid managed care and its place in the larger market. Please explore the Tracker here, and continue to visit as we add data to keep it current and identify new indicators that can inform public understanding of key programmatic and policy issues in this important area.

Health Insurance Explained: The YouToons Have it Covered

Published: Dec 2, 2014

Health Insurance Explained – The YouToons Have It Covered is a light-hearted treatment of a difficult and important topic, breaking down insurance concepts, such as premiums, deductibles and provider networks. It explains how individuals pay for coverage and obtain medical care and prescription drugs when enrolled in various types of health insurance, including HMOs and PPOs.

Written and produced by the Kaiser Family Foundation. Narrated by Former U.S. Senate Majority Leader Bill Frist, a nationally-recognized surgeon and Foundation trustee. Creative production and animation by Free Range Studios.

The video is also available in Spanish.

If you would like to share the video with audiences offline, you may request to download the video by filling out the form below.  Permission from KFF to show the video during presentations, events or meetings is not required.  To share the video on websites, please embed the video directly from YouTube (click the “Share” link.)  We ask that you follow the citation language on our reprint information page — see the citation section for “Other Website Features.”

The 2013 animated video, “The YouToons Get Ready for Obamacare: Health Insurance Changes Coming Your Way Under the Affordable Care Act” is also available in Spanish. The YouToons first appeared in the 2010 animated short, “Health Reform Hits Main Street,” which explained how the health reform law would work. A Spanish-language version is available here.

News Release

New Kaiser Tool Calculates By Locality the Share of Potential ACA Federal Marketplace Enrollees That Signed Up for 2014 Plans

Published: Nov 26, 2014

About 8 million people signed up for a health plan through the Affordable Care Act’s insurance marketplaces by the end of the 2014 open enrollment period — 28 percent of the potential market, according to Kaiser Family Foundation estimates.

As the ACA’s second open enrollment period gears up, a new tool from the Foundation delves into states to compare on a local level the number of people eligible for a marketplace plan with the share who signed up.

The resource, Mapping Marketplace Enrollment, calculates by local area the percentage of potential ACA marketplace enrollees that signed up for a health plan in a federally-based exchange by mid-April 2014. It also displays the number of potential enrollees and the number of plan signups in 100,000-resident statistical geographical areas associated with a zip code.

A Kaiser analysis of the data shows tremendous variation across the country. Signups totaled 60 percent or more as a share of the potential market in parts of Jackson, Miss., and Miami-Dade and Broward counties in Florida, among other areas. Enrollment was less than 10 percent of the potential market in parts of Texas, Iowa, Ohio, Indiana, Arizona, and Utah. Results varied significantly within states, as well: for example, the signup percentage for areas in Florida ranged from 12 to 89 percent.

The new tool uses data from the U.S. Department of Health and Human Services and the U.S. Census Bureau’s American Community Survey. Potential enrollees for the marketplaces are people who were uninsured or buying their own insurance before the ACA went into effect, who are not eligible for Medicaid or employer coverage, who are not in the coverage gap, and who are citizens or authorized immigrants.

National marketplace enrollment totaled 6.7 million as of Oct. 15, reflecting people who had not paid their premiums, attrition since the end of the open enrollment period, and new signups during special enrollment periods. The enrollment data by zip code released by the federal government includes only states served by federally-operated marketplaces and reflects plan signups as of the spring 2014 conclusion of the first ACA open enrollment period.

For more Health Reform resources, please visit kff.org.

Filling the need for trusted information on national health issues, the Kaiser Family Foundation is a nonprofit organization based in Menlo Park, California.

JAMA Forum: Why Health Insurance Literacy Matters

Author: Larry Levitt
Published: Nov 26, 2014

Larry Levitt’s November 2014 post looks at the challenges with people not understanding basic health insurance concepts as millions of them evaluate and choose health plans during open enrollment season for insurance in 2015. The post is now available at The JAMA Forum.

Other contributions to The JAMA Forum are also available.

Estimating Federal Payments and Eligibility for Basic Health Programs: An Illustrative Example

Authors: Stan Dorn and Jennifer Tolbert
Published: Nov 25, 2014

Introduction

In some states, policymakers and stakeholders are considering adoption of the Basic Health Program (BHP) option permitted under the Patient Protection and Affordable Care Act (ACA). Federal regulations allow BHP implementation beginning in 2015. Through BHP, consumers with incomes at or below 200 percent of the federal poverty level (FPL) who would otherwise qualify for subsidized qualified health plans (QHPs) offered in health insurance marketplaces instead are offered state-contracting standard health plans that provide coverage no less generous and affordable than what have been provided in the marketplace. To operate BHPs, states receive federal funding equal to 95 percent of the premium tax credits (PTCs) and cost-sharing reductions (CSRs) that BHP enrollees would have received if they had been covered through QHPs. The rules governing BHP as well as its potential advantages and disadvantages are discussed elsewhere.1 

This paper has a narrow, technical goal: to inform state-level analysts about the characteristics of BHP-eligible people in their state and how to use that information to estimate the approximate federal BHP payment amount per average BHP-eligible resident. The paper first describes how federal BHP payments are determined, under the final federal payment methodology for 2015. The next section explains how state officials can use information about the characteristics of BHP-eligible consumers to estimate average federal payment amounts, illustrating that explanation with an example from one state. The final section places such federal payment estimates in context, showing what they can and cannot contribute to a state’s analysis of BHP’s overall fiscal effects.

To assist policymakers and others with calculating average federal payments for BHP-eligible consumers, we provide detailed estimates of the characteristics of BHP-eligible people in each state in the Appendix and as a link to a downloadable Excel file. These estimates were developed using the Urban Institute’s Health Insurance Policy Simulation Model (HIPSM).

These estimates differ from many past state-level estimates of BHP-eligible consumers, in two ways. First, they avoid underestimating average federal BHP payments, because the estimates in the appendix take into account unaccepted offers of employer-sponsored insurance (ESI) that preclude BHP eligibility. The estimates here are based on data from the American Community Survey (ACS), and unaccepted ESI offers are imputed through statistical matches with non-ACS sources of data. Many past efforts to analyze the characteristics of BHP-eligible consumers did not go beyond Census data. They simply assumed that uninsured consumers and those with nongroup coverage are not offered ESI. In fact, a significant minority have access to ESI, with offers that grow increasingly common as incomes rise. Failing to exclude those consumers from counts of BHP-eligible consumers overestimates average income levels among those who qualify for BHP. Since QHP subsidies and federal BHP payments decline as incomes rise, this underestimates average federal BHP payments.

Second, the numbers in appendix table A4 were developed with the aid of small-area estimation techniques that allowed an estimate of multiple characteristics for BHP-eligible consumers. For example, they show the number of such consumers in a state who are age 35-44, in 2-person households, with incomes between 150 and 175 percent FPL, with 1 BHP-eligible member in each household. Estimates with such multi-characteristic population sets greatly improve policymakers’ ability to project federal payment amounts, because federal payments are based on the number of BHP enrollees with such multiple characteristics.

State-level observers interested in federal payments for BHP enrollees could add take-up assumptions or simulations to the eligibility estimates in appendix table A4 to project the number and characteristics of consumers who will sign up for BHP. Such an enrollment projection could be translated into a total federal funding estimate through the method described below, which develops federal payment amounts for BHP enrollees with each set of characteristics shown in appendix table A4. However, the main goal of this paper is more modest—namely, helping state analysts develop reasonable estimates of average federal payments per BHP-eligible consumer, without determining, among eligible consumers, those who will likely enroll.


Report: How Federal Bhp Payment Amounts Are Determined

As noted earlier, the federal government pays 95 percent of what BHP enrollees would have received in marketplace subsidies, had the state not implemented BHP. To calculate that amount, the federal government puts each BHP enrollee into a federal payment cell, which is defined based on geography, income, and other personal characteristics. A specified federal payment applies to each enrollee in the cell. The payment is based on a reference premium and it includes a PTC component as well as a CSR component. Each of these factors—the cell definition, the reference premium, the PTC component, and the CSR component—is discussed in turn, below.Note that this section describes the federal BHP payment methodology for 2015. CMS proposed the same methodology for 2016.2  That methodology has not been finalized for 2016, however, and it may change for 2017 and beyond.

Federal payment cells

Each BHP enrollee falls within a “federal payment cell” that is defined by the following characteristics of its members:

  • County of residence;
  • Age range (0-20, 21-34, 35-44, 45-54, 45-54, or 55-64);
  • Income range (0-50, 51-100, 101-138, 139-150, 151-175, or 176-200 percent FPL);
  • Household size; and
  • Coverage status (single BHP coverage, two-adult BHP coverage, etc.).

Reference premiums

To determine both the PTC and CSR component of the federal payment for a BHP enrollee, the starting point is the reference premium. The reference premium is the average premium that would have been charged by the second-lowest-cost silver plan in 2015 to non-smokers in the BHP beneficiary’s county and age range if the state had not established a BHP program. Averages within the age range are calculated based on an assumed even age distribution.

In most counties, the same QHPs are offered to all residents. If a single county is split between QHPs so that different silver plans have the second-lowest premium in different portions of the county, the portion with the most residents determines the reference premium that is used to calculate BHP payments for all county residents. Premiums for non-tobacco-users apply, since such premiums determine PTC amounts.

Generally, reference premiums for 2015 will be based on 2015 premiums, once they become known. However, a state seeking predictable federal payments before 2015 premiums were known had the option of instead using 2014 marketplace premiums, updated using a Premium Trend Factor (PTF). Such a state was required to inform CMS by May 15, 2014, that it chose this option. The PTF seeks to capture the likely increase in marketplace premiums from 2014 to 2015, based on nationally applicable trends. For 2015, CMS set the PTF as increasing premiums by 8.15%. This reflected two factors: the average increase in private insurance costs from 2014 to 2015 forecast by the CMS Office of the Actuary; and CMS’ estimates of the average impact on marketplace premiums of changes in the operation of the ACA’s transitional reinsurance program.3 

Determining the premium tax credit component

Once the reference premium is established, calculating the average PTC for BHP enrollees within the federal payment cell begins by determining the percentage of household income devoted to premium payment for enrollees in the “reference” or “benchmark” plan (that is, the second-lowest-cost silver QHP). In 2015, those percentages will be 2.01% for those with incomes below 133% FPL, 3.02% at 133% FPL, 4.02% at 150% FPL, and 6.34% at 200% FPL, with percentages set on linear, sliding scales between the last three FPL “anchor points.” These percentages allow a calculation of the average (mean) payment amount, among households of a given size, for consumers within a particular federal payment cell enrolled in the benchmark plan, assuming an even distribution of households by FPL level. Subtracting that payment amount from the average reference premium for the payment cell yields an estimated average PTC.

That PTC must then be adjusted to reflect the average impact of income tax reconciliation, had BHP consumers claimed advance payment of tax credits (APTC) in the marketplace. To determine this Income Reconciliation Factor (IRF), CMS assumes that BHP eligibility will be continuous, based on household circumstances at the time of initial application, without adjustments to reflect mid-year income fluctuations. Modeling from the Department of the Treasury suggests that, across the entire caseload of BHP-eligible consumers, APTC amounts would be offset by a repayment to IRS that, on average, reduces such amounts by 5.08%. The PTC amount for each BHP payment cell is thus multiplied by an IRF of 94.92% for 2015. Finally, the resulting total is multiplied by 95% to determine the PTC component of the federal BHP payment.

Determining the cost-sharing reduction component

The value of the CSR component in the marketplace equals the total health care claims for essential health benefits (EHBs) paid by the increase in actuarial value resulting from the CSR. The first step in calculating this component is thus estimating the amount of total health care claims provided by the reference-premium plan.

Only some of the premium pays claims costs. To exclude administrative and other non-claims costs, the Factor for Removing Administrative Costs (FRAC) is set at 80%. Put differently, the federal payment methodology assumes that, on average, 80% of the reference premium is used to pay EHB claims. This is based on the approach taken by CMS in defining CSR advance payments for QHPs in 2015.

QHP enrollees will pay some EHB costs. With a silver-level plan, Actuarial Value (AV) is 70%, so consumers pay, on average, 30% of such claims costs. Accordingly, the total amount of EHB claims is the amount paid by the plan, divided by 70%. Put differently, it is the plan’s EHB claims amount (that is, the reference premium times 0.8) multiplied by 1.43, which is referred to as the AV factor.

Unlike PTCs, which reflect the premium charged to non-smokers in states that permit higher QHP premiums for tobacco users, CSRs include claim costs that result from tobacco use. Accordingly, the reference premium calculated as described above must be increased to reflect the average effect of tobacco use on BHP claims. Such a Tobacco Rating Adjustment Factor (TRAF) takes into account tobacco utilization levels by BHP enrollees, shown by state-specific data from the Centers for Disease Control and Prevention (CDC), which includes information about tobacco use rates by age.4  To estimate the average claims costs for tobacco use that are not included within the reference premiums charged to non-users, the TRAF also considers the weighted average difference, among benchmark plans, in premiums charged to tobacco users and non-users. For example, if in a particular state, benchmark plans charge 15 percent more, on average, for tobacco users than for non-users, and 10 percent of adults age 25-34 use tobacco, then the TRAF for BHP adults age 25-34 would increase EHB claims by .15 x .10 or .015.

If QHP enrollees with incomes at or below 200% FPL receive CSRs, they will pay less out-of-pocket for health care services. As a result, they will use more care, and their claims will increase. The Induced Utilization Factor (IUF) takes this effect into account. Based on CMS analysis, consumers who move from silver-level AV of 70% to either 87 or 94% AV—the two minimum AV levels BHP consumers would receive in the marketplace—increase average utilization by 12%. Accordingly, for BHP consumers, regardless of income, the IUF is 12% for 2015.

Taken together, these factors multiplied by the applicable reference premium determine the average claims costs that would have been incurred by BHP consumers, had they received CSRs in the marketplace. The value of the CSR in the marketplace would be the increased share of those claims paid by the federal government because of the CSR. For a consumer above 150% FPL, that share is 17% (that is, the difference between 87% AV provided by CSRs and the underlying 70% AV furnished by silver-level coverage). For a consumer below 150% FPL, it is 24% (the difference between 94% AV and 70% AV).

This penultimate factor—the Change in Actuarial Value—shows that income plays a much simpler role in determining the CSR component of federal BHP payments, compared to the PTC component. All that matters, for purposes of the CSR component, is whether the consumer’s income is above or below 150% FPL. Neither household size nor precise FPL level matters, once that basic threshold question is resolved.

The number that results from the above calculations shows the value of the CSR that BHP enrollees would have received in the marketplace. To determine the CSR component of the federal BHP payment, that number must be multiplied by 95%.

Report: Estimating Federal Bhp Funding Levels

Our suggested approach

As explained earlier, the methodology for calculating actual federal BHP payments relies on determining a reference premium for each county in the state and applying it to each county’s BHP enrollees. The approach we suggest to projecting federal BHP payments simplifies this process by calculating a statewide reference premium and applying it to estimates of the statewide BHP-eligible population.

As the first step in our proposed process, one averages the premium for the second-lowest-cost silver plans among the state’s counties, weighted in proportion to the number of silver-plan enrollees or subsidized QHP enrollees in each county. The averages reflect non-smoker premium quotes for single adult enrollees of a particular age, such as 21-year-olds. The state’s rating rules allow a derivation of premiums for other ages and for coverage of more than one person per household.5 

In step two, one uses the statewide benchmark premium to build statewide federal payment cells. Each cell shows what the federal government would pay for BHP enrollees of the applicable age range, FPL range, household size, and number of BHP-eligible consumers per household, assuming the statewide reference premium.

In step three, one calculates the average federal payment per BHP-eligible consumer, using the estimates in appendix Table A4 showing the number of BHP-eligible consumers who are within each statewide federal payment cell. To obtain the average, one: (1) multiplies the federal payment amount in each cell by the number of eligible consumers in that cell and (2) divides the total by the number of BHP-eligible consumers in the state. The results also allow a determination of average federal payments per BHP-eligible consumers within various sub-populations, such as those with incomes or ages in various ranges.

An illustrative example: Washington State

Here, we show how the above method is used to find that federal payments for BHP-eligible residents in Washington State will average approximately $4,366 for 2015.6 

Step One: Determine the weighted average benchmark premium

For the Washington illustration, we begin by calculating the weighted average “benchmark” premium—that is, the second-lowest-cost silver plan offered in Washington’s marketplace—for 21-year-old non-smokers. Table 1 shows 2014 premiums and total enrollment for the benchmark plan in each Washington county.

Table 1. Benchmark monthly premiums and Total QHP enrollment in Washington, by county: 2014
CountyMonthly Benchmark Premium for 21-year old non-smokerTotal QHP Enrollment as of April 2014
Adams$221.14451
Asotin$221.34421
Benton$220.503,039
Chelan$221.142,319
Clallam$226.872,072
Clark$244.618,564
Columbia$221.1492
Cowlitz$226.871,551
Douglas$221.14871
Ferry$203.63169
Franklin$220.501,333
Garfield$221.3463
Grant$221.141,443
Grays Harbor$226.671,440
Island$226.872,127
Jefferson$226.871,332
King$219.6252,640
Kitsap$226.874,940
Kittitas$221.14923
Klickitat$226.87756
Lewis$226.871,538
Lincoln$203.63225
Mason$226.871,121
Okanogan$221.341,087
Pacific$226.87693
Pend Oreille$203.63255
Pierce$226.8712,748
San Juan$226.871,248
Skagit$226.672,949
Skamania$226.87224
Snohomish$226.6715,518
Spokane$203.4510,027
Stevens$203.63856
Thurston$226.675,057
Wahkiakum$226.87113
Walla Walla$220.501,132
Whatcom$226.876,744
Whitman$221.14541
Yakima$220.504,068
Source: Dirksen 20147  and Washington Health Benefits Exchange, April 2014.8 

We average the county-specific premiums in proportion to each county’s QHP enrollment. As a result, we find a weighted average benchmark premium for 21-year-old non-smokers of $222.86 a month in 2014.9  According to the Washington State Office of the Insurance Commissioner, weighted average QHP rates are expected to rise approximately 8.25% from 2014 to 2015.10  To estimate federal BHP payments for 2015, we therefore use a weighted-average benchmark premium of $241.25 for 21-year-old non-smokers, which is 8.25% above the 2014 level.

Step Two: Construct federal payment cells

After calculating the weighted average benchmark premium, or “reference premium,” for 21-year-old non-smokers in 2015, we construct federal payment cells by developing two components for each relevant combination of age range, FPL, household size, and number of BHP-eligible consumers per household: the PTC component and the CSR component of the federal BHP payment.

Premium Tax Credit Component
Premiums by age

In moving from the reference premium for 21-year-old non-smokers to the PTC component of federal BHP payments, the first step requires estimating the reference premiums that would be charged to BHP-eligible consumers of other ages. Like most states, Washington varies premiums by age using the so-called “HHS Default Standard Age Curve.”11  We apply the ratios of that curve to the $241.25 premium for 21-year-old non-smokers to derive the reference premiums for adults of other ages, as shown in Table 2.

Table 2. Weighted Average Monthly Reference Premiums for Washington Non-Smokers,by Age: 2015
AgePremium RatioWeighted Premium AgePremium RatioWeighted Premium AgePremium RatioWeighted Premium
0-200.635$153.19351.222$294.81501.786$430.87
211.000$241.25361.230$296.74511.865$449.93
221.000$241.25371.238$298.67521.952$470.92
231.000$241.25381.246$300.60532.040$492.15
241.000$241.25391.262$304.46542.135$515.07
251.004$242.22401.278$308.32552.230$537.99
261.024$247.04411.302$314.11562.333$562.84
271.048$252.83421.325$319.66572.437$587.93
281.087$262.24431.357$327.38582.548$614.71
291.119$269.96441.397$337.03592.603$627.97
301.135$273.82451.444$348.37602.714$654.75
311.159$279.61461.500$361.88612.810$677.91
321.183$285.40471.563$377.07622.873$693.11
331.198$289.02481.635$394.44632.952$712.17
341.214$292.88491.706$411.5764+3.000$723.75
Source: CCIIO 2014. Note: The Premium Ratio is taken from the HHS Default Standard Age Curve.

As noted above, the federal payment methodology assumes an even distribution by age within each age range used to define federal payment cells. We apply that averaging methodology in using Table 2 to calculate reference premiums for each age range, with results shown in Table 3.

Table 3. Reference Premiums for Washington Non-Smokers, by Age Range: 2015
Age rangePremium
19-20$153.19
21-34$261.43
31-44$310.18
45-54$425.23
55-64$639.31
Consumer payments for benchmark coverage

Estimating the PTC requires subtracting from the reference premiums shown in Table 3 the amounts that BHP-eligible consumers would pay for marketplace benchmark coverage, which vary based on FPL and household size. Table 4 shows those income-based amounts for households up to 5 people in size.12 

Table 4. Monthly Payments Required for Benchmark Coverage, by FPL and Household Size: 2015
FPLRequired % of incomeHousehold SizeFPLRequired % of incomeHousehold Size
1234512345
1322.01%$25.80$34.78$43.76$52.73$61.711674.81%$78.10$105.27$132.44$159.61$186.78
1333.02%$39.06$52.65$66.24$79.83$93.421684.86%$79.32$106.92$134.52$162.12$189.71
1343.08%$40.12$54.08$68.04$82.00$95.961694.90%$80.56$108.59$136.61$164.64$192.67
1353.14%$41.19$55.52$69.86$84.19$98.521704.95%$81.80$110.26$138.72$167.18$195.64
1363.20%$42.28$56.98$71.69$86.40$101.111714.99%$83.06$111.95$140.85$169.74$198.64
1373.26%$43.37$58.46$73.55$88.64$103.731725.04%$84.32$113.65$142.99$172.32$201.65
1383.31%$44.48$59.95$75.42$90.90$106.371735.09%$85.59$115.36$145.14$174.92$204.69
1393.37%$45.59$61.46$77.32$93.18$109.041745.13%$86.87$117.09$147.31$177.53$207.75
1403.43%$46.72$62.98$79.23$95.49$111.741755.18%$88.16$118.83$149.50$180.17$210.84
1413.49%$47.86$64.52$81.17$97.82$114.471765.23%$89.46$120.58$151.70$182.82$213.94
1423.55%$49.02$66.07$83.12$100.17$117.231775.27%$90.76$122.34$153.91$185.49$217.07
1433.61%$50.18$67.64$85.09$102.55$120.011785.32%$92.08$124.11$156.15$188.18$220.21
1443.67%$51.35$69.22$87.09$104.95$122.821795.37%$93.40$125.90$158.39$190.89$223.38
1453.73%$52.54$70.82$89.10$107.38$125.651805.41%$94.74$127.70$160.66$193.61$226.57
1463.78%$53.74$72.43$91.13$109.82$128.521815.46%$96.08$129.51$162.93$196.36$229.79
1473.84%$54.95$74.06$93.18$112.29$131.411825.50%$97.43$131.33$165.23$199.12$233.02
1483.90%$56.17$75.71$95.25$114.79$134.331835.55%$98.79$133.16$167.53$201.90$236.27
1493.96%$57.40$77.37$97.34$117.31$137.271845.60%$100.16$135.01$169.86$204.70$239.55
1504.02%$58.64$79.04$99.44$119.85$140.251855.64%$101.54$136.87$172.20$207.52$242.85
1514.07%$59.71$80.49$101.26$122.04$142.811865.69%$102.93$138.74$174.55$210.36$246.17
1524.11%$60.80$81.95$103.10$124.25$145.401875.74%$104.33$140.62$176.92$213.22$249.51
1534.16%$61.89$83.42$104.95$126.48$148.011885.78%$105.73$142.52$179.30$216.09$252.87
1544.21%$62.99$84.90$106.81$128.72$150.641895.83%$107.15$144.43$181.70$218.98$256.26
1554.25%$64.09$86.39$108.69$130.99$153.291905.88%$108.57$146.35$184.12$221.89$259.67
1564.30%$65.21$87.90$110.58$133.27$155.961915.92%$110.01$148.28$186.55$224.82$263.09
1574.34%$66.34$89.42$112.50$135.57$158.651925.97%$111.45$150.22$189.00$227.77$266.54
1584.39%$67.47$90.95$114.42$137.89$161.371936.02%$112.90$152.18$191.46$230.74$270.01
1594.44%$68.62$92.49$116.36$140.23$164.111946.06%$114.36$154.15$193.93$233.72$273.51
1604.48%$69.77$94.04$118.32$142.59$166.861956.11%$115.83$156.13$196.43$236.72$277.02
1614.53%$70.93$95.61$120.29$144.97$169.641966.15%$117.31$158.12$198.93$239.74$280.56
1624.58%$72.11$97.19$122.28$147.36$172.451976.20%$118.80$160.13$201.46$242.78$284.11
1634.62%$73.29$98.78$124.28$149.77$175.271986.25%$120.29$162.14$203.99$245.84$287.69
1644.67%$74.48$100.39$126.30$152.21$178.121996.29%$121.80$164.17$206.55$248.92$291.29
1654.72%$75.67$102.00$128.33$154.66$180.982006.34%$123.31$166.21$209.11$252.02$294.92
1664.76%$76.88$103.63$130.38$157.12$183.87
Note: Calculations are based on FPL levels for 2014 for all states except Alaska and Hawaii, which will be in effect at the start of 2015 open enrollment.

As explained above, consumer payments, within each FPL range for each household size, are calculated based on averages, assuming that each FPL percentage is equally represented in the range. Table 5 shows those averages.13  Note that the same amounts would be paid for benchmark coverage in all states but Hawaii and Alaska, so Tables 4 and 5 can be used by analysts in any of the other 48 states and the District of Columbia.14 

Table 5. Average monthly payments required for benchmark coverage, by FPL range and household size: 2015
FPL rangeHousehold size
12345
0-138% FPL$14.16$19.08$24.00$28.93$33.85
139-150% FPL$52.01$70.11$88.20$106.30$124.40
151-175% FPL$73.52$99.10$124.68$150.25$175.83
176-200% FPL$105.97$142.84$179.70$216.57$253.44
Note: Calculations are based on FPL levels for 2014 for all states except Alaska and Hawaii, which will be in effect at the start of 2015 open enrollment. Calculations for BHP consumers under 138% FPL assume even distribution by FPL percentage. If actual distribution between those within federally specified ranges (0-50, 51-100, and 101-138% FPL) is significantly different from the assumed distribution, average payments required for consumers under 138% FPL could differ from those shown.
PTC estimates, without considering tax reconciliation effects

The above analyses allow a calculation of PTC amounts, without considering tax reconciliation effects. The simplest case involves a household with one BHP-eligible member. Such a household’s PTC is determined by subtracting the required payment for benchmark coverage, given the applicable FPL level and household size, as shown in Table 5, from the reference premium for the applicable age range, as shown in Table 3. Table 6 displays the results, by FPL level and household size.

Table 6. PTC amounts for households with one BHP-eligible member: 2015
Household sizeFPLPayment for benchmark planAge range and reference premium
19-2021-3435-4445-5455-64
$153.19$261.43$310.18$425.23$639.31
10-138% FPL$14.16$139.03$247.27$296.02$411.07$625.16
139-150% FPL$52.01$101.18$209.42$258.16$373.21$587.30
151-175% FPL$73.52$79.67$187.91$236.66$351.71$565.79
176-200% FPL$105.97$47.22$155.46$204.21$319.26$533.34
20-138% FPL$19.08$134.11$242.35$291.10$406.15$620.23
139-150% FPL$70.11$83.08$191.32$240.07$355.12$569.20
151-175% FPL$99.10$54.09$162.33$211.08$326.13$540.21
176-200% FPL$142.84$10.35$118.59$167.34$282.39$496.48
30-138% FPL$24.00$129.19$237.43$286.17$401.22$615.31
139-150% FPL$88.20$64.99$173.23$221.97$337.02$551.11
151-175% FPL$124.68$28.51$136.75$185.50$300.55$514.64
176-200% FPL$179.70$0.00$81.73$130.48$245.52$459.61
40-138% FPL$28.93$124.26$232.50$281.25$396.30$610.38
139-150% FPL$106.30$46.89$155.13$203.88$318.93$533.01
151-175% FPL$150.25$2.94$111.18$159.92$274.97$489.06
176-200% FPL$216.57$0.00$44.86$93.61$208.66$422.74
50-138% FPL$33.85$119.34$227.58$276.32$391.37$605.46
139-150% FPL$124.40$28.79$137.03$185.78$300.83$514.92
151-175% FPL$175.83$0.00$85.60$134.35$249.40$463.48
176-200% FPL$253.44$0.00$7.99$56.74$171.79$385.88
Note: Calculations show estimated PTC amounts before considering reconciliation effects.

For households with more than one BHP-eligible member, the calculation is more complex. This issue requires careful attention; it is often mishandled in estimating federal BHP payments. In Washington and almost all other states, family premiums are calculated by adding up the premiums charged to each enrollee within the family.15  The family’s required payment for benchmark coverage, however, is unaffected by the number of family members who receive such coverage. For purposes of estimating federal BHP payments per BHP-eligible consumer, the payment amount required from the entire family is divided among the BHP-eligible members of the family.

To illustrate, in a 4-person household between 139-150% FPL, the required household payment for benchmark coverage is $106.30. If that household has one BHP-eligible member in the 45-54 age range, the reference premium is $425.23. The PTC amount is the difference between the two numbers, or $318.93 (Table 6). If that household has two BHP-eligible members in the 45-54 age range, each is charged the $425.23 reference premium, but they “split” the household’s required payment of $106.30. Each therefore receives a PTC of $372.08, calculated by subtracting $53.15 from $425.23.16  Tables 7 and 8 show PTC amounts for individual consumers within households that have two and three BHP-eligible members. The calculations divide household income-based payments by 2 and 3, respectively, to determine individual (rather than household) PTC amounts.

Table 7. PTC amounts per eligible consumer in households with 2 BHP-eligible members: 2015
Household sizeFPLPayment for benchmark planAge range and reference premium
19-2021-3435-4445-5455-64
$153.19$261.43$310.18$425.23$639.31
20-138% FPL$9.54$143.65$251.89$300.64$415.69$629.77
139-150% FPL$35.05$118.14$226.38$275.12$390.17$604.26
151-175% FPL$49.55$103.64$211.88$260.63$375.68$589.76
176-200% FPL$71.42$81.77$190.01$238.76$353.81$567.90
30-138% FPL$12.00$141.19$249.43$298.18$413.22$627.31
139-150% FPL$44.10$109.09$217.33$266.08$381.12$595.21
151-175% FPL$62.34$90.85$199.09$247.84$362.89$576.97
176-200% FPL$89.85$63.34$171.58$220.33$335.38$549.46
40-138% FPL$14.46$138.73$246.97$295.71$410.76$624.85
139-150% FPL$53.15$100.04$208.28$257.03$372.08$586.16
151-175% FPL$75.13$78.06$186.30$235.05$350.10$564.19
176-200% FPL$108.28$44.91$153.15$201.89$316.94$531.03
50-138% FPL$16.93$136.26$244.50$293.25$408.30$622.39
139-150% FPL$62.20$90.99$199.23$247.98$363.03$577.12
151-175% FPL$87.92$65.27$173.51$222.26$337.31$551.40
176-200% FPL$126.72$26.47$134.71$183.46$298.51$512.60
Note: Display shows estimated PTC amounts before considering tax reconciliation effects.
Table 8. PTC amounts per eligible consumer in households with 3 BHP-eligible members: 2015
Household sizeFPLPayment for benchmark planAge range and reference premium
19-2021-3435-4445-5455-64
$153.19$261.43$310.18$425.23$639.31
30-138% FPL$8.00$145.19$253.43$302.18$417.23$631.31
139-150% FPL$29.40$123.79$232.03$280.78$395.83$609.91
151-175% FPL$41.56$111.63$219.87$268.62$383.67$597.75
176-200% FPL$59.90$93.29$201.53$250.28$365.33$579.41
40-138% FPL$9.64$143.55$251.79$300.53$415.58$629.67
139-150% FPL$35.43$117.76$226.00$274.74$389.79$603.88
151-175% FPL$50.08$103.11$211.35$260.09$375.14$589.23
176-200% FPL$72.19$81.00$189.24$237.99$353.04$567.12
50-138% FPL$11.28$141.91$250.15$298.89$413.94$628.03
139-150% FPL$41.47$111.72$219.96$268.71$383.76$597.85
151-175% FPL$58.61$94.58$202.82$251.57$366.62$580.70
176-200% FPL$84.48$68.71$176.95$225.70$340.75$554.83
Note: Display shows estimated PTC amounts before considering tax reconciliation effects.
Calculating the PTC component of federal BHP payments

To calculate the PTC component of federal BHP payments, the above PTC amounts are multiplied by .9492, reflecting the impact of tax reconciliation, according to the federal payment methodology for 2015; and .95, which converts the marketplace PTC into the federal BHP payment. The amounts in Tables 6 through 8 are multiplied by .90174, the product of these two factors. The results are shown in Table 9.

Cost-Sharing Reduction Component
CSR component before adjusting for tobacco use

Estimating the CSR’s value for an individual consumer begins by calculating the amount of the consumer’s expected EHB claims. As noted earlier, the total amount of EHB claims, without including those related to tobacco use, is determined by making the following adjustments to the reference premium for non-smokers:

  • Multiplying the reference premium by 0.8, to eliminate administrative costs;
  • Dividing it by 0.7, to add consumers’ share of EHB claims; and
  • Multiplying it by 1.12, to account for induced utilization resulting from lower out-of-pocket cost-sharing.

Combining these three factors means that the reference premium is multiplied by 1.28 to estimate the amount of EHB claims (other than those resulting from tobacco use). The value of the CSR, for consumers at or below 150% FPL, is the increase in AV resulting from the CSR, which equals 24% of EHB claims costs; for those between 151 and 200% of FPL, that increase equals 17%. The resulting value of the CSR in the marketplace is then multiplied by 95%, to calculate the CSR component of the federal BHP payment. Table 10 shows these calculations.

Table 10. Calculating the CSR component of the federal BHP payment, without the tobacco adjustment: 2015
Age rangeReference premiumEHB claimsCSR value in marketplaceCSR component of BHP payment
0-150% FPL151-200% FPL0-150% FPL151-200% FPL
19-20$153.19$196.08$47.06$33.33$44.71$31.67
21-34$261.43$334.63$80.31$56.89$76.30$54.04
31-44$310.18$397.03$95.29$67.50$90.52$64.12
45-54$425.23$544.29$130.63$92.53$124.10$87.90
55-64$639.31$818.32$196.40$139.11$186.58$132.16
The tobacco adjustment

The tobacco adjustment is calculated based on two factors: the extent to which EHB claims for tobacco use are not included in the premium charged to non-smokers, which is estimated based on the weighted-average ratio of benchmark premiums for tobacco users to benchmark premiums charged to non-tobacco users; and the estimated prevalence of tobacco use among BHP enrollees.

For tobacco users age 21 and older, all but one of Washington’s benchmark QHPs increase premiums by 7.5% above the rates charged to non-users.17  The other QHP increases such premiums by 20%.18  The latter plan is the benchmark QHP in counties with 41% of the state’s QHP enrollees.19  Weighting these tobacco-based premium increases by QHP enrollment, we find that, for the weighted-average tobacco user age 21-64 in Washington State, premiums rise by 12.6% because of tobacco use. Under the federal payment methodology, this is the measure of EHB tobacco-related claims that are not included in the reference premium charged to non-users.

According to data from the Centers for Disease Control and Prevention (CDC), 17.5% of all Washington adults smoked and 3.6 percent used smokeless tobacco in 2012, totaling 20.1 percent tobacco users. These percentages varied greatly by age, as shown in Table 11.

Table 11. Percentage of Washington residents who use tobacco, by age: 2012
Age rangePercent of residents who use tobacco
CigarettesSmokeless TobaccoTotal
18-2415.8%4.1%19.9%
25-4422.9%5.7%20.0%
45-6417.6%2.4%8.7%
65+7.5%1.2%28.6%
Source: Office on Smoking and Health, National Center for Chronic Disease Prevention and Health Promotion, 2013.20 

By multiplying the 12.6% weighted average increase in health care costs resulting from tobacco use by the estimated rate of tobacco use among Washington residents within various age ranges, as shown in Table 11,, we calculate the percentages by which CSR payments should increase to reflect tobacco-related EHB claims that are not included in premiums charged to non-smokers. The percentage increases that apply within the age ranges used by the CDC are set out in Table 12.

Table 12. Increases in CSR payments required to cover tobacco-related EHB claims, within CDC-reported age ranges
Age rangePercent increase in CSR payments
18-242.5%
25-443.6%
45-642.5%

Table 13 shows how those increases would translate into the age ranges used for BHP payment.21 

Table 13. Increases in CSR payments required to cover tobacco-related EHB claims, within age ranges used for federal BHP payments
Age rangePercent increase in CSR payments
19-202.5%
21-343.3%
31-443.6%
45-542.5%
55-642.5%
Source: CMS 2014.22 

While that calculation shows the generally applicable methodology, in Washington state no tobacco adjustment applies to BHP enrollees under age 21, because QHPs do not raise premiums for tobacco users under age 21.

Calculating the CSR component of federal BHP payments with tobacco adjustment

As the final step in calculating the CSR component, we increase the CSR component of federal BHP payment amounts, shown in Table 10, by the percentages shown in Table 13 (except for adults under age 21, whose CSRs are not adjusted based on tobacco use). The result is shown in Table 14.

Table 14. CSR component of federal BHP payments including tobacco adjustment: estimated Washington state averages, 2015
Age rangeCSR component of federal BHP payment
0-150% FPL151-200% FPL
19-20$44.71$31.67
21-34$78.81$55.82
35-44$93.78$66.43
45-54$127.20$90.10
55-64$191.24$135.46
Federal payment cells

Table 15 combines the PTC components shown in Table 9 with the CSR components shown in Table 14. The combination represents the approximate average federal payment for all BHP-eligible Washington residents who share the displayed combination of household size, FPL, age, and number of BHP-eligible consumers per household. Unlike the dollar amounts shown above, those in the following table are stated in annual terms.

Step Three: Calculate the average federal payment for BHP-eligible residents

Multiplying the number of BHP-eligible consumers in each category, shown in appendix table A4 for Washington State, by the federal payment per capita for each applicable statewide federal payment cell, as shown in Table 15, yields the federal payment totals shown in Table 16. For all BHP-eligible consumers statewide, these payments sum to $190.0 million. When we divide that total by the estimated 43,520 BHP-eligible state residents shown in the Appendix tables for Washington State, we find that federal payments for BHP-eligible state residents average approximately $4,366 for 2015.

Obviously, not all BHP-eligible consumers will enroll. But to the extent that eligible consumers of all types—income, age, household size, etc.—are equally likely to sign up, the average federal payment per enrollee will approximate the amount for all eligible consumers.

These estimates also allow a calculation of average federal payments for various subsets of BHP-eligible consumers, such as all consumers within particular age and FPL ranges. One can simply divide total federal payments for each subset by the number of included consumers. For example, Table 17 shows that:

  • 2015 BHP payments in Washington State rise with age. They average $1,483 for BHP-eligible consumers age 19-20; 2,889 for those age 21-34; $3,421 for those age 35-44; $4,993 for those age 45-54; and $7,841 for those age 55-64. This pattern results from higher marketplace premiums (hence higher QHP subsidies, all else equal) for older adults.
  • Within each individual age band, federal BHP payments are highest for the poorest consumers. For example, among adults age 19-20, federal payments average $2,015 for BHP-eligibles consumers at 0-138% FPL; $1,589 at 139-150% FPL; $1,216 at 151-175% FPL; and $860 at 176-200% FPL. This reflects higher marketplace subsidies (hence higher federal payments) for lower-income consumers.
  • However, when one combines BHP-eligible consumers of all ages, the lowest average federal payments are for those with incomes below 138% FPL, because consumers in this group are poor immigrants disproportionately likely to be young adults. Above 138% FPL, federal payments are highest for those with the lowest income, even if one includes eligible consumers of all ages. Payments average $5,042 at 139-150% FPL, declining to $4,435 at 151-175% FPL and $4,132 at 176 to 200% FPL.

These sub-set averages can help state-level policymakers and stakeholders compare federal payments to health care costs that vary based on age (and income, if benefits and out-of-pocket cost-sharing differ based on BHP enrollees’ income). Such averages can also help policymakers craft BHP rules that promote financial feasibility by encouraging the enrollment of eligible consumers with the most favorable fiscal relationship between federal funding amounts and average health care costs.

Table 17. Average federal payments per BHP-eligible consumer, for various combinations of age and FPL: statewide estimates, 2015
AgeIncome Range
0-138% FPL139-150% FPL151-175% FPL176-200% FPLTotal (0-200% FPL)
19-20$2,015$1,589$1,216$860$1,483
21-34$3,598$3,177$2,658$2,307$2,889
35-44$4,292$3,844$3,260$2,898$3,421
45-54$5,956$5,549$4,869$4,522$4,993
55-64$9,037$8,629$7,728$7,374$7,841
Total (Age 19-64)$4,032$5,042$4,435$4,132$4,366

Report: Conclusion: Placing Federal Payment Estimates In Context

The above process should provide a reasonable approximation of average federal payments per BHP-eligible consumer; however, actual federal payments could be different. For example, if the lowest-income BHP-eligible residents tend to live in a particularly low-cost or a particularly high-cost area of the state, then actual average federal payments may be lower or higher than the amount derived using the approach suggested here. That said, this method provides a good starting point for estimating the amount that a state would receive from the federal government, if all BHP-eligible consumers were equally likely to enroll. This should allow a comparison of federal payments to the cost of providing BHP coverage to the average eligible consumer.

The appendix tables should facilitate estimating BHP coverage costs by providing information about the characteristics of BHP-eligible consumers. However, BHP costs will depend on state decisions about covered benefits, out-of-pocket cost-sharing, premiums, and provider reimbursement. To estimate state costs, policymakers could begin with either average Medicaid costs for non-pregnant, non-disabled adults at relatively high income levels or average silver-level benchmark QHP costs for adults below 200 percent FPL. In either case, those initial cost figures would need to be adjusted to reflect differences between the coverage on which they are based (Medicaid or subsidized QHP coverage) and BHP.

It will also be important to estimate which consumers are likely to enroll. Only those who sign up will generate costs and yield federal payments. As suggested earlier, states may be able to influence the balance of BHP costs and revenues. For example, if the state designs BHP coverage so that the lowest-income BHP consumers are more likely to enroll because of minimal premiums and out-of-pocket costs, that may increase the average amount of federal BHP payments without a corresponding increase in average state BHP costs.

A BHP fiscal analysis also needs to consider potential state savings from BHP.23  More fundamentally, federal BHP funding can vary based on year-to-year changes in QHP benchmark premiums. Over time, marketplace premiums should eventually stabilize. Moreover, CMS’s publication of federal payment rates for a given year in February of the prior year gives states advance notice of changes, allowing time to plan. Predictability is further enhanced if a state decides to base a year’s BHP payments, not on that year’s QHP benchmark premiums, but on the previous year’s premiums, updated based on CMS national projections. Notwithstanding these factors that can enhance a state’s ability to predict future federal payments and thus to plan ahead, during BHP’s early years states could consider attempting to retain a small surplus in BHP trust funds to guard against unforeseen drops in future QHP benchmark premiums or unexpected changes to federal BHP payment methodologies.


Appendix: The Characteristics Of Bhp Eligibles By State

The Characteristics of BHP Eligibles by State

The federal BHP payment formula depends on applicable benchmark premiums and on four characteristics of BHP enrollees: age (within ranges specified by the BHP federal payment methodology), income (within FPL ranges specified by the BHP federal payment methodology), number of persons in the tax unit (the household unit, as defined for purposes of determining eligibility both for BHP and QHP subsidies), and number of BHP-eligible persons in the tax unit who receive coverage through BHP. In order to compute payments, the joint distribution of these four characteristics—in other words, the number of enrollees at each benchmark premium level who possess every possible combination of the above four characteristics—must be known. For each state, we estimated the number of the joint distribution of these characteristics among people who would be eligible for BHP in 2016.24 

We did not model how many of those eligible for BHP would actually enroll in the program. This depends to a large extent on the BHP premiums and beneficiary cost sharing, and states have a lot of flexibility in setting these elements of BHP policy.

Methods

To produce these estimates, we began with the Urban Institute’s Health Insurance Policy Simulation Model-American Community Survey (HIPSM-ACS). To obtain a large, representative sample population for each state, we pooled together the observations on the 2009, 2010, and 2011 American Community Surveys (ACS). Among national surveys conducted by the U.S. Census Bureau, the American Community Survey (ACS) has the largest state-specific samples and so is likely to provide the most reliable estimates. However, a limitation of both this data set and the other data set frequently used (the Current Population Survey-Annual Social and Economic Supplement) is that they do not include information about offers of employer-sponsored insurance (ESI), which almost always preclude subsidy eligibility.25  States that fail to take such offers into account will overestimate the prevalence of relatively high-income BHP-eligible consumers, since ESI offers grow increasingly common as income rises.26  As a result, such states will underestimate federal BHP funding per BHP enrollee, since QHP subsidies, hence BHP funding levels, decline as income rises. The estimates presented here do not share this problem, since HIPSM incorporates, via statistical matches with other data sources, information about unaccepted ESI offers.

Immigration Status. We impute documentation status for non-citizens in each year of survey data separately based on a year-specific model used in the CPS. Documentation status is imputed to immigrants in two stages, using individual and family characteristics, based on an imputation methodology that was originally developed by Passel, the most-used source of estimates of immigrants not lawfully present.27  Undocumented immigrants and lawfully present non-citizens, including immigrant adults who have been U.S. residents for less than five years, are generally ineligible for Medicaid.

Tax units and filing. To model tax units and filing behavior, we use 2011 tax rules (including thresholds for tax filing requirements), Earned Income Tax Credit (EITC) eligibility guidelines, and poverty guidelines as defined by the U.S. Department of Health and Human Services. Baseline coverage and post-ACA eligibility are based on estimates from HIPSM-ACS.

Tax units and filing status are determined based on the IRS guidelines set forth by the 2011 1040 Instructions and the 2011 EITC eligibility guidelines. The primary tax filing unit for each family is defined as the head of the family, the spouse, and any qualifying children or qualifying relatives (as defined by the IRS). In multi-generational households, nuclear subfamilies are tested for their filing status. If they are not found to file as a unit themselves, they are tested to qualify as dependents of the head of the household.

Tax filing status is determined based on characteristics of the head of the tax unit and pooled income within the tax unit. Married couples are assumed to be filing jointly to qualify for tax credits. As support within the household is not captured by the ACS, any unmarried tax unit head with dependents is considered filing as a head of household. Any other unmarried person without dependents is tested as single. To determine requirement to file, individual Adjusted Gross Income (AGI) is pooled for each person within the tax unit and compared to the 2011 minimum mandatory filing threshold.

Due to limitations of the income that is captured by the ACS, some taxable income categories could not be included in total income. Capital gains are not reported as investment income in the ACS, so it was not counted. Paid alimony was also excluded; however, internal analysis based on CPS alimony data suggests this exclusion would not affect our results. The ACS does not collect data on unemployment compensation, but because this was likely an important form of income for people at the margin of the Medicaid and subsidy eligibility thresholds, it was imputed based on reported unemployment compensation from the 2008 CPS.

None of the adjustments needed to calculate AGI are reported by the ACS, so we therefore take total income as a proxy for AGI. Total income is calculated as the sum of wages, business income, farm income, rents, most forms of positive investment income, retirement income, unemployment compensation, and the taxable portion of social security income.

EITC eligibility is calculated in a slightly different way. AGI is pooled only among the head of the tax unit, the spouse (if filing as a married couple), and qualifying children. Qualifying dependents are not tested to file for EITC individually because they are either childless dependents (ineligible for EITC) or are found not to file in subfamily analysis. However, because they are claimed on the tax unit head’s return, they take on the EITC eligibility status of their tax unit.

Once it was determined which tax units were required to file and which were eligible for EITC, units were assigned filing decisions. A 2005 Treasury Report estimated that about 7.4 million taxpayers who were required to file did not in Tax Year 2003.28  That year, approximately 131 million individual tax returns were filed,29  meaning the filing rate among those required to file was about 95%. A study by the IRS of Tax Year 2005 filings estimated the following EITC participation rates, by number of qualifying children: 55.6% among those without qualifying children, 73.6% among those with one qualifying child, and 85.9% among those with two or more qualifying children.30  Based on these rates, tax units were randomly assigned their decision to file or not file.

Eligibility for Medicaid/CHIP, QHP subsidies, and BHP. Medicaid and subsidy eligibility are determined using MAGI, which adds nontaxable social security income to AGI. Unit-level MAGI is pooled among the unit head, the spouse (if married), and any qualifying children with an individual AGI above the single tax filing threshold. The income of other qualifying children and qualifying relatives is not included. This is then used to calculate a ratio of MAGI to the applicable federal poverty level (FPL) of the unit. Special prorating of units that include undocumented parent(s) or childless spouses is used to scale the total AGI (including that of the undocumented family members) by a ratio of the FPLs including and excluding the undocumented family members.

Medicaid eligibility for some groups, particularly the blind and disabled, does not change under the ACA. We model their eligibility using pre-ACA rules. To determine Medicaid and CHIP eligibility for other groups, tax unit-level MAGI-as-a-percentage-of-FPL is assigned to the tax unit head, the spouse (if married), and qualifying children with individual AGI above the single tax filing threshold. Excluded qualifying children and qualifying relatives are automatically eligible for Medicaid under CMS regulations. Under the ACA, the children of non-filing qualifying dependents also automatically qualify for Medicaid. The remaining parents, childless adults, and children are then tested for Medicaid eligibility based on the corresponding eligibility threshold in their state of residence. Children who are found ineligible for Medicaid are tested for CHIP eligibility.

QHP subsidy eligibility is determined slightly differently. To be eligible for subsidies, one must have a MAGI-as-a-percentage-of-FPL between 100 and 400%. Eligibility for any public coverage precludes eligibility for subsidies, so subsidy-eligible consumers cannot be eligible for Medicaid or CHIP under the ACA, as determined above, nor can they currently be eligible for Medicare. Finally, no unit member can have an offer of single coverage that costs less than 9.5% of family MAGI. For this determination, we use the HIPSM-ACS imputation of employer offers and the affordability of those offers.

Those eligible for BHP are by definition those eligible for QHP subsidies who have incomes below 200% FPL.

Single Distributions of Each Characteristic. The resulting data allowed us to produce reliable estimates of the single distributions of BHP eligibles by state of age group, FPL income group, number of people in the tax unit, and number of BHP eligibles within the tax unit. These are Tables A1, A2, and A3.

Joint Distributions for Each State. As noted earlier, estimating federal BHP payments requires the joint distribution of all four characteristics by state. That is, one must know how many BHP-eligible residents of a state share a particular combination of age, FPL level, household size, and number of BHP-eligible household members. This would mean separating the BHP-eligible population for each state into 240 different groups.31  To get reliable estimates for so many small groups of people would require a sample size for each state far larger than what our data provide. We overcame this difficulty using a standard small area estimation technique that relies on our data having a large enough sample size to estimate this four-trait joint distribution among BHP-eligibles nationally. For each state, we reweighted the national joint distribution to match the individual state’s single distribution of age group, FPL income group, household size, and the number of BHP-eligible individuals per household.32  Thus, we used estimates in which we had confidence—state-level single distributions of characteristics and the national joint distribution—to estimate the state-level joint distribution, which could not itself be tabulated directly from the data. The single distributions for each state are shown in tables A1-A3 and the final joint distribution estimates are shown in Table A4. One additional single distribution, involving household size, is not included here, but is available upon request from the authors.

Results

The following tables present the data on the characteristics of the BHP-eligible population by state. Tables A1-A3 provide summary-level statistics on age, income range, and the number of BHP-eligible people in the household unit for all 50 states and the District of Columbia. Table A4 provides detailed estimates of the joint distribution of BHP-eligible consumers by the four characteristics listed above. These detailed estimated are not provided for several states (Alaska, Delaware, the District of Columbia, North Dakota, South Dakota, and Wyoming) due to small sample sizes in those states. Detailed estimates are also not provided for New York because more comprehensive Urban Institute estimates have already been incorporated into state budget projections. Because of sample size considerations, we did not distinguish between FPL income ranges below 138% FPL. The number of BHP-eligible persons in the household unit represents the maximum number of people in the household who can enroll in BHP. Because very few BHP-eligible people are in households with more than five members or in households with more than three BHP-eligible members, our largest listed categories included households with five or more members and with three or more BHP-eligible members. In Table A4, we present data for households with one to four members. You can access the complete data in a downloadable Excel file of Appendix Table A4 (.xls).

Table A1: BHP Eligibles by Age
State19-2021-3435-4445-5455-64Total
N%N%N%N%N%N
Alabama4,0425%30,79435%16,40519%13,34315%22,58726%87,172
Alaska7304%8,08047%2,04012%2,76516%3,74422%17,358
Arizona4,6144%41,73836%20,83418%19,59817%29,12525%115,909
Arkansas2,6065%19,44135%10,39419%9,47017%13,81025%55,720
California46,6156%335,18040%154,24619%149,33418%147,33018%832,704
Colorado4,9005%37,94939%16,60217%17,88218%20,13621%97,469
Connecticut3,4448%17,81441%5,35912%6,12814%10,77525%43,520
Delaware7366%4,90939%2,17817%1,80014%2,90123%12,523
DC1,25315%3,06538%7279%84310%2,21627%8,103
Florida23,1375%176,93835%98,00520%93,65619%107,11921%498,855
Georgia10,4655%80,94138%41,12820%36,64817%41,60720%210,789
Hawaii8913%8,72034%4,53918%5,36521%6,08524%25,600
Idaho1,5934%15,62841%6,61218%5,53715%8,33122%37,701
Illinois11,9136%81,30938%36,54317%38,33218%44,41821%212,515
Indiana7,5546%50,82238%22,72617%21,85816%29,94523%132,905
Iowa2,8756%18,30141%7,20116%7,37017%8,51619%44,263
Kansas3,1006%19,36039%8,41717%9,05618%10,27120%50,203
Kentucky2,9824%29,47236%13,87817%13,43316%22,06927%81,834
Louisiana4,5225%36,21939%16,40218%14,60616%20,96923%92,717
Maine9454%7,71830%3,49114%5,07820%8,18932%25,421
Maryland4,4555%32,27837%16,67419%16,27019%17,54120%87,218
Massachusetts5,9418%32,60043%11,93916%11,57715%13,41318%75,470
Michigan8,3964%62,46933%29,35716%34,45018%52,52728%187,199
Minnesota3,9846%25,77637%6,62310%10,72315%22,36032%69,466
Mississippi2,1894%18,97635%10,36819%9,03817%13,97126%54,541
Missouri5,3434%45,59938%22,00018%19,55516%26,79222%119,289
Montana1,2484%11,45539%4,92417%5,10218%6,34722%29,075
Nebraska1,2324%12,31140%5,55218%6,15720%5,24317%30,495
Nevada2,2244%23,54938%11,81119%11,25418%13,01221%61,850
New Hampshire1,1935%8,82237%3,77916%5,23722%4,71520%23,747
New Jersey7,2154%61,79638%33,97321%28,45918%30,97219%162,416
New Mexico2,2395%17,57937%8,64918%7,95517%10,74023%47,161
New York23,2886%148,88741%67,09918%58,70716%66,74918%364,729
North Carolina8,7065%65,00235%36,56219%32,42217%44,83624%187,528
North Dakota5754%6,09045%1,91014%1,85814%2,96722%13,400
Ohio8,2024%70,13135%35,94418%34,82717%51,46326%200,567
Oklahoma3,4985%29,21338%14,67219%14,11118%16,10121%77,596
Oregon3,9595%34,06139%15,76518%14,23916%19,60022%87,625
Pennsylvania11,5315%77,88034%40,08317%42,01418%57,62525%229,132
Rhode Island1,4607%8,17240%3,29816%3,40717%3,84219%20,179
South Carolina5,4886%34,15435%16,50917%18,12318%23,82624%98,101
South Dakota1,1428%5,73139%2,65518%1,98014%3,08121%14,588
Tennessee5,3694%42,74035%21,45818%22,25518%29,57224%121,394
Texas31,2715%231,70641%112,16220%94,75317%100,36218%570,254
Utah3,5476%26,56247%9,86518%8,00014%8,14215%56,116
Vermont7886%4,14933%2,24518%2,02516%3,40227%12,608
Virginia7,7426%48,25937%24,87619%21,62916%28,89822%131,403
Washington6,6775%53,52641%22,02017%23,12918%26,17420%131,526
West Virginia8993%11,87434%5,03714%6,87320%10,17429%34,855
Wisconsin5,1196%31,93336%15,40117%14,81417%22,40225%89,667
Wyoming5645%3,59335%1,39013%1,67216%3,09830%10,318
* Data suppressed due to low sample size** See the detailed estimates of BHP costs and savings in state budget projections, based on Urban Institute modelingSource: Health Insurance Policy Simulation Model-American Community Survey, 2014
Table A2: BHP Eligibles by FPL
StateLess than 138%139-150%151-175%176-200%Total
N%N%N%N%N
Alabama3,8864%17,14520%35,42841%30,71235%87,172
Alaska9515%3,41520%6,23936%6,75339%17,358
Arizona11,33810%18,93116%44,55138%41,08935%115,909
Arkansas2,6735%11,37320%22,79141%18,88234%55,720
California155,34519%124,61115%284,06834%268,68032%832,704
Colorado8,8039%15,64416%37,50338%35,51936%97,469
Connecticut8,21119%7,12316%14,85434%13,33231%43,520
Delaware1,62913%1,83915%4,85439%4,20234%12,523
DC1,25315%1,42118%2,06325%3,36742%8,103
Florida82,11616%82,66517%175,16235%158,91232%498,855
Georgia16,1388%35,57917%86,52941%72,54334%210,789
Hawaii4,98619%4,19216%7,46329%8,96035%25,600
Idaho1,6854%7,52520%13,91437%14,57739%37,701
Illinois29,20314%36,67617%76,07436%70,56233%212,515
Indiana9,7177%25,09719%50,59838%47,49336%132,905
Iowa3,6178%7,28716%17,38739%15,97236%44,263
Kansas4,2188%9,67219%20,04540%16,26832%50,203
Kentucky6,1257%16,12620%32,24739%27,33633%81,834
Louisiana4,6755%17,25119%37,26440%33,52736%92,717
Maine3701%4,34317%10,73442%9,97339%25,421
Maryland14,18416%12,56214%31,27436%29,19833%87,218
Massachusetts18,10224%9,65013%24,25032%23,46831%75,470
Michigan14,6038%33,35718%70,31338%68,92637%187,199
Minnesota5,6708%12,50718%26,11238%25,17836%69,466
Mississippi1,9134%10,90820%22,59141%19,12935%54,541
Missouri8,4567%21,53518%45,32438%43,97437%119,289
Montana7202%6,88124%11,33939%10,13635%29,075
Nebraska2,7029%6,46821%10,36034%10,96536%30,495
Nevada6,07310%9,05515%22,09336%24,62840%61,850
New Hampshire1,6297%4,73220%7,94333%9,44240%23,747
New Jersey32,39520%24,76715%55,65134%49,60431%162,416
New Mexico3,6208%7,70116%17,63037%18,21039%47,161
New York75,59621%58,10016%116,95632%114,07731%364,729
North Carolina12,9827%34,24718%73,83339%66,46535%187,528
North Dakota1,49411%1,86914%5,71443%4,32432%13,400
Ohio12,2746%35,71018%79,89540%72,68936%200,567
Oklahoma6,2788%12,89917%30,49639%27,92336%77,596
Oregon6,5087%15,47918%32,79937%32,83837%87,625
Pennsylvania17,8048%38,81617%88,36539%84,14737%229,132
Rhode Island3,42217%3,03415%5,56828%8,15540%20,179
South Carolina5,3415%18,44419%39,26940%35,04636%98,101
South Dakota8636%2,37616%5,63839%5,71239%14,588
Tennessee6,6565%25,99221%47,65739%41,08934%121,394
Texas88,13415%99,01317%204,85736%178,25131%570,254
Utah5,0949%9,48317%20,52537%21,01437%56,116
Vermont5024%2,96724%5,04540%4,09532%12,608
Virginia14,29211%20,55016%54,15441%42,40732%131,403
Washington16,30112%20,67216%47,40936%47,14436%131,526
West Virginia1,2694%6,79920%13,51139%13,27538%34,855
Wisconsin4,9596%15,60117%37,21742%31,89136%89,667
Wyoming4815%2,23622%4,59845%3,00329%10,318
* Data suppressed due to low sample size** See the detailed estimates of BHP costs and savings in state budget projections, based on Urban Institute modelingSource: Health Insurance Policy Simulation Model-American Community Survey, 2014
Table A3: BHP Eligibles in Tax Unit
State123+Total
N%N%N%N
Alabama56,30565%27,98832%2,8793%87,172
Alaska12,98975%4,20224%1671%17,358
Arizona84,16673%28,85925%2,8842%115,909
Arkansas35,38564%19,29535%1,0402%55,720
California597,14072%198,28724%37,2774%832,704
Colorado69,05471%26,90628%1,5102%97,469
Connecticut36,89385%6,41215%2140%43,520
Delaware9,45175%2,96224%1101%12,523
DC7,36091%5407%2033%8,103
Florida351,63970%124,29125%22,9265%498,855
Georgia137,91265%62,84730%10,0295%210,789
Hawaii20,08678%5,32621%1881%25,600
Idaho22,09259%14,39638%1,2133%37,701
Illinois155,04673%49,30923%8,1604%212,515
Indiana86,38265%39,51130%7,0125%132,905
Iowa31,61271%11,88127%7712%44,263
Kansas33,46167%14,69329%2,0494%50,203
Kentucky54,41866%26,07332%1,3432%81,834
Louisiana62,93568%25,95828%3,8244%92,717
Maine18,62173%6,40825%3922%25,421
Maryland66,13876%19,18422%1,8962%87,218
Massachusetts59,58979%13,71518%2,1673%75,470
Michigan126,16467%55,24430%5,7913%187,199
Minnesota54,39178%14,15820%9161%69,466
Mississippi34,20863%18,45634%1,8773%54,541
Missouri79,62567%35,64730%4,0163%119,289
Montana17,60161%10,61837%8573%29,075
Nebraska21,46970%8,53128%4952%30,495
Nevada45,61774%14,95624%1,2782%61,850
New Hampshire16,58570%6,20826%9534%23,747
New Jersey116,79472%40,06225%5,5603%162,416
New Mexico34,97174%10,71023%1,4813%47,161
New York274,44675%79,74022%10,5433%364,729
North Carolina129,27569%52,92128%5,3323%187,528
North Dakota9,17568%4,02230%2032%13,400
Ohio138,34769%57,44229%4,7782%200,567
Oklahoma49,35064%24,73132%3,5165%77,596
Oregon60,22269%24,45628%2,9473%87,625
Pennsylvania151,84866%68,12130%9,1634%229,132
Rhode Island14,94774%4,46322%7694%20,179
South Carolina63,19764%29,71830%5,1865%98,101
South Dakota9,10362%4,73932%7475%14,588
Tennessee80,36766%36,80630%4,2213%121,394
Texas381,48067%161,11028%27,6645%570,254
Utah29,94553%22,36340%3,8087%56,116
Vermont8,46367%4,06732%781%12,608
Virginia91,03669%34,88027%5,4874%131,403
Washington90,44869%38,03429%3,0452%131,526
West Virginia24,72571%9,95029%1801%34,855
Wisconsin67,62375%20,24823%1,7962%89,667
Wyoming6,00458%4,31442%0%10,318
* Data suppressed due to low sample size** See the detailed estimates of BHP costs and savings in state budget projections, based on Urban Institute modelingSource: Health Insurance Policy Simulation Model-American Community Survey, 2014

Table A4. Estimated number of BHP-eligible people by state, household size, FPL, number of BHP-eligible people in household unit, and age (.pdf)

Appendix: The Characteristics of BHP Eligibles by State by Matthew Buettgens and Jay Dev, Urban Institute Health Policy Center

Endnotes

  1. Stan Dorn and Jennifer Tolbert. The ACA’s Basic Health Program Option: Federal Requirements and State Trade-Offs, November 2014, Washington, DC: Kaiser Family Foundation and Urban Institute. ↩︎
  2. CMS. “Basic Health Program: Federal Funding Methodology for Program Year 2016,” Federal Register, October 23, 2014, Vol. 79, No. 205, pp. 63363- 63376, http://www.gpo.gov/fdsys/pkg/FR-2014-10-23/pdf/2014-25257.pdf. ↩︎
  3. After a BHP program’s first year, the federal government will need to make an additional adjustment to the reference premium, captured by the Population Health Factor (PHF). At that point, BHP enrollees will no longer be in the individual market. They may have a different average risk level than the remaining participant’s in the individual market. If so, premiums charged in the individual market without the participation of consumers under 200% FPL might be different than if BHP enrollees had stayed in the individual market. The PHF will adjust marketplace premiums to compensate for the change in risk levels made by the removal of BHP consumers so the reference premium reflects what would have been charged without BHP. If BHP consumers are healthier, on average, than individual market participants, the PHF will reduce the premium from levels observed in the marketplace. If they are less healthy, it will raise the premium. – In future years, it should not be difficult to determine the PHF. Each individual market participant’s risk level will be measured as part of the risk adjustment system. If states gather similar information about BHP enrollees, actuaries should be able to estimate the impact on individual market premiums if BHP-eligible consumers were added to the individual market. – In most states today, the PHF is even easier to calculate for the first year of BHP program operation: it does not affect premiums at all. That is because, in 2014, BHP-eligible consumers are already in the individual market in most states. As a result, marketplace premiums are already based on the risk pool that would apply without the operation of BHP. – However, in 2014 a handful of states—especially Minnesota, which covers all BHP-eligible consumers through the state’s longstanding “MinnesotaCare” program, now operating under a Medicaid waiver—serve numerous BHP-eligible consumers outside the individual market. No risk-adjustment system or comparable data-gathering mechanism allows a prospective comparison between the average risk level of such consumers and those who will enroll in the 2014 individual market. As a result, CMS is allowing states, for the 2015 BHP program year, to have the PHF determined retrospectively, after the conclusion of the 2015 BHP program year. A state choosing this option must, by August 1, 2014, have proposed a protocol to CMS for gathering the information needed to determine the PHF. CMS must approve the protocol by December 31, 2014. If information gathered through the protocol shows the need to change CMS’ 2015 payments, adjustments would be carried out through increases or reductions to the state’s later BHP payments. ↩︎
  4. Links to such rates are available through the map at http://www.cdc.gov/tobacco/widgets/index.htm#widget. ↩︎
  5. Most state individual markets, including QHPs, use HHS’s default ratios between premiums charged to adults age 21-24 and individuals of other ages. If more than one person within a family enrolls in a plan, the family premium combines the premiums charged to each family member, based on their ages. A few states—the District of Columbia, Massachusetts, Minnesota, New Jersey, and Utah—depart from the HHS default ratios in varying premium charges based on age. These states still determine family premiums based on the combined age-specific premiums charged to each enrolling family member. For HHS’s default ratios and the ratios used by the latter states, see Center for Consumer Information and Insurance Oversight (CCIIO). State Specific Age Curve Variations.August 9, 2013. http://www.cms.gov/CCIIO/Programs-and-Initiatives/Health-Insurance-Market-Reforms/Downloads/state-specific-age-curve-variations-08-09-2013.pdf. New York and Vermont do not permit premiums to vary based on age. Premiums vary based on family enrollment, depending on the characteristics of the enrolling family. In each state, coverage for two adults costs twice as much as coverage for one adult. For information about how premiums change when children are involved, see CCIIO, “State Specific Family Tier Ratios,” Market Rating Reforms: State Specific Rating Variations. Updated: July 11, 2014. http://www.cms.gov/CCIIO/Programs-and-Initiatives/Health-Insurance-Market-Reforms/state-rating.html#age. ↩︎
  6. The purpose of this example is to illustrate our suggested approach to calculating federal BHP payments, not to provide up-to-the-minute, accurate estimates for Washington State. After this example was developed, final QHP premiums for 2015 were announced. To obtain more accurate and current estimates, Washington State officials and stakeholders would need to revise these calculations using actual 2015 premiums, rather than the projections we developed based on state insurance officials’ analysis. ↩︎
  7. Dekker Dirksen, Community Health Plan of Washington/Community Health Network of Washington, personal communication, July 2014. ↩︎
  8. Washington State Health Benefits Exchange, April 23, 2014. Health Coverage Enrollment Report: October 1, 2013 – March 31, 2014. http://wahbexchange.org/files/2713/9888/1218/WAHBE_End_of_Open_Enrollment_Data_Report_FINAL.pdf. ↩︎
  9. To derive the weighted average, we first multiple the premium in a county by the number of QHP enrollees in that county. For example, we multiply $221.14 in Adams County by the 451 QHP enrollees and obtain a product of $99,734.14. We combine such county-specific products for all counties, which equals $34,028,555.85, and divide by the total number of QHP enrollees statewide, which is 152,690. The resulting average is $222.86. ↩︎
  10. Mike Kreidler, Washington state Insurance Commissioner, “Seventeen health insurers file more than 230 plans for 2015 – average proposed rate change 8%,” News Release, May 13, 2014, http://insurance.wa.gov/about-oic/news-media/news-releases/2014/5-13-2014.html; Jeffrey Naas, Washington State Office of the Insurance Commissioner, personal communication, July 2014. ↩︎
  11. For information about each individual state’s approach to age rating, see CCIIO, Market Rating Reforms: State Specific Rating Variations, Updated July 11, 2014, http://www.cms.gov/CCIIO/Programs-and-Initiatives/Health-Insurance-Market-Reforms/state-rating.html; CCIIO, State Specific Age Curve Variations, August 9, 2013, http://www.cms.gov/CCIIO/Programs-and-Initiatives/Health-Insurance-Market-Reforms/Downloads/state-specific-age-curve-variations-08-09-2013.pdf. ↩︎
  12. Very few BHP-eligible consumers live in households with more than five members. ↩︎
  13. For BHP-eligible consumers under 138% FPL, sample size considerations prevented us from developing eligibility estimates within the smaller FPL ranges used by the federal payment methodology (0-50, 51-100, and 101-138% FPL). We assumed an even distribution of BHP enrollees by FPL income levels from 0 to 138% FPL, as provided by the federal payment methodology for narrower FPL ranges. If BHP-eligible consumers are unevenly distributed among the three federal-specified FPL ranges below 138% FPL, our estimated payment amounts for consumers under 138% FPL may be inaccurate. However, given the relatively small size of the under-138%-FPL population among BHP-eligible consumers, the impact on calculating a state’s average federal payment per BHP-eligible consumer is likely to be modest. ↩︎
  14. Hawaii and Alaska would be treated differently, because the FPL equals different income amounts in those states than in other states. ↩︎
  15. The only exceptions are fully community-rated states, where family premiums vary based on the number of adults and children enrolled in coverage. CCIIO, Market Rating Reforms: State Specific Rating Variations. ↩︎
  16. Put differently, the two BHP-eligible members receive family coverage for which a premium of $850.46 is charged, the household payment requirement is $106.30, and the household PTC is $744.16—precisely twice the $372.08 received by each BHP-eligible member. ↩︎
  17. Premera Blue Cross, “Individual Filing – Effective 1/1/2014,” Exhibit 6.2 in Exchange Rates – Silver Plans; LifeWise Health Plan of Washington, “Individual Filing – Effective 1/1/2014,” Exhibit 6.2 in Exchange Rates – Silver Plans. ↩︎
  18. Group Health Cooperative, 1/1/2014 Individual Rate Filing, “Exhibit 11 – Final Rates.” ↩︎
  19. These counties are Benton, Franklin, King, Walla Walla, and Yakima. Dirksen, op cit. For the distribution of enrollees by County, see Table 2. ↩︎
  20. These numbers come from Tobacco Control State Highlights 2012, http://www.cdc.gov/tobacco/data_statistics/state_data/state_highlights/2012/zip_files/highlights.zip. ↩︎
  21. As explained by CMS in its proposed 2016 BHP methodology, “For the BHP payment rate cell for persons ages 21-34, we would calculate the factor as (4/14 * the utilization rate of 18-24 year olds) plus (10/14 * the utilization rate of 25-44 year olds), which would be the weighted average of tobacco usage for persons 21-34 assuming a uniform distribution of ages; for all other age ranges used for the rate cells, we would use the age range in the CDC data in which the BHP payment rate cell age range is contained.” CMS. Basic Health Program: Federal Funding Methodology for Program Year 2016. ↩︎
  22. CMS, Basic Health Program: Federal Funding Methodology for Program Year 2016. ↩︎
  23. Dorn and Tolbert 2014. ↩︎
  24. These estimates will be almost the same as those for 2015, with very small changes reflecting population growth. A state analyzing BHP implementation for 2015 could use the tables in this appendix to develop the kind of fiscal analysis described in the body of this report. ↩︎
  25. Among consumers with incomes between 139 and 400% FPL who are offered ESI, between 97% and 99.8% of such offers meet the ACA’s definition of affordability. Even among consumers in this income range who do not accept ESI offers, between 87% and 99% of the rejected offers are affordable. See the U.S. panel in table 1 in Matthew Buettgens, Stan Dorn, Habib Moody. Access to Employer-Sponsored Insurance and Subsidy Eligibility in Health Benefits Exchanges: Two Data-Based Approaches. Washington, DC: Urban Institute (prepared for the California HealthCare Foundation), Dec. 2012, http://www.urban.org/UploadedPDF/412721-Access-to-Employer-Sponsored-Insurance.pdf. ↩︎
  26. See Buettgens, Dorn and Moody, 2012. ↩︎
  27. Passel, J. and D. Cohen. 2009. “A Portrait of Unauthorized Immigrants in the United States.” Washington, DC: Pew Hispanic Center. ↩︎
  28. Treasury Inspector General for Tax Administration, “The Internal Revenue Service Needs a Coordinated National Strategy to Better Address an Estimated $30 Billion Tax Gap Due to Non-filers,” November 2005, Reference Number 2006-30-006. ↩︎
  29. “Internal Revenue Service Data Book 2003,” Internal Revenue Service, 2003. ↩︎
  30. Plueger, D, “Earned Income Tax Credit Participation Rate for Tax Year 2005,” Internal Revenue Service, 2009. ↩︎
  31. For households with 1 BHP-eligible member, groups would include 5 age ranges, 4 FPL income ranges, and 5 household sizes (with households of 5 or more members constituting the largest household), for a total of 100 groups (5x4x5=100). Households with 2 BHP-eligible members have the same number of age and FPL income ranges, but only 4 household sizes, since a 1-person household cannot have 2 BHP-eligible members. Accordingly, this second set includes 80 groups (5x4x4=80). The final set, consisting of households with 3+ BHP-eligible members, has only 3 household sizes, so it includes 60 groups (5x4x3=60). Altogether, these three sets include 240 groups (100+80+60=240). ↩︎
  32. Specifically, we reweighted by minimizing cross-entropy. Martin Wittenberg, An introduction to maximum entropy and minimum cross-entropy using Stata, The Stata Journal (2010) 10, Number 3, pp. 315-330. ↩︎

The ACA’s Basic Health Program Option: Federal Requirements and State Trade-Offs

Authors: Stan Dorn and Jennifer Tolbert
Published: Nov 25, 2014

Executive Summary

The Patient Protection and Affordable Care Act (ACA) gives states the option to implement a Basic Health Program (BHP) that covers low-income residents through state-contracting plans outside the health insurance marketplace, rather than qualified health plans (QHPs). In March 2014, the Centers for Medicare & Medicaid Services (CMS) issued final regulations on the requirements for a BHP and the methodology for calculating federal payments to states. States can choose to implement BHP beginning in 2015.

BHP Requirements

In a state implementing this option, BHP is available to consumers with incomes up to 200% of the federal poverty level (FPL) who would otherwise qualify for subsidies in the marketplace. Most are adults with incomes between 133 and 200% FPL, but some are lower-income consumers ineligible for federal Medicaid funding because of immigration status. In addition to meeting income requirements, BHP-eligible consumers must be state residents, age 64 or younger, U.S. citizens or lawfully present immigrants, and ineligible for other minimum essential coverage, including Medicaid, CHIP, and affordable insurance offered by an employer. Although any state can implement BHP, only those that also expand Medicaid are likely to do so.

BHP must be at least as comprehensive and affordable as subsidized coverage in the marketplace. BHP consumers are enrolled in “standard health plans” that cover the ten Essential Health Benefits required of QHPs in the marketplace. At state option, such plans may cover additional benefits as well. BHP premiums and out-of-pocket cost-sharing may not exceed what would have been charged by the benchmark plan (second-lowest cost silver plan) in the marketplace, taking into account premium tax credits (PTCs) and cost-sharing reductions (CSRs) for which consumers would have qualified. Standard health plans may be sponsored by state-contracting HMOs, insurers, Medicaid or CHIP managed care organizations, provider networks, or other qualified entities.

States can choose between Medicaid rules and rules that apply in the marketplace for most aspects of BHP. The flexibility to choose between these existing administrative structures applies to such BHP features as the rules for verifying and redetermining eligibility, effective dates of eligibility, criteria for plan network adequacy, grace periods for late payment of premiums, and enrollment opportunities—either continuous enrollment (as under Medicaid) or open and special enrollment periods (as in the marketplace). This flexibility simplifies state administration and facilitates continuity of coverage for consumers.

Federal Funding of State BHPs

The federal government pays 95% of what BHP enrollees would have received in marketplace subsidies. The federal payment for each enrollee includes two components: one reflecting the PTC and another reflecting the CSR the enrollee would have received in the marketplace. The same amount is paid for all enrollees within each federal payment cell, which is defined based on county of residence, age range, income range, household size, and type of BHP coverage (single, couple, etc.). These per capita amounts are set prospectively for each year. When BHP is first implemented, the state’s initial payments are based on projected enrollment into each payment cell. After the program starts, payments are adjusted to reflect actual enrollment within each cell. The final payment methodology for 2015 was published in March 2014; in subsequent years, final payment methodologies will be published each February prior to the beginning of the BHP program year.

Why states have considered BHP

States considering BHP seek to achieve multiple goals, including providing more affordable coverage and reducing “churning” between Medicaid and marketplace plans. Many of the states actively debating BHP envision providing coverage similar to that offered through existing Medicaid or Children’s Health Insurance Programs. If structured in this manner, BHP would give consumers more affordable coverage than what is offered in marketplaces, even with federal subsidies. The result would likely be higher levels of enrollment and greater access to care for the lowest-income group of subsidy-eligible consumers. Recent research suggests that the perceived unaffordability of coverage is a major obstacle to enrollment among the remaining uninsured. In addition, some states that had previously expanded coverage through a Medicaid waiver or through state-funded coverage would achieve savings by shifting those beneficiaries into a federally-funded BHP without reducing benefits or increasing costs for affected consumers. Finally, serving all residents with incomes up to 200% FPL through the same Medicaid-based health plans, with cost-sharing amounts changing but other coverage remaining constant as income rises and falls, would likely reduce the amount of “churning” (that is, involuntary movement between plans in response to income fluctuation). Churning would be further reduced under the final regulations’ option to provide BHP enrollees with 12-month, continuous eligibility.

BHP would also avoid the need for consumers to reconcile advance premium tax credits on federal income tax returns. Since BHP enrollees do not receive tax credits, they would not face the risk of losing tax refunds or owing tax debts if they turn out to receive excess subsidies during the year.

State cost issues

States evaluating whether to implement BHP must compare expected federal funding to projected costs, factoring in potential offsetting savings, to determine BHP’s financial feasibility. States need to compare federal BHP funding, which will reflect marketplace benchmark premiums, to state BHP costs in assessing the amount (if any) that states need to contribute.

Enrollment patterns influenced by state policy choices will affect the relationship between federal funding levels and state costs. For example, states that encourage enrollment of the lowest-income BHP-eligible consumers by greatly lowering or eliminating their premium charges may see average federal funding per beneficiary increase, since the lowest-income consumers qualify for the highest QHP subsidies.

Potential state budget savings could also affect BHP’s fiscal impact. In addition to shifting enrollees in state-funded programs to federally-funded BHP, some states might achieve savings by using BHP’s negotiating leverage to lower plan and provider bids for both BHP and Medicaid and by structuring BHP benefits to substitute for state-funded services—for example, certain mental health and substance abuse treatment—that fall outside QHPs’ commercial coverage.

States must also decide how to finance BHP administrative costs, which cannot be directly paid with federal BHP funds. However, states can fund these expenses by surcharging BHP plans and using federal BHP funds to cover the resulting premium escalation, just as many marketplaces fund administrative costs by surcharging QHPs and using PTCs to cover much of the consequent premium increase.

States concerned about BHP costs exceeding federal funding can lower BHP costs or “hedge” financial risks. A state can lower BHP costs by increasing consumer out-of-pocket cost-sharing, limiting benefits, or raising premiums (so long as BHP coverage remains at least as generous and affordable as QHP plans). States can also adjust plan payments and associated provider reimbursement levels to reduce BHP costs. BHP plan and provider payments are likely to be set at least somewhat below QHP levels, but cutting payments even further will reduce the state’s costs, albeit by potentially narrowing the provider networks available to beneficiaries.

States can also adopt strategies that hedge financial risks, rather than lower costs. They can share risks with health plans by holding back a small proportion of payments until the end of the year. Once uncertainties are resolved, those “hold-backs” can be disbursed. States can also retain a small percentage of federal payments as reserves, to help pay future years’ BHP costs if unforeseen contingencies materialize and federal BHP funds fall unexpectedly short of covering state BHP costs.

BHP and the marketplace size

Although implementing BHP will reduce the size of a state’s marketplace, smaller marketplaces are likely to remain stable in most states. Implementing BHP will lead to a smaller marketplace as consumers with incomes under 200% FPL move out of the marketplace and into the BHP. However, the ACA’s insurance market reforms will promote stability in marketplaces with fewer enrollees. Those reforms base marketplace premiums on the risk level of the individual market as a whole, not solely on the risk level of enrollees within the marketplace or plan. This requirement, along with other premium stabilization mechanisms, should prevent spikes in premiums that might otherwise occur, as illustrated by a very small but stable marketplace in Massachusetts, operating under rules like the ACA’s. Massachusetts’ Commonwealth Choice exchange, which serves only unsubsidized residents above 300% FPL, has remained stable since its 2007 launch, even though fewer than one-half of 1% of non-elderly residents enrolled during Commonwealth Choice’s first three years.

However, a smaller marketplace could reduce competition and would need alternative sources of revenue. Fewer covered lives could make the marketplace less attractive to carriers. In response, carriers might reduce the number of plan options offered to consumers or avoid the marketplace. Moreover, many states are planning to fund marketplaces through assessments on participating plans. In those states, the administrative costs that are fixed—that is, those that are unchanged even if fewer people enroll—would be spread across a smaller base if fewer consumers receive marketplace coverage. However, BHP could help pay marketplace administrative costs that benefit BHP, such as for eligibility determination, compensating for lost QHP assessments.

BHP and marketplace risk levels and premiums

Implementing BHP could potentially alter the risk level of enrollees in the individual market; however, a state-based risk adjustment system that includes BHP plans could both prevent this change and lead to modest individual market premium reductions. If BHP enrollees have different average costs than other marketplace enrollees, moving them into BHP would change the risk level of the individual market, hence the premiums charged by marketplace plans. At income levels low enough for subsidies, premium payments are determined primarily by household income, with tax credits absorbing overall changes to premium levels. If premiums rise or fall, the consumers most affected are those with incomes too high to qualify for subsidies.

A state can address those concerns by administering a risk-adjustment system that combines BHP plans with individual market carriers, thereby including BHP consumers in the individual market’s risk pool. If such a state’s BHP makes coverage more affordable, it will attract some healthier consumers than would have enrolled into the marketplace. The risk adjustment system will share those better risks with the individual market. The result would likely be modest reductions to individual market risk levels and marketplace premiums.

Minnesota’s 2014 experience with a BHP-like option

Minnesota did not provide marketplace coverage to residents with incomes at or below 200% FPL in 2014 because it was planning to implement BHP in 2015. Instead, these consumers were covered through a reconfigured version of the state’s Medicaid waiver program, MinnesotaCare (MNCare). Removing all residents under 200% FPL from the state’s marketplace did not appear to create any of the problems described above:

  • QHP enrollment was robust, albeit reduced because of MNCare. By the end of open enrollment, 47,902 consumers joined QHPs, and 37,985 signed up for MNCare. As of July 2014, enrollment totals reached 52,233 in QHPs and 54,154 in MNCare.
  • Five participating carriers offered consumers numerous marketplace options, and benchmark premiums were the lowest in the country. Thirty-three QHPs were offered in the median county in the state, including ten silver, ten bronze, eight gold, two platinum, and three catastrophic plans. In addition, benchmark QHP premiums in Minnesota were at least 17% lower than in any other state. For 2015, although the low-cost carrier that covered the most QHP members has withdrawn from the Minnesota marketplace, another carrier has taken its place. The total number of QHP options rose from 78 to 84, and state officials project urban benchmark premiums will remain the country’s lowest.
  • The marketplace reports that it can cover its administrative costs, despite a smaller base of QHP enrollment on which to levy premium surcharges. MNCare pays its proportionate share of marketplace costs related to eligibility and enrollment, replacing at least some of the lost premium surcharge revenue. The marketplace’s capacity for self-support is also enhanced by the projected 69% decline in administrative costs in 2015 as work transitions from building infrastructure towards ongoing operations.

Alternative approaches to improving affordability

States may consider alternatives to BHP, which include state-funded subsidies to supplement PTCs and CSRs in the marketplace and, in the future, more comprehensive approaches through state innovation waivers. Starting in 2017, broad state innovation waivers may allow states to develop methods bolder than BHP for making coverage affordable to low-income consumers. These waivers allow far-reaching (albeit budget-neutral to the federal government) restructuring of the ACA’s fundamental architecture. In the meantime, the most plausible alternative to BHP for states interested in improving affordability involves supplementing PTCs and CSRs. That approach imposes state costs, even if the federal government continues to provide Medicaid matching funds for state-furnished PTC supplements. Moreover, such supplementation will not shield consumers from income-tax reconciliation, and it may not let states achieve some of BHP’s potential cost savings. On the other hand, a state that supplements PTCs and CSRs does not shrink its marketplace, is not at risk for costs other than those involving supplemental subsidies in the marketplace, and can help residents with incomes above 200% FPL. A state committed to improving affordability needs to carefully consider the many trade-offs inherent in these various alternative approaches.

Conclusion

BHP offers the prospect of improved affordability for low-income residents, fiscal gains for some states, and reduced churning. However, it also poses financial risks for states and has implications for state marketplaces. In the coming years, some states may investigate a range of approaches to improving affordability of coverage for their low-income residents. Which approach is best—BHP, state supplementation of marketplace subsidies, or bolder alternatives permitted under state reform waivers that begin in 2017—will depend greatly on the unique circumstances facing each individual state.

Report: Introduction

Beginning in 2015, states have the option to implement a Basic Health Program (BHP) providing low-income consumers with coverage outside health insurance marketplaces, which are sometimes called “exchanges.” The BHP option, provided by the Patient Protection and Affordable Care Act (ACA), permits a state to contract with “standard health plans” that serve consumers with incomes at or below 200% of the federal poverty level (FPL) (about $39,500 for a family of three in 2014) who would otherwise qualify for subsidized marketplace coverage.1  States opting for BHP receive federal funding equal to 95% of what the federal government would have paid in marketplace subsidies for BHP enrollees. BHP beneficiaries must receive coverage at least as affordable and comprehensive as what they would have obtained from a qualified health plan (QHP) participating in a marketplace.

Most states considering BHP have sought to provide low-income consumers with more affordable coverage than will be offered in marketplaces, using models provided by Medicaid or the Children’s Health Insurance Program (CHIP). These models lower the overall cost of coverage by reducing provider payments below levels in the private market and using state leverage to negotiate aggressively with health plans, thereby permitting nominal premiums and cost-sharing. Early microsimulation modeling estimated that such savings would let states use 95% of marketplace subsidies to provide consumers with substantially more affordable coverage than would be available from subsidized QHPs.2 

In March 2014, the Centers for Medicare & Medicaid Services (CMS) published final BHP regulations3  and a final methodology for calculating state BHP payments in calendar year 2015,4  the first year when states will be allowed to operate BHP. This paper begins by summarizing these federal policies, including the requirements for BHP as well as the methodology for determining federal BHP payments. It then analyzes the key trade-offs facing states as they decide whether and, if so, how to implement BHP, with a particular focus on the impact of BHP on state budgets and the size, stability, and risk level of state marketplaces.

Medicaid expansion and BHP eligibility

For citizens and qualified immigrants, BHP is not available below 133% FPL. If a state implements BHP without expanding Medicaid eligibility, such consumers between 100 and 133% FPL qualify for marketplace subsidies, those between 133 and 200% FPL can be eligible for the BHP but not marketplace subsidies, and those above 200% FPL can again qualify for marketplace subsidies. Such “stop-and-start” eligibility for marketplace subsidies makes it unlikely that states will implement BHP without a Medicaid expansion, even though they have the legal right to do so.If a state expands Medicaid to 138% FPL, citizens and qualified immigrants are ineligible for BHP at or below 138% FPL, because they will be eligible for minimum essential coverage through Medicaid.

Report: Requirements For A State Bhp

Eligibility

As envisioned by states considering BHP, this option would provide more affordable coverage for low-income consumers than what they would obtain in the marketplaces. BHP is available to consumers with incomes at or below 200% FPL who would otherwise qualify for marketplace subsidies. Eligible consumers include those who:

  • Are state residents;
  • Are age 64 or younger;
  • Are U.S. citizens or legally residing immigrants;
  • Either have income between 133 and 200% FPL or have income below 133% FPL but are not eligible for federally-matched Medicaid because of their immigration status;
  • Are not eligible for other forms of minimum essential coverage, including CHIP and Medicaid (other than for pregnant women’s coverage or a form of Medicaid that offers less than full scope benefits, such as coverage limited to family planning services); and
  • Are not offered affordable coverage from an employer.

A state must cover all eligible consumers, statewide. A BHP cannot cap enrollment, use a waiting period for those with prior coverage, set an upper income limit on eligibility below 200% FPL, or otherwise fail to enroll eligible applicants. However, to promote the smoother transition of individuals from marketplace coverage to BHP, a state can implement alternative initial enrollment strategies on a transitional basis during 2015 with CMS approval.5 

Covered services and consumer costs

A standard health plan provided through BHP must cover all ten Essential Health Benefits (EHBs) that are required for QHPs nationally. States adopting BHP have the flexibility to use a combination of more than one base benefit option. A BHP may cover additional services, but not fewer services, than those required for QHPs. Several specific benefit requirements for QHPs also govern BHP, including the following:

  • Each plan must provide the state with its list of covered prescription drugs and meet prescription drug coverage requirements applicable to QHPs;
  • Benefit design may not be discriminatory; and
  • Federal funds may not be used for abortion services, except in the case of rape, incest, or danger to the woman’s life.6 

BHP premiums7  and out-of-pocket cost-sharing levels8  may not exceed the amounts that would have been charged if BHP beneficiaries had enrolled in the so-called “reference” or “benchmark” plan—that is, the second-lowest cost silver-level QHP. These costs take into account the premium tax credits and cost-sharing reductions for which enrollees would have qualified. Accordingly, BHP premiums cannot exceed the percentages of household income shown in Table 1, which reflect the structure of premium tax credits. The cost-sharing reductions available in the marketplaces raise the actuarial value of plans to lower deductibles, co-payments, and out-of-pocket maximums. To meet these requirements, BHP actuarial values (AV) cannot fall below the levels shown in Table 2. In addition, American Indians and Alaska Natives (AI/AN) cannot be charged any cost-sharing—put differently, their standard health plans must have an actuarial value of 100%.9  While BHP consumers may not be charged more than they would have been charged in the marketplace, states can set lower premium payments and cost-sharing requirements.

As an additional protection, any BHP variations of premiums and out-of-pocket cost-sharing based on income cannot favor higher-income beneficiaries.10  Other QHP safeguards also apply, such as the prohibition against cost-sharing for preventive services.11  As with QHPs, BHP plans must accept premium and cost-sharing payments made by Ryan White programs, AI/AN organizations, and state and federal government programs.12 

Table 1. Maximum Permitted Premium Charges to BHP Consumers in 2015
Income (FPL)Maximum permitted premium
<133%2% of household income
133-149%3% to 4% of household income (on a linear sliding scale)
150-200%4% to 6.3% of household income (on a linear sliding scale
Source: CMS 2014. Note: These income contribution amounts do not reflect the slight increases recently announced by the IRS, which are described below.13 
Table 2. Minimum Required Actuarial Value for BHP Consumers
Consumer CharacteristicsActuarial Value
Up to 150% FPL94%
151-200% FPL87%
American Indian/Alaska Native(up to 200% FPL)100% (no cost-sharing is permitted)
Source: CMS 2014

In one important respect, BHP consumers are exempt from a cost that can apply in marketplaces. QHP enrollees who claim advance payment of premium tax credits (APTCs) must reconcile those payments on their federal income tax returns. APTC claims, which are based on projected income for the year, are compared to PTCs based on the taxpayer’s final annual income. If the APTCs turn out to have been too high, consumers must repay some or all of the excess, through taxes owed or a reduced refund. If APTCs were too low, taxpayers can claim an additional credit on their return. Since BHP enrollees do not receive APTCs, they are not subject to tax reconciliation.

Health plans

In states adopting BHP, BHP-eligible consumers cannot receive subsidized coverage through the marketplace, and are instead covered through a “standard health plan.”14  States may contract with the following types of entities to offer standard health plans:

  • Licensed health maintenance organizations (HMO);
  • Licensed health insurers, in which case the plan’s medical loss ratio must be at least 85%;15 
  • Non-licensed HMOs participating in Medicaid or CHIP; or
  • Networks of health care providers demonstrating the capacity to meet the state’s minimum required negotiating criteria for its competitive contracting process. Such networks must be “capable of meeting the provision and administration of standard health plan coverage, including but not limited to, the provision of benefits, administration of premiums and applicable cost sharing and execution of innovative features, such as care coordination and care management” and “may include but [are] not limited to: Accountable Care Organizations, Independent Physician Associations, or a large health system [sic].”16  This provider network category could allow BHP plans to include innovative health care delivery systems with alternative financing methods that seek to improve population health and quality while slowing cost growth.

As a general rule, states must assure CMS that each BHP enrollee will have a choice of standard health plans from at least two offerors. However, a state may request an exception by demonstrating that it has reviewed (1) whether it is insisting on contractual requirements beyond those needed under federal law; (2) whether additional negotiating flexibility would be consistent with statutory requirements and available funding for the BHP; and (3) whether potential bidders have received enough information to participate in the BHP.17 

BHP programs must meet competitive contracting requirements, except in 2015 for states that show they are unable to do so. 18  Those requirements include standard state procurement procedures for federal grants.19  They also entail negotiation of premiums, cost-sharing, and benefits and include innovative features, such as:

  • Care coordination and care management for enrollees (especially those with chronic conditions);
  • Incentives for using preventive care; and
  • Strategies to maximize patient involvement in health care decision-making, including through incentives for appropriate utilization and provider choices.

In clarifying the meaning of “negotiation,” CMS explained that “nothing precludes a state from establishing standards that will serve as the starting point for negotiations with standard health plans offerors.” That approach would leave room for negotiation around such elements as “price [paid by the state], the provision of benefits in addition to those specified in the state’s solicitation, lower premium and cost-sharing amounts than those specified in the state’s solicitation, or any other aspects of the state’s program…”

In its plan procurement process, the state must also consider additional criteria that ensure:

  • Consideration of enrollees’ health care needs;
  • Provider networks that meet applicable standards (discussed below);
  • Managed care or similar processes to improve quality, accessibility, appropriate utilization, and efficiency of service provision;
  • Performance measures and standards related to quality and improved outcomes;
  • Coordination with other insurance affordability programs to ensure continuity of care; and
  • Fraud prevention while ensuring consumer protection.

Much like marketplace contracts with qualified health plans, state contracts with standard health plan offerors must address “network adequacy, service provision and authorization, quality and performance, enrollment procedures, disenrollment procedures, noticing and appeals, [and] provisions protecting the privacy and security of personally identifiable information.” Such contracts also need to address other requirements specified by HHS, including those involving “service delivery model[s that] further… the objectives of the program.”20 

States have the option to enter into multi-state compacts to jointly contract with standard health plan offerors that serve BHP beneficiaries in more than one state. Such contracts may cover either statewide areas or specific areas within states.21 

State interactions with consumers

In promulgating BHP rules, CMS gave states the option to use existing administrative structures whenever possible, to promote continuity of coverage for consumers and to simplify program administration. Accordingly, for most aspects of BHP, a state can choose between its Medicaid rules and the rules that apply in the marketplace. This flexibility applies to:

  • Criteria for health plan network adequacy, mentioned above;
  • Rules and procedures for verifying eligibility;22 
  • Rules and procedures for redetermining eligibility (except as described below);23 
  • Standards for authorized representatives (if the state permits their use for BHP);24 
  • Standards and procedures for certified application counselors (if the state permits their use for BHP);25 
  • Effective dates of eligibility;26 
  • Appeals rules and procedures;27 
  • Enrollment opportunities (that is, either continuous enrollment, as under Medicaid, or open and special enrollment periods no more restrictive than those used in the marketplace);28  and
  • Grace periods for late payment of premiums and coverage lock-out periods for non-payment of premiums that either (1) meet marketplace requirements, if the state uses marketplace enrollment procedures for BHP, or (2) provide grace periods lasting at least 30 days and meet CHIP lock-out requirements, if the state uses Medicaid enrollment procedures for BHP.29 

Other specific consumer provisions apply to all BHPs. For example:

  • Eligibility must be redetermined every 12 months, unless it is redetermined earlier based on information received from beneficiaries or third-party data sources. Although enrollees must report changes in circumstances as if they were receiving marketplace subsidies, states have the option to provide BHP eligibility continuously based on circumstances at the time of initial application. Such continuous eligibility remains in effect regardless of changed household conditions, so long as the beneficiary remains under age 65, a state resident, and not enrolled in another form of minimum essential coverage.30  As explained below, federal BHP allotments are based on the assumption that all BHPs provide continuous eligibility.
  • States must inform potential applicants and enrollees about the BHP, including benefits, any coverage tiers used by the state, and eligibility criteria. States must require health plans to provide clear information about premiums, cost-sharing, covered services (including amount, duration, and scope limits); to make available and update at least quarterly information about currently participating providers; and to meet other consumer information requirements that apply to QHPs.31 
  • States may not “discriminate based on race, color, national origin, disability, age, sex, gender identity or sexual orientation.”32 
  • BHPs must use the same streamlined application form and meet the same eligibility coordination requirements that apply to other insurance affordability programs.33 
  • Consumers must receive the same opportunity to apply and to receive assistance with their application that extends to Medicaid applicants.34  As with Medicaid, BHP eligibility must be determined by the state or another governmental entity to which the state delegates the authority to determine eligibility,35  and takes place within the single eligibility service that is used for all insurance affordability programs.
  • American Indian and Alaska Native consumers must receive the benefit of specified safeguards that apply to marketplaces.36 

BHP Blueprint

States interested in establishing BHP must furnish CMS with a comprehensive Blueprint describing the structure and administration of the program. The BHP Blueprint provides the roadmap for how the program will operate and documents compliance with federal legal requirements. In addition to specifying the BHP’s components, the Blueprint must also include a description of how the state will ensure program integrity, an operational assessment documenting agency readiness, a transition plan if the state is proposing an alternative enrollment strategy for 2015, and a description of the qualifications and responsibilities of the BHP Trust Fund trustees and the method of their appointment. In concert with the Blueprint, states must submit a funding plan that includes enrollment and cost projections for the first year, along with any sources of funding beyond the BHP Trust Fund.37 

States must seek public comment on the initial Blueprint and any significant revisions to the Blueprint prior to submission to CMS. Public comment is required for revisions that alter core program functions or make changes to the benefit package or enrollment/disenrollment policies. States are required to provide federally recognized tribes with an opportunity to provide input.38  To further promote transparency and allow public input, HHS will post the submitted Blueprint online.39 

States have the option, as an initial step before submitting a complete Blueprint, to provide a more limited Blueprint that describes the BHP’s basic elements. CMS can grant interim certification of this more limited document to provide states with some certainty as they continue program development and procurement.40 

States may not begin enrolling consumers into the BHP or receive federal payment until CMS provides full certification. This requires the Blueprint to provide a complete description of the program and its operations, document compliance with federal requirements, and demonstrate the integration of BHP with other insurance affordability programs to ensure seamless and coordinated coverage.41 

Federal review

States operating BHPs must submit annual reports to HHS that discuss any evidence of fraud and demonstrate compliance with requirements related to:

  • Eligibility verification;
  • Limitations on the use of federal funds; and
  • Collection of quality and performance measures from all standard health plans.

The report must also address requirements specified by the Secretary and list any recommendations identified through an HHS audit or evaluation that the state has not yet implemented.42 

HHS may conduct annual reviews or audits of state BHPs to identify if states have violated any BHP requirements, including those that may lead to withdrawal of the Blueprint certification. Such oversight will also assess whether any BHP trust fund monies were improperly spent.43 

BHP Trust Fund

A BHP state must establish a BHP trust fund as an independent entity or as a segregated account within the state’s General Fund. All federal BHP payments must be deposited into the BHP trust fund, along with non-federal funds. The trust fund must be overseen by a Board of Trustees and only allowable expenditures—payments to standard health plans that reduce premiums or cost-sharing or provide essential or additional benefits for BHP enrollees—are permitted. 44 

Sound fiscal policies must ensure accountability in the receipt and expenditures of trust fund monies, including:

  • Maintaining accounting records, including retaining records for at least three years;
  • Obtaining annual certification that BHP trust funds are being used in accordance with federal requirements;
  • Conducting an independent audit of expenditures; and
  • Publishing annual reports of BHP trust fund expenditures.45 

The BHP trustees and the state must also develop policies and procedures to ensure restitution, within two years, of any BHP trust funds that may not have been properly spent. If no provision is made to restore improperly spent funds, states may be required to return those funds to HHS.46 

Withdrawal and termination of BHP

A BHP may be terminated by a state or HHS. A state deciding to end BHP must submit written notice to HHS no later than 120 days before termination and include a proposed plan for transitioning consumers to other insurance affordability programs. Once a state receives approval, it is required to inform consumers and standard health plan offerors of its intention at least 90 days before the termination date. To ensure continuity of coverage, the state must transfer eligibility and verification information electronically to the marketplace or the Medicaid agency and inform consumers of their assessed eligibility for other insurance affordability programs.47 

HHS may withdraw certification of a BHP Blueprint if it determines the Blueprint no longer meets applicable requirements. A state must develop a transition plan for consumers within 30 days of the withdrawal of certification by HHS.48 

Report: Federal Funding Of State Bhps

As noted earlier, the federal government pays 95% of what BHP enrollees would have received in marketplace subsidies, had the state not implemented BHP. To calculate that amount, the federal government puts each BHP enrollee into a federal payment cell, which is defined based on county of residence, income, and other consumer characteristics. Before the year begins, the federal government announces the per enrollee amount it will pay for BHP enrollees in each payment cell.When a state is about to start its BHP, the state projects quarterly enrollment levels in each cell. If those projections are deemed reasonable, CMS makes corresponding deposits into the state’s BHP Trust Fund. Once actual enrollment data become available, CMS adjusts payment amounts so that, over time, the funding received by a state reflects actual rather than projected enrollment within each federal payment cell.This section begins by explaining how federal payment cells are defined. It then touches on the timing for setting federal payment amounts. Finally, it uses one example to illustrate how CMS determines payment rates for each cell.

Federal payment cells

Each BHP enrollee falls within a “federal payment cell” that is defined by the following characteristics of its members:

  • County of residence;
  • Age range (0-20, 21-34, 35-44, 45-54, 45-54, or 55-64);
  • Income range (0-50, 51-100, 101-138, 139-150, 151-175, or 176-200% FPL);
  • Household size; and
  • Coverage status (single BHP coverage, two-adult BHP coverage, etc.).

The timing for defining federal payments

As a general rule, the federal payment amounts for each cell—that is, the amount the federal government will pay for each BHP enrollee who fits within the cell—will be set prospectively, before the start of a BHP program year. The only uncertainty facing a state is thus the number of enrollees in each cell. This policy seeks to offer states fiscal predictability. If CMS changes its methodology for determining federal payment, those changes will be implemented only prospectively, for years after the change is made; they will not put into question funds already claimed by a state.

The precise methodology for calculating payments per cell may vary from year to year as CMS gathers experience with the operation of marketplaces and can better predict the subsidies that consumers would have received there. Proposed annual methodologies will be published in October, 15 months before the January start of the applicable BHP program year. The following February, 11 months before the BHP program year begins, annual methodologies will be finalized and federal payment amounts will be published, providing some lead time for state budget planning.

For 2015, the first year of potential BHP operation, the final payment methodology was published in early March, slightly later than is expected for future years. The timing of CMS publication of 2015 payment amounts will depend on various state choices, as explained in below. In the meantime, CMS will provide states with technical assistance to help project federal payment levels.

There are two exceptions to the general rule that federal payment amounts for each cell are not adjusted retrospectively. First, if a federal payment amount reflects an arithmetic error, the error will be corrected. Second, for 2015, a state can request a retrospective adjustment that, after the end of 2015, will change marketplace premiums to compensate for the impact of BHP on the risk level within the individual market. This option reflects unique circumstances. Marketplaces and BHPs have not operated before, which makes it impossible for CMS to prospectively adjust for this factor. Such retrospective, population-wide risk adjustments are only provided for in the 2015 payment methodology, and CMS has not announced whether or not they will be allowed in future years.

Determining the payment amount for each cell

The federal government pays the same amount for each BHP enrollee within a federal payment cell. That amount includes a premium tax credit (PTC) component plus a cost-sharing reduction (CSR) component. Those components equal 95% of what the average BHP beneficiary in the cell would have received in PTCs and CSRs, respectively, if the state had not implemented BHP and the beneficiary had enrolled in the second-lowest cost silver QHP rather than BHP.

Throughout the rest of this section, we will use an example payment cell to illustrate CMS’ calculations. The illustrative payment cell includes all BHP enrollees with the following characteristics:

  • Residence in Peoria County, IL;
  • Age 45-54;
  • Income between 139 and 150% FPL, inclusive;
  • One-person household size; and
  • Enrollment in single BHP coverage.

We explain below how the federal payment for each BHP enrollee within this payment cell is calculated to equal $432 a month, combining a $290 PTC component and a $142 CSR component. At the conclusion of the section, we review all calculations in a text box, so readers can see how they all fit together.

The reference premium

The starting point for defining the federal payment is the reference premium—that is, the average premium that would have been charged by the second-lowest-cost silver plan in 2015 to non-smokers in the BHP beneficiary’s county and age range if the state had not established a BHP program. The average is calculated assuming that enrollees are evenly distributed by age within the payment cell. Premiums for non-smokers are used because PTCs are based on such premiums.

A BHP state makes two choices in deciding how CMS will determine its reference premiums in 2015:

  1. As its first choice, a state could either:
  • Begin its calculations with actual marketplace premiums for the 2015 program year; or
  • Begin its calculations with 2014 marketplace premiums, trended forward to 2015 based on expected national changes to marketplace premiums from 2014 to 2015. CMS projects that national marketplace premiums will rise 8.15%, reflecting increased private insurance costs and changes in the ACA’s transitional reinsurance program. To elect this second option, however, a state was required to inform CMS by May 15, 2014—a date that has now passed.
  1. For its second choice, a state can either:
  • Submit a protocol proposing a method for adjusting marketplace premiums retrospectively, after the end of 2015, to compensate for the impact of BHP implementation on average risk levels in the 2015 individual market; or
  • Not adjust marketplace premiums to reflect the impact of BHP implementation on average risk levels in the individual market.

In our example, we assume that Illinois chooses to use 2014 marketplace premiums trended forward to 2015 and not to adjust marketplace premiums to reflect the effect of BHP on insurance risk levels. Calculation of the reference premium thus begins with 2014 QHP premiums. In 2014, the second-lowest-cost silver QHP in Peoria County, Illinois, charges non-smoking adults age 45-54 an average of $345 a month for single coverage (Table 3). Increasing the $345 premium for 2014 by 8.15% yields a 2015 reference premium of $373.49 

Table 3. Monthly Premiums for Benchmark QHP in Peoria County, IL, for non-smoking, single adults ages 45-54, 2014
AgePremium
45$282
46$293
47$306
48$320
49$334
50$349
51$365
52$382
53$399
54$417
Average 45-54$345
Source: Premium quotes from Healthcare.gov as of March 30, 2014. Averages are calculated assuming an even age distribution, as described in March 2014 BHP federal payment notice.
Determining the PTC component

The next step is determining the percentage of household income QHP enrollees would spend on premiums for the “reference” or “benchmark” plan (that is, the second-lowest-cost silver QHP). For example, those percentages will be 3.0% at 133% FPL and 4.0% at 150% FPL in 2015, varying on a sliding scale between those “anchor points.” The average payment amount is then calculated for people in the federal payment cell, assuming an even distribution of households by FPL level. Subtracting that payment from the average reference premium yields an average PTC amount, approximating what consumers would have received in the marketplace.50  Note: the Internal Revenue Service recently released updated percentages for 2015, which are slightly higher than those used for 2014—for example, consumers at 133% FPL must pay 3.02% of income, rather than 3.0%, for benchmark coverage, and the contribution for those at 150% FPL has gone from 4.0% to 4.02% of income.51  For clarity’s sake, the body of this paper will continue to use the simpler percentages that applied in 2014.

Here is how that calculation works in our example. For one-person adult households between 139-150% FPL, the average enrollee share of the premium payment for a benchmark plan is $52, assuming the adults are evenly distributed by FPL level (Table 4). The resulting advance PTC for our group of middle-aged adults in Peoria County is $321. That is the difference between the reference premium of $373, which reflects the average cost of coverage based on the group’s age and geography, and the average payment amount for benchmark coverage of $52, which reflects their FPL and household size.

Table 4. Monthly premium payments required for the benchmark plan from single adults who have various incomes as a percentage of FPL: 2015
FPLMonthly IncomeMonthly Payment
Share of IncomeDollars
139%$1,3523.4%$45
140%$1,3623.4%$46
141%$1,3713.5%$48
142%$1,3813.5%$49
143%$1,3913.6%$50
144%$1,4003.6%$51
145%$1,4103.7%$52
146%$1,4203.8%$53
147%$1,4303.8%$55
148%$1,4393.9%$56
149%$1,4493.9%$57
150%$1,4594.0%$58
Average, 139-150% FPL$52
Notes: Assumes 2014 FPL levels, which will apply during the start of open enrollment for 2015. Premium payment levels for benchmark coverage are calculated as described in March 2014 BHP federal payment notice (3% of household income at 133% FPL, 4% of household income at 150% FPL, with premium payments increased on an even linear scale between those income levels). Averages assume an even distribution of income among households within each payment cell, by FPL level, as described in CMS payment notice.

The PTC is then adjusted to reflect the average impact of income tax reconciliation, had BHP consumers claimed advance payment of tax credits in the marketplace. CMS estimates that, for the average BHP enrollee nationally, such reconciliation would reduce PTCs by 5.08%. (This finding reflects CMS’ assumption that BHP eligibility will not change at all during the year, regardless of actual income fluctuations.)

Finally, the resulting PTC amount is multiplied by 95% to determine the PTC component of the federal payment for each BHP enrollee in this cell.

In our example, making that 5.08% reduction to the $321 PTC amount yields $305. This is the estimated average amount that, after adjustment for tax reconciliation effects, individuals within this payment cell would have received in premium tax credits per month, if they had enrolled in QHPs rather than BHP in 2015. Illinois’s federal payment amount for this cell thus includes a PTC component equal to 95% of $305, or $290.52 

Determining the CSR component

The value of the CSR in the marketplace equals the portion of the total EHB health care claims for BHP enrollees that is paid by the increase in actuarial value resulting from the CSR. The CSR component of the federal BHP payment is then set to equal 95% of the value of the CRS in the marketplace. We describe each of these steps below.

The calculation of CSR value begins with an estimation of the average EHB health care claims covered by a silver-level plan charging the reference premium. To exclude administrative and other non-claim costs, CMS estimates that 80% of the reference premium is used to pay BHP claims, so 20% is subtracted from the reference premium.

Consumers also share in paying EHB claims through deductibles, copayments, and other cost sharing. Silver-level plans have an actuarial value of 70%, which means that, for an average population, the plans pay 70% of all covered claims. To add the amount of claims paid by the plan and consumers, the adjusted reference premium (less the 20% reduction for non-claims costs) is then divided by 70%.

As noted earlier, the reference premium amount in the payment cell used in our example is $373 per month. Excluding the 20% of the premium related to administrative and other non-claim costs results in an average EHB claims amount of $298.40. To determine the total amount of all covered claims, including payments from both the plan and the consumer, we divide $298.40 by 70%, resulting in a total EHB claims amount of $426.29.

These claims estimates are based on the reference premium that is charged for non-smokers. However, CSRs, unlike PTCs, pay the costs of tobacco-related care. CMS therefore increases the claims amount to reflect both the percentage of BHP enrollees who use tobacco (as shown by data from the Centers for Disease Control and Prevention, taking into account age and state)53  and the estimated impact of tobacco use on health care costs (as shown by the difference between weighted average QHP benchmark premiums charged to tobacco users and non-users).54 

For purposes of our example, let us assume that, for Illinois residents age 45-54, CMS sets this tobacco adjustment to require a 30% average increase in EHB claims above the amount for non-tobacco users. Adding 30% to $426.29 (that is, multiplying it by 1.3) results in a total average EHB claims amount of $554.17.

One final adjustment is made to reflect the increased utilization resulting from the reduced cost-sharing faced by BHP enrollees. The calculations above reflect utilization of silver-level coverage, with 70% actuarial value. However, the federal payment cell in our example consists of consumers with incomes between 139 and 150% FPL, who will receive CSRs that raise the actuarial value of their coverage to 94%. This will reduce their cost-sharing, which in turn will increase their utilization. CMS estimates that such increased utilization will increase total claims by an average of 12%. Accordingly, the claims cost estimate for silver coverage must be increased by 12%, to reflect induced utilization.

Increasing the total claims amount in our example by 12%, to account for induced utilization resulting from lower cost-sharing, raises the average EHB claims per consumer to $620.67.

As stated earlier, the value of the CSR component equals the increased share of health care claims paid by the federal government as a result of the CSR. The CSR increases the actuarial value of the reference plan by 24% for BHP enrollees with incomes at 133-150% FPL (AV = 94%) and by 17% for BHP enrollees with incomes at 150-200% FPL (AV = 87%). For those two groups the EHB claims costs estimates developed as described above are thus multiplied by 24% and 17%, respectively, to determine the CSR’s value, had BHP enrollees received QHP coverage in the marketplace.

Finally, the resulting estimate of CSR value is multiplied by 95% to determine the CSR component of the federal payment for each BHP enrollee in this cell.

Our example involves BHP enrollees at or below 150% FPL. Accordingly, CSRs in the marketplace would have increased actuarial value from 70% to 94%, paying 24% of total claims. The average EHB claims amount in the marketplace for consumers in this payment cell is $620.67 per month. The CSR’s value in the marketplace would thus be 24% of such claims, or $148.96 per month. The CSR component of the BHP payment is 95% of that CSR value, or $141.51 a month—$142, rounded off to the nearest dollar.

The total monthly federal BHP payment for each enrollee in this example payment cell equals the $290 PTC component plus the $142 CSR component, or $432.

Calculating the Federal BHP Payment: A Recap

Reference premium for 2015

  1. The average 2014 premium for non-smoking adults age 45-54 in Peoria County’s second-lowest cost silver QHP ($345) increased by the projected national average QHP premium increase for 2015 (8.15%) = $373

Premium Tax Credit Component

  1. Reference premium for 2015 ($373) minus the average payment for benchmark plan in one-person households in this FPL range ($52) = expected advance PTC amount ($321)
  2. Reduce expected advance PTC amount ($321) by average tax reconciliation percentage assuming no mid-year eligibility adjustments (5.08%) = average PTC, post-tax reconciliation ($305)
  3. Multiply average PTC, post-tax reconciliation ($305) by 95% for PTC component of BHP payment ($290)

Cost Sharing Reduction Component

  1. To determine EHB claims paid by silver-level QHP charging reference premium, exclude administrative costs (20%) from reference premium ($373) = $298.40
  2. To add EHB claims paid by consumer, divide plan-paid claims ($298.40) by silver level AV (70%) =$426.29 in total EHB claims, including plan-paid claims plus consumer cost-sharing
  3. Increase to add average claims costs for BHP smokers, as estimated by CMS. Assume CMS publishes 30% tobacco factor for BHP enrollees in this age group, raises EHB claims to $554.17.
  4. Increase claims (12%) to reflect greater utilization because of lower cost-sharing due to CSR. EHB claims = $620.67.
  5. In this FPL range, CSR in the marketplace would raise AV from 70 to 94%, so value of CSR is 24% of EHB claims ($620.67) = $148.96.
  6. Multiply CSR value in the marketplace ($148.96) by 95% to obtain CSR component of BHP payment ($141.51, or $142, rounded off to the nearest dollar)

Total Monthly Federal BHP Payment for Enrollees in Payment Cell

  1. Add PTC component ($290) and CSR component ($142) = $432

Report: Key State Policy Questions

In this section of the paper, we begin by discussing the reasons some states have considered implementing BHP. We then explore the two main areas of concern that have been raised as arguments for not moving forward: namely, BHP’s fiscal risks for states and BHP’s potential adverse effects on marketplaces.

Rationale for BHP

Several states have seriously considered BHP. Depending on the state, the objectives prompting consideration have included the following:

Increasing the affordability of coverage for low-income adults. One analysis attempting to quantify the potential gains in this area found that providing BHP coverage like that offered by many state CHIP programs would lower monthly premiums for the average eligible adult under 200% FPL from $100 a month, in subsidized marketplace plans, to $8 a month.55  It also found that average annual out-of-pocket costs would fall from $434, in subsidized marketplace plans, to $96. Making coverage more affordable could increase low-income consumers’ willingness to enroll and, once enrolled, to obtain necessary non-emergency care.

Experience with 2014 QHP enrollment reinforced the importance of these goals. An inability to afford coverage was the most commonly reported reason consumers remained uninsured as of June 2014, according to the Health Reform Monitoring Survey, a quarterly survey of the nonelderly that monitors ACA implementation. Among the uninsured with incomes between 139 and 400% FPL—the main target group for marketplace subsidies—52% cited financial reasons for not enrolling.56  However, within that group, 40 percent had heard “little or nothing” about subsidies; and even among the remainder, who reported hearing “some” or “a lot” about subsidies, the perceived unaffordability of QHP coverage may not reflect accurate and complete information about available assistance.

Reducing “churn” between health plans. If Medicaid, CHIP, and BHP were combined so that the same health plans served all residents with incomes at or below 200% FPL, the total amount of “churning” between Medicaid plans and marketplace plans would decline by 16%, according to the only published analysis that took into account unaccepted offers of employer-sponsored insurance.57  Moreover, final BHP regulations permit states to provide BHP enrollees with continuous, 12-month eligibility, based on household circumstances at the time of application, regardless of later, mid-year changes. In fact, federal BHP funding is premised on such continuous BHP eligibility, as noted earlier.58  Implementing such continuous eligibility could greatly reduce mid-year transitions between insurance affordability programs.

Protecting consumers from the risk of tax reconciliation. As noted earlier, BHP consumers do not receive APTCs and so are not subjected to tax reconciliation. Shielding uninsured consumers from this risk could increase their willingness to enroll into subsidized coverage. Once the APTC reconciliation requirements become widely understood, some consumers who qualify for APTCs could choose to remain uninsured rather than risk losing tax refunds or owing money to the federal government due to tax reconciliation.

Achieving significant state budget savings while preserving existing access to care for beneficiaries of pre-ACA state programs. Before the ACA, some states covered low-income adults through Medicaid waiver programs or using state-only funding. This coverage was typically much more affordable for consumers and, in some cases, offered more generous benefits than subsidized marketplace insurance. BHP lets states continue pre-ACA coverage for these groups, while substituting federal for state funding. Otherwise, such states face the dilemma of either: (1) moving their residents into the marketplace—thus saving state money but increasing residents’ health care costs and potentially reducing their access to care—or (2) continuing to provide low-income residents with state-funded help—thereby preserving their pre-ACA access to care but persisting with state expenditures not paid by other states for similar populations.

Providing coverage that reflects state rather than federal policy preferences. Some state officials expressed interest in using BHP to provide low-income consumers with coverage like that furnished to children at similar income levels under state CHIP programs. They sought to use approaches preferred by state policymakers, rather than providing subsidies defined in federal laws governing marketplace coverage. In other states, officials felt that objectives related to delivery system reform might be better achieved with direct state control through BHP rather than through marketplace QHPs, particularly in federally facilitated marketplaces.

State fiscal issues

While BHP offers states federal funding that can be used to provide low-income consumers with more affordable coverage, its financing structure creates fiscal issues for states. Federal BHP funding equals 95% of what the federal government would have paid in premium and cost-sharing subsidies for BHP enrollees. If that funding proves insufficient to cover program costs, states will be responsible for covering any shortfalls. States must thus carefully compare BHP costs to available federal funding, taking into account any state savings created by BHP. This section explores these fiscal issues and discusses strategies for mitigating state risks.

Estimating total federal funding and State BHP Costs

A critical step in assessing the financial feasibility of BHP and estimating available federal funding is to identify the characteristics of BHP-eligible consumers. Previous sections of this report explain how CMS will set federal funding amounts for particular BHP consumers, but to project total federal funding levels, states will need to estimate the distribution of BHP-eligible consumers, by geography, age, and income. Among surveys conducted by the U.S. Census Bureau, the American Community Survey (ACS) has the largest state-specific samples and so is likely to provide the most reliable estimates. However, a limitation of this data set is that ACS data do not include information about offers of employer-sponsored insurance (ESI), which almost always preclude subsidy eligibility.59  States that fail to take such offers into account will overestimate the prevalence of relatively high-income BHP-eligible consumers, since ESI offers grow increasingly common as income rises.60  As a result, such states will underestimate federal BHP funding per BHP enrollee, since QHP subsidies, hence BHP funding levels, decline as income rises.

State BHP rules will affect federal funding. A state could structure its BHP program to boost the enrollment of consumers who qualify for particularly high federal funding levels. A state might encourage the enrollment of low-income BHP consumers, for example, by entirely or almost entirely eliminating premium charges for enrollees below a specified FPL level. Such consumers receive particularly large QHP subsidies and so would draw down particularly high federal BHP payments. Increased enrollment of low-FPL consumers, relatively to those with somewhat higher FPL levels, would likely increase the overall ratio of federal funding to state BHP costs, perhaps by non-trivial amounts.

States must carefully estimate BHP costs, exploring mechanisms to reduce those costs, if needed. Medicaid expenditures per member per month for healthy adults, increased to furnish provider reimbursement and associated plan payments to somewhere between Medicaid and QHP levels, can represent a useful starting point for estimating the cost of BHP adult coverage.61  A state can lower those costs by increasing out-of-pocket cost-sharing above Medicaid levels, which lowers utilization. Along similar lines, varying the scope of covered benefits can affect BHP coverage costs.62  The state could also impose or raise consumer premium charges.63 

Provider reimbursement and associated plan payment levels also influence BHP coverage costs. A state that further raises these amounts above Medicaid levels will increase BHP costs. If that increase would cause state costs to exceed federal funding levels or state policymakers’ fiscal targets, offsetting program changes may be needed, such as benefit reductions or increases in consumer cost-sharing (so long as they do not violate the baseline federal requirement that BHP consumers must receive at least the covered benefits and cost-sharing protections that would have been available in the marketplace).64  On the other hand, a state could reduce BHP costs by lowering provider and plan payments towards Medicaid levels, but that would limit provider networks, with potentially adverse effects on access to care, depending on the state.

States can finance BHP administrative costs through assessments on BHP participating plans. As explained earlier, federal BHP dollars cannot directly pay for BHP administration. However, states can leverage BHP’s new infrastructure to obtain administrative funding. As CMS explained, “states have the option to establish sources of non-federal funding to help offset administrative costs associated with BHP. Non-federal resources can include assessments imposed on BHP participating plans.”65 

A BHP can thus fund administrative costs by surcharging BHP-participating plans. The resulting revenues are non-federal resources, which can pay BHP administrative expenses. Those assessments are part of standard health plans’ costs, funded through premiums. The premiums, in turn, are paid using federal BHP funds. Many marketplaces use a similar strategy by raising administrative funds through QHP assessments. QHPs incorporate those assessments into higher premiums, which federal PTCs help pay.

Potential state budget savings

States assessing their potential financial exposure could also consider potential sources of state budget savings that might result from BHP implementation.

State-funded populations could be shifted into BHP. Depending on state circumstances, the resulting state savings may involve the following groups:

  • Lawfully present pregnant non-citizen women whose incomes are at or below 138% FPL receive, in many states, optional Medicaid coverage under Section 214 of the Children’s Health Insurance Program Reauthorization Act of 2009 or CHIP coverage. No maintenance-of-effort requirement applies to such women over age 18. A state implementing BHP could move them into federally-funded BHP without reducing their benefits or increasing their costs.
  • Other lawfully present non-citizens whose incomes are at or below 138% FPL and who are ineligible for federal Medicaid funds because of immigration status receive state-financed health coverage in some states. Without BHP, such immigrants could receive subsidized QHP coverage, which may be significantly less affordable than what the state previously furnished. BHP would let the state continue providing those immigrants with coverage along pre-ACA lines while shifting the cost of their care to the federal government.
  • Pregnant women with incomes between 138 and 200% FPL receive optional Medicaid coverage in most states. A state implementing BHP could move such women who are over age 18 (to whom maintenance-of-effort requirements do not apply) into federally-funded BHP while preserving all the benefits and cost-sharing protections formerly provided by Medicaid. In some states, when women in this income range become pregnant, they must move from QHPs to Medicaid plans if they want to access Medicaid’s additional services and cost reductions. If BHP is provided through the same plans that serve Medicaid beneficiaries, women could stay with the same plan and provider when they get pregnant without surrendering Medicaid’s services and cost-sharing protections. Preserving continuity of care during pregnancy would ameliorate this potentially important form of churning, affecting low-income pregnant women, not discussed above.

BHP “covered lives” may give states additional negotiating leverage to obtain lower bids from plans or providers seeking to serve both Medicaid and BHP consumers. Even a small percentage reduction in Medicaid’s per member per month costs could yield significant savings, given the total size of Medicaid managed care contracts in most states. Savings might also result from lower per unit costs if BHP is added to administrative services contracts that benefit multiple, state-administered health programs.

BHP benefits could be structured to substitute for state-funded services. For example, BHP could provide coverage for services such as mental health and substance abuse treatment of an amount, duration, and scope that exceeds the commercial benefits covered by QHPs. BHP provider networks could also be structured to assure or increase state fiscal gains in these areas.

Limiting State Financial Risks

As noted earlier, a state that implements BHP assumes the risk of a larger-than-anticipated gap between state BHP costs and federal BHP funds. Policymakers may be concerned that more than an expected amount of state general funds could ultimately be required to cover any resulting shortfall. Despite the efforts by federal officials to ensure a predictable level of federal funding, states face some inevitable uncertainties. The most important such uncertainties may involve fluctuating QHP benchmark premiums during the early years of marketplace operations, which directly influence federal BHP funding amounts. Such uncertainties are mitigated by CMS’s publication of BHP payment amounts for each year in February of the previous calendar year and state options to base a year’s BHP payments on the previous year’s QHP benchmark premiums, trended forward based on CMS national projections. These two policies give states time to respond when QHP benchmark premiums change in surprising ways.

To limit fiscal uncertainties associated with the BHP, states can explicitly share risks with health plans through contractual contingencies. For example, a small proportion of payments to health plans could be held back until after the end of the year. Along similar lines, health plan contracts could reserve the right for states to reduce payment amounts if unforeseen shortfalls emerge. Similar contract language is already standard in many states for Medicaid and other programs.

States can maintain modest funding reserves to cover future shortfalls. CMS has made clear that a state is not required to spend all of its federal BHP funding during the year in which such funding is provided. One year’s funds can be retained and used for future BHP consumers.66  A state BHP could thus carry over modest reserves to guard against future contingencies.

States must carefully consider the trade-offs of any strategies to mitigate financial risks. If a state uses its leverage with health plans to ask them to share risks, the state will have less leverage to obtain other desired concessions. And if for a given year a state holds some federal BHP funds in reserve, such a decision could translate into fewer covered services, higher costs for beneficiaries, or lower reimbursement levels for plans (and hence providers) during that particular year.

Impact of BHP on a state’s marketplace

Implementing BHP will reduce the size of the state’s marketplace and potentially change its risk pool. This section explores those effects.

A smaller marketplace

BHP will reduce marketplace size. Microsimulation estimates of the impact of BHP on the marketplace conducted before the start of open enrollment in October 2013 suggested that, in the average state under full ACA implementation, BHP would reduce the number of APTC-recipient marketplace enrollees by about half, from 3.1% to 1.6% of residents under age 65. Adding unsubsidized enrollees, the average marketplace was projected to shrink by 20% under BHP, from 6.5% to 5.2% of non-elderly residents.67  Now that the open enrollment period has ended, policymakers should be able to determine the percentage of marketplace enrollees whose incomes are at or below 200% FPL and who would leave the marketplace if their state implemented BHP. New York is the only state to publish income tabulations describing QHP enrollment. There, 39% of QHP beneficiaries are under 200% FPL and would leave the marketplace following BHP implementation; 35% qualify for subsidies with incomes between 200 and 400% FPL; and 26% of QHP enrollees are unsubsidized, with incomes above 400% FPL.68 

A smaller marketplace is highly unlikely to become unstable, in most states. Before the ACA, purchasing pools could become dangerously unstable and experience so-called “death spirals” when small size made them vulnerable to adverse selection. Prior to the ACA’s insurance market reforms, a pool’s premiums were based on risk levels within the pool. As a result, a few costly enrollees in a small pool could raise premiums significantly. Healthy consumers could then buy the identical coverage for a much lower cost outside the pool. Many healthy consumers would leave the pool, further raising the average risk level within the pool, further raising premiums, causing an exodus of the healthiest remaining consumers, etc.

This is highly unlikely to happen with the ACA’s insurance reforms and market stabilization mechanisms, which share risk across the entire individual market. Insurance rating rules, risk-adjustment mechanisms, pooling requirements, and reinsurance seek to make the cost of coverage reflect the risk level of the individual market as a whole, rather than the risk level of enrollees within a particular plan or within the marketplace. Consequently, even if a relatively small marketplace attracts members who are comparatively unhealthy, marketplace premiums are unlikely to rise above the level charged outside the marketplace by more than a small amount. Moreover, the healthiest marketplace enrollees cannot purchase the identical coverage elsewhere for a substantially lower cost. At the same time, a coverage mandate brings healthy enrollees into the individual market, lowering the overall risk level. Illustrating the stability yielded by ACA-like insurance reforms, Massachusetts’s Commonwealth Choice marketplace, which was limited to unsubsidized consumers above 300% FPL, remained perfectly stable even though, during its first three years, it served less than one-half of one percent of non-elderly residents (see text box).69 

A smaller marketplace may need to charge higher amounts to cover administrative costs. Some administrative costs vary with size and will decline if a marketplace shrinks. Other costs are fixed, however. The latter will need to be spread across a smaller base if a state implements BHP. Accordingly, if a marketplace relies on QHP assessments to fund administrative costs, the amount charged per plan will rise. If the result is higher QHP premiums, consumers who qualify for tax credits will be largely unaffected, but unsubsidized consumers would face a somewhat higher cost for coverage inside the marketplace than outside.70  To address this problem, BHP could help pay marketplace administrative costs, in proportion to benefits received, as is taking place in Minnesota (described below); or the marketplace could apply surcharges to BHP standard health plans.

A smaller marketplace may have less appeal to carriers. With fewer covered lives in the marketplace, carriers may be less interested in offering coverage. As a result, marketplace consumers could have fewer plan options. While this would simplify consumer choice, some consumers may have valued the options that are lost. Moreover, it is not clear whether carriers would have the same incentives to lower premiums and maximize market share if fewer covered lives are at stake.

A Tiny but Stable Health Insurance Marketplace: The Massachusetts ExperienceThe much greater stability of purchasing pools under reform has already been observed in Massachusetts, which implemented policies like those the ACA has put in place nationwide. That state’s Commonwealth Choice program began in July 2007, functioning as a health insurance marketplace serving individuals with incomes above 300% FPL and some small firms. By the end of 2007, slightly fewer than 15,000 people received individual coverage.71  Enrollment was still under 20,000 by the end of 2008.72  By July 2010, several programs for small employers were added, and total enrollment reached approximately 35,000, of whom nearly 27,000 received individual coverage.73  At no point did the small number of people receiving individual coverage through the exchange cause its destabilization.

If anything, greater challenges faced Commonwealth Choice than marketplaces in states that implement BHP. The Massachusetts program was limited to consumers over 300% FPL. More importantly, Commonwealth Choice offered no subsidies. By contrast, even in a state that implements BHP, marketplaces will be the only place where consumers with incomes between 200 and 400% FPL can obtain subsidized coverage, providing a force for stability and enrollment of healthy consumers that was not present with Commonwealth Choice.

Effect on the marketplace risk pool

BHP’s impact on the risk pool will depend on state circumstances and should not be exaggerated. The health status of BHP-eligible consumers will affect the risk pool of the marketplace. While lower income is associated with poorer health status, BHP-eligible consumers are more likely to be young adults, who are typically healthier, compared to others in the individual market. Analysts using the Urban Institute’s Health Insurance Policy Simulation Model found, for example, that because many Utah adults below 200% are relatively young, BHP implementation in that state would raise premiums in the individual market, hence in the marketplace, by approximately 2%; but in Washington State, where low-income adults tend to be older than in the country as a whole, BHP implementation would not change the individual market’s risk level.74 

Regardless of the state, however, the magnitude of BHP’s impact should not be exaggerated. As noted earlier, marketplace enrollees are pooled together with other participants in the individual market. Accordingly, if consumers under 200% FPL move from marketplace to BHP, the risk pool of the entire individual market will be affected, not just the smaller pool within the marketplace. The proportionate impact on risk levels, hence premiums, will thus be smaller than is sometimes envisioned.

The effect of the BHP on the marketplace risk level also depends on the extent to which a state’s Medicaid program covers high risk individuals, including pregnant women and people with disabilities between 138 and 200% FPL.75  A state with broad Medicaid eligibility in this income range has fewer high-risk individuals whom BHP would shift out of the marketplace. How low-income adult demographics and Medicaid coverage play out—and so how BHP implementation would affect the individual market’s risk pool—vary greatly by state.

BHP can be structured to improve the individual market risk pool. If BHP is more affordable than subsidized marketplace coverage, BHP will likely attract some healthy consumers who would not enroll into the marketplace. CMS has made clear that federally-operated risk-adjustment systems cannot include BHP. However, a state-operated risk-adjustment system can combine BHP standard health plans with individual market carriers.76  That would keep consumers below 200% FPL within the individual market’s risk pool while adding to that pool the better risks attracted by BHP’s more affordable cost structure. The result would likely be a modest reduction to individual premiums charged both within and outside marketplaces.

Notwithstanding its appeal, this approach has trade-offs. Establishing and operating a risk adjustment system could require significant effort from state officials, even if much of the information technology infrastructure and methodologies required for such a system will already be in place because of the federal system. Moreover, BHP standard health plans will either receive or make risk-adjustment payments, modestly increasing the uncertainties such plans face at initial BHP implementation.

The impact on Minnesota’s marketplace of BHP-like coverage in 2014

Minnesota policymakers plan to implement BHP starting in 2015. As a transition policy for 2014, consumers with incomes at or below 200% FPL do not receive QHP subsidies in Minnesota’s marketplace. Instead, they are covered through the state’s preexisting (but reconfigured) Medicaid waiver program, MinnesotaCare (MNCare). Excluding consumers under 200% FPL from the state’s marketplace has not yet appeared to create significant problems along the lines suggested above.

  • QHP enrollment is reduced but remains robust. According to the first data available after the end of open enrollment, 47,902 consumers had enrolled in QHPs by April 13, 2014, and 37,985 had joined MNCare.77  Since then, MNCare enrollment has remained unconstrained, but only those qualifying for special enrollment periods have been able to sign up for QHPs. Accordingly, as of July 10, 2014, 52,233 consumers were covered through QHPs and 54,154 had joined MNCare.78  Approximately half of all consumers who applied for QHP subsidies were found eligible. These results were achieved despite significant problems with the marketplace’s early rollout.
  • Broad carrier participation provides consumers with numerous QHP options. Five different carriers, contracting with ten different provider networks, sponsored Minnesota QHPs in 2014. In the median county, consumers could choose from among 33 QHPs, including ten silver, ten bronze, eight gold, two platinum, and three catastrophic plans.79  While this range of choices was significant, it was somewhat narrower than in the average marketplace rating area nationally, where five carriers offered 47 QHPs.80  For 2015, although the low-cost carrier that covered the most QHP members has withdrawn from the Minnesota marketplace, another carrier has taken its place, and the total number of QHP options rose from 78 to 84.81 
  • QHP reference premiums are very low, and the marketplace appears stable. Rather than experiencing adverse selection that raised QHP premiums and risked a potential death spiral, Minnesota had the country’s lowest benchmark QHP premiums in 2014, at least 17% below those in the second least-expensive state;82  and Minnesota’s marketplace showed no signs of instability.83  Even though the lowest-cost carrier has left the marketplace for 2015, average premium increases are forecast at 4.5 to 12 percent.84  State officials characterize 2015 benchmark premiums in Minnesota’s urban areas as continuing to be the lowest in the country.85 
  • The marketplace reports that it can cover its administrative costs, despite a smaller base of QHP enrollment on which to levy premium surcharges. The marketplace has proposed a balanced budget for 2015, without requiring additional resources from the state or federal governments. Officials anticipate receiving $11 million from a 3.5% “withhold” of premium revenues from QHPs, along with $22 million from the Medicaid program—including MNCare. Marketplace operations involving enrollment and eligibility determination help achieve the purposes of MNCare and the underlying Medicaid program. The latter programs contribute to those functions in proportion to the benefits they receive. In effect, MNCare’s implementation shifted some of funding of marketplace administration from health plan assessments to Medicaid. Another factor facilitating financial feasibility is that the marketplace’s annual administrative costs are projected to fall by 69% in 2015 as the bulk of its work transitions away from initial infrastructure development and towards ongoing operations.86 

While serving consumers under 200% FPL through a separate system of coverage has not yet created significant problems for Minnesota’s marketplace, problems might develop in the future.

Alternative state options to making coverage more affordable for low-income consumers

States may consider state innovation waivers beginning in 2017. Broad state innovation waivers, which can go into effect starting in 2017, may allow bold approaches that combine federal resources offered by the ACA and, in ways that are budget-neutral to the federal government, provide low-income consumers with more affordable coverage than they would obtain in marketplaces with standard ACA subsidies.87  However, CMS has not yet promulgated substantive guidelines, although Vermont long ago announced its plan to use such a waiver to implement a state-based single-payer system.

Until states can adopt innovation waivers, the most plausible alternative state-level method of improving affordability involves supplementing subsidies offered in the marketplace. For example, Massachusetts and Vermont, which used pre-ACA Medicaid waivers to provide subsidized coverage to adults with incomes above 138% FPL, are lowering the cost of marketplace coverage by supplementing PTCs and CSRs for residents with incomes up to 300% FPL. A Medicaid waiver provides federal matching funds for PTC supplements;88  but federal matching funds are not available for CSR supplements, which these states are therefore funding with state-only dollars.89 

The ACA permits states to supplement marketplace subsidies.90  However, it is not clear that states with pre-ACA coverage less generous than that offered by Massachusetts and Vermont can obtain Medicaid waivers to help pay the cost of PTC supplements, since such states cannot argue that waivers are needed to prevent their low- and moderate-income residents from suffering harm. With or without such waivers, a state supplementation strategy involves state budget costs that need to be compared against potential costs under BHP.

A state supplementation approach has other important differences from BHP:

  • It does not shield low-income residents from the tax reconciliation risks of losing tax refunds or incurring federal income tax debts if they inaccurately project annual income when they enroll.
  • It would likely not provide the same reduction in “churning,” since most consumers would need to change plans when their income moves above or below 139% FPL, and since 12-month continuous eligibility will not be available.
  • It may or may not provide the same opportunities for state budget savings, depending on state circumstances.
  • It keeps consumers below 200% FPL in the marketplace, incorporating the healthier risks attracted by lower premiums into the individual market without requiring the state to administer risk adjustments.
  • Consumers between 138 and 200% FPL will retain access to marketplace networks, rather than Medicaid provider networks, which may improve their access to care.
  • It lets the state make coverage more affordable for residents with incomes above 200% FPL. For a BHP state to help such residents, it would need to combine BHP for consumers up to 200% FPL with marketplace supplements for consumers above that income level.

How Would a Rise in Risk Levels within a Marketplace Affect Consumers?Increased risk levels within a marketplace are shared throughout a state’s individual market. Each carrier pools all individual market enrollees, within and outside the marketplace. Moreover, risk-adjustments and reinsurance payments combine risks among all carriers’ individual market plans. As a result, if marketplace risk levels rise, marketplace premiums will increase by less than would be the case without market-wide risk sharing, but premiums will also rise for individual plans outside marketplaces.

To illustrate the impact of higher risk on various consumers, suppose average risks inside a marketplace rise by 10%, risks outside the marketplace do not change, the marketplace includes half of all individual market enrollees within a state, and the ACA’s risk-sharing mechanisms are fully effective. Individual market premiums will rise by 5%, both inside and outside the marketplace. Effects will vary among consumers, depending on whether they receive tax credits and which plan they choose, as follows.

  1. Individual market enrollees, both within and outside the marketplace, who do not receive tax credits will see their premiums rise based on the average change in market-wide risk. In this example, their premiums will increase 5%.
  2. Tax credit beneficiaries who enroll in benchmark coverage will be unaffected. If a tax credit beneficiary selects the second-lowest cost silver plan in the marketplace, his or her premium payment depends entirely on income. The plan’s 5% premium increase will be paid entirely by higher tax credits.
  3. Tax credit beneficiaries who enroll in coverage more expensive than the benchmark plan will pay slightly more in premiums. They pay both their income-based amount and the difference between the benchmark premium and the higher premium charged by their chosen plan. If all marketplace premiums rise by 5%, that difference increases by 5%. For example, a single adult earning $25,000 a year who chooses the benchmark plan pays 6.92% of income in premiums, or $144 a month.91  If that adult instead enrolls in a plan that costs $50 more than the benchmark plan, the consumer’s monthly payments are $194. If all premiums rise by 5%, the differential between the consumer’s plan and the benchmark plan will be $52.50, rather than $50, so the consumer’s monthly payment will be $196.50—a 1.3% net increase.
  4. Tax credit beneficiaries who enroll in coverage less expensive than the benchmark plan will pay slightly less in premiums. They pay their income-based amount minus the difference between the benchmark premium and the lower premium charged by their chosen plan. If all marketplace premiums rise by 5%, that difference increases by 5%. To continue with the prior example, if a consumer earning $25,000 a year picks a plan costing $50 less than the benchmark, the consumer pays $94 a month. If all premiums rise by 5%, the difference between the consumer’s plan and the benchmark plan will be $52.50, rather than $50, so the consumer’s monthly payment will be $91.50—a 2.7% net decrease.
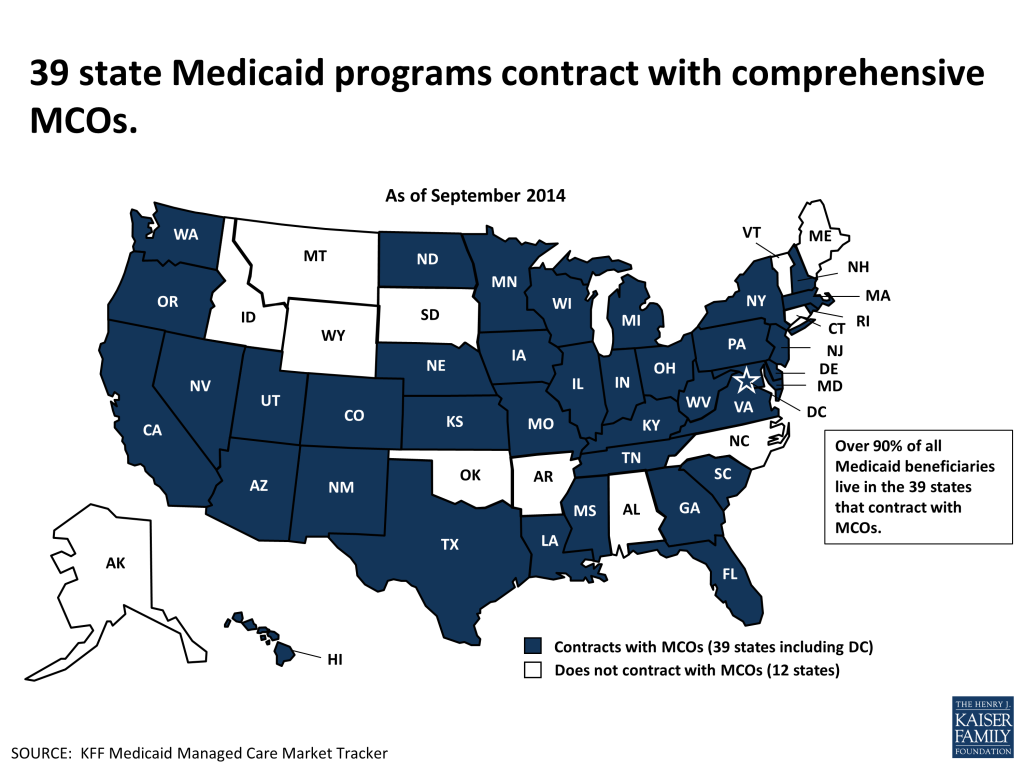
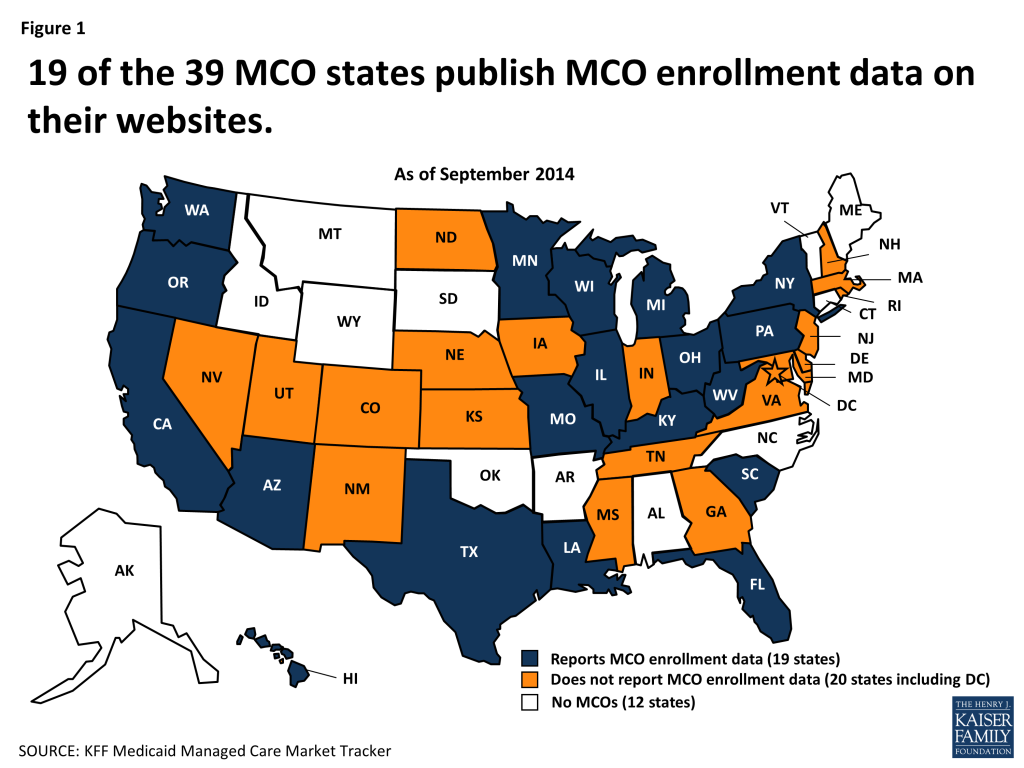
Report: Conclusion

BHP offers prospects of improved affordability for low-income residents, fiscal gains for some states, and reduced churning. Structured carefully to attract good risks and share them with the rest of the individual market via state-administered risk-adjustment systems, BHP could improve the individual market’s overall risk level, modestly lowering marketplace premiums. On the other hand, BHP would reduce marketplace size, potentially narrowing the range of QHP options and raising marketplace administrative charges.

In the coming years, some states may investigate a range of approaches to improving affordability of coverage for their low-income residents. Which approach is best—BHP, state supplementation of marketplace subsidies, or bolder alternatives permitted under state reform waivers that begin in 2017—will depend greatly on the unique circumstances facing each individual state.

The authors are grateful to Jessica Schubel of the CMS Center for Medicaid and CHIP Services, Christopher J. Truffer of the CMS Office of the Actuary, and Matthew Buettgens of the Urban Institute for their careful review of and comments on earlier drafts of this paper.

Endnotes

  1. Technically, a state contracts with a “standard health plan offeror” that sponsors a “standard health plan.” ↩︎
  2. See, e.g., Stan Dorn, Matthew Buettgens, Caitlin Carroll. Using the Basic Health Program to Make Coverage More Affordable to Low-Income Households: A Promising Approach for Many States. Washington, DC: Urban Institute, Sept. 2011, http://www.urban.org/UploadedPDF/412412-Using-the-Basic-Health-Program-to-Make-Coverage-More-Affordable-to-Low-Income-Households.pdf. ↩︎
  3. CMS. “Basic Health Program: State Administration of Basic Health Programs; Eligibility and Enrollment in Standard Health Plans; Essential Health Benefits in Standard Health Plans; Performance Standards for Basic Health Programs; Premium and Cost Sharing for Basic Health Programs; Federal Funding Process; Trust Fund and Financial Integrity.” Federal Register. Vol. 79, No. 48 (March 12, 2014): 14112-14151, http://www.gpo.gov/fdsys/pkg/FR-2014-03-12/pdf/2014-05299.pdf. ↩︎
  4. CMS: “Basic Health Program; Federal Funding Methodology for Program Year 2015.” Federal Register. Vol. 79, No. 48 (March 12, 2014): 13887 -13906, http://www.gpo.gov/fdsys/pkg/FR-2014-03-12/pdf/2014-05257.pdf. ↩︎
  5. 42 CFR 600.305. ↩︎
  6. 42 CFR 600.405. ↩︎
  7. 42 CFR 600.505. ↩︎
  8. 42 CFR 600.520(c). ↩︎
  9. 42 CFR 600.520(b). ↩︎
  10. 42 CFR 600.520(a). ↩︎
  11. 42 CFR 600.510(b). ↩︎
  12. 42 CFR 600.520(d). In addition, the state must provide consumers with access to information about premiums and cost-sharing at different income levels as well as the consequences if premiums are not paid. Such information must be made available upon request or through an Internet web site and at various key junctures, such as at enrollment and redetermination. 42 CFR 600.515. ↩︎
  13. IRS. Revenue Procedure 2014-37. http://www.irs.gov/pub/irs-drop/rp-14-37.pdf. ↩︎
  14. 42 CFR 600.415(a). ↩︎
  15. 42 CFR 600.415(b)(3). ↩︎
  16. 42 CFR 600.5 ↩︎
  17. 42 CFR 600.420(a). ↩︎
  18. 42 CFR 600.410. ↩︎
  19. See 45 CFR 92.36 (b) through (i). ↩︎
  20. 42 CFR 600.415(b)(1). These contracts must also include the provisions required for all state contracts that use federal grant funds, under 45 CFR 92.36(i). ↩︎
  21. 42 CFR 600.420(b). ↩︎
  22. 42 CFR 600.345. ↩︎
  23. 42 CFR 600.340(c) and (d). ↩︎
  24. 42 CFR 600.310(c). ↩︎
  25. 42 CFR 600.315. ↩︎
  26. 42 CFR 600.320(c). ↩︎
  27. 42 CFR 600.335. ↩︎
  28. 42 CFR 600.320(d). ↩︎
  29. 42 CFR 600.525. ↩︎
  30. 42 CFR 600.340. ↩︎
  31. 42 CFR 600.150. ↩︎
  32. 45 CFR 155.120(c)(2), cited in 42 CFR 600.165 ↩︎
  33. 42 CFR 600.310(a), 42 CFR 600.330. ↩︎
  34. 42 CFR 600.310(b). ↩︎
  35. 42 CFR 600.320(a). ↩︎
  36. 42 CFR 600.160. ↩︎
  37. 42 CFR 600.110. ↩︎
  38. 42 CFR 600.115 (c). ↩︎
  39. 42 CRF 600.110 (c). ↩︎
  40. 42 CFR 600.110; 42 CFR 600.120 (a). ↩︎
  41. 42 CFR 600.120. ↩︎
  42. 42 CFR 600.170. ↩︎
  43. 42 CFR 600.200. ↩︎
  44. 42 CFR 600.705. ↩︎
  45. 42 CFR 600.710. ↩︎
  46. 42 CFR 600.715. ↩︎
  47. 42 CFR 600.140. ↩︎
  48. 42 CFR 600.142. ↩︎
  49. These calculations assume that, in each case, premiums are rounded off to the nearest dollar. If instead calculations did not use rounding, the 2014 average premium would be $344.70, and the 2015 reference premium would be $372.79. One other comment is appropriate. Illinois might seek to apply a retrospective adjustment to premiums based on the state’s Medicaid coverage of pregnant women, outside the marketplace, to 200 percent FPL (and slightly higher). After the end of the 2015 BHP program year, actuaries could estimate the impact on Illinois’s individual market risk pool if pregnant women covered through BHP in 2015 had instead received coverage in the individual market. The result could be a slight increase in reference premiums, hence federal BHP funding for 2015. We could not estimate the amount of that increase here, however, and assume that Illinois opts not to make this retroactive adjustment. ↩︎
  50. FPL levels are based on the thresholds for calendar year 2014, since those will be in effect at the November 2014 start of 2015 open enrollment. ↩︎
  51. IRS. Revenue Procedure 2014-37. http://www.irs.gov/pub/irs-drop/rp-14-37.pdf. ↩︎
  52. As before, these numbers round off each product to the nearest dollar. Without such rounding, the PTC amount, before application of the IRF, would be $321.06; the IRF would reduce that amount to $304.75; and the final PTC component would 95 percent of the latter figure, or $289.51. ↩︎
  53. For an example of state-specific 2012 smoking rates by age, see Illinois’s rates as reported by CDC: http://apps.nccd.cdc.gov/brfss/age.asp?cat=TU&yr=2012&qkey=8161&state=IL. ↩︎
  54. To be more precise, the ratio between premiums charged to tobacco users and non-users shows the effect of tobacco use in raising claims costs above those that were covered by the premiums charged to non-tobacco users. ↩︎
  55. Dorn, Buettgens, Carroll, op cit. ↩︎
  56. Adele Shartzer, Genevieve M. Kenney, Sharon K. Long, Katherine Hempstead, and Douglas Wissoker. Who Are the Remaining Uninsured as of June 2014? July 29, 2014. Washington, DC: Urban Institute, http://hrms.urban.org/briefs/who-are-the-remaining-uninsured-as-of-june-2014.pdf. ↩︎
  57. Matthew Buettgens, Austin Nichols, and Stan Dorn. Churning Under the ACA and State Policy Options for Mitigation. Washington, DC: Urban Institute (prepared for the Robert Wood Johnson Foundation), June 2012, http://www.urban.org/UploadedPDF/412587-Churning-Under-the-ACA-and-State-Policy-Options-for-Mitigation.pdf. Other studies, which did not consider the impact of unaccepted offers of employer coverage, reached mixed results. Graves, John, Rick Curtis, and Jonathan Gruber, “Balancing Coverage Affordability and Continuity under a Basic Health Program Option,” New England Journal of Medicine. Vol. 365, no. 24 (2011): e44. Hwang, Ann, Sara Rosenbaum, and Benjamin D. Sommers, “Creation of State Basic Health Programs Would Lead to 4 Percent Fewer People Churning between Medicaid and Exchanges,” Health Affairs. Vol. 31, no. 6 (2012): 1314-20. This is a key methodological issue. In effect, BHP can raise the threshold of transition between Medicaid plans and marketplace plans from 138 percent FPL to 200 percent FPL. The impact of BHP on churning is thus greatly affected by the number of subsidy-eligible households near those two thresholds. Studies that fail to fully consider offers of employer coverage, which are more frequent at higher income levels, understate the potential impact of BHP in reducing churning. ↩︎
  58. A state might adjust BHP eligibility mid-year, based on new information from enrollees or reliable third-party data sources. Such adjustments do not increase the PTC component of federal BHP payments on the theory that mid-year adjustments of APTC claims would reduce tax-reconciliation offsets, thus increasing the PTC amounts received by BHP consumers had they enrolled in QHPs in the marketplace. Instead, as noted earlier, the tax reconciliation reduction to the PTC component is calculated based on the assumption that BHP eligibility is continuous so, in effect, APTCs would not have been modified mid-year. As a result, a state that chooses to implement 12-month continuous eligibility for BHP will not suffer any adverse effects in its receipt of federal funding. Costs would rise for a state that pays part of BHP expenses, however. Such a state would experience increased enrollment, hence increased expenditures, as a result of continuous eligibility. By the same token, increased enrollment would bring such a state a corresponding increase in federal BHP payments. ↩︎
  59. Among consumers with incomes between 139 and 400 percent FPL who are offered ESI, between 97 percent and 99.8 percent of such offers meet the ACA’s definition of affordability. Even among consumers in this income range who do not accept ESI offers, between 87 percent and 99 percent of the rejected offers are affordable. See the U.S. panel in table 1 in Matthew Buettgens, Stan Dorn, Habib Moody. Access to Employer-Sponsored Insurance and Subsidy Eligibility in Health Benefits Exchanges: Two Data-Based Approaches. Washington, DC: Urban Institute (prepared for the California HealthCare Foundation), Dec. 2012, http://www.urban.org/UploadedPDF/412721-Access-to-Employer-Sponsored-Insurance.pdf. ↩︎
  60. See Buettgens, Dorn and Moody, 2012. ↩︎
  61. An alternative approach would begin with QHP costs. For example, a recent BHP analysis for the state of Oregon took that approach. In extrapolating to the cost of using a Medicaid-based infrastructure, this analysis discounted QHP costs based on the estimated average difference between QHP and Medicaid provider reimbursements. Tim Courtney, Julia Lerche, Patrick Holland, Karan Rustagi, Matthew Buettgens, Stan Dorn, Jay Dev, and Hannah Recht. Oregon Basic Health Program Study, prepared for the Oregon Health Authority, Oregon Health Policy Research. October 2014, Clearwater, FL: Wakely Consulting Group and the Urban Institute. ↩︎
  62. For an example of how varying the details of BHP coverage can affect likely costs, see Matthew Buettgens, Stan Dorn, Jeremy Roth, Caitlin Carroll. The Basic Health Program in Utah. Washington, DC: Urban Institute, Nov. 2012, http://www.urban.org/UploadedPDF/412695-The-Basic-Health-Program-in-Utah.pdf. ↩︎
  63. Such premium increases could deter participation by healthier consumers, increasing average risk levels and the costs of those who do enroll. However, so long as BHP premiums remain significantly below those charged in the marketplace, this effect is likely to be much less significant than the fiscal contributions resulting from consumer premium payments. ↩︎
  64. If states believe that they can likely increase plan payments (and ultimately the associated provider reimbursements) above Medicaid levels but there is some uncertainty as to the amount that federal funding will support, some of the increase could be held back and paid as a bonus after the end of the year. The total statewide payment amount would be based on how the relevant uncertainties were resolved, and the amount received by each plan (and ultimately provider) would be in proportion to the total amount of care furnished to BHP consumers. ↩︎
  65. 79 Federal Register at 14133. ↩︎
  66. 42 CFR 600.705(e). ↩︎
  67. Dorn, Buettgens, Carroll, op cit. ↩︎
  68. Authors’ calculations, New York Department of Health. “2014 Open Enrollment Report,” NY State of Health: The Official Health Plan Marketplace, June 2014, Albany, NY. ↩︎
  69. For an estimate of the state’s non-elderly population, see U.S. Census Bureau, “Massachusetts,” State & County Quick Facts, Last Revised: Thursday, 27-Mar-2014 09:55:43 EDT, http://quickfacts.census.gov/qfd/states/25000.html. ↩︎
  70. A smaller marketplace also has less leverage to change health care delivery and financing to improve population health and quality while slowing cost growth. However, those important goals need not be compromised if the state acting as purchaser uses BHP among other state programs to accomplish those same objectives. In fact, if the marketplace is federally facilitated, BHP could enhance a state’s ability to implement delivery system and payment reforms, as noted in the text. ↩︎
  71. Massachusetts Commonwealth Connector (Connector). Commonwealth Choice Progress Report. December 13, 2007. ↩︎
  72. Connector. Connector Summary Report. December 11, 2008. https://www.mahealthconnector.info/portal/binary/com.epicentric.contentmanagement.servlet.ContentDeliveryServlet. ↩︎
  73. By July 2010, enrollment was approximately 36,000-37,000, of which 75 percent was in the non-group portion of the program. Connector. Report to the Massachusetts Legislature: Implementation of Health Care Reform, Fiscal Year 2010. November 2010. Total enrollment, in both small group and non-group portions of the program combined, has now levelled off at slightly higher than 40,000. Connector. Report to the Massachusetts Legislature: Implementation of Health Care Reform, Fiscal Year 2012. December 2012. ↩︎
  74. Matthew Buettgens, Stan Dorn, Jeremy Roth, Caitlin Carroll. “The Basic Health Program in Utah.” Washington, DC: Urban Institute, November 2012, http://www.urban.org/UploadedPDF/412695-The-Basic-Health-Program-in-Utah.pdf; Matthew Buettgens, Caitlin Carroll. “The ACA Basic Health Program in Washington State.” Washington, DC: Urban Institute, April 2012, updated August 2012, http://www.urban.org/UploadedPDF/412572-The-ACA-Basic-Health-Program-in-Washington-State.pdf. ↩︎
  75. Depending on the details of Medicaid coverage, it can either preclude BHP eligibility or, as a practical matter, make BHP enrollment less likely. As noted earlier, one can simultaneously qualify for (1) pregnancy-related Medicaid or categories of Medicaid eligibility that provide less than minimum essential coverage and (2) BHP or marketplace subsidies. However, enrollment in BHP or marketplace coverage is much less likely to take place, as a practical matter, with someone who is receiving Medicaid than with someone who is uninsured or previously paid for individual insurance. ↩︎
  76. States may also have the authority, in their role as regulators of insurance markets, to require carriers that serve the individual market and BHP to pool both sets of enrollees. ↩︎
  77. MNsure. MNsure Metrics Dashboard: Prepared for Board of Directors Meeting, April 16, 2014, https://www.mnsure.org/images/bd-2014-04-16-dashboard.pdf. ↩︎
  78. MNsure. MNsure Metrics Dashboard: Prepared for Board of Directors Meeting, July 16, 2014, https://www.mnsure.org/images/bd-2014-04-16-dashboard.pdf. ↩︎
  79. Authors’ calculations, MNSure. Provider Networks. (undated) https://www.mnsure.org/images/Individual-ServiceAreas-ProviderLook-up.xls. ↩︎
  80. Amy Burke, Arpit Misra, and Steven Sheingold. “Premium Affordability, Competition, and Choice in the Health Insurance Marketplace, 2014.” ASPE Research Brief, June 18, 2014, Washington, DC: Assistant Secretary for Planning and Evaluation, U.S. Department of Health and Human Services (ASPE/HHS). ↩︎
  81. MNSure. “Health Care Coverage and Plan Rates for 2015.” October 1, 2015, https://www.mnsure.org/images/2015-10-1-MNsure-healthcare-coverage-plan-rates.pdf. ↩︎
  82. According to HHS estimates of weighted average premiums by state, Minnesota’s premiums for the lowest-cost silver plan, second-lowest cost silver plan, and lowest-cost bronze plan were $192, $192, and $144 a month, respectively, well below those in any other state among the 48 (including the District of Columbia) for which data were reported. The state with next lowest such premiums for silver plans was Tennessee, with $235 and $245 weighted average premiums for the lowest and second-lowest-cost silver plans, respectively, 18 percent and 22 percent above Minnesota’s corresponding averages. The state with the second-least-expensive weighted-average lowest-cost bronze plan was Oklahoma, with $174 monthly premiums that exceeded Minnesota’s levels by 17 percent. Authors’ calculations. ASPE Office of Health Policy. “Table 4: Weighted Average Premiums, 48 States,” Health Insurance Marketplace Premiums for 2014. September 25, 2013, http://aspe.hhs.gov/health/reports/2013/marketplacepremiums/ib_premiumslandscape.pdf. ↩︎
  83. James Nord. “MNsure claims success in first year sign-ups.” Politics in Minnesota. April 4, 2014. http://politicsinminnesota.com/2014/04/mnsure-claims-success-in-first-year-sign-ups/. ↩︎
  84. Christopher Snowbeck. “MNsure: Twin Cities’ rates still look cheaper, but gap is shrinking in Minnesota,” Star Tribune, October 4, 2014, http://www.startribune.com/business/278072961.html. ↩︎
  85. Minnesota State Department of Commerce. “Commerce Announces Minnesota Health Insurance Rates – Lowest Rates in Nation for Second Year,” October 1, 2014, http://mn.gov/commerce/insurance/media/newsdetail.jsp?id=209-143493. ↩︎
  86. The other major source of funding is $5 million in unspent federal exchange grant funds from 2013. MNsure. “Preliminary MNsure Budget for Calendar Year 15,” March 12, 2014, http://www.lcc.leg.mn/mnsure/meetings/04092014/Bd-2014-03-12-Prelim2015Budget.pdf; Christopher Snowbeck, “MNsure board OKs 3.5 percent premium withholding,” TwinCities Pioneer Press. May 14, 2014, http://www.twincities.com/politics/ci_25762410/mnsure-board-oks-3-5-percent-premium-withholding; James Nord. “MNsure enrolls 170,000 Minnesotans as insurance deadline passes.” Politics in Minnesota. April 1, 2014, http://politicsinminnesota.com/2014/04/mnsure-enrolls-170000-minnesotans-as-insurance-deadline-passes/. ↩︎
  87. ACA Section 1332 permits state innovation waivers that allow major changes to ACA’s architecture, including marketplaces, PTCs, and CSRs. Such changes must be cost-neutral and may not increase consumer costs or reduce benefits, compared to the ACA without a waiver. These waivers may not be into effect until 2017. In this context, they might allow a state to use 100 percent, rather than 95 percent, of PTCs and CSRs to serve consumers through state-sponsored coverage that makes coverage more affordable for low-income consumers who include and potentially go beyond those who qualify for BHP. For the final regulation concerning the process for obtaining such waivers, see CMS, Department of the Treasury. “Application, Review, and Reporting Process for Waivers for State Innovation.” Federal Register. Vol. 77, No. 38, 11700- 11721, Monday, February 27, 2012, http://www.gpo.gov/fdsys/pkg/FR-2012-02-27/pdf/2012-4395.pdf, promulgating 31 CFR 33.100 et seq., 45 CFR 155.1300, et seq. ↩︎
  88. Massachusetts Executive Office of Health and Human Services (EOHHS). MassHealth: Roadmap to 2014. Revised May 2013, http://www.mass.gov/eohhs/docs/eohhs/cms-waiver/aca-transition-plan-draft.pdf; Letter from CMS Administrator Marilyn Tavenner to EOHHS Secretary John Polanowicz, October 1, 2013, http://www.mass.gov/eohhs/docs/eohhs/cms-waiver/ma-1115-amendment-approval-oct-1-2013.pdf. For Vermont’s premium costs, see Vermont Health Connect Subsidy Calculator, http://info.healthconnect.vermont.gov/tax_credit_calculator. ↩︎
  89. Brian Rosman, Health Care for All Massachusetts, personal communication, 2013. ↩︎
  90. ACA §1412(e). ↩︎
  91. Results from Kaiser Family Foundation Subsidy Calculator, https://modern.kff.org/interactive/subsidy-calculator/. ↩︎
News Release

Poll: Ebola Was a Bigger Story Than the Midterms

Published: Nov 24, 2014

In his latest column for The Wall Street Journal’s Think Tank, Drew Altman discusses what the public was more concerned about in November, Ebola or the results of the midterm elections.

All previous columns by Drew Altman are available online.