Medicaid Expansion in Michigan

Published: Jan 8, 2016

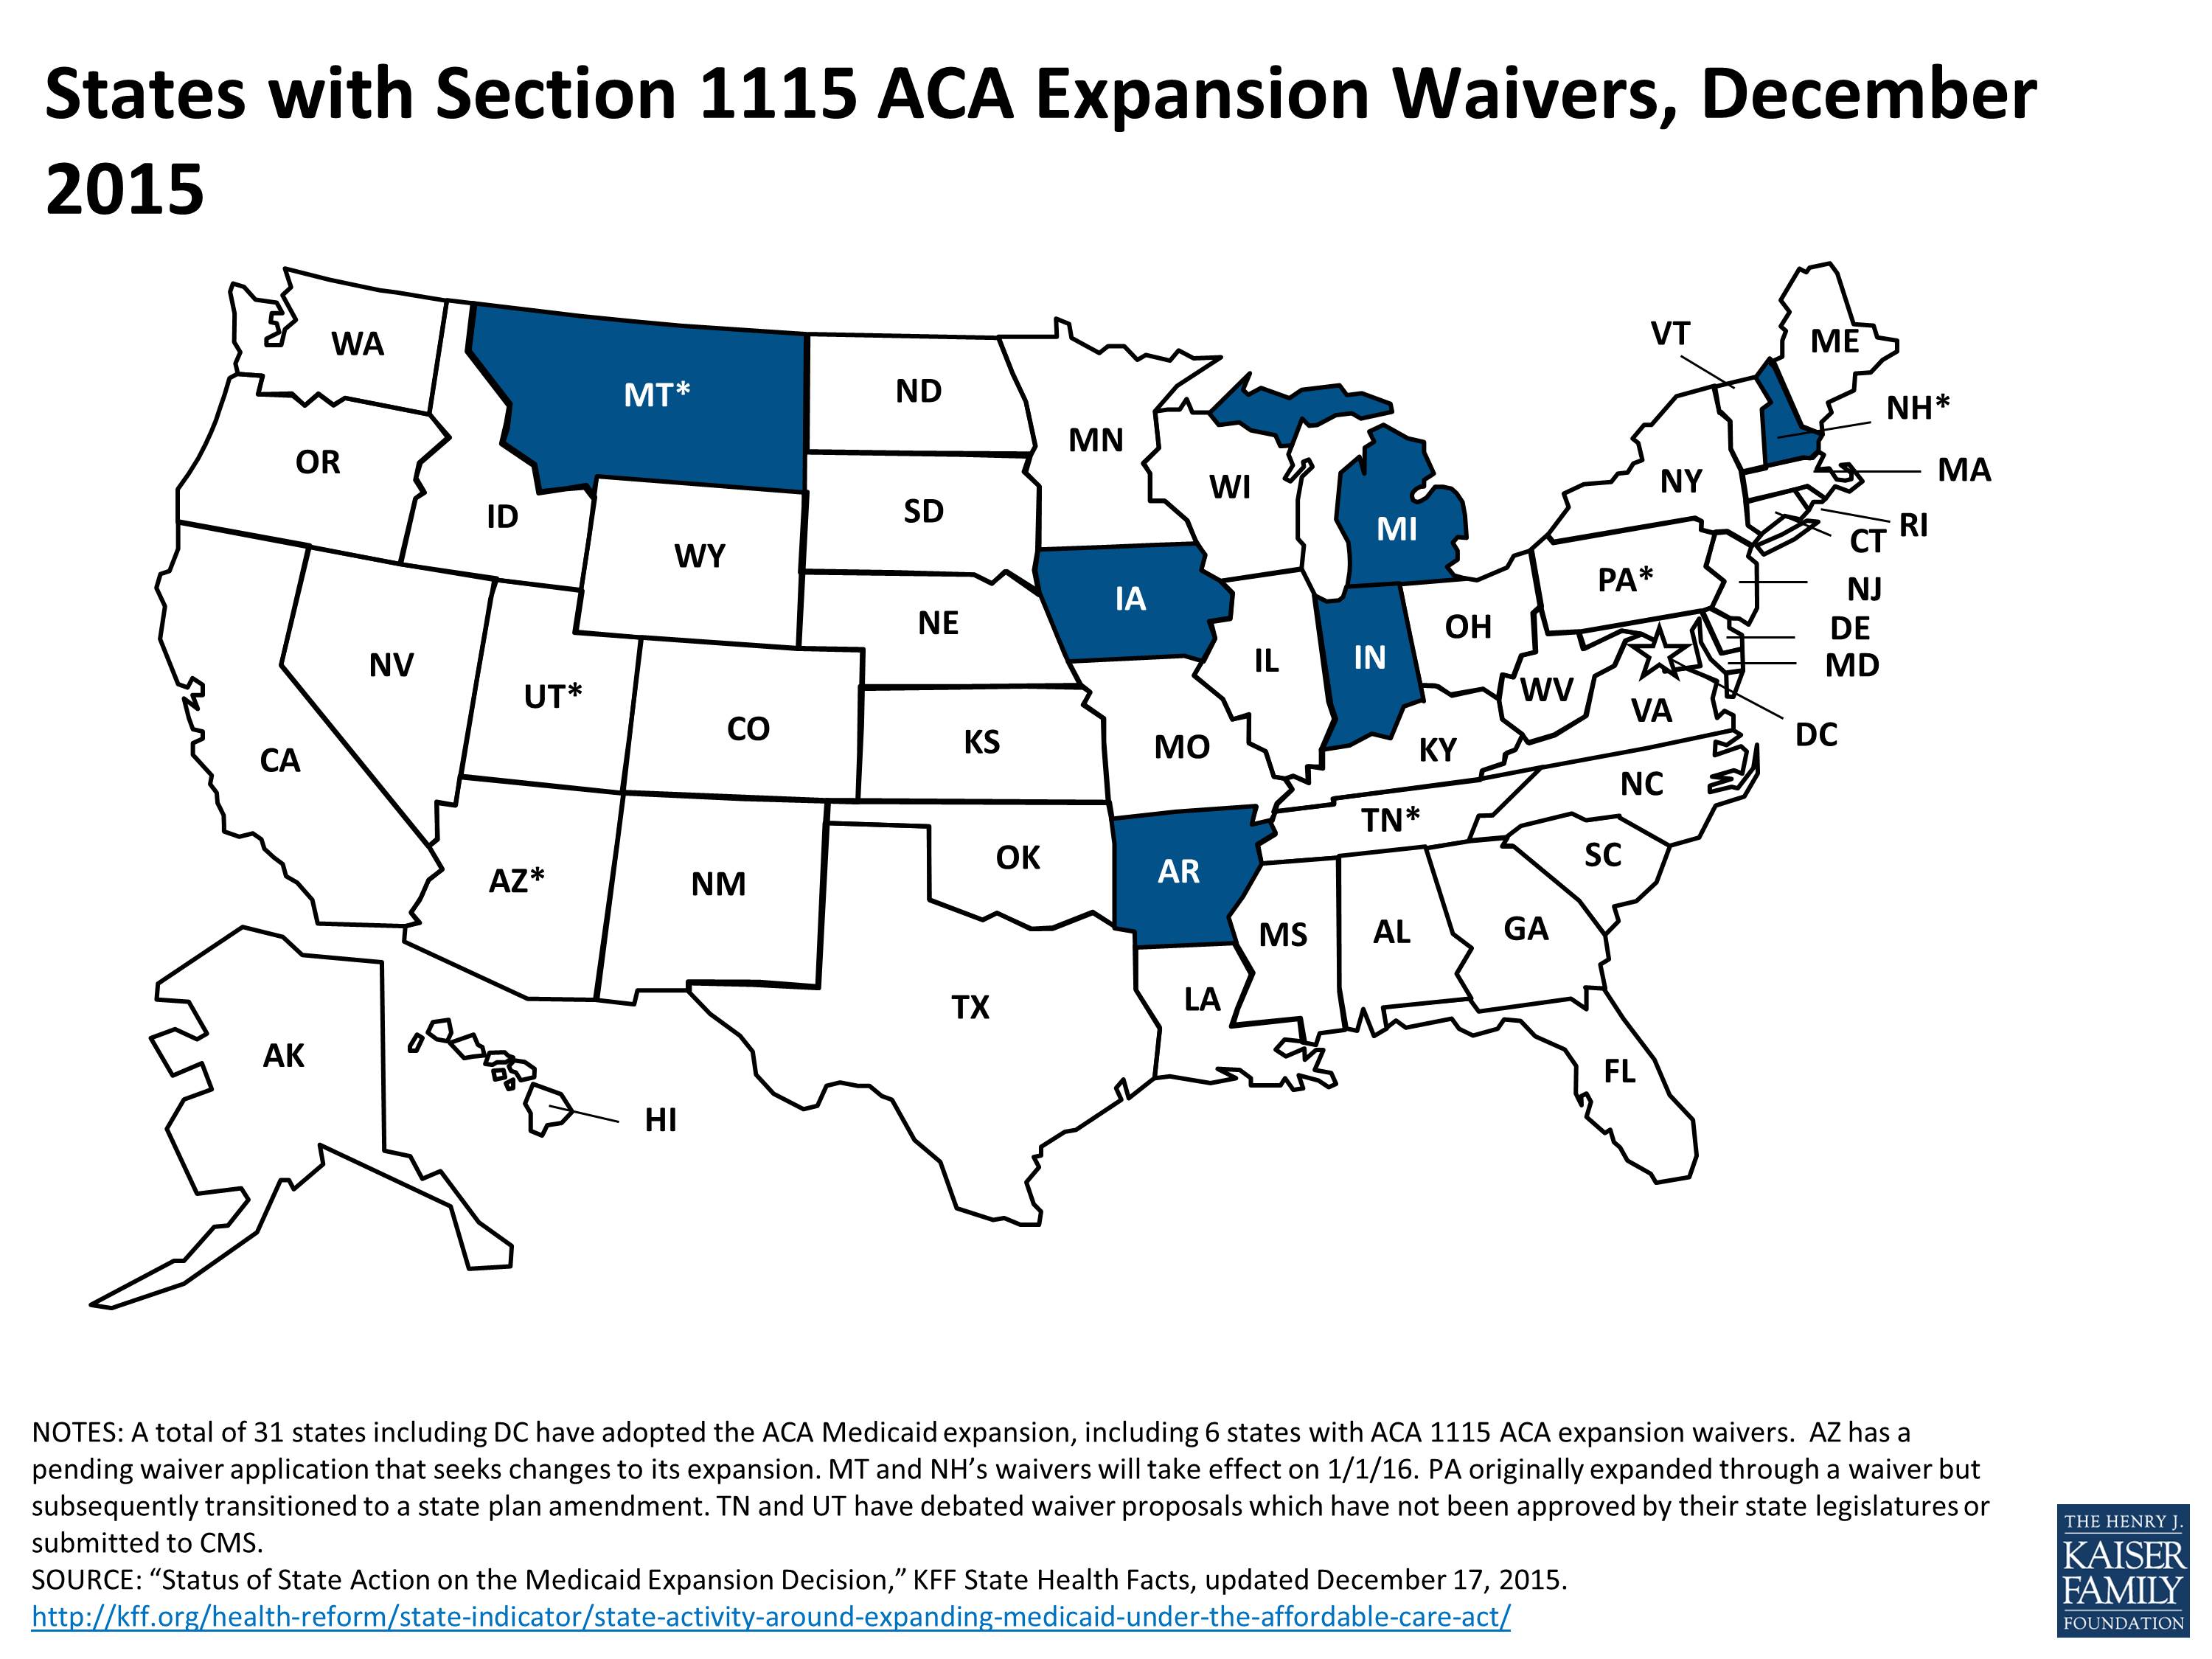
Michigan obtained approval from the Centers for Medicare and Medicaid Services (CMS) to implement the Affordable Care Act’s (ACA) Medicaid expansion through a Section 1115 demonstration waiver, called the “Healthy Michigan Plan.” The waiver initially was approved on December 30, 2013, and was implemented beginning April 1, 2014. On December 17, 2015, CMS approved Michigan’s waiver amendment, with new authorities to take effect in April 2018, after the expansion has been in effect for 48 months.1 

Under the current Healthy Michigan Plan, the state provides Medicaid coverage to all newly eligible adults with income up to and including 138% of the federal poverty level (FPL, $16,243 per year for an individual in 2015).2  An estimated 605,000 adults are enrolled in coverage through the waiver as of September, 2015.3  The waiver requires all beneficiaries to make monthly payments into a health savings account based on their average co-payments for services used in the previous six months (at state plan amounts). The waiver also requires beneficiaries from 100-138% FPL to make income-based monthly premium contributions to health savings accounts (2% of income). Health savings account payments can be reduced through compliance with specified healthy behaviors, and failure to pay copayments or premiums does not result in a loss of Medicaid eligibility. The waiver uses Michigan’s pre-existing Medicaid Managed Care Organizations (MCOs), and Pre-paid Inpatient Health Plans (PIHPs) for mental health and substance abuse services, to serve the newly eligible population.

Under the approved waiver amendment, beneficiaries between 100% and 138% FPL who are not medically frail will choose between two  coverage options as of April 2018:4 

  • Continued coverage through Medicaid managed care (the Healthy Michigan Plan); or
  • Medicaid premium assistance for Marketplace coverage through a Qualified Health Plan (QHP) (the Marketplace Option).

If beneficiaries choose Medicaid managed care, they will be required to complete a healthy behavior, or they are subject to transition to a QHP.  Beneficiaries above 100% FPL will face monthly premiums of up to 2% of income in both Medicaid managed care and QHPs, but failure to pay would not result in termination of eligibility.

As of December 2015, 31 states (including DC) have adopted the ACA’s Medicaid expansion. Michigan is one of six states (along with ArkansasIndiana, Iowa, Montana, and New Hampshire) that are implementing the Medicaid expansion using a Section 1115 demonstration waiver as of 2016. Pennsylvania had initially implemented the Medicaid expansion using a Section 1115 demonstration but later transitioned to a traditional Medicaid expansion using state plan authority.

Table 1 highlights the components in Michigan’s original waiver and is updated to reflect approved changes in the waiver amendment effective in April 2018.

Table 1: Healthy Michigan Plan as Amended on December 17, 2015
ElementHealthy Michigan Plan
Overview:  Covers childless adults ages 19 to 64 from 0 to 138% FPL statewide through Medicaid managed care. Requires copayments at state plan amounts for all beneficiaries, which may be reduced by participating in specified healthy behavior activities. Copayments are paid into health savings accounts monthly based on the average copayments for services used in the previous six months. Also requires beneficiaries 100-138% FPL to pay monthly premiums (2% of income) into health savings accounts. Beneficiaries cannot lose or be denied Medicaid eligibility, be denied health plan enrollment, or be denied access to services, and providers may not deny services, for failure to pay copays or premiums.

Beginning April 2018, beneficiaries with incomes above 100% FPL who are not medically frail will choose between 2 options:  continued coverage through Medicaid managed care or Marketplace QHP coverage with Medicaid premium assistance and cost-sharing subsidies.  Those choosing Medicaid managed care must meet a healthy behavior requirement after a one year grace period.

Duration:12/30/13 to 12/31/18. Enrollment began 4/1/14.
Coverage Groups:Adults ages 19-64 up to 138% FPL (childless adults 0-138% FPL, non-working parents from 37-138% FPL, and working parents from 64-138% FPL).5 
Exempt Populations:Noncitizens eligible only for emergency services, Program for All-Inclusive Care for the Elderly (PACE) participants, and individuals residing in intermediate care facilities for individuals with intellectual and developmental disabilities (ICFs/IDD).

As of April 2018, newly eligible adults above 100% FPL who are medically frail will remain in Medicaid managed care and are not subject to being transferred to a Marketplace QHP with Medicaid premium assistance if they do not complete a healthy behavior (described below).

Premiums:Beneficiaries above 100% FPL pay monthly premiums in the amount of 2% of income.

Beneficiaries cannot lose or be denied Medicaid eligibility, be denied health plan enrollment, or be denied access to services, and providers may not deny services for failure to pay premiums.  This applies to both those in Medicaid managed care and in QHP coverage, when that option becomes available in April 2018.

Cost-sharing and premiums cannot exceed 5% of household income.

Co-Payments:All demonstration beneficiaries have cost-sharing obligations based on their average prior 6 months of copays, billed at the end of each quarter. Cost-sharing is paid into health savings accounts and can be reduced through compliance with healthy behaviors. Amount of cost-sharing is based on state plan amounts and not changed from what would have been collected without the waiver.6   Cost-sharing for beneficiaries receiving coverage through Marketplace QHPs, when that option becomes available in April 2018, also will be limited to Medicaid state plan amounts.

Beneficiaries cannot lose or be denied Medicaid eligibility, be denied health plan enrollment, or be denied access to services, and providers may not deny services for failure to pay copays.  Copays in excess of 2% of income may be reduced through compliance with healthy behaviors. Cost-sharing and premiums cannot exceed 5% of household income. These provisions apply to beneficiaries in Medicaid managed care and those in  QHP coverage

Health Savings Account and Healthy Behavior Protocols:Health savings account and healthy behavior protocols were developed by the state and approved by CMS. The health savings account protocol describes the online accounts used by beneficiaries enrolled in MCOs and the healthy behavior protocol describes the services beneficiaries can engage in to decrease cost-sharing requirements and how engaging in these activities decreases their required cost-sharing. Changes to the protocols are also subject to CMS approval.7 

The state must submit a revised healthy behavior protocol to CMS by July 1, 2017 to implement the new healthy behavior requirements for non-medically frail beneficiaries with incomes above 100% FPL as of April 2018; these requirements cannot be more restrictive than those approved in August 2014.  These beneficiaries will have a one year grace period to complete a healthy behavior before they are subject to being moved from Medicaid managed care to Marketplace premium assistance.  Enrollees who move from Medicaid managed care to Marketplace premium assistance (for failure to complete a healthy behavior) will be automatically transitioned without additional eligibility determinations. Those who are newly enrolled or whose income increases above 100% FPL in or after April 2018, will have one year of Medicaid managed care coverage to complete a healthy behavior before they are subject to QHP enrollment. By April 1, 2017, the state must submit a transition plan for how the new waiver provisions will be implemented for beneficiaries above 100% FPL in April 2018.

Delivery Systems and Benefits:No Medicaid benefits are waived.

Medicaid MCOs and PIHPs (for mental health and substance abuse services) are used to serve the newly eligible population. Beneficiaries in Medicaid managed care receive an Alternative Benefits Plan (ABP) that contains the same benefits as the state plan benefit package.

Beneficiaries receiving Medicaid premium assistance for Marketplace coverage (beginning in April 2018) will receive an ABP that may be specific to the QHP in which they are enrolled.  Michigan will provide wrap-around coverage on a fee-for-service basis for non-emergency medical transportation, EPSDT and family planning services and supplies including access to out-of-network family planning providers for beneficiaries in QHPs.  These beneficiaries will also have access to at least one QHP in each service area that contracts with an FQHC/RHC. QHP enrollees may have prescription drug prior authorization requests decided within 72 hours instead of 24 hours, with a 72 hour supply dispensed in an emergency.

Those newly determined eligible for waiver coverage will initially be placed in fee-for-service until an MCO is selected or auto-assignment occurs.

Plan Choice andAuto-Assignment:Enrollment broker assists beneficiaries with MCO selection before relying on auto-assignment.

According to the waiver, MCO auto-assignment first takes into account beneficiary’s prior or current MCO history and then MCO affiliation of beneficiary’s historic providers.

In rural counties,8  there will only be one MCO. In all other areas, beneficiaries will have a choice of MCOs. There will be one PIHP per region.

MCO lock-in for 12 months after initial 90 days to switch plans.

The state will develop an auto-assignment methodology for QHP enrollment when that option becomes available in April 2018,

Financing:The budget neutrality limit calculations for the waiver are estimated to be the PMPM for each year increased by 5.1% multiplied by the number of eligible member months and adding the products across years and applying the federal share.
Cost-effectiveness:Michigan may apply state-developed measures in evaluating the cost-effectiveness of Marketplace premium assistance.
Evaluation:An evaluation design was developed by the state and approved by CMS to examine the following topics: uncompensated care costs, reduction in number of uninsured, impact on healthy behaviors and health outcomes, beneficiary views on impact of demonstration, impact of contribution requirements, and impact of health accounts.9  The state must submit a draft evaluation design update reflecting the waiver amendment provisions by April 2016.
  1. The state legislation authorizing Medicaid expansion called for the termination of the Healthy Michigan Plan on April 30, 2016 if the state failed to obtain approval of the waiver amendment by December 31, 2015.  Mich. Comp. Laws § 400.105d, http://www.legislature.mi.gov/(S(w0bdpchgm1olcvuemkvl5bic))/mileg.aspx?page=getObject&objectName=mcl-400-105d. ↩︎
  2. Marilyn Tavenner, Administrator of the Centers for Medicare and Medicaid Services, Waiver Approval Letter, December 30, 2013, accessed on January 3, 2014, http://www.michigan.gov/documents/snyder/Healthy_Michigan_1115_Demonstration_Approval_12302013_443466_7.pdf. ↩︎
  3. Healthy Michigan Section 1115 Demonstration, Centers for Medicare and Medicaid Services, Special Terms and Conditions Approved December 17, 2015.    https://www.michigan.gov/documents/snyder/Healthy_Michigan_1115_Demonstration_Approval_12302013_443466_7.pdf ↩︎
  4. Healthy Michigan Section 1115 Demonstration, Centers for Medicare and Medicaid Services, Special Terms and Conditions Approved December 17, 2015.    https://www.michigan.gov/documents/snyder/Healthy_Michigan_1115_Demonstration_Approval_12302013_443466_7.pdf ↩︎
  5. Childless adults ages 19-64 from 0 to 35% FPL eligible for Michigan’s limited benefit package covered by the Adult Benefits Waiver that existed prior to initial implementation of the Healthy Michigan Plan transitioned to full Medicaid coverage as part of the new expansion group. ↩︎
  6. Beneficiaries are subject to co-pays according to the current state plan (inpatient hospital admission (except emergent admission), $50; non-emergency use of the ER, brand-name drugs, dental visit, or hearing aid, $3; physician, podiatry, or vision office visits, $2; outpatient hospital or chiropractic visit or generic drugs, $1). ↩︎
  7. Health savings account protocol is Attachment E, and the healthy behaviors protocol is Attachment F of the waiver’s Special Terms and Conditions. ↩︎
  8. Counties considered rural are Alger, Baraga, Chippewa, Delta, Dickinson, Gogebic, Houghton, Iron, Keweenaw, Luce, Mackinac, Marquette, Menominee, Ontonagon, and Schoolcraft. ↩︎
  9. Evaluation plan is Attachment B of the waiver’s Special Terms and Conditions. ↩︎
News Release

How Health-Care Bills Hinder Millions of Americans

Published: Jan 5, 2016

In his latest column for The Wall Street Journal’s Think Tank, Drew Altman examines the problems many Americans with health insurance are having paying medical bills based on a new Kaiser-New York Times Survey, and discusses why the issue of the adequacy of insurance coverage is gaining traction.

All previous columns by Drew Altman are online.

News Release

Visualizing Health Policy: Recent Trends in Employer-Sponsored Health Insurance Premiums

Published: Jan 5, 2016

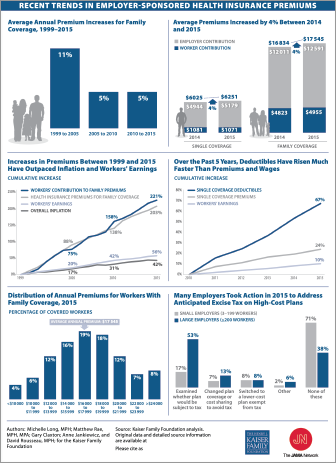
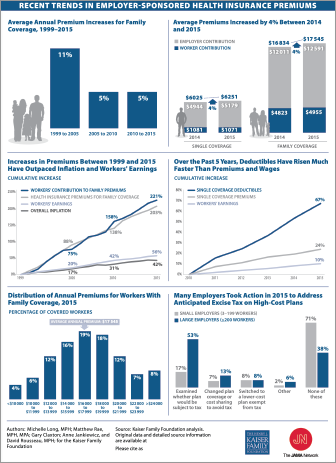
This Visualizing Health Policy infographic charts recent trends in employer-sponsored health insurance premiums. Between 1999 and 2015, premiums increased by 203 percent, outpacing both inflation and workers’ earnings. However, growth of premiums for family coverage slowed toward the end of that time period, from an average of 11 percent a year between 1999 and 2005, to 5 percent between 2005 and 2015. In recent years, deductibles rose faster than both premiums and wages, with the average premium for single and family coverage increasing 4 percent between 2014 and 2015. There is considerable variation in the premiums at different firms; 8 percent of covered workers are enrolled in a family plan worth more than $24,000 and 4 percent are in plans worth less than $10,000 annually. Over half of large employers conducted an analysis to determine whether they offered a plan which would be subject to the excise tax on high cost health plans slated to take effect in 2018.

jama_2015dec_trends_in_insurance_premiums-1.png

Visualizing Health Policy is a monthly infographic series produced in partnership with the Journal of the American Medical Association (JAMA). The full-size infographic is freely available on JAMA’s website and is published in the print edition of the journal.

Visualizing Health Policy: Recent Trends in Employer-Sponsored Health Insurance Premiums

Published: Jan 5, 2016

This Visualizing Health Policy infographic charts recent trends in employer-sponsored health insurance premiums. Between 1999 and 2015, premiums increased by 203 percent, outpacing both inflation and workers’ earnings. However, growth of premiums for family coverage slowed toward the end of that time period, from an average of 11 percent a year between 1999 and 2005, to 5 percent between 2005 and 2015. In recent years, deductibles rose faster than both premiums and wages, with the average premium for single and family coverage increasing 4 percent between 2014 and 2015.  There is considerable variation in the premiums at different firms; 8 percent of covered workers are enrolled in a family plan worth more than $24,000 and 4 percent are in plans worth less than $10,000 annually.  Over half of large employers conducted an analysis to determine whether they offered a plan which would be subject to the excise tax on high cost health plans slated to take effect in 2018.

jama_2015dec_trends in insurance premiums

Visualizing Health Policy is a monthly infographic series produced in partnership with the Journal of the American Medical Association (JAMA). The full-size infographic is freely available on JAMA’s website and is published in the print edition of the journal.

View Source Slides

News Release

New Kaiser/New York Times Survey Finds One in Five Working-Age Americans With Health Insurance Report Problems Paying Medical Bills

Published: Jan 5, 2016

Among the Insured with Medical Bill Problems, 63% Report Using Up Most or All Their Savings and 42% Took on an Extra Job or Worked More Hours

Half of People Without Health Insurance Report Problems With Medical Bills, and They Face Similar Financial and Personal Consequences As Those With Insurance

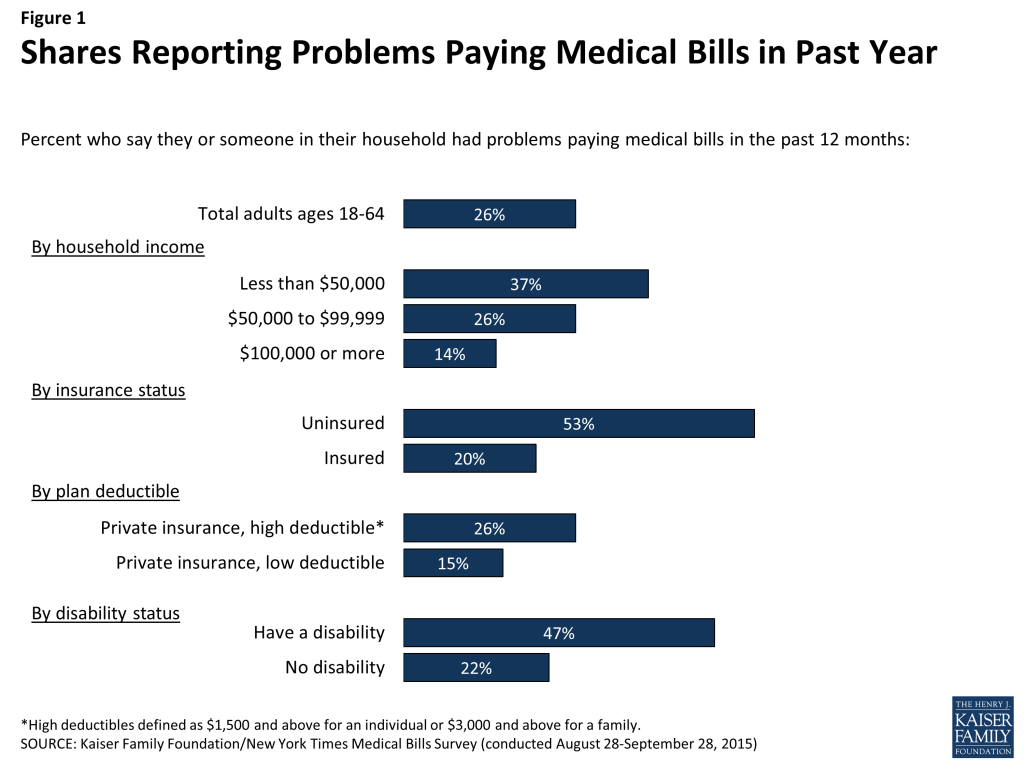
Among people with health insurance, one in five (20%) working-age Americans report having problems paying medical bills in the past year that often cause serious financial challenges and changes in employment and lifestyle, finds a comprehensive new Kaiser Family Foundation/New York Times survey. As expected, the situation is even worse among people who are uninsured: half (53%) face problems with medical bills, bringing the overall total to 26 percent.

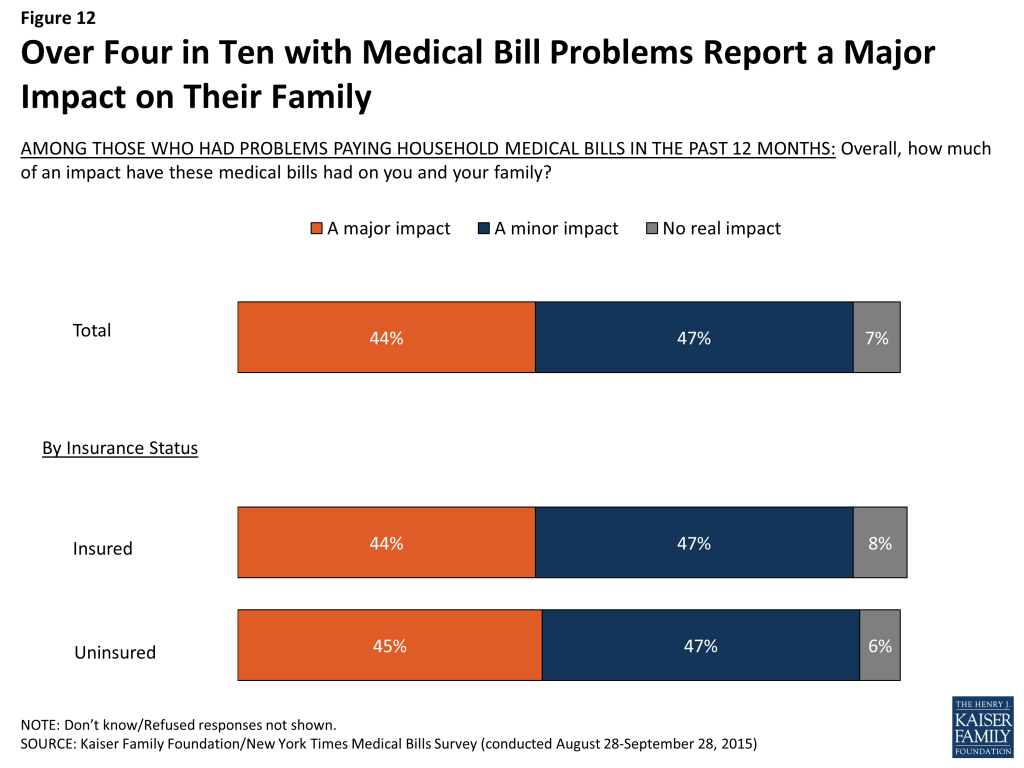
While insurance can protect people from problem medical bills, the survey suggests that those with employer coverage or other insurance suffer similar consequences as the uninsured once such problems occur. Among those facing problems with medical bills, almost identical shares of the insured (44%) and uninsured (45%) say the bills had a major impact on their families.

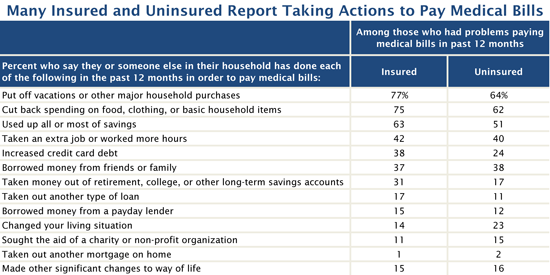
People with insurance who face problem medical bills also report a wide range of consequences and sacrifices during the past year as a result, including delaying vacations or major household purchases (77%), spending less on food, clothing and basic household items (75%), using up most or all their savings (63%), taking an extra job or working more hours (42%), increasing their credit card debt (38%), borrowing money from family or friends (37%), changing their living situation (14%), and seeking the aid of a charity (11%). These shares generally are as large as or larger than the shares among uninsured people with problem medical bills.

Medical Debt Table for Email Alert v1

Overall, 62 percent of those who had medical bill problems say the bills were incurred by someone who had health coverage at the time (most often through an employer). Of those who were insured when the bills were incurred, three-quarters  (75%) say that the amount they had to pay for their insurance copays, deductibles, or coinsurance was more than they could afford.

People with health insurance who have problems with medical bills also report skipping or putting off other health care in the past year because of the cost, such as postponing dental care (62%), skipping doctor-recommended tests or treatments (43%), or not filling a prescription (41%). In general, people with medical bill problems are two to three times as likely to report each of these problems as those without problems paying medical bills.

The Kaiser/Times survey provides an in-depth, quantitative look at the extent and causes of Americans’ medical-debt issues and their impact on people’s lives, families, finances and access to health care.  The New York Times is reporting on the findings this week, and the Foundation is issuing a report detailing the survey’s results and implications.

Other findings include:

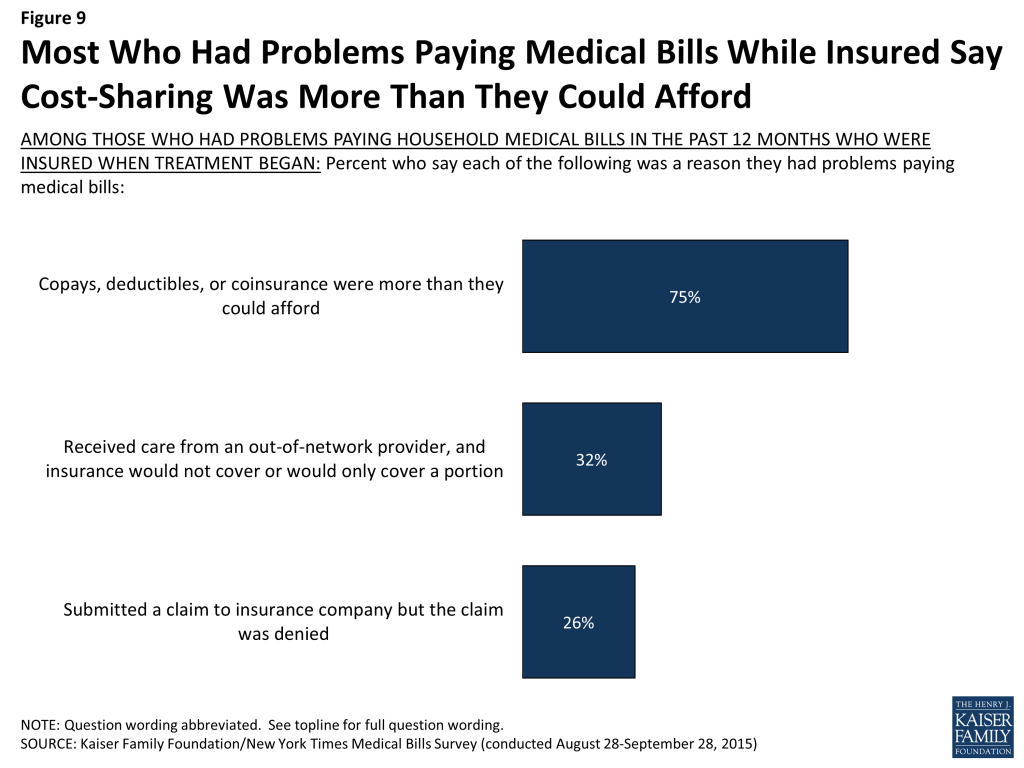
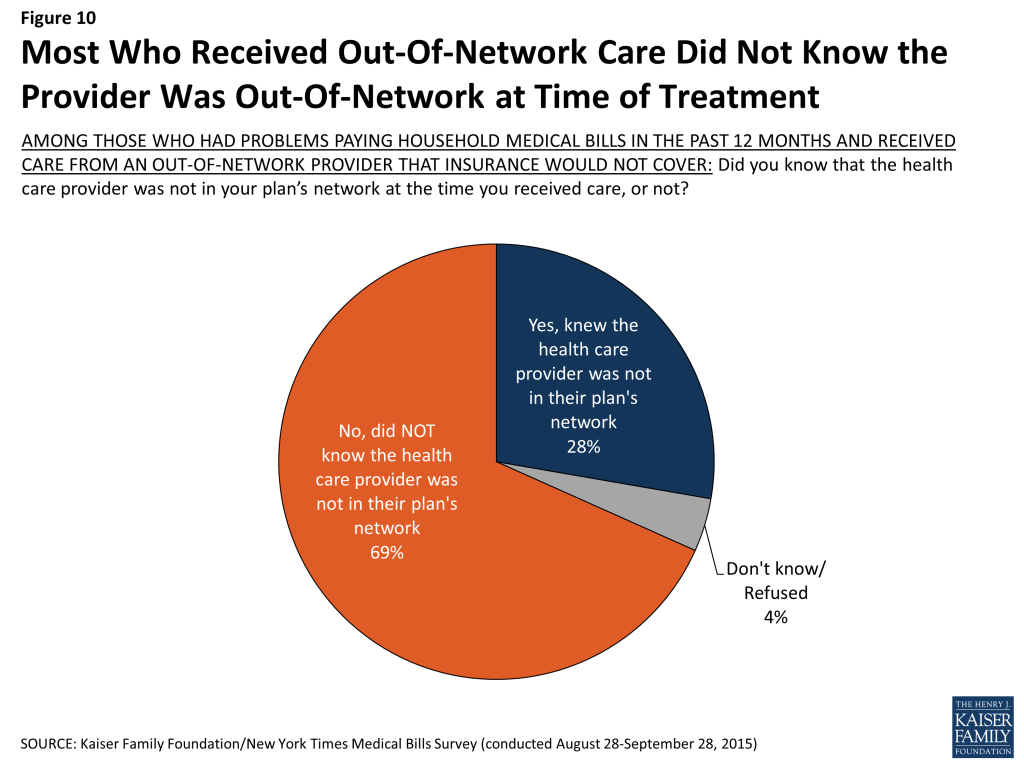
  • Among the insured with problem medical bills, a quarter (26%) say they received unexpected claim denials; and about a third (32%) say they received care from an out-of-network provider that their insurance wouldn’t cover. The out-of-network charges were a surprise for a large majority: 69 percent were unaware that the provider was not in their plan’s network when they received the care.
  • Among those with private insurance, those in higher deductible plans are more likely to report medical bill problems than those in plans with lower deductibles (26% versus 15%).
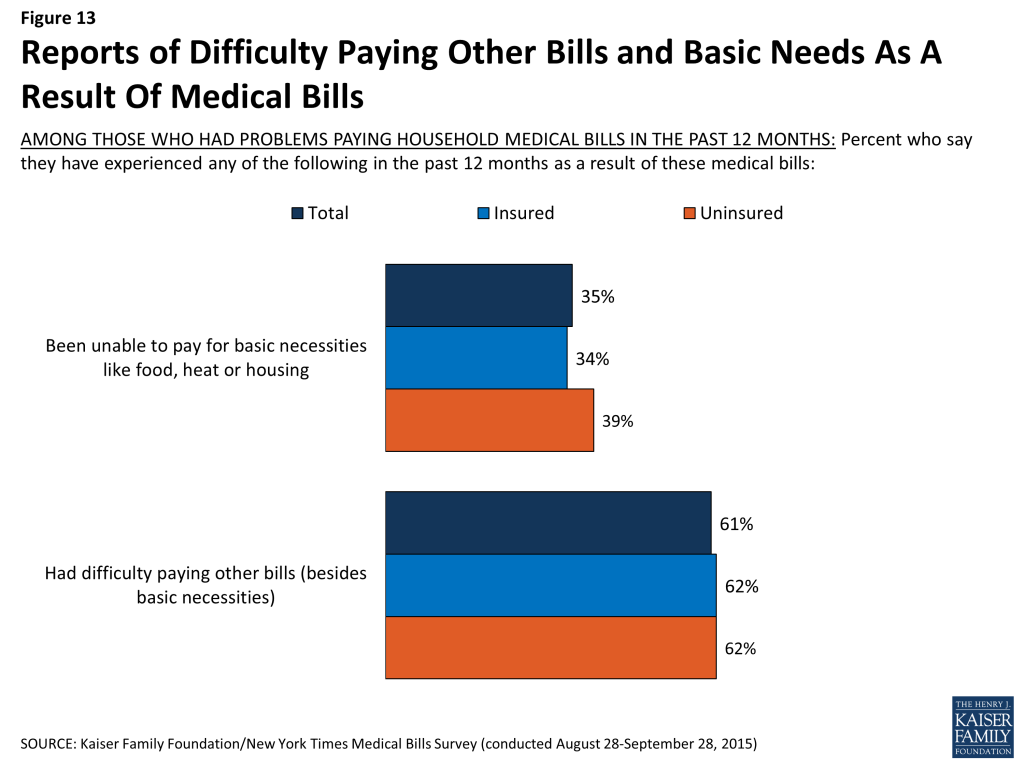
  • Most (61%) of those with medical bill problems say they’ve had difficulty paying other bills as a result of their medical debt, and more than a third (35%) say they were unable to pay for basic necessities like food, heat, or housing. Almost six in ten of those with problems paying medical bills (58%) say they’ve been contacted by a collection agency in the past year. Those who faced medical bill problems with and without insurance are about equally likely to report each of these situations.
  • Among those with medical bill problems, 31 percent say the total reached at least $5,000, including 13 percent who say the total reached at least $10,000. Significant shares also report having problems with smaller totals, including one in four (24%) who say their bills totaled less than $1,000.
  • Relatively small amounts pose major problems for some families because they are living paycheck to paycheck. Of all those with medical bill problems, most (61%) say they are either just meeting their basic expenses (43%) or aren’t able to do so (18%). While people without health insurance are more likely to find themselves in such circumstances, more than half (55%) of those with insurance who have medical bill problems say they are either just getting by or don’t have enough to make ends meet.
  • People who have had difficulty paying medical bills are more likely to report taking a variety of extra steps to negotiate prices or shop around for health care than their peers. However, for those with medical bill problems, seven in ten (69%) of those who shopped around for a lower price say it was difficult to find out how much they would have to pay, and a similar share (67%) of those who attempted to negotiate price with a provider say their efforts were unsuccessful.

Teams from the Foundation and The Times worked together to develop the questionnaire and analyze the data. Each organization is solely responsible for the content it publishes based on the survey. The survey was conducted from Aug. 28 through Sept. 28 among a national probability-based sample of 2,575 adults ages 18-64, including 1,204 who reported problems paying medical bills and 1,371 who did not.  Interviews were conducted online and by telephone in English and Spanish. The margin of sampling error is plus or minus 3 percentage points for the full sample, and plus or minus 4 percentage points both for those with and without problems paying medical bills. Among those with medical bill problems, the margin of sampling error is plus or minus 5 percentage points for those with insurance and plus or minus 8 percentage points for those without insurance.

The Burden of Medical Debt: Results from the Kaiser Family Foundation/New York Times Medical Bills Survey

Authors: Liz Hamel, Mira Norton, Karen Pollitz, Larry Levitt, Gary Claxton, and Mollyann Brodie
Published: Jan 5, 2016

Overview

This Kaiser Family Foundation/New York Times survey provides an in-depth look at the experiences of Americans ages 18-64 who say they or someone in their household had problems paying medical bills in the past year.  The survey explores the causes of medical bill problems and the impacts they have on individuals and their families, finances, and access to health care.  To provide context, a shorter companion survey was conducted among those who do not report having medical bill problems.

News Release

Report

Read The New York Times Coverage

Key Findings: Introduction

The cost of health care has long been a concern in the U.S., on both a national and a personal level. For individuals, this concern plays out most prominently among those who face difficulty paying medical bills or who are unable to pay such bills at all. For people who are uninsured, lack of coverage not only hinders access to care but also leaves them vulnerable to medical bills that cannot be paid. While insurance provides financial protection, that protection can be incomplete for a number of reasons, including rising deductibles and other forms of cost-sharing, out-of-network charges, the growing complexity of insurance that can leave consumers with unexpected bills, and the fact that many people have only modest financial assets to cover medical expenses.

Previous Kaiser surveys have found that about a quarter of people say they or someone in their household had problems paying medical bills in the past year, and a 2014 Kaiser report provided a qualitative look at some of the circumstances and consequences of unpaid medical bills through interviews with people who had sought credit counseling for medical debt.1  But to date, there has been little research providing a quantitative look at the causes of medical bill problems and the impacts they have on people’s families, their finances, and their access to health care.

To fill this gap, the Kaiser Family Foundation and The New York Times conducted an in-depth survey with 1,204 adults ages 18-642  who report that they or someone in their household had problems paying or an inability to pay medical bills in the previous 12 months. To provide context, we also conducted a shorter companion survey with 1,371 adults ages 18-64 who do not report having medical bill problems.

Key Findings: Section 1: Who Has Medical Bill Problems And What Are The Contributing Factors?

Prevalence of problems paying medical bills among different groups

Overall, about a quarter (26 percent) of U.S. adults ages 18-64 say they or someone in their household had problems paying or an inability to pay medical bills in the past 12 months. Though certain groups are more likely than others to report such problems, the survey finds that people from all walks of life can and do experience difficulty paying medical bills.

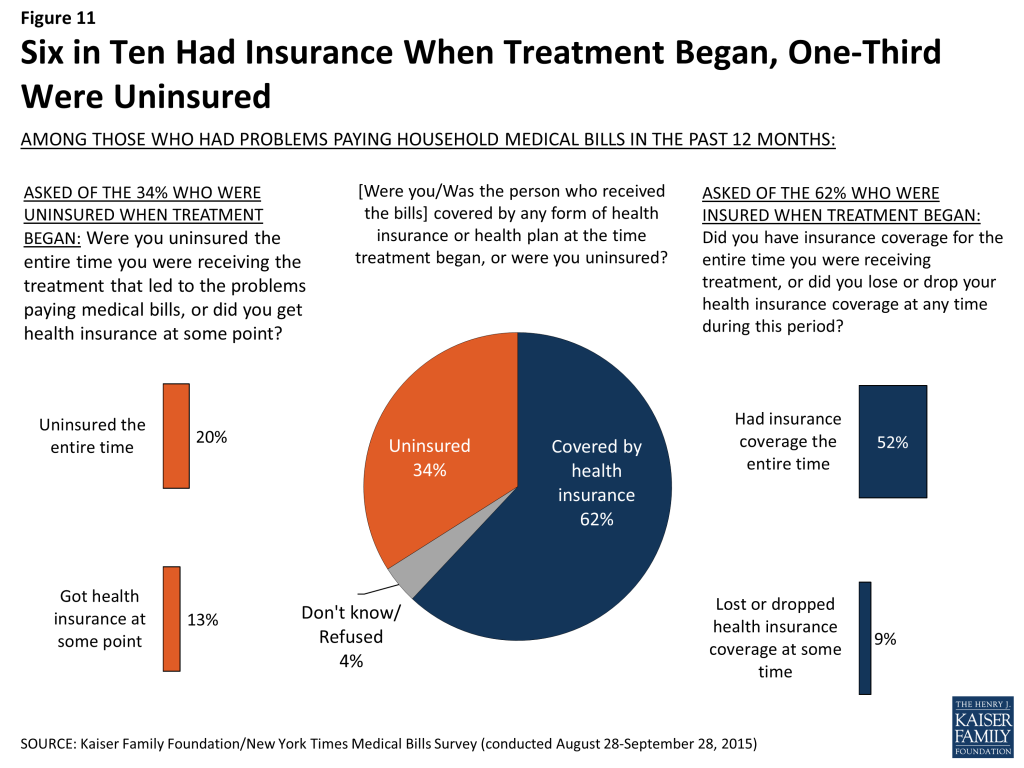
Insurance status has a strong association with medical bill difficulties, with over half (53 percent) of the uninsured saying they had problems paying household medical bills in the past year. However, as previous surveys have shown, insurance is not a panacea against these problems. Roughly one in five of those with health insurance through an employer (19 percent), Medicaid (18 percent), or purchased on their own (22 percent) also report problems paying medical bills. In fact, overall among all people with household medical bill problems, more than six in ten (62 percent) say the person who incurred the bills was covered by health insurance, while a third (34 percent) say that person was uninsured. Among those with private insurance (either through an employer or self-purchased), their plan’s deductible makes a difference in ability to afford health care bills, with those in higher deductible plans more likely to report medical bill problems than those in plans with lower deductibles3  (26 percent versus 15 percent).

Not surprisingly, problems paying medical bills are also more common among those with lower or moderate incomes. Just under four in ten (37 percent) of those with annual household incomes below $50,000 report experiencing such problems, compared with about a quarter (26 percent) of those with moderate incomes between $50,000 and $100,000, and 14 percent of those in the highest income category.4  Those with poorer health status and greater health needs are also more likely to report facing medical bill problems. This is true among those who say they have a disability that prevents them from participating fully in daily activities (47 percent report problems versus 22 percent of those without such a disability), among those who rate their own health as fair or poor (45 percent versus 22 percent of those in excellent, very good, or good health), and among those who say they’re receiving regular or ongoing medical treatment for a chronic condition (34 percent versus 23 percent of those who are not receiving such treatment).

Figure 1: Shares Reporting Problems Paying Medical Bills in Past Year

Beyond insurance, income, and health status, several other demographic differences emerge in the rates at which people report experiencing problems paying medical bills. Women are somewhat more likely than men to report having such problems (29 percent versus 23 percent), as are adults under age 30 compared with those ages 30-64 (31 percent versus 24 percent) and those with children in their household versus those without (29 percent versus 24 percent). Looking by region, residents of the South have the highest share reporting problems (32 percent), while those in the Northeast have the lowest (18 percent). Likely due to differences in income and insurance status, those without a college degree are more likely than college graduates to report medical bill problems, as are Blacks and Hispanics compared with whites. (See Appendix Table 1 for more detail).

To explore these relationships further, we used a statistical technique called logistic regression analysis to isolate which demographic characteristics are the strongest predictors of problems paying medical bills when holding other factors constant. In that analysis, income, insurance status, and all 3 measures of health status (being in fair or poor health and having a disability or chronic condition) had a significant and strong association with problems paying medical bills, even after accounting for the influence of the other demographic factors. Having a private insurance plan with a high deductible also remained a significant predictor, even after controlling for other factors, as did being under age 25 and having minor children at home. Gender, race, and ethnicity were not statistically significant predictors of problems paying medical bills when controlling for other factors, suggesting that the higher rates of reported problems among women, Blacks, and Hispanics have to do with underlying differences in income and insurance status between these groups and their counterparts.

Circumstances leading to problems paying medical bills

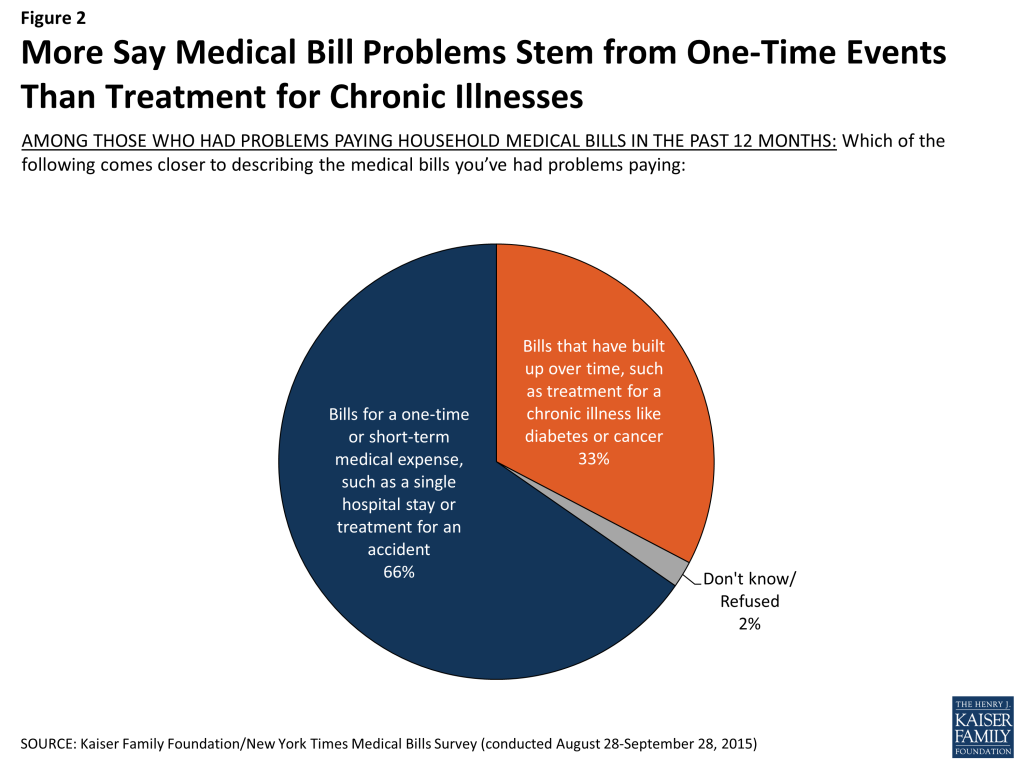
Among those who report problems paying medical bills, two-thirds (66 percent) say the bills were the result of a one-time or short-term medical expense such as a hospital stay or an accident, while 33 percent cite bills for treatment of chronic conditions that have built up over time. These shares are similar for people who faced medical bill problems with and without insurance coverage.

Figure 2: More Say Medical Bill Problems Stem from One-Time Events Than Treatment for Chronic Illnesses

Many are still struggling to pay off bills for treatment that occurred in the past. Over six in ten (63 percent) say they are no longer receiving the medical treatment that led to their problems paying bills, and almost half (46 percent) say the illness or injury that led to the bills occurred more than one year ago.

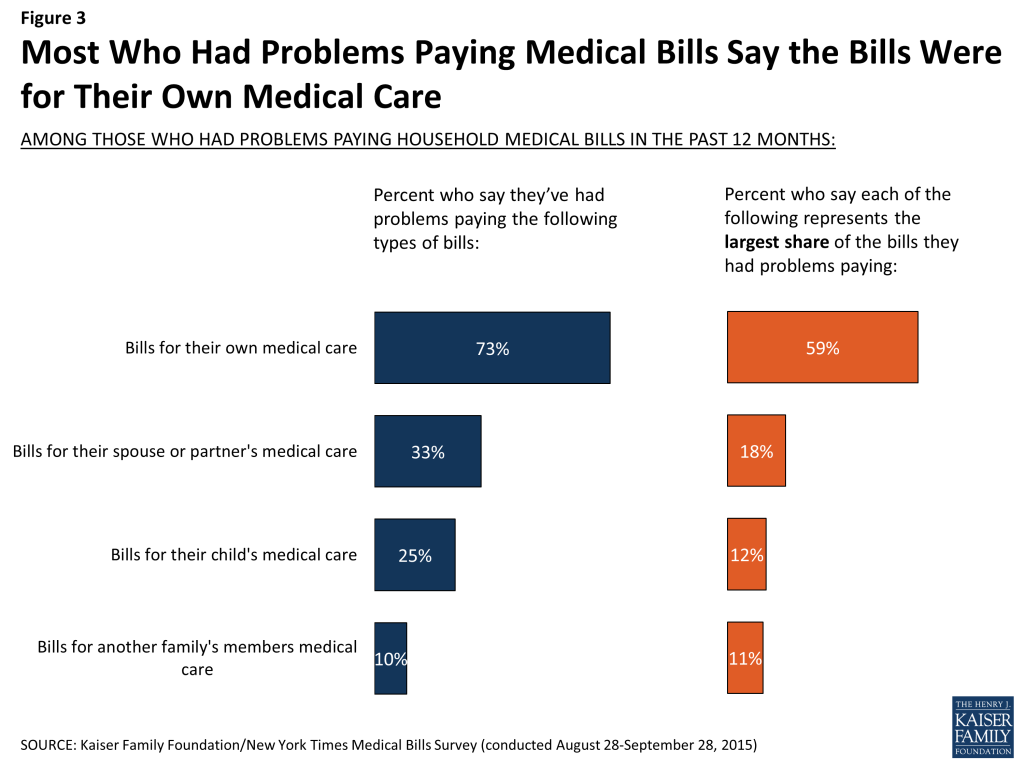
Most of those with medical bill problems say the bills are the result of their own or their spouse’s medical care. One-quarter (44 percent of those with children under age 18 in their household) say they had problems paying a child’s medical bills, and 10 percent cite another family member. Thirty-five percent say they’ve had problems paying bills for more than one family member.

Figure 3: Most Who Had Problems Paying Medical Bills Say the Bills Were for Their Own Medical Care

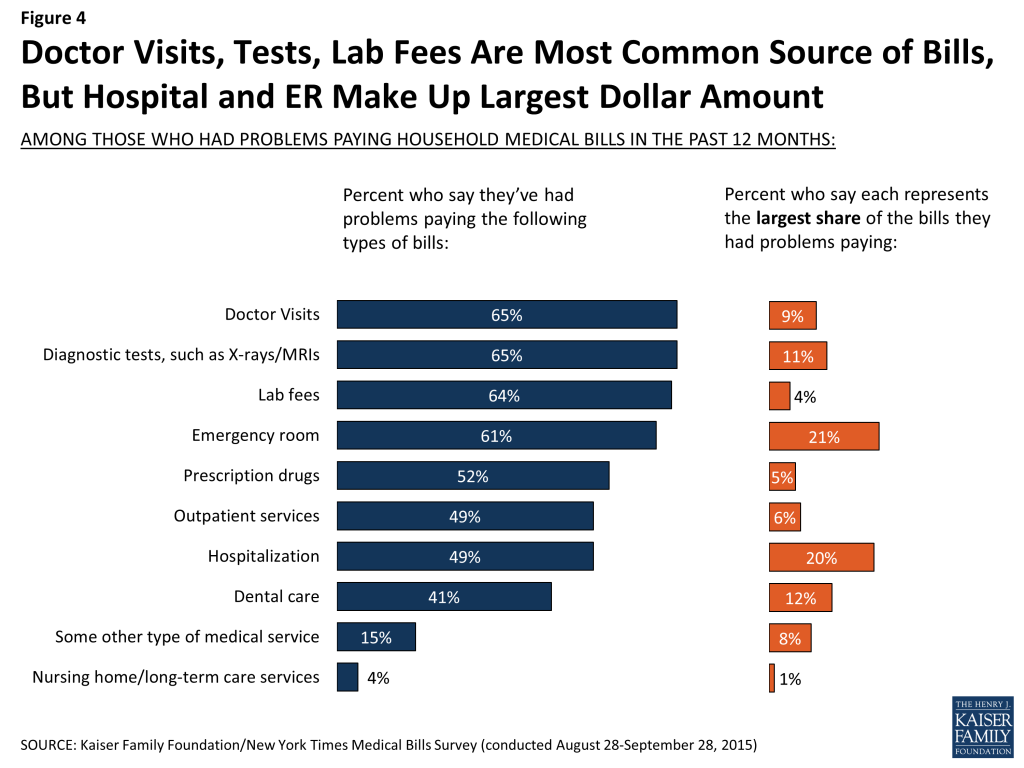
The medical bills people report facing also come from a variety of sources. More than six in ten of those who had difficulty paying say the medical bills were for doctor visits (65 percent), diagnostic tests (65 percent), lab fees (64 percent) and emergency room visits (61 percent). About half say they had problems with bills for prescription drugs (52 percent), hospitalization (49 percent), and outpatient services (49 percent), while four in ten (41 percent) report problems with bills for dental care. Nearly all of those who had problems paying medical bills (91 percent) report having trouble with bills from at least two of these categories, and over half (53 percent) had problems with bills from five or more different sources.

Asked which types of bills made up the largest share of what they owed, the most common responses are emergency room visits (21 percent) and hospitalization (20 percent), followed by dental care (12 percent) and diagnostic tests like X-rays and MRIs (11 percent). In general, people who had problems paying medical bills with or without insurance report having similar types of bills, however the uninsured are more likely than the insured to say that emergency room bills were the largest source of their bill problems (35 percent versus 15 percent), while those with insurance are more likely than the uninsured to point to diagnostic tests like X-rays and MRIs (14 percent versus 6 percent).

Figure 4: Doctor Visits, Tests, Lab Fees Are Most Common Source of Bills, But Hospital and ER Make Up Largest Dollar Amount

When asked to describe in their own words the illness or injury that led to their medical bill problems, people give a variety of responses. Overall, the largest share (36 percent) name a specific disease, symptom or condition like heart disease or gastrointestinal problems, followed by issues related to chronic pain or injuries (16 percent), accidents and broken bones (15 percent), surgery (10 percent), dental issues (10 percent), and infections like pneumonia and flu (9 percent). Five percent each cite mental health or substance abuse issues and pregnancy or childbirth as the cause of their bills.

Among who say their bill problems were the result of a one-time or short-term medical expense, just under one in five (18 percent) cite an accident as the main cause. Most of the others name illnesses, pain, dental issues, or surgery, suggesting that although most bill problems are caused by one-time events, these events are often acute episodes of illness or expensive surgeries, medications or tests, rather than injuries caused by accidents. Those who say their bills have built up over time are even more likely to cite specific diseases, the most common being cancer (14 percent), heart disease (11 percent), and diabetes (11 percent).

Table 1: Self-Reported Descriptions of Situations Leading to Medical Bill Problems
Could you briefly describe the illness or injury that led to [these medical] bills? (open-ended question)TotalAmong those who say bills were for a one-time or short-term medical expense

(66% of total)

Among those who say bills have built up over time

(33% of total)

Diseases/Illnesses/Symptoms (NET)36%26%56%
Heart disease/heart attack/stroke8611
Cancer/tumors6214
Gastrointestinal/stomach668
Allergies/asthma/respiratory disease547
Diabetes4111
High blood pressure426
Neurological problems324
Auto-immune disease214
Kidney disease/problems221
Cervical/ovarian/gynecologic problems22<1
Thyroid issues1<11
Pain/injuries (NET)161517
Arthritis/joint pain/problems889
Back/neck pain/problems656
Chronic pain, other/unspecified334
Accident/Broken bones (NET)15186
Broken bones562
Accident, car/vehicle561
Accident, unspecified562
Accident, job-related11<1
Surgery10109
Teeth/Dental10117
Infectious diseases (NET)9107
Pneumonia/lung infection324
Viral infections351
Other/unspecified infection231
Mental Health/Substance abuse547
Pregnancy/Child birth/Maternity care563
Cancer screening121
Vision/Eye Problems112
Other896
Don’t know/Refused/Skipped545
NOTE: Percentages add up to more than 100 because multiple responses were accepted.
In their own words: Could you briefly describe the illness or injury that led to these medical bills?

The open-ended responses to this question show that medical bill problems can arise from single health events or chronic, ongoing conditions. Problems occur among people with and without insurance. They can affect one person or multiple family members at a time. Unexpected bills may arise when people don’t realize how many providers will bill separately for a single treatment event, or when insurance doesn’t pay for care people thought would be covered. Medical bill problems may be short term, or drag on for years.

  • “A heart attack (MI) requiring 4 stents being placed. Also an appendectomy. Ongoing: diabetes and heart disease that require monthly visits and prescriptions. My son also has epilepsy which has impacted our medical expenses.”
  • “In 2002 I had a pancreatic attack, a tumor in my pancreas removed and my spleen removed, and I broke 2 arms at the same time, partial hysterectomy. And hepatitis.”
  • “Cancer. Current treatment not FDA approved for certain cancers, so even though the treatment is working, it is no longer covered by insurance and costs approximately $11,000 per month.”
  • “It’s a whole lot. Diabetes and claustrophobic and everything. TIA, a mini stroke, depression, anxiety.”
  • “I had a tooth that went bad and had to have it pulled. I now need another tooth in its place. The dentist wants all the money for the procedure up front. I do not have thousands of dollars to give.”
  • “Was treated by my family doctor for a MRSA infection which led to C-Diff which I went to the ER for. They ran several tests and diagnosed the illness but sent me home with no treatment. I had made arrangements to pay the bill monthly and came to realize there were several other bills associated with the visit that were specific to Doctor, CT scan, Lab all being separate bills.”
  • “I have been diagnosed with osteoarthritis throughout my body, as well as degenerative disc disease. I have had to have at least 6 MRI’s in past 5 years, 3 back injections, 5 foot surgeries, 2 knee surgeries, wrist surgery, torn tendon repair, several joint replacement surgeries, etc.”
  • “I was pregnant and miscarried when I was 10.5 weeks a long. Prior to losing the baby, I had an ultrasound which cost $636 and I don’t have insurance. I was eligible for pregnancy-related Medicaid, but it wasn’t billed right and a year and a half later I got the bill. I am still trying to get it straightened out.”
  • “Eye glasses not covered. Orthotics not covered. Many different problems with feet.”
  • “Insurance not paying for wellness care of any kind, blood work, labs, physical and only 8o% of a mammogram.”

Financial status of those with medical bill problems

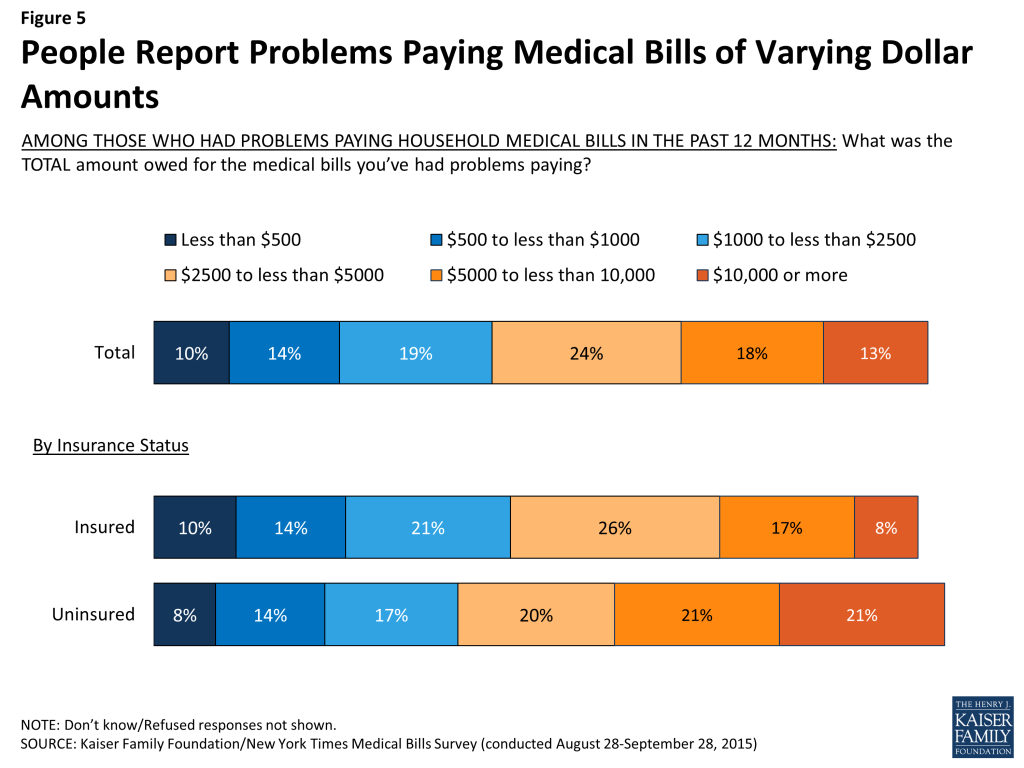
About three in ten (31 percent) of those with medical bill problems say the total amount of the bills they had problems paying was $5,000 or more, including 13 percent who report bills adding to at least $10,000. Insurance appears to provide some protection from the highest bills, as the insured are less likely than the uninsured to report having bills of $10,000 or more (8 percent versus 21 percent).

Figure 5: People Report Problems Paying Medical Bills of Varying Dollar Amounts

Many of those with medical bill problems report struggling with bills of lower amounts, including 24 percent of the insured and 22 percent of the uninsured who say their bills amounted to less than $1,000. While these lower amounts may seem small, even a bill of $500 or less can present a major problem for someone who is living paycheck to paycheck. In fact, when asked to describe their financial situation, about six in ten (61 percent) of those who’ve had problems paying medical bills say they either just meet their basic expenses (43 percent) or don’t have enough to meet basic expenses (18 percent). Among the comparison group who did not report problems paying medical bills, just a quarter (24 percent) report such a tenuous financial situation, while the majority say they either live comfortably or meet their basic expenses with a little left over for extras.

Given their differing demographic profiles, it’s not surprising that those with health insurance are less likely than those without insurance to say they struggle to meet basic expenses. However, even among the insured, those who have faced medical bill problems are significantly more likely than their counterparts who haven’t had such problems to say they are either just getting by or don’t have enough to make ends meet (55 percent versus 22 percent).

Table 2: Most of Those with Medical Bill Problems Report Just Making Ends Meet
Total adults 18-64InsuredUninsured
How would you describe your household’s financial situation?Medical bill problemsNo medical bill problemsMedical bill problemsNo medical bill problemsMedical bill problemsNo medical bill problems
Live comfortably8%35%9%37%6%18%
Meet your basic expenses with a little left over for extras314136422036
Just meet your basic expenses431841164638
Don’t have enough to meet basic expenses186146268
NOTE: Don’t know/Refused responses not shown.

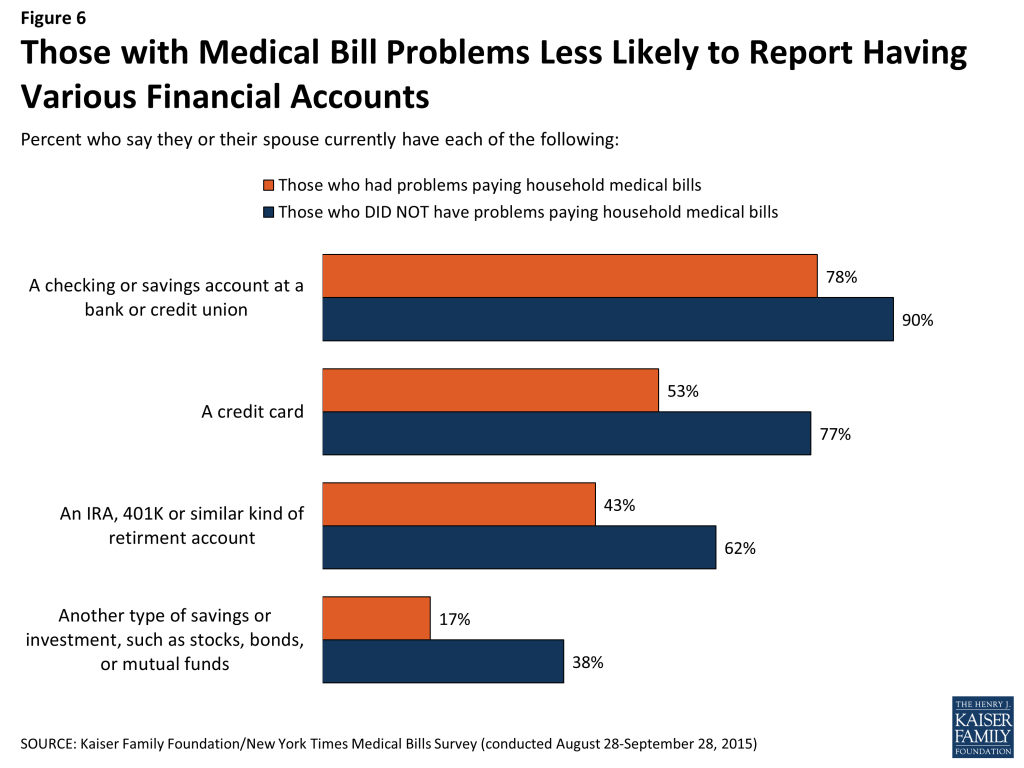
The financial accounts held by people who’ve had problems paying medical bills also paint a picture of a more fragile financial situation. A large majority (78 percent) say they have a checking or savings account, though this is lower than among those who have not had medical bill problems (90 percent). Compared to those without medical debt, those who’ve had medical bill problems are also less likely to say they have a credit card (53 percent versus 77 percent), a retirement savings account (43 percent versus 62 percent), or some other type of savings (17 percent versus 38 percent). Again, not surprisingly, among those with medical bill problems, the uninsured are less likely than the insured to report having each of these types of accounts.

Figure 6: Those with Medical Bill Problems Less Likely to Report Having Various Financial Accounts

Income loss due to illness is another complicating factor for some of those who face medical bill difficulties. About three in ten (29 percent) say that someone in their household had to take a cut in pay or hours as a result of the illness that led to the medical bills, either because of the illness itself or in order to care for the person who was sick. Most of these (19 percent of the total who had problems paying medical bills) say their household income decreased a lot as a result.

The uninsured who had medical bill problems (36 percent) are somewhat more likely to report job losses or pay cuts, but still about a quarter (26 percent) of the insured who had medical bill problems report facing such an adverse employment outcome as a result of the illness that led to their bills.

Figure 7: About Three in Ten Report Job Loss Or Pay Cut Due to Illness That Led to Medical Bill Problems

Key Findings: Section 2: The Role Of Health Insurance

Medical bill problems among those with health insurance

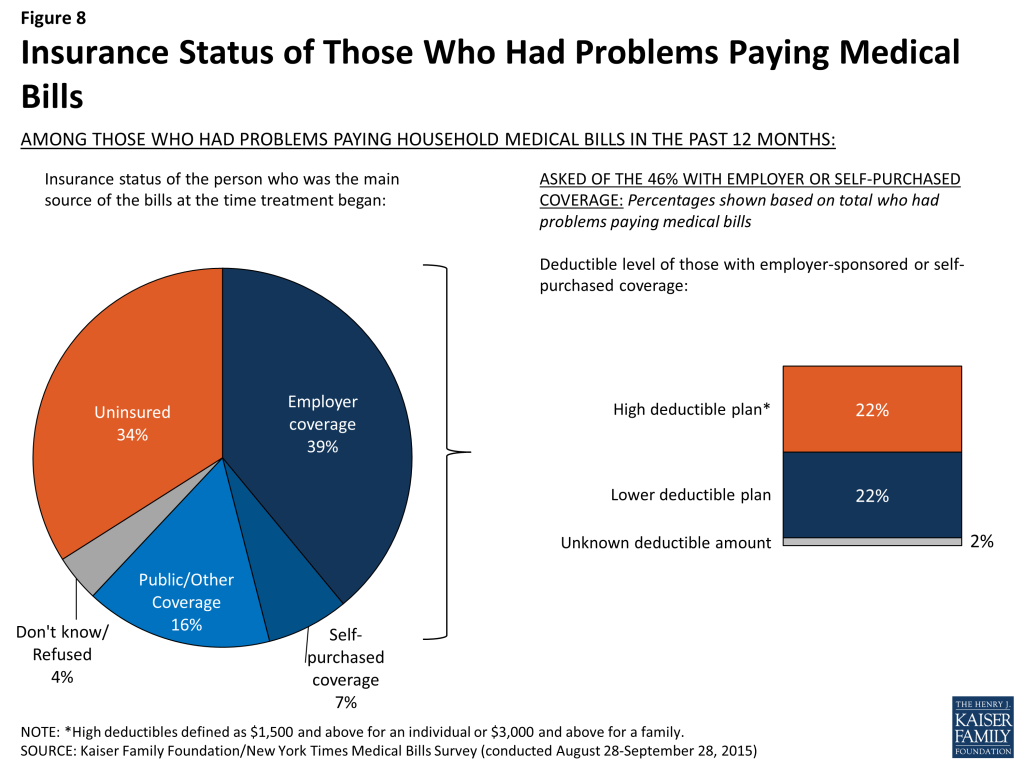
While problems paying medical bills are more common among the uninsured, more than six in ten (62 percent) of those who had problems paying medical bills say the person who incurred the bills was covered by health insurance when treatment began, with most of that coverage (39 percent of the total) coming through an employer. The vast majority (83 percent) of those who were insured when treatment began say they kept their coverage throughout the treatment period, but 15 percent of them (9 percent of the total) say they lost or dropped coverage at some point, mainly because of job loss or change or because they were no longer eligible for coverage.

Among those with private insurance through an insurer or purchased on their own (46 percent of the total who had problems paying medical bills), about half report having plans with high deductibles (at least $1500 for an individual of $3000 for a family), while the other half report having lower-deductible plans.

Figure 8: Insurance Status of Those Who Had Problems Paying Medical Bills

Of those who were insured when the bills were incurred, three-quarters (75 percent) say that the amount they had to pay for their insurance copays, deductibles, or coinsurance was more than they could afford. Interestingly, this is true among people in plans with higher deductibles (83 percent) and among those in plans with lower deductibles (76 percent), suggesting that other types of cost-sharing can present a problem even for people in lower-deductible health plans. For example, even under a plan with a relatively low deductible, large medical bills could arise from repeated co-pays or from out-of-network coinsurance.  This finding should not be confused with the finding shown in the first section of this report – that people in plans with higher deductibles are more likely to report problems paying medical bills in the first place. However, among insured people who have medical bill problems, most find cost sharing unaffordable regardless of the deductible level.

Figure 9: Most Who Had Problems Paying Medical Bills While Insured Say Cost-Sharing Was More Than They Could Afford

About three in 10 (32 percent) of those who had problems paying medical bills while insured say they received care from an out-of-network provider that their insurance wouldn’t pay for. For many, these bills came as a surprise. Seven in 10 (69 percent) of those who had problems paying for care received from an out-of-network provider say they were unaware that the provider was not in their plan’s network when they received the care.

Figure 10: Most Who Received Out-Of-Network Care Did Not Know the Provider Was Out-Of-Network at Time of Treatment

Denied claims also contribute to medical bill problems among those with insurance. About a quarter (26 percent) of the insured who had medical bill problems say they had a claim denied by their insurance company. Common reported reasons for denial include a particular treatment not being covered (25 percent of those with denied claims) and receiving care from an out-of-network provider (14 percent); 21 percent of those who say they had a claim denied did not know or could not provide a reason for the denial.

The uninsured and attempts to get coverage

About a third (34 percent) of those who had problems paying medical bills say they were uninsured when the treatment that led to their medical bill problems began. However, many of these (39 percent, or 13 percent of the total who had problems paying medical bills) say they got coverage at some point while they were receiving treatment, mainly from Medicaid (36 percent of those who were uninsured and gained coverage).

Figure 11: Six in Ten Had Insurance When Treatment Began, One-Third Were Uninsured

Among those who remained uninsured throughout the time they were receiving the treatment that led to their medical bills, many say they tried to get coverage from Medicaid (52 percent), the health insurance marketplace (28 percent) or directly from an insurance company or broker (16 percent). Most of those who tried but were not able to get coverage from Medicaid say they were told they were not eligible for the program, while the most commonly reported reason for not getting private coverage was because it was too expensive.

Key Findings: Section 3: Consequences Of Medical Bill Problems

The impact of medical bills on families

Among the roughly one-quarter of Americans ages 18-64 who report having problems paying medical bills, roughly equal shares say the impact of those bills on their families has been major (44 percent) and minor (47 percent). Relatively few (7 percent) say there has been no real impact. The survey shows that while insurance may protect people from having medical bills problems in the first place, once those problems occur the consequences are similar regardless of insurance status. Among those with medical bill problems, almost identical shares of the insured (44 percent) and uninsured (45 percent) say the bills have had a major impact on their families. Similarly, among those who had problems paying medical bills, those with higher incomes are just as likely to report that the bills had a major impact as those with lower incomes (though as noted above, people with lower incomes are more likely than those with higher incomes to report problems paying medical bills in the first place).

A few groups among those with medical bill problems are more likely to say the medical bills have had a major impact on their families, including people with bills amounting to $5,000 or more (66 percent), those who say the family member who generated the bills has a disability (57 percent), and those who describe their financial situation as not having enough to meet basic expenses (56 percent).

Figure 12: Over Four in Ten with Medical Bill Problems Report a Major Impact on Their Family

Among people with private health insurance, those in high-deductible plans are more likely than those in lower-deductible plans to say the bills had a major impact on their family (49 percent versus 35 percent), which may be related to the fact that high deductible plan enrollees report having higher bills on average. About two-thirds (64 percent) of those in high-deductible plans say their bills amounted to $2,500 or more, compared to four in ten with lower-deductible plans (40 percent).

Sacrifices made to pay medical bills

Even among those with health insurance, people who’ve faced medical bill problems report making various sacrifices in order to pay these bills, including significant changes to their employment, financial situation, or lifestyle. Overall, about seven in ten report cutting back or delaying vacations or major household purchases (72 percent) as well as reducing spending on food, clothing and basic household items (70 percent). About six in ten (59 percent) say they used up all or most of their savings in order to pay medical bills. Substantial shares say that someone in their household took on an extra job or worked more hours (41 percent), borrowed money from family and friends (37 percent), or increased their credit card debt (34 percent). Roughly a quarter (26 percent) say they took money out of a retirement, college, or other long-term savings account. Smaller – but not inconsequential – shares say they changed their living situation (17 percent), took out another type of loan (15 percent), borrowed from a payday lender (13 percent), or sought the aid of a charity or non-profit (12 percent) in order to pay medical bills. Very few (2 percent) report taking out a second mortgage on their home.

These sacrifices are reported by people in all walks of life, and not just the uninsured or those with precarious financial situations. In fact, people who have problems paying medical bills despite having health insurance are more likely than the uninsured with medical bill problems to say they’ve put off vacations or major household purchases (77 percent versus 64 percent), cut back spending on food, clothing, or basic household items (75 percent versus 62 percent), used up all or most of their savings (63 percent versus 51 percent), increased their credit card debt (38 percent versus 24 percent), or taken money out of long-term savings (31 percent versus 17 percent) in order to pay medical bills. The opposite is true in one case; the uninsured with medical bill problems are more likely than those with insurance to say they had to change their living situation in order to pay these bills (23 percent versus 14 percent).

Table 3: Many Insured and Uninsured Report Taking Actions to Pay Medical Bills
Among those who had problems paying medical bills in past 12 months
Percent who say they or someone else in their household has done each of the following in the past 12 months in order to pay medical bills:TotalInsuredUninsured
Put off vacations or other major household purchases72%77%64%
Cut back spending on food, clothing, or basic household items707562
Used up all or most of savings596351
Taken an extra job or worked more hours414240
Borrowed money from friends or family373738
Increased credit card debt343824
Taken money out of retirement, college, or other long-term savings accounts263117
Changed your living situation171423
Taken out another type of loan151711
Borrowed money from a payday lender131512
Sought the aid of a charity or non-profit organization121115
Taken out another mortgage on home212
Made other significant changes to way of life151516

In addition to the sacrifices listed above, fifteen percent of people who had problems paying medical bills report making other significant changes to their way of life in order to pay these bills.

In their own words: What other significant changes did you make in your way of life in order to pay these medical bills?
  • “Apartment instead of house. Not getting groceries some weeks to get by.”
  • “Charges for my insulin exceeded $1200 a month (3 times the amount of my house payment). I had to reduce the amount of insulin I took based on what I could afford; my health was negatively impacted as a result.”
  • “Cold showers, can’t fix plumbing. Other needed repairs have been patched as best as possible but not fixed.”
  • “Medical Insurance / bills was the deciding factor in a job change. I gave up other benefits to choose a job that had the best medical coverage.”
  • “Sold everything we could spare.”
  • “Can’t take the kids anywhere. Wish I could do more for my kids!”
  • “I need physical therapy after shoulder repair but I couldn’t afford to finish it. I wish I could have.”
  • “I am losing my house.”
  • “I’ve cut back on just about everything for my family and the way we live.”

Effects of medical bills on ability to get needed health care

For many, problems paying household medical bills can impact their ability to get (or continue getting) the health care services they need. Overall, about three in ten (31 percent) of those who faced problems paying medical bills say they had problems getting other health care they needed directly as a result of these problems. While the problem is worse for those without insurance – among whom 41 percent say they had trouble getting needed care because of medical bills – it is also reported by about a quarter (26 percent) of those who had insurance when their medical bill problems occurred.

More broadly, many of those with medical bill problems report delaying or skipping health care over the past 12 months because of the cost – at rates 2 to 3 times those of their counterparts who did not have problems paying medical bills, regardless of their insurance status. For example, among those with health insurance, 43 percent of those with medical bill problems say there was a time in the past year when they or a family member did not get a recommended medical test or treatment because of the cost, compared with just 13 percent of those without such medical bill problems. Similarly, 41 percent of the insured who faced medical bill problems say they did not fill a prescription in the past 12 months because of the cost, compared with 14 percent of those with health insurance who did not have bill problems. Access to dental care can be affected, too; among those with health insurance, 62 percent of those with medical bill problems report postponing dental care in the previous year due to cost, compared with 29 percent of those without such problems.

Table 4: Those with Medical Bill Problems More Likely to Report Skipping or Delaying Care
TotalInsuredUninsured
Percent who say they or another family member living in their household have done each of the following in the past 12 months because of the COST:Medical bill problemsNo medical bill problemsMedical bill problemsNo medical bill problemsMedical bill problemsNo medical bill problems
Put off/postponed getting dental care/check-ups65%31%62%29%72%42%
Relied on home remedies/over the counter drugs instead of going to see a doctor623258307144
Put off/postponed getting health care you needed602258216537
Not filled a prescription for medicine431441144513
Not gotten a medical test/treatment that was recommended by a doctor431343134313
Chosen a less expensive treatment than the one your doctor recommended401538144726
Cut pills in half/skipped doses of medicine3493293913
Skipped/postponed rehabilitation care that your doctor recommended225205286

Effects of medical bills on household finances and ability to afford basic needs

Medical bills can also lead to problems meeting other financial obligations and paying for basic necessities. Among those with medical bill problems, about six in ten of both the insured (62 percent) and the uninsured (62 percent) say they’ve had difficulty paying other bills as a result of medical debt. Over a third in each group (34 percent of the insured and 39 percent of the uninsured) say they were unable to pay for basic necessities like food, heat, or housing as a result of medical bills.

Figure 13: Reports of Difficulty Paying Other Bills and Basic Needs As A Result Of Medical Bills

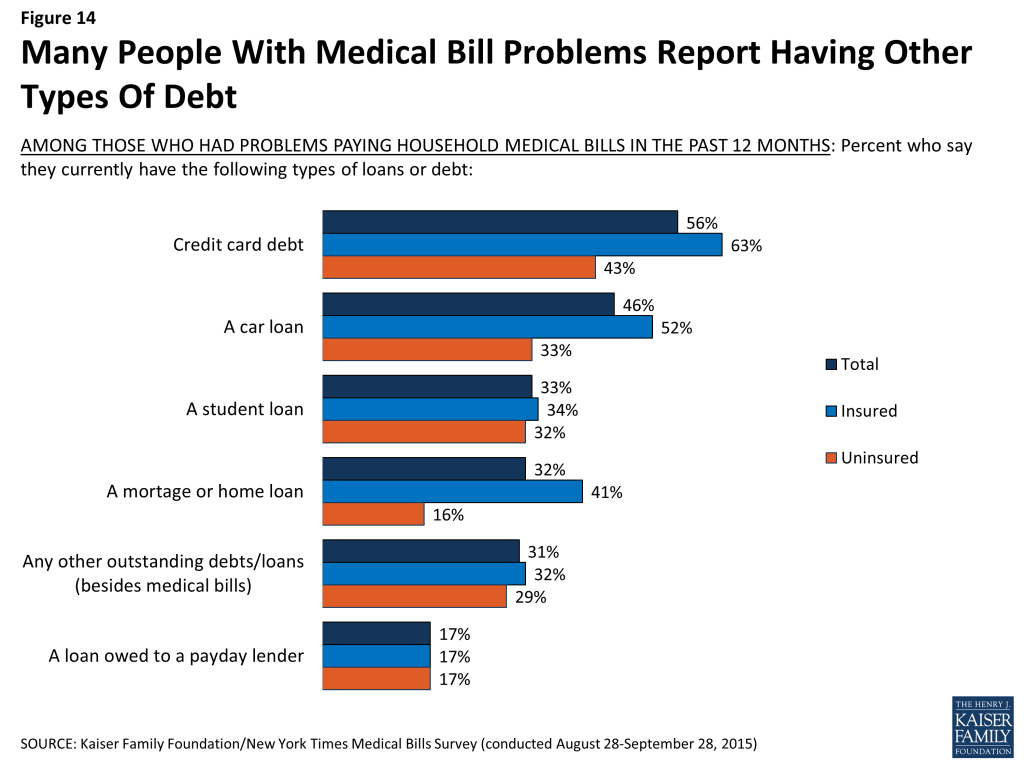
Although this survey focuses on the problems Americans face in paying medical bills, for many, medical bills represent just one source of bills or debt. Most of those with medical bill problems report having other kinds of debt, including credit card debt (56 percent), car loans (46 percent), student loans (33 percent), mortgages (32 percent), payday loans (17 percent), and other outstanding loans (31 percent). Among those with medical bill problems, those with health insurance are more likely than those without insurance to report having credit card debt (63 percent versus 43 percent), a car loan (52 percent versus 33 percent), or a mortgage (41 percent vs. 16 percent), which may reflect better access to these types of credit among the insured group. However, similar shares of the insured and uninsured report having a student loan (34 percent of the insured and 32 percent of the uninsured) and a loan owed to a payday lender (17 percent each).

Figure 14: Many People With Medical Bill Problems Report Having Other Types Of Debt

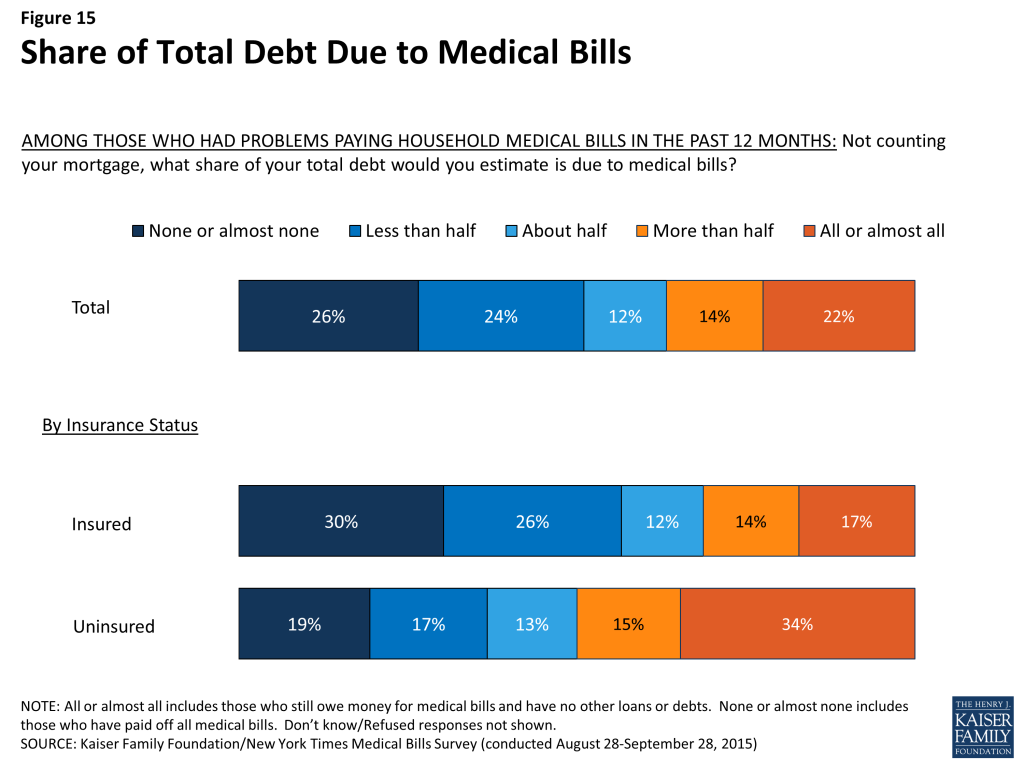
For some of those with problems paying medical bills, medical debt makes up a large share of their total debt. About one in five (22 percent, including 17 percent of the insured and 34 percent of the uninsured) say their medical bills represent all or almost all of their total non-mortgage debt. By contrast, just over half (56 percent) of the insured and about a third (36 percent) of the uninsured say they have either paid off all their medical bills, or that medical debt makes up less than half of their total debt.

Figure 15: Share of Total Debt Due to Medical Bills

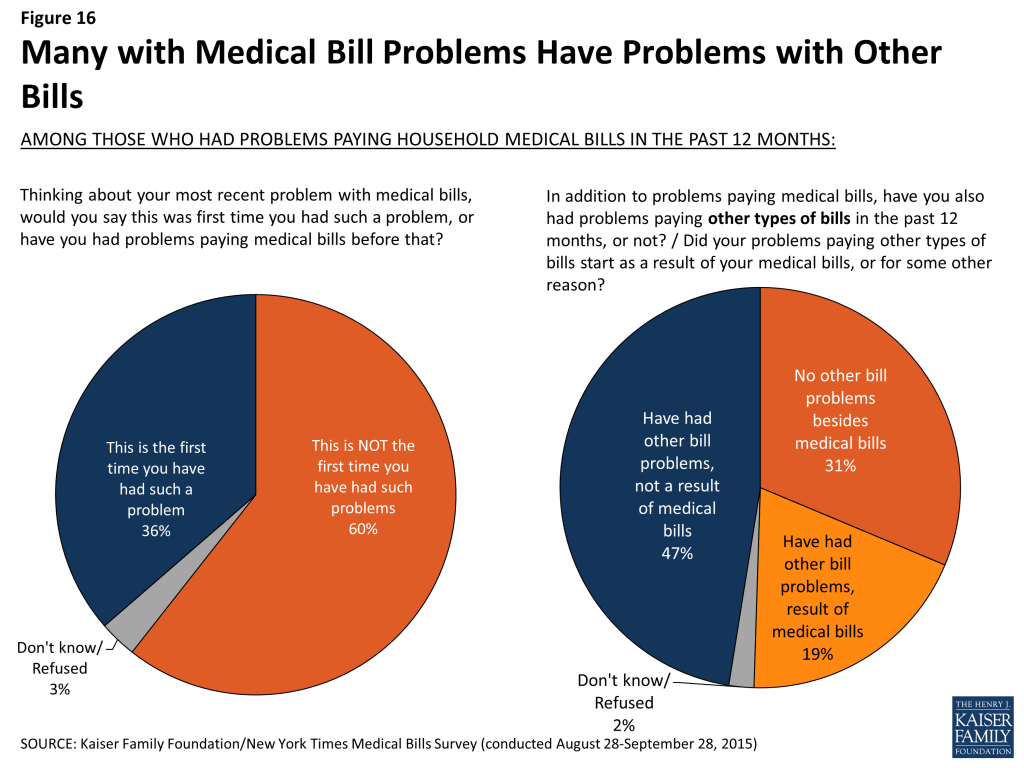
The survey also finds that once medical bill problems start, it can be difficult to make them stop, and that for some, medical bills can start a cascade of other bill problems. Six in ten (60 percent) say this is not the first time they’ve faced medical bill problems, a share that is even higher among those who say their bills are the result of an ongoing health problem (67 percent) and those who say the family member who generated the bills has a disability (69 percent).

Further, while almost half (47 percent) say they’ve also had problems paying other unrelated bills in the past year, medical bills appear to be either the sole problem or the main trigger of bill problems for the other half, including 31 percent who say they’ve only had problems with medical bills, not other types of bills, and 19 percent who say their problems paying other bills started as a result of their medical bills.

Figure 16: Many with Medical Bill Problems Have Problems with Other Bills

Financial consequences of struggling to make payments

Many of those who’ve faced household medical bill problems report struggling to make payments, both for their medical bills and for other bills. Six in ten (61 percent) say they have been late on a payment for a medical bill, and almost as many (56 percent) say they’ve missed a payment. Similar shares report being late or missing payments for other (non-medical) bills (56 percent and 46 percent, respectively). Once a person has problems paying medical bills, their insurance status appears to make little difference in their ability to pay bills on time. Among those with medical bill problems, similar shares of the insured and uninsured say they’ve been late on a payment (62 percent and 63 percent, respectively) or missed a payment (55 percent and 61 percent) for a medical bill in the past year.

Far fewer, though still roughly two in ten, say they’ve defaulted on a loan for a medical bill (17 percent), including a somewhat higher share of the uninsured (23 percent) compared to those with insurance (15 percent).

Figure 17: Many of Those With Medical Bill Problems Report Being Late and Missing Payments, But Fewer Have Defaulted

Likely as a result of missed or late payments, almost six in ten (58 percent) of those with medical bill problems say they’ve been contacted by a collection agency in the past year, mostly because of medical bills alone (25 percent) or a combination of medical bills and some other type of debt (20 percent). Again, once medical bill problems start, insurance offers little protection against such follow-up, with similar shares of the insured (56 percent) and uninsured (63 percent) saying they’ve been contacted by a collections agency in the past 12 months.

Table 5: Many With Medical Bill Problems Report Being Contacted by Collection Agency
Among those who had problems paying medical bills in past 12 months
Have you or someone else in your household been contacted by a collection agency in the past 12 months for any reason, or not?  Was that because of medical bills, some other type of bills, or both?TotalInsuredUninsured
Yes, contacted by collection agency58%56%63%
Because of medical bills252622
Because of some other type of bills121015
Because of both201924
No, not contacted by collection agency414434
NOTE: Don’t know/Refused responses not shown.

An indication of more serious financial problems, a small share (2 percent) of those with household medical bill problems say they’ve declared personal bankruptcy in the past year, and another 16 percent report declaring bankruptcy longer than 12 months ago. Overall, 11 percent say they’ve declared bankruptcy at some point and that medical bills were at least a partial contributor to their bankruptcy. Among those with medical bill problems, reports of having declared bankruptcy are similar among the insured (21 percent) and those without health insurance (14 percent).

Table 6; Almost One-Fifth With Medical Bills Problems Have Declared Bankruptcy
Among those who had problems paying medical bills in past 12 months
Have you ever declared personal bankruptcy, or not?  Did you declare bankruptcy mainly because of medical bills, mainly because of some other type of debt, or both?TotalInsuredUninsured
Declared bankruptcy in the past 12 months2%3%1%
Declared bankruptcy more than 12 months ago161812
Total declared bankruptcy (NET)182114
Because of medical bills333
Because of some other type of bills794
Because of both8107
Never declared bankruptcy827986
NOTE: Don’t know/Refused responses not shown.

Key Findings: Section 4: Patients As Consumers

In today’s health care environment where information about the cost of health care services can be difficult to find, patients and families often need to be savvy consumers in terms of estimating the cost of care (or their share of the cost if insured), finding the best price, and working out a payment plan after services have been received. The survey finds that some of those who faced medical bill problems found health care providers willing to cooperate with them in setting up payment plans or reducing the amount they owed, while others attempted to engage in cost-conscious health care shopping behaviors and met with little success.

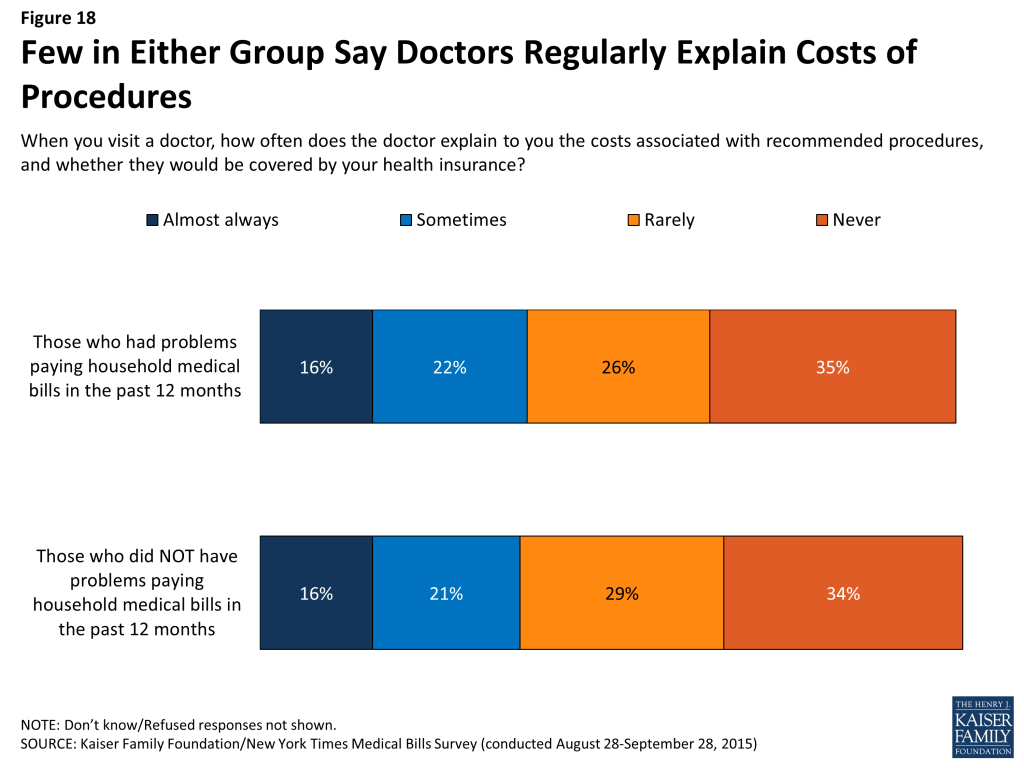
Broadly, the survey finds that a majority of people both with medical bill problems (61 percent) and without (63 percent) say doctors rarely, if ever, discuss the costs of recommended treatments and whether they would be covered by insurance.

Figure 18: Few in Either Group Say Doctors Regularly Explain Costs of Procedures

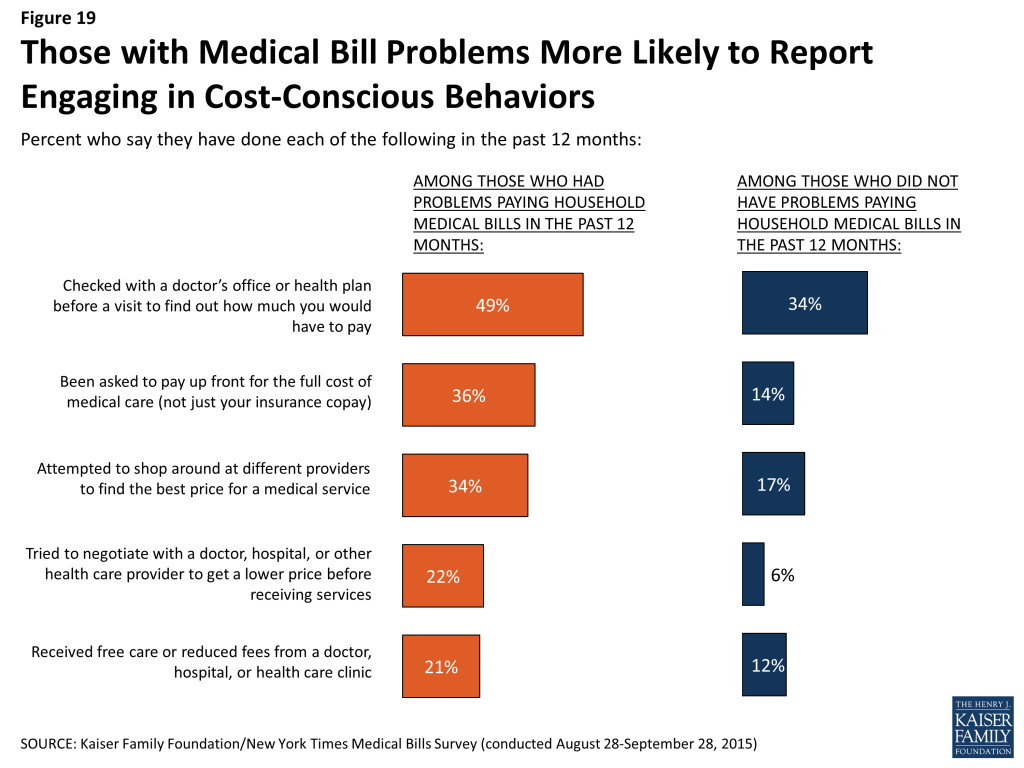
The survey does find, however, that those who’ve had difficulty paying medical bills are more likely than their peers to report taking extra measures to negotiate prices or shop around for health care.

Compared to those who have not experienced medical bill problems, those who have faced such problems are more likely to say that in the past 12 months, they have checked with a doctor’s office about the cost a visit beforehand (49 percent versus 34 percent), shopped around to find the best price for a medical service (34 percent versus 17 percent), or negotiated with a provider to get a lower price before receiving services (22 percent versus 6 percent). However, those with medical bill problems are also more likely than those without such problems to say they have been told by a provider they must pay in full up front before services are provided (36 percent versus 14 percent).

Figure 19: Those with Medical Bill Problems More Likely to Report Engaging in Cost-Conscious Behaviors

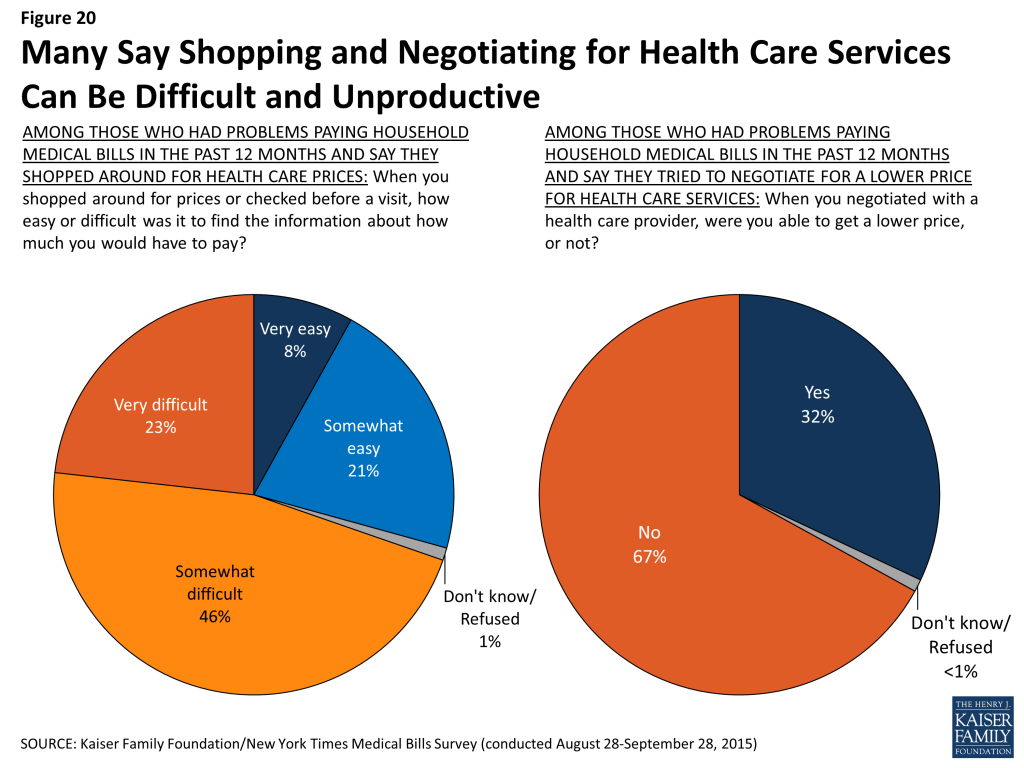
Despite these extra efforts, many of those who say they tried to engage in cost-conscious behaviors found it difficult or unproductive. Seven in ten (69 percent) of those who shopped around for a lower price on medical services say it was difficult to find information about how much they would have to pay, and 67 percent of those who attempted to negotiate with a provider for a lower price say they were unsuccessful in doing so.

Figure 20: Many Say Shopping and Negotiating for Health Care Services Can Be Difficult and Unproductive

Just over half (53 percent) of those who had problems paying medical bills say they worked out a payment plan with a provider for at least some of what they owed. Most of these (28 percent of the total) say they did not pay a finance charge to the provider, while 12 percent say they did pay a finance charge and another 12 percent are not sure.

Figure 21: More Than Half of Those with Medical Bill Problems Have Worked Out a Payment Plan with a Health Care Provider
In their own words: One respondent’s story of confusing billing issues

[My wife] had an issue in her lower abdomen with chronic pain and went to see her OB/GYN for a professional opinion. She had the initial visit and needed to have some diagnostic lab testing done as well as a further ultrasound. She got no notification of the fees that were expected to be paid and the doctor told her that there was nothing to pay except the co-pay. Fast forward a few months and she gets a notice from the office saying that her unpaid bill is being forwarded to collections and will need to be paid immediately. She was never given notice before this collections notice and the fees seemed to be hidden or unknown to the doctor’s office. The disconnect between the medical services provided, and payment processing for those services provided, seems to be one of the largest issues, where one party is unaware of what the other needs to charge and does not give the patient the appropriate financial information in regards to the services being rendered.

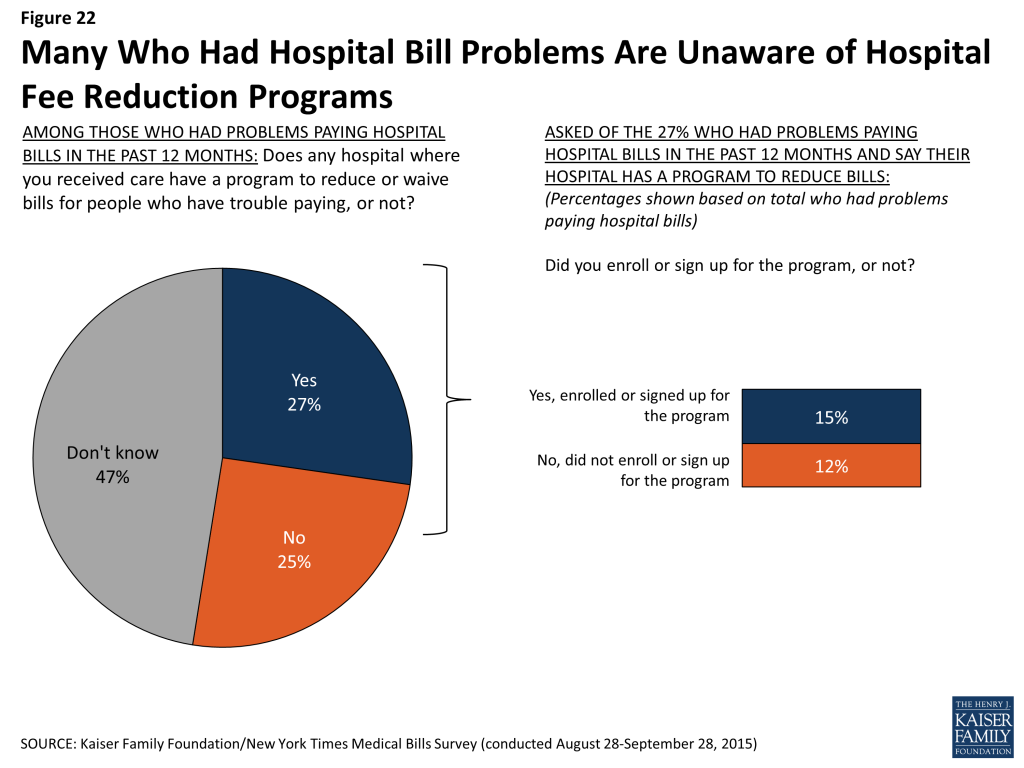
Many hospitals have programs available to reduce or waive bills for people who have trouble paying, and non-profit hospitals are required to have such programs.5  Among those who report problems paying hospital bills, about half (47 percent) do not know if the hospital where they received care has such a program or not. Over a quarter (27 percent) say the hospital does have such a program, and 15 percent signed up for it. Additionally, fourteen percent of those who had problems paying medical bills other than hospital bills say a health care provider agreed to reduce the amount they owed.

Figure 22: Many Who Had Hospital Bill Problems Are Unaware of Hospital Fee Reduction Programs

Key Findings: Conclusion

These survey findings confirm that problems related to unaffordable medical bills and medical debt are prevalent, affecting roughly 1 in 4 non-elderly adults in the United States. Certain groups are more vulnerable, including individuals and families with lower incomes and limited financial assets, people with chronic medical conditions and disabilities, the uninsured, and people insured by plans with high deductibles.  Even so, people are not immune who have higher incomes, who are insured, or who are otherwise in good health and then experience unexpected health problems.

Insurance features like cost-sharing, provider networks, and confusing billing practices can all lead to medical bill problems among the insured. While higher deductibles and other forms of cost-sharing have helped to keep health insurance premium growth at historically low levels in recent years, the survey highlights the consequences these changes can have for people. Price transparency is another issue; while many say they tried to research treatment option costs in advance, most say such information was difficult to find.

The survey also shows that medical bill problems can have real and often lasting impacts on individuals and families in terms of their standard of living, their financial stability, and their ability to access needed health care. While insurance provides some protection against incurring medical bill problems in the first place, once these problems occur, the effects on individuals and families are often as serious for the insured as they are for the uninsured. As the nation moves beyond the debate over the Affordable Care Act, issues of health care costs and affordability like those highlighted by this survey are likely to play a prominent role in health policy discussions. Information about the causes of medical debt and its impacts on people can play an important part in these discussions and help policymakers and others as they work on solutions to alleviate the burden of medical debt on American families.

Appendix 1: Reported Problems Paying Medical Bills By Demographic Group

Appendix 1: Reported Problems Paying Medical Bills By Demographic Group

GroupPercent who say they or someone in their household had problems paying medical bills in the past 12 months
Total26%
Insurance statusUninsured53
Employer coverage19
Non-group coverage22
Medicaid18
Deductible level (among those with employer or non-group coveragePrivate insurance, high deductible6 26
Private insurance, lower deductible15
Annual household incomeLess than $50,00037
$50,000-$99,99926
$100,000 or more14
Disability prevents from participating fully in work, school, housework, other activitiesYes47
No22
Self-reported health statusFair/poor45
Excellent/very good/good22
Receiving regular medical treatment for any chronic health problemYes34
No23
GenderMale23
Female29
Age18-2931
30-4924
50-6425
Children in householdYes29
No24
EducationHigh school or less32
Some college30
College graduate16
Race/ethnicityWhite, non-Hispanic24
Black, non-Hispanic31
Hispanic32
Other/mixed race25
Census RegionNortheast18
Midwest23
South32
West26

Survey Methodology

Appendix 2: Survey Methodology

The Kaiser Family Foundation/New York Times Medical Bills Survey is based on interviews with a probability-based sample of 2,575 respondents between the ages of 18 and 64 conducted August 28 through September 28, 2015. Interviews were administered online and by telephone in English and Spanish, including a longer interview with 1,204 adults who reported problems paying household medical bills in the past 12 months and a shorter comparison survey with 1,371 who did not report such problems. Teams from the Foundation and The Times worked together to develop the questionnaire and analyze the data, and both organizations contributed financing for the survey. Each organization is solely responsible for its content.

NORC at the University of Chicago conducted sampling, interviewing, and tabulation for the survey using the AmeriSpeak Panel, a representative panel of adults age 18 and over living in the United States. AmeriSpeak Panel members are recruited through probability sampling methods using the NORC National Sample Frame, an address-based sampling frame. Panel members who do not have internet access complete surveys via telephone, and internet users complete surveys via the web (for the current survey, 619 respondents completed via phone and 1,956 via web).

The combined results have been weighted to adjust for the fact that not all survey respondents were selected with the same probability, to address the implications of sample design, and to account for systematic nonresponse along known population parameters. The first weighting stage addressed differences in probability of selection for the AmeriSpeak Panel and to account for differential nonresponse to the AmeriSpeak screening interview. At this stage, an adjustment was also made to account for the undersampling of panelists who did not report problems paying household medical bills and to account for differential nonresponse to the survey screening interview.

In the second weighting stage, the sample was adjusted to match known demographic distributions of the U.S. population ages 18-64 by age, gender, education, race/ethnicity, Census region, and household income. Demographic weighting parameters were based on the U.S. Census Bureau’s 2015 March Supplement to the Current Population Survey.

The margin of sampling error including the design effect for the full sample is plus or minus 3 percentage points.  All statistical tests of significance account for the effect of weighting. Numbers of respondents and margin of sampling error for key subgroups are shown in the table below. For results based on other subgroups, the margin of sampling error may be higher. Sample sizes and margins of sampling error for other subgroups are available by request. Note that sampling error is only one of many potential sources of error in this or any other public opinion poll.

GroupN (unweighted)M.O.S.E.
Total adults ages 18-642,575±3 percentage points
Problems paying household medical bills past 12 months1,204±4 percentage points
No problems paying household medical bills past 12 months1,371±4 percentage points
Insured with problems paying household medical bills past 12 months802±5 percentage points
Uninsured with problems paying household medical bills past 12 months369±8 percentage points

Kaiser Family Foundation public opinion and survey research and NORC at the University of Chicago are both charter members of the Transparency Initiative of the American Association for Public Opinion Research.

Endnotes

  1. Medical Debt Among People With Health Insurance, Kaiser Family Foundation, January 2014. https://modern.kff.org/private-insurance/report/medical-debt-among-people-with-health-insurance/ ↩︎
  2. People ages 65 and older also experience problems paying medical bills. However, since nearly all of them have access to health insurance coverage through Medicare, and since their family budget considerations are often quite different from those of younger adults, we limited this survey to those ages 18-64. ↩︎
  3. Throughout this report, higher deductibles are defined as $1,500 and above for an individual or $3,000 and above for a family. ↩︎
  4. Results are similar if respondents are grouped by an estimate of their income as a percentage of the federal poverty level (FPL) using information on income and family size, rather than based on household income alone. ↩︎
  5. New Requirements for 501(c)(3) Hospitals Under the Affordable Care Act, Internal Revenue Service, https://www.irs.gov/Charities-&-Non-Profits/Charitable-Organizations/New-Requirements-for-501(c)(3)-Hospitals-Under-the-Affordable-Care-Act ↩︎
  6. Throughout this report, higher deductibles are defined as $1,500 and above for an individual or $3,000 and above for a family. ↩︎
News Release

How High Drug Prices Weigh on the Sickest Americans

Published: Dec 28, 2015

In his latest column for The Wall Street Journal’s Think Tank, Drew Altman explores the data behind public concern about prescription drug costs and highlights that the people most in need are the most burdened by the problem.

All previous columns by Drew Altman are online.

News Release

Bernie Sanders, Hillary Clinton, and Medicare for All

Published: Dec 21, 2015

In his latest column for The Wall Street Journal’s Think Tank, Drew Altman explores the differing positions of presidential candidates Hillary Clinton and Bernie Sanders on a single payer or Medicare-for-all health care system and whether Democratic voters consider it an important factor in the 2016 primaries.

All previous columns by Drew Altman are online.