Characteristics of Remaining Uninsured Men and Potential Strategies to Reach and Enroll them in Health Coverage

Published: Apr 14, 2016

Issue Brief

Summary

This brief provides information on remaining nonelderly uninsured men ages 19-64, provides national estimates of their eligibility for ACA coverage options, and discusses strategies for reaching and enrolling them into health coverage. Data and figures presented in this brief are based on Kaiser Family Foundation analysis of the 2015 Current Population Survey data for nonelderly adults.1  Key findings include:

  • In 2014, nearly 15 million nonelderly adult men were uninsured, accounting for slightly more than half of remaining uninsured adults. Men are more likely to be uninsured than women and less likely to have Medicaid or other public coverage. This pattern reflects the fact that many men were not eligible for Medicaid prior to the ACA, since the program excluded non-disabled adults without dependent children. Nonelderly uninsured men include many young childless adults, but also include fathers and older men. Most (76%) nonelderly uninsured men live in a household with at least one full-time worker, but more than half are low-income. Nearly one-third (32%) of nonelderly uninsured men reported having trouble paying medical bills in 2014.
  • Nationally, an estimated 44% of nonelderly uninsured men are eligible for financial assistance under the ACA (Figure 1). In Medicaid expansion states, over half (55%) of men are eligible for assistance, including over one-third (35%) who are eligible for Medicaid. In contrast, in non-expansion states, one-third (33%) are eligible for assistance, including just 2% who are eligible for Medicaid, while one in five (20%) falls into the coverage gap.
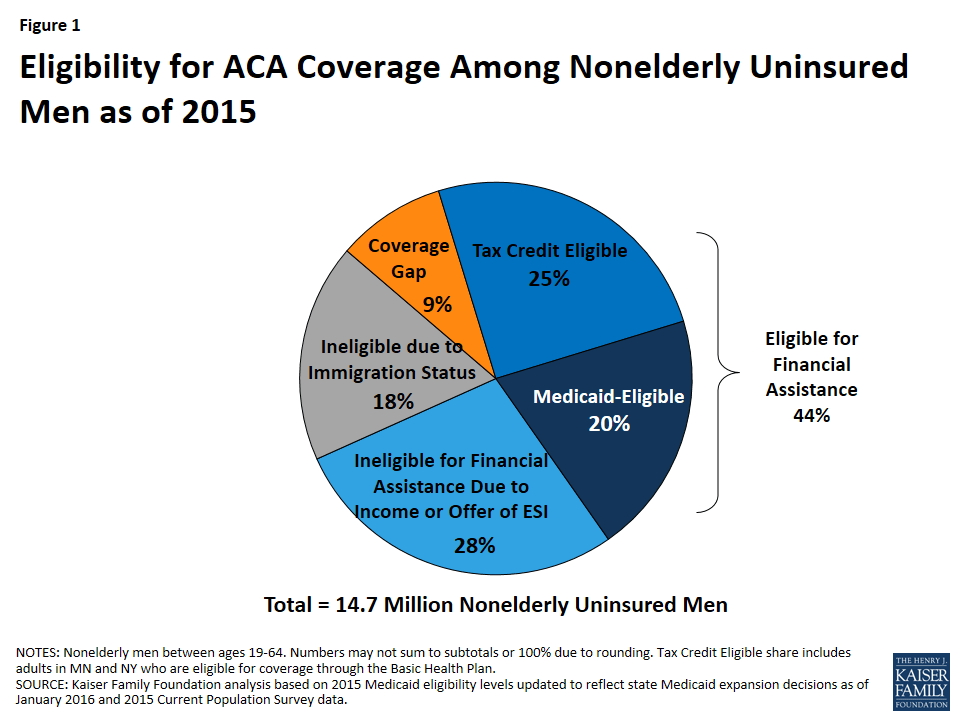
Figure 1: Eligibility for ACA Coverage Among Nonelderly Uninsured Men as of 2015
  • Enrolling eligible uninsured men will be key for continued coverage gains. To reach and enroll uninsured men, longstanding outreach and enrollment strategies used to connect with families will be important, as well as targeted strategies for men, including specific strategies focused on reaching low-income fathers.

Introduction

The Affordable Care Act (ACA) extends health insurance coverage to people who lack access to an affordable coverage option. Under the ACA, as of 2014, Medicaid coverage is extended to low-income adults in states that have opted to expand eligibility, and tax credits are available for middle-income people who purchase coverage through a health insurance Marketplace. Although the number of uninsured adults ages 19-64 declined significantly in 2014, there were still over 27 million uninsured nonelderly adults in the U.S. at the start of 2015 based on analysis of 2015 Current Population Survey data.2  Over half of these adults, or nearly 15 million, were nonelderly uninsured men. This brief provides information on remaining nonelderly uninsured men, describing the characteristics of this population, explaining the importance of health coverage for them, providing national estimates of eligibility for ACA coverage options among this group, and discussing strategies for reaching and enrolling nonelderly uninsured men in health coverage.

How many nonelderly men are uninsured?

In 2014, nearly 15 million men ages 19-64 were uninsured in the U.S. There were a total of nearly 95 million nonelderly men in the U.S. in 2014. Of these men, 67% were covered by employer-based or other private coverage, 18% were covered by Medicaid or other public coverage, while 16% remained uninsured (Figure 2). Compared to women, men are less likely to have Medicaid or other public coverage and more likely to be uninsured. This coverage pattern reflects the fact that, prior to the ACA Medicaid expansion, the program played a very limited role for men since non-disabled adults without dependent children were not eligible.

Figure 2: Insurance Coverage of Nonelderly Adults by Gender, 2014

Uninsured rates for men vary widely across states and by certain characteristics. A man’s likelihood of being uninsured varies based on where he lives. Across states, the uninsured rate for men ranged from a high of 25% in Texas to a low of 6% in Massachusetts.3  Uninsured rates also vary by certain characteristics. For example, men with family income below 100% of the federal poverty level, men with less than a high school education, Black men, Hispanic men, and non-citizen immigrant men are at greater risk of being uninsured compared to the national average (Figure 3). In contrast, the uninsured rate for White men was 11%.

Figure 3: Uninsured Rates Among Nonelderly Men by Selected Characteristics, 2014

Who are nonelderly uninsured men?

Nearly half (45%) of nonelderly uninsured men are young adults between ages 19-35 and three quarters are childless adults. However, this group includes men across the age spectrum and one quarter are fathers (Figure 4).
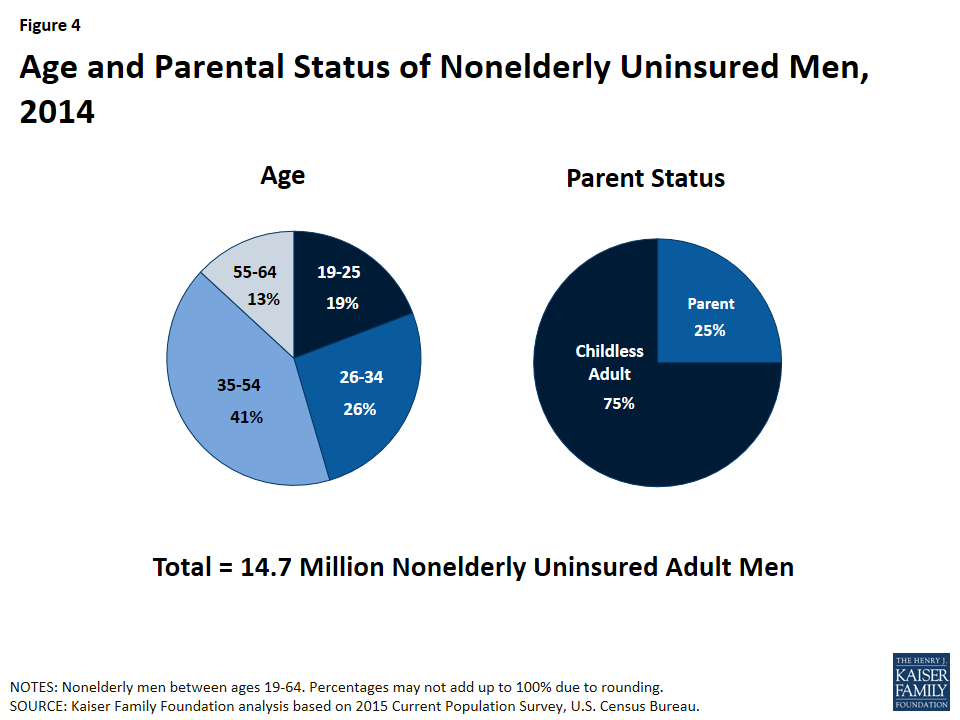
Figure 4: Age and Parental Status of Nonelderly Uninsured Men, 2014

Most nonelderly uninsured men are in working families but have low incomes. Though provisions in the ACA aim to make coverage more affordable for low and moderate-income families, these income groups still make up the majority of the uninsured. More than three-quarters (76%) of nonelderly uninsured men live in a household with at least one full-time worker, but more than half have family income at or below 200% FPL ($40,320 per year for a family of 3 in 2016) (Figure 5).
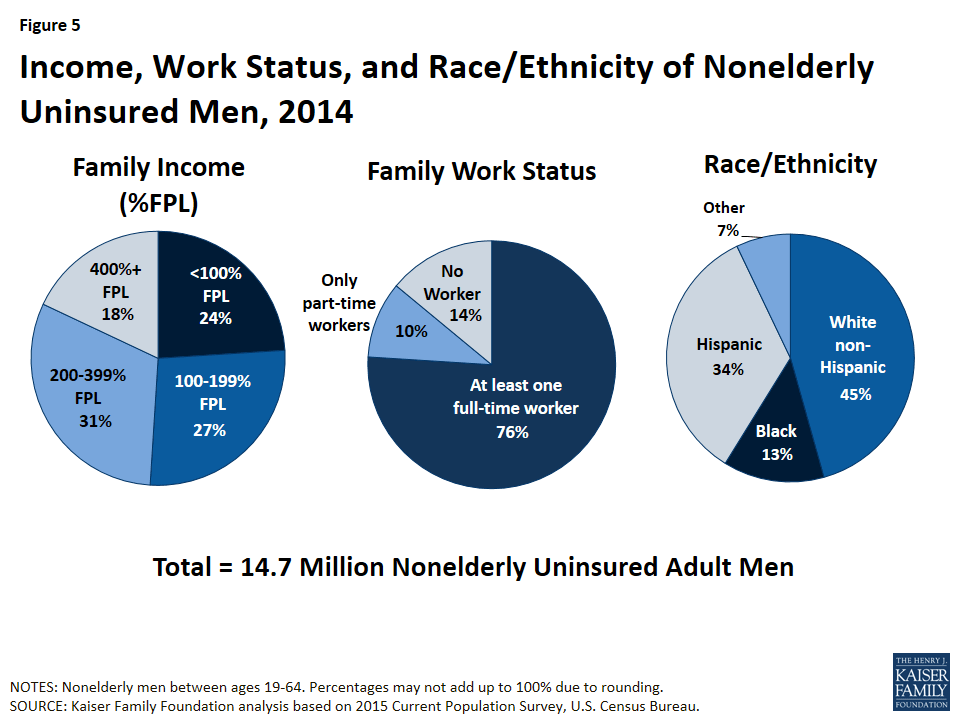
Figure 5: Income, Work Status, and Race/Ethnicity of Nonelderly Uninsured Men, 2014

Men of color represent a disproportionate share of uninsured men. While 37% of all nonelderly men are men of color, men of color account for over half (55%) of nonelderly uninsured men. In 2014, over one-third (34%) of nonelderly uninsured men were Hispanic, 13% were Black, and 7% identified as another non-White group, including Asian, Native Hawaiian or other Pacific Islander, American Indian or Alaska Native, or mixed race.

Why is health coverage for nonelderly men important?

Health insurance makes a difference in whether and when men get necessary medical care, where they get their care, and ultimately, how healthy they are. Health insurance also plays an important role in providing financial protection and stability to families.

Nonelderly uninsured men are less likely to report having a usual source of care and receiving preventive care compared to those with health coverage (Figure 6). Only 36% of nonelderly uninsured men reported having a usual source of care compared to 67% of nonelderly men with Medicaid coverage and 77% of nonelderly men with private coverage. Additionally, nonelderly men with health coverage are more than two times as likely to receive preventive care compared to those who are uninsured.
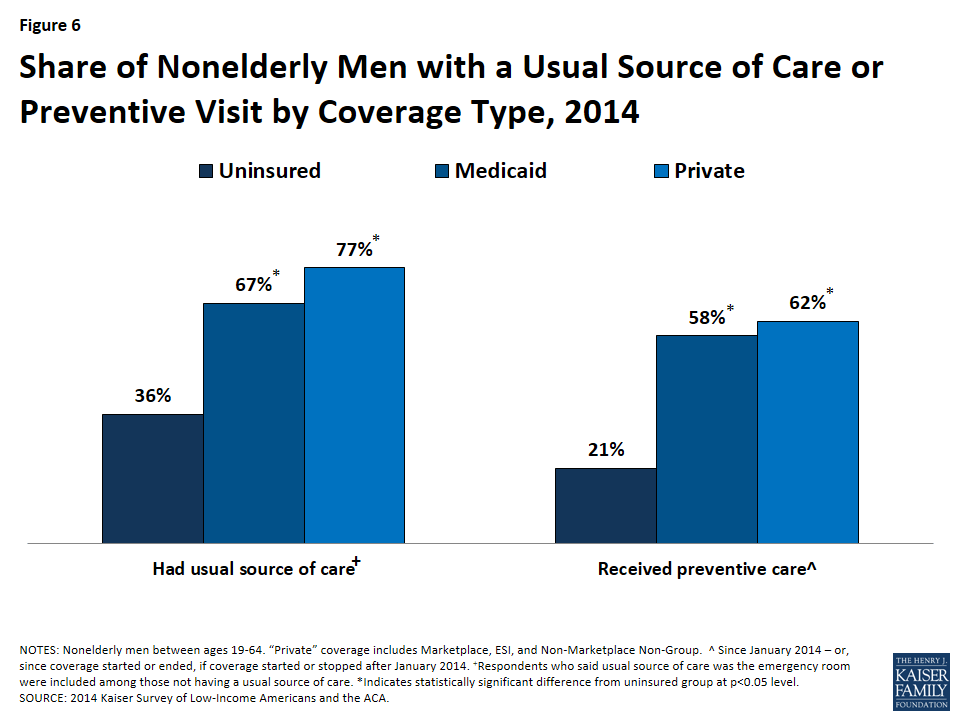
Figure 6: Share of Nonelderly Men with a Usual Source of Care or Preventive Visit by Coverage Type, 2014

Uninsured men are at increased risk of financial strain due to medical bills compared to those with coverage. Nonelderly uninsured men are more likely (32%) than nonelderly men with Medicaid (15%) or nonelderly men with private coverage (10%) to report having trouble paying medical bills in 2014 (Figure 7). Men without coverage are also more likely than those who are insured to report serious financial strain due to medical bills. In 2014, more than one-quarter (27%) of nonelderly uninsured men reported that medical bills caused them to use up all or most of their savings, have difficulties paying for basic necessities, borrow money, or be contacted by a collection agency. In contrast, only 9% of nonelderly men with Medicaid and 7% of nonelderly men with private coverage experienced this type of financial strain due to medical bills.
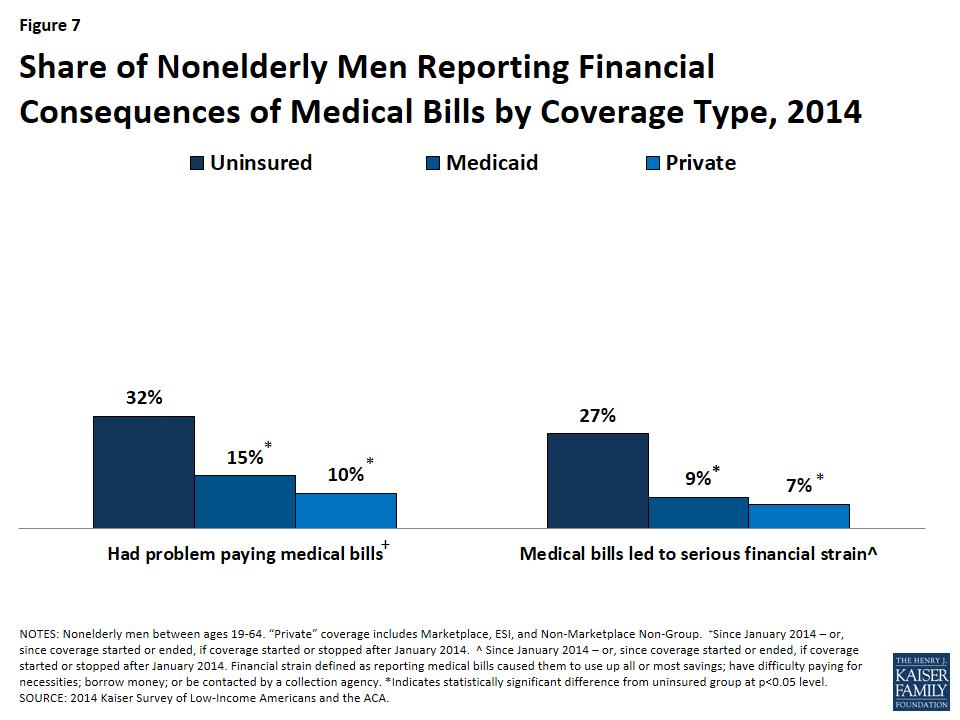
Figure 7: Share of Nonelderly Men Reporting Financial Consequences of Medical Bills by Coverage Type, 2014

How many nonelderly uninsured men are eligible for coverage under the ACA?

The ACA fills historical gaps in Medicaid eligibility by extending Medicaid to nearly all nonelderly adults with incomes at or below 138% of the federal poverty level (FPL) ($27,821 for a family of three in 2016). With the June 2012 Supreme Court ruling, the Medicaid expansion effectively became optional for states. As of February 2016, 31 states and DC had adopted the Medicaid expansion under the ACA.4  The ACA also established Health Insurance Marketplaces where individuals can purchase insurance and allows for federal tax credits for such coverage for people with incomes from 100% to 400% FPL ($20,160 to $80,640 for a family of three in 2016). Tax credits are generally only available to people who are not eligible for other coverage.

Because the ACA envisioned low-income people receiving coverage through Medicaid, people with incomes below poverty are not eligible for Marketplace subsidies. Thus, in the 19 states not implementing the Medicaid expansion, some adults fall into a “coverage gap” – earning too much to qualify for Medicaid but not enough to qualify for premium tax credits. In addition, undocumented immigrants are ineligible for Medicaid coverage and barred from purchasing coverage through a Marketplace.

An estimated 44% of nonelderly uninsured men are eligible for financial assistance under the ACA (Figure 8). Of the nearly 15 million nonelderly uninsured men in the U.S. as of the beginning of 2015, a quarter (25%) is eligible for Marketplace premium tax credit subsidies and 20% are eligible for Medicaid. Nearly one in ten (9%) nonelderly uninsured men fall into the coverage gap in the states that have not adopted the Medicaid expansion. The remainder is not eligible for financial assistance because they have an offer of ESI or have income above the limit for premium tax credits (28%) or due to immigration status (18%). Patterns of eligibility vary by state, depending on state decisions about expanding Medicaid, premiums in the exchange, and underlying demographic factors such as poverty rates and access to employer coverage.
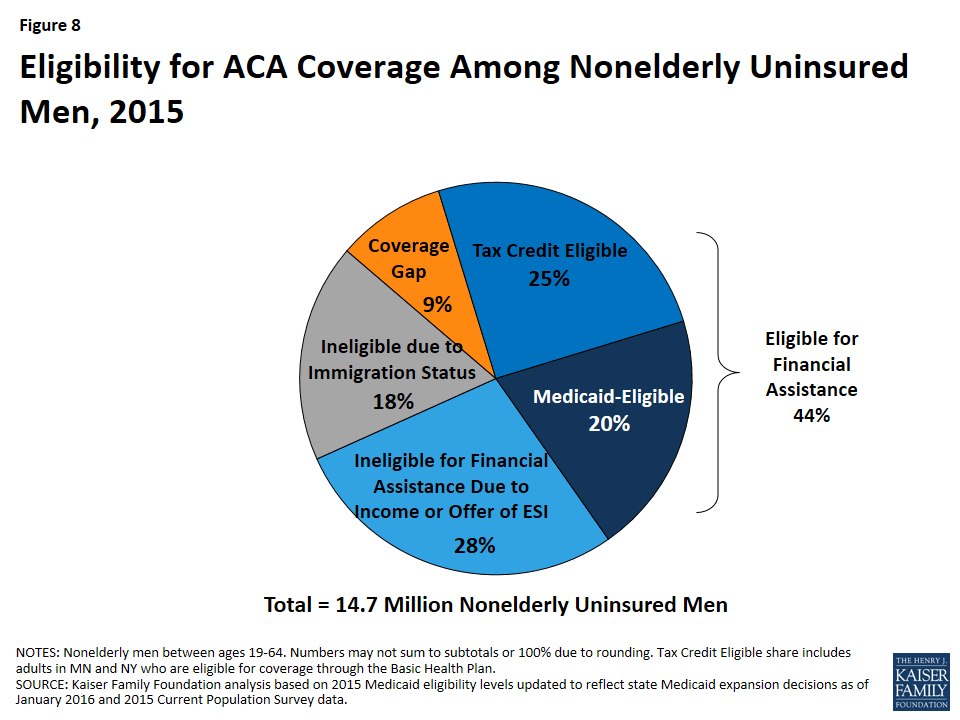
Figure 8: Eligibility for ACA Coverage Among Nonelderly Uninsured Men, 2015

Nonelderly uninsured men in Medicaid expansion states are more likely to be eligible for coverage than those in non-expansion states (Figure 9 and Appendix). In Medicaid expansion states, over half (55%) of men are eligible for Medicaid or subsidized Marketplace coverage, including over one-third (35%) who are eligible for Medicaid. In contrast, in non-expansion states, one-third of (33%) nonelderly uninsured men are eligible for Medicaid or subsidized Marketplace coverage, with just 2% eligible for Medicaid. One in five (20%) nonelderly uninsured men falls into the coverage gap in non-expansion states.
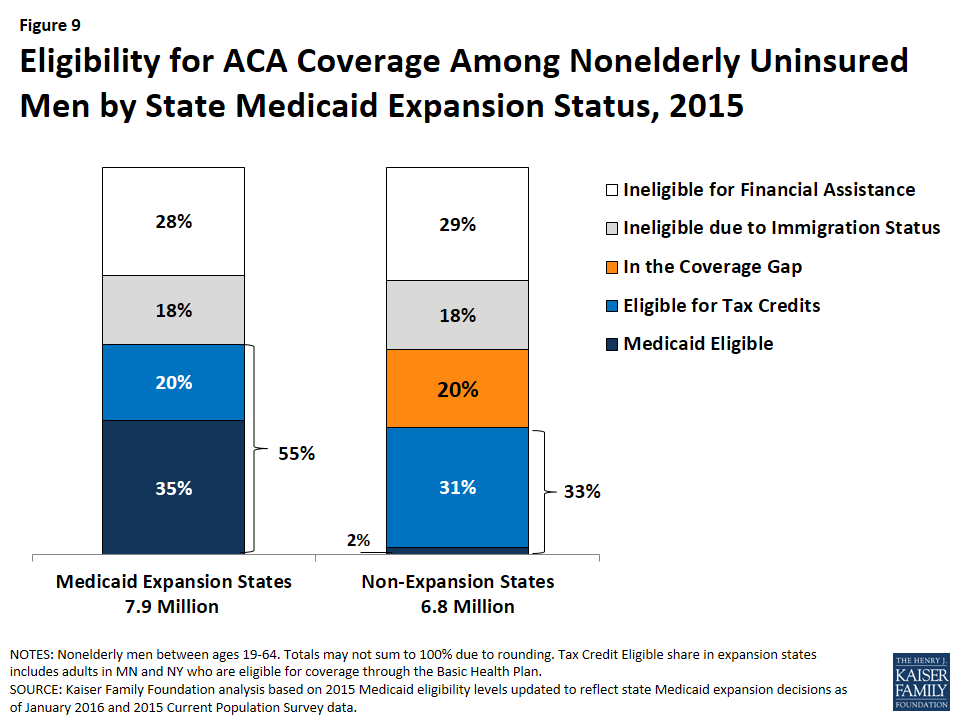
Figure 9: Eligibility for ACA Coverage Among Nonelderly Uninsured Men by State Medicaid Expansion Status, 2015

What strategies can be used to reach and enroll eligible nonelderly uninsured men in health coverage?

With more than four in ten or over six million nonelderly uninsured men estimated to be eligible for coverage, reaching and enrolling these men into coverage would support continued coverage gains among the overall remaining uninsured. Moreover, increasing coverage among men would lead to improved access to care and increased financial protection from medical bills for them, recognizing that one-third of uninsured men reported trouble paying medical bills. While some longstanding outreach and enrollment strategies used to connect families to coverage may help reach and enroll uninsured men, targeted strategies for men will also be important, including strategies focused on reaching low-income fathers.

Eligible but uninsured men face a range of barriers to enrolling in coverage. Men face increased barriers to enrolling in coverage given the historic exclusion of many men from Medicaid prior to the ACA and them placing a relatively low priority on their own health and having health coverage. As such, messaging targeted to men will be important for overcoming these barriers, which include lack of information about the availability of health coverage and financial assistance, less motivation to seek out health coverage, wariness about engaging with government programs, and perceived difficulty with the application and enrollment process.5 , 6 

Providing outreach and one-on-one enrollment assistance through trusted individuals within the community is important for successful enrollment. Enrollment experiences to date point to the importance of conducting an array of outreach and enrollment initiatives through numerous local avenues, including churches, college campuses, beauty and barber shops, local grocery or community stores, libraries and extension centers.7  Recognizing that many uninsured men are in working families, small businesses and job placement sites may also be effective outreach sites. Identifying avenues that facilitate connections with men via trusted individuals will be key for increasing their enrollment. For example, low-income fathers may already be connected to “father-serving” organizations in their communities, making these organizations well positioned to help connect fathers to health coverage. These programs have men with similar life experiences that can serve as trusted messengers and may have an existing physical presence in the neighborhood. Other community-based organizations and agencies that serve men may also serve as effective points of connection, including workforce development programs, child support agencies, and justice system agencies.8 

A combination of broad and targeted messages will be key for reaching and enrolling uninsured men. Individuals learn about health coverage options through multiple avenues, including word of mouth, mass media, and healthcare providers, and have varied preferences about where and how to receive information. Broad-based messages are effective in educating individuals about coverage, but targeted messages and efforts are important for reaching and enrolling hard-to-reach groups, including low-income men and fathers.9  Some messages that have been identified as effective for talking with low-income men and fathers about coverage include, discussing the importance of coverage for maintaining good health and the value of obtaining screenings and preventive care; emphasizing the affordability of coverage options, the availability of financial help, and the financial protections gained from having coverage; and highlighting how gaining coverage supports an individual’s ability to be an effective provider for the family.10 ,11  Messaging about the availability of free in-person enrollment assistance has also been identified as particularly useful.12  Findings also suggest that talking with fathers about their children’s health and health care coverage can offer an effective entry point for talking about their own health and health coverage.13 

Conclusion

Health insurance makes a difference in whether and when people get necessary medical care, where they get their care, and ultimately, how healthy they are. Health coverage may also provide increased financial security. As of the beginning of 2015, there were still over 27 million uninsured nonelderly adults in the U.S. More than half of these uninsured adults were men – or nearly 15 million. An estimated 44% of these men, or nearly 6.5 million, are currently eligible for financial assistance under the ACA. Targeted outreach and enrollment efforts will be key for reaching and enrolling these uninsured men into coverage and achieving continued coverage gains.

Appendix

Table 1: Distribution of Nonelderly Men, Ages 19-64, for ACA Coverage Among Those Remaining Uninsured as of 2015
StateUninsured MenMedicaid EligibleTax Credit EligibleIneligible for Financial Assistance due to Income, ESI offer, or CitizenshipIn the Coverage Gap
US Total14,719,00020%25%46%9%
Alabama246,0000%38%32%30%
Alaska46,00047%27%26%
Arizona338,00045%12%43%
Arkansas134,00038%24%38%
California1,816,00030%18%52%
Colorado264,00031%23%45%
Connecticut133,00020%30%50%
Delaware30,00030%27%43%
DC24,00051%NA43%
Florida1,311,000NA33%43%22%
Georgia665,000NA29%46%22%
Hawaii34,00044%NA43%
Idaho67,000NA33%43%23%
Illinois545,00032%13%55%
Indiana285,00039%24%38%
Iowa87,00035%20%44%
Kansas138,0000%31%49%21%
Kentucky132,00041%NA43%
Louisiana*279,00045%23%32%
Maine56,000NA41%33%18%
Maryland173,00037%NA49%
Massachusetts110,000NANA54%
Michigan374,00045%22%33%
Minnesota^158,00021%NA66%
Mississippi164,000NA33%35%30%
Missouri210,0000%36%43%21%
Montana58,00035%26%38%
Nebraska81,000NA28%56%12%
Nevada146,00041%22%37%
New Hampshire51,00028%20%52%
New Jersey415,00034%15%51%
New Mexico110,00042%16%42%
New York^720,00030%26%44%
North Carolina470,000NA30%43%25%
North Dakota28,00034%31%36%
Ohio414,00041%22%37%
Oklahoma233,000NA33%43%21%
Oregon155,00037%16%47%
Pennsylvania432,00040%21%40%
Rhode Island32,00055%26%NA
South Carolina263,000NA39%41%19%
South Dakota36,000NA35%40%21%
Tennessee273,000NA26%48%23%
Texas1,923,000NA27%54%18%
Utah131,000NA35%45%18%
Vermont18,00029%32%38%
Virginia338,000NA29%54%15%
Washington298,00030%22%48%
West Virginia60,00052%21%27%
Wisconsin190,00024%28%48%
Wyoming26,000NA38%35%27%
NOTES: Percentages may not sum to 100% due to rounding.*LA’s Medicaid Expansion is expected to take effect by July 1, 2016. For purposes of this analysis, LA is considered an expansion state. ^ Tax Credit Eligible share in MN and NY includes adults who are eligible for coverage through the Basic Health Plan. † WI covers adults up to 100% FPL in Medicaid under a waiver but did not adopt the ACA expansion. Some estimates are “N/A” because point estimates do not meet minimum standards for statistical reliability. “-“ indicates state does not have a Medicaid coverage gap.SOURCE: Kaiser Family Foundation analysis of 2015 Current Population Survey, U.S. Census Bureau.

Endnotes

  1. This brief is based on Kaiser Family Foundation analysis of the 2015 Current Population Survey, combined with other data sources; 2014 is the most recent year with full data required for this analysis. We estimate coverage and eligibility as of early 2015, which is prior to the end of the 2015 Marketplace open enrollment period, but this brief reflects state Medicaid expansion decisions as of January 2016. An overview of the methodology underlying the analysis can be found in the Methods box at the end of the data note at: https://modern.kff.org/health-reform/issue-brief/new-estimates-of-eligibility-for-aca-coverage-among-the-uninsured/. ↩︎
  2. Melissa Majerol, Vann Newkirk, and Rachel Garfield, The Uninsured: A Primer: Key Facts About Health Insurance and the Uninsured in the Era Of Health Reform(Washington, DC: Kaiser Commission on Medicaid and the Uninsured, Nov. 2015), https://modern.kff.org/uninsured/report/the-uninsured-a-primer-key-facts-about-health-insurance-and-the-uninsured-in-the-era-of-health-reform/. ↩︎
  3. The Kaiser Family Foundation State Health Facts. Data Source: Kaiser Family Foundation estimates based on the Census Bureau’s March 2015 Current Population Survey (CPS: Annual Social and Economic Supplements), “Health Insurance Coverage of Men 19-64” accessed February 22, 2016, https://modern.kff.org/other/state-indicator/nonelderly-adult-men/. ↩︎
  4. The Kaiser Family Foundation State Health Facts. Data Source: Current status for each state is based on KCMU tracking and analysis of state executive activity, “Status of State Action on the Medicaid Expansion Decision” accessed March 4, 2016, https://modern.kff.org/health-reform/state-indicator/state-activity-around-expanding-medicaid-under-the-affordable-care-act/. ↩︎
  5. RTI International, “Linking Low-Income Fathers to Health Coverage” (presentation, sponsored by Office of Planning, Research, and Evaluation, Administration for Children and Families and Office of the Assistant Secretary for Planning and Evaluation U.S. Department of Health and Human Services Jan. 13, 2016). ↩︎
  6. PerryUndem Research/Communication, “Open Enrollment Round 2: Insights from Uninsured Individuals about Enrolling in Health Coverage through the Health Insurance Marketplace” (presentation, Oct. 2014). ↩︎
  7. Samantha Artiga, Jennifer Tolbert, and Robin Rudowitz, Year Two of the ACA Coverage Expansions: On-the-Ground Experiences from Five States, (Washington, DC: Kaiser Commission on Medicaid and the Uninsured, June 2015), https://modern.kff.org/health-reform/issue-brief/year-two-of-the-aca-coverage-expansions-on-the-ground-experiences-from-five-states/. ↩︎
  8. RTI International, Linking Low-Income Men to Medicaid and the Health Insurance Marketplace, (Washington, DC: Office of the Assistant Secretary for Planning and Evaluation (ASPE) and the Administration for Children and Families (ACF), Nov. 2015), https://aspe.hhs.gov/sites/default/files/pdf/156566/LIM_fathers_brief.pdf. ↩︎
  9. Kaiser Commission on Medicaid and the Uninsured, Key Lessons from Medicaid and CHIP for Outreach and Enrollment Under the Affordable Care Act (Washington, DC: Kaiser Commission on Medicaid and the Uninsured, June 2013), https://modern.kff.org/medicaid/issue-brief/key-lessons-from-medicaid-and-chip-for-outreach-and-enrollment-under-the-affordable-care-act/. ↩︎
  10. RTI International, “Linking Low-Income Fathers to Health Coverage” (presentation, sponsored by Office of Planning, Research, and Evaluation, Administration for Children and Families and Office of the Assistant Secretary for Planning and Evaluation U.S. Department of Health and Human Services Jan. 13, 2016). ↩︎
  11. PerryUndem Research/Communication, “Open Enrollment Round 2: Insights from Uninsured Individuals about Enrolling in Health Coverage through the Health Insurance Marketplace” (presentation, Oct. 2014). ↩︎
  12. Ibid. ↩︎
  13. RTI International, “Linking Low-Income Fathers to Health Coverage” (presentation, sponsored by Office of Planning, Research, and Evaluation, Administration for Children and Families and Office of the Assistant Secretary for Planning and Evaluation U.S. Department of Health and Human Services Jan. 13, 2016). ↩︎

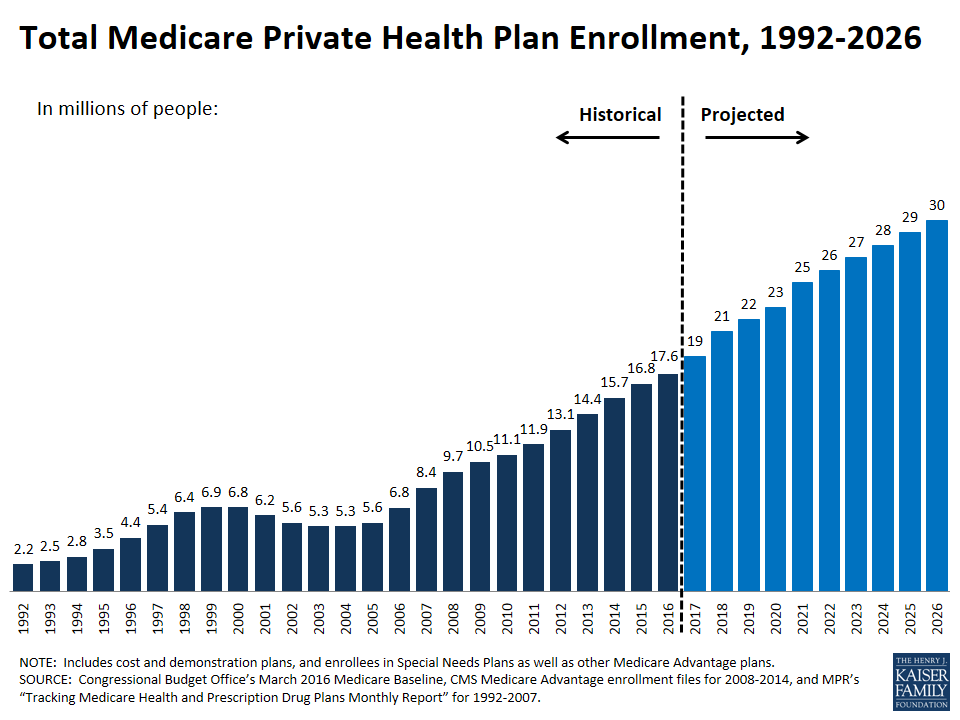
Total Medicare Private Health Plan Enrollment, Current and Projected

Published: Apr 13, 2016

Source

Congressional Budget Office’s March 2016 Medicare Baseline, CMS Medicare Advantage enrollment files for 2008-2014, and MPR’s “Tracking Medicare Health and Prescription Drug Plans Monthly Report” for 1992-2007.

Medicaid Spending Growth Compared to Other Payers: A Look at the Evidence

Authors: Lisa Clemans-Cope, Urban Institute, John Holahan, Urban Institute, and Rachel Garfield
Published: Apr 13, 2016

Executive Summary

Medicaid provided health coverage for over 70 million individuals during the 2013 fiscal year. A number of studies have demonstrated that Medicaid coverage helps to improve receipt of preventive health care, access to care, and out-of-pocket spending burdens and other financial outcomes. However, given ongoing concerns about federal and state budgets, the costs of the Medicaid program are likely to be again at the forefront of state and federal policy discussions. As federal policy makers consider proposals to reform Medicaid financing, this issue brief examines evidence from over 40 methodologically rigorous studies related to Medicaid program spending. Key findings show:

Per capita spending in the Medicaid program is lower compared to private insurers after adjusting for the greater health needs of Medicaid enrollees. One study showed if a low-income adult Medicaid enrollee were instead covered by private health insurance, spending would be over 25 percent higher.1  An early study2  found 18 percent higher spending and attributed the difference to differences in provider payment rates.

Medicaid spending growth primarily has been driven by rising Medicaid enrollment, and spending growth per enrollee in Medicaid has been low compared to other payers. One study showed that from 2007 to 2013, growth in per enrollee Medicaid spending on medical services was the same as GDP per capita growth and lower than growth in national health expenditures per capita, the consumer price index for medical care, and private health insurance per enrollee spending.3 

Lower payment levels in Medicaid have contributed to its relatively low costs. For example, a survey of Medicaid physician fees showed that Medicaid fees were 66 percent of the Medicare fees in 2014,4  and another study showed that Medicaid’s per unit pharmacy costs were less than half of Medicare’s per unit pharmacy costs in 2012.5 

Recent federal budget proposals include provisions to reform Medicaid financing in an effort to reduce federal spending. Some savings may be found from more efficient care delivery (i.e. reductions in emergency room visits or hospital readmissions). However, given Medicaid’s already lower payment rates that contribute to lower per capita spending, such proposals could result in reductions in utilization and/or enrollment as well as additional pressure on states to lower provider payment further. These changes could have adverse effects on beneficiaries’ access to care.

Issue Brief

Introduction

Medicaid provided health coverage for over 70 million individuals during the 2013 fiscal year, with a total cost (including spending by both the federal government and states) of about $460 billion.6  In that year, total spending for Medicaid was 2.8 percent of gross domestic product (GDP). Federal spending for Medicaid was 1.6 percent of GDP, compared to 3.5 percent for mandatory Medicare outlays.7  And in 2014, due to a rapid increase in spending associated mainly with the expansion of Medicaid coverage under the ACA, Medicaid expenditures totaled $494 billion, accounting for 2.9 percent of GDP, with the federal government paying about 60 percent of the total.8 

A number of methodologically rigorous studies have demonstrated that Medicaid coverage helps to improve receipt of preventive health care, access to care, and out-of-pocket spending burdens and other financial outcomes.9 ,10 ,11 ,12 ,13  Fewer studies have assessed the impacts of Medicaid on health, but studies have found positive impacts on infant mortality,14  child mortality,15  HIV mortality,16  adult mortality,17  disease-related mortality,18  and reported mental health status/rates of depression).19 ,20 

In addition, recent evidence suggests that Medicaid coverage has long-term positive effects. Expansions of Medicaid eligibility for pregnant women increased economic opportunity of their children when they reached adulthood through increased rates of high school and college completion and higher incomes.21 ,22 ,23  In addition, children who gained eligibility for Medicaid paid more in cumulative taxes by age 28 compared to similar children who did not gain Medicaid coverage, such that the government is estimated to recoup 56 cents of each dollar spent on Medicaid during childhood by the time the children reach age 60.24 

Despite Medicaid’s positive effects, Medicaid is a significant expenditure item and consequently, a major target for cost-cutting in federal and state budget debates. Medicaid, like other payers, has room to improve the efficiency of the services that are provided.25 ,26 ,27  While this brief does not examine efficiency or quality of care, we recognize the potential for savings likely exists in Medicaid as well as other payers due to inefficient patterns of care (such as overreliance on emergency department care, unnecessary tests, over-prescribing of drugs), medical mistakes and other inefficient spending. At the same time, the relatively low provider payment levels in Medicaid may affect access to providers and have other negative impacts for Medicaid beneficiaries.

Given ongoing concerns about federal and state budgets, the costs of the Medicaid program are likely to be again at the forefront of state and federal policy discussions. To inform these discussions, this brief summarizes findings from studies on Medicaid program spending from both peer-reviewed journals and “grey literature” such as working papers and reports from academic and other research centers. We first examine literature that compares spending for Medicaid enrollees to spending for those with private insurance, focusing on broad, national populations and studies that were published in the last 15 years, using multiple regression methods to control for differences between the two groups in the health status and health risks of enrollees. We then examine literature that assesses the rate of growth of spending and per capita spending in Medicaid compared with other payers and other benchmarks. For this examination, due to the timely nature of the topic, we reviewed studies that were released in the last three years and included estimates of per capita Medicaid spending and growth trends, as well as selected studies of provider payment. Several other studies not included in this examination have similar findings and draw on the same data sources.

Findings from a Literature Review on Spending in the Medicaid Program

How do health care needs for Medicaid enrollees compare to the low-income privately insured population?

When comparing historical per capita spending between Medicaid and private coverage, it is critical to account for the fact that Medicaid enrollees have had far greater health care needs and a greater prevalence of disability compared to low-income privately insured population, at least prior to 2014. (These differences are likely linked to Medicaid eligibility pathways, several of which are targeted to adults with health needs. Differences could attenuate somewhat with the ACA expansion population in 2014.) A 2013 study using data from 2003 to 2009 showed that, among low-income adults (with family income below 138 percent of the federal poverty level [FPL]), Medicaid enrollees reported poorer physical and mental health, more limitations, and more comorbidities than did privately insured adults in the same income group.28  In particular:

  • Over half (53.3 percent) of adults enrolled in Medicaid reported a health limitation, compared to just one-fifth (21.0 percent) of the low-income privately insured adults.
  • Medicaid enrollees had greater health care needs than low-income privately insured population on a host of other measures as well, such as a higher prevalence of multiple chronic conditions (48.3 percent versus 31.6 percent), a higher prevalence of non-chronic conditions (69.6 percent versus 59.8 percent), a higher prevalence of mental illness or substance abuse (37.8 percent versus 18.6 percent), and a higher prevalence of other conditions such as asthma, diabetes, heart disease, hypertension, back conditions, bronchitis/respiratory conditions, and digestive/gastrointestinal conditions.

How does spending per enrollee in Medicaid compare to private insurance?

Spending per enrollee is lower for Medicaid compared to private insurance after controlling for differences in socio-demographic and health characteristics between the two groups. Given the significant health and disability differences between Medicaid enrollees and those who are privately insured, the most rigorous research examining differences in per enrollee spending has focused primarily on regression-adjusted comparisons that control for these underlying differences in the need for health care.

An early study29  used data from 1996 to 1999 and found that after adjusting for health and socio-demographic factors, total spending would be 18 percent higher for adults if a typical low-income adult with Medicaid were instead covered by private health insurance. The underlying driver of the difference in total expenditures was differences in provider payment rates.

  • The study found no evidence that spending differences between Medicaid and private coverage for low-income enrollees were due to lower service use of Medicaid enrollees.
  • If adults with Medicaid coverage were given private coverage, medical spending was predicted to increase from $3,250 to $3,848, an increase of over 18 percent, while spending for children would be virtually unchanged.

Updating and expanding on the previous research, another study30  used MEPS data from 2005 and found that after adjusting for health and socio-demographic factors, total health care spending for a typical low-income Medicaid adult or child would have been far higher if covered by private health insurance. In particular, if a typical low-income Medicaid adult or child were instead covered by private health insurance, total spending would be 26 percent higher for adults and 37 percent higher for children.

  • The study estimated that total health care spending would increase nearly 26 percent, from $5,671 per person per year to $7,126, if a typical low-income Medicaid adult were covered by private health insurance for a full year. In addition, total health care spending would increase 37 percent, from $909 per child per year to $1,247, if a low-income Medicaid or CHIP-enrolled child were covered instead by private health insurance for a full year.
  • The study also showed that out-of-pocket spending was estimated to be six to seven fold higher under private insurance than under public insurance.

Subsequent research with the 2005 MEPS31  examined use and expenditures for different types of services (e.g. inpatient hospital, outpatient hospital, emergency department, office-based physician, prescription drugs, and other)32  and found that after adjusting for health status and other factors, if adults enrolled in private coverage were instead enrolled in Medicaid, physician expenditures would be 34%.

  • Regression adjusted estimates showed lower spending for adults under Medicaid compared to privately insured adults for all service types, including emergency department care (8 percent), and significantly lower expenditures for inpatient hospital care (33 percent) and outpatient hospital care (40 percent).
  • Regression adjusted estimates for a typical privately insured child showed lower spending under Medicaid than under private coverage for all service types except for inpatient hospital care, which the authors attributed to the possibility of either expenditure misclassification or substitution of outpatient for inpatient hospital services for children.

A 2013 study33  used pooled MEPS data from 2003 to 2009 to compare health care access, use, and spending for low-income adults enrolled in Medicaid to their counterparts with private employer-sponsored insurance.34  The authors found that regression-adjusted comparisons generally showed that enrollees are less costly to insure in Medicaid. In fact, adjusting for health and socio-demographic factors using multiple regression techniques, the study found that if a low-income adult enrolled in Medicaid was instead covered by private health insurance, insurer payments (not including out-of-pocket costs) would be over 25 percent higher.

  • The study also found that Medicaid provides access to health care services comparable to that of the privately insured sample but at significantly lower costs. In addition, the study found that the likelihood of using most health care services (e.g., primary care doctors, prescription drugs and inpatient care) would not differ significantly if Medicaid enrollees were instead covered by private insurance, with the exception of lower emergency department use and more specialist visits in private coverage.
  • Additionally, given the differences in benefit design between the private plans and Medicaid, out-of-pocket spending for health care services was estimated to be over three times as high if Medicaid enrollees were instead covered by private insurance.

Lastly, after the 2012 Supreme Court Decision that rendered the Medicaid expansion optional for states under the ACA, the Congressional Budget Office (CBO) estimated per capita spending levels if individuals were covered under the new ACA exchanges as opposed to Medicaid. CBO projected that that federal spending would increase by roughly $3,000 by 2022 for each such person on average. The CBO estimated that, on average, exchange subsidies would cost the federal government about $9,000 while the Medicaid costs would have been roughly $6,000.35 

Table 1. Data, methods and findings for selected studies of the differences in risk-adjusted spending between Medicaid and private health insurance
StudyData yearsSampleData SourceStudy DesignComparisonFindings
(Hadley and Holahan 2003)1996, 1997, 1998, and 1999Low-income (income ≤ 200% FPL) nonelderly adults (19-64 years old) and children (0-18)Medical Expenditure Panel Survey (MEPS)Multiple regression techniques to compare insurance status, including a two-part model of expendituresComparison of annual per capita medical expenditures for low-income nonelderly individuals with Medicaid coverage and private insuranceIf a typical low-income Medicaid adult were instead covered by private health insurance, total spending would be 18 percent higher for adults. The authors concluded that the underlying driver of the difference in total expenditures were differences in provider payment rates.
The models for adults controlled for gender, age, race and ethnicity, education, family income relative to poverty, marital status, self-reported health, functional status and limitations, and acute and chronic medical conditions. The models for children controlled for gender, age, race and ethnicity, family income relative to poverty, parents’ education and marital status, self-reported health, functional status and limitations, and acute and chronic medical conditions. All models also include controls for census region.
(Ku and Broaddus 2008)2005Low-income (income ≤ 200% FPL), nonelderly adults (19-64 years old) and children (0-18)Medical Expenditure Panel Survey (MEPS)Multiple regression techniques to compare insurance status, including a two-part model of expendituresComparison of annual per person total and out-of-pocket medical spending for Medicaid and privately insured groups.If a typical low-income Medicaid adult or child were instead covered by private health insurance, total spending would be 26 percent higher for adults or 37 percent higher for children. The authors noted large differences in out-of-pocket spending, where out-of-pocket spending burdens were far lower in Medicaid than in private coverage.
The models for adults and children controlled for gender, age, race/ethnicity, family income as a percent of poverty, region of residence, self-reported health status (e.g., fair or poor), self-reported mental health status, presence of chronic diseases (including arthritis, asthma, diabetes, emphysema, heart disease, or hypertension), pregnancy (as indicated by having a child in the last year) and presence of activity limitations (including Activities of Daily Living, Instrumental Activities of Daily Living, functional and sensory limitations). The models for adults also controlled for educational attainment, employment and marital status. The models for children also controlled for the presence of siblings.
(Ku 2009)2005Low-income (income ≤ 200% FPL), nonelderly adults (19-64 years old) and children (0-18)Medical Expenditure Panel Survey (MEPS)Multiple regression techniques to compare insurance status, including a two-part model of expendituresComparison of utilization and expenditures under Medicaid and private health insurance for low-income adults and children, by type of service (inpatient hospital, outpatient hospital, emergency department, office-based providers, dental, prescription drugs, and other).For adults, this study found significantly lower expenditures under Medicaid for all services except prescription drugs. If adults enrolled in private coverage were instead enrolled in Medicaid, inpatient hospital, outpatient hospital, and office-based provider expenditures would be 33 to 40 percent lower. For children, expenditures were lower for outpatient hospital, emergency, and office-based expenditures under Medicaid but higher for inpatient hospital expenditures.
The models adjust for age, gender, race/ethnicity, income (below poverty versus 100% to 200% of the FPL), self-reported health status (fair/poor versus excellent, good/very good vs. excellent), self-reported mental health status (fair/poor versus other), diagnosis of chronic disease (arthritis, asthma, diabetes, emphysema, heart disease, hypertension), pregnancy (having had a child in the last year), activity limitation (any vs. none, including Activities Of Daily Living, activity, functional or sensory limitations), and region of country (south, Midwest, or northeast versus west). For adults, the models also controlled for employed, marital status, and educational attainment (no high school vs. college or more; high school or GED vs. college or more). For children, the models also controlled for the presence of siblings.
(Coughlin, et al. 2013)2003 to 2009Low-income (income ≤ 138% FPL), nonelderly adults (19-64 years old)Medical Expenditure Panel Survey (MEPS)Multiple regression techniques to compare insurance status, including a two-part model of expendituresComparison of utilization and expenditures under Medicaid and private employer-sponsored insurance for low-income adults; by type of service (inpatient hospital, emergency department, outpatient separately for general doctor and specialist, prescription drugs, and out-of-pocket).If a low-income adult enrolled in Medicaid was instead covered by private health insurance, total spending would be over 25 percent higher (not including estimated out-of-pocket costs). Out-of-pocket (OOP) spending for health care services would be three times higher if Medicaid beneficiaries were instead covered by employer-sponsored coverage.
The models controlled for sex, age, race/ethnicity, marital status, smoking status, any dependents in the family, educational status (high school graduate or higher), family income (below 50%, 50 to 100%, or 100 to 138% of the FPL), self-reported health status, physical and mental health as measured by the Physical Component Summary (PCS) and the Mental Component Summary (MCS) from the Short-Form 12 (SF-12®); presence of more than one chronic condition (asthma, diabetes, heart disease, hypertension, back conditions, bronchitis/respiratory conditions, mental illness/substance use disorder, and digestive/gastrointestinal conditions), presence of any limitation (cognitive, social, physical limitations, where physical limitations includes limitations in the ability to perform Activities Of Daily Living or Instrumental Activities Of Daily Living); SSI status; and household employment status. All models also controlled for characteristics of the local community including: geographic region indicators; Medicare managed care adjusted average per capita cost (AAPCC) reimbursement rates by county; presence of Federally Qualified Health Centers (FQHCs) by county; number of general doctors and specialists per person by county; number of short-term general hospital beds per person by county; and unemployment rate by county.

How does spending growth in Medicaid compare to private payers and Medicare?

In this section, we examine literature assessing the rate of growth of spending and per capita spending in Medicaid compared with other payers, as well as other benchmarks such as per capita growth in GDP and the rate of general medical cost inflation. We find that the evidence suggests that Medicaid has constrained costs as well as, or better than, Medicare and private insurance. The relevant studies are summarized in Table 2.

Medicaid spending growth between 2007 and 2013 was heavily driven by rising enrollment over and above inflation, as demonstrated in a series of annual studies.36 ,37 ,38 

  • The most recent study found that total spending on medical services in Medicaid increased by an average annual rate of 5.7 percent from 2007 to 2013, with higher spending growth of 6.9 percent during the recessionary period (2007 to 2010) and slower spending growth of 4.4 percent after the recession (2010 to 2013).39 
  • During the recessionary period (2007 to 2010), enrollment among families grew at 7.2 percent per year on average compared to 3.3 percent per year on average among the disabled and elderly. After the recession (2010 to 2013), enrollment growth among families slowed to 3.1 percent per year while remaining fairly steady at 2.9 percent per year among the disabled and elderly. In 2013, over two-thirds of Medicaid enrollees (39.8 million) were non-disabled adults and children, and of the disabled and elderly enrollees, most were dually eligible for Medicaid and Medicare.
  • After adjusting for the changing composition of Medicaid enrollees (i.e. by age and disability status), annual per capita Medicaid spending growth on a per enrollee basis was just 1.7 percent from 2007 to 2013, with higher per capita spending growth of 2.2 percent during the recessionary period (2007 to 2010) and slower per capita spending growth of 1.3 percent after the recession (2010 to 2013).

This research also showed that growth in Medicaid spending per enrollee was relatively low compared to several health spending benchmarks from 2007 to 2013.40 

  • Average annual per enrollee Medicaid spending on medical services increased by 1.7 percent per year from 2007 to 2013, compared to GDP per capita growth of 1.7 percent, average annual per capita growth of 3.1 percent for national health expenditures and average annual growth of 3.2 percent for the consumer price index (CPI) for medical care.
  • At 3.1 percent, average annual spending growth per enrollee for Medicaid acute care (i.e. excluding long term care and including managed care expenses as acute care) was about 33 percent lower than the 4.6 percent average annual spending growth per enrollee for private health insurance, which provides primarily acute care benefits.

CBO analysis of historical cost growth up to 2014 showed that Medicaid spending increased as a share of GDP primarily due to rising Medicaid enrollment; it also found that excess cost growth (defined below) in Medicaid was lower than for other payers.41 

  • CBO analysis shows that that Medicaid spending growth was mainly driven by rising enrollment and that the Medicaid program has controlled costs per enrollee more than other programs.
  • The CBO’s estimate of excess cost growth, which measures the extent to which growth in adjusted health care spending exceeds growth in potential output per person,42  shows that Medicaid’s excess cost growth on a per enrollee basis has been lower than other payers. Between 1990 and 2013, Medicaid spending growth was just 0.3 percentage points higher than spending growth for the overall economy, whereas overall health spending growth outpaced growth of the overall economy by 1.1 percentage points.
  • In addition, the CBO analysis shows that excess cost growth in Medicaid was lower than in that Medicare and other sources since 1975.43  The weighted average rate of excess cost growth in Medicaid was 1.5 percent between 1975 and 2013, compared to 1.9 percent in Medicare and 1.8 percent for other health care spending.44 

Consistent with the CBO findings, a paper by Iglehart and Sommers published in 2015 examined Medicaid spending over an even longer time frame—since 1966—also finding that Medicaid spending growth has been driven primarily by increased enrollment.45  Additionally, the paper finds that inflation-adjusted per capita Medicaid spending was flat or declining between 1998 and 2014.

In a recent report, the CMS Office of the Actuary analyzed historical growth rates in per enrollee Medicaid expenditures during the 10-year period 2004 and 2013, finding that the effect of enrollment mix—or the difference between the increase in Medicaid benefit expenditures per enrollee and the increase in Medicaid benefit expenditures per enrollee if enrollment were held constant each year— on Medicaid expenditures varies widely across years.46 

  • After adjusting for the changing composition of Medicaid enrollees on expenditures, Medicaid benefit expenditures per enrollee grew at an average annual rate of 1.7 percent from 2004 to 2013. Over that 10-year period, adjustments for the effect of enrollee composition on spending varied widely, from −2.4 percent to 1.4 percent.

Finally, National Health Expenditure (NHE) estimates show that Medicaid spending growth in 2014 is likely faster than recent historical trends due to enrollment47  —and that Medicaid has generally constrained per capita spending growth more than any other payer.48 

  • National Health Expenditure Projections from the Center for Medicare and Medicaid Services (CMS) Office of the Actuary show that in 2012 and 2013, historical data indicate that Medicaid health spending grew 5.4 percent and 6.1 percent, respectively, whereas Medicaid spending was estimated to have grown 12.0 percent in 2014, largely as a result of the expansion of Medicaid eligibility under the ACA.
  • In fact, while annual spending growth rates in Medicaid were similar or higher than in Medicare or private coverage between 2007 and 2014, the NHE analysis showed that per capita Medicaid spending growth was below that of Medicare and private coverage over most of that period. For example, in 2012, the annual growth in per enrollee expenditure was 0.5 percent in Medicaid, compared to 2.7 percent in Medicare and 4.8 percent in private insurance.
Table 2: Selected Studies Comparing Medicaid Total and Per Capita Spending Growth to Private Payers and Medicare
StudyData yearsMain Data SourceSelected Findings
(Garfield, et al. 2015)2007 to 2013The Medicaid Financial Management Reports (CMS Form 64) from CMS for federal fiscal years 2007 to 2013; Medicaid Statistical Information System (MSIS) data from 2010; Kaiser/HMA enrollment dataOn a per enrollee basis, Medicaid annual spending growth was 1.7 percent from 2007 to 2013, with higher per capita spending growth of 2.2 percent during the recessionary period and slower spending growth of 1.3 percent after the recession.Average annual per enrollee Medicaid spending on medical services increased by 1.7 percent per year from 2007 to 2013, compared to GDP per capita growth of 1.7 percent, average annual per capita growth of 3.1 percent for national health expenditures and average annual growth of 3.2 percent for the consumer price index (CPI) for medical care.
(Congressional Budget Office 2015)1975 to 2014; 1990 to 2013The CMS Form 64; Other data include the 2015 Medicare Trustees Report.CBO analysis of cost growth between 1990 and 2014 showed that Medicaid spending increased as a share of GDP primarily due to rising Medicaid enrollment. Between 1990 and 2013, Medicaid spending growth was just 0.3 percentage points higher than spending growth for the overall economy, whereas overall health spending growth outpaced growth of the overall economy by 1.1 percentage points. In addition, historically, excess cost growth in Medicaid was lower than for other payers.
(Iglehart and Sommers 2015)1966 to 2014Data provided by the Medicaid and CHIP Payment and Access Commission (MACPAC).Medicaid spending growth has been driven primarily by increased enrollment and per capita Medicaid spending has been flat or declining since 1998 up through 2014.
(CMS Office of the Actuary 2014)2004 to 2013CMS Form 64 and MSISDuring the 10-year period 2004 and 2013, the disproportionately high enrollment of children and non-aged/non-disabled adults over the period reduced spending on a per enrollee basis. After adjusting to exclude the effect of changes in the enrollee mix (i.e. the costliness of enrollees) on expenditures, Medicaid benefit expenditures per enrollee grew at an average annual rate of 1.7 percent from 2004 to 2013.
(Keehan, et al. 2015)2007 to 2014National Health Expenditure (NHE) Accounts and ProjectionsMedicaid spending growth in 2014 is likely faster than recent historical trends due to enrollment. In 2012 and 2013, Medicaid health spending was estimated to have grown 5.4 percent and 6.1 percent, respectively. This analysis shows that Medicaid spending grew 12.0 percent in 2014, largely as a result of the expansion of Medicaid eligibility under the ACA. In addition, per capita Medicaid spending growth has historically been below that of Medicare and private coverage in most years. For example in 2012, the annual growth in per enrollee expenditure was 0.5 percent in Medicaid, compared to 2.7 percent in Medicare and 4.8 percent in private insurance.

How does provider payment and prescription drug payment in Medicaid compare to other payers?

The research reviewed above, which shows that Medicaid spending per capita and Medicaid spending growth have historically been relatively low despite a disproportionately sick enrollee population with more health problems, raises questions about how the cost savings has been achieved. Cost-containment efforts, such as expanded enrollee copayments and pharmacy management tools (e.g. preferred drug lists [PDLs]), as well as constrained access, have almost certainly played a role in constraining costs in the Medicaid program. However, a critical factor driving savings appears to be low payment rates.49 

A handful of studies have assessed how provider payments for particular services under Medicaid fee-for service (FFS) or Medicaid managed care compare with provider payments under Medicare or private insurance. In these studies, Medicaid is generally demonstrated to have lower payment rates. The studies are summarized in Table 3.

Between 1993 to 2014, researchers at the Urban Institute produced multiple studies that have shown that part of the reason that Medicaid is successful in constraining costs is that the program has consistently had lower fees for physician services compared with the fees paid by private payers or Medicare.50 ,51 

  • Most recently, a 2014 Urban Institute study collected data on Medicaid physician fees for 27 procedure codes for three types of services: primary care, obstetric care, and other services.52  The researchers computed a state-specific Medicare-to-Medicaid fee index, or the ratio of the Medicaid fee for each service in each state to the Medicare fee for the same service. The study showed that, on average, Medicaid fees in the survey were 66 percent of the Medicare fees.

A recent study of payments per inpatient hospital stay between 1996 and 2012 compared inflation-adjusted payment rates that were also standardized across patient and stay characteristics; it found that private insurance had the highest rates, followed by Medicare and then Medicaid—with Medicaid payment rates averaging approximately 90 percent of Medicare rates across the period.53  However, the study did not include supplemental Medicaid payments to hospitals.

A 2015 analysis by the Office of Inspector General (OIG) demonstrated that Medicaid’s per unit pharmacy costs were less than half of Medicare’s per unit pharmacy costs—with much of the savings due to Medicaid’s rebate policies.54 

  • The study evaluated the costs of 200 selected brand-name drugs and found that pharmacy average unit costs were similar under Medicare Part D and Medicaid. For example, the average unit reimbursement amounts in Medicare Part D and Medicaid differed by less than 2 percent for 135 of the 200 selected drugs.
  • However, Medicaid’s average net unit pharmacy costs (the average unit pharmacy reimbursement amounts minus the average unit rebate) were far lower than net unit costs under Medicare’s Part D in 2012.
  • For the selected brand-name drugs in the study, median Medicaid unit rebate amounts were three times higher than median Medicare Part D unit rebate amounts, and for 37 of the selected drugs, median Medicaid unit rebate amounts were over 10 times higher than those for Medicare Part D. Medicare Part D unit rebate amounts exceeded Medicaid for just two of the selected drugs in the study. (Median unit rebate amounts in dollars were not published in the study.)
  • After accounting for rebates in both programs for the selected brand-name drugs in the study, Medicaid net unit costs were less than half of Medicare Part D net unit costs for 110 of the selected brand-name drugs. Medicaid net unit costs were lower than Medicare Part D net unit costs for all but five of the brand-name drugs. Overall, while Medicaid drug expenditures in 2012 were lower than Medicare Part D expenditures at $35.7 billion compared to of $66.5 billion, Medicaid drug rebates were higher than Medicare, at $16.7 billion compared to $10.3 billion. Thus, rebates totaled 46.8 percent of Medicaid drug spending, compared to just 15.5 percent of Medicare Part D spending.

A 2014 GAO study demonstrated that provider payments for selected services under Medicaid FFS and Medicaid managed care were generally substantially lower—about 30 to 65 percent lower—than private insurance.55 

  • The report examined how payments for 26 evaluation and management (E/M) services (including E/M for office visits, hospital care, and emergency care) in selected states compare under Medicaid FFS and Medicaid managed care and private health insurance.
  • The study found that Medicaid rates were generally lower than private insurance in 2009 and 2010, prior to the temporary payment increases mandated by the Health Care and Education Reconciliation Act of 2010 (HCERA).
  • In the 40 states where data were available, Medicaid FFS payments were 27 to 65 percent lower than private insurance in 31 of the 40 states. In the 23 states where data was available to compare Medicaid managed care payments to private insurance, GAO found that Medicaid managed care payments to providers were 31 to 65 percent lower than private insurance in 18 of the 23 states. The GAO found that Medicaid payments generally were lower than private insurance for all three types of E/M assessed, and that the magnitude of the payment differences was generally largest for emergency care and smallest for office visits.

A 2015 chartpack published by the American Hospital Association (AHA) examined reimbursements for hospital-based services for community hospitals, finding that Medicaid reimbursements are far lower than those for private payers.56 ,57 

  • This analysis of aggregate hospital payment-to-cost ratios for hospital-based services financed by Medicaid, Medicare, and private payers from 1993 through 2013 shows that Medicaid rates have historically been far lower than private payers, and similar to Medicare levels. This study included Medicaid and Medicare Disproportionate Share Hospital (DSH) payments. In 2013, while aggregate private payment-to-cost ratios were near 145 percent, Medicaid ratios were about 89 percent and Medicare ratios were about 88 percent. The gap between Medicaid and private payer ratios is larger than a decade earlier, when private payment-to-cost ratios were about 122 percent and Medicaid ratios were about 92 percent.
Table 3. Selected Studies Comparing Provider Payment and Prescription Drug Payment for Medicaid and Other Payers
StudyData yearsMain Data SourceSelected Findings
(Zuckerman, Skopec and McCormack 2014)2012 and 2014Urban Institute 50-State Survey of Medicaid Physician Fees; Medicare Physician Fee

Schedule.

On average, Medicaid fees for the 27 services surveyed averaged just 66 percent of the Medicare fees. For primary care services (not including the ACA primary care fee bump) Medicaid fees were even lower relative to Medicare, at about 59 percent of Medicare fees, and state variation was considerable, a trend that continued from previous survey findings.
(Selden, et al. 2015)1996 to 2012Medical Expenditure Panel Survey (MEPS)After standardizing across patient and stay characteristics, inflation-adjusted payments per inpatient hospital stay were highest in private insurance, followed by Medicare and then Medicaid—with Medicaid payment rates averaging approximately 90 percent of Medicare rates across the period. However, the study did not include supplemental Medicaid payments to hospitals, and differences between Medicaid and Medicare in most years were not significantly different from zero.
(Levinson 2015)2012CMS Medicare Part D and Health Plan Management System data, Medicare Trustees’ Report, CMS Medicaid Budget and Expenditure System (MBES), Medicaid State utilization data, Medicaid unit rebate amounts (URAs)This Office of Inspector General (OIG) report demonstrated that Medicaid’s pharmacy costs were less than half of Medicare’s pharmacy costs for 110 of the 200 selected brand-name drugs.
(GAO 2014)2009 and 2010Medicaid Analytic eXtract (MAX), selected data from Medicaid

managed care organizations (MCO), and the Truven Health Analytics

MarketScan® Commercial Claims and Encounters Database

The study found that Medicaid rates were generally lower than private insurance in 2009 and 2010. In the 40 states where data was available, Medicaid FFS payments were 27 to 65 percent lower than private insurance in 31 of the 40 states. In the 23 states where data was available to compare Medicaid managed care payments to private insurance, GAO found that Medicaid managed care payments were 31 to 65 percent lower than private insurance in 18 of the 23 states.
(American Hospital Association 2015)1993 to 2013American Hospital Association Annual Survey data for community hospitalsThis comparison of aggregate hospital payment-to-cost ratios for hospital-based services financed by Medicaid, Medicare, and private payers showed that Medicaid rates have historically been far lower than private payers and similar to Medicare levels.

Conclusion

This brief reviewed literature assessing a range of evidence on Medicaid program spending. Overall, the literature shows that per capita spending in the Medicaid program is lower compared to private insurers after adjusting for the greater health needs of Medicaid enrollees; Medicaid spending growth has been primarily driven by rising Medicaid enrollment; spending growth per enrollee in Medicaid has been low compared to other payers; and lower payment levels in Medicaid have contributed to its relatively low costs. Recent federal budget proposals include provisions to reform Medicaid financing in an effort to reduce federal spending. Some savings may be found from more efficient care delivery (i.e. reductions in emergency room visits or hospital readmissions). However, given Medicaid’s already lower payment rates that contribute to lower per capita spending, such proposals could result in reductions in utilization and/or enrollment as well as additional pressure on states to lower provider payment further. These changes could have adverse effects on beneficiaries’ access to care.

Endnotes

  1. Teresa A. Coughlin, Sharon K. Long, Lisa Clemans-Cope, and Dean Resnick. What Difference Does Medicaid Make? Assessing Cost Effectiveness, Access, and Financial Protection under Medicaid for Low-Income Adults. (Washington, DC: The Kaiser Family Foundation, May 2013), https://modern.kff.org/medicaid/issue-brief/what-difference-does-medicaid-make-assessing-cost-effectiveness-access-and-financial-protection-under-medicaid-for-low-income-adults/ ↩︎
  2. Jack Hadley and John Holahan. “Is Health Care Spending Higher under Medicaid or Private Insurance?” Inquiry 40 (2003):323-42. ↩︎
  3. Rachel Garfield, Robin Rudowitz, Katherine Young, Laura Snyder, Lisa Clemans-Cope, Emily Lawton and John Holahan. Trends in Medicaid Spending Leading up to ACA Implementation. (Washington, DC: The Kaiser Family Foundation, February 2015), http://files.kff.org/attachment/issue-brief-trends-in-medicaid-spending-leading-up-to-aca-implementation. ↩︎
  4. Stephen Zuckerman, Laura Skopec and Kristen McCormack. Reversing the Medicaid Fee Bump: How Much Could Medicaid Physician Fees for Primary Care Fall in 2015? (Washington, DC: The Urban Institute, December 2014), http://www.urban.org/sites/default/files/alfresco/publication-pdfs/2000025-Reversing-the-Medicaid-Fee-Bump.pdf. ↩︎
  5. Daniel R. Levinson. Medicaid Rebates for Brand-Name Drugs Exceeded Part D Rebates by a Substantial Margin. (Washington DC, Department of Health and Human Services Office of Inspector General, April 2015), http://oig.hhs.gov/oei/reports/oei-03-13-00650.pdf. ↩︎
  6. U.S. Government Accountability Office (GAO). Medicaid Payment: Comparisons of Selected Services under Fee-for-Service, Managed Care, and Private Insurance. (Washington, DC: U.S. Government Accountability Office, July 2014), http://www.gao.gov/products/GAO-14-533 ↩︎
  7. Congressional Budget Office. The 2014 Long-term Budget Outlook. (Washington, DC: CBO, July 2014), https://www.cbo.gov/sites/default/files/113th-congress-2013-2014/reports/45471-Long-TermBudgetOutlook_7-29.pdf ↩︎
  8. Alison Mitchell. Medicaid Financing and Expenditures. (Washington, DC: Congressional Research Service, December 2015). ↩︎
  9. Katherine Baicker, Sarah L. Taubman, Heidi L. Allen, et al. “The Oregon Experiment—Effects of Medicaid on Clinical Outcomes,” New England Journal of Medicine 368 (2013):1713-22. ↩︎
  10. Susan H. Busch and Noelia Duchovny. “Family Coverage Expansions: Impact on Insurance Coverage and Health Care Utilization of Parents,” Journal of Health Economics 24, no. 5 (2005):876-890. ↩︎
  11. Embry M. Howell and Genevieve M. Kenney. “The Impact of the Medicaid/CHIP Expansions on Children: A Synthesis of the Evidence.” Medical Care Research and Review (2012):372-96. ↩︎
  12. Stacey McMorrow, Genevieve Kenney, Sharon Long and Dana E. Goin. “Medicaid Expansions from 1997 to 2009 Increased Coverage and Improved Access and Mental Health Outcomes for Low‐Income Parents.” Health Services Research (2016), doi: 10.1111/1475-6773.12432. ↩︎
  13. Tal Gross and Matthew Notowidigdo. “Health Insurance and the Consumer Bankruptcy Decision: Evidence from Expansions of Medicaid.” Journal of Public Economics 95 no. 7-8 (2011):767-778. ↩︎
  14. Janet Currie and Jonathan Gruber. “Health Insurance Eligibility, Utilization of Medical Care, and Child Health,” The Quarterly Journal of Economics 111 no. 2 (1996):431-466. ↩︎
  15. Janet Currie and Jonathan Gruber. “Saving Babies: The Efficacy and Cost of Recent Changes in the Medicaid Eligibility of Pregnant Women,” Journal of Political Economy 104, no. 6 (1996):1263-1296. ↩︎
  16. Dana P. Goldman, Jayanta Bhattacharya, Daniel F. McCaffrey, et al. “Effect of Insurance on Mortality in an HIV-Positive Population in Care.” Journal of the American Statistical Association 96, no. 455 (2001):883-894. ↩︎
  17. Benjamin D. Sommers, Katherine Baicker, and Arnold M. Epstein. “Mortality and Access to Care among Adults after State Medicaid Expansions,” New England Journal of Medicine 367 (2012):1025-1034. ↩︎
  18. Laura R. Wherry and Bruce D. Meyer. “Saving Teens: Using a Policy Discontinuity to Estimate the Effects of Medicaid Eligibility,” Journal of Human Resources (November 2015): epub ahead of print. ↩︎
  19. Baicker et al 2013. ↩︎
  20. McMorrow, Kenney, Long, & Goin, 2016. ↩︎
  21. Rourke L. O’Brien and Cassandra Robertson. Medicaid and Intergenerational Economic Mobility. (Madison, WI: University of Wisconsin-Madison, Institute for Research on Poverty (IRP) Discussion Paper No. 1428-15, April 2015), http://www.irp.wisc.edu/publications/dps/pdfs/dp142815.pdf ↩︎
  22. Sarah Miller and Laura Wherry. The Long-Term Effects of Early Life Medicaid Coverage. (Ann Arbor, MI: University of Michigan Working Paper, August 2015). ↩︎
  23. Sarah Cohodes, Daniel Grossman, Samuel Kleiner and Michael M. Lovenheim. “The Effect of Child Health Insurance Access on Schooling: Evidence from Public Insurance Expansions.” Journal of Human Resources. (2015): epub ahead of print ↩︎
  24. David W. Brown, Amanda Kowalski and Ithai Z. Lurie. Medicaid as an Investment in Children: What is the Long-Term Impact on Tax Receipts? (National Bureau of Economic Research Working Paper, No. 20835, January 2015). ↩︎
  25. Todd Gilmer and Richard Kronick. “Differences In The Volume Of Services And In Prices Drive Big Variations In Medicaid Spending Among US States And Regions,” Health Affairs 30, no. 7 (2011):1316-1324. ↩︎
  26. Bruce Landon, Eric Schneider, Sharon-Lise Normand, et al. “Quality of Care in Medicaid Managed Care and Commercial Health Plans,” JAMA 298, no. 14 (2007):1674-81. ↩︎
  27. Margaret S. Colby, Debra J. Lipson and Sarah R. Turchin. “Value for the Money Spent? Exploring the Relationship between Expenditures, Insurance Adequacy, and Access to Care for Publicly Insured Children.” Maternal and Child Health Journal 16, Supp 1 (2012):51-60. ↩︎
  28. Coughlin, et al. 2013 ↩︎
  29. Hadley and Holahan 2003. ↩︎
  30. Leighton Ku and Matthew Broaddus. “Public And Private Health Insurance: Stacking Up the Costs,” Health Affairs 27, no. 4 (2008):w318-w327. ↩︎
  31. Leighton Ku. “Medical and Dental Utilization and Expenditures Under Medicaid and Private Health Insurance,” Medical Care Research and Review 66, no. 4 (2009):456-71. ↩︎
  32. Dental care was also examined but the comparison with private is influenced by the fact that in 2005, many states offered minimal dental coverage or no dental coverage in Medicaid. ↩︎
  33. Coughlin, Long, Clemans-Cope, & Resnick, 2013 ↩︎
  34. The MEPS-based analyses do not capture Medicaid payments that are not associated with a specific service, such as Medicaid disproportionate-share hospital (DSH) payments. ↩︎
  35. Congressional Budget Office. Estimates for the Insurance Coverage Provisions of the Affordable Care Act Updated for the Recent Supreme Court Decision (Washington, DC: Congressional Budget Office, July 2012), https://www.cbo.gov/publication/43472 ↩︎
  36. Garfield, et al., 2015 ↩︎
  37. Katherine Young, Rachel Garfield, Lisa Clemans-Cope, Emily Lawton, and John Holahan. Enrollment-Driven Expenditure Growth: Medicaid Spending during the Economic Downturn, FY 2007-2011. (Washington, DC: Kaiser Family Foundation, April 2013), https://modern.kff.org/medicaid/report/enrollment-driven-expenditure-growth-medicaid-spending-during/ ↩︎
  38. Katherine Young, Lisa Clemans-Cope, Emily Lawton, and John Holahan. Medicaid Spending Growth in the Great Recession and Its Aftermath, FY 2007-2012. (Washington, DC: The Kaiser Family Foundation, July 2014), https://modern.kff.org/wp-content/uploads/2014/07/8309-03-medicaid-spending-growth-in-the-great-recession-and-its-aftermath-fy-2007-2012.pdf ↩︎
  39. Garfield, et al., 2015 ↩︎
  40. Garfield, et al., 2015 ↩︎
  41. The CBO estimates that total Medicaid spending (including state spending) rose from 0.9 percent of GDP in 1985 to 2.9 percent in 2014, and that net federal Medicaid spending rose from 0.5 percent of GDP in 1985 to 1.7 percent in 2014. While estimates show that net federal spending for Medicaid over much of that period grew only about as quickly as the overall economy did, in 2014 Medicaid spending growth was much higher, largely due to the expansion of Medicaid coverage under the ACA. As a result, between 2013 and 2014, net federal Medicaid spending grew by 13.6 percent to $301 billion in 2014—with another $195 billion in Medicaid spending by states in 2014. Congressional Budget Office. The 2015 Long-Term Budget Outlook. (Washington, DC: Congressional Budget Office, June 2015), https://www.cbo.gov/sites/default/files/114th-congress-2015-2016/reports/50250-LongTermBudgetOutlook-3.pdf ↩︎
  42. The CBO calculates excess growth as growth in health care spending per person relative to the growth of “potential” gross domestic product (GDP) per capita (i.e. CBO’s estimate of the maximum sustainable GDP) after adjusting for demographic changes’ impact on health care spending. ↩︎
  43. CBO’s calculations take the weighted average of the annual excess cost growth rates between 1975 and 2013 by placing twice as much weight on the latest year as on the earliest year and setting the weights for intermediate years by following a linear progression between the two. ↩︎
  44. Congressional Budget Office, 2015 ↩︎
  45. John K. Iglehart and Benjamin D. Sommers. “Medicaid at 50 — From Welfare Program to Nation’s Largest Health Insurer,” New England Journal of Medicine, 372 (2015):2152-2159. ↩︎
  46. CMS Office of the Actuary. 2014 Actuarial Report on the Financial Outlook for Medicaid. (Washington, DC: Department of Health and Human Services, Centers for Medicare and Medicaid Services, 2014), https://www.medicaid.gov/medicaid-chip-program-information/by-topics/financing-and-reimbursement/actuarial-report-on-financial-outlook-for-medicaid.html ↩︎
  47. Historical 2014 enrollment data was not available for this analysis; enrollment was projected to increase by 12.9 percent, to 66.5 million. ↩︎
  48. Sean P. Keehan, Gigi A. Cuckler, Andrea M. Sisko, et al. “National Health Expenditure Projections, 2014–24: Spending Growth Faster than Recent Trends,” Health Affairs 34, no. 8 (2015): 1407-17. ↩︎
  49. Problems accessing care for Medicaid enrollees are not discussed at length in this review. Literature on the relationship between Medicaid enrollees’ access to care and low payments to providers finds access problems, although most measures of access to care are comparable to private coverage. In particular, research has shown that higher Medicaid provider rates have a small to moderately positive impact on access to care for a range of types of care: physician care (Sandra L. Decker. “In 2011 Nearly One-Third Of Physicians Said They Would Not Accept New Medicaid Patients, But Rising Fees May Help,” Health Affairs 31, no. 8 (2012): 1673-1679.), dental care for children (Thomas C. Buchmueller, Sean Orzol, and Lara D. Shore-Sheppard. The Effect of of Medicaid Payment Rates on Access to Dental Care Among Children. (NBER Working Paper No. 19218, July 2013), and other types of care. Yet overall, studies show that, after adjusting for health and socio-demographic factors, the vast majority of Medicaid enrollees have good access to care and fewer unmet health needs compared to those who lack insurance, and generally similar access to care and unmet needs compared to privately insured enrollees (Coughlin, et al. 2013; Genevieve Kenney and Christine Coyer. National Findings on Access to Health Care and Service Use for Children Enrolled in Medicaid, MACPAC Contractor Report No. 1. (Washington DC: TheURban Institute, March 2012), https://www.macpac.gov/wp-content/uploads/2015/01/Contractor-Report-No_1.pdf). ↩︎
  50. Zuckerman, Skopec, & McCormack, 2014. ↩︎
  51. Stephen Zuckerman and Dana Goin. How Much Will Medicaid Physician Fees for Primary Care Rise in 2013? Evidence from a 2012 Survey of Medicaid Physician Fees. (Washington, DC: The Urban Institute, December 2012), http://www.urban.org/research/publication/how-much-will-medicaid-physician-fees-primary-care-rise-2013-evidence-2012 ↩︎
  52. Zuckerman, Skopec and McCormack 2014 ↩︎
  53. Thomas M. Selden, Zeynal Karaca, Patricia Keenan, Chapin White and Richard Kronick. “The Growing Difference between Public and Private Payment Rates for Inpatient Hospital Care,” Health Affairs 34, no. 12 (2015):2147-2150. ↩︎
  54. Levinson, 2015 ↩︎
  55. GAO, 2014 ↩︎
  56. American Hospital Association. Trendwatch Chartbook 2015, Table 4.4: Aggregate Hospital Payment-to-cost Ratios for Private Payers, Medicare. (Chicago, Illinois: American Hospital Association, 2015), http://www.aha.org/research/reports/tw/chartbook/2015/table4-4.pdf ↩︎
  57. This evidence demonstrates that Medicaid reimbursements for hospital-based services are lower than those for private payers. While private payments may cross-subsidize public payments, this does not imply “cost shifting” in the sense that providers are not likely to decrease private insurer’s reimbursement rates if Medicaid rates increase, and providers are similarly not likely to be able to increase the rates they have negotiated with private insurers if Medicaid rates decrease. Although some cost-shifting may occur at the margin, research evidence shows that cost-shifting is not widespread. Austin B. Frakt, A. B. “How Much Do Hospitals Cost Shift? A Review of the Evidence.” Milbank Quarterly 89, no. 1 (2011) 90-130.   ↩︎
Poll Finding

Kaiser Family Foundation Survey of Pennsylvania Residents

Published: Apr 13, 2016

The Kaiser Family Foundation Survey of Pennsylvania Residents measures Pennsylvanians’ opinions about a selection of health issues, including which issues they believe state policymakers should prioritize, opinions about prescription painkiller abuse, and experiences accessing and paying for health care. The survey was conducted March 7-15, 2016 among a representative sample of 804 adults ages 18 and over living in Pennsylvania.

Paying for Health Coverage: The Challenge of Affording Health Insurance Among Marketplace Enrollees

Authors: Jennifer Tolbert and Katherine Young
Published: Apr 7, 2016

Issue Brief

Introduction

As millions of people newly gain health insurance coverage as a result of the Affordable Care Act (ACA), affordability of coverage remains a persistent problem for some. Despite the availability of subsidies to lower the cost of coverage in the Marketplaces, many people have trouble affording their premiums and the out-of-pocket costs when they access care. Recent research indicates that a quarter of all adults with private insurance had unaffordable coverage when premiums, deductibles, and total out-of-pocket costs were taken into account.1  While many people have newly gained coverage, through the Marketplaces, the ongoing financial challenges associated with paying premiums may put that new coverage at risk for some.

Now in the third year of Marketplace coverage, little is still known about how many people are facing affordability challenges and why. This brief seeks to understand who is facing challenges affording their health coverage and the factors that may be contributing to those challenges. Based on the 2014 Kaiser Survey of Low-Income Americans and the ACA2 , which provides insights into the experience of consumers during the first year of ACA implementation, this brief describes the characteristics of those reporting difficulty paying premiums, comparing this group to those who report little to no difficulty paying their premiums. The brief also examines financial security, utilization of health services, and problems with health plans among these two groups. While data from 2014 may not reflect the experiences of current enrollees, they are useful for exploring the differences between these two groups of Marketplace enrollees at that point in time.

According to survey data, one-third of those with Marketplace coverage reported difficulty paying their premium (Figure 1).  This finding is consistent with other surveys of Marketplace enrollees in which a third report dissatisfaction with their premium and 36% report dissatisfaction with their deductible.3  In comparison, the survey finds that only 17% of those with coverage through their employer reported a similar difficulty.

Figure 1: Difficulty Affording Health Insurance Premiums among Nonelderly Adults, by Insurance Coverage

Throughout this brief, we use difficulty paying premiums as a measure of affordability issues for consumers enrolled in Marketplace plans. We refer to the group reporting difficulty paying their premium as Paying Premium Difficult and the group reporting little to no difficulty paying their premium as Paying Premium Not Difficult. One limitation of this categorization is that it captures one aspect of overall health costs—the premium— and does not account for other out-of-pocket costs associated with accessing care. We explore the effect of these out-of-pocket costs in the analysis and report those findings in this brief.

Characteristics of those having trouble affording coverage

In many ways, those reporting difficulty affording Marketplace coverage looked much like those who reported no trouble affording coverage. They shared similar characteristics in terms of income, age, and health status, but were more likely to have dependent children.

Six in ten adults who said they had difficulty affording their premium had incomes below 250% of the poverty level and three in ten were under age 35. For those enrolled in a qualified health plan (QHP) in the Marketplace, having income below 250% of the poverty level ($50,225 for a family of three in 2015) qualifies individuals and families for both tax credits to lower the cost of premiums and cost sharing reductions to reduce out-of-pocket costs in the form of lower deductibles, copayments, and coinsurance. Among those who reported their income, 63% of adults with difficulty affording their premiums had incomes below 250% FPL, which was similar to the share (69%) among those with no trouble affording premiums (Figure 2). The age distribution of the two groups was also similar, with three in ten of both groups under age 35. These findings are consistent with Marketplace enrollment data indicating about 27% of those who signed up for Marketplace coverage in 2014 were adults under age 35.4  In addition, the two groups were similar with respect to health status measures. About three-quarters of adults with difficulty affording their premiums reported having excellent to good overall health, similar to the share of those with affordable premiums (73% vs. 79%). Additionally, about four in ten of both groups reported having an ongoing medical condition (45% vs. 41%). (Data on health status not shown.)

Figure 2: Income, Age, and Family Status of Nonelderly Adults with Marketplace Coverage, by Affordability of Premium

Nearly half of adults reporting trouble affording their coverage had dependent children. Among those reporting difficulty paying premiums, 49% had dependent children in their homes, compared to only 16% of those with affordable Marketplace coverage (Figure 2). For those eligible for subsidies in the Marketplace, the premium contribution is based on a percentage of income rather than a percentage of the premium. Consequently, families in the Marketplace who choose the benchmark plan or a lower cost plan will not have to pay more than their childless counterparts simply because they need a family policy. However, adults with children may face additional costs for housing, food, or education that may strain family budgets, particularly for lower income families, leading to difficult trade-offs between paying health insurance premiums or paying for household necessities.

Financial insecurity of those having trouble affording coverage

When it comes to overall financial security, adults with difficulty paying their premiums faced greater financial problems overall and also expressed greater worry over medical costs. For these individuals, having health insurance did not seem to be providing the same level of financial protection as for those who perceived their health coverage to be affordable.

Adults having trouble paying their premiums were more financially insecure than those not having trouble. Adults who reported difficulty paying their health insurance premium were more likely to report facing financial challenges in other aspects of their lives. Nine in ten said that it is somewhat or very difficult to save money and nearly seven in ten reported difficulty paying off debt.  These rates were higher than for adults with no difficulty affording their premiums (Figure 3). When it comes to paying for necessities, adults who perceived their coverage to be unaffordable also fared somewhat worse than those who perceived their coverage to be affordable. Nearly half (45%) reported difficulty paying for necessities compared to just over a quarter of those with affordable coverage. This finding suggests that for some, paying for health insurance is one further strain on an already tight budget.

Figure 3: Financial Insecurity Among Nonelderly Adults with Marketplace Coverage, by Affordability of Coverage

For adults reporting difficulty paying their premiums, having coverage eased somewhat, but not fully, financial insecurity over medical costs. Compared to those with affordable coverage, adults having trouble affording their coverage expressed less confidence in their ability to pay for both usual and major medical costs. Over four in ten were not confident they could afford usual medical costs and nearly eight in ten were not confident they could afford major medical costs, compared to just two in ten and four in ten, respectively, of those with affordable coverage (Figure 4). In addition, they were three times more likely to report having outstanding medical debt compared to those with affordable coverage (34% vs. 10%). Medical debt can place significant stress on family budgets and is a major contributor to personal bankruptcies.5 

Figure 4: Financial Insecurity over Medical Costs Among Nonelderly Adults with Marketplace Coverage, by Affordability of Coverage

Use of health services among those having trouble affording coverage

Increasingly, private insurance plans, particularly those sold through the Marketplaces, come with deductibles that must be met before insurance coverage begins to cover any costs. 6  For consumers with these higher deductible health plans, using health services can sometimes require large out-of-pocket payments, which, in turn, can lead to difficulties paying for care. Adults who reported difficulty paying for their coverage were more likely to use services and also more likely to have unmet health care needs than those who reported no difficulty paying for their coverage.

Adults having trouble affording coverage were more likely to have used medical services than those not having trouble, but equally likely to have received preventive care and to have taken a prescription drug. Nearly two-thirds of those with difficulty paying their premium reported visiting a doctor for a specific condition; over half had received preventive services or check-ups; and six in ten reported taking a prescription drug (Figure 5). While the rates of use of preventive services and prescription drugs were similar to the rates among those with no difficulty paying their premiums, the use of medical services was higher. For those with private insurance, use of services can come with a high price tag if some or all of the costs of the services must be paid for out of pocket before a deductible is met. It could be that for those reporting difficulty affording coverage, accessing health care services was another factor putting pressure on limited family finances, contributing to the perception that their health coverage overall was unaffordable.

Figure 5: Use of Health Services Among Nonelderly Adults with Marketplace Coverage, by Affordability of Premium

Adults having trouble affording coverage were also more likely to postpone care than those not having trouble. Nearly four in ten adults with difficulty paying their premiums reported they postponed care, a rate that was higher than for those with no difficulty paying premiums (Figure 6). Although the data do not specify the reason why care was postponed, cost is often a factor.7  Particularly, given this group’s financial concerns, especially related to affording medical costs, it seems likely that financial pressures may have led some to postpone getting care.

Figure 6: Unmet Need for Care Among Nonelderly Adults with Marketplace Coverage, by Affordability of Premium

Understanding health insurance coverage among those having trouble affording coverage

As people have gained coverage through the Marketplaces, there is growing evidence that they do not fully understand the scope of their coverage and the cost sharing requirements.8  Many argue this lack of health literacy is contributing to problems consumers face with their health plans and with the costs associated with their coverage. This argument appears to hold true for adults with trouble affording their coverage who exhibited lower levels of health literacy and reported greater problems with their health plans.

Adults having difficulty paying for their coverage were more likely to report not understanding aspects of their health coverage. Less than half of adults experiencing difficulty paying their premiums reported understanding “very well” or “somewhat well” what their health plan covered compared to three-quarters of those with no difficulty paying their premiums (Figure 7). While a larger share reported understanding how much they would have to pay when they visit a doctor (63%), this rate was still lower than among adults with no trouble affording coverage (87%). These lower rates might be expected if the adults reporting affordability difficulties with unaffordable were among those newly insured as a result of implementation of the ACA. However, this group was not more likely than those with no trouble affording coverage to have been uninsured prior to obtaining insurance through the Marketplace. These findings suggest that the complexity of many health insurance plans may lead to confusion among consumers and that ongoing education may be needed to ensure people understand their coverage and how it works.

Figure 7: Understanding of Health Insurance Among Nonelderly Adults with Marketplace Coverage, by Affordability of Premium

Perhaps related to their lower levels of health literacy, adults with trouble affording coverage were more likely to report problems with their coverage. One third of adults in this group indicated their plan did not pay for a service they thought was covered. In addition, over half reported having to pay for services because they hadn’t met their deductible and four in ten said the share of costs they had to pay were more than expected (Figure 8). In contrast, only two in ten adults with no trouble affording coverage reported these same problems. Facing already tight budgets, having to pay more than expected out of pocket was likely adding to the financial burden for these consumers. Further, not only did they report greater problems with covered services and costs, adults with trouble affording coverage also said they had difficulty getting questions answered by their plan at a higher rate than those with no trouble (42% vs. 12%). For these consumers, the dissatisfaction associated with not getting questions answered may have added to the overall frustration with their health plans and with coverage. As a result, they may have felt as though they were not getting value from their health plan.

Figure 8: Problems with Health Plans Among Nonelderly Adults with Marketplace Coverage, by Affordability of Premium

Conclusion

While the implementation of new coverage options under the Affordable Care Act has led to unprecedented gains in health insurance coverage in the past two years, the reliance on private insurance with premiums and cost sharing means that affordability of coverage continues to be a problem for some consumers. Marketplace enrollees who reported difficulty affording their premium in 2014 were similar to other Marketplace enrollees in many respects, but they faced greater financial insecurity generally and also as a result of their use of health care services. High deductible plans that require people to pay out of pocket when they visit a doctor, have an X-ray or lab test, or need a prescription drug seemed to be a particular problem for these individuals. Exacerbating this problem was the lack of understanding of what was covered by their health plan and what cost sharing rules applied, which could lead to unexpected costs.

Developing strategies to address and improve the affordability of coverage for those enrolled in plans in the Marketplaces are necessary to maintaining the coverage gains achieved to date. Although the policy levers to lower costs for those in the Marketplaces beyond the premium tax credits and cost sharing reductions already available are limited, improving consumers’ health literacy around health insurance concepts and the balance between the monthly premium and the annual deductible may help to alleviate some of the problems that are contributing to the financial challenges consumers are facing. In addition, informing lower income consumers about the availability of cost sharing reduction plans that have lower deductibles and copayments can reduce the out-of-pocket burden many of these consumers face. Marketplace assisters play an essential role in educating consumers and helping them select the plans that best meet their needs, but broader efforts to improve health literacy appear to be needed.

Endnotes

  1. Sara Collins, Munira Gupta, Michelle Doty, and Sophie Beutel, How High Is America’s Health Care Cost Burden? Findings from the Commonwealth Fund Health Care Affordability Tracking Survey, July-August 2015, (New York, NY: The Commonwealth Fund), November 2015, http://www.commonwealthfund.org/~/media/files/publications/issue-brief/2015/nov/1844_collins_how_high_is-americas_hlt_care_cost_burden_tb_v1.pdf. ↩︎
  2. Additional information on the survey methodology is available in the methods appendix, https://modern.kff.org/report-section/adults-who-remained-uninsured-at-the-end-of-2014-appendix/. ↩︎
  3. Liz Hamel, Mira Norton, Larry Levitt, Gary Claxton, and Mollyann Brodie, Survey of Non-Group Health Insurance Enrollees, Wave 2, (Menlo Park, CA: Kaiser Family Foundation), May 21, 2015, https://modern.kff.org/health-reform/poll-finding/survey-of-non-group-health-insurance-enrollees-wave-2/. ↩︎
  4. Office of the Assistant Secretary for Planning and Evaluation, Health Insurance Marketplace: Summary Enrollment Report for the Initial Annual Open Enrollment Period, For the period: October 1, 2013 – March 31, 2014 (Including Additional Special Enrollment Period Activity Reported through4-19-2014), (Washington, DC: Department of Health and Human Services (HHS)), May 1, 2014, https://aspe.hhs.gov/report/health-insurance-marketplace-summary-enrollment-report-initial-annual-open-enrollment-period. ↩︎
  5. Karen Pollitz, Cynthia Cox, Kevin Lucia, and Katie Keith, Medical Debt Among People with Health Insurance, (Washington, DC: Kaiser Family Foundation), January 7, 2014, https://modern.kff.org/private-insurance/report/medical-debt-among-people-with-health-insurance/. ↩︎
  6. Matthew Rae, et al., Patient Cost-Sharing in Marketplace Plans, 2016, (Washington, DC: Kaiser Family Foundation), November 13, 2015, https://modern.kff.org/health-costs/issue-brief/patient-cost-sharing-in-marketplace-plans-2016/ ↩︎
  7. Rachel Garfield and Katherine Young, How Does Gaining Coverage Affect People’s Lives? Access, Utilization, and Financial Security among Newly Insured Adults (Washington, DC: Kaiser Commission on Medicaid and the Uninsured, June 2015), https://modern.kff.org/health-reform/issue-brief/how-does-gaining-coverage-affect-peoples-lives-access-utilization-and-financial-security-among-newly-insured-adults/. ↩︎
  8. Karen Pollitz, Jennifer Tolbert, and Rosa Ma, 2015 Survey of Health Insurance Marketplace Assister Programs and Brokers, (Washington, DC: Kaiser Family Foundation), August 6, 2015, https://modern.kff.org/report-section/2015-survey-of-health-insurance-marketplace-assister-programs-and-brokers-section-3-why-did-consumers-seek-help/. ↩︎

Visualizing Health Policy: Recent Trends in Prescription Drug Costs

Published: Apr 5, 2016

This Visualizing Health Policy infographic spotlights national spending on prescription drugs and the public’s views on pharmaceutical prices. Prescription drug spending rose sharply in 2014, driven by growth in expenditures on specialty drugs, including medications to treat cancer and hepatitis C. Medicare’s spending on prescription pharmaceuticals also has risen, largely due to the addition of the Medicare prescription drug benefit in 2006: between 2004 and 2014, the program’s share of US drug expenditures increased from 2% of $193 billion to 29% percent of $298 billion. Prices for many specialty drugs are higher in the United States than other developed countries, and about 1 in 4 people in the United States who take prescription drugs report difficulty affording them. The majority of the public favors 4 policy actions to hold drug prices in check: requiring pharmaceutical companies to publicly release information on how they set prices; allowing Medicare to negotiate medication prices; limiting charges for high-cost drugs; and allowing people in the United States to buy drugs imported from Canada.

jama_2016april_prescription-drug-costs_thumb (002)

Visualizing Health Policy is a monthly infographic series produced in partnership with the Journal of the American Medical Association (JAMA). The full-size infographic is freely available on JAMA’s website and is published in the print edition of the journal.

For more information about trends in prescription drug spending, go to the Peterson-Kaiser Health System Tracker.

View Source Slides

News Release

Visualizing Health Policy: Recent Trends in Prescription Drug Costs

Published: Apr 5, 2016

This Visualizing Health Policy infographic spotlights national spending on prescription drugs and the public’s views on pharmaceutical prices. Prescription drug spending rose sharply in 2014, driven by growth in expenditures on specialty drugs, including medications to treat cancer and hepatitis C. Medicare’s spending on prescription pharmaceuticals also has risen, largely due to the addition of the Medicare prescription drug benefit in 2006: between 2004 and 2014, the program’s share of US drug expenditures increased from 2% of $193 billion to 29% percent of $298 billion. Prices for many specialty drugs are higher in the United States than other developed countries, and about 1 in 4 people in the United States who take prescription drugs report difficulty affording them. The majority of the public favors 4 policy actions to hold drug prices in check: requiring pharmaceutical companies to publicly release information on how they set prices; allowing Medicare to negotiate medication prices; limiting charges for high-cost drugs; and allowing people in the United States to buy drugs imported from Canada.

jama_2016april_prescription-drug-costs_thumb_002.png

Visualizing Health Policy is a monthly infographic series produced in partnership with the Journal of the American Medical Association (JAMA). The full-size infographic is freely available on JAMA’s website and is published in the print edition of the journal.

For more information on trends in prescription drug spending, go to the Peterson-Kaiser Health System Tracker.

News Release

Policy Insight Examines How Current Rules May Deter Seniors From Switching from Medicare Advantage to Traditional Medicare and Implications for Medicare’s Future

Published: Mar 31, 2016

In this new policy insight, the Kaiser Family Foundation’s Tricia Neuman examines current rules that may discourage seniors from switching from Medicare Advantage to traditional Medicare.Traditional Medicare…Disadvantaged? explores this issue through the lens of a 67-year old Boomer who faced difficult financial and health coverage choices in the aftermath of a serious mountain biking accident.

Previous columns in the Policy Insights series are also available.

News Release

Infographic: The Spread of the Zika Virus and the U.S. Response

Published: Mar 31, 2016

What is Zika, how many countries are affected by it, and what is the U.S. doing to respond to the rapid spread of the virus?

To better understand Zika, a new Kaiser Family Foundation infographic offers key facts about the virus, tracks the increasing number of countries reporting local transmission over the past year, and breaks down how key U.S. government agencies are responding to Zika.

Thumbnail_-_JAMA_2016march__the_2015-16_zika_outbreak.png

Other Kaiser Family Foundation resources on the Zika virus are available online.