KFF designs, conducts and analyzes original public opinion and survey research on Americans’ attitudes, knowledge, and experiences with the health care system to help amplify the public’s voice in major national debates.
The U.S. government has a long history of supporting efforts to improve the health of women and families around the world. While many U.S. programs address women and family health generally, several are focused on them directly, including: maternal and child health (MCH), which includes immunization activities; family planning and reproductive health (FP/RH); and nutrition.1 The accompanying papers examine U.S funding for each of these sectors. They look at funding trends over time, the top country recipients of aid, the share of funding provided to the sector within the larger U.S. global health funding portfolio, and the role of the U.S. as a donor in the context of overall donor support. Among the key findings are the following:
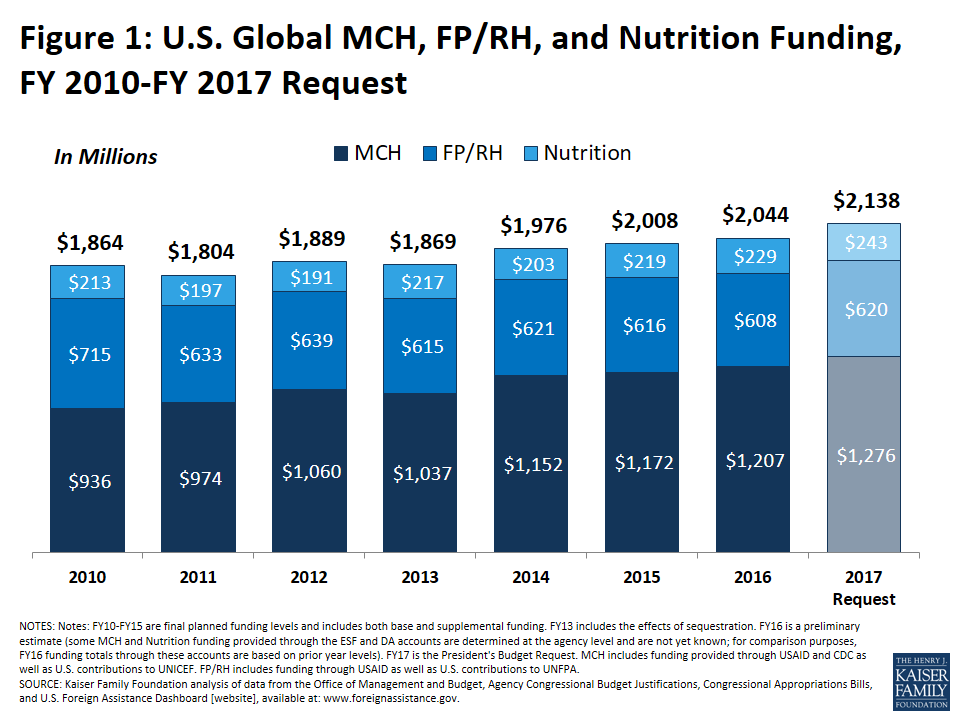
Combined U.S. funding for these sectors has risen somewhat in recent years, increasing from $1.9 billion in FY10 to $2.0 billion in FY16 ($180 million or 10%). This increase has been driven almost entirely by funding for maternal and child health programs (which rose by $271 million or 29%). Funding for the other two sectors has fluctuated and even decreased in some years, with funding for FP/RH declining over the period (a decrease of $108 million or 15%). The President’s budget request for FY17 includes a 5% increase for these sectors combined, most of which would go to MCH programs (See Figure 1).
Figure 1: U.S. Global MCH, FP/RH, and Nutrition Funding, FY 2010-FY 2017 Request
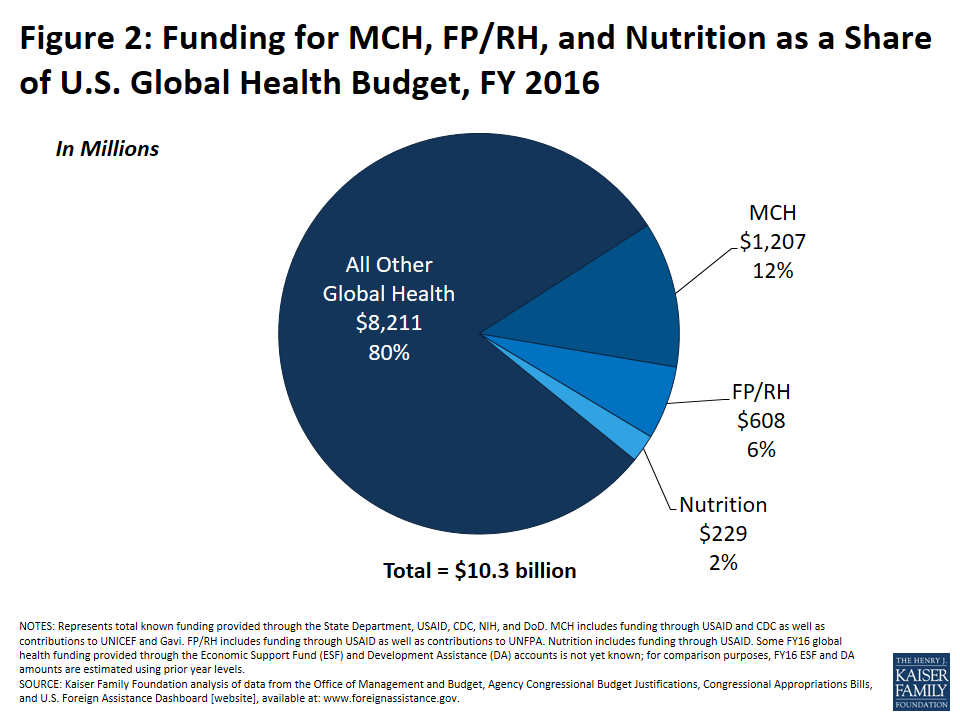
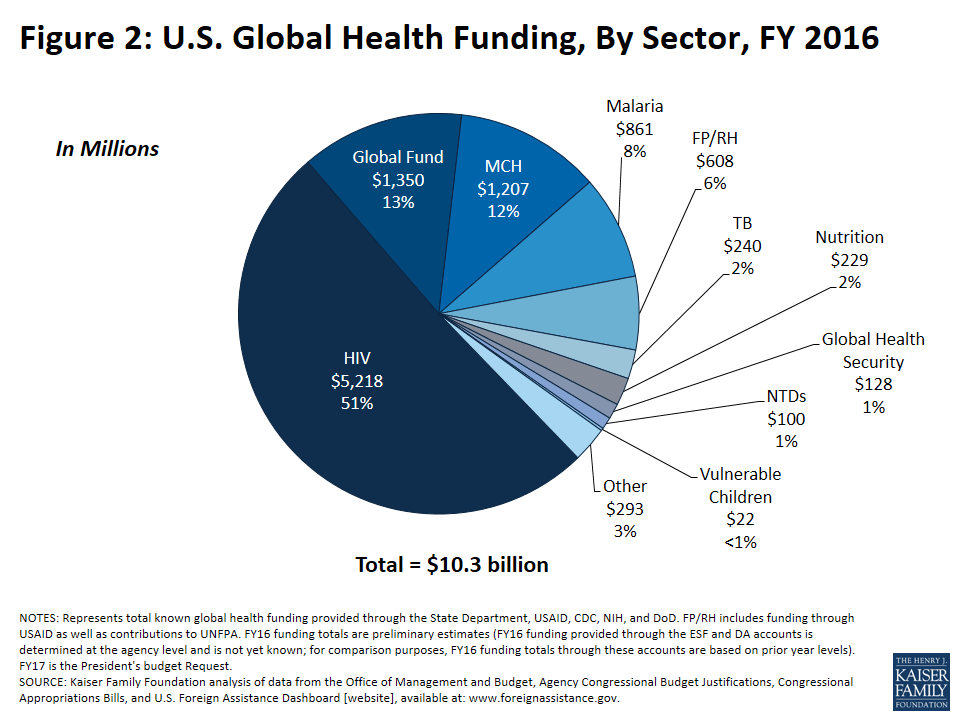
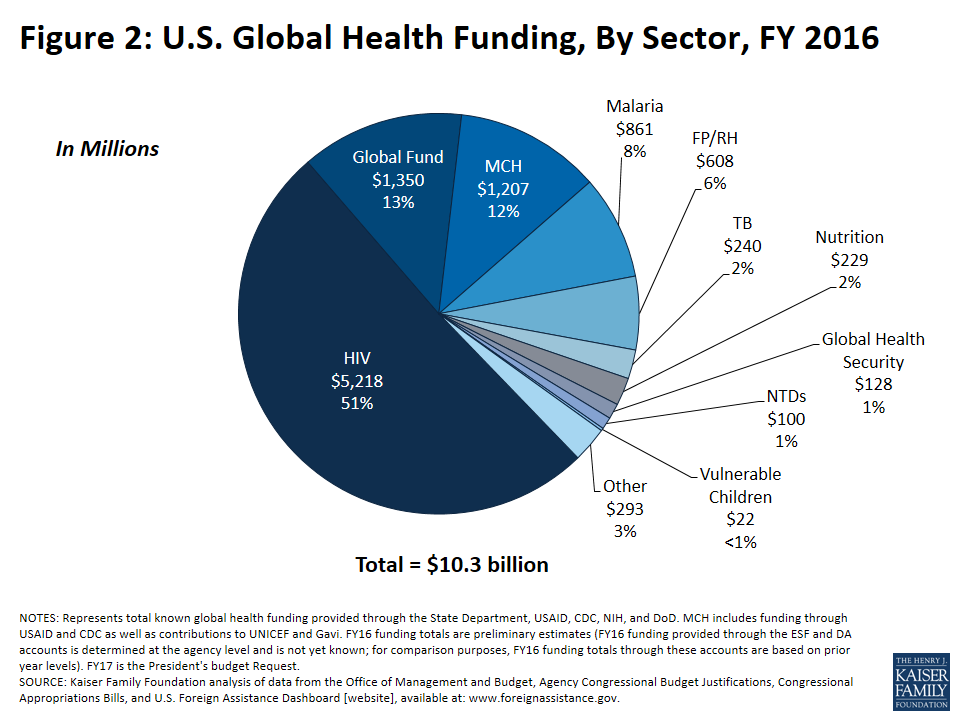
U.S. funding for these sectors represents a relatively small share of the U.S. global health budget, which has been dominated by funding for disease-specific efforts – primarily PEPFAR and the Global Fund – over the last decade. In FY16, the three sectors accounted for 20% of the global health budget (see Figure 2). Funding for MCH was 12%, the third largest program after PEFPAR and the Global Fund. A significant share of funding for MCH is directed at immunization activities (at least 42% in FY16). Funding for FP/RH in FY16 was 6% of U.S. global health funding, and nutrition was 2%.
Figure 2: Funding for MCH, FP/RH, and Nutrition as a Share of U.S. Global Health Budget, FY 2016
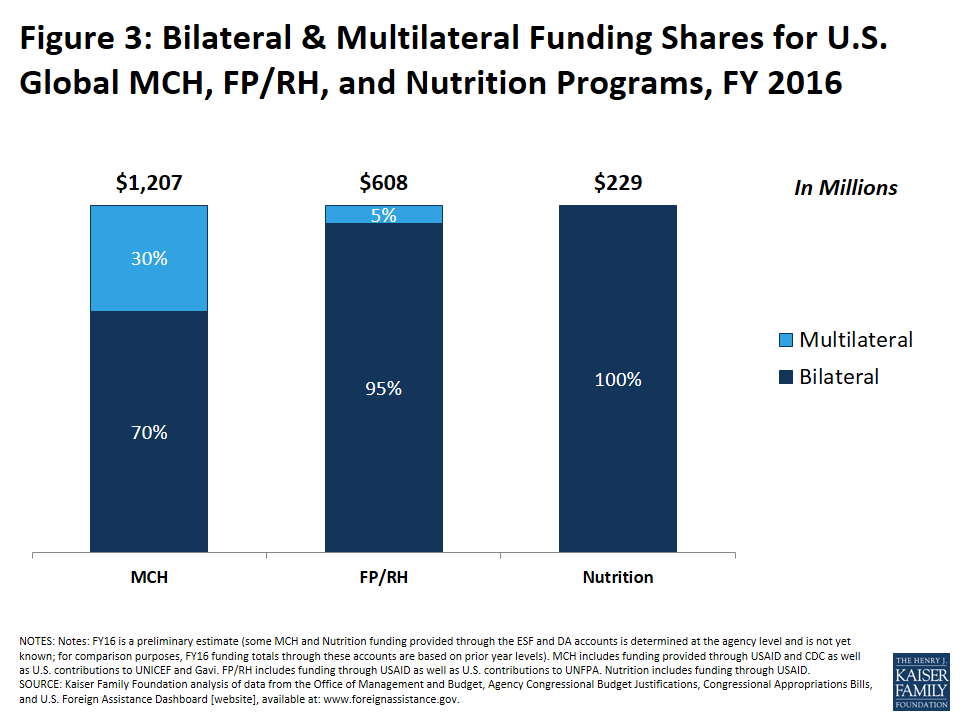
Most of the U.S. effort in these sectors is bilateral, with funding provided directly to countries or regions. Still, over time, an increasing share has been provided multilaterally, rising from 14% in FY10 to 20% in FY16. Most of this has been driven by the MCH portfolio, which channeled 30% of funds multilaterally in FY16 to GAVI and UNICEF. FP/RH funding included 5% for multilateral efforts through UNFPA. All nutrition funding was provided through bilateral channels. (see Figure 3).
Figure 3: Bilateral & Multilateral Funding Shares for U.S. Global MCH, FP/RH, and Nutrition Programs, FY 2016
Within each sector, the U.S. government has increasingly focused its funding on a subset of “priority countries” which represent those with the most severe health needs. For example, both the maternal and child health and family planning and reproductive health programs focus on 24 priority countries, which account for 76% and 70% of funding, respectively.
The U.S. is the largest donor to these sectors in the world,2 though no single donor provides the majority of funding in any of the three sectors.
Taken together, these papers show that funding for these three sectors has, overall, remained relatively flat over the past several years, though funding for MCH programs has grown as a priority. Combined, the sectors account for just a fifth of the U.S. global health budget. Still, it is important to note that funding for these three sectors alone does not fully capture U.S. support for activities that address women and family health; other programs, including PEPFAR and the President’s Malaria Initiative, indirectly support such activities, though their focus is not on women and family health per se. Ultimately, as the largest donor to each area in the world, future funding by the United States stands to have a significant impact in the field.
Endnotes
While the separation of these sectors into distinct areas is somewhat artificial, they are funded separately by Congress which, in some cases, also includes specific guidelines and criteria for how such funding can be used. ↩︎
The U.S. was the largest donor to family planning in 2014, the most recent year with available data; when family planning and reproductive health are combined, the U.S. was the second largest, after the UK. ↩︎
The U.S. government has supported international family planning and reproductive health (FP/RH) efforts for 50 years and is one of the largest donors to FP/RH in the world.1,2 Since 1965, the U.S has obligated approximately $14 billion to international FP/RH activities, though funding has fluctuated over time, including significant decreases in some periods, largely due to political debates surrounding family planning and abortion in the U.S.3 For FY16, the U.S. Congress provided $608 million for FP/RH activities (both bilateral and multilateral funding combined), and the President’s budget request for FY17 includes $620 million for FP/RH.4 This brief provides an overview of U.S. funding for FP/RH, including trends in bilateral and multilateral funding and top country recipients of U.S. funding, and places the U.S. within the larger context of overall donor support for the sector.5
Introduction
The U.S. government has provided financial and other support for international FP/RH efforts for 50 years and is one of the largest donors to FP/RH in the world; since 1965, the U.S has obligated approximately $14 billion to international FP/RH activities.6,7,8 The U.S. Agency for International Development (USAID) serves as the lead agency for FP/RH, carrying out programs in nearly 40 countries, with a focused effort in 24 priority countries.9 USAID works to increase access to voluntary family planning information, commodities, and services, and is a core partner of FP2020 (see below).10 While most of its effort is focused specifically on family planning, USAID also supports some broader RH activities, including efforts to address child marriage, female genital mutilation, and gender based violence and the provision of post abortion care.11 Other U.S. agencies involved in international FP/RH efforts include the Centers for Disease Control and Prevention (CDC) (research, surveillance, technical assistance, and a designated WHO Collaborating Center for Reproductive Health), the Department of State (diplomatic and humanitarian efforts), the National Institutes of Health (NIH) (research), and the Peace Corps (volunteer activities). Additionally, USAID’s FP/RH efforts are closely linked to its maternal and child health (MCH) programs, although Congress directs funding to and USAID operates these programs separately. Recent years have also seen greater emphasis on coordinating FP investments with HIV efforts through the President’s Emergency Plan for AIDS Relief (PEPFAR).
Overview of Funding Trends
U.S. support for international FP/RH is provided through both bilateral programs and contributions to the United Nations Population Fund (UNFPA). Most U.S. funding for FP/RH activities is provided through bilateral efforts (95% in FY16), while 5% is channeled through multilateral efforts. Funding has fluctuated over time, including declines in some periods largely due to changing party control in the Administration and Congress and political debates surrounding family planning and abortion in the U.S.12 As a result, there are several legal, policy, and programmatic requirements that govern the use of U.S. funding for international FP/RH efforts.13 U.S. policy, under the Helms amendment, for example, currently prohibits funding for abortion as a method of family planning in international programs.14
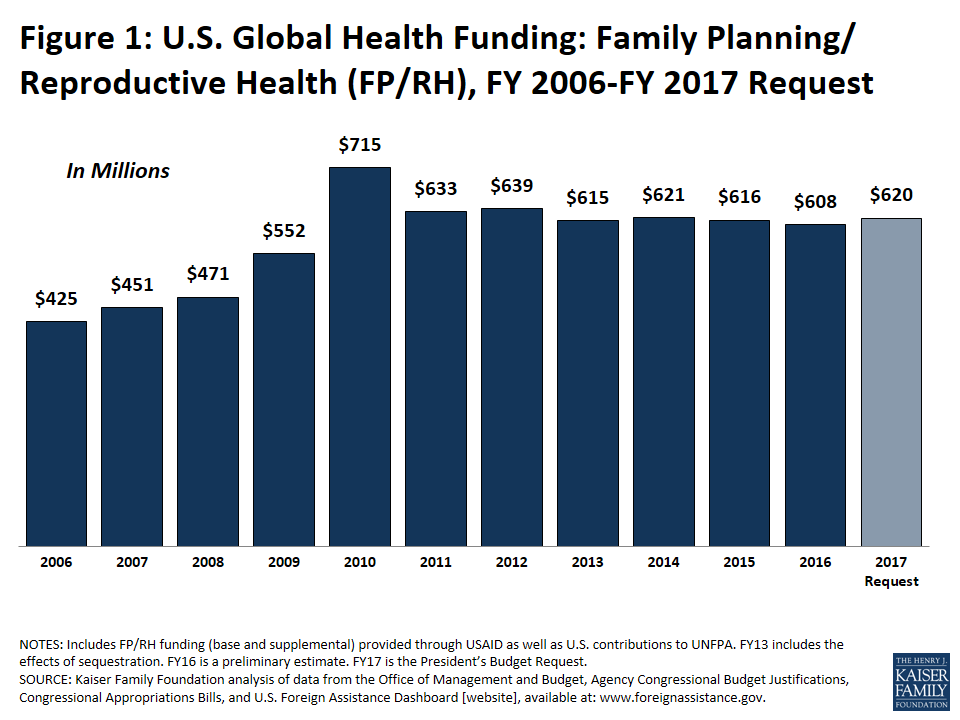
Funding for the program rose steadily over its first two decades but saw significant cuts during the 1980s under the Reagan Administration. Funding was subsequently increased reaching a peak in 1994 under President Clinton, coinciding with the International Conference on Population and Development, but then decreased again under the Republican controlled Congress. After increasing slightly, funding remained essentially flat under President George W. Bush. Funding increased significantly after President Obama took office in 2009 and reached $715 million in FY10 (the highest level to date), including the restoration of funding for UNFPA (see below).15 Funding declined to $633 million in FY11, but has since remained relatively flat (see Figure 1).
Despite increases in FP/RH funding in recent years, funding for the sector represents a relatively small share of the overall U.S. global health budget, and its share has declined over time with the rise of other U.S. global health programs and focus areas, most notably PEPFAR. FP/RH has accounted for approximately 5-8% for much of the past decade (see Figure 2).
Bilateral Funding
Bilateral funding provided by USAID increased from $425 million in FY06 to $575 million in FY16.16,17 It reached its highest point, $664 million, in FY10; since then, funding has been between $585-$608 million per year (see Table 1).18 The President’s FY17 budget request includes $585 million for bilateral FP/RH activities, which would represent a $10 million increase.
Of the $585 million in bilateral funding in FY15 (the most recent year for which country-specific data are available), $407 million (70%) was provided to the 24 FP/RH priority countries. An additional 9 countries received bilateral funding directly (totaling $48 million) and others were reached through regional funding provided by the agency. The top recipient of funding in FY15 was Nigeria ($34.5 million), followed by Ethiopia ($31.6 million), Uganda ($27.5 million), Bangladesh ($27.0 million), Tanzania ($26.4 million), Kenya ($26.0 million), Afghanistan ($21.4 million), Jordan ($20.3 million), the Philippines ($18.0 million), and Democratic Republic of the Congo ($16.7 million) (see Table 2). These top 10 recipients accounted for 43% of overall bilateral assistance in FY15.
Multilateral Funding
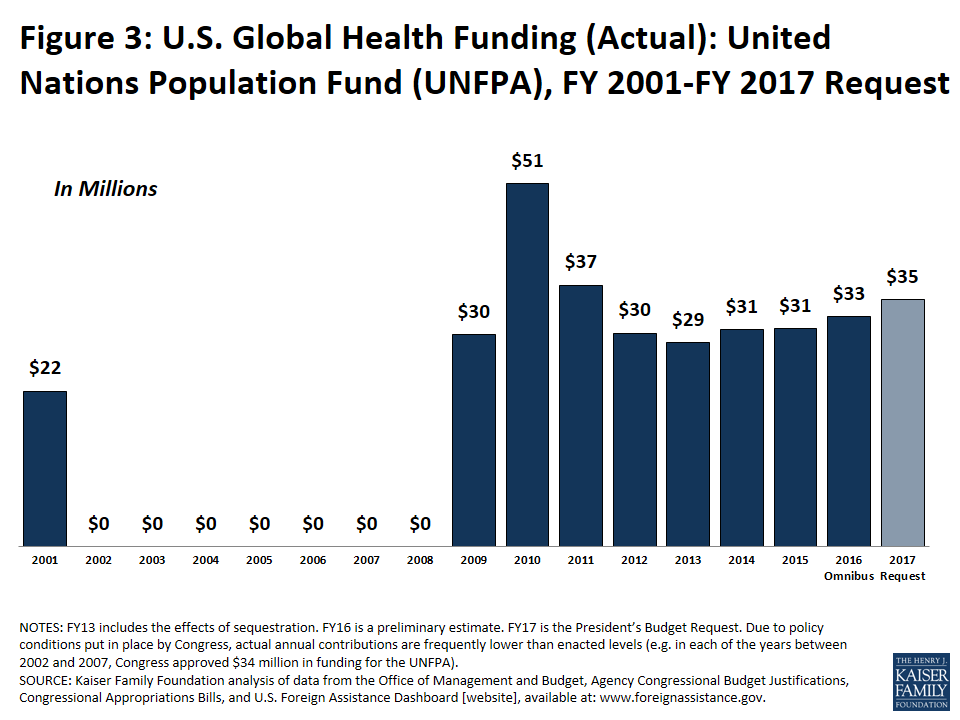
The U.S. also supports FP/RH through multilateral contributions to UNFPA, the lead UN agency supporting sexual and reproductive health activities in many low- and middle-income countries. Although the U.S. helped create UNFPA in 1969 and was a leading contributor for many years, there have been several years in which funding has been withheld due to executive branch determinations that UNFPA’s activities in China violated the Kemp-Kasten Amendment, which prohibits funding any organization or program, as determined by the President, that supports or participates in the management of a program of coercive abortion or involuntary sterilization, despite that fact that UNFPA does not support such activities in China. Funding was first withheld by President Reagan in 1985 and later restored by President Clinton (who provided funding in each year except for 1999). George W. Bush also suspended funding to the agency which was restored in FY09 by President Obama. In FY16, the U.S. provided $33 million for UNFPA. Due to policy conditions put in place by Congress, actual annual contributions to UNFPA are frequently lower than the enacted levels with the difference being transferred to bilateral programs (see Figure 3).
The United States in Context: International Donor Assistance for Family Planning
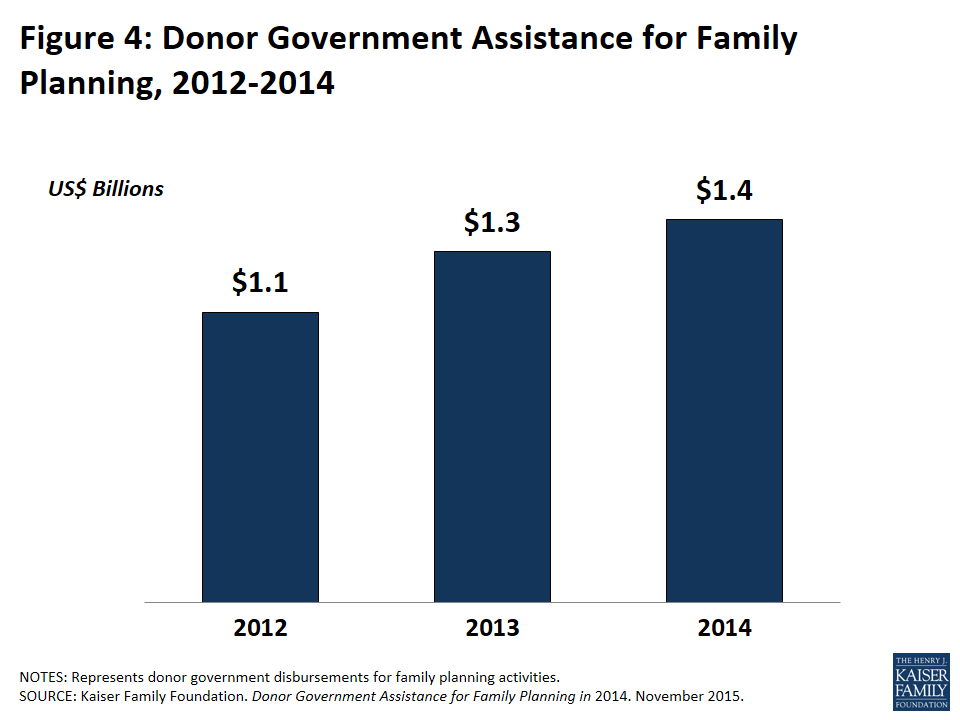
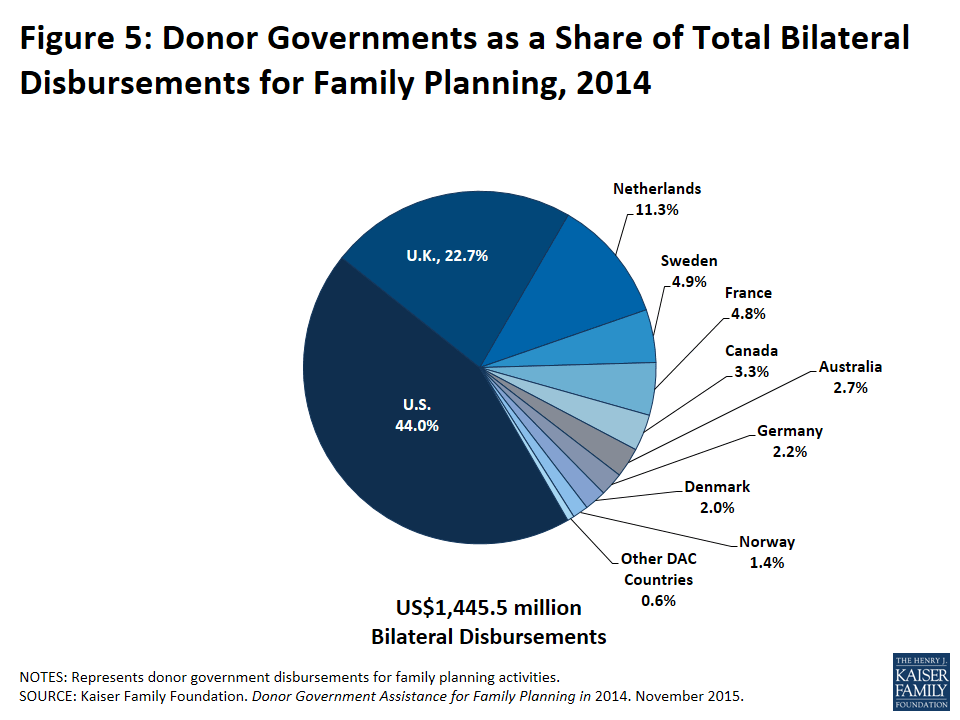
The U.S. is the single largest donor to international family planning efforts in the world.19 In July 2012, the U.K. Government and the Bill & Melinda Gates Foundation, in partnership with UNFPA, civil society organizations, developing countries, donor governments, the private sector, and multilateral organizations met at the London Summit on Family Planning (FP2020) and made commitments aimed at improving access to voluntary family planning services. While the U.S. did not make a formal commitment at the Summit, USAID is a core partner in helping reach the goals of the Summit. In 2014, the most recent year for which data are available, donor governments provided $1.4 billion to support bilateral family planning programs in low- and middle-income countries, an increase of more than $100 million (9%) above 2013 levels and 32% above 2012 levels (see Figure 4).20 The U.S. was the single largest bilateral donor in 2014, disbursing US$636.6 million and accounting for almost half (44%) of total bilateral funding (see Figure 5). The U.K. (US$327.6 million, 23%) was the second largest bilateral donor, accounting for nearly a quarter of all funding, followed by the Netherlands (US$163.6 million, 11%), Sweden (US$70.2 million, 5%), and France (US$69.8 million, 5%).
Figures & Tables
Table 1. U.S. Government Funding for FP/RH Programs, Bilateral & Multilateral, in Millions, FY06-FY17 Request
2006
2007
2008
2009
2010
2011
2012
2013
2014
2015
2016
2017 Request
Bilateral
$424.8
$450.6
$470.6
$522.4
$663.7
$595.6
$608.3
$586.2
$590.5
$585.2
$575.0
$585.0
Multilateral (UNFPA)
$0.0
$0.0
$0.0
$30.0
$51.4
$37.0
$30.2
$28.9
$30.7
$30.8
$32.5
$35.0
Total
$424.8
$450.6
$470.6
$552.4
$715.1
$632.6
$638.5
$615.1
$621.2
$616.0
$607.5
$620.0
Notes: Includes FP/RH funding (base and supplemental) through USAID as well as U.S. contributions to UNFPA. FY06-FY15 are final planned funding levels. FY13 includes the effects of sequestration. FY16 is s a preliminary estimate. FY17 is the President’s budget Request.
Figure 1: U.S. Global Health Funding: Family Planning/Reproductive Health (FP/RH), FY 2006-FY 2017 RequestFigure 2: U.S. Global Health Funding, By Sector, FY 2016Figure 3: U.S. Global Health Funding (Actual): United Nations Population Fund (UNFPA), FY 2001-FY 2017 RequestFigure 4: Donor Government Assistance for Family Planning, 2012-2014Figure 5: Donor Governments as a Share of Total Bilateral Disbursements for Family Planning, 2014
Table 2. U.S. Government Funding for FP/RH Programs, by Country & Region, in Millions, FY06-FY15
2006
2007
2008
2009
2010
2011
2012
2013
2014
2015
Country Total
$2,283.4
$2,330.1
$2,366.8
$2,422.5
$2,509.7
$2,485.1
$2,490.9
$2,468.7
$2,478.0
$2,469.8
Afghanistan*
$18.6
$46.3
$32.2
$30.0
$53.7
$23.9
$21.0
$21.7
$17.0
$21.4
Albania
$0.4
$0.6
$2.0
$0.8
$0.5
$0.5
–
–
–
–
Angola
$2.0
$2.5
$3.0
$4.0
$3.7
$4.0
$4.0
$4.0
$4.0
$4.0
Armenia
$4.2
$3.8
$2.2
$1.0
$0.7
$0.8
$0.8
$0.8
–
–
Azerbaijan
$1.4
$1.3
$1.9
$0.8
$0.9
$1.0
–
–
–
–
Bangladesh*
$18.8
$16.7
$17.6
$18.5
$21.0
$23.2
$25.3
$26.6
$27.0
$27.0
Belarus
$0.5
–
–
–
–
–
–
–
–
–
Benin
$2.2
$2.2
$2.3
$3.0
$2.7
$3.0
$4.0
$3.0
$3.0
$3.0
Bolivia
$7.7
$7.9
$9.1
$9.1
$8.1
$9.1
$8.1
–
–
–
Burundi
–
–
–
–
–
–
$3.0
$3.0
$3.0
$3.0
Cambodia
$3.0
$3.0
$3.5
$5.0
$4.9
$5.0
$6.0
$5.0
$5.0
$5.0
Democratic Republic of Congo*
$5.7
$6.7
$7.6
$9.0
$12.7
$14.5
$15.5
$16.2
$16.7
$16.7
Dominican Republic
$1.7
$1.4
$1.3
$1.7
–
–
–
–
–
–
Egypt
$6.7
$13.0
$12.0
$11.0
$5.0
$3.0
–
–
–
–
El Salvador
$3.0
$2.1
$2.4
$2.4
$2.3
–
–
–
–
–
Ethiopia*
$19.8
$16.9
$18.6
$20.5
$23.0
$27.9
$30.0
$30.5
$31.6
$31.6
Georgia
$0.7
$0.7
$1.8
$1.1
$0.9
$1.5
$1.5
$1.4
–
–
Ghana*
$6.3
$6.3
$7.7
$9.0
$11.7
$13.0
$13.0
$13.0
$13.0
$15.0
Guatemala
$6.6
$6.3
$6.6
$6.6
$6.1
$6.6
$6.6
$6.6
$6.5
$6.5
Guinea
$2.4
$2.4
$2.8
$3.0
$2.7
$3.0
$4.0
$3.0
$3.0
$3.0
Haiti*
$7.9
$11.3
$9.2
$7.2
$43.3
$9.0
$9.0
$9.0
$9.0
$9.0
Honduras
$9.1
$3.5
$3.5
$3.5
$3.2
$3.5
$2.5
$1.4
–
–
India*
$14.8
$14.7
$15.7
$19.5
$20.6
$23.0
$23.0
$21.9
$19.0
$14.0
Indonesia
$3.0
$1.0
–
–
–
–
–
–
–
–
Jamaica
$2.0
$0.9
–
–
–
–
–
–
–
–
Jordan
$6.4
$10.9
$24.0
$17.1
$20.8
$17.3
$14.0
$15.0
$13.0
$20.3
Kazakhstan
$0.1
–
–
–
$0.2
$0.3
–
–
–
–
Kenya*
$8.9
$10.4
$13.2
$17.8
$19.7
$23.8
$24.8
$25.1
$26.0
$26.0
Kyrgyz Republic
$0.2
$0.2
$0.2
$0.2
$0.2
$0.2
–
–
–
–
Liberia*
$3.1
$3.1
$6.0
$7.0
$6.6
$7.0
$7.0
$7.0
$7.0
$7.0
Madagascar*
$4.1
$6.5
$8.4
$12.0
$13.8
$14.0
$14.0
$14.0
$14.0
$14.0
Malawi*
$4.2
$5.6
$6.5
$8.7
$9.8
$11.7
$12.7
$12.7
$12.7
$12.7
Mali*
$6.5
$6.5
$6.8
$6.8
$7.4
$10.0
$11.0
$11.0
$11.0
$11.0
Mozambique*
$5.5
$5.0
$6.6
$8.0
$9.5
$11.5
$12.2
$12.8
$13.0
$13.0
Nepal*
$6.3
$6.1
$7.5
$9.0
$8.9
$11.0
$13.0
$13.9
$14.4
$14.4
Nicaragua
$3.5
$2.7
$2.7
$2.7
$2.4
$2.7
–
–
–
–
Niger
–
–
$0.1
–
–
–
–
–
–
–
Nigeria*
$13.4
$18.2
$15.8
$19.0
$20.1
$25.4
$30.5
$33.5
$34.5
$34.5
Pakistan*
$12.0
$11.9
$18.7
$28.3
$43.5
$39.6
$37.5
$17.2
$32.3
$15.4
Paraguay
$1.8
$2.1
$2.1
$4.1
$1.9
–
–
–
–
–
Peru
$6.8
$5.2
$5.2
$5.4
$4.6
$3.9
$1.0
–
–
–
Philippines*
$15.8
$14.5
$14.8
$17.0
$16.1
$18.5
$18.5
$18.0
$18.0
$18.0
Russia
$3.3
$2.6
$4.7
$3.4
$2.7
$2.9
–
–
–
–
Rwanda*
$3.5
$6.7
$7.5
$9.0
$10.2
$12.0
$12.0
$12.4
$13.0
$13.0
Senegal*
$2.8
$3.5
$5.0
$7.0
$9.8
$12.5
$13.5
$14.7
$15.0
$15.0
Sierra Leone
–
–
$0.2
–
–
–
–
–
–
–
South Africa
$1.3
$1.0
$1.0
$1.5
$1.5
$1.5
–
–
–
–
South Sudan*
–
–
–
–
–
$7.0
$8.0
$8.0
$8.0
$8.0
Sudan
$1.2
$1.2
$3.5
$5.3
$5.4
–
–
–
–
–
Tajikistan
$0.1
$0.0
$0.3
$0.4
$0.9
$0.9
$1.5
$1.0
–
–
Tanzania*
$5.9
$8.1
$10.9
$17.0
$19.0
$22.7
$25.7
$25.7
$26.4
$26.4
Timor-Leste
–
$2.0
$1.0
$1.4
$0.9
$1.0
$2.0
$1.0
$1.0
$1.0
Turkmenistan
$0.0
$0.0
–
–
$0.2
$0.2
–
–
–
–
Uganda*
$6.3
$8.3
$10.6
$15.0
$16.3
$21.0
$24.0
$26.5
$27.5
$27.5
Ukraine
$1.2
$0.4
$2.5
$1.4
$1.5
$2.1
$1.2
$1.2
$1.0
–
Uzbekistan
$0.1
$0.2
$0.1
$0.2
$0.1
–
–
–
–
–
Yemen*
–
$1.5
$1.5
$8.0
$4.5
$3.5
$2.5
$2.9
$3.5
$3.5
Zambia*
$3.2
$5.8
$7.4
$10.0
$11.7
$13.0
$13.0
$13.0
$13.0
$13.0
Zimbabwe
$1.2
$1.2
$1.2
$4.5
$1.8
$2.0
$2.0
$2.0
$2.0
$2.0
Regional Total
$19.0
$15.5
$16.6
$16.3
$14.6
$18.7
$21.6
$23.1
$19.8
$19.9
Africa Regional Office
$4.9
$2.0
$2.2
$2.3
$1.9
$2.2
$2.3
$2.1
$2.0
$2.0
Asia Middle East Regional Office
$1.1
$1.2
$1.2
$1.3
$1.6
$2.3
$2.3
$2.4
–
–
Asia Regional
–
–
–
–
–
–
–
–
$2.5
$2.5
Central Asia Regional Office
$0.1
–
–
–
–
–
–
–
–
–
East Africa Regional Office
$2.3
$2.3
$2.5
$3.0
$2.1
$2.9
$4.0
$3.8
$4.0
$4.0
Europe and Eurasia Regional
$0.6
$0.5
$0.9
$0.1
–
$0.3
$2.0
–
–
–
Europe Regional Office
$0.1
$0.2
$0.5
$0.0
–
$0.2
–
–
–
–
Latin America and Caribbean Regional Office
$1.3
$1.4
$1.4
$1.5
$1.2
$1.5
$1.5
$2.4
$1.0
$1.0
West Africa Regional Office
$8.6
$7.9
$7.9
$8.0
$7.8
$9.3
$9.5
$12.4
$10.3
$10.4
Total
$2,302.4
$2,345.6
$2,383.4
$2,438.8
$2,524.3
$2,503.8
$2,512.5
$2,491.8
$2,497.8
$2,489.7
Notes: Includes country-specific and regional FP/RH funding (base and supplemental) provided through USAID. FY06-FY15 are final funding levels. FY13 includes the effects of sequestration.
Endnotes
KFF. Donor Government Assistance for Family Planning in 2014; November 2015. ↩︎
KFF analysis of official development assistance funding as reported to the Organisation for Economic Co-operation and Development (OECD) Credit Reporting System (CRS) database, April 2016. ↩︎
Congressional Research Service (CRS). International Family Planning Programs: Issues for Congress. June 2012. ↩︎
The FY16 Omnibus bill (P.L. 114-113) states that, of the funding appropriated for bilateral assistance, “not less than $575,000,000 should be made available for family planning/reproductive health,” and provides an additional $32.5 million for the U.S. contribution to the United Nations Population Fund (UNFPA). In recent years, final funding amounts for FP/RH have been higher than the enacted level. For instance, enacted FP/RH funding in FY15 totaled $610 million ($575 million for bilateral programs and $35 million for UNFPA), but the final funding level for FP/RH (bilateral and UNFPA) in FY15 totaled $616 million. ↩︎
With the exception of FY16 and FY17, all funding totals in this analysis represent the final planned funding level for that fiscal year. This includes both base and supplemental appropriations for bilateral FP/RH activities as well as U.S. contributions for UNFPA. FY16 represents the enacted level and FY17 represents the President’s budget request. ↩︎
KFF. Donor Government Assistance for Family Planning in 2014; November 2015. ↩︎
KFF analysis of official development assistance funding as reported to the Organisation for Economic Co-operation and Development (OECD) Credit Reporting System (CRS) database, April 2016. ↩︎
Congressional Research Service (CRS). International Family Planning Programs: Issues for Congress. June 2012. ↩︎
USAID. Family Planning Program Overview; October 2015. ↩︎
USAID. Family Planning Program Overview; October 2015. ↩︎
PAI. 50 Years of US International Family Planning Assistance; December 2015. ↩︎
Congressional Research Service (CRS). U.S. International Family Planning Programs: Issues for Congress; January 2016. ↩︎
Congressional Research Service (CRS). U.S. International Family Planning Programs: Issues for Congress; January 2016. ↩︎
Funding totals include both base and supplemental appropriations. For instance, the FY10 total includes $64.5 million that was provided through a supplemental appropriation. ↩︎
Includes both base and supplemental funding. In recent years, bilateral funding for FP/RH activities is provided through the Global Health Programs (GHP) and Economic Support Fund (ESF) accounts at USAID, and historically, funding has also been provide through the Assistance for Europe, Eurasia and Central Asia (AEECA) and Development Assistance (DA) accounts at USAID. ↩︎
FY16 is based on funding provided in the “Consolidated Appropriations Act, 2016” (P.L. 114-113) and is a preliminary estimate. Final family planning numbers may differ from the initially enacted level as the FY16 omnibus bill specified the minimum level of bilateral FP funding ($575.0m through the GHP and ESF accounts), not the actual level. For example, final FY15 FP funding totaled $616.0m for bilateral programs and the U.S. contribution to UNFPA. Final FP funding for FY16 is expected to follow suit. ↩︎
Funding totals include both base and supplemental appropriations. For instance, the FY10 total includes $64.5 million that was provided through a supplemental appropriation. ↩︎
KFF. Donor Government Assistance for Family Planning in 2014; November 2015. ↩︎
KFF. Donor Government Assistance for Family Planning in 2014; November 2015. ↩︎
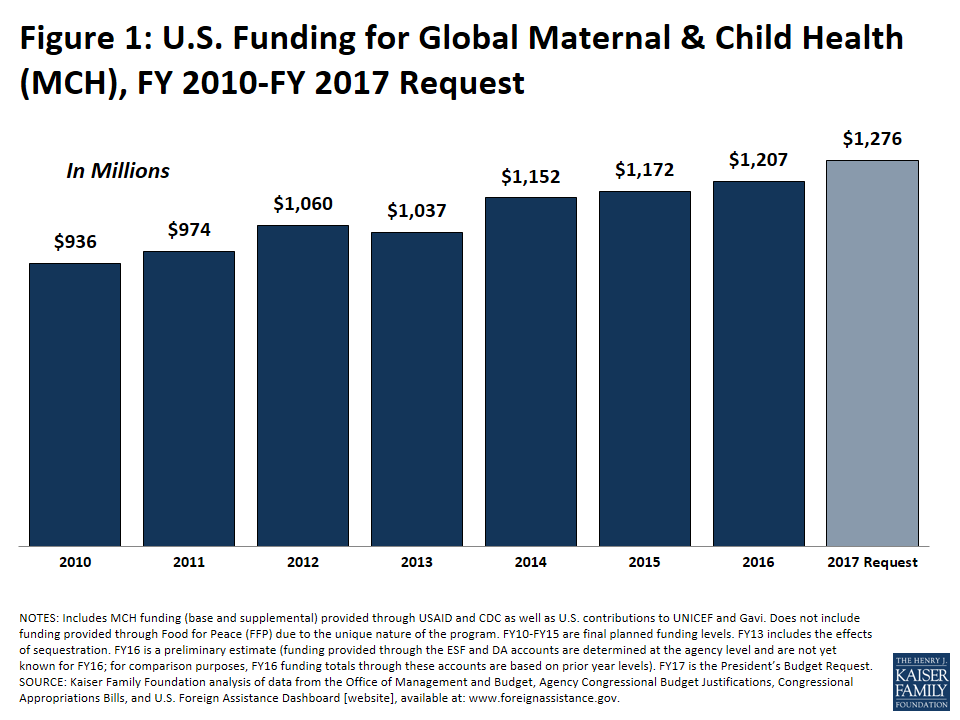
The U.S. government has a long history of supporting international maternal and child health (MCH) efforts, including global immunization activities, and is the largest donor government to MCH activities in the world.1,2 Between FY10 and FY16, the U.S. Congress provided $7.5 billion for MCH-specific activities (both bilateral and multilateral funding combined), of which $2.6 billion (35%) supported global immunization efforts.3,4 In FY16, Congress provided $1.21 billion for MCH and the President’s FY17 budget request includes $1.28 billion, a $69 million increase. Most funding for MCH is provided bilaterally, though the share given through multilateral channels has increased in recent years. This brief provides an overview of U.S. funding for MCH, including trends in bilateral and multilateral funding and top country recipients of U.S. funding, and places the U.S. within the larger context of overall donor support for the sector.5
Introduction
The U.S. government has provided financial and other support for international MCH efforts, including global immunization activities, since the 1960s and is the largest donor government to MCH activities in the world.6,7 The U.S. Agency for International Development (USAID) serves as the lead agency for MCH and focuses its support on 24 priority countries.8 USAID works to improve the accessibility and quality of antenatal care, delivery care, and postnatal care; newborn health; immunizations (including polio); child health through the treatment of diarrhea, pneumonia, and malaria; as well as water, sanitation, and hygiene. Other U.S. agencies involved in international MCH efforts include the Centers for Disease Control and Prevention (CDC) (research and technical assistance), the Department of State (diplomatic and humanitarian efforts), the National Institutes of Health (NIH) (research), and the Peace Corps (volunteer activities). Additionally, USAID supports the integration of family planning with maternal care services, although Congress directs funding to and USAID operates these programs separately.9
Overview of Funding Trends
U.S. support for international MCH activities is provided through both bilateral programs and contributions to multilateral organizations, including the United Nations Children’s Fund (UNICEF) as well as Gavi, the Vaccine Alliance (Gavi).10 Most U.S. funding for MCH activities is provided through bilateral efforts (70% in FY16), though an increasing share has been channeled through multilateral efforts in recent years (rising from 22% in FY10 to 30% in FY16). Funding for MCH activities has increased over time, rising from $936 million in FY10 to $1.2 billion in FY16, largely due to increased funding for immunizations; between FY10 and FY16 U.S. support for global immunization programs rose from $266 million to $513 million.11,12 The president’s FY17 request includes $1.28 billion for MCH activities, $69 million above the FY16 level (see Figure 1). Funding for MCH activities has also increased as a share of the global health budget rising from 9% in FY10 to 12% in FY16 (see Figure 2). Despite accounting for a relatively small share of the budget, funding for MCH activities account for the third largest amount of funding after HIV and the Global Fund.
Bilateral Funding
Bilateral funding for MCH is provided through USAID and CDC’s Global Immunization program. Total bilateral funding for MCH increased from $726 million in FY10 to $839 million in FY16.13,14 The President’s FY17 budget request includes $869 million for bilateral MCH activities, which would represent a $30 million increase (4%). Most of the bilateral funding is provided through USAID (74%) with the remainder at CDC (26%). While total funding for both agencies increased between FY10 and FY16, USAID’s funding fluctuated over the period (see Table 1).
Of USAID’s $632 million in bilateral funding in FY15 (the most recent year for which country level data are available; CDC funding is not available by recipient country), $477 million (76%) was provided to the 24 MCH priority countries. An additional 12 countries received bilateral funding directly (totaling $56 million) and others were reached through regional funding provided by the agency. The top recipient of funding in FY15 was Afghanistan ($67.1 million), followed by Nigeria ($48.0 million), Ethiopia ($39.3 million), Democratic Republic of the Congo ($34.8 million), Bangladesh ($30.0 million), Jordan ($24.8 million), Pakistan ($24.7 million), Indonesia ($20.0 million), South Sudan ($18.0 million), and Uganda ($16.0 million) (see Table 2). These top 10 recipients accounted for 59% of USAID’s country and regional specific assistance in FY15.
Multilateral Funding
The U.S. also supports MCH efforts through multilateral contributions to UNICEF as well as to Gavi, the vaccine alliance. U.S. contributions to UNICEF, the lead UN agency supporting child health activities in many low- and middle-income countries, have remained relatively stable over the past decade, increasing slightly from $125.7 million in FY06 to $132.5 million in FY16.
Gavi, an independent public-private partnership and multilateral funding mechanism that aims to “save children’s lives and protect people’s health by increasing access to immunization in poor countries”, was created in 1999 and formally launched in 2000.15 The U.S. made its first contribution of $48 million in FY01 and U.S. contributions have greatly increased in recent years with multi-year funding commitments made by the Obama administration.16 In FY16 the U.S. provided $235 million to Gavi and the President’s FY17 request includes $275 million for Gavi, an increase of $40 million (17%). The U.S. is the second largest donor government, followed by the U.K., contributing $1.4 billion since Gavi was established.
Immunization Funding
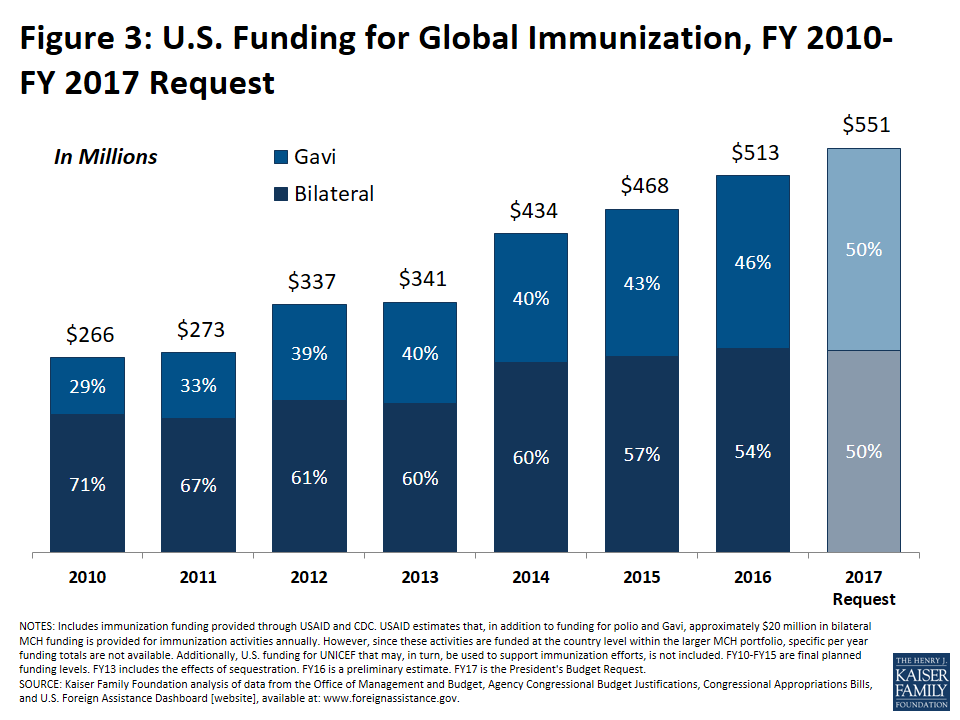
U.S. support for global immunization activities is provided through USAID’s MCH program, CDC’s Global Immunization program, and through the U.S. contribution to Gavi. Between FY10 and FY16, total U.S. global immunization funding rose from $266 million to $513 million, an increase of $247 million over the period (see Figure 3 and Table 3).17,18 This increase accounted for almost the entire increase (91%) in total MCH funding between FY10 and FY16. The President’s FY17 request includes $551 million for global immunization activities, an increase of $38 million (7%) above FY16.
The majority of U.S. funding for global immunization activities is provided through bilateral programs, which increased from $188 million in FY10 to $278 million in FY16. However, U.S. multilateral support provided through its contribution to Gavi has increased more rapidly, rising from $78 million in FY10 to $235 million in FY16, and has increased as a share of total immunization funding over the period rising. The President’s FY17 budget request includes $276 million in bilateral funding, a decrease of $2.4 million (-1%) below FY16, and $275 million for Gavi, an increase of $40 million (17%) above FY16.
The majority of U.S. bilateral funding for global immunization activities supports polio vaccination efforts at both USAID and CDC. Total U.S. polio funding increased from $136 million ($34 million at USAID and $102 million at CDC) in FY10 to $228 million ($59 million at USAID and $169 million at CDC) in FY16. The President’s FY17 budget request includes $226 ($52 million at USAID and $174 million at CDC) million for polio activities, a decrease of $2 million (1%) compared to FY16.
The United States in Context: International Donor Assistance for Maternal & Child Health
The U.S. is the largest donor government to MCH activities in the world. A recent Lancet study analyzed donor assistance for MCH activities from 2003 to 2012 and found that the U.S. was the single largest donor government to international MCH efforts in the world in each year during the period. According to the study, in 2012, the U.S. accounted for 16% of total donor assistance for MCH, followed by GAVI (11%), the Global Fund (10%), EU Institutions (9%), and the Bill & Melinda Gates Foundation (8%).19 The Institute for Health Metrics and Evaluation (IHME) also conducted a similar analysis examining development assistance for health. This analysis also found that the U.S. was the largest donor government to MCH activities in each year between 1990 and 2014.20
Figures & Tables
Table 1. U.S. Government Funding for MCH Programs, Bilateral & Multilateral, in Millions, FY10-FY17 Request
2010
2011
2012
2013
2014
2015
2016
2017Request
Bilateral
$725.5
$752.3
$797.8
$773.7
$844.6
$840.2
$839.2
$868.7
USAID
$571.9
$601.5
$630.0
$614.2
$644.2
$631.6
$620.2
$644.7
of which polio
$34.3
$32.3
$39.5
$43.7
$59.0
$59.0
$59.0
$51.6
CDC Global Immunization
$153.7
$150.9
$167.7
$159.5
$200.4
$208.6
$219.0
$224.0
of which polio
$101.8
$101.6
$115.9
$110.3
$150.5
$158.8
$169.0
$174.0
Multilateral
$210.3
$222.1
$261.8
$263.1
$307.0
$332.0
$367.5
$407.0
Gavi
$78.0
$89.8
$130.0
$138.0
$175.0
$200.0
$235.0
$275.0
UNICEF
$132.3
$132.3
$131.8
$125.2
$132.0
$132.0
$132.5
$132.0
Total
$935.8
$974.4
$1,059.5
$1,036.8
$1,151.6
$1,172.2
$1,206.7
$1,275.7
of which Immunizations
$265.9
$273.0
$337.2
$341.2
$434.4
$467.6
$513.0
$550.6
Notes: Includes MCH funding (base and supplemental) provided through USAID and CDC as well as U.S. contributions to UNICEF and Gavi. Does not include funding provided through Food for Peace (FFP) due to the unique nature of the program. FY10-FY15 are final planned funding levels. FY13 includes the effects of sequestration. FY16 funding totals are preliminary estimates (FY16 funding provided through the ESF and DA accounts is determined at the agency level and is not yet known; for comparison purposes, FY16 funding totals through these accounts are based on prior year levels). FY17 is the President’s budget Request.
Figure 1: U.S. Funding for Global Maternal & Child Health (MCH), FY 2010-FY 2017 RequestFigure 2: U.S. Global Health Funding, By Sector, FY 2016Figure 3: U.S. Funding for Global Immunization, FY 2010-FY 2017 Request
Table 2. U.S. Government Funding for MCH Programs, by Country & Region, in Millions, FY10-FY15
2010
2011
2012
2013
2014
2015
Country Total
$2,481.4
$2,542.8
$2,549.7
$2,544.4
$2,553.7
$2,547.8
Afghanistan*
$82.1
$109.6
$89.8
$101.1
$78.8
$67.1
Albania
$1.2
$1.3
$0.0
$0.0
$0.0
$0.0
Angola
$1.3
$1.3
$1.4
$1.3
$1.0
$1.0
Armenia
$1.9
$2.0
$2.0
$0.2
$0.0
$0.0
Azerbaijan
$1.3
$1.6
$0.0
$0.0
$0.0
$0.0
Bangladesh*
$13.5
$21.0
$27.0
$28.5
$30.0
$30.0
Belarus
$0.1
$0.0
$0.0
$0.0
$0.0
$0.0
Benin
$3.7
$4.9
$4.9
$3.8
$3.6
$3.6
Bolivia
$5.6
$6.0
$6.0
$0.0
$0.0
$0.0
Burma
$0.0
$0.0
$2.0
$2.9
$7.0
$5.0
Burundi
$1.8
$2.1
$2.1
$2.0
$2.0
$2.0
Cambodia
$7.8
$9.0
$9.0
$8.0
$6.0
$6.0
Democratic Republic of Congo*
$13.0
$15.5
$20.2
$32.4
$34.8
$34.8
Djibouti
$0.1
$0.2
$0.0
$0.0
$0.0
$0.0
Dominican Republic
$1.9
$2.0
$2.0
$1.0
$0.0
$0.0
Ecuador
$0.0
$0.0
$0.0
$0.0
$0.0
$0.0
Egypt
$2.0
$3.0
$0.0
$0.0
$5.9
$0.0
El Salvador
$1.9
$2.0
$0.0
$0.0
$0.0
$0.0
Ethiopia*
$16.4
$21.0
$27.3
$37.1
$39.3
$39.3
Georgia
$3.9
$3.5
$3.3
$0.8
$0.0
$0.0
Ghana*
$4.3
$8.0
$8.0
$8.0
$8.0
$8.0
Guatemala
$3.5
$6.0
$6.0
$5.7
$4.0
$3.0
Guinea
$2.3
$2.5
$2.5
$2.5
$2.4
$2.4
Haiti*
$35.4
$14.0
$14.0
$14.0
$14.0
$14.0
Honduras
$2.7
$2.5
$2.5
$2.2
$0.0
$0.0
India*
$17.9
$20.0
$22.0
$19.0
$18.5
$14.0
Indonesia*
$14.6
$15.5
$20.0
$20.0
$20.0
$20.0
Iraq
$0.0
$17.8
$2.3
$0.0
$0.0
$0.0
Jamaica
$0.0
$0.0
$0.0
$0.0
$0.0
$0.0
Jordan
$21.5
$10.0
$10.0
$10.0
$13.0
$24.8
Kazakhstan
$0.2
$0.4
$0.0
$0.0
$0.0
$0.0
Kenya*
$5.5
$8.0
$10.4
$11.4
$13.0
$13.7
Kosovo
$0.6
$0.0
$0.0
$0.0
$0.0
$0.0
Kyrgyz Republic
$1.0
$0.6
$1.0
$0.0
$0.0
$0.0
Liberia*
$6.4
$8.0
$8.0
$11.0
$11.0
$11.0
Madagascar*
$8.5
$8.6
$8.6
$8.6
$9.0
$9.0
Malawi*
$5.6
$9.0
$11.7
$11.7
$14.5
$14.5
Mali*
$7.7
$10.5
$13.7
$13.7
$13.7
$13.7
Mozambique*
$8.1
$12.0
$12.0
$12.1
$15.4
$15.4
Nepal*
$5.8
$10.5
$15.5
$15.5
$15.5
$15.5
Nicaragua
$2.6
$2.2
$2.9
$0.0
$0.0
$0.0
Niger
$0.0
$0.0
$0.0
$0.0
$0.0
$0.0
Nigeria*
$16.3
$23.0
$29.9
$45.7
$48.0
$48.0
Pakistan*
$71.1
$46.2
$43.0
$12.8
$16.5
$24.7
Paraguay
$0.0
$0.0
$0.0
$0.0
$0.0
$0.0
Peru
$3.4
$3.4
$4.0
$0.0
$0.0
$0.0
Philippines
$3.0
$3.0
$3.0
$2.5
$2.5
$2.0
Romania
$0.0
$0.0
$0.0
$0.0
$0.0
$0.0
Russia
$0.9
$0.3
$0.0
$0.0
$0.0
$0.0
Rwanda*
$5.5
$9.0
$9.0
$9.0
$10.0
$10.0
Senegal*
$4.6
$6.5
$8.5
$8.5
$10.5
$8.5
Sierra Leone
$0.0
$0.0
$0.0
$0.0
$0.0
$0.0
Somalia
$1.4
$1.5
$1.6
$0.0
$0.0
$0.0
South Africa
$0.0
$0.0
$0.0
$0.0
$0.0
$0.0
South Sudan*
$14.3
$19.0
$24.7
$20.1
$18.0
$18.0
Tajikistan
$2.2
$2.0
$2.0
$2.0
$2.0
$2.0
Tanzania*
$5.2
$9.0
$11.7
$12.6
$13.1
$13.1
Timor-Leste
$0.9
$1.0
$1.0
$1.0
$1.0
$1.0
Turkmenistan
$0.4
$0.0
$0.0
$0.0
$0.0
$0.0
Uganda*
$5.4
$8.5
$11.1
$12.4
$16.0
$16.0
Ukraine
$0.0
$0.6
$0.0
$0.0
$0.0
$0.0
Uzbekistan
$0.3
$0.0
$0.0
$0.0
$0.0
$0.0
West Bank and Gaza
$9.0
$9.4
$1.8
$0.0
$0.0
$0.0
Yemen*
$4.5
$5.5
$5.5
$5.5
$5.5
$5.5
Zambia*
$6.8
$9.5
$10.3
$11.8
$13.3
$13.3
Zimbabwe
$2.8
$3.0
$3.0
$3.0
$3.0
$3.0
Regional Total
$14.1
$17.2
$17.6
$18.3
$17.4
$15.6
Africa Regional Office
$8.5
$9.9
$9.4
$8.8
$8.6
$8.0
Asia Middle East Regional Office
$1.8
$2.5
$2.6
$2.4
$0.0
$0.0
Asia Regional
$0.0
$0.0
$0.0
$0.0
$2.3
$2.3
East Africa Regional Office
$0.9
$1.0
$1.1
$1.1
$0.9
$1.0
Europe and Eurasia Regional
$0.0
$0.2
$0.0
$0.0
$0.3
$0.0
Europe Regional Office
$0.0
$0.1
$0.2
$0.0
$0.0
$0.0
Latin America and Caribbean Regional Office
$2.1
$2.6
$3.3
$3.4
$3.0
$1.8
Sahel Regional Program
$0.0
$0.0
$0.0
$1.5
$1.6
$1.6
West Africa Regional Office
$0.7
$0.8
$1.0
$1.0
$0.8
$1.0
Total
$2,495.5
$2,560.0
$2,567.3
$2,562.7
$2,571.1
$2,563.4
Notes: Includes country-specific and regional MCH funding (base and supplemental) provided through USAID. Does not include funding provided through Food for Peace (FFP) due to the unique nature of the program. FY10-FY15 are final funding levels. FY13 includes the effects of sequestration. Funding for South Sudan includes funding provided to Sudan prior to 2011 as this funding was concentrated in the southern portion of the country. *Represents a USAID priority country.
Table 3. U.S. Government Funding for Immunization Programs, Bilateral & Multilateral, in Millions, FY10-FY17 Request
2010
2011
2012
2013
2014
2015
2016
2017Request
USAID
$112.3
$122.1
$169.5
$181.7
$234.0
$259.0
$294.0
$326.6
of which polio
$34.3
$32.3
$39.5
$43.7
$59.0
$59.0
$59.0
$51.6
of which Gavi
$78.0
$89.8
$130.0
$138.0
$175.0
$200.0
$235.0
$275.0
CDC Global Immunization
$153.7
$150.9
$167.7
$159.5
$200.4
$208.6
$219.0
$224.0
of which polio
$101.8
$101.6
$115.9
$110.3
$150.5
$158.8
$169.0
$174.0
Total
$265.9
$273.0
$337.2
$341.2
$434.4
$467.6
$513.0
$550.6
Notes: FY10-FY15 are final funding levels. FY13 includes the effects of sequestration. FY16 is a preliminary estimate. FY17 is the President’s budget Request. USAID estimates that, in addition to funding for polio and Gavi, approximately $20 million in bilateral MCH funding is provided for immunization activities annually. However, since these activities are funded at the country level as components of integrated health systems strengthening or health service delivery activities within the larger MCH portfolio, specific per year funding totals are not available. Additionally, U.S. funding for UNICEF that may, in turn, be used to support immunization efforts, is not included. As such, the immunization funding totals presented in this analysis should be considered a conservative estimate.
Endnotes
IHME. Financing Global Health 2014: Shifts in Funding as the MDG Era Closes; 2015. ↩︎
Arregoces, L. et al., Countdown to 2015: changes in official development assistance to reproductive, maternal, newborn, and child health, and assessment of progress between 2003 and 2012, The Lancet Global Health, Volume 3, Issue 7, 410 – 421. ↩︎
U.S. immunization totals include funding provided through the CDC’s Global Immunization program, USAID funding for polio, and the U.S. contribution to Gavi. U.S. funding for UNICEF that may, in turn, be used to support immunization efforts, is not included. As such, the immunization funding totals presented in this analysis should be considered a conservative estimate. ↩︎
USAID estimates that, in addition to funding for polio and Gavi, approximately $20 million in bilateral MCH funding is provided for immunization activities annually. However, since these activities are funded at the country level as components of integrated health systems strengthening or health service delivery activities within the larger MCH portfolio, specific per year funding totals are not available. ↩︎
With the exception of FY16 and FY17, all funding totals in this analysis represent the final funding level for that fiscal year. This includes both base and supplemental appropriations for bilateral MCH activities as well as U.S. contributions for UNICEF and Gavi. FY16 represents the enacted level and FY17 represents the President’s budget request. ↩︎
IHME. Financing Global Health 2014: Shifts in Funding as the MDG Era Closes; 2015. ↩︎
Arregoces, L. et al., Countdown to 2015: changes in official development assistance to reproductive, maternal, newborn, and child health, and assessment of progress between 2003 and 2012, The Lancet Global Health, Volume 3, Issue 7, 410 – 421. ↩︎
USAID. Ending Preventable Maternal Mortality: USAID Maternal Health Vision for Action; June 2014. ↩︎
Prior to FY10, funding for MCH programs included support for nutrition activities. For comparison purposes, MCH funding prior to FY10 is not included. ↩︎
U.S. immunization totals include funding provided through the CDC’s Global Immunization program, USAID funding for polio, and the U.S. contribution to Gavi. U.S. funding for UNICEF that may, in turn, be used to support immunization efforts, is not included. As such, the immunization funding totals presented in this analysis should be considered a conservative estimate. ↩︎
USAID estimates that, in addition to funding for polio and Gavi, approximately $20 million in bilateral MCH funding is provided for immunization activities annually. However, since these activities are funded at the country level as components of integrated health systems strengthening or health service delivery activities within the larger MCH portfolio, specific per year funding totals are not available. ↩︎
Includes both base and supplemental funding. In recent years, bilateral funding for MCH activities is provided through the Global Health Programs (GHP) and Economic Support Fund (ESF) accounts at USAID, and historically, funding has also been provide through the Assistance for Europe, Eurasia and Central Asia (AEECA) and Development Assistance (DA) accounts at USAID. Does not include funding provided through Food for Peace (FFP) due to the unique nature of the program, in FY15 the U.S. provided $3 million for MCH activities through FFP. ↩︎
FY16 is based on funding provided in the “Consolidated Appropriations Act, 2016” (P.L. 114-113) and is a preliminary estimate. ↩︎
KFF. The U.S. & Gavi, the Vaccine Alliance; March 2015. ↩︎
U.S. immunization totals include funding provided through the CDC’s Global Immunization program, USAID funding for polio, and the U.S. contribution to Gavi. U.S. funding for UNICEF that may, in turn, be used to support immunization efforts, is not included. As such, the immunization funding totals presented in this analysis should be considered a conservative estimate. ↩︎
USAID estimates that, in addition to funding for polio and Gavi, approximately $20 million in bilateral MCH funding is provided for immunization activities annually. However, since these activities are funded at the country level as components of integrated health systems strengthening or health service delivery activities within the larger MCH portfolio, specific per year funding totals are not available. ↩︎
Arregoces, L. et al., Countdown to 2015: changes in official development assistance to reproductive, maternal, newborn, and child health, and assessment of progress between 2003 and 2012, The Lancet Global Health, Volume 3, Issue 7, 410 – 421. ↩︎
IHME. Financing Global Health 2014: Shifts in Funding as the MDG Era Closes; 2015. ↩︎
Millions of people have gained access to health insurance coverage under the Affordable Care Act (ACA) through Medicaid and the Marketplaces. While research shows that coverage improves access to care and promotes financial stability, issues around access and affordability remain, and are more acute for the low-income population. To learn more about how low-income individuals have fared with their new coverage, we conducted nine focus groups (three groups with Medicaid enrollees and six groups with low-income Marketplace enrollees) in six states (California, Florida, Maryland, Missouri, Ohio, and Virginia). Many participants were struggling financially and reported substantial debt (including medical debt). Many had ongoing physical and mental health needs and were accessing health services to treat those conditions. Following are key themes from the groups:
New coverage did not change underlying financial struggles and hardship due to medical debt incurred prior to gaining coverage. Many participants were stretched financially, had limited capacity to absorb unexpected costs, and struggled with finding secure employment in their area.
Medicaid stands up well for the lowest income participants in terms of ease of enrollment, out-of-pocket costs and affordability, and ability to find providers and access care. A small number of participants reported trouble affording care that wasn’t covered (particularly for vision or dental) and difficulty finding some providers, including mental health providers.
Largely due to premium tax credits in the Marketplace, premiums were generally affordable, but out-of-pocket costs weighed heavily on Marketplace participants, especially those with high deductible plans. Many reported being overwhelmed by plan choices. Some were able to make trade-offs to purchase higher cost plans with lower deductibles to meet anticipated care needs, but not everyone was able to afford higher premiums.
The fear of unknown costs was a constant worry for many Marketplace participants. Many got bills for services they thought were covered, such as screenings, colonoscopies and mammograms when issues were discovered and treated. These bills caused many to avoid getting needed care. Marketplace participants also reported trouble affording care that wasn’t covered by their plan, notably vision and some dental services.
Most participants had accessed care and were positive overall about new ACA coverage through Medicaid and the Marketplace. They were grateful that coverage was available to them, particularly those who had been previously ineligible for Medicaid or barred from private coverage due to pre-existing conditions. However, many Marketplace participants wanted coverage to be more affordable.
Introduction
Since the implementation of the Affordable Care Act in 2010, millions of people have gained health coverage through health insurance Marketplaces and expanded Medicaid in states that have opted to adopt the Medicaid expansion. This new coverage has improved access to care and provided financial protection against medical expenses for many.1 However, affording this coverage is a problem for some. Particularly for low-income individuals with private insurance through the Marketplaces, premiums and out-of-pocket costs can be difficult to afford, creating barriers to accessing needed care. Although Medicaid offers protection from premiums and deductibles, some beneficiaries may still face challenges getting the care they need. Additionally, problems paying medical bills continue to plague many, even those with insurance.2 These problems can be especially acute for low and moderate-income individuals and families, many of whom are burdened by debt and struggle to pay monthly bills.
The ACA expanded Medicaid to nearly all nonelderly adults with incomes at or below 138% of the federal poverty level (FPL). With the June 2012 Supreme Court ruling, the Medicaid expansion effectively became optional for states, and as of January 2016, 31 states and DC had expanded Medicaid eligibility under the ACA. In states that did not adopt the expansion, individuals with incomes between 100-138% FPL are eligible for tax credits in the Marketplace, but Marketplace coverage has more out-of-pocket costs than Medicaid.
This report is based on focus group discussions with low and moderate income adults who gained Medicaid or Marketplace coverage following the implementation of the ACA. It explores several areas about their coverage, including their experiences signing up for coverage; their knowledge of what their plan covers and what factors they weighed in choosing their plan; what they pay for their coverage and their perceptions of whether these costs are affordable; their experiences accessing care; and the impact of out-of-pocket costs on their ability to get needed care. Building on other research in this area, this report provides valuable insights into the ongoing financial struggles facing low-income individuals and the problems they confront affording health coverage.
Methods
The findings are based on nine focus group discussions conducted by the Kaiser Family Foundation and Belden Russonello Strategists in six cities during January and February 2016. Sites included Baltimore, MD; Richmond, VA; Columbus, OH; St. Louis, MO; Oakland, CA; and Tampa, FL. Three of these cities are in states that have expanded Medicaid—California, Maryland, and Ohio—and in these sites, we conducted separate focus groups with individuals (income 50-138% FPL) who were enrolled in Medicaid and with those enrolled in coverage through the Marketplace (income 139-250% FPL). In the three non-expansion states—Florida, Missouri, and Virginia—we conducted focus groups only with individuals (income 100-250% FPL) who were enrolled in coverage through the Marketplace. Annual income at 138% FPL is equal to $16,242 for an individual and $27,724 for a family of three in 2015. Annual income at 250% FPL is equal to $29,700 for an individual and $50,400 for a family of three.
Each focus group consisted of 9-11 participants, with a total of 91 participants including 30 covered by Medicaid and 61 covered through the Marketplace. Participants were selected to provide a mix of demographic characteristics, including age, race/ethnicity, marriage status, and work status. All individuals had used services since obtaining their current coverage and most reported having at least one chronic condition. Additionally, all reported that they had trouble affording some aspect of their current coverage, including premiums, deductibles, and/or copayments. (For more details on participants see Appendix A).
Prior to enrolling in their current coverage, three-quarters of those with Medicaid were previously uninsured while about half of those with Marketplace coverage were uninsured. Across both groups, the length of time that participants were uninsured ranged from a few months to many years, with several participants reporting they had been uninsured their entire adult lives. Most participants were aware of the coverage options available through the ACA and signed up when the coverage became available in 2014 or when they lost their previous coverage. Most participants said they learned about new coverage options through the news and media, were eager to have coverage, and signed up when the coverage became available. Some, however, were motivated to sign up to avoid paying the penalty. Often the reason for signing up influenced how they chose their plans.
Issue Brief
Key Findings
1. Underlying financial struggles and hardship due to medical debt incurred prior to gaining Medicaid or Marketplace coverage remain
Participants reported struggling financially, with many saying they had difficulty paying for basic expenses each month. Most participants in the Medicaid and Marketplace groups were working. Despite improvements in the economy since the recession, most said it was still difficult to find work or full-time jobs, and as a result, many were working part-time. In part, because of the inability in the current job market to find stable, full-time jobs, over half of participants described their financial situation as poor or just getting by. Many participants across both groups said they were having trouble affording basic needs like housing (rent or mortgage), food, utilities and transportation, and were often unable to pay monthly bills. To get by, participants said they relied on family members and churches, in some cases. Participants in the Medicaid groups were more likely to report relying on other social services, but Marketplace participants also said they went to food pantries for support.
Nearly all participants sought ways to cut expenses, including dropping internet or cable television, consolidating cell phone plans, as well as limiting the number of times they eat out. Some juggled bills by skipping some bills one month and others the next month or paying just enough to avoid having services shut off. Most tried to live within their means, but often faced unexpected bills such as car repairs, a leaky roof, or medical expenses that added to their financial struggles.
I think there’s jobs, I just think it’s hard to get a full time job… most people I know work a couple jobs to equal one full-time job. (Nancy, Richmond Marketplace) – Things are coming up all the time. Whether it’s a medical expense, whether it’s something that involves your vehicle. All kinds of things can come up at any point in time. If you’re just making it, that’s going to throw a cramp in your spending, or in your finances. (Donnie, Baltimore Marketplace)–
Contributing to financial problems, participants reported a range of chronic and acute health issues, some of which affected their ability to work. Overall the groups reported that they were in “good” health. However, across both the Medicaid and Marketplace groups, participants reported many health conditions. The most common chronic health issues across the groups were high cholesterol and blood pressure; depression, anxiety, or other mental or emotional conditions; arthritis; asthma/emphysema; and diabetes. Some participants described more serious health problems like cancer, stroke, and autoimmune diseases. A number suffered injuries on the job and others said they suffered from chronic pain. For some, these injuries and illnesses limited their job options and their ability to work, particularly when health conditions, including pain, were not well managed.
I work part-time because of my anxiety. It’s a lot easier than working full-time. (Sophie, Baltimore Marketplace) – I was injured on the job, that’s why I ended up losing the job. It was a rotator cuff…. I’ve never seen a company abandon me as fast as, “We love you Paul, but when you get hurt, you’re gone.” (Paul, St. Louis Marketplace)
The large majority of participants had some or a lot of debt, including debt from medical bills, that contributed to their financial challenges. Nearly three-quarters of participants (64 out of 91) reported having at least some debt, and many reported having a lot of debt. Student loans and medical expenses were the biggest sources of debt, but car loans and credit cards were also contributors. Among participants who reported medical debt, most of the medical expenses were incurred while they were uninsured, though some reported incurring medical debt while previously insured. Participants in both the Medicaid and Marketplace groups reported experiencing significant health problems while they were uninsured, including cancer, stroke, and kidney stones, as well as chronic conditions, such as diabetes and asthma. Getting treatment for these more severe conditions often resulted in large medical bills, but even minor issues, such as a trip to the emergency room for a broken foot, could result in unaffordable medical bills. Many were not able to make payments on this debt and were often sent to collections, ultimately damaging their finances and credit.
I have [student loans], I have been paying it for 16 years. I came out of school owing $70,000. That’s just for the Master’s degree. (Womson, Baltimore Marketplace) – There was two years we weren’t insured before the whole Obamacare. My wife had cysts she had to have removed and whatnot. We didn’t have insurance. She wasn’t working. I was the only worker. Couldn’t really afford that and pay all your bills at the same time, so that’s still piled up…it’s affecting the credit. I try to pay when I can, but there’s months you can’t pay. (Dave, St. Louis Marketplace) – I had a separate physician’s bill for one time at the ER…I thought everything was covered but no. It’s in my closet. I’ll pay it eventually. (Shaeeda, Baltimore Medicaid)
2. Medicaid coverage stands up well for the lowest income participants in terms of enrollment, access and out of pocket costs
Most participants with Medicaid said the enrollment process was simple and appreciated the ability to enroll online. Medicaid participants reported applying for their coverage through multiple avenues. Many applied through new websites, either through their state’s integrated Marketplace and Medicaid website or directly through the Medicaid agency website. Some received help enrolling at a provider’s office when they sought care or with the help of an enrollment assister. While most reported that the process was easy, a small number experienced delays in obtaining coverage and others had problems with the website. Some participants had to pick a Medicaid managed care plan once they enrolled. If they did not pick a plan they may have been assigned to a plan. Participants said they chose the plan based on brand or reputation and if they could keep their doctor.
With the new Medicaid expansion they have a hotline you can call now where if you sent in your paperwork or if you do it online, they answer the phone right away and answer questions and its great customer service. I couldn’t believe how good it was compared to dealing with the local Job and Family Services office. (Rachel, Columbus Medicaid) – I applied online. It took me like 10 or 15 minutes. You put in social security numbers. How much you make. I didn’t hear from them for a while. I think it took like two months or maybe three months before I got a letter. Eventually I got a letter saying I was approved. They send you packets with different providers. You pick a provider. They send you an insurance card. Then we had insurance. (Johntai, Baltimore Medicaid)
Several participants reported confusion and difficulty signing up for Marketplace coverage in the first year; for those signing up for the first time or renewing their coverage in 2015 the process was smoother. A number of participants said they first signed up in the fall of 2013 so they would have coverage beginning in January 2014. Those applying early indicated they faced problems with the website and other difficulties enrolling in coverage. Some faced delays in the process and reported receiving conflicting or incorrect information from enrollment assisters or the call center when they sought assistance with their application. In contrast, participants signing up for the first time in 2015 indicated the website was more functional and the process was easier. Similarly, those who renewed their Marketplace coverage in 2015 reported the process to be free of the problems from the first year and relatively easy to navigate. Despite improvements, many individuals had trouble figuring out their income, and therefore, eligibility for subsidies. Many low-income individuals may have multiple jobs, or jobs without steady income streams, so projecting their income for the year for purposes of determining eligibility for subsidies is difficult.
I felt that the website was also built for people in really traditional jobs. I’m an independent contractor, so I don’t get pay stubs every two weeks. Verifying my income and all that stuff was not easy for someone in my position. (Shannon, Baltimore Marketplace) – At first they had problems with the website but once that got going, I went to the family services and on the computer it took me like maybe five minutes. It was really easy. (Billy, Columbus Marketplace)
Participants with Medicaid described their coverage as comprehensive and affordable. Despite being screened for having affordability issues as a condition for participation in the focus group, Medicaid participants expressed satisfaction with their coverage, describing it as very affordable and providing coverage, in most cases, for the services they need. Several participants noted their affordability challenges stemmed from medical debt they were trying to pay off, unrelated to their current Medicaid coverage. They thought that coverage through Medicaid could help address prior medical bills and were disappointed when they learned that would not be the case. Once they gained coverage, participants with Medicaid obtained care to address ongoing health needs. Especially for those who were uninsured prior to enrolling in Medicaid, having coverage meant they were able to get treatment and medications for chronic conditions, including diabetes, asthma, and mental health issues. Participants appreciated not having to pay premiums and while they noted modest copayment requirements for certain services, they said these were affordable. Participants who previously had private insurance contrasted the low out-of-pocket costs in Medicaid to the larger copayments for doctor’s visits they paid previously.
It was a relief to not have to always worry about what the co-pay was going to be this time. When I had private insurance I was always worried about whether or not I was going to be able to afford the visit. (Johntai, Baltimore Medicaid)
–I’ve gone once [to the doctor] and it was completely covered. They didn’t want a copay or anything. (Cynthia, Columbus Medicaid)
–I think the good thing with this is I know the visit’s going to be covered. I don’t have to worry about how much am I going to have to shell out at the end of the visit and the guess work around how much it will be. (Shaeeda, Baltimore Medicaid)
A small number of Medicaid participants said they had problems affording services not covered by insurance, particularly dental and vision, and finding some doctors. Medicaid does not always cover vision or dental for adults or alternative treatments such as acupuncture or chiropractic care. Some participants faced out-of-pocket costs for these services; others avoided accessing these services knowing they could not afford the costs. In addition, some Medicaid enrollees reported difficulty finding certain types of providers, such as mental health providers.
I don’t want to have dental work because I don’t have dental coverage and dentists are so expensive. (Daniel, Oakland Medicaid)
–I think with specialists like chiropractors, mental health, optometry things like that, [Medicaid] could be a little better. (Jason, Columbus Medicaid)
Most Medicaid enrollees thought that paying a monthly premium would be difficult. Medicaid participants in the three locations do not face a monthly fee or premium. A limited number of states have approval or are seeking approval to impose these fees on their Medicaid expansion population, particularly for enrollees at or above 100% of poverty. Most Medicaid enrollees in these groups valued their coverage and said they would be able to pay a small amount for coverage. However, most participants felt that a fee of up to 2% of income ($20-$25 for an individual or $50-$55 for a family of four with incomes up to 138% of poverty) was high and would be a burden to pay.
It would be a struggle. (Deborah, Baltimore Medicaid)
–It feels reasonable right now because I have an income and I don’t have a lot of debt…But there have been times in my life where I was so poor and so much in debt, there is no way I could have afforded even twenty dollars a month. (Rachel, Columbus Medicaid)
–I wouldn’t have it probably. I’d probably just go without. (Jana, California Medicaid)
3. While premiums were generally affordable, out-of-pocket costs weighed heavily on Marketplace participants
Understanding of health insurance concepts, particularly deductibles and out-of-pocket maximums, varied widely among participants. Many Marketplace participants reported being overwhelmed by the plan choices and had difficulty weighing different plan options. They admitted being confused by terms like deductibles and out-of-pocket maximums when first signing up. As a result, they reported focusing more on the monthly cost of the coverage in the first year. That price sensitivity, in combination with their lack of understanding how insurance works, led some to select a plan with a lower premium but higher deductible. Knowledge improved as participants gained experience using their coverage. Most participants switched plans after their first year of coverage; some sought to avoid large premium increases while others sought a better balance between premiums and deductibles. After using their coverage for a year, some participants reported placing greater emphasis on choosing plans with lower out-of-pocket costs or those in which their providers participated when they renewed their coverage.
No one ever explained to you what deductibles were or what the difference between a premium and a deductible was, or why they were different. (Joanne, Richmond Marketplace)
–It’s just more simplification of the whole thing would be nice. There’s too many options, and in essence you don’t know the results of what you choose, until you actually have an operation, and then you get that $6,600 [bill from the deductible]. (Paul, St. Louis Marketplace)
–I think everybody was more prepared because they were going in this year with better information than the first year. At first it was money and now they’re through it for a year so now, they know that they need a lower deductible and they’re willing to pay a higher premium. (Billy, Columbus Marketplace)
–I did want to stay with my doctor, but the reason I chose the specific plan from the specific organization was balancing out what I pay per month, how it’s subsidized and the deductible… (Roger, Oakland Marketplace)
Availability of premium tax credits helped to make premiums affordable for many Marketplace enrollees. The premium tax credits available to low and moderate income individuals and families were important to making coverage affordable for participants. Many acknowledged that without the subsidies they received, their premiums would have been too high for them to afford each month. Some participants who had previous coverage through an employer or coverage they purchased on their own, found premiums to be lower in the Marketplace than what they had paid before. While most participants said their monthly premium was affordable, several reported having missed a premium payment because of unexpected expenses in a particular month. These individuals and families were constantly having to balance competing expenses, sometimes having to choose between paying their premium or buying food or keeping their electricity on. In addition, some mentioned it was difficult to determine eligibility for the subsidies due to fluctuations in income.
I had private insurance and I was paying through the nose, $700 and $600…when I signed up for Covered California that first year my rates dropped to like $250 for roughly the same type of coverage. (Po, Oakland Marketplace)
–What I have now, the premium is really low, and my doctors are in it. (Michelle, St. Louis Marketplace)
–We just haven’t paid [the premium] this month…I’ll pay the bills first. Whatever is left, I’ll deal with the incidentals. (Shannon, Baltimore Marketplace)
–I’m getting a premium, but I know I have to pay it back as soon as I file my taxes. I work as a waiter, and the year that they took my taxes, not much was reported. This year, I know every tax credit I got, I have to pay back as soon as I file. Not looking forward to that. (Zak, Baltimore Marketplace)
Participants expressed concern about their ability to afford the out-of-pocket costs related to their plan deductibles, especially those participants with higher deductible plans. Nearly all participants reported their plan included an annual deductible that required them to pay out of pocket for services before their insurance would take effect. These deductibles ranged from less than $500 to over $6,000 for those with individual coverage and double these amounts for those with family coverage. When asked whether they could afford their full deductible, if needed, responses varied. While some said no, others had included the deductible in the calculation of their costs for the coverage and felt they could afford it. For participants enrolled in high deductible bronze plans, the costs associated with the deductibles prevented them from getting care they felt they needed. These participants described feeling as if they were uninsured for anything other than a catastrophic event. Some described their coverage as a backstop against financial ruin should a severe health care issue arise, rather insurance that covered needed medical services. As a consequence, some participants said they did not go the doctor or get treatment for chronic conditions because they knew they could not afford the costs.
My insurance last year, like I said, the deductible was really high. They didn’t really cover much. I was left with a lot of bills. I would just suffer through anything to not have to pay it. (Kimberly, Richmond Marketplace)
–There’s just too much out-of-pocket. Way too much. (Paul, St. Louis Marketplace)
–I’d really like to see some specialists but I know I wouldn’t be able to afford the copay. I have $2,000-$3,000 out of pocket every year that I, I can’t afford that. That’s why I have health insurance. If I could afford $3,000, why would I need health insurance? (Matthew, Richmond Marketplace)
–It’s a Bronze plan and the deductible is like $6,000, so basically it’s a catastrophic plan and I’ve never used it. (Po, Oakland Marketplace)
–Sometimes, it’s hard making those choices. I don’t want to decide whether to get medical treatment that I crucially need, as opposed to buying dinner. (Womson, Baltimore Marketplace)
Some participants reported making financial trade-offs to purchase plans with lower deductibles so they could get care they anticipated needing during the year. Choosing plans with lower deductibles or those that offered broad provider networks was particularly important for participants with ongoing health needs. Participants with greater understanding of how health insurance works and what to look for in a plan were able to weigh competing priorities of price versus out-of-pocket costs to select plans that would enable them to access the care they expected to need during the year. These participants reported spending a great deal of time examining different options and investigating provider networks so that they could make an informed choice. However, only those with greater financial resources were able to make these choices. Some participants who needed ongoing care said they could not afford the higher premiums associated with the lower deductible plans.
You see, with me being diabetic, high blood pressure…I needed a good medication … you know, a good drug program …so I had to go with the higher premiums. (Alan, Tampa Marketplace)
–At the marketplace, I got the most expensive plan that I could get because I knew I had to have surgery and I got the deductible…I think $1,150… and I knew that my surgery would be covered …but I still got to pay premiums and whatnot and I had to pay the deductible. The same with this year, I had surgery again so I just kept the same insurance. If I didn’t have the issue that I have I probably would have just gotten the basic with the $6,000 cap or whatever. (Brandy, Columbus Marketplace)
4. The fear of unknown costs was a constant worry for many participants, which caused many to avoid needed care
Despite some challenges, many Marketplace participants, particularly those with lower deductible plans, reported accessing needed care. Participants offered many examples of being able to go to the doctor or get needed care once they enrolled in their Marketplace coverage. They reported getting treatment for chronic conditions, such as diabetes or high blood pressure, and for mental health conditions, including anxiety and depression. Several participants said they were able to get long-standing issues addressed, and in some cases, finally had surgeries they had been putting off for years. Many also said they were able to get check-ups and routine screenings. Coverage of prescriptions drugs was particularly important for many. However, some participants expressed frustration that their drugs weren’t covered or were included in a higher tier, which meant they were forced to pay large monthly copayments.
Before I had health coverage, this was probably 3 years ago, it turns out, I had pneumonia for a month and the cough went on for another year. I just never went to the doctor. I didn’t have insurance. Finally, when I did end up getting coverage, I was told, “You have damage in your lungs from this cough that’s been going on for a year.” I was able to get medication for that. (Chris, Richmond Marketplace)
–The few visits I’ve gone in for would have buried me in debt if I didn’t have insurance. I’ll pay the $65 dollars… if it saves me from getting a $10,000 bill for what I thought was a routine test. (Shannon, Baltimore Marketplace)
–[Since gaining insurance] I filled some cavities and just took care of some stuff before I’d actually lose my front tooth and not be able to fix it. That’s a real scare because that affects your everyday life…people look at you different. (Billy, Columbus Marketplace)
However, when they used their coverage, nearly all Marketplace participants reported receiving an unexpected bill for services they thought were covered. Several participants, even those with lower deductible plans, said they were afraid to use their coverage because they worried about hidden costs, including lab tests or procedures that were not covered. In some cases, the bills participants received were the result of not yet having met the deductible for the year. However, in other cases, participants reported receiving bills because they failed to get prior authorization for the service, or because the claim was denied, or because the service was provided by a participating provider but at a non-participating facility. Several participants reported bills related to receiving a colonoscopy. In this case, participants scheduled the colonoscopy believing it would be covered as a preventive screening. However, when a polyp was discovered and removed, they received a bill for the procedure. Participants said it was impossible to anticipate these types of bills in advance, leading some to forego care to avoid unexpected costs. Some participants contacted the insurance companies and were able to resolve the problems. For others, these bills presented a financial burden, and many reported they were still paying them off.
Even though I have coverage, just for me. I still try not to go to the doctor. I try. I don’t want a bill. Every time I go to the doctor, they send me a bill in the mail. Here we go. Fax me this. Fax me that. Send me this. Prove this. Prove that. It’s ridiculous. (Regina, Baltimore Marketplace)
–You get a procedure done that you’re supposed to get done, a colonoscopy. You read the information in your health plan that says, “We cover screenings, screenings are free,” but if you find something it’s not covered. I went in and got it done thinking, I’m perfectly healthy, there’s nothing wrong with me. “Oh no, we had to take something out.” Well I’m glad they found it… Now it’s like I get this series of bills. Now the premium is higher than it was and you have medical bills. What I’ve done is I’ve not gone in to get blood screens anymore because I don’t know what they’re going to pay for. (Margie, Columbus Marketplace)
–I broke my arm and my hip and everything. I was covered by the insurance but the ambulance wasn’t. It was $900 just to take me to the hospital… Nobody tells you; I didn’t know that it wasn’t covered. I thought it was a free service. (Laura, Tampa Marketplace)
–We never hardly go to the eye doctor anymore, even though we both have glaucoma because it’s like $300, one visit to the ophthalmologist. (Dave, St. Louis Marketplace)
A number Marketplace participants said they had problems affording services not covered by insurance, particularly dental and vision, and finding some doctors. In particular, participants consistently reported that vision care, glasses, some prescription drugs, and alternative treatments (such as acupuncture or chiropractic care) were not covered. Some said they had trouble getting dental care or certain medical supplies. For participants who needed these services and supplies, they either paid out of pocket for the care or did not get the care because they could not afford it. Some also reported difficulty finding certain doctors, particularly mental health providers. In some cases, participants were forced to pay out of pocket to see specialists who were out-of-network.
It covers children but not adult [vision]. I pay for my glasses out of pocket. It’s cheaper than getting vision insurance. (JoAnna, Richmond Marketplace)
–This year, I saw on my card that I had dental… I’d gone to the dentist and I said, “Oh good, I have dental.” It turns out my dental, if somebody knocks my teeth off, I’m covered, but just to get x-rays, or cleaning, or fillings, or anything else I’m not covered. (David, St. Louis Marketplace)
5. Overall, most were positive about ACA coverage and grateful that coverage was available to them
Most participants were positive about their Medicaid and Marketplace coverage and were grateful that coverage was available to them, particularly those with pre-existing conditions.Many noted that they were able to get care and diagnose long-standing medical issues. Many with chronic needs like diabetes or asthma, highly valued their coverage and the ability to see doctors and get necessary medications. A number of individuals who had previously had private or employer coverage found Medicaid and Marketplace coverage comparable in benefits and much more affordable. Some participants who had been unable to get coverage in the individual market before the ACA due to pre-existing health conditions were especially grateful for the coverage.
For me I’m glad I have the healthcare because there’s been a couple of situations this year if I didn’t I would have been out of work for a lot longer making less money. In the long run I was able to work because of it. (Zak, Baltimore Marketplace)
–I thank God for the marketplace because if I had to pay that [for surgery] out of pocket, I just would have had to live through the pain and I wouldn’t be able to have kids anymore…if I’d had insurance before, we would’ve caught it much, much sooner. It wouldn’t have been the issue that it is today. (Brandy, Columbus Marketplace)
–I feel grateful too especially about my health care for my kids. My son has had to have surgery. He has had multiple broken bones. Things that would have been so expensive if I was uninsured and paying for it. (Rachel, Columbus Medicaid)
–Insurers turned me down [because my wife had cancer]. That’s why I was glad that they have this. Nobody can deny you because of previous or prior medical problem. That saved my wife because she has so many medical problems. We could never get insurance for her. (David, St. Louis Marketplace)
–I feel blessed because having asthma and being uninsured, to get proper medication and not being able to work because of the asthma… I feel healthier and I am able to work when I can when I need to now. Those four or five years that I didn’t have it [health insurance] was a very rough time. It was a struggle. (William, Columbus Medicaid)
While they were appreciative of the coverage, many Marketplace participants wanted better coverage that was more affordable. While people were grateful for coverage, unexpected bills, dealing with insurance companies, and facing known deductibles were sources of stress which made those with Marketplace coverage fearful to use the coverage they had. They were particularly frustrated by the out-of-pocket costs, which were unaffordable to many and wanted insurance that didn’t come with so many hidden costs. They also wanted a more streamlined system that was easier to navigate and better information to know whether services would be covered and what their out-of-pocket costs would be.
Before my surgery, I would say, probably 10 hours a week on the phone, back and forth, getting things approved. Just, I was like, this is causing me more stress than anything I’ve ever dealt with in my whole life… How in God’s name are we giving you so much money? There’s no other industry where I would give you this much money to treat me this way. (Rebecca, Richmond, Marketplace)
–I feel like I do somewhat well. I’m able to meet my bills. I own a home and everything. I have a modest savings, but at the same time, my deductible is extremely high. It’s what I can afford. I know that all it takes is one accident or something to happen and all of my savings is wiped out. (Chris, Richmond Marketplace)
–Yeah I have a mixed feeling…in my prior life when I was working full time and had health insurance. I never had to worry about if I got sick, would I be able to pay this bill or whatever. Now with this insurance and because I only work part time, it’s kind of like, I have insurance but is it going to be covered? Is something not going to work out to my advantage? I’m going to owe money.” (Joy, Columbus Marketplace)
–Yeah, it’s good to have coverage. Just in general I wish insurance was better in some way, but is this a better option? I’m not so sure it is, not the $6,600 [deductible]. I would rather if we had a choice and I would rather have a better choice. This is not the best thing. (Paul, St. Louis Marketplace)
Without coverage, many felt like they would be stressed, anxious and face negative health and financial consequences. Across Medicaid and Marketplace groups, participants said they would worry about their health and finances if they lacked coverage. For those with on-going issues, loss of coverage would mean that they could lose access to needed services or prescription drugs. For those without on-going health issues, they feared they would not be able to access primary and preventive care and that an emergency or accident would have devastating financial consequences.
I would probably suffer an anxiety attack from shock! I would limit my doctor’s visits to extreme emergencies and take my medication every other day instead of daily. (Kym, Baltimore Medicaid)
–I would not go to the doctor for well visits – or even if I were sick. I would only go to the emergency room in a crisis or to the free medical clinic at my church. I would definitely be worried and “what if I get sick” is always hanging over my head. (Corey Ann, Columbus Marketplace)
–I feel very secure having the 87 silver plan from Covered CA. If I didn’t have coverage I might move to Canada or to another country where I could buy health insurance. (Roger, Oakland Marketplace)
–PANIC!! I would feel scared and vulnerable! I would cut back on utilization and wait longer to seek care. (Julia, Tampa Marketplace)
Conclusion
Millions of people have gained access to health insurance coverage under the ACA through Medicaid and the Marketplaces. Focus groups with low-income individuals who have Medicaid or Marketplace coverage in California, Florida, Maryland, Missouri, Ohio, and Virginia reveal that many are struggling financially—they have difficulty paying their bills each month and many are burdened by debt (including medical debt). Their new coverage did not change these underlying financial struggles. However, gaining coverage enabled many to access care they needed to treat ongoing conditions giving them peace of mind.
Participants with Medicaid were generally able to access care with few out-of-pocket costs. This protection from out-of-pocket costs provided by Medicaid was important as participants with Medicaid had incomes below 138% FPL, and thus, had limited capacity to shoulder any extra costs. For Marketplace participants, premiums were generally affordable largely due to the tax credits, but some struggled with their monthly payments. In addition, out-of-pocket costs and, the fear of unexpected bills were a constant worry for Marketplace participants and caused many to avoid needed care. In states that did not expand Medicaid, individuals with incomes between 100-138% FPL can receive coverage through the Marketplace, but coverage through Medicaid would be more affordable with fewer out-of-pocket costs if their state expanded.
Most participants were positive about gaining coverage and grateful that coverage was available to them, particularly those who had been barred from coverage due to pre-existing conditions. While many Marketplace participants wanted more affordable coverage and protection from unexpected costs, they agreed that without coverage, they would not be able to access needed care and would face more stress, anxiety and worry about getting sick and how to pay for care.
The authors gratefully acknowledge Nancy Belden and Catherine Heyward with Belden Russenello Strategists for conducting the focus groups upon which this report is based. They also extend their deep appreciation to all the focus group participants for sharing their experiences to inform this project.
Terrorism, Human Rights, and Climate Change Top the Public’s Priority List for U.S. Engagement in World Affairs; Other Issues, Including Health, Rated Important
Visibility of U.S. Global Health Efforts Declining: 36% Have Heard a Lot or Some about U.S. Efforts in the Past Year, Down from 57% in 2010
Strong Support for U.S. Role in Combatting Zika At Home and Abroad
When it comes to world affairs, majorities of Americans list fighting terrorism (64%), protecting human rights (60%), and protecting the environment and fighting climate change (51%) as top priorities for the president and Congress, finds a new Kaiser Family Foundation survey of the public’s views on the United States’ role in global health.
Global health ranks somewhat lower on the public’s priority list, with about a third (35%) of Americans saying it is one of the top priorities for U.S. engagement in world affairs, and half (51%) listing it as an important priority.
When asked specifically about U.S. global health efforts, 69 percent of Americans say improving access to clean water should be one of the top priorities; followed by combating disease outbreaks like Ebola and Zika (62%), improving children’s health, including vaccinations, (61%) and reducing hunger and malnutrition (61%).
In spite of the media coverage and attention paid to the Ebola and Zika outbreaks in recent years, U.S. global health efforts appear to have declining visibility with the public. Slightly more than a third of the public (36%) say they have heard “a lot” or “some” about U.S. global health efforts in the last year, down from 57 percent in 2010.
Eight in ten Americans have heard or read at least something about the Zika virus. When it comes to strategies to combat the virus’s rapid spread, large majorities of this group support a wide range of efforts, saying the U.S. should invest resources to prevent Zika’s spread in the U.S. (90%), invest more money in research on the virus (83%), help women in countries with outbreaks access birth control (77%), and provide financial aid to countries with outbreaks (72%). The poll was conducted before the current debate in Washington about redirecting current funding to fight Zika or provide new funding instead, and did not ask about that question.
When asked about efforts to combat Zika, six in ten Americans (58%) who have heard or read about the Zika virus say the United States is doing enough to protect Americans from the virus, while one in four (26%) say the U.S. is not doing enough. When asked about the U.S. role in the global response, four in ten (38%) say the U.S. is doing enough to fight the Zika outbreak in Central and South America, while one in four (26%) say the U.S. is not doing enough, and a third (32%) say they don’t know enough to say.
Most Americans (61%) overall are aware of the association between the Zika virus and birth defects in pregnant women, which has sparked intense concern from public health officials in the U.S. and globally. (The survey was conducted before last week’s announcement by the Centers for Disease Control and Prevention confirming this link.)
Of those who have heard or read about Zika, 65 percent say women in affected countries do not have adequate access to birth control, compared to 16 percent who think they have adequate access and 18 percent who don’t know or don’t think women should have access to birth control. This group is split on whether the U.S. is doing enough to help women in these countries make decisions on family planning and preventive health, with 33 percent saying it is, 34 percent saying it isn’t, and 30 percent saying they don’t know enough to say.
Designed and analyzed by public opinion researchers at the Kaiser Family Foundation, the survey was conducted March 1-26 2016, among a nationally representative random digit dial telephone sample of 1,508 adults. Interviews were conducted in English and Spanish by landline (606) and cell phone (902). The margin of sampling error is plus or minus 3 percentage points for the full sample. For results based on subgroups, the margin of sampling error may be higher.
The 2016 Survey of Americans on the U.S. Role in Global Health is the latest in a series of surveys designed, conducted, and analyzed by the Kaiser Family Foundation in order to shed light on the American public’s perceptions, knowledge, and attitudes about the role of the United States in efforts to improve health for people in developing countries. This most recent survey updates trends on Americans’ perceptions of the most urgent problems facing developing countries, views on U.S. spending on health, and U.S. priorities for women’s health in developing countries. It also explores new questions on Americans’ awareness of the Zika virus outbreak and recent U.S. efforts to combat the outbreak both at home and in developing countries.
Executive Summary
The latest survey finds that a majority of the public wants the U.S. to take either the leading role or a major role in trying to solve international problems generally, as well as in improving health for people in developing countries specifically. However, improving health for people in developing countries is not one of the public’s top priorities for the ways in which the U.S. might engage in world affairs, falling behind fighting global terrorism and protecting human rights. Seven in ten Americans believe that the current level of U.S. spending on health in developing countries is too little or about right, yet the public is somewhat skeptical about the ability of more spending to lead to progress, with more than half saying that spending more money will not lead to meaningful progress. Republicans and independents are more skeptical than Democrats, and these partisan differences have increased over time. Another notable trend is the decreasing visibility of U.S. efforts to improve health in developing countries; just over a third of the public says they have heard “a lot” or “some” about these efforts in the past 12 months, a decrease of 21 percentage points since 2010.
The most recent survey took an in-depth look at the public’s views on the U.S. role in improving women’s health, with a particular focus on the recent outbreak of the Zika virus in Central and South America. Most Americans view promoting opportunities for women and girls as an important priority for U.S. engagement in foreign affairs, and about half (52 percent) say U.S. government is currently not doing enough to improve the lives of women and girls in developing countries. The public also largely recognizes that most women in developing countries are disadvantaged compared with their male counterparts, and that most women in developing countries (including those affected by Zika) do not have adequate access to birth control. Despite this, there are mixed reactions to U.S. involvement in this area. While most want the U.S. to help women in Zika-affected countries access birth control, the public is split into equal thirds who say the U.S. is doing enough or not doing enough to help women in these countries make family planning and preventive health decisions (with another third unsure).
Section 1: Views Of U.s. Role In World Affairs And In Global Health Efforts
Most See a Major Role for U.S. in World Affairs Generally and in Global Health Specifically
Broadly, the public is largely supportive of the U.S. playing a significant role in trying to solve international problems. About six in ten Americans (57 percent) say the U.S. should play at least a major role in world affairs, including 16 percent who say the U.S. should take the leading role and 41 percent who say the U.S. should play a major role but not the leading one. This is a decline from December 2015, when 65 percent said the U.S. should play at least a major role in world affairs, but similar to results from 2012.
Table 1: Majority Say U.S. Should Take Major or Leading Role in World Affairs
I would like you think about the role the U.S.should play in trying to solve international problems.Do you think the U.S. should take…
2012
2015
2016
…a leading role in world affairs
17%
18%
16%
…a major role, but not the leading role
43
47
41
…a minor role
26
24
28
…no role at all in world affairs
11
9
9
Don’t know/Refused
3
2
5
Similarly, six in ten Americans (61 percent) say the U.S. should play at least a major role in improving health for people in developing countries, including 15 percent who say we should take the “leading role” and 46 percent who say a “major role.” While majorities of Democrats, Republicans, and independents say the U.S. should take at least a major role in trying to solve international problems and improving health for people in developing countries, Democrats are somewhat more likely to support such a role.
Figure 1: Democrats Somewhat More Likely to See a Major International Role for U.S.
The majority of Americans think President Obama and his administration have made improving health for people in developing countries about the same level of a priority (54 percent) or a higher priority (27), compared to previous presidential administrations, with only about one in ten (11 percent) saying President Obama has made it a lower priority. Consistent with the overall sense that the U.S. should take a major role in this area, over four in ten (43 percent) say they would like the next president to make improving health for people in developing countries an even higher priority, while a similar share (39 percent) say the current priority level is about right and just 14 percent would like it to be a lower priority. Democrats are more likely to say that President Obama has made improving health a higher priority (38 percent) and are more likely to say they would like to see the next president make it a higher priority (53 percent) compared with independents (23 percent and 42 percent) or Republicans (21 percent and 31 percent).
Figure 2: Four in Ten Americans Say Next President Should Make Improving Health in Developing Countries a Higher Priority
Improving Health in Developing Countries Viewed as One of Many Important Priorities
When it comes to different ways in which the U.S. might engage in world affairs, fighting global terrorism (64 percent) and protecting human rights (60 percent) top the public’s priority list. These are closely followed by protecting the environment and fighting climate change (51 percent) and helping out in areas affected by natural disaster (50 percent).
While improving health for people in developing countries does not top the list of priorities, more than one-third (35 percent) of Americans say it is one of the top priorities, and another 51 percent deem it an important priority. This is similar to the share that say promoting opportunities for women and girls around the world (36 percent) and improving education in developing countries (34 percent) are a top priority, and slightly more than the share who say helping to reduce poverty in developing countries (30 percent) is a top priority. Fewer prioritize helping refugees from countries like Syria (20 percent), promoting democracy in other countries (19 percent), and providing military assistance to developing countries (13 percent).
Figure 3: Terrorism, Human Rights Top Priorities for World Affairs; Many Other Issues, Including Health, Rated Important
Despite the fact that improving health for people in developing countries does not top the public’s list of priorities for world affairs, two issues related to health – hunger and clean water – are named by the largest shares of Americans as the most urgent problems facing developing countries. In an open-ended question, one in four Americans name hunger or lack of food as the most urgent problem facing developing countries, followed closely by 23 percent who mention clean water. When the question is framed in terms of the most urgent health problem facing developing countries, the top two responses are similar: 28 percent name hunger or malnutrition and 22 percent say clean water.
Figure 4: Hunger and Clean Water Seen as Top Problems Facing Developing Countries
The share of Americans who name clean water as an urgent problem in both these questions has increased significantly in the past four years. In 2012, only 7 percent of Americans said that clean water was one of the most urgent problems facing developing countries, and just 12 percent named it as the one of the most urgent health problems. The increased concern regarding access to clean water in developing countries may be due to recent media attention about water quality issues in the U.S., particularly surrounding the water crisis in Flint, Michigan.
Table 2: Percent of Americans Who Say Clean Water is an Urgent Problem
2012
2016
Percent Change from 2012 to 2016
Clean water is an urgent problem
7%
23%
+16 percentage points
Clean water is an urgent HEALTH problem
12
22
+10 percentage points
The focus on clean water and reducing hunger is also evident in opinions about priorities for U.S. efforts to improve health in developing countries. Topping the list, 69 percent of Americans say that improving access to clean water should be one of the top priorities. This is slightly more than the percent who say by combating global outbreaks of diseases like Ebola and Zika (62 percent), improving children’s health (61 percent), and reducing hunger and malnutrition (61 percent) are top health priorities. While others – including combatting specific diseases like HIV/AIDS, malaria, tuberculosis, and polio as well as improving access to family planning – fall farther down the list, majorities of the public view each one of these areas as important, with fewer than a quarter saying each is “not that important.”
Figure 5: Many Health Priorities Seen as Important; Clean Water Tops the List
Mixed Attitudes on Whether U.S. Efforts Have Led To Progress
When asked about the success of U.S. global health efforts to date, the majority of the public, 67 percent, believes that over the past ten years, at least some progress has been made as a result of U.S. efforts to improve the health for people in developing countries, though relatively few (12 percent) feel that “a lot” of progress has been made. These views are shared across the political spectrum, with large shares of Democrats, independents, and Republicans all saying that at least some progress has been made.
Figure 6: Majorities Say U.S. Efforts Have Led to Some Progress for People in Developing Countries
At the same time that most Americans believe progress has been made as a result of U.S. global health efforts, overall visibility of these efforts appears to have decreased. Just over a third (36 percent) of the public in the most recent survey say that in the past year they have heard “a lot” or “some” about U.S. government efforts to improve health for people in developing countries, down from nearly half in 2013 and 2012, and 57 percent in 2010.
Figure 7: Visibility of U.S. Government Efforts Down Somewhat Since 2010
More Support For Global Health Spending Than For Foreign Aid
Previous Kaiser surveys have found that the public vastly overestimates the amount of the federal budget that is actually spent on foreign aid. In December 2015, just 3 percent of Americans correctly stated that 1 percent or less of the federal budget is spent on foreign aid, and on average, Americans say spending on foreign aid makes up 31 percent of the federal budget.1 The 2016 survey finds that half of Americans say the U.S. is spending “too much” on foreign aid while only one in five say the U.S. is spending “too little” (19 percent) or the right amount (21 percent). Yet, after hearing the fact that foreign aid spending is about one percent of the federal budget, the percent of individuals who say spending is “too much” drops from 49 percent to 30 percent.
Figure 8: Half of Americans Say U.S. is Spending Too Much on Foreign Aid Until They Know Actual Spending Amount
The public is more supportive of U.S. spending on global health than foreign aid more generally. When asked specifically about global health spending, seven in ten say the U.S. is now spending too little (32 percent) or about the right amount (38 percent) on efforts to improve health for people in developing countries, and fewer than one-fifth say the U.S. is spending too much (18 percent). Over time, opinions on U.S. spending on improving health in developing countries have remained fairly stable, but the most recent survey does record the lowest share (18 percent) of Americans saying that the U.S. is spending too much on health in developing countries. This share is down from 30 percent in December 2015, a decrease that was seen across partisan subgroups.
Figure 9: Trend in Views of U.S. Spending on Health in Developing Countries
Partisan Differences In Views On U.S. Global Health Spending
Similar to partisan differences on the role of government and federal spending on domestic priorities found in other surveys, there are differences in views of U. S. spending on global health by political party identification. Democrats are more likely to say the country is spending “too little” than “too much” (49 percent vs. 9 percent), whereas Republicans are more likely to say the opposite, that the country is spending “too much” rather than “too little” (31 percent vs. 14 percent). Independents fall in the middle, with 32 percent saying the U.S. spends “too little” and 18 percent saying the U.S. spends “too much” on health in developing countries.
Figure 10: Democrats More Likely to Say U.S. Currently Spends Too Little on Global Health
At the same time that the public generally supports maintaining or increasing government spending on health in developing countries, there is also doubt about the potential effectiveness of increased spending from the U.S. and other developed nations. More than half of Americans (57 percent) believe that spending more money will not make much of a difference in improving health for people in developing countries, while about four in ten (39 percent) say that more spending will lead to meaningful progress.
Republicans and independents are particularly skeptical, with majorities saying increased spending will not make much of a difference, 71 percent and 60 percent, respectively. This is compared to nearly six in ten Democrats (56 percent) who say increased spending will lead to meaningful progress and 42 percent who say increased spending will not make much of a difference.
These partisan differences have increased over time, from a margin of 13 percentage points separating the shares of Republicans and Democrats who believed spending more would lead to progress in 2009, compared to a difference of 32 percentage points today.
Figure 11: Over Time, Fewer Republicans Say U.S. Spending Will Lead to Meaningful Progress
Americans see a variety of benefits, both at home and abroad, to U.S. spending to improve health in developing countries. About three-fourths (74 percent) say such spending helps protect the health of Americans by preventing the spread of diseases like Ebola and Zika, and nearly six in ten (59 percent) say it helps to improve the image of the U.S. throughout the world. Two-thirds (68 percent) also believe such spending helps make people and communities in developing countries more self-sufficient. Americans are more skeptical about the impact of such spending on U.S. national security and the U.S. economy, with about four in ten saying spending helps in these areas (41 percent each) and over half saying it doesn’t have much impact (56 percent each). Partisan differences exist here, too, with Democrats more likely than Republicans to say that spending on global health helps in each of these areas. Still, majorities of Republicans say spending helps protect Americans from disease (68 percent), helps make people and communities in developing countries more self-sufficient (59 percent), and helps to improve the U.S. image around the world (52 percent).
Table 3: Democrats More Likely to Say Spending Money on Improving Health in Developing Countries Helps U.S. and Other Countries
Percent who say spending money on improving health in developing countries helps…
Total
Democrats
Independents
Republicans
…protect the health of Americans by preventing the spread of diseases like Ebola and Zika
74%
79%
74%
68%
…make people and communities in developing countries more self-sufficient
68
75
70
59
…improve the U.S. image around the world
59
66
61
52
…U.S. national security by lessening the threat of terrorism originating in developing countries
41
49
41
30
…the U.S. economy by improving the circumstances of people who can buy more U.S. goods
41
52
39
28
Determining How Global Health Spending Should Be Directed
In terms of which criteria should be used to determine allocation of U.S. spending on health in developing countries, the public, regardless of party identification, ranks two factors at the top of the list: whether a problem mainly affects children, and whether the U.S. could be threatened by a similar health problem (nearly seven in ten say each of these should be “very important” in determining how U.S. dollars are spent). Roughly half also say “how many people die each year from a given health problem” (55 percent) and “the number of lives saved relative to the amount spent” (49 percent) should be very important criteria. U.S. foreign policy concerns rank lower on the list, with 41 percent placing great importance on whether a country is friendly to the U.S., and just over one-third (36 percent) saying the same about whether spending is in the interest of U.S. foreign policy.
Figure 12: Whether a Health Problem Affects Children or Threatens U.S. Seen Most Important In Deciding How To Allocate Funds
When asked how funds should be directed, a majority of the public thinks the U.S. should give money to international organizations like the Global Fund to Fight Aids, Tuberculosis and Malaria (77 percent), the United Nations and the World Health Organization (71 percent), or directly to U.S. based non-profits operating programs in developing countries (65 percent). Half of Americans also say the U.S. should give money directly to local non-profits based in developing countries. On the other side, majorities say the U.S. should not give money directly to religious or faith-based organizations (55 percent) or directly to governments in developing countries (65 percent).
Figure 13: Public Wants Funds to Go to International Organizations and U.S.-Based Non-Profits, Not Developing Country Governments
More broadly, seven in ten Americans (69 percent) want the U.S. to participate in international efforts when giving aid to improve health in developing countries, compared to 28 percent who want the U.S. to operate on its own so it has more control over how the money is spent and gets more credit and influence in the country receiving aid. The share who want the U.S. to participate in international efforts has increased steadily over the past seven years, from 55 percent in 2009 to 69 percent in 2016.
Figure 14: Seven in Ten Americans Say U.S. Should Participate in International Efforts to Improve Health in Developing Countries
Section 2: Views On The U.s. Role Improving The Lives Of Women And Girls In Developing Countries
Many health issues in developing countries have a disproportionate impact on women and girls, and the most recent survey took an in-depth look at the public’s views on the U.S. role in improving women’s health, with a particular focus on the recent outbreak of the Zika virus in Central and South America. As noted above, nearly all Americans (90 percent) view promoting opportunities for women and girls as an important priority for U.S. engagement in foreign affairs, with over a third (36 percent) deeming it one of the top priorities.
The public also largely recognizes that most women in developing countries are disadvantaged compared with their male counterparts. Large majorities say that women in developing countries are worse off than men in their legal rights (81 percent), ability to get a good education (78 percent), likelihood of living in poverty (71 percent), and their ability to get the health care services they need (63 percent).
Figure 15: Most Say Women in Developing Countries Worse Off Than Men
Interestingly, men and women provide similar responses, with majorities of both sexes saying that women are worse off. The only item in which women are more likely than men to say that women are worse off is the likelihood of living in poverty with 75 percent of women saying the women are worse off compared to 67 percent of men.
Figure 16: Equal Shares of Men and Women Say Women in Developing Countries Are Worse Off
More than half (52 percent) of Americans think the U.S. government is not doing enough to improve the lives of women and girls in developing countries, while about one-third of Americans (32 percent) think the U.S. government is currently doing enough and 4 percent say the U.S. is either doing too much or shouldn’t be involved. A large majority of Democrats (68 percent) and a slim majority of independents (52 percent) say the U.S. government is not doing enough, while Republicans are more evenly split with 42 percent saying the U.S. government is doing enough and 36 percent saying it is not doing enough.
Figure 17: Half of the Public Says U.S. is Not Doing Enough to Improve Lives of Women in Developing Countries
The Zika Virus
One recent global health development that has a disproportionate impact on women in developing countries is the Zika virus outbreak. The mosquito-borne Zika virus, which has mostly affected South and Central American countries and has been associated with birth defects in babies born to infected mothers, was declared a global health emergency by the United Nations on February 1st.2 Eight in ten Americans say they have heard or read about the Zika virus, with 23 percent saying they have heard or read “a lot” and 32 percent saying they have heard “some.”
Figure 18: Eight in Ten Americans Have Heard at Least a Little about Zika
The majority of the American public is aware of the potential ways to spread the virus and potential effects of the virus. About three-quarters (73 percent) are aware that a person can become infected through a bite from an infected mosquito, more than half (53 percent) are aware that a person can become infected by having sex with someone who is infected, and 64 percent are aware that it does not appear to be spread through shaking hands with an infected person.
Figure 19: Majorities of Public Are Aware of How Zika Is (and Is Not) Spread
Six in ten Americans know about the connection between the Zika virus and birth defects in children born to infected mothers. This connection was confirmed by the CDC on April 13th, 2016.3
Figure 20: Six in Ten Are Aware of Association Between Zika and Birth Defects
Given this link, concerns have been raised about women’s access to contraception in Zika-affected areas4 . Three-fourths (76 percent) of Americans say that most women in developing countries do not have adequate access to birth control while just 12 percent believe these women have adequate access and another 12 percent are unsure. When asked specifically about developing countries affected by the Zika virus, results are somewhat similar. Most (65 percent) of those who have heard or read about the Zika virus say women in developing countries affected by the virus do not have adequate access to birth control, while 16 percent believe they do have adequate access and 18 percent are unsure.
Figure 21: Majority of Americans Think Women in Developing Countries Do Not Have Adequate Access to Birth Control
Women are somewhat more likely than men to know about the connection between the Zika virus and birth defects in babies born to infected mothers. Sixty-four percent of women report knowing about this connection compared to 57 percent of men. In addition, women are more likely than men to worry that they or someone in their family will be affected by the Zika virus and to worry that the U.S. will see a large number of cases of the Zika virus in the next 12 months. Nearly half of women (46 percent) are “very” or “somewhat” worried that the U.S. will see a large number of Zika cases, compared to 35 percent of men. Three in ten women (31 percent) are worried that they or someone in their family will be affected by the Zika virus, compared to 23 percent of men.
Figure 22: Women Somewhat More Likely Than Men to Worry About Zika Virus
Despite this, fewer than one in ten Americans (9 percent) report they have changed their travel plans to avoid countries affected by Zika, including 12 percent of women of reproductive age (those between the ages of 18 and 49).
Figure 23: One in Ten Report Changing Travel Plans Due to Zika
Attitudes Towards U.S. Efforts to Fight the Zika Virus
Among those who have heard or read anything about the Zika virus, a majority give mostly positive ratings to government efforts to combat Zika in the United States, though many are unsure about U.S. efforts in Central and South America. Six in ten (58 percent) say the U.S. is doing enough to protect Americans from the virus, while one in four (26 percent) say the U.S. is not doing enough and another 15 percent say they don’t know enough to say. Comparatively, four in ten (38 percent) say the U.S. is doing enough to fight the Zika virus in Central and South America, while 26 percent say the U.S. is not doing enough and almost a third (32 percent) say they don’t know enough to say. Two percent volunteer that the U.S. is doing too much in this area or should not be involved.
Figure 24: Most Think U.S. is Doing Enough to Protect Americans From Zika, More Unsure on Abroad Efforts
Attitudes are also split on whether the U.S. is doing enough to help women in developing countries who may be at risk for the Zika virus make family planning and preventive health decisions. One-third (34 percent) of Americans who have heard or read anything about Zika, say the U.S. government is not doing enough, which is roughly equal to the share who say it is doing enough (33 percent). Democrats are more likely to say the U.S. government is not doing enough (45 percent), compared to 33 percent of independents and 19 percent of Republicans.
Table 4: U.S. Government Doing Enough to Help Women in Developing Countries At Risk for Zika
Among those who have heard/read anything about Zika
Do you think the U.S. government is doing enough or not doing enough to help women in Central and South America who may be at risk for the Zika virus make family planning and preventive health decisions?
Total
Democrats
Independents
Republicans
Doing enough
33%
27%
31%
43%
Not doing enough
34
45
33
19
Doing too much/Should not be involved (vol.)
2
<1
3
4
Don’t know
30
27
33
33
When asked whether the U.S. should or should not take several actions in response to the Zika virus, nine in ten of those who have heard or read anything about Zika say the U.S. should invest resources to prevent the spread of Zika in the U.S. More than eight in ten (83 percent) also say the U.S. should invest more money in research on Zika, while three-fourths want the U.S. to help women in Zika-affected countries access birth control (77 percent), and provide financial aid to Zika-affected countries (72 percent).
Figure 25: Majorities Think U.S. Should Take Various Actions to Combat Zika at Home and Abroad
Methodology
The Kaiser Family Foundation 2016 Survey of Americans on the U.S. Role in Global Health was designed and analyzed by public opinion researchers at the Kaiser Family Foundation (KFF). The survey was conducted March 1-26 2016, among a nationally representative random digit dial telephone sample of 1,508 adults ages 18 and older, living in the United States, including Alaska and Hawaii (note: persons without a telephone could not be included in the random selection process). Computer-assisted telephone interviews conducted by landline (606) and cell phone (902, including 549 who had no landline telephone) were carried out in English and Spanish by Princeton Data Source under the direction of Princeton Survey Research Associates International (PSRAI). Both the random digit dial landline and cell phone samples were provided by Survey Sampling International, LLC. For the landline sample, respondents were selected by asking for the youngest adult male or female currently at home based on a random rotation. If no one of that gender was available, interviewers asked to speak with the youngest adult of the opposite gender. For the cell phone sample, interviews were conducted with the person who answered the phone. The survey fieldwork was funded through a grant from the Bill & Melinda Gates Foundation.
The combined landline and cell phone sample was weighted to balance the sample demographics to match estimates for the national population using data from the Census Bureau’s 2014 American Community Survey (ACS) on sex, age, education, race, Hispanic origin, nativity (for Hispanics only), and region along with data from the 2010 Census on population density. The sample was also weighted to match current patterns of telephone use using data from the January-June 2015 National Health Interview Survey. The weight takes into account the fact that respondents with both a landline and cell phone have a higher probability of selection in the combined sample and also adjusts for the household size for the landline sample. All statistical tests of significance account for the effect of weighting.
The margin of sampling error including the design effect for the full sample is plus or minus 3 percentage points. Numbers of respondents and margins of sampling error for key subgroups are shown in the table below. For results based on subgroups, the margin of sampling error may be higher. Sample sizes and margin of sampling errors for other subgroups are available by request. Note that sampling error is only one of many potential sources of error in this or any other public opinion poll. Kaiser Family Foundation public opinion and survey research is a charter member of the Transparency Initiative of the American Association for Public Opinion Research.
This brief reviews Kentucky’s experiences expanding coverage under the Affordable Care Act (ACA) to highlight lessons learned about what has contributed to the state’s implementation success. It also highlights changes being made to the Marketplace and Medicaid coverage in Kentucky and the potential impact of these changes moving forward. Through case studies and other research, the Kaiser Family Foundation has tracked ACA implementation experiences in Kentucky and several other states through the end of the second open enrollment period in January 2015 (Appendix). Going forward, state experiences through the third open enrollment period and into early 2016 will be examined. Key findings based on the work conducted to date include the following:
Kentucky has had one of the most successful ACA implementation experiences among states. Beginning in 2014, the state expanded Medicaid to low-income adults and built its own State-Based Marketplace, kynect. Since implementing the ACA, Kentucky’s uninsured rate fell from 16% in 2013 to 8% in 2014, one of the largest reductions in the country.1 A number of components contributed to Kentucky’s enrollment success. One of the most pivotal components was the single, integrated eligibility system it built for kynect and Medicaid. Other elements included strong leadership and collaboration, broad outreach and marketing efforts, and a robust and diverse network of enrollment assistance.
Following the expansion, Medicaid enrollees generally have been able to access needed services, with some challenges for specific services and in certain areas. Access for enrollees in Marketplace coverage varies by choice of plan. Per enrollee costs of care for Medicaid expansion adults have been lower than anticipated, and the state has reported cost savings as a result of the expansion.
Kentucky’s newly elected Governor has begun transitioning the fully state-run Marketplace, kynect, to a federally-supported State-Based Marketplace. With this transition, the state will rely on Healthcare.gov for some functions, including Marketplace eligibility determinations and enrollment.2 In addition, the Governor plans to seek a waiver to make changes to the Medicaid expansion.3 Looking ahead it will be important to assess how these changes may reshape coverage in Kentucky, including how the Marketplace transition affects Medicaid and Marketplace outreach and enrollment, insurer participation and plan offerings, and, if implemented, the impact of the Medicaid waiver.
Issue Brief
What has been Kentucky’s ACA implementation experience to date?
Kentucky has had one of the most successful ACA implementation experiences among states. Beginning in 2014, the state expanded Medicaid to low-income adults and built its own State-Based Marketplace, kynect. Since implementing the ACA, Kentucky’s uninsured rate fell from 16% in 2013 to 8% in 2014, one of the largest reductions in the country.4 Much of this reduction is attributed to the Medicaid expansion. Total enrollment in Medicaid grew by over 570,000 or 94% from the pre-ACA baseline period of July – September 2013 to December 2015.5 As of December 2015, the program covered roughly a quarter of the state’s population. Nearly 94,000 people are enrolled in coverage through kynect, which represents about 38% of the potential Marketplace population.6
Several components have contributed to Kentucky’s success implementing the ACA, including strong leadership and collaboration; a high-functioning integrated eligibility system for Medicaid and Marketplace coverage; broad outreach and marketing efforts; a robust and diverse network of enrollment assistance; and initiatives to strengthen access to care for Medicaid enrollees as more individuals enroll as discussed below.
Leadership and Collaboration
Stakeholders reported that kynect and Medicaid officials were highly engaged and personally committed to achieving success and were often present at outreach and enrollment events. The previous Governor made successful implementation of the coverage expansions in 2014 a priority, and this leadership carried down through state officials. Many of the state agencies involved in health reform implementation, including Medicaid, kynect, and the Department for Community Based Services, are peer agencies housed within the Kentucky Cabinet for Health and Family Services. Stakeholders indicated that this structure helped promote strong working relationships among the agencies and that they worked hand-in-hand throughout planning and implementation of the coverage expansions. There was also close coordination between kynect and the Department of Insurance. Further, the state engaged with other stakeholders early and often, including the community, advocates, assisters, agents, and providers.
“We have weekly stakeholder meetings over at kynect. It gets us all in a room and it’s a lot harder to fuss when you’re looking at somebody because we’re all peer agencies. We’re all under the same umbrella but it’s easy to get frustrated. If you all get in a room once a week it’s hard to stay frustrated because you just ask the questions and work through things. I think they’ve been very effective.”—Medicaid official
Eligibility System
One of the most pivotal components of Kentucky’s enrollment success is the single, integrated eligibility system it built for kynect and Medicaid. When the ACA coverage expansions took effect in January 2014, Kentucky launched a new integrated eligibility system that made eligibility determinations for both kynect Marketplace coverage and for non-disabled Medicaid groups, including children, pregnant women, parents and adults newly eligible through the ACA Medicaid expansion. While the Federally-Facilitated Marketplace (FFM), Healthcare.gov, and most State-Based Marketplaces experienced large system problems during the initial year of implementation in 2014, Kentucky was one of the few states that had a largely successful system launch. This successful system launch facilitated streamlined enrollment of eligible individuals in both kynect and Medicaid coverage.
Stakeholders point to a number of factors that contributed to the state’s system success. One key component is that it is a fully integrated system, which eliminates the need to transfer data between kynect and Medicaid. Moreover, consumers only receive a single notice of their determination rather than separate notices from each program, minimizing confusion. At its outset, the system also was able to make real-time determinations for most cases and could handle complex situations in which members of a family may be eligible for different types of coverage. The system also included features that consumers valued, such as a pre-screen feature that allowed consumers to anonymously shop for coverage after answering a few quick questions, as well as the ability to electronically upload documentation when it is required.
“It’s a one stop shop. You know, it takes maybe 30 to 45 minutes. You enter your information. If you’re Medicaid eligible, you pick a Medicaid managed care organization. If you’re QHP eligible, you pick a qualified health plan. So, certainly that one stop shop streamlined application process I think really contributed to our success.” –kynect official
The system’s success was underpinned by the state’s close work with contractors, ongoing implementation of workarounds and incremental fixes as needed, and use of data and feedback loops to identify problems. Stakeholders stressed that close collaboration among policy staff, IT systems staff, and contractors was vital during both the initial build of the system and on an ongoing basis to manage the system and quickly resolve problems. Contractors were co-located on site with state policy and IT staff to facilitate close and constant communication. Stakeholders also noted that the state would implement workarounds and incremental fixes when it faced early problems or glitches with its system, which allowed for continuous improvement. Medicaid and kynect officials also pointed to the importance of using data and feedback loops to understand how the system was functioning and identify problems. During the initial launch, officials reported that they closely tracked statistics to monitor system operations and would target fixes or changes as necessary when the data pointed to problems.
The state continued to refine and enhance the system over time. The system did face some early technological glitches, but stakeholders generally agreed that many were resolved by the end of the first open enrollment period. The state implemented several enhancements to the system prior to the second open enrollment period. These enhancements included allowing consumers to see premium costs with the advance premium tax credits applied when shopping for plans. In addition, the system was adjusted to display silver plans at the top of the plan list for people who qualify for cost-sharing reductions, given that these plans have the best value for these consumers by providing access to the cost-sharing reductions. Stakeholders reported that the system functioned very smoothly during the second open enrollment period, which allowed more individuals to self-enroll and freed up assistance resources to address more complex cases. As of the end of the second open enrollment period, the state was planning for continued improvements and enhancements, including addressing system problems affecting enrollment for immigrants and refugees and consumers changing plans at renewal. The state was also planning to move all Medicaid determinations, including disability-based determinations, as well as determinations for other social service programs into the new system and to launch a tablet-based application.
The kynect website included features to assist individuals seeking health insurance. These features included informational videos, a countdown clock to the end of open enrollment, an option to subscribe to email updates, a toll-free number, and information about how to obtain local in-person assistance. The website provided resources in other languages as well as a toll-free number for language assistance and a full Spanish version of the website was available. Kynect also launched a mobile app through which individuals could identify enrollment events, find an agent or assister, complete a pre-screen for eligibility, and anonymously shop. It planned to enhance the app over time to allow individuals to create an account, take images of documentation, and browse for plans, including Medicaid managed care plans (Figure 1).
Figure 1: Kynect Mobile App
Outreach and Marketing
Kentucky used state-specific branding for kynect, which helped detach the coverage expansions from the ACA or “Obamacare.” This state-specific branding was particularly important in Kentucky, since many residents are distrustful of government programs and not politically supportive of the ACA. Kentucky directed all residents seeking health insurance to “kynect, Kentucky’s Health Care Connection.” It also created animated characters that were representative of different types of Kentuckians who could benefit from the new coverage options, to which stakeholders felt consumers responded well (Figure 2). The effectiveness of the state-specific branding is supported by survey results that show that, although Kentucky residents lean negative in their views of the ACA law as a whole, they are more positive towards the programs the law has created in the state. For example, about half (49%) of residents have an unfavorable view of the health care law, but 42% have a favorable view of kynect and 63% have a favorable view of the Medicaid expansion. However, there remain large gaps in knowledge and understanding of these components of the law, with about 30% saying they don’t know enough to say their view on kynect and 13% not reporting a view on the Medicaid expansion.
I think the approach that the Governor took on this whole thing was to not talk about it in terms of Obamacare or the Affordable Care Act. He talked about it in terms of…Kentucky’s health… it’s not about politics…. It’s about improving the health of our state, so that kind of takes the argument out of it. – kynect official
Figure 2: Examples of kynect Animated Characters
Kentucky conducted statewide marketing across diverse channels. The state launched an extensive statewide marketing campaign to educate individuals about the new coverage options and used diverse channels, including television, radio, print, billboards, and social media. Messaging during the early part of the initial open enrollment period conveyed a simple, straightforward message about the availability of new coverage options and focused on raising brand awareness of kynect. In year two, outreach messaging shifted away from raising awareness to providing personal testimonials and emphasizing the importance and value of coverage. Stakeholders also indicated that messaging focused more on the availability of financial help and affordable coverage options during year two. For example, kynect’s advertising included the phrase, “If you think you can’t afford to be insured, think again” (Figure 3).
Figure 3: Outreach Messaging
In addition to a broad marketing campaign, the state and other stakeholders engaged in an expansive range of local level enrollment efforts. For example, kynect and Medicaid officials and assisters attended events throughout the state, including the state fair, where they distributed information about coverage options and encouraged people to enroll (see Box 1). They distributed reusable shopping bags at these events, which were viewed as highly effective in raising awareness of kynect. Additionally, kynect officials travelled across the state in branded RVs to promote coverage and get people enrolled. During the initial open enrollment period, kynect also established an enrollment storefront in the community that was staffed with assisters, brokers, and kynect and Medicaid staff. Stakeholders noted that this storefront was enormously successful and particularly helpful for handling complex cases because all of the people with the needed expertise were in the same room. Building on this success, kynect provided two enrollment storefronts during year two as well as enrollment kiosks in various locations. The state and assisters also hosted local enrollment events. For example, kynect promoted a “Sign-up Saturday” event at local libraries. In some cases, assisters used local media outlets to reach large numbers of consumers. For example, some assisters participated in a weekly local news station call-in show, during which consumers could call in with coverage questions.
The state and assisters utilized targeted enrollment efforts to connect with hard-to-reach populations. Stakeholders described focused efforts to reach the Latino community, including utilizing more Spanish-speaking assisters and volunteers and marketing through Spanish media channels. Assisters also targeted outreach to the immigrant community, African Americans, young adults, veterans, and the LGBT community. In addition, the state launched an initiative to enroll individuals in coverage as they re-enter the community upon release from prison or jail.
Box 1: Using the State Fair to Promote Outreach and Branding in Kentucky
The state fair in Kentucky has been a tradition for over 100 years. The fair is held in August at the Kentucky Exposition Center and attracts about 600,000 people annually. The state fair and other festivals and large sporting events across the state served as a key opportunity to provide information about coverage options to large numbers of people. Marketplace and Medicaid officials and assisters hosted informational booths at these events to raise awareness about the coverage options and initiate one-on-one conversations with interested consumers (Figure 4). Officials and assisters found that starting with the question, “Do you know somebody that doesn’t have health insurance?” was a highly effective way to initiate conversations with individuals at these events. In addition, the reusable kynect shopping bags helped engage consumers at these events. These popular, colorful bags included the kynect logo and the caricatures that appeared in ads and other kynect marketing and have been credited with successfully raising awareness of kynect and initiating a marketing buzz. Replicating the logo and characters on t-shirts and even hot air balloons made it difficult to go anywhere in the state without hearing about kynect.
Figure 4: Kynect Informational Booth at the State Fair
“[The bags] were like gold. I mean they were just really pretty, colorful, and instead of us sitting there talking about healthcare, we’d say, ‘have you heard about kynect, let me tell you about kynect’ and then people would stop and listen, and ‘do you have health insurance,’…and if they said ‘yes, I have health insurance,’ ‘well do you have a child or do you have somebody that you know that doesn’t?’ We made those connections and I think that that was one of our biggest success factors…..” — Medicaid official
Enrollment Assistance
Kentucky established an extensive consumer assistance network that drew on existing assistance networks, including those providing Medicaid and CHIP enrollment assistance, health clinics, community-based organizations, hospitals, and advocacy organizations. Kynectors, as enrollment assisters are called in Kentucky, had varied backgrounds and were able to provide personalized assistance to the communities they served. Some kynectors also said that, because of their personal ties to the community, local organizations, schools, and other groups were often willing to work closely with them and sometimes offered resources, such as space and equipment, to support enrollment. Recruiting trusted members of the community to serve as kynectors was particularly important in rural eastern Kentucky where kynectors achieved significant enrollment success. In addition to kynectors, insurance brokers played an important role in enrollment. Kynect undertook significant efforts to engage brokers in enrollment and, despite some early fears and concerns among brokers, a large number of brokers were certified and often worked collaboratively with assisters to enroll uninsured people. This relationship between kynectors and brokers became increasingly strong over time. Providers, particularly community health centers (CHCs), also played a key role in outreach and enrollment by conducting both in-reach to their uninsured patients as well as outreach to the broader community.
Agents felt very threatened about it, so very early on, both the Commissioner of Insurance and our folks assured agents that they’re going to have a role and they’re going to have a very important role. And so when we set up the advisory board, we established several subcommittees and one of them was a subcommittee called Agents and Navigators. … The idea was that we were going to put the two competing forces … together and see if we couldn’t work out some kind of agreed to relationship. – kynect official
Kentucky utilized a regionally-based hub and spoke structure to organize and coordinate assister activities. Under this model, several lead regional organizations helped organize and coordinate activities of kynectors in their area, disseminated updates and information from the state to kynectors, and provided feedback on implementation to the state. In some areas, broader coalitions of stakeholders also helped coordinate and organize activities. For example, in Louisville, the local Board of Health established an outreach and enrollment coalition that coordinated efforts, shared best practices, and provided feedback on experiences in the field to the state. Kynectors also used shared online calendars to indicate where and when they were planning events, which helped prevent gaps and overlaps in outreach and enrollment efforts.
The state provided readily available support to consumer assisters. Kentucky established resources for kynectors and brokers to obtain support when they had questions or needed assistance while helping a consumer. Kynectors had dedicated telephone lines to reach call center staff, which helped reduce long waits when they needed support. Kentucky also maintained close and regular communication with kynectors to both share updates and information and receive feedback on implementation.
Access to and Utilization of Care
There have been efforts underway at multiple levels to help increase health insurance and health care literacy among individuals. For example, kynect created a “how to kynect” brochure that provides a glossary, information on how to find a primary care provider and how to use care, and healthy living tips. Kynectors have also developed educational materials to help improve health and health care literacy among newly covered individuals.
Medicaid enrollees are accessing needed care. An independent analysis of the first year of the Medicaid expansion in Kentucky found that, compared to previously eligible parents, those in the Medicaid expansion group accessed providers at a higher rate and had increased utilization of preventive services.7 Stakeholders suggest that part of this pattern might be due to the previous lack of health insurance leading to first-time screenings and appointments particularly for diabetes, heart disease, and other chronic conditions. In addition, there has not been a spike in overall emergency room use as had been anticipated.
There are some access challenges for certain types of services and providers. These challenges include access to certain specialties and behavioral health services and access in rural areas. However, stakeholders pointed out that these challenges are reflective of overall provider shortages and not specific to Medicaid. Kentucky engaged in efforts to expand access to behavioral health providers by allowing Medicaid to contract with individual providers (rather than through community mental health centers) and additional provider types (such as licensed drug alcohol counselors) and adding new services to Medicaid (such as additional services for substance use treatment). Stakeholders in Kentucky also pointed to challenges recruiting dental providers, although they noted that access varies across the state, with greater provider availability in Louisville where there is a dental school. As of the end of the second open enrollment period, Kentucky was focused on increasing care management for Medicaid enrollees who are super-utilizers of emergency department care. In addition, Kentucky added behavioral health services into the Medicaid managed care contract in 2014, and was holding regular meetings with the plans and educational forums with behavioral health providers to support integration of these services.
Overall, Kentucky residents, particularly those enrolled in Medicaid, view the program as working well for low-income residents. Among all residents, about two-thirds (67%) feel that the Medicaid program is working well for most low-income people in the state. This share rises to 84% among adults who are actually covered by Medicaid (Figure 5).
Figure 5: Two-Thirds of Kentucky Residents Say Medicaid Is Working Well; Those Covered by Medicaid Are Even More Positive
Access to care for individuals enrolled in QHPs varies based on their choice of plan. For example, a number of stakeholders noted that some individuals who selected lower cost plans with limited networks experienced challenges getting appointments and finding providers. They suggested that some of these challenges have moderated over time as individuals have adjusted their expectations and some plans have made adjustments to better accommodate member needs.
Economic Impact of Medicaid Expansion
The state has achieved cost savings as a result of the expansion. Overall, estimates show savings resulting from the Medicaid expansion. One analysis estimated a net positive fiscal impact from the Medicaid expansion of $919.1 million from SFY 2014 through SFY 2021 compared to what the state would have spent had it not expanded. These net positive impacts resulted from increased employment, increased revenues to providers, and decreased uncompensated care.8 The analysis also found that the state’s health care system and overall economy realized an infusion of $1.16 billion driven by new federal payments to health care providers for Medicaid expansion enrollees in calendar year 2014.9
What changes are being made to kynect and Medicaid?
In December 2015, newly elected Governor Bevin took office in Kentucky. Consistent with his election campaign, he has begun making changes to Kentucky’s health coverage system. These changes include transitioning from the fully state-run Marketplace, kynect, to a federally-supported State-Based Marketplace and proposing to make changes to the Medicaid expansion through a waiver.10,11 A Kaiser Family Foundation survey of the views of Kentucky residents completed just after the Governor’s election in 2015 found that about half (52%) of residents would prefer to keep kynect, while roughly a quarter (26%) would prefer to switch to the federal marketplace. Nearly three in four (72%) Kentuckians said they would prefer to keep the state’s Medicaid program as it is rather than scale it back it to cover fewer people (Figure 6).
Figure 6: Kentucky Residents’ Views on Changes to kynect and Medicaid, 2015
What are the potential impacts of these changes?
Changes to kynect
When the state transitions to a federally-supported State-Based Marketplace, the federal government will handle all eligibility and enrollment functions for Marketplace coverage through Healthcare.gov. The state will retain responsibility for consumer assistance and will maintain review of plans to include in the Marketplace, but certification of the plans will become a federal government responsibility. Some key questions to consider about the potential effects of this change include the following:
How will the Medicaid and Marketplace enrollment experience be affected? With this change, there will no longer be an integrated eligibility determination and enrollment system for Medicaid and Marketplace coverage. On February 29, 2016, Kentucky launched Benefind, its new online portal for individuals to apply for Medicaid. Individuals may also apply for the Children’s Health Insurance Program and other programs, including the Supplemental Nutritional Assistance Program (SNAP, formerly food stamps) and Temporary Assistance for Needy Families, through Benefind. The Benefind system now serves as the state’s Medicaid eligibility determination system, while Marketplace determinations will occur through Healthcare.gov beginning in 2017. Once the transition is complete, timely and effective data transfers between Benefind and Healthcare.gov will be key for providing a seamless enrollment experience and preventing delays in eligibility determinations and gaps in coverage. Early experience with Benefind has indicated that system glitches have led to confusion and disruptions in coverage that could compromise enrollment.12
How will outreach and enrollment assistance be affected? As a federally-supported State-Based Marketplace, the state will retain responsibility for running the navigator (kynector) program. However, funding and other decisions will have important implications for the availability of consumer assistance in the future. For example, the transition to Benefind limited the role kynectors can play in assisting individuals with Medicaid coverage since only state eligibility workers can access the Benefind system.13 In addition, the state ended its advertising campaign that was targeted at raising consumer awareness about coverage options for kynect as of December 2015.14
How will this transition affect insurer participation and plan offerings in the Marketplace? The state will continue to play a leading role in negotiating with insurers and will make recommendations to the FFM regarding insurer contracts. The state will also continue to regulate the insurers. However, plans will contract with the federal government rather than the state, which may influence their participation decisions. In addition, insurers that were considering entering the market for 2017 may choose to wait out this transition year.
How much will the transition cost? The specific costs associated with the transition to a federally-supported State-Based Marketplace are uncertain. However, there are costs associated with decommissioning kynect, standing up the new Benefind eligibility system, and building functionalities to connect with Healthcare.gov. At the same time, there are savings related to foregone maintenance and operations costs for kynect and other potential savings that could accrue from reduced funding for consumer assistance and the call center.
From Medicaid Expansion to Waiver
The Governor plans to seek a waiver to make changes to the Medicaid expansion and has noted that he is looking to Indiana’s Medicaid expansion waiver as a potential model. The Governor hopes to have a plan proposed by the middle of 2016 and to implement changes at the start of 2017. To date, six states (AR, IA, MI, IN, NH, and MT) have Section 1115 waivers to implement the ACA Medicaid expansion in ways that extend beyond the law. While the waivers are each unique, they include some common provisions, including use of premium assistance, charging premiums, eliminating coverage of non-emergency medical transportation, and use of healthy behavior incentives.15 Most of the states with approved expansion waivers used the waiver to expand coverage to the uninsured population, resulting in new coverage. Since Kentucky already has its expansion in place, how the waiver affects individuals with existing coverage will be a key consideration. As more details on changes the Governor might seek through a waiver become available, it will be important to consider their impacts on enrollees, providers, costs, and program administration and complexity.
Conclusion
As a leader in implementing the ACA coverage expansions, Kentucky’s experience provides useful lessons about key components that have contributed to its success. These components include strong leadership and collaboration; a high-functioning integrated eligibility system; broad outreach and marketing efforts; a strong and diverse network of enrollment assistance; and initiatives to strengthen access to care for Medicaid enrollees as more individuals enroll. The newly elected Governor is moving forward with changes to transition from the fully state-run Marketplace, kynect, to a federally-supported State-Based Marketplace and plans seek a waiver to make changes to the Medicaid expansion. These changes have the potential to reshape coverage in Kentucky and will be important to track and assess over time.
Kaiser Family Foundation analysis of the 2014 and 2015 Current Population Survey, Annual Social and Economic Supplements. ↩︎
Kaiser Family Foundation, State Health Facts. “Total Medicaid and CHIP Child Enrollment, Summer 2013 to December 2015” Data source: CMS, Medicaid & CHIP Monthly Applications, Eligibility Determinations, and Enrollment Reports: February 2014 – December 2015 preliminary), as of February 29, 2016, https://modern.kff.org/health-reform/state-indicator/total-monthly-medicaid-and-chip-enrollment/. ↩︎
Melissa Patrick and Al Cross, “Bevin Administration Will Still Have State Health-Insurance Exchange but Use Federal Exchange for Enrollment; Cost Debated” Kentucky Health News, March 6, 2016, http://www.thenewsjournal.net/8094-2/↩︎
In late 2015, amid a series of closures of relatively small co-op health plans, the nation’s largest private insurer, UnitedHealth Group, announced that it too expected losses in its Affordable Care Act (ACA) marketplace business and would reconsider its participation in the Marketplaces in the first half of 2016. Most recently, there have been media reports that UnitedHealthcare (a subsidiary of UnitedHealth Group) would no longer participate in the Arkansas, Georgia, and Michigan exchange markets starting in 2017. Though United is a large, established insurer in the employer-based insurance market, it has been cautious about entering the ACA marketplaces, only participating in a handful of states in 2014 before expanding its reach in 2015 and 2016.
This analysis provides a state by state look at where United is participating in the Marketplaces this year and the extent to which it is offering one of the lower premium plans. It provides context for what the effect would be if United withdraws from some or all remaining markets where the company participates in 2016 (both in states using Healthcare.gov and those running their own exchanges). We examine the effect a further withdrawal would have on insurer participation on the exchanges, with a particular focus on areas with limited competition (counties with just 1 or 2 insurers). We also analyze premium data to identify where United currently offers one of the two lowest-cost silver plans. As the low-cost silver plans are generally the most popular plans on the market, and these plans are the basis for subsidy calculation, a United exit would likely have a more significant effect on people living in these counties.
If United were to exit from all areas where it currently participates and not be replaced by a new entrant, the effect on insurer competition could be significant in some markets – particularly in rural areas and southern states. United current participates in 1855 counties, representing 59% of all counties nationwide (and an estimated 71% of marketplace enrollees). We find that in 29% of counties (536 out of 1855 counties) where United participates, its exit would result in a drop from two insurers to one. In another 29% of counties (532) where United currently participates, there would be two exchange insurers as a result of a withdrawal. If United were to leave the exchange market overall, 1.8 million Marketplace enrollees would be left with two insurers, and another 1.1 million would be left with one insurer as a result of the withdrawal.
United does not generally offer low premium plans in the Marketplaces. It has the lowest or second-lowest silver plan in 35% of counties (647) where it participates in 2016, representing an estimated 16% of marketplace enrollees overall. Even when it did price relatively low, it was often not significantly lower than its nearest competitors. As a result, the effect of a United withdrawal nationally would be modest. The national weighted average benchmark silver plan would have been roughly 1% higher in 2016 had United not participated (less than $4 per month for an unsubsidized 40-year-old).
United’s Participation in ACA Marketplaces
When the new health insurance exchanges launched in 2014, United was noticeably absent from most state marketplaces. Taking a relatively cautious approach early on, the company offered plans in just 4 states in 2014, but quickly expanded to 23 states in 2015 and again expanded to a total of 34 states in 2016.
The parent company UnitedHealth Group owns a number of subsidiaries, including UnitedHealthcare and Harken Health. In cases where two or more issuers in a given area are owned or operated by a single parent company, we group issuers by parent company (using HHS Medical Loss Ratio public use files, and refer to these groupings of affiliated issuers as single “insurers” throughout the analysis. At the time of this report, one United subsidiary, UnitedHealthcare, will leave the market in Arkansas, Georgia, and Michigan in 2017, while Harken Health, another United subsidiary, will continue to participate in Georgia. (We therefore consider United as remaining in the market in Georgia counties where the Harken Health subsidiary currently operates.)
An outstanding question is whether the withdrawals from these three states will be followed by similar exits elsewhere. It is possible that United may continue to participate in some states but exit from certain counties within the state. In Virginia, for example, the insurer’s preliminary rate filing indicates that it may not participate in some counties in 2017 where it had in 2016. The rest of this analysis examines the effects of a full exit by UnitedHealth Group from the remaining states, taking into account the insurer’s planned withdrawal from Arkansas and Michigan and partial withdrawal from Georgia.
Effects of a United Withdrawal on Insurer Participation
If United were to withdraw from additional state Marketplaces, the effects on competition would vary from state-to-state and even county-to-county depending on how significant of a player United had been. Our ability to analyze market share and market concentration at the state or county level, however, is limited by the lack of publicly-available insurer enrollment data in the majority of states (the following section discusses this in more detail).
Another way to quantify the effect of United’s potential departure is to focus on those areas that would be left with just one or two insurers. Our previous analysis of insurer participation on the Marketplaces in states that use Healthcare.gov found that 40% of counties in those states had one or two insurers in 2016, up from 35% the previous year. This analysis includes all 50 states and DC, and finds that 36% of counties nationally had one or two exchange insurers in 2016.
If United were to withdraw from all states, 532 counties would go from having three insurers to two, while another 536 counties would go from having two insurers to just one. The net effect of a United exit would be that 532 more counties in the U.S. would have just one or two insurers on the exchange. Combining these counties with the 1,121 counties that already had one or two insurers would mean that just over half (53%) of U.S. counties would have one or two exchanges insurers.
Figure 1: Percent of U.S. counties with just one or two insurers in 2016, before and after United exit
As discussed in more detail below, counties with limited competition tend to be more rural and sparsely populated, and therefore do not represent the bulk of enrollment. If United exits everywhere (again, with the exception of Harken Health in Georgia), the number of Marketplace enrollees with access to only one or two exchange insurers would increase (from 1.9 million to 3.8 million or from 15% to 30% of all enrollees), and the number of enrollees with only one insurer would also increase (from 303 thousand to 1.4 million or from 2% to 11% of all enrollees). Still, the vast majority of Marketplace enrollees (8.9 million or 70% of enrollees nationally) would continue to have a choice of three or more insurers, even in the absence of United.
Figure 2: Percent of individuals enrolled in counties with just one or two insurers in 2016, before and after United exit
State-by-State Effects of a United Withdrawal on Insurer Participation
The table below shows the distributional effects of a potential exit by United in the states and counties where it currently participates. Consumer choice and plan participation in certain states, such as Alabama, Kansas, Mississippi, North Carolina, Oklahoma, and Tennessee, would be particularly affected by a United departure. All Kansas and Oklahoma exchange enrollees currently have two insurers from which to choose, but would be left with one insurer if United were to exit from the state and not be replaced by a new entrant. In Alabama, 67% of enrollees (living in 60 counties) would go from having a choice of two insurers to a single exchange insurer, and the remaining 33% of enrollees (living in 7 counties) would go from having a choice of three insurers to two.
Table 1: Potential Effects of a United Withdrawl on Insurer ParticipationIn the States and Counties where United Participates in 2016
State
Total # Counties in State
Total # Enrollees in State
Where United Participates
If exit, drop from 2 to 1Insurer (% of state total)
If exit, drop from 3 to 2Insurers(% of state total)
Counties
Enrollees
Counties
Enrollees*
Counties
Enrollees*
Alabama
67
195,047
67
195,047
60 (90%)
130,359 (67%)
7 (10%)
64,688 (33%)
Arizona
15
203,064
15
203,064
8 (53%)
30,761 (15%)
5 (33%)
14,825 (7%)
Arkansas
75
73,643
75
73,643
–
–
–
–
California**
58
1,575,340
34
203,472
–
–
28 (48%)
158,769 (10%)
Colorado
64
150,769
42
125,276
–
–
26 (41%)
7,318 (5%)
Connecticut***
8
116,019
8
116,019
–
–
–
–
Florida
67
1,742,806
67
1,742,806
44 (66%)
268,068 (15%)
13 (19%)
367,156 (21%)
Georgia****
159
587,833
157
569,200
30 (19%)
20,184 (3%)
47 (30%)
47,604 (8%)
Illinois
102
388,176
27
304,434
–
–
–
–
Indiana
92
196,241
92
196,241
–
–
9 (10%)
6,567 (3%)
Iowa
99
55,088
76
48,311
–
–
73 (74%)
47,161 (86%)
Kansas
105
101,553
105
101,553
105 (100%)
101,553 (100%)
–
–
Kentucky***
120
93,666
120
93,666
38 (32%)
18,540 (20%)
39 (33%)
20,488 (22%)
Louisiana
64
214,143
64
214,143
–
–
59 (92%)
130,990 (61%)
Maryland**
24
162,103
24
162,103
–
–
–
–
Massachusetts***
14
213,883
14
213,883
–
–
–
–
Michigan
83
345,804
7
153,559
–
–
1 (1%)
1,905 (1%)
Mississippi
82
108,668
82
108,668
50 (61%)
47,001 (43%)
32 (39%)
61,667 (57%)
Missouri
115
290,197
115
290,197
2 (2%)
3,723 (1%)
96 (83%)
97,380 (34%)
Nebraska
93
87,824
93
87,824
–
–
2 (2%)
840 (1%)
Nevada
17
88,142
3
79,278
–
–
3 (18%)
79,278 (90%)
New Jersey
21
288,571
21
288,571
–
–
–
–
New York**
62
271,964
15
204,536
–
–
–
–
North Carolina
100
613,477
77
563,819
38 (38%)
155,008 (25%)
39 (39%)
408,811 (67%)
Ohio
88
243,714
88
243,714
–
–
–
–
Oklahoma
77
145,328
77
145,328
77 (100%)
145,328 (100%)
–
–
Pennsylvania
67
439,235
23
289,131
–
–
5 (7%)
172,724 (39%)
Rhode Island
5
34,670
5
34,670
–
–
5 (100%)
34,670 (100%)
South Carolina
46
231,845
5
45,649
3 (7%)
20,674 (9%)
2 (4%)
24,975 (11%)
Tennessee
95
268,860
95
268,860
57 (60%)
78,803 (29%)
24 (25%)
69,333 (26%)
Texas
254
1,306,179
30
1,044,424
7 (3%)
26,323 (2%)
3 (1%)
9,780 (1%)
Virginia
134
421,892
37
245,465
–
–
7 (5%)
8,579 (2%)
Washington**
39
200,691
39
200,691
16 (41%)
81,912 (41%)
–
–
Wisconsin
72
239,031
56
193,895
1 (1%)
37 (0%)
7 (10%)
5,856 (2%)
TOTAL (US)
3,142
12,681,637
1,855
9,051,140
536 (17%)
1,128,274 (9%)
532 (17%)
1,841,363 (15%)
Source: Kaiser Family Foundation, Analysis of UnitedHealth Group’s Premiums and Participation in ACA Marketplaces. 2016.Note: *“Enrollees” refers to the sum of all those signed up for a marketplace plan in the affected counties at the end of open enrollment in 2016. It does not refer to the number of enrollees in United plans – this information is not available at the county-level. **Marketplace enrollment-per-county data obtained from State for 2015 increased proportionate to 2016 sign-ups.***Marketplace enrollment-per-county estimated as proportion of State enrollment. See methods for more details.****Georgia results include Harken Health as a participating insurer.
The loss of United from Arkansas’ exchange will result in a drop from 4 insurers to 3 insurers (grouped by parent company) in every county in the state if the insurer is not replaced by a new entrant. Though more insurers participating in an area is generally seen as a sign of stronger competition, some market analysts have suggested that a minimum of 3 insurers is generally sufficient for effective competition to take place.Similarly, in Mississippi, 43% of enrollees (living in 50 counties) would go from having a choice of two insurers to having a single exchange insurer, and the remaining 57% of enrollees (living in 32 counties) would go from having a choice of three insurers to two.
In Georgia, the withdrawal of the subsidiary UnitedHealthcare will leave many counties with limited exchange market competition: 47 counties would go from having three insurers to two, and another 30 counties will be left with 1 exchange insurer. Though nearly half (48%) of Georgia counties will have just one or two insurers in the absence of UnitedHealthcare (up from 19% of counties in 2016), these counties are largely rural and do not represent the bulk of enrollment. In total, 67,788 Georgia Marketplace enrollees (representing 12% of enrollees overall in the state) will have a choice of one or two insurers in 2017 (up from 28,184 in 2016), unless another company enters the market.
Insurer Participation in Urban vs. Rural Areas
The areas where United currently participates are somewhat less rural than the areas where it does not participate. In the 1,855 counties where United offers exchange coverage in 2016, 18% of the population lives in rural areas, while across the 1,287 areas where United did not participate, 25% of the population lives in rural areas. Even so, because rural areas typically have fewer insurers, United’s withdrawal would have a more pronounced effect on insurer participation in rural regions.
In the 532 counties where a United exit would result in a drop from three to two insurers, a disproportionately large share (26%) of the population lives in rural areas. And in the 536 counties where the company’s withdrawal would leave just one insurer, an even larger share (35%) of the population lives in rural areas. For perspective, 20% of the total 2016 enrolled population lives in rural areas. In the 787 counties where a United exit would leave behind at least 3 insurers, just 13% of the population lives in rural areas.
Areas Where United Offers a Low-Cost Silver Plan
In addition to potentially leaving several areas with one or two participating insurers, a United withdrawal would be most disruptive where a large share of enrollees had been enrolled in one of the company’s plans. However, it is unclear how often that is the case due to a lack of publicly-available enrollment data for exchange plans. While insurer-level enrollment data are unavailable in most states, we do know from Health and Human Services (HHS) reports that a large share of enrollees tend to enroll in one of the two lowest cost silver plans.
Table 2 below illustrates the distributional effect United’s participation had on silver premiums in 2016 Marketplaces. Overall, United offered one of the two lowest cost silver plans in 647 counties in 2016; this represents 35% of the counties in which the company participated and 21% of counties across the U.S. This represents 22% of enrollees living in areas where United participates and 16% of enrollees nationally. If the general trend reported by HHS holds true in these counties, and enrollees were more likely to sign up for the low-cost silver plans, it is likely that United held a sizable share of the market in these areas.
Table 2: Distribution of Counties where United participates in 2016,by the dollar-per-month increase in the benchmark premium for a 40-year-old if United had not participated
State
Total # Counties in State
Counties Where United Participates
Counties where United offers one of the two lowest cost silver plans (% of state total)
Counties where the benchmark would be higher if United had not participated(40 year old premium)
$1 – $25
$25 -$100
> $100
Alabama
67
67
66 (99%)
8 (12%)
58 (87%)
Arizona
15
15
10 (67%)
2 (13%)
5 (33%)
3 (20%)
Arkansas
75
75
(0%)
California*
58
34
3 (5%)
3 (5%)
Colorado*
64
42
1 (2%)
1 (2%)
Connecticut*
8
8
(0%)
Florida
67
67
19 (28%)
6 (9%)
12 (18%)
1 (1%)
Georgia**
159
157
34 (21%)
31 (19%)
3 (2%)
Illinois
102
27
18 (18%)
10 (10%)
8 (8%)
Indiana
92
92
(0%)
Iowa
99
76
71 (72%)
5 (5%)
66 (67%)
Kansas
105
105
2 (2%)
2 (2%)
Kentucky*
120
120
(0%)
Louisiana
64
64
50 (78%)
37 (58%)
13 (20%)
Maryland*
24
24
10 (42%)
10 (42%)
Massachusetts*
14
14
(0%)
Michigan
83
7
(0%)
Mississippi
82
82
16 (20%)
11 (13%)
5 (6%)
Missouri
115
115
70 (61%)
55 (48%)
14 (12%)
Nebraska
93
93
65 (70%)
14 (15%)
50 (54%)
Nevada
17
3
2 (12%)
2 (12%)
New Jersey
21
21
(0%)
New York*
62
15
(0%)
North Carolina
100
77
74 (74%)
29 (29%)
36 (36%)
9 (9%)
Ohio
88
88
13 (15%)
12 (14%)
1 (1%)
Oklahoma
77
77
(0%)
Pennsylvania
67
23
14 (21%)
12 (18%)
2 (3%)
Rhode Island*
5
5
0%
South Carolina
46
5
(0%)
Tennessee
95
95
73 (77%)
43 (45%)
30 (32%)
Texas
254
30
8 (3%)
7 (3%)
1 (0%)
Virginia
134
37
11 (8%)
11 (8%)
Washington*
39
39
16 (41%)
16 (41%)
Wisconsin
72
56
1 (1%)
TOTAL (US)
3,142
1,855
647 (21%)
327(18%)
304 (10%)
13 (0%)
Source: Kaiser Family Foundation, Analysis of UnitedHealth Group’s Premiums and Participation in ACA Marketplaces. 2016.*Premiums in state-based exchanges gathered by rating area from state plan finder tools. See methods for more details.**Georgia results include Harken Health as a participating insurer.
In addition to being one of the more popular plan options, the second-lowest cost silver (benchmark) plan is the basis for calculating subsidies on the exchange. Enrollees must pay the difference between the plan they choose and the benchmark plan, making them sensitive to large differences in premiums. In roughly half (330) of the counties where United offered one of the lowest-cost silver plans, the company’s presence in the Marketplace had a relatively minor effect on benchmark premiums. If the company had not participated in these counties, the benchmark plan would have been higher by $25 per month or less for a 40-year-old. In the remaining counties, where the benchmark premium would have been much higher ($25 to $100), it’s likely that United represents a larger portion of the market.
In states like Iowa, Alabama, Arizona, Nebraska, North Carolina, and Tennessee, where United priced significantly lower than some of its competitors, it is likely that more enrollees would have enrolled in a United plan and would therefore be most affected by the company’s withdrawal.
Overall, the national average benchmark premium would be 1% higher had United not participated in 2016, which is less than $4 per month for an unsubsidized 40-year-old on average. (Note that this does not take into account different pricing behavior by insurers due to fewer competitors.)
Figure 3: Percent of counties and individuals where United currently participates in the marketplace, where benchmark premiums will rise if United exits in 2016
Conclusion
On average nationally, based on our analysis of 2016 insurer premiums, United’s participation on the exchanges had a relatively small effect on premiums. The company was less likely to offer one of the lowest-cost silver plans, where the bulk of enrollees tend to sign up. When it did offer a low-cost option, its pricing was often not far from its competitors. As a result, the weighted average benchmark premium would have been roughly 1% higher had United not participated in 2016 (not accounting for the possible effect changes in insurer participation may have had on pricing behavior or the potential for new entrants to the market).
However, the significance of United leaving the exchange market would vary substantially by state and could have a significant effect in some markets. In more than half of the counties where it participates – and 34% of counties overall – a United withdrawal would have an appreciable effect on the number of insurers competing on the exchange. More than one in four counties where United participates would see a drop from two insurers to one if the company were to exit and not be replaced by a new entrant, and a similar number would go from having three insurers to two. In total, 1.8 million enrollees would go from having a choice of three insurers to two, and another 1.1 million would go from having a choice of two insurers to one.
Two of the states where United has announced its withdrawal, Georgia and Arkansas, offer an illustration of this variation. On the one hand, even after United’s withdrawal, every enrollee in Arkansas will continue to have 3 insurers from which to choose, a number that is sometimes seen as an important threshold for effective market competition to take place. United had not offered one of the two lowest silver plans in any county in Arkansas, which may also be an indication that the company did not have sizable market share in the state.
In Georgia, on the other hand, nearly fifty thousand Marketplace enrollees (8%) will go from having a choice of three insurers to two as a result of one United subsidiary withdrawing. Another twenty thousand enrollees (3%) will be left with just one insurer if no new entrants replace United. Additionally, United offered one of the lowest cost silver plans in about 1 in 5 Georgia counties, suggesting that it may have held a relatively sizable share of the market in these areas.
In a similar situation as Georgia, certain other states – such as Alabama, North Carolina, and Tennessee – would be particularly affected by a potential United withdrawal as these states would see appreciable drops in insurer participation and sizable changes in benchmark premiums in a number of counties if United were not participating.
The longer-term effects of a United withdrawal are more difficult to quantify. Other participating plans may independently plan to raise or lower premiums and enter or exit markets. In areas with limited insurer participation, the remaining plans after a United exit may have more market power relative to providers, but in the absence of insurer competition, those savings may not be passed along to consumers. The ACA’s rate review and medical loss ratio provisions may counter some of this effect by requiring insurers to undergo state or federal review of large rate increases and requiring that plans issue rebates if they set premiums too high relative to the cost of providing care.
The ACA marketplaces are still relatively new and insurers have only recently had sufficient information on who is enrolling and how much health care they are using in order to set accurate premiums. Premium changes and the exit of insurers that are not able to offer competitive and profitable plans is to be expected.
Methods
This analysis utilizes publicly available plan participation and premium data for states using the Healthcare.gov interface (including state-based exchanges that utilize Healthcare.gov: NV, NM, HI, and OR). We obtained plan participation and premium data for state-based exchanges that do not utilize Healthcare.gov by searching the most populous counties and/or zip codes by rating area on each state’s plan finder tools.
One limitation of this approach for state-based exchanges is that, while plans must set uniform premiums across a rating area, they may opt to selectively participate in certain counties within a rating area. Therefore, it is possible that some insurers do not participate in some counties within a given rating area in state-based exchanges that do not use Healthcare.gov, so the total insurer count may vary within those counties.
Enrollment data at the county level in states that use Healthcare.gov are published by the U.S. Department of Health and Human Services Office of the Assistant Secretary for Planning and Evaluation (ASPE). These data represent plan sign-ups, not effectuated enrollment. Some state-based exchanges make similar data available. Where this data were available for state-based exchanges but only from 2015, county-level enrollment was increased based on the change in state enrollment from 2015 to 2016. Where county-level enrollment data were not available in state-based exchanges, we proportionately assigned state-level sign-ups by county population. The percent of county population residing in rural areas was obtained from the Missouri Census Data Center.
We grouped insurers by parent company or group affiliation, which we obtained from HHS Medical Loss Ratio public use files. In some cases, parent company information was not available from the HHS file, and corrections were made. Harken Health is a subsidiary of UnitedHealth Group; in Georgia this plan is treated as remaining in the market, while in Chicago, Illinois it is treated as potentially exiting the market.
Changes in the benchmark premium are weighted by county enrollment using the method described above. As we are unable to confirm the percentage of the premium that is due to essential health benefits in state-based exchanges, we did not apply this percentage in states that use the Healthcare.gov interface when calculating changes in the benchmark premium.
A withdrawal by UnitedHealth Group from the Affordable Care Act (ACA) marketplaces in 2017 could have a significant impact on insurer competition and premiums in some markets, though it would have a minimal effect on the average benchmark premium nationwide, according to a new analysis from the Kaiser Family Foundation.
Late last year, UnitedHealth announced that it experienced significant financial losses in ACA compliant plans and that it would decide about future participation in ACA marketplaces during the first half of 2016. So far, it has confirmed that it is withdrawing from the marketplace in Arkansas, Michigan, and partially withdrawing in Georgia.
The analysis is based on insurer participation and premiums in marketplaces in 2016. It assumes that no new insurers will enter markets where UnitedHealth is currently participating and does not assess United’s statements about its losses or the reasons for them.
The impacts of a UnitedHealth withdrawal would vary considerably by state and market area, with a more pronounced effect in rural areas.
UnitedHealth participated in ACA marketplaces in 34 states in 2016; in 21 percent of U.S. counties it offered one of the two lowest-cost silver plans, the most popular options.
Without UnitedHealth’s participation in 2016, monthly benchmark premiums for the second lowest cost silver plan for a 40 year-old would have been $25 to $100 higher in 304 of 3,142 counties in the U.S. and more than $100 higher in 13 counties. A UnitedHealth exit would likely affect premiums most in Alabama, Arizona, Iowa, Nebraska and North Carolina, the analysis finds.
Since UnitedHealth often is not one of the lower cost plans, the effect nationally on premiums of an exit by the insurer would be modest. The weighted national average monthly premium for the second lowest-cost silver plans in 2016 would have been 1% higher (less than $4 per month for a 40-year-old), according to the analysis.
A withdrawal by UnitedHealth nationwide would also leave some markets with fewer choices and less competition. The number of counties with one or two insurers offering health plans in the marketplaces would increase from 1,121 counties to 1,653 counties. A UnitedHealth withdrawal nationwide would result in an additional 1.8 million enrollees with a choice of two insurers, and an additional 1.1 million could be served by a marketplace with only one insurer.
However, even if UnitedHealth leaves all markets, the majority of counties (1,490) and ACA marketplace enrollees (8.9 million) could continue to have a choice of three or more insurers, according to the analysis. A minimum of three insurers is generally considered to be sufficient for effective competition.
The new report provides a state by state analysis of UnitedHealth’s current participation in the ACA marketplaces to help gauge the effect of the insurer’s participation decisions for 2017.
Even before the association between Zika infection and births defects was confirmed, the Pan American Health Organization (PAHO), the CDC and other health authorities had issued guidance to pregnant women and those seeking to become pregnant to consider delaying travel to Zika-affected areas, and for those living in countries with widespread Zika transmission to avoid exposure to mosquito bites. In some countries public health authorities have gone even further, recommending that women postpone becoming pregnant for a period of time; most notably, the Minister of Health of El Salvador, a country which is experiencing a rise in suspected Zika cases, has recommended delaying pregnancy until 2018.
Such calls to postpone pregnancy raise serious issues, because many women across the region have limited access to contraceptives and other reproductive health services, experience high rates of sexual violence, and face other reproductive health decision-making barriers that can result in unintended pregnancies. In fact, some of the Zika-affected countries have among the strictest abortion laws in the world, potentially presenting women who have an unintended pregnancy with a dangerous catch-22. The United States government may have an important role to play in addressing health access and rights for women in Zika-affected countries, both through its direct health and development assets as well as its diplomatic engagement and public health expertise. To understand more about where these issues are likely to be more acute, we examine available country-level data on access to contraception, abortion policies, and the US government’s foreign assistance and global health presence in Zika-affected countries.
Access to Reproductive Health Services in Zika-Affected Countries
One way to measure access to reproductive health services is to look at the use of contraceptives, as indicated by the contraceptive prevalence rate (CPR). As shown in Table 1, of the 21 countries in Latin America and the Caribbean with confirmed Zika transmission as of April 14, the CPR (for any method of birth control) ranges from just 37.8% in Haiti to 79.5% in Nicaragua; for modern methods, which are more effective, the range is 33.6% in Haiti to 75.7% in Costa Rica. Most countries in the region have a CPR for modern methods below 70%, including 5 countries with a CPR at 50% or below. It is important to note that these CPR estimates are national averages that likely mask significant inequities within counties, particularly across geographic and income lines. Typically, poorer women and women in rural areas have much less access to contraceptives, and are likely to be most at risk for Zika infection as well. In addition, such averages do not take into account the contraceptive method mix available to women, which in some cases may be limited.
Another way to gauge access is to examine contraceptive security, reflected by whether stock-outs (lack of availability) of contraceptive commodities have occurred in a country. Data on such measures (not shown in table) are available for seven of the 21 countries with widespread Zika transmission in the region – the Dominican Republic, El Salvador, Guatemala, Haiti, Honduras, Nicaragua and Paraguay. Of these, all but Nicaragua and Paraguay report that in 2015, contraceptive commodity stockouts were a problem at either the service delivery point level or central level, indicating ongoing issues with access.
For those women who face an unintended pregnancy and pregnant women concerned they have been exposed to Zika virus, their options may be quite limited. There currently is no vaccine or treatment for Zika virus and microcephaly, a lifelong condition, has no cure or treatment. Looking at the abortion laws of these countries, nine have among either the most restrictive or highly restrictive abortion laws in the world. Three (the Dominican Republic, El Salvador, and Nicaragua) provide no legal access to abortion under any circumstances. Six (Guatemala, Haiti, Honduras, Paraguay, Suriname, and Venezuela) provide access to abortion only to save a woman’s life. At present, microcephaly isn’t detectable until quite late in pregnancy (if at all), when many countries, even those with less restrictive abortion laws, would not permit an abortion. In eight of the nine countries with severe restrictions, the CPR for modern methods is below 70%; three of the countries have a CPR of 50% or below. Five of the nine reported stockouts of contraceptives, meaning that contraceptive access may be more problematic for women in these countries.
U.S. Bilateral Presence in the Region
The U.S. government has limited bilateral assets in the region, a reflection of the longer term “graduation” of many Latin American countries from U.S. development assistance over the last several decades as they have grown economically and seen improved health outcomes. Indeed, with the exception of Haiti all of the Zika-affected countries in the region are designated either as high income (4 countries) or middle income (16 countries). As shown in Table 2, of the 21 countries with ongoing Zika transmission, six receive some bilateral funding for health from the U.S. Other than Haiti, funding was less than $25 million in 2015. Two receive funding for family planning/reproductive health (FP/RH) and maternal and child health (MCH) programs specifically – Guatemala and Haiti – though this funding was under $20 million in each country in 2015. Haiti, the poorest country in the region, has the biggest U.S. global health presence, with funding in four program areas (HIV, FP/RH, MCH, and nutrition) totaling over $137 million, primarily for HIV. Twelve other countries receive U.S. development assistance in non-health sectors, while three receive no U.S. development assistance.
Implications for the U.S.
Taken together these data suggest that women in Latin America and the Caribbean, particularly those who are poorer and live in rural areas and especially those countries with limited contraceptive access and evidence of some contraceptive commodity stockouts may face significant barriers in delaying pregnancy as recommended by some public health authorities, and if they experience an unintended pregnancy or have concerns about being infected with Zika during their pregnancy, have limited options. The U.S. government may have an important role to play in addressing these challenges. While its global health assets in these countries are limited, where such assets are present, the USG could help to augment access to family planning commodities and other services. Where direct assets are not present, the U.S. could consider mobilizing additional resources where access may be a problem. Ultimately, though, given its limited health and development presence in Zika-affected countries, the U.S. government may be best positioned to use its public health expertise and diplomatic leverage, including through supporting the WHO and other UN mechanisms, to ensure that the rights of women and girls are protected as countries seek to respond to the spread of Zika virus. Indeed, a key principle of U.S. family planning assistance is “voluntarism and informed choice”, to ensure that people can choose voluntarily whether to use family planning, have information on their child-bearing choices, and are offered a broad range of methods and services, a principle critical to ensuring that women are able to make their own reproductive health decisions. The U.S. also has public health and research expertise to contribute to the global effort to identify diagnostics, treatments, and a vaccine for Zika and to continue to investigate the the virus and its health effects.
The White House recently brought federal health and national security officials together to discuss Zika and some members of Congress have begun calling on the Administration to do more. Now that the World Health Organization has declared Zika due to its potential link to microcephaly a “Public Health Emergency of International Concern”, there will be intensified attention to these issues. As the U.S. and global responses unfold, we will learn more about this threat, and understand better the kinds of interventions that will be most effective in addressing the Zika threat. Based on our best understanding right now, ensuring women’s access to contraception and broader range of reproductive health services is a key part of the ongoing response.
Table 1. Contraceptive Prevalence Rates (CPR) and Abortion Policies in Latin America and Caribbean Countries with Active Zika Transmission
Country
CPR – Any Method
CPR – Modern Methods
Abortion Policy
Barbados
60.3
56.7
Some restrictions
Bolivia
62.5
40.4
Some restrictions
Brazil
79.0
75.2
Restrictive
Colombia
78.2
71.7
Some restrictions
Costa Rica
78.9
75.7
Restrictive
Cuba
73.6
72.3
Least Restrictive
Dominican Republic
71.8
68.6
Most restrictive
Ecuador
72.6
61.2
Restrictive
El Salvador
70.7
64.3
Most restrictive
Guatemala
57.2
47.8
Highly restrictive
Guyana
44.8
43.5
Least restrictive
Haiti
37.8
33.6
Highly restrictive
Honduras
72.7
63.7
Highly restrictive
Jamaica
71.8
67.9
Restrictive
Mexico
72.6
67.4
Least restrictive
Nicaragua
79.5
75.4
Most restrictive
Panama
61.3
57.7
Some restrictions
Paraguay
77.4
68.0
Highly restrictive
Suriname
51.8
50.8
Highly restrictive
Trinidad and Tobago
50.0
43.8
Restrictive
Venezuela
70.0
63.8
Highly restrictive
NOTES:“-” = No data availableAbortion Policy = circumstances under which a woman can legally get an abortion in that country “Most restrictive” = no abortions under any circumstances “Highly restrictive” = only to save a woman’s life “Restrictive” = only to save a woman’s life, due to rape or incest, and/or to preserve a woman’s mental or physical health “Some restrictions” = only for one of the following reasons: economic, social, fetal impairment, rape, incest, woman’s mental or physical health, or to save a woman’s life “Least restrictive” = abortion legal (typically up to a certain gestational age such as 20 weeks)
Table 2. Presence of U.S. Government Global Health and Other Foreign Assistance in Latin American and Caribbean Countries with Active Zika Transmission, FY 2015
Country
US Global Health Funding by Program Area
Other US Foreign Assistance Program
Family Planning/ Reproductive Health
HIV/AIDS
Maternal and Child Health
Nutrition
Barbados
$22,281,000
Bolivia
Brazil
$300,000
Colombia
X
Costa Rica
X
Cuba
X
Dominican Republic
$15,113,000
Ecuador
El Salvador
X
Guatemala
$6,500,000
$3,000,000
$8,700,000
Guyana
$6,636,000
Haiti
$9,000,000
$104,013,000
$14,000,000
$10,200,000
Honduras
X
Jamaica
X
Mexico
X
Nicaragua
X
Panama
X
Paraguay
X
Suriname
X
Trinidad and Tobago
Venezuela
X
SOURCE: Kaiser Family Foundation analysis of data from the U.S. Foreign Assistance Dashboard [website] available at www.foreignassistance.gov