KFF designs, conducts and analyzes original public opinion and survey research on Americans’ attitudes, knowledge, and experiences with the health care system to help amplify the public’s voice in major national debates.
Medicare Advantage plans, which consist primarily of HMOs and PPOs, now cover almost 18 million people – nearly one-third of all Medicare beneficiaries. Medicare Advantage plans have been in the news lately because the proposed merger between Aetna and Humana, which together account for one-quarter of all Medicare Advantage enrollees, could further consolidate the Medicare Advantage market.
A Kaiser Family Foundation analysis, featuring the latest publicly available data on the 2017 Medicare marketplace, examines new information on plan availability, premiums, out-of-pocket limits and other features of Medicare Advantage plans. Overall, the analysis finds that the Medicare Advantage market has been relatively stable in recent years, with few changes in premiums, plan offerings, and insurer participation. Key findings include:
The average Medicare beneficiary will be able to choose from 19 plans in 2017, a number which has been relatively stable since 2012.
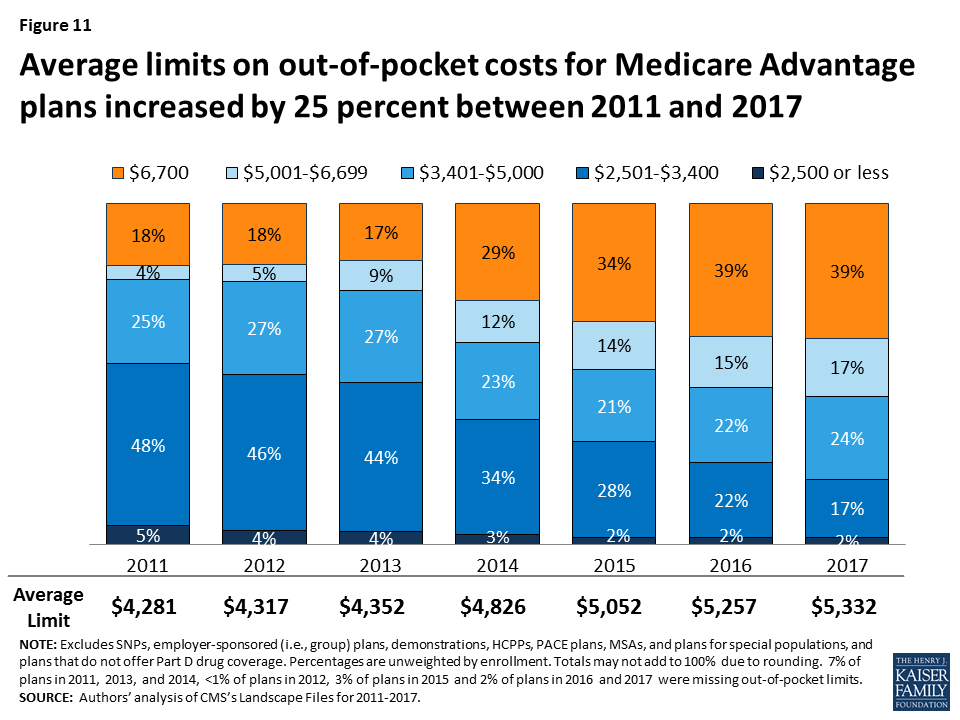
While premiums have been relatively flat, average limits on out-of-pocket costs for Part A and B benefits have increased by 25 percent since 2011, from $4,281 in 2011 to $5,332 in 2017.
About one-quarter of beneficiaries will have a choice of plans offered by three or fewer firms in 2017.
With nearly one-third of all Medicare beneficiaries enrolled in Medicare Advantage plans in 2016,1 there is ongoing interest in the evolution of this marketplace and how well it is working for people on Medicare. For the past several years, the Medicare Advantage market has appeared to be relatively stable, based on the metrics available, with few changes in average premiums, plan offerings, and insurer participation. Less information is available about cost-sharing for Medicare-covered services, extra benefits, or Medicare Advantage provider networks, including how they may have changed over time.2
This spotlight analyzes publicly available data to review the Medicare Advantage plans offered in 2017, with information on including plan availability, premiums, out-of-pocket limits and other plan features:
The average Medicare beneficiary will be able to choose from 19 plans in 2017, a number which has been relatively stable since 2012.
The average beneficiary will be able to choose from plans offered by six firms; one-quarter of beneficiaries nationwide will have a choice of plans offered by three or fewer firms in 2017.
If enrollees in Medicare Advantage prescription drug plans (MA-PDs) stay in the same plan between 2016 and 2017, their premiums will increase by 4 percent, on average.
While premiums have been relatively flat, average limits on out-of-pocket costs for Part A and B benefits have increased by 25 percent, since 2011 from $4,281 in 2011 to $5,332 in 2017.
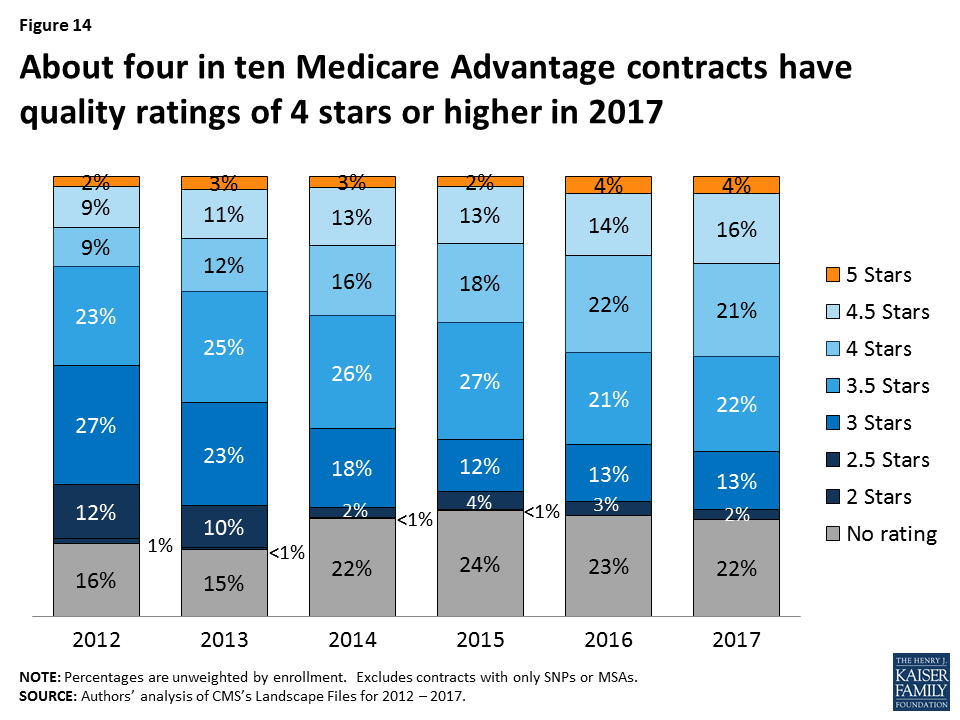
About four in ten (41%) plans are rated as 4 stars or higher in 2017. Since 2012, Medicare has paid bonus payments to Medicare Advantage plans with four or more stars.
The design of Medicare Advantage plans is heavily influenced by the level of federal payments to plans and the requirements of plans. As of 2017, the payment reductions adopted in the Affordable Care Act (ACA) will be fully phased-in. The effects of these reductions have been partly blunted by quality-based bonus payments to plans and the way payment reductions were applied.3 In 2016, federal payments to plans are estimated to be 2 percent higher than traditional Medicare spending, on average, including the bonus payments.4
The Medicare Advantage market is highly consolidated nationwide and could become more so depending on the outcomes of the proposed Aetna-Humana and Anthem-Cigna mergers. Such market concentration can influence the competiveness and the stability of the market. More longer-term, some lawmakers are proposing to transform Medicare into a premium support system, building off of Medicare Advantage. A premium support system would likely look very different from current Medicare Advantage plans since it would change federal payments to plans and plans’ financial incentives, with uncertain effects for plans and beneficiaries.
Issue Brief
Plan Offerings in 2017
Number of Plans Offered
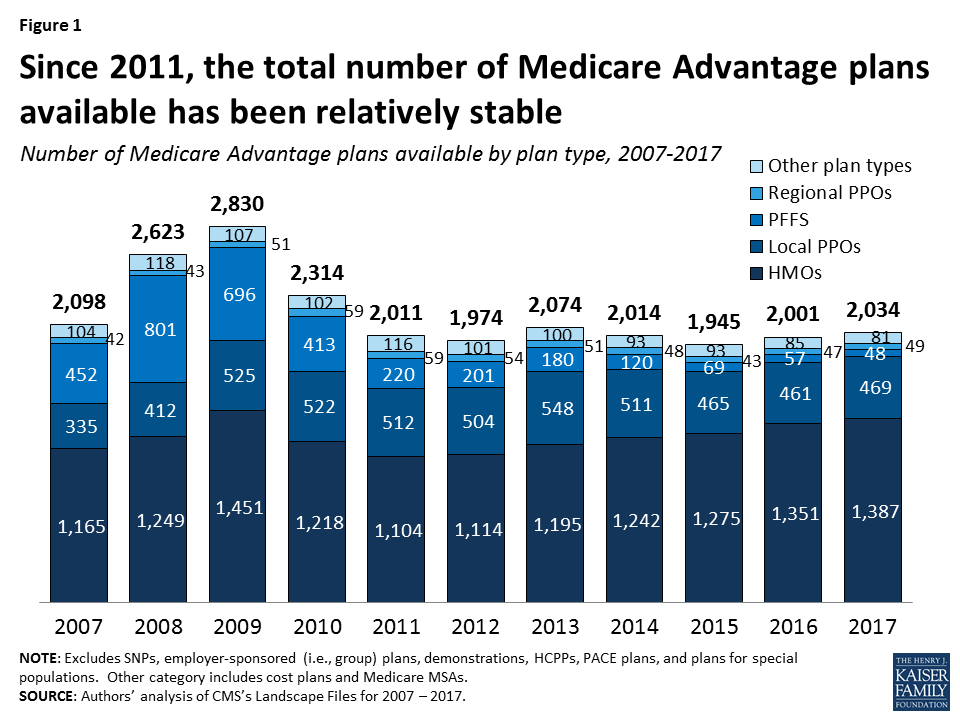
In total, 2,034 Medicare Advantage plans will be available nationwide for individual enrollment in 2017, a number that has been relatively stable since 2011 (Figure 1). Among the plans that were available in 2016, 238 will be exiting the Medicare Advantage market, and 271 plans will be offered for the first time (Table A1). While virtually every state will see some change in the number of plans, most of the plans exiting the market in 2017 attracted relatively few enrollees in 2016. Just under 3 percent of all Medicare Advantage enrollees in 2016, 414,710 beneficiaries, will need to choose a new plan in 2017 because their plan exited.
Figure 1: Since 2011, the total number of Medicare Advantage plans available has been relatively stable
HMOs continue to account for the large majority of plans available, and will account for two-thirds of all plans offered in 2017 (Table A1). Since 2010, the number of HMOs has increased each year, with 36 more HMOs in 2017, while the availability of other plan types has either remained similar or decline.
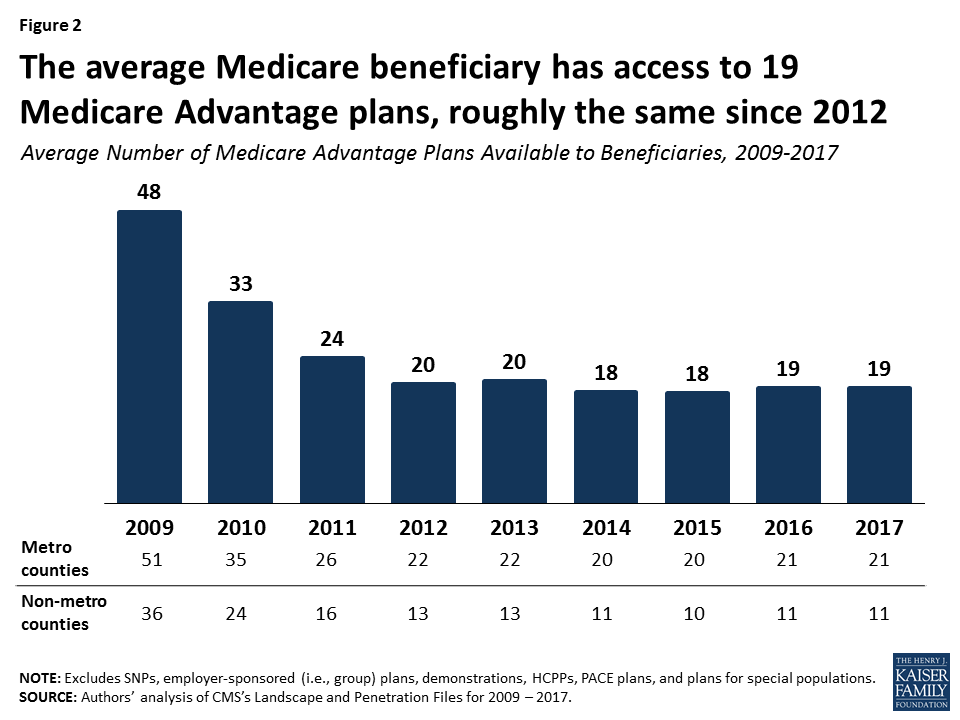
Since 2012, the number of plans available to Medicare beneficiaries has been relatively stable. The average beneficiary will be able to choose from among 19 plans, on average, in 2017, the same number as in 2016 (Figure 2). Beneficiaries in metropolitan areas will be able to choose from 21 plans, on average, and beneficiaries in non-metropolitan areas will be able to choose from 11 plans, on average, the same as in 2016. Similarly, the average number of plans available to beneficiaries in the lowest cost counties (i.e., lowest quartile of counties) and in other counties will remain the same in 2017 as it was in 2016, ranging from 15 plans available in the lowest cost counties to 23 plans available in the highest cost counties; Table A2).
Figure 2: The average Medicare beneficiary has access to 19 Medicare Advantage plans, roughly the same since 2012
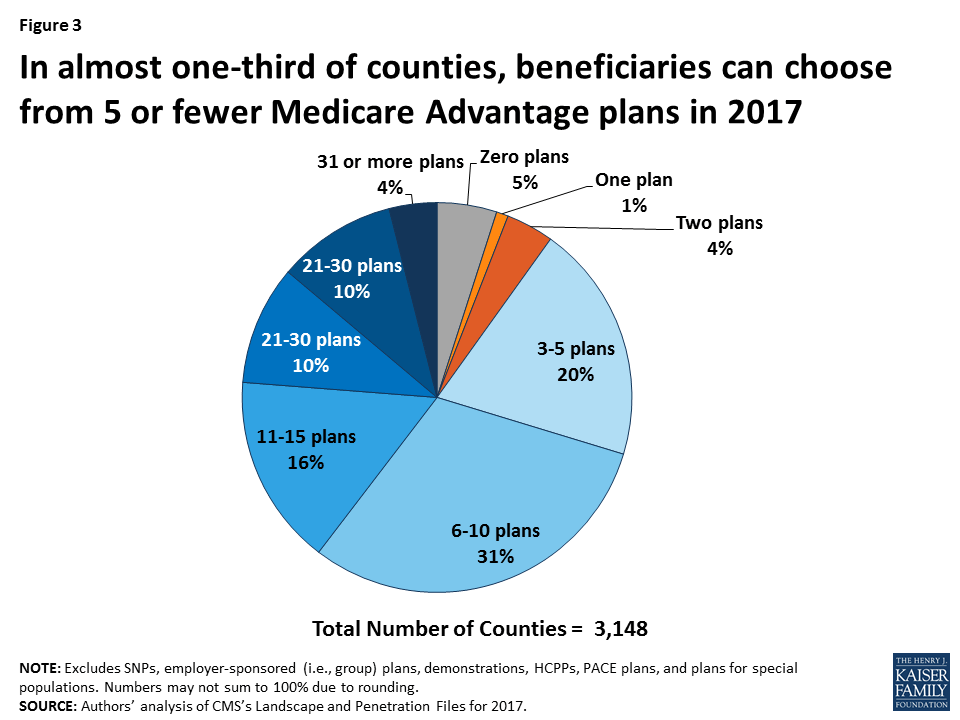
Despite the high number of plans available per beneficiary, relatively fewer plans are available in many counties. In almost one-third (30%) of counties, most of which are rural, beneficiaries can choose from five or fewer Medicare Advantage plans, including 10 percent of counties with less than 3 plans in 2017 (Figure 3). At the other end of the spectrum, in about one-quarter of counties, beneficiaries can choose from 16 or more plans, including 4 percent of counties in which beneficiaries can choose from more than 30 plans in 2017. About 14 percent of beneficiaries are in counties that have two plans or less and 54 percent of beneficiaries are in counties that have 5 or fewer plans.
Figure 3: In almost one-third of counties, beneficiaries can choose from 5 or fewer Medicare Advantage plans in 2017
Number of Firms Offering Medicare Advantage Plans
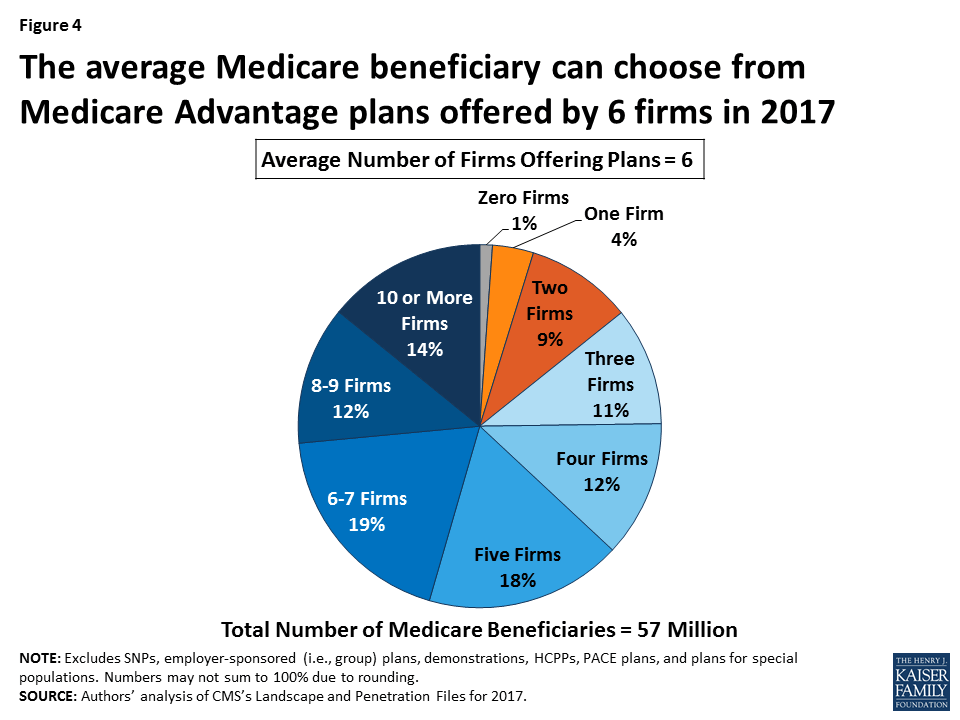
The average Medicare beneficiary will be able to choose from many plans, but in some areas, these plans will be offered by a handful of firms. The average Medicare beneficiary will be able to choose from plans offered by 6 firms, on average, in 2017, with sizeable variation across counties (Figure 4). One-quarter of beneficiaries will be able to choose from plans offered by three or fewer firms, while another quarter of beneficiaries will be able to choose from plans offered by 8 or more firms. The number of firms offering Medicare Advantage plans will be highest in the New York City area (Bronx, Kings, Queens, and New York Counties), Los Angeles County, and Orange County, California, where 15 or more firms will be offering Medicare Advantage plans. In contrast, in 439 counties in 26 states, most of which are rural counties with few Medicare beneficiaries, only one firm will offer Medicare Advantage plans in 2017, and in another 154 counties, zero firms will offer Medicare Advantage plans.
Figure 4: The average Medicare beneficiary can choose from Medicare Advantage plans offered by 6 firms in 2017
Access to Medicare Advantage Plans
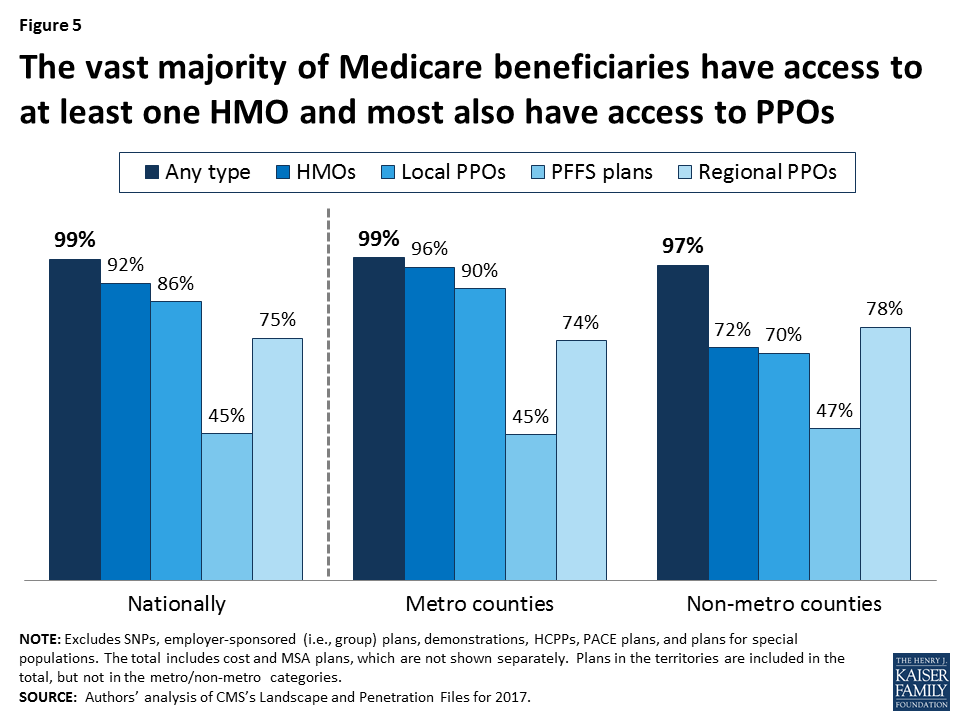
As in recent years, virtually all Medicare beneficiaries (99%) will continue to have access to a Medicare Advantage plan as an alternative to traditional Medicare (Figure 5). Virtually all beneficiaries in metropolitan areas (99%) and the vast majority of beneficiaries in non-metropolitan areas (97%) will continue to have access to at least one Medicare Advantage plan, similar percentages as in 2016. Consistent with prior years, in non-metropolitan counties relative to metropolitan counties, a smaller share of beneficiaries will have access to HMOs or local PPOs, and a slightly larger share of beneficiaries will have access to private fee-for-service (PFFS) plans and regional PPOs.
Figure 5: The vast majority of Medicare beneficiaries have access to at least one HMO and most also have access to PPOs
Change in Plan Availability By Firm
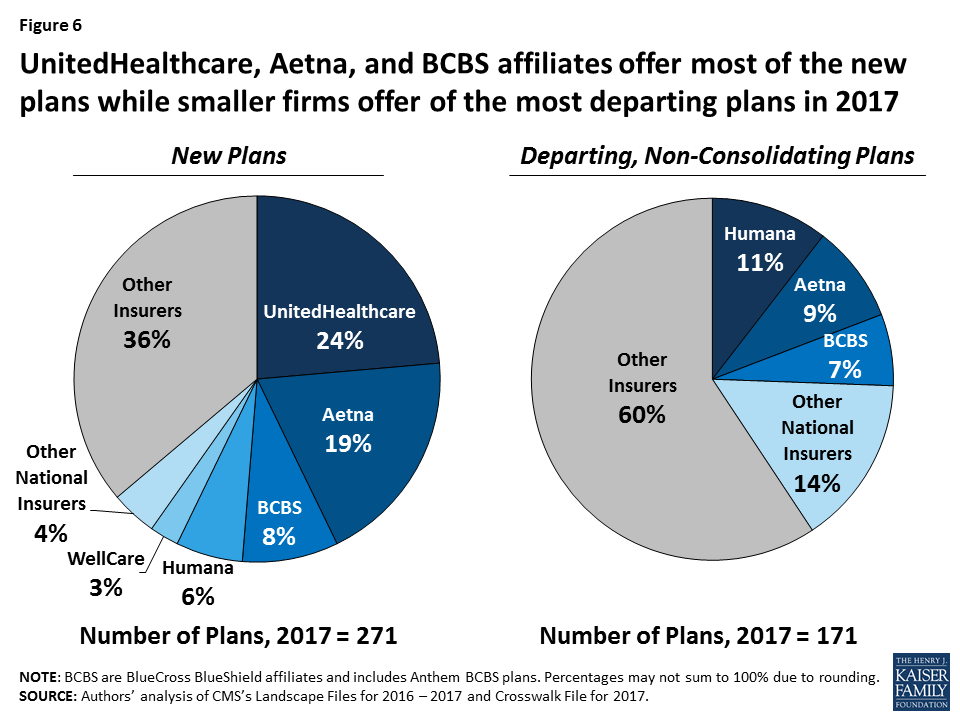
Half of the 271 new Medicare Advantage plans in 2017 are offered by UnitedHealthcare, Aetna, and firms affiliated with BlueCross BlueShield (BCBS; Figure 6). UnitedHealthcare alone accounts for about one-quarter of all new Medicare Advantage plans. Aetna and Humana, whose proposed merger is pending, together account for another one-quarter of new plans.
Figure 6: UnitedHealthcare, Aetna, and BCBS affiliates offer most of the new plans while smaller firms offer of the most departing plans in 2017
Fewer plans will be exiting than entering the Medicare Advantage market in 2017, and some firms will also be offering Medicare Advantage plans for the first time. Most of these appear to be local companies, some like SharpAdvantage in San Diego. These new firms will be in nine states: California, Illinois, Iowa, Georgia, Florida, Mississippi, North Dakota, Pennsylvania, and South Carolina.
Most (60%) of the 171 departing plans were offered by smaller firms that tend to have a more regional focus. Humana, Aetna, and BCBS affiliates comprise about one-quarter (26%) of the departing plans, with other national insurers, such as UnitedHealthcare, Cigna, Kaiser Permanente, Anthem and Wellcare, comprising a total of 15 percent, each with less than 3 percent of the departing plans.
Plan Premiums
Medicare beneficiaries enrolled in Medicare Advantage plans pay the Part B premium like other beneficiaries (less any rebate provided by the Medicare Advantage plan), and may also pay an additional monthly premium charged by the Medicare Advantage plan for benefits and prescription drug coverage. This analysis of premiums includes only Medicare Advantage plans that offer prescription drug coverage (MA-PDs). The minority of Medicare Advantage plans (12%) that do not cover prescription drugs are not included in the analysis, in order to better compare premiums across plan types and years. The analysis also weights plans by their 2016 enrollment to reflect the impact of premium changes on current enrollees. (Unweighted premiums, which reflect beneficiaries’ plan options, are in Appendix Table A3)
Premiums (Weighted by Enrollment), Assuming Enrollees Remain in the Same Plan
To examine how premiums will change for Medicare Advantage enrollees, assuming they remain in the same plan between 2016 and 2017, this spotlight examines the premiums among MA-PDs offered in both years and weights the premiums by plan enrollment in 2016. This analysis includes plans with no premiums as well as plans with monthly premiums. Enrollees may be able to prevent or reduce increases in premiums by switching to another plan. After the open enrollment period, we will analyze the premiums for plans selected by all Medicare Advantage enrollees in 2017.5 In recent years, average premiums, weighted by actual enrollment, have tended to be lower than estimates of weighted premiums based on prior year enrollment.
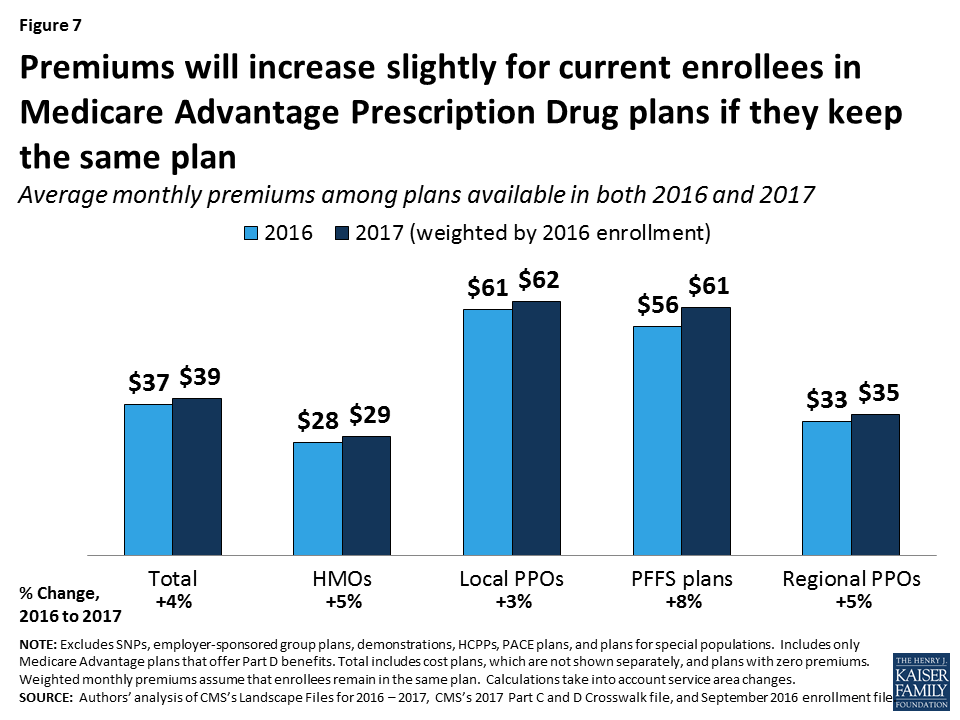
The difference reflects the net impact of beneficiaries making enrollment changes between one year and the next, and plan choices among new Medicare Advantage enrollees. Based on plan enrollment in the Fall of 2016, the average Medicare Advantage enrollee in a plan that will continue to be offered in 2017 will pay about $39 per month, an increase of $2 per month (or 4%) compared to 2016, if they stay in the same plan (Figure 7). In percentage terms, enrollees in PFFS plans will experience a larger increase in premiums (8% on average) than enrollees in other types of Medicare Advantage plans, assuming no change in enrollment. Monthly premiums, weighted for 2016 enrollment will be lower for enrollees in HMOs ($29 per month) than for enrollees in other types of Medicare Advantage plans.
Figure 7: Premiums will increase slightly for current enrollees in Medicare Advantage Prescription Drug plans if they keep the same plan
In general, enrollees in MA-PDs that will continue to be offered in 2017 had somewhat lower premiums (averaging $37 per month), on average, than enrollees in plans that will be exiting the market (averaging $42 per month; Table A1). However, the difference varies across plan types and these changes are difficult to interpret because plan premiums are a function of many plan-specific factors, as well region-specific factors.
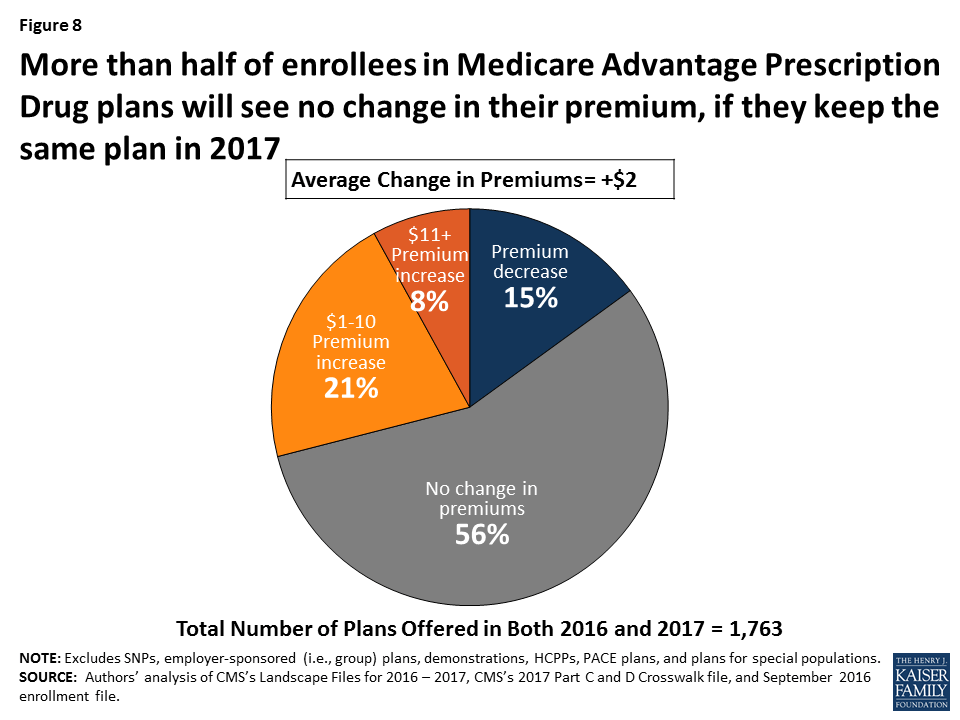
Change in Premiums. While over half (56%) of Medicare Advantage enrollees will see no change in their premiums, some enrollees will experience increases or decreases in their monthly premium (Figure 8). About 8 percent of enrollees will see the largest increases, with monthly premiums increasing by $11 or more a month, if they do not change their plan. In contrast, one in seven MA-PD enrollees (15%) will see premiums decline in 2017, if they stay in the same plan.
Figure 8: More than half of enrollees in Medicare Advantage Prescription Drug plans will see no change in their premium, if they keep the same plan in 2017
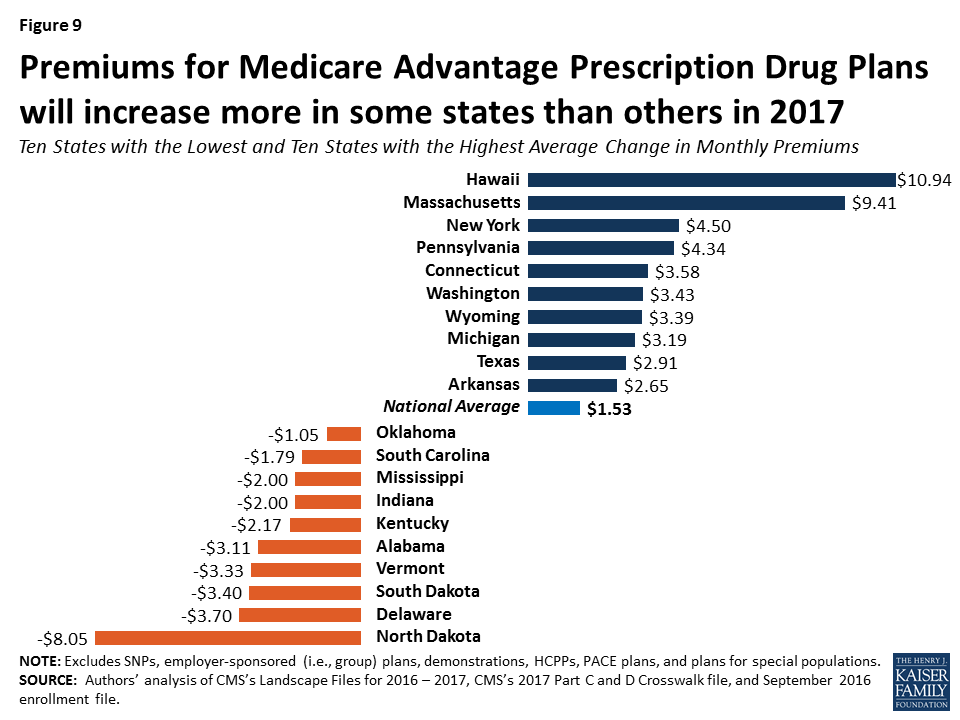
The change in monthly premiums also will vary somewhat across the country (Figure 9). In most states, average premiums will increase or decrease by less than $5 per month. However, in North Dakota, average premiums will decrease by about $8 per month, while in Massachusetts and Hawaii, average premiums will increase by more than $9 per month. Other work has shown that only about 10 percent of Medicare Advantage enrollees switch plans each year, and the share of people switching plans does not significantly increase until premiums increase by $20 or more per month, at which point 20 percent of enrollees switch plans, on average.6
Figure 9: Premiums for Medicare Advantage Prescription Drug Plans will increase more in some states than others in 2017
Access to Plans with No Premium
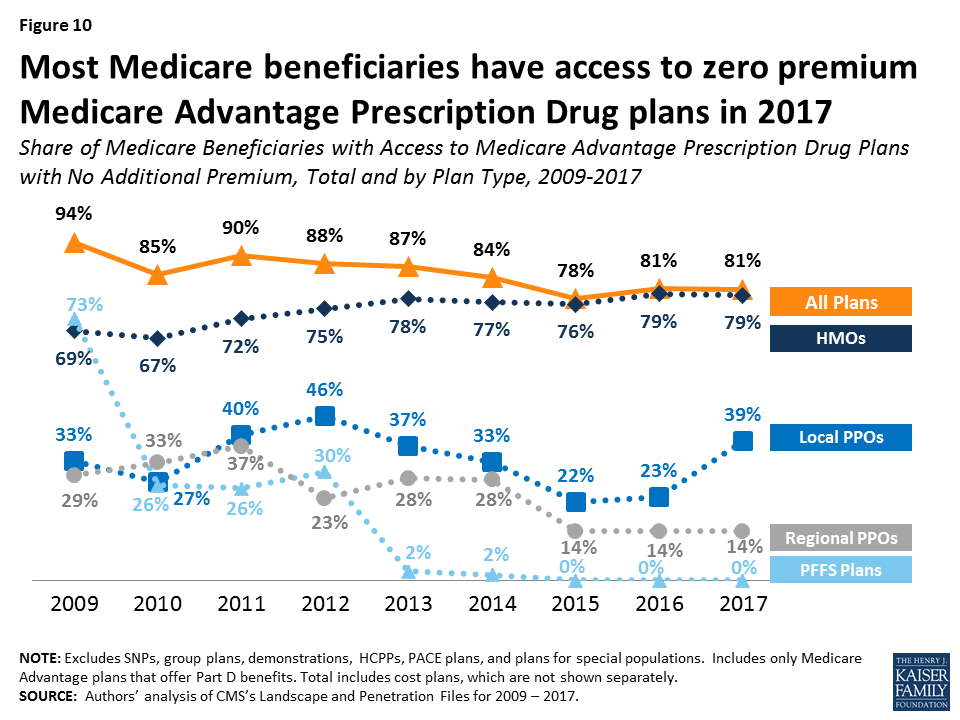
Medicare Advantage plans with no additional premium (other than the Medicare Part B premium) – so called “zero premium plans” – have been a feature of the Medicare Advantage landscape for many years. About four-fifths (81%) of all beneficiaries will have access to a zero-premium MA-PD in 2017, the same as in 2016 (Figure 10). The continued availability of zero-premium plans mainly reflects offerings among HMOs since zero-premium plans are less common among other plan types. More local PPOs will have zero premiums in 2017 but the share of local PPOs using this feature has varied over time.
Figure 10: Most Medicare beneficiaries have access to zero premium Medicare Advantage Prescription Drug plans in 2017
Limits On Out-of-Pocket Spending
The traditional Medicare program does not include a limit on out-of-pocket spending for services covered under Parts A and B. In contrast, Medicare Advantage plans are required to limit enrollees’ out-of-pocket expenses for services covered under Parts A and B to no more than $6,700, with higher limits allowed for services received from out-of-network providers. Even before the 2011 implementation of this requirement, most Medicare Advantage plans (79% in 2010) voluntarily included a limit on enrollees’ out-of-pocket spending.7 CMS encourages plans to limit enrollees’ out-of-pocket expenses to no more than $3,400 per year, by allowing these plans to charge higher cost-sharing for some services. These out-of-pocket limits do not include expenses for Part D prescription drugs (which have a separate catastrophic threshold), nor do they include expenses for extra benefits or for services not covered by the plan.
Continuing the trend since 2011, out-of-pocket limits for MA-PDs will be higher in 2017 than in prior years, on average. In 2017, the average plan’s limit will be $5,332, up from $4,281 in 2011 (Figure 11).
Figure 11: Average limits on out-of-pocket costs for Medicare Advantage plans increased by 25 percent between 2011 and 2017
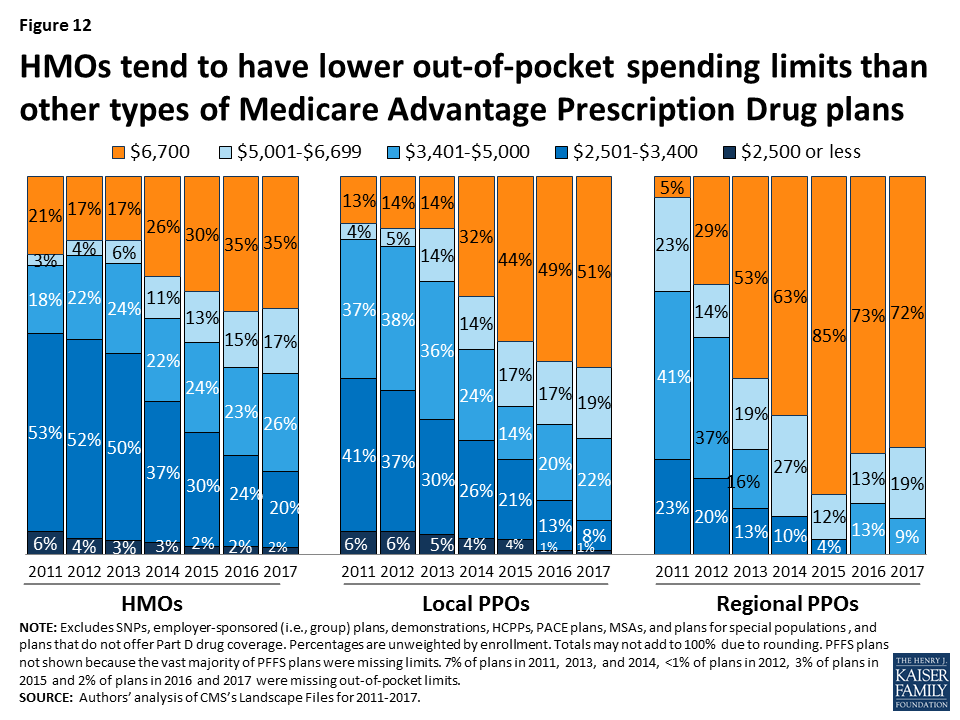
In 2017, two-fifths of plans (39%) will have limits equal to the maximum ($6,700), the same as in 2016. About 19 percent of plans will have a limit of $3,400 or less in 2017, a sharp decline since 2011 when over half (53%) of plans had limits of $3,400 or less. Average out-of-pocket limits are increasing across all plan types (Figure 12). Almost three-quarters (72%) of regional PPOs, half (51%) of local PPOs, and one-third (35%) of HMOs have out of pocket limits equal to $6,700. Limits at or below $3,400 are rare across all plan types.
Figure 12: HMOs tend to have lower out-of-pocket spending limits than other types of Medicare Advantage Prescription Drug plans
Prescription Drug Coverage
In 2017, the vast majority (88%) of Medicare Advantage plans will offer prescription drug coverage. Historically, plans without a drug benefit were developed for beneficiaries who may have access to other sources of prescription drug coverage, such as retiree health coverage from former employers or the Veterans Health Administration, as well as those who for any other reason do not want to purchase such coverage.
Coverage of the Part D Deductible
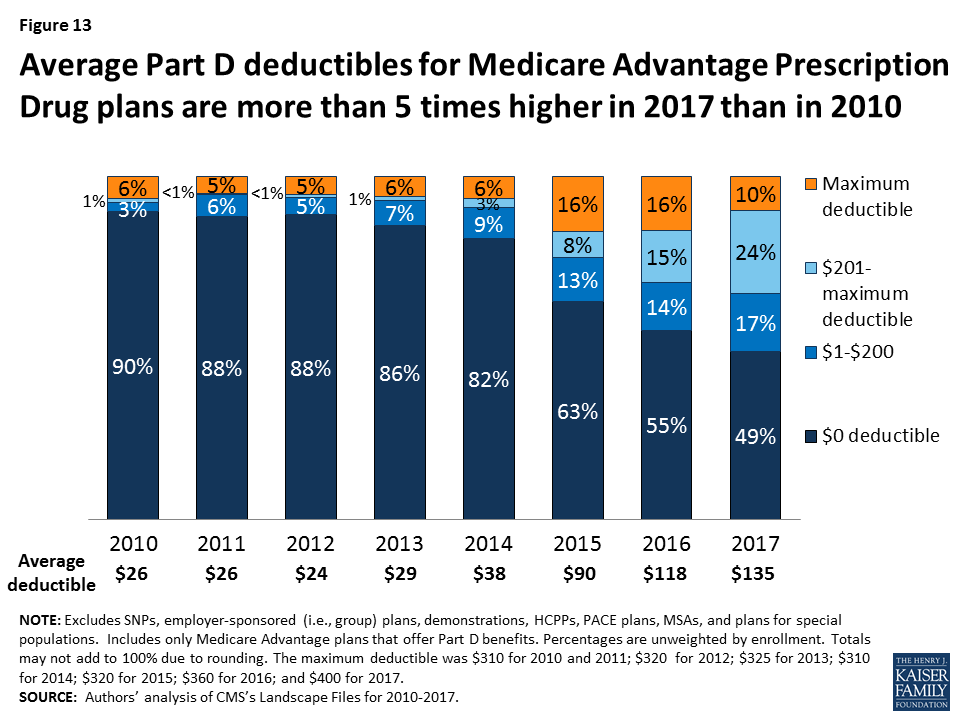
The standard design of the drug benefit includes an initial coverage deductible which is updated each year, and is $400 in 2017. Plans can vary the benefit design as long as they provide cost-sharing that is at least actuarially equivalent to the standard benefit. In 2017, half (51%) of MA-PDs will impose a deductible for prescription drug coverage. Since 2010, the average MA-PD deductible has quintupled from $26 in 2010 to $135 in 2017 (Figure 13). A smaller share of MA-PDs will charge the maximum deductible (10% in 2017 versus 16% in 2016). Deductibles are more frequently used in free standing PDPs and more charge the maximum allowed amount.8
Figure 13: Average Part D deductibles for Medicare Advantage Prescription Drug plans are more than 5 times higher in 2017 than in 2010
Quality Ratings
For many years, the CMS has posted quality ratings of Medicare Advantage plans to provide Medicare beneficiaries with additional information about plans offered in their area. All Medicare Advantage plans are rated on a 1 to 5-star scale, with 1 star representing poor performance, 3 stars representing average performance, and 5 stars representing excellent performance. CMS assigns quality ratings at the contract level, rather than for each individual plan. This means that every Medicare Advantage plan covered under the same contract receives the same quality rating, and most contracts cover multiple plans of the same type (e.g. HMO).
Since 2012, Medicare Advantage plans have received bonus payments based on their contract’s quality ratings, and plans within contracts with higher ratings also receive higher rebate amounts. In 2017, plans within contracts with 4 or more stars will receive bonuses of 5 percent. Plans in lower scoring contracts receive no bonuses. (Those too new or with too few enrollees in their contract to be rated get a bonus of 3.5 percent). These bonus percentages are doubled in some counties.9 Additionally, beneficiaries can enroll in a plan with 5 stars (the highest rating) at any time during the year, not just during the annual open enrollment period.
In 2017, about four in ten (41%) Medicare Advantage contracts will have ratings of four or more stars, similar to 2016 (Figure 14). Five percent of contracts received 5 stars, the highest rating possible. More than one-third (35%) of contracts will have average ratings (3 or 3.5 stars), and 2 percent of contracts will have below average ratings (2 or 2.5 stars) in 2017.
Figure 14: About four in ten Medicare Advantage contracts have quality ratings of 4 stars or higher in 2017
Change in Number and Availability of Plans Offered by Firm
While many organizations offer Medicare Advantage plans, most plans are owned or affiliated with a small number of companies and organizations. In 2016, 7 firms and affiliates accounted for almost three-quarters of all enrollment: UnitedHealthcare, Humana, Blue Cross and Blue Shield (BCBS) affiliated companies (including Anthem BCBS plans), Kaiser Permanente, Aetna, Cigna, and Wellcare. These companies and affiliates account for 64 percent of the plans being offered in 2017 (Table A4).
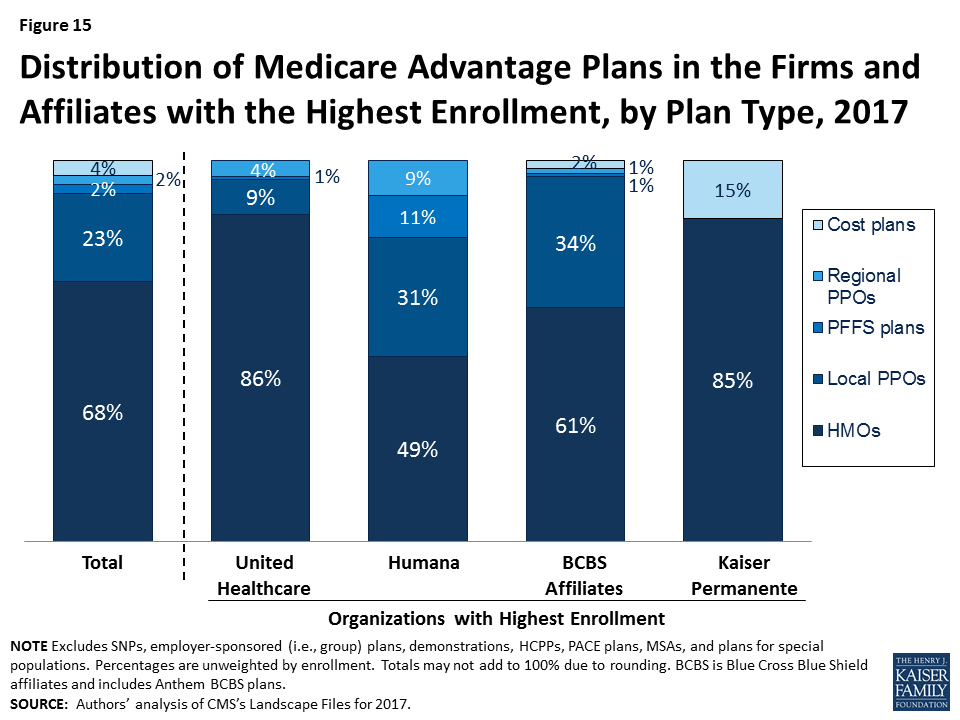
Firm strategies are reflected both in the types of plans they offer and the share of beneficiaries to whom they are available (Figure 15; Table A5). Two firms with the largest footprints in the Medicare Advantage market are United Healthcare and Humana. In 2017, 74 percent of Medicare beneficiaries will have a United Health plan available to them for individual enrollment, and 83 percent will have a Humana plan. Humana’s footprint continues to be large despite recent declines in the total number of plans they offer nationwide. Humana offers diverse types of plans than most other firms. HMOs, local PPOs, and regional PPOs offered by Humana will be available to more than half of beneficiaries (56%, 58%, and 61%, respectively) and Humana PFFS plans will be available to about four in ten beneficiaries (39%). UnitedHealthcare offerings, in contrast emphasize HMOs. More than half of beneficiaries (61%) will have access to a UnitedHealthcare HMO in 2017, up from 55 percent of beneficiaries in 2016.
Figure 15: Distribution of Medicare Advantage Plans in the Firms and Affiliates with the Highest Enrollment, by Plan Type, 2017
How Mergers Could Affect Medicare Advantage Plan Offerings
Aetna’s proposed merger with Humana has raised concerns about its potential to reduce competition in the Medicare market. Humana is a dominant firm in the Medicare Advantage market and a merger with Aetna would likely increase the dominance of the combined firms, even with some divestment. Even without a merger, Aetna’s footprint in the Medicare Advantage market has expanded since its acquisition of Coventry. In 2017, Aetna plans will be available to more than half (56%) of all beneficiaries, up from 49 percent in 2016 and 33 percent in 2014, the year after the acquisition of Coventry. Between 2016 and 2017, Aetna will greatly increase the number of local PPOs it offers, rising from 82 plans in 2016 to 117 plans in 2017. Accordingly, a larger share of beneficiaries will have access to an Aetna local PPO (52%) in 2017, up from four in ten (40%) beneficiaries in 2016, and one-third of beneficiaries (33%) in 2015.
Cigna and Anthem have also proposed to merge, although this would have less of an impact on the Medicare Advantage marketplace than the Aetna-Humana proposed merger. Nonetheless, with its conversion to for profit status and acquisition of other BCBS affiliates, Anthem BCBS has expanded the geographic scope of its Medicare Advantage market, and will be available to 24 percent of all Medicare beneficiaries in 2017. Cigna currently is a somewhat smaller player in the Medicare Advantage market, with its plans available to 20 percent of beneficiaries in 2017. If this merger is approved, concerns about the effects on competition in Medicare Advantage would likely be limited to a few specific markets.
Discussion
Plan choices for beneficiaries will be relatively stable between 2016 and 2017, with very little change in the number or type of plans available to beneficiaries or the firms offering those plans. Firms continue to offer diverse products and most beneficiaries have a choice of HMOs and PPOs, while fewer beneficiaries have access to PFFS plans. Most beneficiaries will continue to have a wide choice of plans, including plans that require no additional premiums. Premium increases generally will be moderate but will vary considerably across enrollees. Medicare beneficiaries enrolling in a Medicare Advantage plan will find that the plans available to them, on average, have somewhat higher quality ratings in 2017 than in 2016 but provide less financial protection with higher limits on out-of-pocket costs.
Given the rise in Medicare Advantage enrollment, it is unfortunate that beneficiaries do not have more information that is readily available to facilitate plan comparisons and inform their choices. In particular, it remains challenging for consumers (and researchers) to obtain information that can be used to compare plan networks, cost sharing, and extra benefits, or the performance of individual plans on quality and efficiency metrics. Such information could be used to strengthen program oversight.
The multi-year experience of private plans in Medicare provides insight into the implications of choice for older adults and people with disabilities on Medicare. By its nature, the structure of the Medicare Advantage program and its reliance on competition among private plans demands much of plan enrollees, particularly if they want to maximize Medicare’s value. Since firms can make changes to their plans each year (e.g., premiums, cost-sharing, extra benefits and provider networks), each year’s choices bring potentially significant changes for beneficiaries to consider that can be particularly challenging for beneficiaries with serious health problems or cognitive limitations. Perhaps that is one reason why such a small share of Medicare Advantage enrollees change plans each year,10 unless confronted with relatively steep premium increases.
While Medicare Advantage has been relatively stable in recent years, it was not always so. Beneficiaries experienced considerable disruption in the late 1990s and early 2000s when firms departed many markets and reduced benefits under the Medicare +Choice program, the predecessor program to Medicare Advantage.11 The current stability in the Medicare Advantage market has benefited considerably from the current payment system which, even after the ACA payment reductions, pays plans, on average, 102 percent of the cost of coverage under traditional Medicare. Some lawmakers are now proposing to transform Medicare into a premium support system, building off of Medicare Advantage. A premium support system could be a major departure from the current program due to many factors, including a change in federal payments to plans and plans’ financial incentives, which would have uncertain effects for plans and beneficiaries.
Gretchen Jacobson, and Tricia Neuman are with the Kaiser Family Foundation; Anthony Damico is an independent consultant; and Marsha Gold is a Senior Fellow Emeritus with Mathematica Policy Research and independent consultant.
Appendix
Box 1: Availability of Special Needs Plans in 2017
Special Needs Plans (SNPs) are a type of Medicare Advantage plan that was authorized in 2003 as part of the Medicare Prescription Drug, Improvement and Modernization Act (MMA) to provide a managed care option for beneficiaries with significant or relatively specialized health care needs. Medicare beneficiaries can enroll in a SNP if they are dually eligible for Medicare and Medicaid (D-SNPs), require an institutional-level of care (I-SNPs), or have a severe or chronic condition (C-SNP). Most SNPs are HMOs, but they can also be PPOs.
When SNPs were authorized, there were few requirements beyond those required of other Medicare Advantage plans. The Medicare Improvements for Patients and Providers Act (MIPPA) of 2008 established additional requirements for SNPs, including requiring all SNPs to provide a care management plan to document how care would be provided for enrollees and requiring C-SNPs to limit enrollment to beneficiaries with specific diagnoses or conditions. As a result of the MIPPA requirements, the number of SNPs declined in 2010. The ACA required D-SNPs to have a contract with the Medicaid agency for every state in which the plan operates, beginning in 2013.
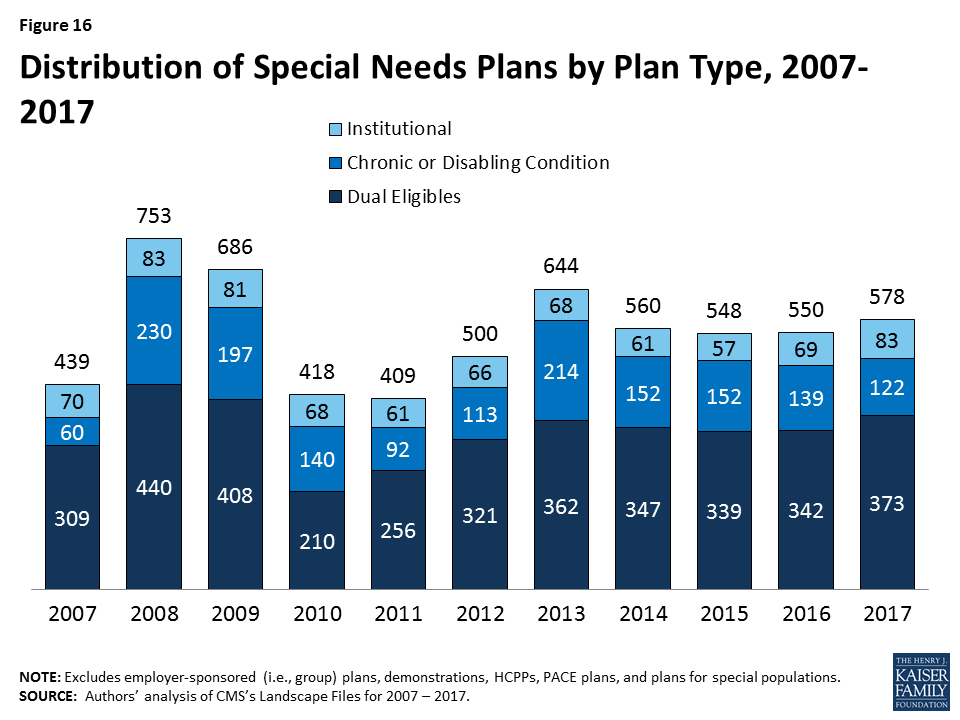
In 2017, 578 SNPs will be available, similar years since 2013 (Figure 16; Table A6). The availability of SNPs will continue to vary across states. In 2017, at least one SNP of any type will be available in all states but six (AK, IA, ND, SD, VT, and WY). SNPs were not available in Nebraska and Rhode Island in 2016 but will be available in 2017; Nebraska will have one D-SNP and Rhode Island will have one D-SNP and two I-SNPs. As in past years, SNPs will be most numerous in selected high population states, notably Florida (97 plans), California (70 plans), and New York (45 plans).
The total number of D-SNPs will increase from 342 plans to 373 plans between 2016 and 2017, and the number of C-SNPs will decline from 139 plans in 2016 to 122 plans in 2017. Similar to prior years, most C-SNPs (72%) will focus on diabetes, chronic heart failure, or cardiovascular disorders. The total number of I-SNPs will increase from 69 plans in 2016 to 83 plans in 2017, and six new companies will offer I-SNPs for the first time in 2017 (accounting for 8% of plans).
Figure 16: Distribution of Special Needs Plans by Plan Type, 2007-2017
Table A1. Medicare Advantage Plan Market Entries and Exits, Average Monthly Premiums and Average Out-of-Pocket Spending Limits for Medicare Advantage Prescription Drug plans (MA-PDs), Weighted by 2016 Enrollment, 2016-2017
All Medicare Advantage Plans (MA-PD and MA-only plans)
All plans
HMO
Local PPO
PFFS
Regional PPO
Cost
MSA
2016 Plan Total
2,001
1,351
461
57
47
81
4
Total number of staying plans
1,763
1,193
400
47
47
72
4
Number of staying plans with no service area reductions
1,519
1,048
324
24
47
72
4
Number of staying plans with reduced service areas
185
99
63
23
–
–
–
Number of consolidating plans, post consolidation
59
46
13
–
–
–
–
Total number of departing plans
238
158
61
10
–
9
–
Number of plans departing due to consolidation
67
50
13
–
–
4
–
Number of terminating plans
171
108
48
10
–
5
–
Number of new plans
271
194
69
1
2
5
–
2017 Plan Total
2,034
1,387
469
48
49
77
4
Total Medicare Advantage enrollees, as of September 2016
12,282,452
8,496,896
2,065,184
225,353
1,065,036
427,283
2,700
Number of staying plans’ enrollees
11,867,742
8,223,231
1,951,216
198,751
1,065,036
426,808
2,700
Number of enrollees losing access to their plan
414,710
273,665
113,968
26,602
–
475
–
Average premiums of MA-PDs, weighted by 2016 enrollment
Premiums for all plans, 2016
$37.24
$27.61
$61.59
$55.82
$32.89
$112.38
$0.00
Terminating plans, 2016
$41.83
$25.41
$78.57
$52.76
N/A
$71.02
N/A
Staying plans, 2016
$37.08
$27.69
$60.60
$56.23
$32.89
$112.42
$0.00
2017 Premiums for remaining 2016 plans
$38.61
$29.12
$62.41
$60.96
$34.53
$112.68
$0.00
Change in premiums for plans available in both 2016 and 2017
$1.53
$1.44
$1.82
$4.73
$1.64
$0.26
$0.00
Share of enrollees in MA-PDs with no premiums, among plans available in both 2016 and 2017
2016
49%
59%
24%
8%
45%
1%
100%
2017
48%
58%
24%
8%
45%
1%
100%
Change in share of plans with no premiums
-1%
-1%
0%
0%
0%
0%
0%
Average premiums paid per enrollee, among MA-PDs with premiums (excluding zero premium plans) and available in both 2016 and 2017
2016
$73.11
$67.99
$79.98
$60.91
$59.60
$113.90
N/A
2017
$74.84
$69.39
$82.29
$66.03
$62.58
$114.16
N/A
Average out-of-pocket spending limits per year among MA-PDs, weighted by 2016 enrollment, among plans available in both 2016 and 2017
2016
$5,204
$4,974
$5,661
N/A
$6,595
$3,538
N/A
2017
$5,235
$4,974
$5,817
N/A
$6,605
$3,698
N/A
Change in average out-of-pocket spending limits
$32
$1
$156
N/A
$10
$160
N/A
Total MA-PD enrollees, as of September 2016
11,668,604
8,343,955
2,032,438
132,299
951,002
208,910
–
Number of staying MA-PDs’ enrollees
11,284,612
8,072,317
1,920,084
132,299
951,002
208,910
–
Number of enrollees losing access to their MA-PD
383,992
271,638
112,354
–
–
–
–
NOTE: Excludes Special Needs Plans (SNPs), demonstrations, Health Care Prepayment Plans (HCPPs), Program of All Inclusive Care for the Elderly (PACE) plans, employer-sponsored (i.e., group) plans, and plans for special populations.SOURCE: Authors’ analysis of CMS’s Landscape Files for 2016 and 2017 and CMS’s 2016 and 2017 Part C and D Crosswalk file and September 2016 enrollment.
Table A2. Average Number of Plans Available to Beneficiaries by County of Residence, 2009-2017
2009
2010
2011
2012
2013
2014
2015
2016
2017
National Average
48
33
24
20
20
18
18
19
19
Metro counties
51
35
26
22
22
20
20
21
21
Non-metro counties
36
24
16
13
13
11
10
11
11
Fee-for-Service Costs, by Quartile
Lowest cost quartile
45
28
18
17
17
17
15
15
15
Second quartile
46
31
20
17
16
15
14
15
15
Third quartile
44
30
20
17
18
16
16
17
17
Highest cost counties
53
37
30
24
24
21
22
23
23
NOTE: Excludes SNPs, employer-sponsored (i.e., group) plans, demonstrations, HCPPs, PACE plans, and plans for special populations.SOURCE: Authors’ analysis of CMS’s Landscape and Penetration Files for 2009 – 2017.
Table A3. Unweighted Average Monthly Premiums for Medicare Advantage Prescription Drug Plans, by Plan Type, 2009-2017
2009
2010
2011
2012
2013
2014
2015
2016
2017
Change, 2016-2017
All Plans
$51.81
$55.86
$50.61
$49.80
$51.43
$51.47
$53.42
$52.57
$50.97
-$1.60
HMOs
$34.52
$40.11
$36.24
$33.20
$34.11
$35.37
$38.28
$39.14
$38.81
-$0.33
Local PPOs
$65.12
$70.17
$65.72
$69.14
$72.57
$74.92
$81.02
$78.61
$72.91
-$5.70
PFFS plans
$74.46
$75.09
$65.79
$70.96
$83.29
$90.93
$87.86
$91.40
$92.43
$1.03
Regional PPOs
$55.68
$59.29
$53.38
$55.64
$56.89
$59.30
$67.85
$74.93
$80.84
$5.91
NOTE: Excludes SNPs, demonstrations, HCPPs, PACE plans, employer-sponsored (i.e., group) plans, and plans for special populations. Premiums include plans with premiums as well as plans with no premiums. Cost plans are included in the total but are not shown separately.SOURCE: Authors’ analysis of CMS’s Landscape Files for 2009 – 2017.
Table A4. Number of Medicare Advantage Plans Available, by Plan Type and Firm, 2015-2017
All
HMOs
Local PPOs
PFFS Plans
Regional PPOs
Cost Plans
2015
2016
2017
2015
2016
2017
2015
2016
2017
2015
2016
2017
2015
2016
2017
2015
2016
2017
Number of Plans – Total
1945
2001
2034
1275
1351
1387
465
461
469
69
57
48
43
47
49
86
81
77
UnitedHealthCare
164
223
272
132
187
234
22
24
25
2
2
2
8
10
11
0
0
0
Humana
395
362
337
195
184
164
116
106
105
53
41
37
31
31
31
0
0
0
BCBS – Total
291
311
316
163
189
194
110
110
109
4
2
3
4
4
4
6
6
6
Anthem BCBS
54
62
65
35
45
48
16
14
14
0
0
0
3
3
3
0
0
0
Other BCBS plans
237
249
251
128
144
146
94
96
95
4
2
3
1
1
1
6
6
6
Kaiser Permanente
39
41
41
34
34
34
0
0
0
0
0
0
0
0
0
5
6
6
Aetna
195
203
233
121
119
113
74
82
117
0
0
0
0
2
3
0
0
0
WellCare
40
49
50
40
49
50
0
0
0
0
0
0
0
0
0
0
0
0
Cigna
43
46
43
40
43
41
3
3
2
0
0
0
0
0
0
0
0
0
Other
778
766
742
550
546
557
140
136
111
10
12
6
0
0
0
75
69
65
NOTE: Excludes SNPs, demonstrations, HCPPs, PACE plans, employer-sponsored (i.e., group) plans, and plans for special populations. BCBS are BlueCross BlueShield affiliates, which includes Anthem BCBS plans. Total includes MSAs, which are not shown separately. For earlier years of data, see See Jacobson G, Gold M, Damico A, Neuman T, and Casillas, G. “Medicare Advantage 2016 Data Spotlight: Overview of Plan Changes.” December 2015. https://www.kff.org/medicare/issue-brief/medicare-advantage-2016-data-spotlight-overview-of-plan-changes/SOURCE: Authors’ analysis of CMS’s Landscape Files for 2015 – 2017.
Table A5. Share of Medicare Beneficiaries with Access to Firms’ Medicare Advantage Plan Offerings, by Plan Type and Firm, 2015-2017
Any Plan
HMOs
Local PPOs
PFFS Plans
Regional PPOs
Cost Plans
Firm
2015
2016
2017
2015
2016
2017
2015
2016
2017
2015
2016
2017
2015
2016
2017
2015
2016
2017
UnitedHealthcare
69%
70%
74%
49%
55%
61%
18%
13%
10%
2%
2%
2%
32%
32%
33%
0%
0%
0%
Humana
86%
85%
83%
56%
58%
56%
54%
53%
58%
44%
43%
39%
61%
61%
61%
0%
0%
0%
BCBS – Total
71%
72%
72%
54%
58%
58%
46%
45%
41%
1%
1%
3%
15%
15%
15%
2%
2%
2%
Anthem BCBS plans
21%
24%
24%
15%
20%
22%
9%
9%
8%
0%
0%
0%
8%
8%
8%
0%
0%
0%
Other BCBS plans
58%
55%
55%
46%
44%
43%
37%
36%
33%
1%
1%
3%
7%
7%
7%
2%
2%
2%
Kaiser Permanente
15%
17%
17%
13%
13%
13%
0%
0%
0%
0%
0%
0%
0%
0%
0%
2%
2%
2%
Aetna
45%
49%
56%
42%
43%
45%
33%
40%
52%
0%
0%
0%
0%
7%
7%
0%
0%
0%
Wellcare
25%
32%
29%
25%
32%
29%
0%
0%
0%
0%
0%
0%
0%
0%
0%
0%
0%
0%
Cigna
19%
20%
20%
19%
20%
20%
2%
2%
1%
0%
0%
0%
0%
0%
0%
0%
0%
0%
Others
79%
79%
79%
73%
73%
73%
30%
34%
28%
4%
4%
3%
0%
0%
0%
6%
6%
5%
NOTE: Excludes SNPs, demonstrations, HCPPs, PACE plans, employer-sponsored (i.e., group) plans, and plans for special populations. BCBS are BlueCross BlueShield affiliates, which includes Anthem BCBS plans. Any plan includes beneficiaries with access to an MSA (not shown separately). For earlier years of data, see See Jacobson G, Gold M, Damico A, Neuman T, and Casillas, G. “Medicare Advantage 2016 Data Spotlight: Overview of Plan Changes.” December 2015. https://www.kff.org/medicare/issue-brief/medicare-advantage-2016-data-spotlight-overview-of-plan-changes/SOURCE: Authors’ analysis of CMS’s Landscape Files for 2015 – 2017.
Table A6. Number and Type of Special Needs Plans, by State, 2016 and 2017
2016
2017
State
Overall
Dual eligibles
Institutional
Chronic conditions
Overall
Dual eligibles
Institutional
Chronic conditions
Alabama
6
4
2
0
6
4
2
0
Alaska
0
0
0
0
0
0
0
0
Arizona
33
21
4
8
30
19
4
7
Arkansas
7
4
0
3
7
5
0
2
California
72
31
4
37
70
28
4
38
Colorado
9
4
3
2
9
4
3
2
Connecticut
4
2
2
0
4
2
2
0
Delaware
3
1
1
1
6
2
3
1
District of Columbia
5
2
1
2
9
4
3
2
Florida
94
58
6
30
97
64
8
25
Georgia
14
8
2
4
20
12
3
5
Hawaii
5
5
0
0
6
6
0
0
Idaho
1
1
0
0
1
1
0
0
Illinois
10
5
2
3
8
3
2
3
Indiana
8
4
2
2
6
3
2
1
Iowa
0
0
0
0
0
0
0
0
Kansas
2
0
1
1
3
1
1
1
Kentucky
13
8
1
4
13
9
1
3
Louisiana
13
9
0
4
11
10
0
1
Maine
4
2
1
1
4
2
1
1
Maryland
10
3
3
4
12
3
5
4
Massachusetts
9
7
1
1
10
7
2
1
Michigan
6
4
1
1
6
4
1
1
Minnesota
9
9
0
0
10
10
0
0
Mississippi
6
4
0
2
6
6
0
0
Missouri
12
3
5
4
8
3
3
2
Montana
1
1
0
0
1
1
0
0
Nebraska
0
0
0
0
1
1
0
0
Nevada
7
0
1
6
7
0
1
6
New Hampshire
1
0
1
0
1
0
1
0
New Jersey
9
4
3
2
11
5
4
2
New Mexico
3
2
1
0
6
6
0
0
New York
53
37
11
5
45
31
11
3
North Carolina
14
7
2
5
9
6
2
1
North Dakota
0
0
0
0
0
0
0
0
Ohio
18
11
4
3
18
12
5
1
Oklahoma
1
0
1
0
1
0
1
0
Oregon
11
7
3
1
15
8
6
1
Pennsylvania
21
11
6
4
22
13
7
2
Puerto Rico
15
13
0
2
16
14
0
2
Rhode Island
0
0
0
0
3
1
2
0
South Carolina
8
3
1
4
13
5
1
7
South Dakota
0
0
0
0
0
0
0
0
Tennessee
8
7
1
0
8
7
1
0
Texas
31
22
2
7
36
26
2
8
Utah
2
2
0
0
2
2
0
0
Vermont
0
0
0
0
0
0
0
0
Virginia
9
2
3
4
18
9
5
4
Washington
8
6
2
0
9
6
3
0
West Virginia
1
1
0
0
2
1
1
0
Wisconsin
18
13
4
1
18
14
3
1
Wyoming
0
0
0
0
0
0
0
0
Total, U.S.
550
342
69
139
578
373
83
122
NOTE: Columns do not sum to U.S. total because some SNPs overlap state boundaries.SOURCE: Authors’ analysis of CMS’s Landscape Files for 2016-2017.
The Kaiser Health Policy News Index is designed to help journalists and policymakers better understand which health policy-related news stories Americans are following, and what the public knows about health policy issues covered in the news. It also looks at how attention to health policy news stories compares to other national news stories.
Health Policy Stories v. National News Stories
Table 1 below presents the top news stories of 2016, as determined by the percent of Americans who said they followed news coverage related to each story “very” or “fairly” closely in monthly Kaiser tracking polls. The major news stories that dominated this past year and captivated Americans’ attention range from multiple conflicts involving police officers to the various scripted and unscripted events of the 2016 presidential election.
As seen in the table, health policy news stories were never the most closely followed news stories. Across the ten Kaiser Health Tracking Polls conducted between January and November 2016, the presidential campaign was the top news story in more than half of these surveys. On average, more than seven in ten Americans said they were closely following news about the election each month.
Table 1: Most Closely Followed Stories in 2016 by Month
Month
Story
Percent who say theyfollowed the story closely
January
Conflicts involving ISIS and other Islamic militant groups in Iraq and Syria
76%
February
2016 presidential campaigns
Conflicts involving ISIS and other Islamic militant groups
73
73
March
2016 presidential campaigns
81
April
Terrorist attacks in Brussels and other conflicts involving ISIS
80
June
The attack at a LGBT night club in Orlando, Florida
85
July
2016 presidential campaigns
83
August
Conflicts involving ISIS and other Islamic militant groups
Republican candidate Donald Trump’s presidential campaign win
82
NOTE: In May 2016, no tracking poll was conducted. The December tracking poll will be released in January 2017.
Although the election was certainly the biggest national story of 2016, there were several major health policy stories that made news this year, including the unsafe levels of lead in Flint, Michigan’s water supply and the Zika virus outbreak. The year was bookended by stories about Republican lawmakers and the Affordable Care Act, with January’s top health story being President Obama vetoing repeal of the law and November’s top health story being Republican lawmakers’ plans to repeal the law once President-elect Trump is in office.
Table 2: Most Closely Followed Health Policy Stories in 2016 by Month
Month
Health Policy Story
Percent who say theyfollowed the story closely
January
Congressional efforts to repeal the 2010 health care law and President Obama’s veto
48%
February
Unsafe levels of lead found in the drinking water in Flint, Michigan
64
March
Unsafe levels of lead found in the drinking water in Flint, Michigan
63
April
Unsafe levels of lead found in the drinking water in Flint, Michigan
70
June
Reports about rising health insurance premiums
61
July
The Zika virus outbreak
The ongoing heroin and prescription painkiller addiction epidemic in the U.S.
52
52
August
The Zika virus outbreak
60
September
The Zika virus outbreak
61
October
The Zika virus outbreak
64
November
Republican plans to repeal the 2010 health care law
70
NOTE: In May 2016, no tracking poll was conducted. The December tracking poll will be released in January 2017.
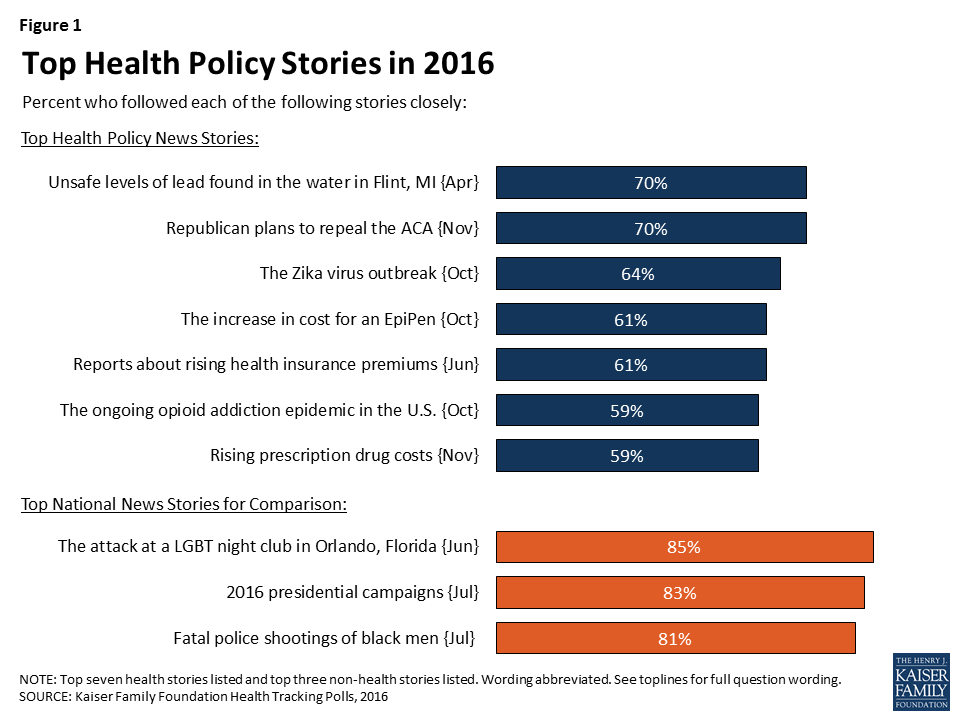
Overall, the top three most closely-followed news stories in 2016 were the attack at an LGBT night club in Orlando, Florida (85 percent reported following this story closely in June), the 2016 presidential campaign (83 percent in July), and the fatal police shootings of black men (81 percent in July). The top three most closely followed health policy news stories in 2016 were the unsafe levels of lead in Flint, Michigan’s drinking water (70 percent in April), Republicans post-election plans to repeal the Affordable Care Act (70 percent in November), and the Zika virus outbreak (64 percent in October).
Figure 1: Top Health Policy Stories in 2016
A Closer Look at Some of the Top Health Policy News Stories
In addition to tracking which health policy-related news stories Americans are following, the Kaiser Health Tracking Polls also examines what the public knows about health policy issues covered in the news. In 2016, we examined Americans’ awareness of and attitudes towards several of the health policy stories in the news.
Flint, Michigan Water Crisis
While Flint, Michigan began using the Flint River as its water source in April 2014, serious concerns about the level of lead in the city’s drinking water supply did not emerge until 2015. The Kaiser Family Foundation began tracking Americans’ attention to news about the unsafe levels of lead in Flint’s water supply in February 2016, and the story ranks as one of the top health policy news stories of the year. One of the main findings from our survey work during this time was the lack of confidence that Americans had in their state governments to ensure the safety of public services; in April, about three in ten (29 percent) reported being ‘extremely’ or ‘very’ confident that their state government can ensure the safety of public water supplies over the next five years while seven in ten reported being either “somewhat confident” or “not all confident.”
Figure 2: Majority of the Public Not Very Confident in State Government’s Ability to Ensure Safety of Public Services
News about the Affordable Care Act
The year began with Republican lawmakers voting to repeal the Affordable Care Act (ACA), only to have President Obama veto the bill.1 And with the election of Republican presidential candidate Donald Trump, the year is ending with reenergized efforts to repeal this legislation and accompanying uncertainty about the future of the U.S. health care system. Throughout 2016, Americans have paid varying degrees of attention to news stories about different aspects of the ACA, with news about Republican post-election plans to repeal the law (70 percent reported following this story closely in November), reports about rising health insurance premiums (61 percent in June), and the number of Americans without health insurance (58 percent in September), having the largest share of individuals who reported following news about these stories closely.
Figure 3: Americans Vary in How Closely they Follow ACA-Related News
Partisans Vary In Perceptions of How Media Cover the ACA
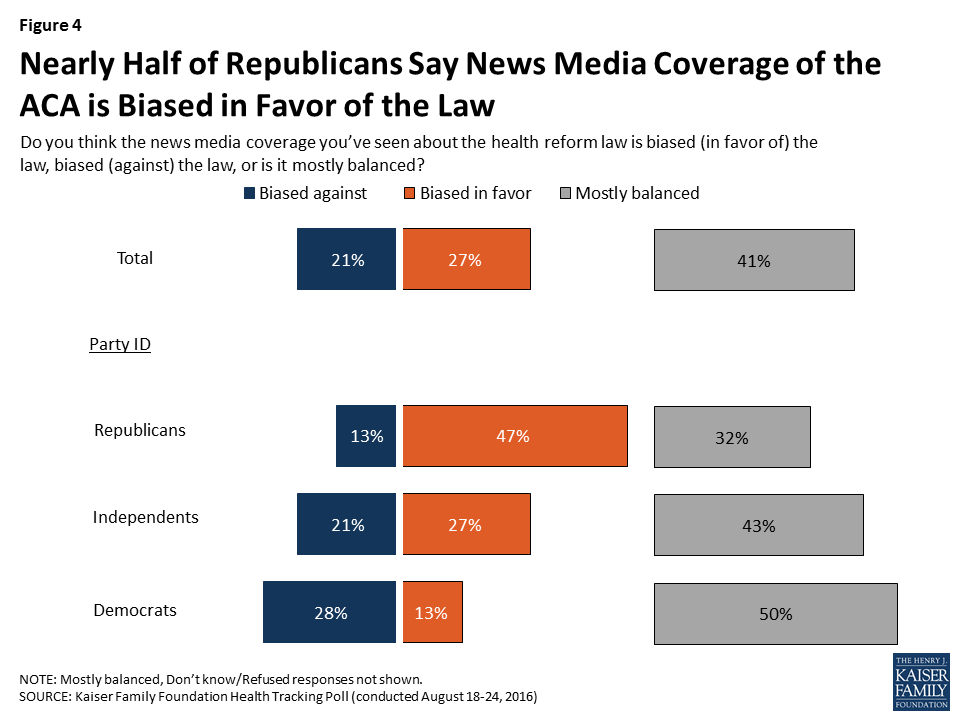
As with almost everything associated with the ACA, Americans’ attitudes of how the news media cover the law are largely dependent on party affiliation. As seen in August, not only do Republicans, Democrats, and independents have very different views towards the law – they also have different views on how the media cover the law. Nearly half (47 percent) of Republicans said the coverage was biased in favor of the law while half of Democrats and 43 percent of independents said the news coverage was mostly balanced.
Figure 4: Nearly Half of Republicans Say News Media Coverage of the ACA is Biased in Favor of the Law
Zika Virus Outbreak
The Kaiser Family Foundation started tracking Americans’ attention to the Zika virus outbreak beginning in February 2016, when the World Health Organization first declared the virus to be an international public health emergency.2 Throughout 2016, the Zika virus outbreak was one of the most followed health stories, with about six in ten of the population from February through October saying they followed news about the virus closely.
Our polls this year have also measured overall knowledge of the ways the virus spreads, the effects of the virus, and support for Congressional funding aimed at reducing the impact of the virus. Overall, the surveys found that although Americans said they were paying close attention to the virus (especially during the summer months), very few reported that they were personally affected. The September Kaiser Health Tracking Poll found that while a vast majority of Americans have heard or read about the Zika virus, very few (2 percent) said they personally knew anyone whose health had been affected by the virus.
Figure 5: Nine in Ten Americans Have Heard at Least a Little About Zika; Two Percent Know Someone Whose Health Is Affected
For more findings from our survey research on Zika, visit our Zika slideshow.
The U.S. Heroin and Prescription Painkiller Epidemic
Throughout 2016, the news media has covered stories about the increase in Americans’ use of heroin and prescription painkillers, and the increase in overdose deaths related to these drugs. News stories about the opioid epidemic included specific events such as the announcement of the Centers for Disease Control and Prevention’s new guidelines for prescribing prescription painkillers in March3 and more general stories about how the epidemic is affecting individuals and communities. The Foundation began tracking Americans’ attention to the epidemic in June. Since then, with the exception of one month, at least half of the public have reported closely following news stories related to the epidemic.
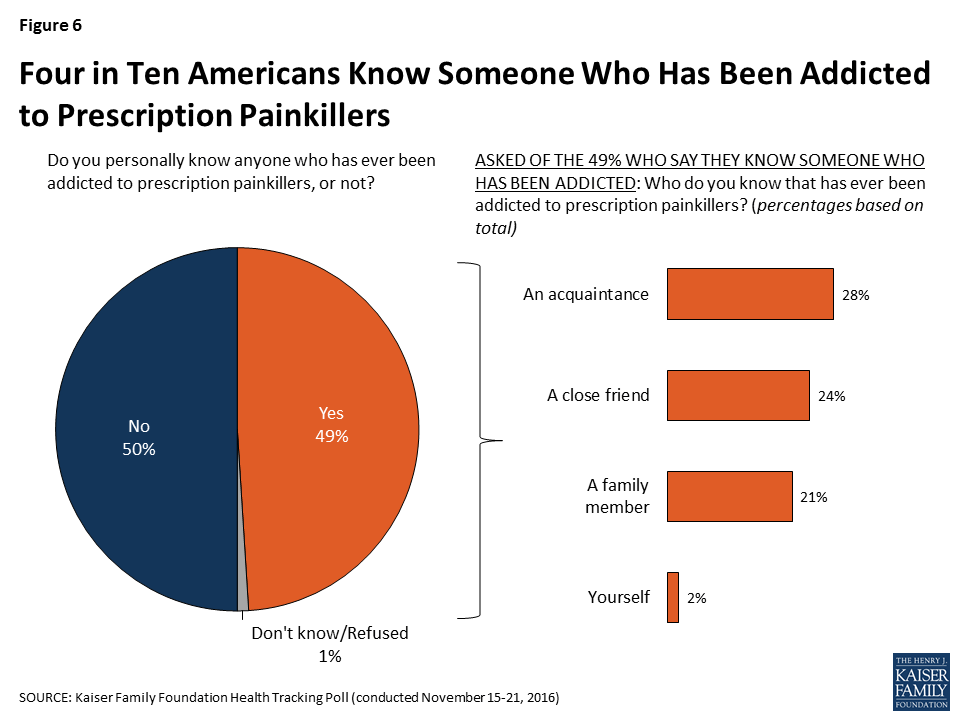
In addition to tracking attention to these stories, several of our surveys examined the public’s attitudes toward, and experiences with, the prescription painkiller epidemic, including the November Kaiser Health Tracking Poll, which found that nearly half of Americans said they knew someone who had been addicted to prescription painkillers, including 2 percent who said it was themselves who was addicted.
Figure 6: Four in Ten Americans Know Someone Who Has Been Addicted to Prescription Painkillers
In addition, a partnership survey with The Washington Post took a closer look at U.S. adults who were long-term users of prescription painkillers and found that one in three (34 percent) long-term opioid users reported being physically dependent or addicted.
Prescription Drug Prices
Another major health story, followed by most Americans this year, has been news about the rising costs of prescription drugs – most notably, coverage about an increase in cost for the EpiPen. The October Kaiser Health Tracking Poll found that about six in ten Americans reported following news about the increase in cost for the EpiPen, which was similar to the share who reported following more general news about the rise in prescription drug costs in the November Kaiser Health Tracking Poll.
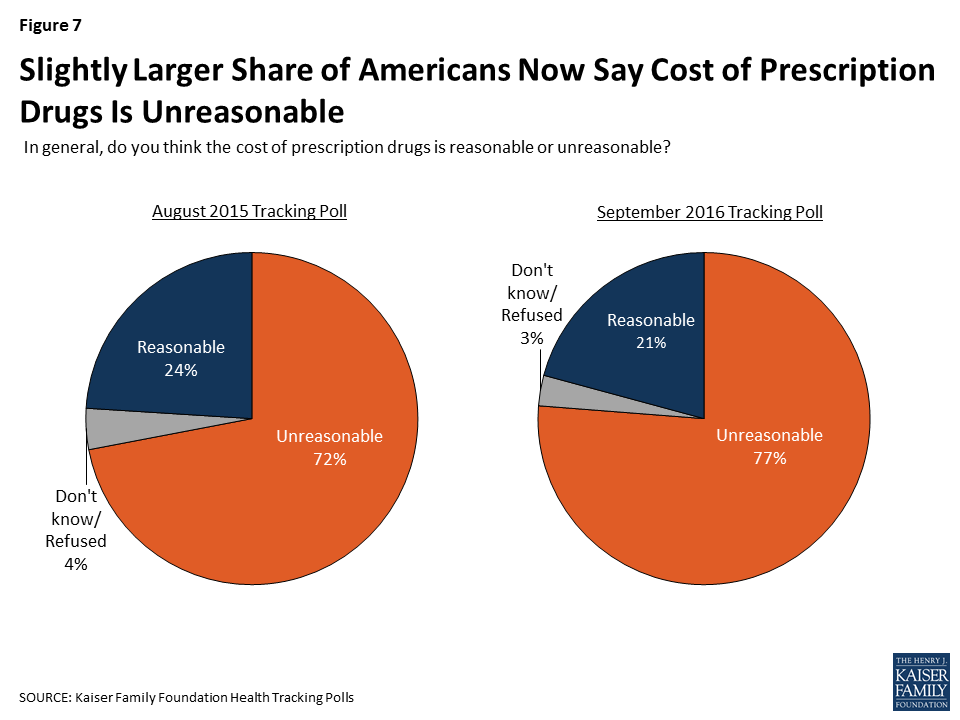
In light of the recent media attention on rising prescription drug costs, we have also been tracking Americans’ perceptions of prescription drug costs and find that these perceptions have changed over time. For example, in September 2016, we found a larger share of Americans said they think prescription drug prices were unreasonable compared to those who said they were unreasonable a year earlier.
Figure 7: Slightly Larger Share of Americans Now Say Cost of Prescription Drugs Is Unreasonable
More data on public opinion on prescription drugs and their prices is available in a summary slideshow.
Methodology
The Kaiser Family Foundation tracks the public’s attention to and awareness of the top health policy stories using the Health Policy News Index (HPNI) in each month’s tracking poll. To develop the HPNI, researchers track the top news stories and top health policy news stories on a daily basis over a one-month period to assess which are the top news stories. The top news stories and top health policy news stories are measured separately. In order to gather the top news stories during the month, data is collected daily on the top five news stories as determined by GoogleNews. The top health policy news stories are gathered using the Morning Briefing produced by Kaiser Health News, an editorially independent program of the Foundation. Each weekday during the month, Foundation researchers tally the number of stories appearing in the Morning Briefing from 5 news organizations (TheAssociated Press, The Washington Post, USA Today, TheNew York Times, and TheWall Street Journal). All news and related stories are coded by researchers to reflect the basic type of news story and the subject the story addresses. Those topics that were covered in the largest number of stories are tallied and the most common stories of the month are then included in the HPNI. The number of stories included in the HPNI vary each month depending on the number of stories that have garnered national news attention.
Following the news-tracking period, a question about how closely the public followed each of the stories in the HPNI is included on the monthly Kaiser Health Tracking Poll, a nationally representative dual frame telephone survey (landline and cell phone) of U.S. adults ages 18 and over, conducted in English and Spanish. Each tracking poll interviews a minimum of 1,200 respondents. Detailed methodological information about each month’s poll is available at https://www.kff.org/tag/tracking-poll/.
Endnotes
The U.S. Senate passed the legislation on December 3, 2015 and the House passed the legislation on January 6, 2016. President Obama vetoed the legislation on January 8, 2016. ↩︎
A key provision of the Affordable Care Act (ACA) is the requirement that private insurance plans cover recommended preventive services for women without any patient cost-sharing.1 On December 20, 2016, the Health Resources and Services Administration updated the preventive services for women by accepting the recommendations of the Women’s Preventive Services Initiative, convened by the American College of Obstetricians and Gynecologists (ACOG), and comprised of representatives of national groups with expertise in women’s health. The committee reaffirmed the services for women that were recommended in 2011 and added one new one for mammography.
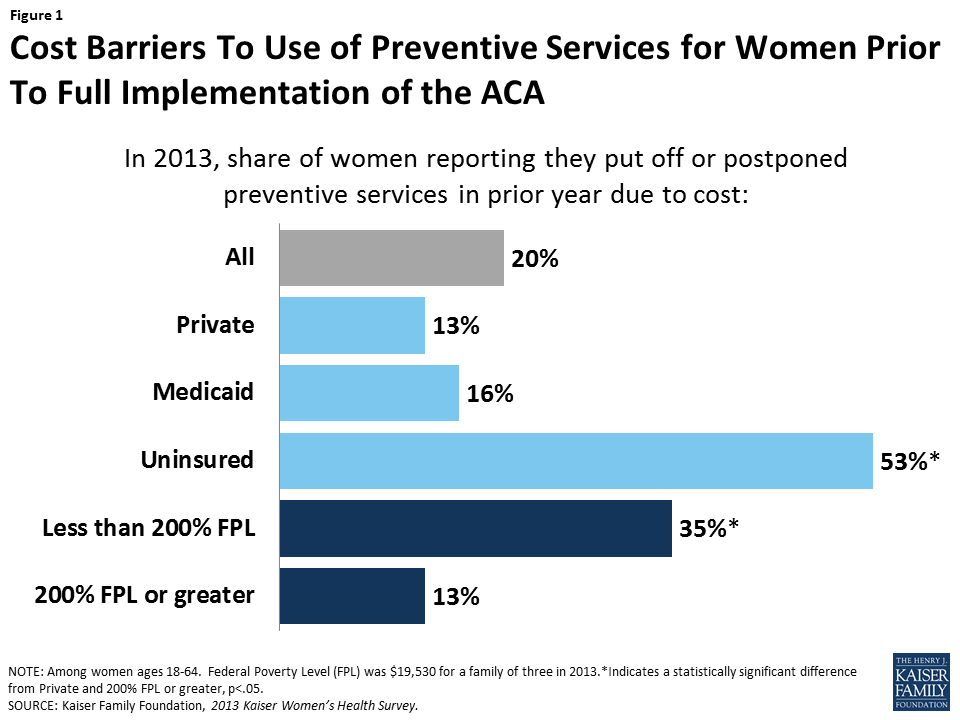
Prior to the ACA’s full implementation, one in five women reported they postponed or went without preventive care because of cost, a much greater barrier for low-income and uninsured women (Figure 1). This factsheet summarizes the ACA preventive services policy’s impact on women, with a focus on the women’s services that are promulgated by HRSA.
Figure 1: Cost Barriers To Use of Preventive Services for Women Prior To Full Implementation of the ACA
ACA Preventive Services That Affect Women
Under Section 2713 of the ACA, private health plans must provide coverage for a range of preventive services for adults and children and may not impose cost-sharing (such as copayments, deductibles, or co-insurance) on patients receiving these services. These requirements apply to most private plans – including individual, small group, large group, and self-insured plans in which employers contract administrative services to a third party. The policy also applies to beneficiaries covered under the ACA’s Medicaid expansion. For children and adolescents, plans must cover the services recommended by the Health Resources and Services Administration’s Bright Futures Project. The required preventive services for adults2 are based on evidence-based recommendations issued by the following three different federal organizations: the United States Preventive Services Task Force (USPSTF), the Centers for Disease Control and Prevention Advisory Committee on Immunization Practices (ACIP), and for women, the Health Resources and Services Administration (HRSA). The preventive services that HRSA requires for women were initially based on recommendations from an expert committee convened by the Institute of Medicine (now the National Academy of Medicine).3 This subset of services for women was just updated by HRSA, and is based on recommendations from the Women’s Preventive Services Initiative (WPSI), a committee convened by ACOG. Table 1 summarizes all of the preventive services affecting women recommended by these three committees that the ACA requires plans to cover without cost sharing.
Table 1: ACA Requires Private Plans to Cover Recommended Preventive Services Free of Cost Sharing for Women
Highlights on the Updated HRSA-Defined Preventive Services for Women
The newly updated services for women from HRSA are designed to identify gaps in services for women that are not recommended by the other expert committees. They include:
Contraceptive coverage
The contraceptive coverage recommendation has been updated. This policy requires that all private plans must cover without cost sharing all 18 distinct prescribed methods used by women (Table 2), as outlined by the Food and Drug Administration (FDA). Insurers may continue to limit coverage in these categories to generic drugs and can impose cost-sharing for equivalent branded drugs. The WPSI reiterates that contraceptive care should include counseling, initiation of contraceptive use, and follow-up care (e.g. management and evaluation as well as changes to and removal or discontinuation of the contraceptive method).
Of all the preventive services, contraception has gained the most attention, with some employers suing the federal government and seeking an exemption from the rule based on the premise that by including contraception in their plans they were being forced to violate their religious beliefs. This litigation reached the US Supreme Court in two cases: Burwell v Hobby Lobby and Zubik v Burwell.4
Table 2: FDA Approved Contraceptive Methods that must be Covered in Private Plans and Medicaid Expansion Programs
The updated HRSA preventive services coverage rules now require that average-risk women be covered for mammography screening. Coverage may begin between ages 40 and 50 and continue through at least age 74, every 1-2 years. HRSA recommends that an individual woman decide on timing and frequency of mammography in consultation with her health care provider. Additionally, the USPSTF recommends that women with family history of breast, ovarian, or peritoneal cancer should be screened for BRCA-related cancer, and those with positive results should receive genetic counseling and genetic testing when appropriate. The USPSTF also recommends that some women with higher risk for breast cancer take prophylactic medications, such as tamoxifen or raloxifene, which must be covered without cost sharing under the ACA.5
Cervical cancer
The HRSA services include cervical cancer screening for women ages 21 to 65. Depending on age and risk, a combination of Pap and HPV testing may be used.
Pregnancy
HRSA recommends screening all pregnant women for gestational diabetes. Prenatal visits are also covered without cost sharing as part of the HRSA recommendation for well woman visits, discussed further below. This is in addition to a number of screening tests recommended by the USPSTF for pregnant women, plus folic acid supplements and substance abuse counseling and cessation (Table 1).
Breastfeeding services and supplies
Both the USPSTF and HRSA recommend breastfeeding education and lactation consultations for pregnant and postpartum women. The HRSA recommendation goes further by recommending coverage without cost sharing for rental of breast pumps and breastfeeding supplies during the antenatal, perinatal, and postpartum periods.
Counseling on Sexually Transmitted Infections (STIs)
HRSA recommends behavioral counseling for women at increased risk for STIs.
Screening for human immunodeficiency virus (HIV)
The HRSA services include HIV counseling, at least one HIV test during a woman’s lifetime and more if needed, for women at higher risk for contracting HIV.
Screening for Interpersonal and Domestic Violence
The committee recommends that providers screen adolescents and women for violence and provide or refer to interventional services when needed. This can include counseling, education, and other support services.
Well-woman visits
The HRSA services for women include coverage for at least one annual well-woman visit that women can use to obtain all of the preventive services that are recommended, including prenatal care. They note that for some women, more than one visit may be needed to cover all the preventive and counseling services they need.
Conclusion
A repeal of the ACA as proposed by President-elect Trump would end the requirement that recommended preventive services be covered by private plans without cost sharing, unless this provision is included as part of replacement legislation. The specific preventive services for women that were updated and promulgated by HRSA, however, could also be eliminated or scaled back by administrative action, without the need for Congressional action because HRSA can accept or reject any of the women’s services recommended by the WPSI.
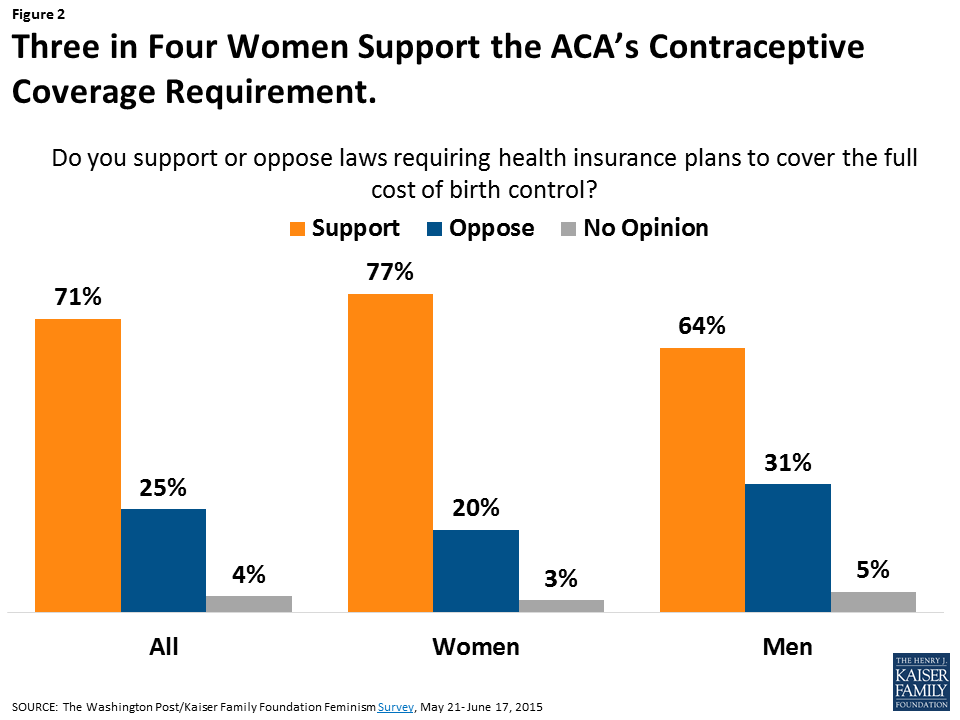
As the Trump administration transitions to the White House, it remains to be seen how or whether the new administration and 115th Congress will specifically address preventive services for women more broadly. The administration and Congress, however, have signaled that they will address the accommodation for employers claiming religious objections to the contraceptive coverage provision.6 Although the contraceptive coverage provision has been controversial among certain employers, among the public, and especially among women, there has been widespread support for the requirement (Figure2). Research has also documented that women’s out-pocket-spending on contraceptives has dropped significantly as a result of the law.7 Given that more than 90% of women use contraceptives at some point in their lives,8 this is a benefit that affects millions of women.
Figure 2: Three in Four Women Support the ACA’s Contraceptive Coverage Requirement.
The 2010 Affordable Care Act (ACA) included many provisions affecting the Medicare program and the 57 million seniors and people with disabilities who rely on Medicare for their health insurance coverage. Such provisions include reductions in the growth in Medicare payments to hospitals and other health care providers and to Medicare Advantage plans, benefit improvements, payment and delivery system reforms, higher premiums for higher-income beneficiaries, and new revenues.
President-elect Donald Trump, Speaker of the House Paul Ryan, Health and Human Services (HHS) Secretary-nominee and current House Budget Committee Chairman Tom Price, and many other Republicans in Congress have proposed to repeal and replace the ACA, but lawmakers have taken different approaches to the ACA’s Medicare provisions. For example, the House Budget Resolution for Fiscal Year 2017, introduced by Chairman Price in March 2016, proposed a full repeal of the ACA. The House Republican plan, “A Better Way,” introduced by Speaker Ryan in June 2016, proposed to repeal some, but not all, of the ACA’s Medicare provisions.
This brief explores the implications for Medicare and beneficiaries of repealing Medicare provisions in the ACA. The Congressional Budget Office (CBO) has estimated that full repeal of the ACA would increase Medicare spending by $802 billion from 2016 to 2025.1 Full repeal would increase spending primarily by restoring higher payments to health care providers and Medicare Advantage plans. The increase in Medicare spending would likely lead to higher Medicare premiums, deductibles, and cost sharing for beneficiaries, and accelerate the insolvency of the Medicare Part A trust fund. Policymakers will confront decisions about the Medicare provisions in the ACA in their efforts to repeal and replace the law.
What are the key Medicare provisions in the ACA and how would repeal affect Medicare spending and beneficiaries?
The following discussion highlights several of the key Medicare provisions in the ACA and assesses how repeal of these provisions could affect Medicare spending and beneficiaries.2
Payments to Health Care Providers
The ACA reduced updates in Medicare payment levels to hospitals, skilled nursing facilities, hospice and home health providers, and other health care providers. The ACA also reduced Medicare Disproportionate Share Hospital (DSH) payments that help to compensate hospitals for providing care to low-income and uninsured patients, with the expectation that hospitals would have fewer uninsured patients as a result of the ACA’s coverage expansions.
Repealing the ACA’s sustained reductions in provider payments would be expected to:
Increase Part A and Part B spending. CBO has estimated that roughly $350 billion3 of the total $802 billion in higher Medicare spending over 10 years could result from repealing ACA provisions that changed provider payment rates in traditional Medicare. Repealing these provisions would increase payments to providers in traditional Medicare. Additionally, some hospitals would receive higher DSH payments, if these payments were restored to their pre-ACA levels.
Increase the Part A deductible and copayments and the Part B premium and deductible paid by beneficiaries. The Part A deductible and copayments would be expected to increase due to an increase in Part A spending that would likely occur if payment reductions are repealed. This is because the Part A deductible for inpatient hospital stays is indexed to updates in hospital payments, and the copayment amounts for inpatient hospital and skilled nursing facility stays are calculated as a percentage of the Part A deductible. Similarly, the Part B premium and deductible would be expected to increase if payments to Part B service providers are restored. This is because Part B premiums are set to cover 25 percent of Part B spending, and the Part B deductible is indexed to rise at the same rate as the Part B premium.
Payments to Medicare Advantage Plans
Prior to the ACA, federal payments to Medicare Advantage plans per enrollee were 14 percent higher than the cost of covering similar beneficiaries under the traditional Medicare program, according to the Medicare Payment Advisory Commission (MedPAC).4 The ACA reduced payments to Medicare Advantage plans over six years, which brought these payments closer to the average costs of care under the traditional Medicare program. In 2016, federal payments to plans were 2 percent higher than traditional Medicare spending (including quality-based bonus payments to plans).5
Repealing the ACA’s Medicare Advantage payment changes would be expected to:
Increase total Medicare spending as a result of increasing payments to Medicare Advantage plans relative to spending under traditional Medicare. CBO has estimated that repealing the Medicare Advantage-related provisions in the ACA would increase Medicare spending by roughly $350 billion6 (out of the $802 billion total increase) over 10 years.
Increase the Part B premium and deductible paid by beneficiaries. The Part B premium and deductible would likely increase if the payment reductions for Medicare Advantage plans are repealed because the Part B premium is set to cover 25 percent of Part B spending, and the Part B deductible is indexed to rise at the same rate as the Part B premium.
Improve benefits and lower out-of-pocket costs for beneficiaries enrolled in Medicare Advantage plans. Payments that Medicare Advantage plans receive in excess of their costs to provide Part A and Part B benefits are required to be used to provide benefits not covered by traditional Medicare, to reduce cost sharing, premiums, or limits on out-of-pocket spending, or both. Thus, if the ACA’s reductions in Medicare Advantage plan payments were repealed, plans could provide extra benefits to Medicare Advantage enrollees and/or reduce enrollees’ costs.
Medicare Benefit Improvements
The ACA included provisions to improve Medicare benefits by providing free coverage for some preventive benefits, such as screenings for breast and colorectal cancer, cardiovascular disease, and diabetes, and closing the coverage gap (or “doughnut hole”) in the Part D drug benefit by 2020. These benefit improvements increased Medicare Part B and Part D spending.
Repealing the ACA’s Medicare benefit improvements would be expected to:
Reduce Medicare Part B spending for preventive services and reduce Part D spending on costs in the coverage gap.
Increase beneficiary cost sharing for Part B preventive benefits.
Increase beneficiary cost sharing by Part D enrollees who have drug spending high enough to reach the coverage gap. According to MedPAC, in 2013, roughly 25 percent of the 37.8 million Part D enrollees (or around 9 million beneficiaries) had drug spending high enough to reach the coverage gap.7 ,8
Reduce Part D premiums, on average, since Part D premiums are set to cover 25.5 percent of program costs, and reinstating the Part D coverage gap would lower Part D spending.
Revenues to the Medicare Trust Funds
The ACA established new sources of revenue dedicated to the Medicare program, including a 0.9 percentage point increase in the Medicare Part A payroll tax on earnings of higher-income workers (incomes more than $200,000/individual and $250,000/couple), and a fee on the manufacturers and importers of branded drugs, which has generated additional revenue for the Part B trust fund, including $3 billion in 2015 alone.9
Repealing the ACA’s Medicare revenue provisions would be expected to:
Reduce revenues to Medicare’s Part A and Part B trust funds.
Reduce Part A payroll taxes for Medicare beneficiaries (and other taxpayers) with earnings greater than $200,000/individual or $250,000/couple.
Medicare Part B and Part D Premiums for Higher-Income Beneficiaries
The ACA froze the income thresholds for the Part B income-related premium beginning at $85,000/individual and $170,000/couple through 2019, which subjected a larger share of Medicare beneficiaries to the higher Part B income-related premium over time.10 The law also added a new surcharge to Part D premiums for higher-income enrollees, using the same income thresholds as Part B premiums.
Repealing the ACA’s income-related premium provisions would be expected to:
Reduce the number of higher-income Part B enrollees paying income-related premiums.
Reduce Part D premiums for beneficiaries with incomes above $85,000/individual and $170,000/couple.
Payment and Delivery System Reforms and New Quality Incentives
Through a new Center for Medicare & Medicaid Innovation (CMMI, or Innovation Center) within the Centers for Medicare & Medicaid Services (CMS), the ACA directed CMS to test and implement new approaches for Medicare to pay doctors, hospitals, and other providers to bring about changes in how providers organize and deliver care. The ACA authorized the Secretary of Health and Human Services to expand CMMI models into Medicare if evaluation results showed that they either reduced spending without harming the quality of care or improved the quality of care without increasing spending. CMMI received an initial appropriation of $10 billion in 2010 for payment and delivery system reform model development and evaluation, and the ACA called for additional appropriations of $10 billion in each decade beginning in 2020.
The ACA also created incentives for hospitals to reduce preventable readmissions and hospital-acquired conditions, and established new accountable care organizations (ACO) programs. Research has shown declines in Medicare patient readmissions since the Hospital Readmission Penalty Program provisions were introduced.
Repealing these ACA’s payment and delivery system reform provisions would be expected to:
Increase Medicare spending due to elimination of CMMI and other quality incentive programs. On net, CBO has estimated that CMMI’s operations will generate savings of $34 billion over the 2017-2026 period, with gross savings of $45 billion over this period. These savings are attributed to the expansion of successful payment and delivery system reform models into Medicare. In addition to eliminating the savings generated from CMMI, Medicare spending could also increase if the incentives to reduce preventable readmissions and hospital-acquired conditions are included in proposals to repeal and replace the ACA.
Independent Payment Advisory Board
The ACA authorized a new Independent Payment Advisory Board (IPAB), a 15-member board that is required to recommend Medicare spending reductions to Congress if projected spending growth exceeds specified target levels, with the recommendations taking effect according to a process outlined in the ACA. To date, no members have been appointed to the Board. Many policymakers have expressed opposition to IPAB, and there have been several legislative attempts to eliminate it. The CMS Office of the Actuary has estimated that the IPAB process will first be triggered in 2017, based on its most recent Medicare spending growth rate projections.11
Repealing IPAB would be expected to:
Increase Medicare spending over time, in the absence of the Board’s cost-reducing actions. CBO projects Medicare savings of $8 billion as a result of the IPAB process between 2019 and 2026.12
How would ACA repeal affect the solvency of the Medicare Hospital Insurance trust fund?
Fully repealing the ACA would accelerate the projected insolvency of the Medicare Hospital Insurance (HI) trust fund, out of which Part A benefits are paid. This would result from higher spending for Part A services due to higher payments to Part A service providers (such as hospitals) and Medicare Advantage plans for services provided under Part A, along with reduced revenues, if the additional 0.9 percent payroll tax on high earners is repealed. As a result, Medicare would not be able to fulfill its obligation to pay for all Part A-covered benefits within a shorter period of time if the ACA is repealed than if the law is retained.
Prior to enactment of the ACA in 2010, the Medicare Trustees projected that the Part A trust fund would not have sufficient funds to pay all Part A benefits beginning in 2017. Following enactment of the law, the insolvency date was extended. The current insolvency date is projected to be 2028. Repealing the ACA is expected to push up the insolvency date.
Discussion
The Medicare provisions of the ACA have played an important role in strengthening Medicare’s financial status for the future, while offsetting some of the cost of the coverage expansions of the ACA and also providing some additional benefits to people with Medicare. Savings were achieved in part by reducing payments to providers, such as hospitals and skilled nursing facilities. Medicare provider payment changes in the ACA were adopted in conjunction with the ACA’s insurance coverage expansions, with the expectation that additional revenue from newly-insured Americans would offset lower revenue from Medicare payments. In addition, Medicare savings were achieved through lower payments to Medicare Advantage plans.
Congressional action to repeal the ACA appears imminent, but it is not yet clear whether Congress will repeal the ACA in its entirety or keep certain provisions in place. Previous Congressional proposals have taken different approaches. For example, the House Budget Resolution for Fiscal Year 2017, introduced by Chairman Price in March 2016, proposed a full repeal of the ACA. The House Republican plan, “A Better Way,” introduced by Speaker Ryan in June 2016, proposed to repeal some of the ACA’s Medicare Advantage payment changes, along with repealing IPAB and CMMI, the additional Medicare payroll tax on high earners, and certain other tax and revenue provisions, but appears to retain other Medicare provisions, including changes to provider payment updates and the benefit improvements.13
A majority of Americans have expressed support for some of the ACA provisions that affect Medicare, including the elimination of out-of-pocket costs for many preventive services, closing the Part D coverage gap, and the higher Medicare payroll tax for higher-income workers.14 Some industry stakeholders have expressed concern about the implications of retaining the ACA’s savings provisions, yet repealing the ACA’s coverage expansions.
Aside from uncertainty about whether any of the ACA’s Medicare provisions will be retained, questions have arisen as to what changes policymakers could advance through the legislative process known as “reconciliation.” Policymakers are considering repealing the ACA as part of budget reconciliation legislation, which requires only a simple majority in the Senate to pass. Senate rules (the so-called “Byrd Rule”) limit the scope of reconciliation legislation to provisions with budgetary effects, including spending and revenues. Most of the Medicare provisions in the ACA have budgetary effects, according to CBO, so would likely be considered in order in the context of a reconciliation bill.
As a result of the Medicare provisions included in the ACA, Medicare spending per beneficiary has grown more slowly than private health insurance spending; premiums and cost-sharing for many Medicare-covered services are lower than they would have been without the ACA; new payment and delivery system reforms are being developed and tested; and the Medicare Part A trust fund has gained additional years of solvency. Full repeal of the Medicare provisions in the ACA would increase payments to hospitals and other health care providers and Medicare Advantage plans, which would likely lead to higher premiums, deductibles, and cost sharing for Medicare-covered services paid by people with Medicare. Full repeal would also reduce premiums for higher-income beneficiaries, and reduce payroll tax contributions from beneficiaries (and other taxpayers) with high earnings. Repealing the ACA would have uncertain effects on evolving payment and delivery system reforms. Partial repeal of the law could also have implications for Medicare spending, the Part A trust fund solvency date, and beneficiaries’ costs. Policymakers who seek to repeal the ACA may need to address the implications for Medicare, beneficiaries, and other stakeholders.
Endnotes
Congressional Budget Office, “Budgetary and Economic Effects of Repealing the Affordable Care Act,” June 2015, available at https://www.cbo.gov/publication/50252. ↩︎
This discussion does not include the ACA provision to eliminate the tax deductibility of the 28 percent federal subsidy, known as the retiree drug subsidy (RDS), for employers who provide creditable prescription drug coverage to Medicare beneficiaries. Repealing this provision would not have a direct effect on Medicare spending but, in allowing for the tax deductibility of RDS payments, would be accounted for as a federal tax expenditure. ↩︎
This $350 billion estimate is calculated from CBO’s statement that roughly one-half of the net increase in direct spending ($715 billion, between 2016 and 2025) would stem from repealing provisions that changed payment rates in the fee-for service sector. Congressional Budget Office, “Budgetary and Economic Effects of Repealing the Affordable Care Act,” June 2015, available at https://www.cbo.gov/publication/50252. ↩︎
This $350 billion estimate is calculated from CBO’s statement that roughly one-half of the net increase in direct spending ($715 billion, between 2016 and 2025) would stem from repealing provisions that changed the rules for setting payment rates for Medicare Advantage plans. Congressional Budget Office, “Budgetary and Economic Effects of Repealing the Affordable Care Act,” June 2015, available at https://www.cbo.gov/publication/50252. ↩︎
According to CMS estimates, more than 11 million Medicare Part D enrollees have received a total of $23.5 billion in savings and discounts in the coverage gap since the enactment of the ACA, with savings averaging $2,127 per enrollee over five years. See Centers for Medicare & Medicaid Services, “Medicare Advantage Premiums Remain Stable in 2017; Beneficiaries Have Saved over $23.5 Billion on Prescription Drugs,” September 22, 2016, available at https://www.cms.gov/Newsroom/MediaReleaseDatabase/Press-releases/2016-Press-releases-items/2016-09-22.html. ↩︎
The Part B income-related premium was established by the Medicare Modernization Act of 2003 and took effect in 2007. The Medicare Access and CHIP Reauthorization Act of 2015 (MACRA) made further changes to Medicare’s income-related premiums requiring beneficiaries with incomes above $133,500 ($267,000 for married couples) to pay a larger percentage of Part B and Part D program costs than they currently pay, beginning in 2018. MACRA also included a provision to index the thresholds to inflation based on their levels in 2019. ↩︎
As Republican policymakers consider how to repeal and replace the Affordable Care Act (ACA), they are likely to face a number of decisions about whether to retain any of the law’s changes to Medicare. Repealing the ACA has potential implications for Medicare spending, beneficiaries, and other stakeholders, according to a new Kaiser Family Foundation brief.
A full repeal of the ACA would undo all of the law’s changes to Medicare and would increase Medicare spending, primarily by restoring higher payments to health care providers and Medicare Advantage plans. The increase in Medicare spending would likely lead to higher Medicare premiums, deductibles, and cost sharing for beneficiaries, and accelerate the insolvency of the Medicare Part A trust fund. It also would eliminate coverage in the “doughnut hole” of the Medicare Part D drug benefit, a coverage gap that is closing by 2020 under the ACA.
Full repeal of the Medicare provisions in the ACA would increase Medicare spending by $802 billion from 2016 to 2025, according to the Congressional Budget Office.
Ever since the Affordable Care Act became law, critics have warned that it would cause a “death spiral” in the individual health insurance market. Those fears were unfounded, but if Republicans in Congress repeal the ACA without immediately replacing it, they might just cause one.
The ACA prohibits insurers from denying access to coverage based on pre-existing conditions and also prohibits them from charging different premiums to individuals based on their health. Everyone is in one big insurance pool, sharing in the average cost. Critics worry that in such a system, people who are sick buy coverage because they know they need it, but healthy people hold out, raising the average cost of doing business for insurers and leading them to raise premiums on everyone. That, in turn, could cause yet more healthy people to drop insurance because they no longer see it as a good value, again requiring insurers to increase premiums, and so on, resulting in a death spiral.
To prevent this from happening, the ACA encourages healthy people to get insurance through a carrot (premium subsidies for low- and middle-income people) and a stick (the so-called individual mandate, which generally requires people to be insured or pay a penalty).
It hasn’t worked out perfectly, with more sick people enrolled than insurers expected when they initially set their premiums in 2014. That’s a big reason why premiums are rising more quickly for 2017 — with benchmarks increasing 22% on average nationally and 8% in California. Some insurers have exited the market, and Obamacare consumers face fewer choices. But the hope is that these higher premiums represent a one-time market correction rather than a sign of worsening trends to come.
Of course, the election of Donald Trump and continued Republican control of Congress have put the future of the ACA itself in doubt. Republicans have consistently promised to repeal and replace the health law, and they now have the ability to fulfill that promise — though, according to recent news reports, they will seek to repeal the law before they figure out how to replace it.
Judging from the GOP’s strategy during the Obama administration (when it was understood that the president would veto any legislation that hurt his signature law), Republicans may use a budget maneuver known as a reconciliation bill to repeal major parts of the ACA. The advantage of such a bill is that it cannot be filibustered in the Senate, meaning it can be passed with 51 votes instead of 60. The disadvantage is that it can be used only to make changes that have a direct effect on federal spending or taxes. So, for example, a reconciliation bill cannot repeal the ACA’s insurance market regulations, including protections for people with pre-existing conditions. But it can repeal the law’s premium subsidies and the individual mandate.
If that’s what GOP lawmakers decide to do — as many informed observers suspect they will — there’s a high likelihood that they would, in fact, produce a death spiral. With guaranteed insurance for people with pre-existing conditions but no subsidies or individual mandate, premiums could skyrocket. Or, more likely, insurers simply would exit the market. Why risk losses when the whole law is getting repealed anyway? The upshot would be canceled coverage with no other options for people buying in the ACA’s marketplaces (like healthcare.gov or Covered California), as well as those buying directly from insurers, where the same rules apply.
Even if the GOP eliminates only the individual mandate — while leaving other aspects of the ACA in place for a period of time — this could happen very quickly.
But there are ways to avoid this potential chaos.
One approach would be to hold off on voting to repeal the ACA until the Republicans settle on a replacement. That could put Republicans in a difficult position because they have promised to repeal the ACA quickly and have not yet reached consensus on an alternative.
Another approach would be to leave the individual mandate in place and extend temporary mechanisms included in the ACA to stabilize the insurance market, providing subsidies to insurance companies that enroll high-cost patients and those that experience financial losses. This approach, too, poses political challenges because Republicans strongly oppose the individual mandate and some have opposed the ACA’s stabilization mechanisms as a “bailout” of insurers.
President-elect Trump said recently that he wanted to keep the ACA’s prohibition against denying coverage for people with pre-existing conditions. It’s understandable that Republicans would want to keep the popular stuff in the ACA while getting rid of the unpopular stuff (the individual mandate and increased taxes). Unfortunately, there’s no magic pixie dust to make that easy or avoid difficult trade-offs.
A new Kaiser Family Foundation analysis finds that 52 million adults under 65 – or 27 percent of that population — have pre-existing health conditions that would likely make them uninsurable if they applied for health coverage under medical underwriting practices that existed in most states before insurance regulation changes made by the Affordable Care Act.
In eleven states, at least three in ten non-elderly adults would have a declinable condition, according to the analysis: West Virginia (36%), Mississippi (34%), Kentucky (33%), Alabama (33%), Arkansas (32%), Tennessee (32%), Oklahoma (31%), Louisiana (30%), Missouri (30%), Indiana (30%) and Kansas (30%).
States with the most people estimated to have the conditions include: California (5,865,000), Texas (4,536,000), and Florida (3,116,000).
Using data from two large government surveys, the analysis estimates the total number of nonelderly adults in each state with a health condition that could lead to a denial of coverage in the individual insurance market, based on pre-ACA field underwriting guides for brokers and agents. The results are conservative because the data don’t include some declinable conditions. The estimates also don’t include the number of people with other health conditions that wouldn’t necessarily cause a denial, but could lead to higher insurance costs based on underwriting.
While most people with pre-existing health conditions have coverage through an employer or public program, such as Medicaid, they may intermittently seek insurance in the individual market during times when they’re ineligible for other coverage, such as following a job loss or divorce. People who are self-employed, early retirees, or lower-wage workers in jobs that don’t provide health benefits often are covered by individual plans for longer periods.
Before ACA protections took effect in 2014, private insurers in the individual health insurance market could use applicants’ health status, health history and other risk factors to determine whether and under what terms to issue coverage. Some examples of conditions which could have led to automatic denial of coverage include cancer, diabetes, epilepsy, heart disease, and pregnancy.
In the post-election health policy debate, both political parties have expressed a desire to continue protecting people with pre-existing conditions.
UPDATE: An updated version of this analysis based on 2018 data is now available. It includes estimates for non-elderly adults and households, with some breakouts by state, age and gender.
Before private insurance market rules in the Affordable Care Act (ACA) took effect in 2014, health insurance sold in the individual market in most states was medically underwritten.1 That means insurers evaluated the health status, health history, and other risk factors of applicants to determine whether and under what terms to issue coverage. To what extent people with pre-existing health conditions are protected is likely to be a central issue in the debate over repealing and replacing the ACA.
This brief reviews medical underwriting practices by private insurers in the individual health insurance market prior to 2014, and estimates how many American adults could face difficulty obtaining private individual market insurance if the ACA were repealed or amended and such practices resumed. We examine data from two large government surveys: The National Health Interview Survey (NHIS) and the Behavioral Risk Factor Surveillance System (BRFSS), both of which can be used to estimate rates of various health conditions (NHIS at the national level and BRFSS at the state level). We consulted field underwriting manuals used in the individual market prior to passage of the ACA as a reference for commonly declinable conditions.
Estimates of the Share of Adults with Pre-Existing Conditions
We estimate that 27% of adult Americans under the age of 65 have health conditions that would likely leave them uninsurable if they applied for individual market coverage under pre-ACA underwriting practices that existed in nearly all states. While a large share of this group has coverage through an employer or public coverage where they do not face medical underwriting, these estimates quantify how many people could be ineligible for individual market insurance under pre-ACA practices if they were to ever lose this coverage. This is a conservative estimate as these surveys do not include sufficient detail on several conditions that would have been declinable before the ACA (such as HIV/AIDS, or hepatitis C). Additionally, millions more have other conditions that could be either declinable by some insurers based on their pre-ACA underwriting guidelines or grounds for higher premiums, exclusions, or limitations under pre-ACA underwriting practices. In a separate Kaiser Family Foundation poll, most people (53%) report that they or someone in their household has a pre-existing condition.
A larger share of nonelderly women (30%) than men (24%) have declinable preexisting conditions. We estimate that 22.8 million nonelderly men have a preexisting condition that would have left them uninsurable in the individual market pre-ACA, compared to 29.4 million women. Pregnancy explains part, but not all of the difference.
The rates of declinable pre-existing conditions vary from state to state. On the low end, in Colorado and Minnesota, at least 22% of non-elderly adults have conditions that would likely be declinable if they were to seek coverage in the individual market under pre-ACA underwriting practices. Rates are higher in other states – particularly in the South – such as Tennessee (32%), Arkansas (32%), Alabama (33%), Kentucky (33%), Mississippi (34%), and West Virginia (36%), where at least a third of the non-elderly population would have declinable conditions.
Table 1: Estimated Number and Percent of Non-Elderly People with Declinable Pre-existing Conditions Under Pre-ACA Practices, 2015
State
Percent of Non-Elderly Population
Number of Non-Elderly Adults
Alabama
33%
942,000
Alaska
23%
107,000
Arizona
26%
1,043,000
Arkansas
32%
556,000
California
24%
5,865,000
Colorado
22%
753,000
Connecticut
24%
522,000
Delaware
29%
163,000
District of Columbia
23%
106,000
Florida
26%
3,116,000
Georgia
29%
1,791,000
Hawaii
24%
209,000
Idaho
25%
238,000
Illinois
26%
2,038,000
Indiana
30%
1,175,000
Iowa
24%
448,000
Kansas
30%
504,000
Kentucky
33%
881,000
Louisiana
30%
849,000
Maine
29%
229,000
Maryland
26%
975,000
Massachusetts
24%
999,000
Michigan
28%
1,687,000
Minnesota
22%
744,000
Mississippi
34%
595,000
Missouri
30%
1,090,000
Montana
25%
152,000
Nebraska
25%
275,000
Nevada
25%
439,000
New Hampshire
24%
201,000
New Jersey
23%
1,234,000
New Mexico
27%
332,000
New York
25%
3,031,000
North Carolina
27%
1,658,000
North Dakota
24%
111,000
Ohio
28%
1,919,000
Oklahoma
31%
706,000
Oregon
27%
654,000
Pennsylvania
27%
2,045,000
Rhode Island
25%
164,000
South Carolina
28%
822,000
South Dakota
25%
126,000
Tennessee
32%
1,265,000
Texas
27%
4,536,000
Utah
23%
391,000
Vermont
25%
96,000
Virginia
26%
1,344,000
Washington
25%
1,095,000
West Virginia
36%
392,000
Wisconsin
25%
852,000
Wyoming
27%
94,000
US
27%
52,240,000
SOURCE: Kaiser Family Foundation analysis of data from National Health Interview Survey and the Behavioral Risk Factor Surveillance System.NOTE: Five states (MA, ME, NJ, NY, VT) had broadly applicable guaranteed access to insurance before the ACA. What protections might exist in these or other states under a repeal and replace scenario is unclear.
At any given time, the vast majority of these approximately 52 million people with declinable pre-existing conditions have coverage through an employer or through public programs like Medicaid. The individual market is where people seek health insurance during times in their lives when they lack eligibility for job-based coverage or for public programs such as Medicare and Medicaid. In 2015, about 8% of the non-elderly population had individual market insurance. Over a several-year period, however, a much larger share may seek individual market coverage.2 This market is characterized by churn, as new enrollees join and others leave (often for other forms of coverage). For many people, the need for individual market coverage is intermittent, for example, following a 26th birthday, job loss, or divorce that ends eligibility for group plan coverage, until they again become eligible for group or public coverage. For others – the self-employed, early retirees, and lower-wage workers in jobs that typically don’t come with health benefits – the need for individual market coverage is ongoing. (Figure 1 shows the distribution of employment status among current individual market enrollees.)
Prior to the ACA’s coverage expansions, we estimated that 18% of individual market applications were denied. This is an underestimate of the impact of medical underwriting because many people with health conditions did not apply because they knew or were informed by an agent that they would not be accepted. Denial rates ranged from 0% in a handful of states with guaranteed issue to 33% in Kentucky, North Carolina, and Ohio. According to 2008 data from America’s Health Insurance Plans, denial rates ranged from about 5% for children to 29% for adults age 60-64 (again, not accounting for those who did not apply).
Figure 1: Employment Status of Non-Group Enrollees, 2016
Medical Underwriting in the Individual Market Pre-ACA
Prior to 2014 medical underwriting was permitted in the individual insurance market in 45 states and DC. Applications for individual market policies typically included lengthy questionnaires about the health and risk status of the applicant and all family members to be covered. Typically, applicants were asked to disclose whether they were pregnant or contemplating pregnancy or adoption, and information about all physician visits, prescription medications, lab results, and other medical care received in the past year. In addition, applications asked about personal history of a series of health conditions, ranging from HIV, cancer, and heart disease to hemorrhoids, ear infections and tonsillitis. Finally, all applications included authorization for the insurer to obtain and review all medical records, pharmacy database information, and related information.
Once the completed application was submitted, the medical underwriting process varied somewhat across insurers, but usually involved identification of declinable medical conditions and evaluation of other conditions or risk factors that warranted other adverse underwriting actions. Once enrolled, a person’s health and risk status was sometimes reconsidered in a process called post-claims underwriting. Although our analysis focuses on declinable medication conditions, each of these other actions is described in more detail below.
Declinable Medical Conditions
Before the ACA, individual market insurers in all but five states maintained lists of so-called declinable medical conditions. People with a current or past diagnosis of one or more listed conditions were automatically denied. Insurer lists varied somewhat from company to company, though with substantial overlap. Some of the commonly listed conditions are shown in Table 2.
Table 2: Examples of Declinable Conditions In the Medically Underwritten Individual Market, Before the Affordable Care Act
Condition
Condition
AIDS/HIV
Lupus
Alcohol abuse/ Drug abuse with recent treatment
Mental disorders (severe, e.g. bipolar, eating disorder)
Alzheimer’s/dementia
Multiple sclerosis
Arthritis (rheumatoid), fibromyalgia, other inflammatory joint disease
Muscular dystrophy
Cancer within some period of time (e.g. 10 years, often other than basal skin cancer)
SOURCE: Kaiser Family Foundation review of field underwriting guidelines from Aetna (GA, PA, and TX), Anthem BCBS (IN, KY, and OH), Assurant, CIGNA, Coventry, Dean Health, Golden Rule, Health Care Services Corporation (BCBS in IL, TX) HealthNet, Humana, United HealthCare, Wisconsin Physician Service. Conditions in this table appeared on declinable conditions list in half or more of guides reviewed. NOTE: Many additional, less-common disorders also appearing on most of the declinable conditions lists were omitted from this table.
Our analysis of rates of pre-existing conditions in this brief focuses on those conditions that would likely be declinable, based on our review of pre-ACA underwriting documents. Our analysis is limited – and our results are conservative – because NHIS and BRFSS questionnaires do not address some of the conditions that were declinable, and in some cases the questions that do relate to declinable conditions were too broad for inclusion. See the methodology section for a list of conditions included in the analysis.
In addition to declinable conditions, many insurers also maintained a list of declinable medications. Current use of any of these medications by an applicant would warrant denial of coverage. Table 3 provides an example of medications that were declinable in one insurer prior to the ACA. Our analysis does not attempt to account for use of declinable medications.
Table 3: Declinable Medications
Anti-Arthritic Medications
Adalimumab/Humira
Cyclosporine/Sandimmune
Methotrexate/Trexall
Ustekinumab/Stelara
others
Anti-Diabetic Medications
Avandia/Rosiglitazone
Glucagon
Humalog/Insulin products
Metformin HCL
others
Medications for HIV/AIDS or Hepatitis
Abacavir/Ziagen
Efavirenz/Atripla
Interferon
Lamivudine/Epivir
Ribavirin
Zidovudine/Retrovir
others
Anti-Cancer Medications
Anastrozole/Arimidex
Nolvadex/Tamoxifen
Femara
others
Anti-Psychotics, Autism, Other Central Nervous System Medications
Abilify/Ariprazole
Aricept/Donepezil
Clozapine/Clozaril
Haldol/Haldoperidol
Lithium
Requip/Ropinerole
Risperdal/Risperidone
Zyprexa
others
Anti-Coagulant/Anti-Thrombotic Medications
Clopidogrel/Plavix
Coumadin/Warfarin
Heparin
others
Miscellaneous Medications
Anginine (angina)
Clomid (fertility)
Epoetin/Epogen (anemia)
Genotropin (growth hormone)
Remicade (arthritis, ulcerative colitis)
Xyrem (narcolepsy)
others
SOURCE: Blue Cross Blue Shield of Illinois, Product Guide for Agents
Some individual market insurers also developed lists of ineligible occupations. These were jobs considered sufficiently high risk that people so employed would be automatically denied. In addition, some would automatically deny applicants who engaged in certain leisure activities and sports. Table 4 provides an example of declinable occupations from one insurer prior to the ACA. Our analysis does not attempt to account for declinable occupations.
Table 4: Ineligible Occupations, Activities
Active military personnel
Iron workers
Professional athletes
Air traffic controller
Law enforcement/detectives
Sawmill operators
Aviation and air transportation
Loggers
Scuba divers
Blasters or explosive handlers
Meat packers/processors
Security guards
Bodyguards
Mining
Steel metal workers
Crop dusters
Nuclear industry workers
Steeplejacks
Firefighters/EMTs
Offshore drillers/workers
Strong man competitors
Hang gliding
Oil and gas exploration and drilling
Taxi cab drivers
Hazardous material handlers
Pilots
Window washers
SOURCE: Preferred One Insurance Company Individual and Family Insurance Application Form
Other Adverse Underwriting Actions
Beyond the declinable conditions, medications and occupations, underwriters also examined individual applications and medical records for other conditions that could generate significant “losses” (claims expenses.) Among such conditions were acne, allergies, anxiety, asthma, basal cell skin cancer, depression, ear infections, fractures, high cholesterol, hypertension, incontinence, joint injuries, kidney stones, menstrual irregularities, migraine headaches, overweight, restless leg syndrome, tonsillitis, urinary tract infections, varicose veins, and vertigo. One or more adverse medical underwriting actions could result for applicants with such conditions, including:
Rate-up – The applicant might be offered a policy with a surcharged premium (e.g. 150 percent of the standard rate premium that would be offered to someone in perfect health)
Exclusion rider – Coverage for treatment of the specified condition might be excluded under the policy; alternatively, the body part or system affected by the specified condition could be excluded under the policy. Exclusion riders might be temporary (for a period of years) or permanent
Increased deductible – The applicant might be offered a policy with a higher deductible than the one originally sought; the higher deductible might apply to all covered benefits or a condition-specific deductible might be applied
Modified benefits – The applicant might be offered a policy with certain benefits limited or excluded, for example, a policy that does not include prescription drug coverage.
In some cases, individuals with these conditions might also be declined depending on their health history and the insurer’s general underwriting approach. For example, field underwriting guides indicated different underwriting approaches for an applicant whose child had chronic ear infections:
One large, national insurer would issue standard coverage if the child had fewer than five infections in the past year or ear tubes, but apply a 50% rate up if there had been more than 4 infections in the prior year;
Another insurer, which used a 12-tier rate system, would issue coverage at the second most favorable rate tier if the child had just one infection in the prior year or ear tubes, at the fifth rate tier if there had been 2-3 infections during the prior year, and at the seventh tier if there had been 4 or more infections; for some conditions, this company’s rating might depend on the plan deductible – applicants with history of ear infections would be offered the second rating tier for policies with a deductible of $5,000 or higher;
Another insurer would issue standard coverage if the child had just one infection in the prior year or if ear tubes had been inserted more than one-year prior, apply a rate up if there were two infections in the prior year, and decline the application if there were three or more infections;
Another insurer would issue standard coverage if the child had fewer than 3 infections in the past year, but issue coverage with a condition specific deductible of $5,000 if there had been 3 or more infections or if ear tubes had been inserted.
In a 2000 Kaiser Family Foundation study of medical underwriting practices, insurers were asked to underwrite hypothetical applicants with varying health conditions, from seasonal allergies to situational depression to HIV. Results varied significantly for less serious conditions. For example, the applicant with seasonal allergies who made 60 applications for coverage was offered standard coverage 3 times, declined 5 times, offered policies with exclusion riders or other benefit limits 46 times (including 3 offers that excluded coverage for her upper respiratory system), and policies with premium rate ups (averaging 25%) 6 times.
Pre-existing Condition Exclusion Provisions
In addition to medical screening of applicants before coverage was issued, most individual market policies also included more general pre-existing condition exclusion provisions which limited the policy’s liability for claims (typically within the first year) related to medical conditions that could be determined to exist prior to the coverage taking effect.3
Example of pre-existing condition exclusion
Jean, an Arizona teacher whose employer provided group health benefits but did not contribute to the cost for family members, gave birth to her daughter, Alex, in 2004 and soon after applied for an individual policy to cover the baby. Due to time involved in the medical underwriting process, the baby was uninsured for about 2 weeks. A few months later, Jean noticed swelling around the baby’s face and eyes. A specialist diagnosed Alex with a rare congenital disorder that prematurely fused the bones of her skull. Surgery was needed immediately to avoid permanent brain damage. When Jean sought prior-authorization for the $90,000 procedure, the insurer said it would not be covered. Under Arizona law, any condition, including congenital conditions, that existed prior to the coverage effective date, could be considered a pre-existing condition under individual market policies. Alex’s policy excluded coverage for pre-existing conditions for one year. Jean appealed to the state insurance regulator who upheld the insurer’s exclusion as consistent with state law.
The nature of pre-existing condition exclusion clauses varied depending on state law. In 19 states, a health condition could only be considered pre-existing if the individual had actually received treatment or medical advice for the condition during a “lookback” period prior to the coverage effective date (from 6 months to 5 years). In most states, a pre-existing condition could also include one that had not been diagnosed but that produced signs or symptoms that would prompt an “ordinarily prudent person” to seek medical advice, diagnosis or treatment. In 8 states and DC, conditions that existed prior to the coverage effective date – including those that were undiagnosed and asymptomatic – could be considered pre-existing and so excluded from coverage under an individual market policy. For example, a congenital condition in a newborn could be considered pre-existing to the coverage effective date (the baby’s birth date) and excluded from coverage. About half of the states required individual market insurers to reduce pre-existing condition exclusion periods by the number of months of an enrollee’s prior coverage.
Example of policy rescission
Jennifer, a Colorado preschool teacher, was seriously injured in 2005 when her car was hit by a drug dealer fleeing the police. She required months of inpatient hospitalization and rehab, and her bills reached $185,000. Jennifer was covered by a non-group policy which she had purchased five months prior to the accident. Shortly after her claims were submitted, the insurer re-reviewed Jennifer’s application and medical history. Following its investigation, the insurer notified Jennifer they found records of medical care she had not disclosed in her application, including medical advice sought for discomfort from a prolapsed uterus and an ER visit for shortness of breath. The insurer rescinded the policy citing Jennifer’s failure to disclose this history. Jennifer sued the insurer for bad faith; four years later a jury ordered the insurer to reinstate the policy and pay $37 million in damages.
Unlike exclusion riders that limited coverage for a specified condition of a specific enrollee, pre-existing condition clauses were general in nature and could affect coverage for any applicable condition of any enrollee. Pre-existing condition exclusions were typically invoked following a process called post-claims underwriting. If a policyholder would submit a claim for an expensive service or condition during the first year of coverage, the individual market insurer would conduct an investigation to determine whether the condition could be classified as pre-existing.
In some cases, post-claims underwriting might also result in coverage being cancelled. The investigations would also examine patient records for evidence that a pre-existing condition was known to the patient and should have been disclosed on the application. In such cases, instead of invoking the pre-existing condition clause, an issuer might act to rescind the policy, arguing it would have not issued coverage in the first place had the pre-existing condition been disclosed.
Discussion
The Affordable Care Act guarantees access to health insurance in the individual market and ends other underwriting practices that left many people with pre-existing conditions uninsured or with limited coverage before the law. As discussions get underway to repeal and replace the ACA, this analysis quantifies the number of adults who would be at risk of being denied if they were to seek coverage in the individual market under pre-ACA rules. What types of protections are preserved for people with pre-existing conditions will be a key element in the debate over repealing and replacing the ACA.
We estimate that at least 52 million non-elderly adult Americans (27% of those under the age of 65) have a health condition that would leave them uninsurable under medical underwriting practices used in the vast majority of state individual markets prior to the ACA. Results vary from state-to-state, with rates ranging around 22 – 23% in some Northern and Western states to 33% or more in some southern states. Our estimates are conservative and do not account for a number of conditions that were often declinable (but for which data are not available), nor do our estimates account for declinable medications, declinable occupations, and conditions that could lead to other adverse underwriting practices (such as higher premiums or exclusions).
While most people with pre-existing conditions have employer or public coverage at any given time, many people seek individual market coverage at some point in their lives, such as when they are between jobs, retired, or self-employed.
There is bipartisan desire to protect people with pre-existing conditions, but the details of replacement plans have yet to be ironed out, and those details will shape how accessible insurance is for people when they have health conditions.
Gary Claxton, Cynthia Cox, Larry Levitt, and Karen Pollitz are with the Kaiser Family Foundation. Anthony Damico is an independent consultant to the Kaiser Family Foundation.
Methods
To calculate nationwide prevalence rates of declinable health conditions, we reviewed the survey responses of nonelderly adults for all question items shown in Methods Table 1 using the CDC’s 2015 National Health Interview Survey (NHIS). Approximately 27% of 18-64 year olds, or 52 million nonelderly adults, reported having at least one of these declinable conditions in response to the 2015 survey. The CDC’s National Center for Health Statistics (NCHS) relies on the medical condition modules of the annual NHIS for many of its core publications on the topic; therefore, we consider this survey to be the most accurate means to estimate both the nationwide rate and weighted population.
Since the NHIS does not include state identifiers nor sufficient sample size for most state-based estimates, we constructed a regression model for the CDC’s 2015 Behavioral Risk Factor Surveillance System (BRFSS) to estimate the prevalence of any of the declinable conditions shown in Methods Table 1 at the state level. This model relied on three highly significant predictors: (a) respondent age; (b) self-reported fair or poor health status; (c) self-report of any of the overlapping variables shown in the left-hand column of Methods Table 1. Across the two data sets, the prevalence rate calculated using the analogous questions (i.e. the left-hand column of Methods Table 1) lined up closely, with 20% of 18-64 year old survey respondents reporting at least one of those declinable conditions in the 2015 NHIS and 21% of 18-64 year olds in the 2015 BRFSS. Applying this prediction model directly to the 2015 BRFSS microdata yielded a nationwide prevalence of any declinable condition of 28%, a near match to the NHIS nationwide estimate of 27%.
Methods Table 1: Declinable Medical Conditions Available in Survey Microdata
Declinable Condition Questions Available in both the 2015 National Health Interview Survey and also the 2015 Behavioral Risk Factor Surveillance System
Declinable Condition Questions Available in only the 2015 National Health Interview Survey
Ever had CHD
Melanoma Skin Cancer
Ever had Angina
Any Other Heart Condition
Ever had Heart Attack
Crohn’s Disease or Ulcerative Colitis
Ever had Stroke
Epilepsy
Ever had COPD
Difficulty Due to Mental Retardation
Ever had Emphysema
Difficulty Due to Cerebral Palsy
Chronic Bronchitis in past 12 months
Difficulty Due to Senility
Ever had Non-Skin Cancer
Difficulty Due to Depression
Ever had Diabetes
Difficulty Due to Endocrine Problem
Weak or Failing Kidneys
Difficulty Due to Blood Forming Organ Problem
BMI > 40
Difficulty Due to Drug / Alcohol / Substance Abuse
Pregnant
Difficulty Due to Schizophrenia, ADD, or Bipolar Disorder
In order to align BRFSS to NHIS overall statistics, we then applied a Generalized Regression Estimator (GREG) to scale down the BRFSS microdata’s prevalence rate and population estimate to the equivalent estimates from NHIS, 27% and 52 million. Since the regression described in the previous paragraph already predicted the prevalence rate of declinable conditions in BRFSS by using survey variables shared across the two datasets, this secondary calibration solely served to produce a more conservative estimate of declinable conditions by calibrating BRFSS estimates to the NHIS. After applying this calibration, we calculated state-specific prevalence rates and population estimates off of this post-stratified BRFSS sample.
The programming code, written using the statistical computing package R v.3.3.2, is available upon request for people interested in replicating this approach for their own analysis.
Endnotes
In 2013, five states – Maine, Massachusetts, New Jersey, New York, and Vermont – required all non-group health insurance policies to be offered on a guaranteed issue basis (meaning applicants could not be denied based on health status) with community rating (meaning premiums could not vary based on health status). ↩︎
Under the Health Insurance Portability and Accountability Act of 1996 (HIPAA), eligible individuals who had at least 18 months of continuous prior coverage, who were leaving group health plan coverage, and who met other requirements, had to be offered non-group policies on a guaranteed issue basis with no pre-existing condition exclusions. HIPAA gave insurers flexibility to limit the number of guaranteed issue policies to two. In addition, HIPAA gave states flexibility to offer eligible individuals an alternative source of individual market coverage, such as high-risk pool coverage, which most states elected to do. See Kaiser Family Foundation State Health Facts.
↩︎
As the nation struggles with an ongoing epidemic of prescription painkiller abuse, misuse, and overdoses, a new Washington Post/Kaiser Family Foundation survey finds that one in three (34%) of those who recently used such drugs for at least two months report being addicted or dependent.
Most long-term users are battling significant health problems, including seven in ten who say they have a debilitating disability or chronic disease. Almost all (98%) long-term painkiller users cite relieving pain as a reason for using the medications, but some also report other reasons:
One third (34%) say they take the painkillers for fun or to get high;
One in five (22%) say they take them to deal with day-to-day stress; and
One in ten (12%) say they take them to relax or relieve tension.
Nearly all (97%) long-term users say they started taking the painkillers through a prescription from a doctor, and most say they discussed with their doctor the possibility of addiction or dependence and alternative ways to manage pain. However, only a third (33%) say their doctor discussed a plan for getting off of the medication.
Some long-term users also report misuse of prescribed medications, including:
20 percent say that they have known or suspected that someone else was using, taking, or selling their painkillers;
17 percent report taking painkillers not prescribed for them; and
14 percent say they’ve shared their painkillers with a family member or friend.
Given the recent attention to prescription opioid abuse, two thirds (67%) of long-term users say they are concerned that efforts to reduce the number of people abusing prescription painkillers will make it harder for them to obtain their medication.
The new Post/Kaiser Survey of Long-Term Prescription Painkiller Users and Their Household Members is the 30th in a series of surveys over the past 20 years conducted as part of The Washington Post/Kaiser Family Foundation Survey Project. The poll was conducted by cellular and landline telephone October 3 – November 9, 2016, among a random national sample of 809 adults age 18 and older who they themselves (n=622), or a household member (n=187) have taken strong prescription painkillers for a period of two months or more at some time in the past two years other than to treat pain from cancer or terminal illness. The margin of sampling error is plus or minus 4 percentage points for the full survey and plus or minus 5 percentage points for those personally taking prescription painkillers long-term. A report with full survey results is available on the Foundation’s website. The Washington Post articles on the survey findings are available at washingtonpost.com. The survey was designed and analyzed jointly by researchers at Kaiser and The Washington Post.