The Effects of Premiums and Cost Sharing on Low-Income Populations: Updated Review of Research Findings

Authors: Samantha Artiga, Petry Ubri, and Julia Zur
Published: Jun 1, 2017

Issue Brief

Key Findings

Recently, there has been increased interest at the federal and state level to expand the use of premiums and cost sharing in Medicaid as a way to promote personal responsibility, prepare beneficiaries to transition to commercial and private insurance, and support consumers in making value-conscious health decisions. This brief reviews research from 65 papers published between 2000 and March 2017 on the effects of premiums and cost sharing on low-income populations in Medicaid and CHIP. This research has primarily focused on how premiums and cost sharing affect coverage and access to and use of care; some studies also have examined effects on safety net providers and state savings. The effects on individuals, providers, and state costs reflect varied implementation of premiums and cost sharing across states as well as differing premium and cost sharing amounts. Together, the research finds:

  • Premiums serve as a barrier to obtaining and maintaining Medicaid and CHIP coverage among low-income individuals. These effects are largest among those with the lowest incomes, particularly among individuals with incomes below poverty. Some individuals losing Medicaid or CHIP coverage move to other coverage, but others become uninsured, especially those with lower incomes. Individuals who become uninsured face increased barriers to accessing care, greater unmet health needs, and increased financial burdens.
  • Even relatively small levels of cost sharing in the range of $1 to $5 are associated with reduced use of care, including necessary services. Research also finds that cost sharing can result in unintended consequences, such as increased use of the emergency room, and that cost sharing negatively affects access to care and health outcomes. For example, studies find that increases in cost sharing are associated with increased rates of uncontrolled hypertension and hypercholesterolemia and reduced treatment for children with asthma. Additionally, research finds that cost sharing increases financial burdens for families, causing some to cut back on necessities or borrow money to pay for care.
  • State savings from premiums and cost sharing in Medicaid and CHIP are limited. Research shows that potential revenue gains from premiums and cost sharing are offset by increased disenrollment; increased use of more expensive services, such as emergency room care; increased costs in other areas, such as resources for uninsured individuals; and administrative expenses. Studies also show that raising premiums and cost sharing in Medicaid and CHIP increases pressures on safety net providers, such as community health centers and hospitals.

Introduction

Recently, there has been increased interest at the federal and state level to expand the use of premiums and cost sharing in Medicaid. Current rules limit premiums and cost sharing in Medicaid to facilitate access to coverage and care for the low-income population served by the program, who have limited resources to spend on out-of-pocket costs. Proponents of increasing premiums and cost sharing in Medicaid indicate that doing so will promote personal responsibility, prepare beneficiaries to transition to commercial and private insurance, and support consumers in making value-conscious health decisions.1 

This brief, which updates an earlier brief “Premiums and Cost-Sharing in Medicaid: A Review of Research Findings,” reviews research on the effects of premiums and cost sharing on low-income populations in Medicaid and CHIP. It draws on findings from 65 papers published between 2000 and March 2017, including peer-reviewed studies and freestanding reports, government reports, and white papers by research and policy organizations. This research has primarily focused on how premiums and cost sharing affect coverage and access to care; some studies also have examined effects on state savings. The effects on individuals, providers, and state costs reflect varied implementation of premiums and cost sharing across states as well as differing premium and cost sharing amounts.

Premiums and Cost Sharing in Medicaid and CHIP Today

Currently, states have options to charge premiums and cost sharing in Medicaid and CHIP that vary by income and eligibility group (Box 1). Reflecting these options, premiums and cost sharing in Medicaid and CHIP vary across states and groups. As of January 2017, 30 states charge premiums or enrollment fees and 25 states charge cost sharing for children in Medicaid or CHIP.2  Most of these charges are limited to children in CHIP since the program covers children with higher family incomes than Medicaid and has different premium and cost sharing rules. States generally do not charge premiums for parents in Medicaid, but 39 states charge cost sharing for parents and 23 of the 32 states that implemented the Affordable Care Act (ACA) Medicaid expansion to low-income adults charge cost sharing for expansion adults.3  Six states have waivers to charge premiums or monthly contributions for adults that are not otherwise allowed.4 

Box 1: Medicaid and CHIP Premium and Cost Sharing Rules

Medicaid

  • States may charge premiums for enrollees with incomes above 150% of the federal poverty level (FPL), including children and adults. Enrollees with incomes below 150% FPL may not be charged premiums.
  • States may charge cost sharing up to maximums that vary by income (Table 1). States cannot charge cost sharing for emergency, family planning, pregnancy-related services, preventive services for children, or preventive services defined as essential health benefits in Alternative Benefit Plans in Medicaid. In addition, states generally cannot charge cost sharing to children enrolled through mandatory eligibility categories. The minimum eligibility standard for children is 133% FPL, although some states have higher minimums.
  • Overall, premium and cost sharing amounts for family members enrolled in Medicaid may not exceed 5% of household income. This 5% cap is applied on a monthly or quarterly basis.

CHIP

  • States have somewhat greater flexibility to charge premiums and cost sharing for children in CHIP, although there are limits on the amounts that states can charge, including an overall cap of 5% of household income.
Table 1: Maximum Allowable Cost Sharing Amounts in Medicaid by Income
<100% FPL100% – 150% FPL>150% FPL
Outpatient Services$410% of state cost20% of state cost
Non-Emergency use of ER$8$8No limit (subject to overall 5% of household income limit)
Prescription Drugs

Preferred

Non-Preferred

$4

$8

$4

$8

$4

20% of state cost

Inpatient Services$75 per stay10% of state cost20% of state cost
Notes: Some groups and services are exempt from cost sharing, including children enrolled in Medicaid through mandatory eligibility pathways, emergency services, family planning services, pregnancy related services, and preventive services for children. Maximum allowable amounts are as of FY2014. Beginning October 1, 2015, maximum allowable amounts increase annually by the percentage increase in the medical care component of the Consumer Price Index for All Urban Consumers (CPI-U).

Effects of Premiums (Table 1)

A large body of research shows that premiums can serve as a barrier to obtaining and maintaining Medicaid and CHIP coverage among low-income individuals. Studies show that premiums in Medicaid and CHIP lead to a reduction in coverage among both children and adults.5 ,6 ,7 ,8 ,9 ,10   Numerous studies find that premiums increase disenrollment from Medicaid and CHIP among adults and children, shorten lengths of Medicaid and CHIP enrollment, and deter eligible adults and children from enrolling in Medicaid and CHIP.11 ,12 ,13 ,14 ,15 ,16 ,17 ,18 ,19 ,20 ,21 ,22 ,23 ,24 ,25 ,26 ,27 ,28 ,29 ,30 ,31 ,32 ,33 ,34 ,35 ,36 ,37 ,38 ,39 

Although some individuals who disenroll from Medicaid or CHIP following premium increases move to other sources of coverage, others become uninsured and face negative effects on their access to care and financial security. Those with lower incomes and those without a worker in the family are more likely to become uninsured compared to those with relatively higher incomes or with a worker in the family, reflecting less availability of employer coverage.40 ,41 ,42 ,43 ,44 ,45 ,46 ,47 ,48 ,49  Studies also show that those who become uninsured following premium increases face increased barriers to accessing care, have greater unmet health needs, and face increased financial burdens.50 ,51 ,52  ,53 ,54  Several studies suggest that these negative effects on health care are largest among individuals with greater health care needs.55 ,56 

Premium effects are largest for those with the lowest incomes, particularly among those with incomes below poverty. Given that most states limit premium charges to children in CHIP, most studies of premium effects have focused on children in CHIP, who generally have incomes above 100% or 150% of the federal poverty level. A range of these studies show that premium effects are larger among children at the lower end of this income range, who have greater disenrollment and increased likelihood of becoming uninsured.57 ,58 ,59 ,60 ,61 ,62 ,63 ,64 ,65  Reflecting the more limited use of premiums among Medicaid enrollees with incomes below poverty, fewer studies have focused on this population. However, studies that have focused on poor Medicaid enrollees found substantial negative effects on enrollment from premiums.66 ,67 ,68 ,69  For example, in Oregon, nearly half of adults disenrolled from Medicaid after a premium increase with a maximum premium amount of $20, with many becoming uninsured and facing barriers to accessing care, unmet health needs, and increased financial burdens.70 ,71 ,72  Similarly, a more recent study of the Healthy Indiana Plan waiver program for Medicaid expansion adults with incomes below 138% FPL, which requires premiums that range from $1-$100 to enroll in a more comprehensive plan, found that 55% of eligible individuals either did not make their initial payment or missed a payment.73  Research also finds that premium effects may vary by other factors beyond income. For example, one study finds larger effects of premiums among families without an offer of employer-sponsored coverage.74  Some research also suggests that increases in Medicaid and CHIP premiums may have larger effects on coverage for children of color and among children whose families have lower levels of educational attainment.75 ,76 ,77 

Research finds varying implications of premiums for individuals with significant health needs. Overall, individuals with greater health needs are less likely to disenroll from Medicaid or CHIP coverage and are more likely to have longer periods of Medicaid or CHIP coverage compared to those with fewer health needs.78 ,79 ,80 ,81  However, findings vary regarding how individuals with health needs respond to premium increases. Some studies show that individuals with greater health needs are less sensitive to premium increases compared to those with fewer health needs, reflecting their increased need for services.82 ,83  These findings suggest that individuals with greater health needs are more likely than those with less significant health needs to remain enrolled following premium increases, but then face increased financial burdens to maintain their coverage. Other studies find that children with increased health needs are as likely or more likely than those with fewer health needs to disenroll from coverage following premium increases, suggesting premiums may lead to children going without coverage despite ongoing health needs.84 ,85 

Effects of Cost Sharing (Table 2)

A wide range of studies find that even relatively small levels of cost sharing, in the range of $1 to $5, are associated with reduced use of care, including necessary services. The RAND health insurance experiment (HIE), conducted in the 1970s and still considered the seminal study on the effects of cost sharing on individual behavior, shows a reduction in use of services after cost sharing increased, regardless of income.86  Since then, a growing body of research has found that cost sharing is associated with reduced utilization of services,87  including vaccinations,88  prescription drugs,89 ,90 ,91 ,92  mental health visits,93  preventive and primary care,94 ,95 ,96 ,97 ,98  and inpatient and outpatient care,99 ,100  and decreased adherence to medications.101 ,102 ,103  In many of these studies, copayment increases as small as $1-$5 can effect use of care. Some studies find that lower-income individuals are more likely to reduce their use of services, including essential services, than higher-income individuals.104 ,105  Research also suggests that copayments can result in unintended consequences, such as increased use of other costlier services like the emergency room.106  Two studies have found that copayments do not negatively affect utilization.107 ,108  In one case, the authors suggest that increases in provider reimbursement may have negated effects of the copayment increases, particularly if not all copayments were being collected by providers at the point of care.109 

Research points to varying effects of cost sharing for people with significant health needs. Some studies find that utilization among individuals with chronic conditions or significant health needs is less sensitive to copayments compared to those with fewer health needs. As such, these individuals face increased cost burdens associated with accessing care because of copayment increases.110 ,111  Other research finds that even relatively small copayments can reduce utilization among individuals with significant health needs.112 ,113 ,114 

Numerous studies find that cost sharing has negative effects on individuals’ ability to access needed care and health outcomes and increases financial burdens for families.115 ,116 ,117 ,118 ,119 ,120 ,121 ,122  For example, studies have found that increases in cost sharing are associated with increased rates of uncontrolled hypertension and hypercholesterolemia123  and reduced treatment for children with asthma.124  Increases in cost sharing also increase financial burdens for families, causing some to cut back on necessities or borrow money to pay for care. In particular, small copayments can add up quickly when an individual needs ongoing care or multiple medications.125 ,126 

Findings on how cost sharing affects non-emergent use of the emergency room are limited. One study found that these copayments reduce non-urgent visits.127  Other studies find that these copayments do not affect use of the emergency room.128 ,129 

Effects on State Budgets and Providers (Table 3)

Research suggests that state savings from premiums and cost sharing in Medicaid and CHIP are limited. Studies find that potential increases in revenue from premium and cost sharing are offset by increased disenrollment; increased use of more expensive services, such as emergency room care; increased costs in other areas, such as resources for uninsured individuals; and administrative expenses.130 ,131 ,132 ,133 ,134 ,135 ,136  One state study found increased revenues from premiums without significant effects on enrollment, but authors note a range of program-specific factors that may have contributed to this finding, including it being limited to a Medicaid-buy in program for individuals with disabilities with incomes above 150% FPL who may be less price-sensitive to the increase and the state implementing administrative processes designed to minimize disenrollment.137 

Studies also show that increases in premiums and cost sharing in Medicaid and CHIP can increase pressures on safety net providers, such as community health centers and hospitals. Several studies show that coverage losses following premium increases lead to increases in the share of uninsured patients seen by providers138 ,139 ,140  and increased emergency department use by uninsured individuals.141 ,142  One study also found that increases in copayments led to community health centers having to divert resources for medications for uninsured individuals to help people who could not afford copayments and that copayments increased the rate of “no shows” for appointments at community health centers.143 

Conclusion

Recently, there has been increased interest at the federal and state levels to expand the use of premiums and cost sharing in Medicaid as a way to promote personal responsibility, prepare beneficiaries to transition to commercial and private insurance, and support consumers in making value-conscious health decisions. Current rules limit premiums and cost sharing in Medicaid to facilitate access to coverage and care for the low-income population served by the program, who have limited resources to spend on out-of-pocket costs. This review of a wide body of research provides insight into the potential effects of increasing premiums and cost sharing for Medicaid enrollees. It shows that premiums serve as a barrier to obtaining and maintaining coverage for low-income individuals, particularly those with the most limited incomes, and that even relatively small levels of cost sharing reduce utilization of services. As such, increases in premiums and cost sharing result in increased barriers to coverage and care, greater unmet health needs, and increased financial burdens for families. Further, the research suggests that state savings from premiums and cost sharing in Medicaid and CHIP are limited and that increases in premiums and cost sharing in Medicaid and CHIP can increase pressures on safety-net providers.

Study Tables

The three tables below support the Kaiser Family Foundation Issue Brief titled, “The Effects of Premiums and Cost Sharing on Low-Income Populations: Updated Review of Research Findings.” The tables highlight findings from 65 studies published between 2000 and March 2017, including peer-reviewed studies and freestanding reports, government reports, and white papers by research and policy organizations on the effects of premiums and cost sharing on low-income populations in Medicaid and CHIP. Each table corresponds to one of three sections in the brief: (1) effects of premiums; (2) effects of cost sharing; and (3) effects on state budgets and providers. The table lists studies in reverse chronological order, with the most recent studies first, and groups the studies by nationwide and state-specific studies. Studies that apply to multiple sections are included in more than one table but list only the relevant findings for that section.

Table 1: Effects of PremiumsTable 2: Effects of Cost SharingTable 3: Effects on State Budgets & Providers

Table 1: Effects Of Premiums

National StudiesState Studies

Table 1: Effects of Premiums
CitationDataStudy Population(s)Study Focus and Major Findings
National Studies
Gery P Guy, et. al., “The Role of Public and Private Insurance Expansions and Premiums for Low-Income Parents: Lessons from State Experiences,” Medical Care 55, 3 (March 2017):236-243.2000-2013 Current Population Survey (CPS) and Medical Expenditure Panel Survey (MEPS) dataNonelderly parents with incomes at or below 300% FPL
  • Estimates effects of different types of coverage expansions and premiums on parent coverage.
  • Higher public premiums were associated with a reduction in public insurance, and increased the likelihood of private insurance or being uninsured. A $500 increase in annual public premiums decreased the probability of public insurance by 1.9 percentage points, increased the probability of private insurance by 1.2 percentage points, and increased the probability of being uninsured by 0.6 percentage points.
  • Public premiums were a significant deterrent to coverage for parents in non-worker households and had effects on public coverage that were over 10 times as large as the effects among families with a worker. Among parents without a worker in the household, a $500 increase in annual public premiums decreased the probability of public insurance by 9.8 percentage points, increased the probability of private insurance by 2.9 percentage points, and increased the probability of being uninsured by 6.9 percentage points. Among parents with a worker in the household, both public and private premiums had a significant impact on insurance status.
Salam Abdus, et. al., “Children’s Health Insurance Program Premiums Adversely Affect Enrollment, Especially Among Lower-Income Children,” Health Affairs 33, 8 (August 2014): 1353-1360.1999-2010 Medical Expenditure Panel Surveys (MEPS) dataChildren eligible for Medicaid or CHIP with incomes above 100% FPL
  • Simulates the relationship between premiums and coverage by income level and by parental access to employer coverage.
  • Among eligible children in families with incomes between 101-150% of poverty, a $10 increase in monthly premiums is associated with a 6.7 percentage point reduction in having Medicaid or CHIP coverage and a 3.3 percentage point increase in being uninsured. The increase in likelihood of being uninsured is larger among children whose parents lack offers of employer coverage.
  •  Among eligible children in families with incomes above 150% of poverty, a $10 increase in monthly premiums is associated with a 1.6 percentage point reduction in Medicaid or CHIP coverage. In this income range, the increase in being uninsured may be higher among children whose parents lack an offer of employer sponsored coverage than among those whose parents have an offer.
Silviya Nikolova and Sally Stearns, “The Impact of CHIP Premium Increases on Insurance Outcomes among CHIP Eligible Children,” BMC Health Services Research 14 (March 2014):101-107.2003 Medical Expenditure Panel Surveys (MEPS) data in 19 statesChildren assumed eligible for CHIP in the income range subject to premiums
  • Simulates the effect of premium differences for children in states that have a tiered premium structure for CHIP, in which families at higher incomes pay higher premiums than families in a lower income group.
  • A $1 increase in premium for those in the higher income group was associated with a 1.7 to 2.2 percentage point increase in the likelihood of being privately insured.
  • Premium increases were not associated with uninsurance rates.
Carole R Gresenz, Sarah E Edgington, Miriam J Laugesen and Jose J Escarce, “Income Eligibility Thresholds, Premium Contributions, and Children’s Coverage Outcomes: A Study of CHIP Expansions,” Health Services Research 48:2, Part II (April 2013):884-902.2002-2009 Current Population Survey dataChildren with family incomes 200%- 400% FPL
  • Simulates effects of varying premium schedules (no, low, medium, and high premiums) for individuals with incomes between 200-400% FPL.
  • Across the examined income levels, premiums decrease enrollment in public coverage and increase enrollment in private coverage, with greater effects as premium contributions increase. Changes in uninsured rates are less sensitive to premiums at these income levels, particularly among those with incomes at 300% and 400% FPL, likely reflecting the greater availability of employer coverage at these income levels.
Gery P Guy, Jr., E. Kathleen Adams, and Adam Atherly, “Public and Private Health Insurance Premiums: How do they Affect Health Insurance Status of Low-Income Childless Adults?,” Inquiry 49 (Spring 2012):52-64.2000-2008 Current Population Survey dataLow-income childless adults (age 19-64) eligible for public coverage expansions or premium assistance programs in 16 states and DC
  • Estimates effects of public and private health insurance premiums on insurance status of low-income childless adults eligible for public coverage or premium assistance programs.
  • Higher public premiums are associated with a decrease in the probability of having public insurance and an increase in the probability of being uninsured. A $1,000 increase in annual public premiums was associated with a 14.2 percentage-point reduction in the probability of public insurance and an 8.2 percentage point increase in the probability of being uninsured.
  • Increased private premiums decrease the probability of having private insurance. A $1,000 increase in annual private premiums was associated with a 3.3 percentage point reduction in the probability of private insurance.
  • Eligibility for premium assistance programs and increased subsidy levels are associated with lower uninsured rates. A $1,000 increase in the annual subsidy level for premium assistance was associated with a 3.4 percentage point reduction in the likelihood of being uninsured.
Jack Hadley, et. al., “Insurance Premiums and Insurance Coverage of Near-Poor Children,” Inquiry 43, 4 (Winter 2006/2007).1996-2003 Community Tracking Study Household Survey dataChildren in families with incomes between 100%-300% FPL
  • Estimates the effects of premiums on children’s coverage.
  • Higher public premiums are significantly associated with a lower probability of public coverage and higher probabilities of private coverage and being uninsured. An increase in the public premium that leads to a 1% decrease in public coverage increases the probability of private coverage by .62%, while the probability of being uninsured increases by .38%.
  • Higher private premiums are significantly related to a lower probability of private coverage and higher probabilities of public coverage and being uninsured. If the probability of private coverage decreases by 1%, the probability of public coverage will increase by .55% and the probability of being uninsured will increase by .45%.
Genevieve Kenney, Jack Hadley, and Fredric Blavin, “Effects of Public Premiums on Children’s Health Insurance Coverage: Evidence from 1999 to 2003,” Inquiry 43 (Winter 2006/ 2007):345-361.2000-2004 Current Population Survey dataChildren with family incomes between 100% to 300% FPL and who meet the eligibility requirements for either Medicaid or CHIP coverage
  • Simulates the effects of premiums on children’s coverage.
  • Raising public premiums reduces enrollment in public programs, and increases the odds of having private coverage or being uninsured relative to having Medicaid or CHIP coverage. Public premiums have larger effects on lower income families.
  • For children with family incomes between 100%-300% FPL, increasing per-child public premiums by an average of $120 annually reduces public coverage by 1.4 percentage points, increases private coverage by 1.1 percentage points, and increases uninsured rates by .3 percentage points.
  • Larger reductions in public coverage were found among lower income eligible children whose family incomes are between 100%-200% FPL. For these children, a $120 annual increase in public premiums would result in a 4.2 percentage point reduction in public coverage, a 3.2 percentage point increase in private coverage, and a 1.0 percentage point increase in the share uninsured.
  • Data also suggest that increases in public premiums may have more pronounced effects on uninsured rates when applied to Black or Hispanic children, whose families have lower levels of educational attainment.
  • A 10% increase in private coverage costs would lower private coverage by 1.4 percentage points, raise public coverage by .6 percentage points, and increase the share uninsured by .8 percentage points.
State Studies   Back to top
The Lewin Group, Healthy Indiana Plan 2.0: POWER Account Contribution Assessment, Prepared for Indiana Family and Social Services Administration (FSSA), (Washington, DC: Lewin Group, March 2017).December 2016-January 2017 Surveys of enrolled, disenrolled, and not enrolled individuals, February 2015-December 2016 Indiana Family and Social Services Administration (FSSA) enrollment data and administrative data, and January-September 2016 data from 3 managed care entities (MCE)Indiana: Medicaid expansion enrollees with incomes between 0-138% FPL
  • Assesses the affordability of the Healthy Indiana Plan (HIP) 2.0’s POWER Account Contribution (PAC) policy, which contains contributions that range from $1-$100 per month, depending on income.
  • Between February 1, 2015 and November 30, 2016, 55% of the 590,315 individuals eligible to pay PAC either never made a first payment or missed a payment during their enrollment. Individuals with incomes at or below poverty were more likely to not make a payment that those with incomes above poverty.
  • 15% of survey respondents reported that they are always or usually worried about having enough money to pay their PAC.
  • 44% of those who missed a payment cited not being able to afford to pay the contribution as the main reason for nonpayment and 17% indicated confusion regarding the payment process. Among those who never made a payment, 22% cited not being able to afford the contribution and 22% cited being confused about the payment process.
  • Individuals who disenrolled due to nonpayment or those who never enrolled because they did not make their first payment were less likely than those enrolled in HIP to report making appointments for both routine and specialty care. They were also less likely to report filling a prescription in the past six months or since leaving HIP.
  • 47% of those who disenrolled due to nonpayment and 41% of those who never enrollment because they did not make their first payment reported that they had insurance coverage, which was most commonly employer sponsored coverage.
MaryBeth Musumeci, et. al., An Early Look at Medicaid Expansion Waiver Implementation in Michigan and Indiana, (Washington, DC: Kaiser Family Foundation, January 2017), https://www.kff.org/report-section/an-early-look-at-medicaid-expansion-waiver-implementation-in-michigan-and-indiana-key-findings/.State administrative dataMichigan and Indiana: Adults enrolled in the Medicaid expansion waiver programs
  • Examines early implementation experiences of Michigan and Indiana Section 1115 Medicaid expansion waivers to low-income adults.
  • State data show that premium costs may deter eligible adults from enrolling in coverage. Particularly for very low-income adults, even very low premiums may be unaffordable.
  • In Michigan, from October 2014-July 2016, about 38% of beneficiaries who owed premiums had paid them. As of July 2016, over 112,000 Michigan beneficiaries owed past due premiums or copayments; about 44,200 (less than 40%) of these were in “consistent failure to pay” status, subjecting them to garnishment of their state income tax refunds.
  • 37% of Healthy Indiana Plan (HIP) 2.0 enrollees with incomes below poverty were not paying monthly premiums and, therefore, were enrolled in HIP Basic, the more limited benefit package with point-of-service copayments, as of October 2016. To date, a limited number of Indiana beneficiaries with incomes above poverty have been locked out of coverage for failure to pay monthly premiums. Between August and October 2016, 4,621 HIP 2.0 beneficiaries were disenrolled and locked out of coverage for 6 months for failing to pay premiums.
James Marton et. al., “Estimating Premium Sensitivity for Children’s Public Health Insurance Coverage: Selection but No Death Spiral,” Health Services Research 50, 2 (April 2015): 579-598.State administrative data, 2003-2006Georgia: Children enrolled in PeachCare, Georgia’s CHIP program
  • Estimates the effects of premium increases on the probability that near-poor and moderate income children disenroll from public coverage.
  • A $1 increase in per child premium is associated with a 7.7-7.83% increase in the probability of a child disenrolling from CHIP.
  • The data suggest that families with children in poor health do not respond much differently than families with children in medium or good health to premium increases, despite having a lower baseline probability of disenrolling from coverage.
Laura Dague, “The Effect of Medicaid Premiums on Enrollment: A Regression Discontinuity Approach,” Journal of Health Economics 37 (May 2014): 1-12.State administrative data, 2008-2010Wisconsin: Children and parents enrolled in BadgerPlus, Wisconsin’s Medicaid and CHIP program
  • Estimates the effects that premiums in Medicaid have on the length of enrollment.
  • A monthly premium increase from $0 to $10 results in 1.4 fewer months of continuous enrollment for both adults and children and increases the probability of disenrollment by 12-15 percentage points.
  • No or relatively small effects are found for other large discrete changes in premiums, suggesting that the premium requirement itself, more than the specific dollar amount, discourages enrollment.
Michael Hendryx, et al., “Effects of a Cost-Sharing Policy on Disenrollment from a State Health Insurance Program,” Social Work in Public Health 27, 7 (2012):671-686.Survey of adults who stayed enrolled and disenrolled following premium changes.Washington State: Low-income adults in Washington’s Basic Health Plan
  • Examines the effects of increased premiums and cost sharing in Washington’s state-funded coverage program for adults on enrollment and possible health care consequences of disenrollment. Effective January 2004, Washington made policy changes that increased average monthly premiums for adults from $27 to $35 and average monthly out-of-pocket costs from $29 to $52.
  • About 5% of enrollees disenrolled after the policy changes. Disenrollees were more likely to be younger adults, male, and have fewer children. Among all disenrollees, 39% indicated that they left because they obtained other coverage, 35% reported that they were no longer eligible, while 21% indicated that they left the program because they could not afford it. Middle-income enrollees were the most likely to have left because they had trouble paying for coverage.
  • 63% of disenrollees were aware of the changes in premiums and cost sharing. Among all disenrollees who were aware of the changes, 26% cited the changes as a reason for disenrolling. Among disenrollees who were aware of the changes and left voluntarily, 34% cited the changes as a reason for disenrolling. Among those citing the changes as a disenrollment reason, the increase in the monthly premium was the most important change that affected their decision.
  • Overall, 37% of disenrollees had no health insurance when surveyed. Disenrollees reported less access to care, greater subsequent out-of-pocket costs, and more difficulty providing coverage for children than people who stayed enrolled.
Michael M Morrisey, et.al., “The Effects of Premium Changes on ALL Kids, Alabama’s CHIP Program,” Medicare & Medicaid Research Review 2,3 (2012):E1-E17.State administrative data, 1999 and 2009Alabama: Children enrolled in ALL Kids, Alabama’s CHIP program
  • Examines the effects of an annual premium increase as well as increases in copayments on enrollment and renewal in Alabama’s CHIP program, ALL Kids. In October 2003, premiums for individual coverage increased by $50 per year and copays by $1-$3 per visit.
  • The increases in premiums and copays are estimated to have reduced renewals that are completed within 12 months by 6.1% annually. This reduction is over one-third larger—up to 8.3%—if only immediate renewals are considered.
  • Families with a child who has a chronic condition were more likely to renew coverage overall. However, those with chronic conditions, African Americans, and those with lower family incomes were more sensitive to the premium increase.
Bill J Wright, et. al., “Raising Premiums and Other Costs for Oregon Health Plan Enrollees Drove Many to Drop Out,” Health Affairs 29, 12 (December 2010):2311-2316.State administrative data and a mail survey, November 2003, 2004, and 2005Oregon: Adults enrolled in Medicaid with income below 100% FPL
  • Examines effects of premium and cost sharing increases for poor adults enrolled in Oregon’s Medicaid program. In 2003, Oregon made a range of policy changes to its Medicaid program, the Oregon Health Plan (OHP), which included benefit reductions, increased premiums and cost sharing and stricter premium payment policies for adults enrolled in its OHP Standard program. Enrollees in OHP Plus continued to receive benefits similar to the original OHP.
  • During the study period between 2003 and2005, only 33% of OHP Standard plan enrollees remained continuously enrolled following the policy changes, compared to 69% of OHP Plus enrollees. Most disenrollment occurred in the first six months following the changes, when 44% of OHP Standard enrollees left the program.
  • Premium increases and rigid premium payment deadlines were a major reason why members reported disenrolled from the OHP Standard plan, accounting for nearly half of the disenrollment over the first six months.
  • At the end of the study, 32% of those who had left OHP Standard had become uninsured compared to 8% of those who had left OHP Plus.
Michael R Cousineau, Kai-Ya Tsai, and Howard A Kahn, “Two Responses to a Premium Hike in a Program for Uninsured Kids: 4 in 5 Families Stay In as Enrollment Shrinks by a Fifth,” Health Affairs 31, 2 (February 2012):360-366.L.A. Care Health Plan enrollment data, 2009-2011California: Children enrolled a health insurance program for low-income immigrant children in Los Angeles County and those whose income exceeded 250% FPL
  • Examines the effects of premium increases on disenrollment from a health insurance program for low-income immigrant children in Los Angeles County. In July 2010, L.A. Care Health Plan increased premiums for older children (age 6-18) to $15 per month for each child, with a maximum of $45 per family. Premium increases did not apply to younger children (ages 0-5).
  • After premiums increased, the retention rate among older children dropped by nearly five percentage points from an average of 98.1% to 93.8%. Much of the decline occurred in the first two months after the premium increase. As a result, monthly enrollment among older children declined by 39% after the premium increase. In contrast, the average retention rate for younger children did not change over the period.
  • At the end of the study period, 59% of the older children subject to the premiums were still enrolled. Without the premium increase, it was expected that 80% of the children in this group would still be enrolled. As such, it is estimated that the increase resulted in an enrollment decline of 20%.
James Marton, Patricia G Ketsche, and Mei Zhou, “SCHIP Premiums, Enrollment, and Expenditures: A Two State, Competing Risk Analysis,” Health Economics 19 (2010):772-791.State administrative data for Kentucky, 2001-2004 and Georgia, 2003-2005


Kentucky and Georgia: Children enrolled in Medicaid and CHIP in Kentucky and Georgia
  • Compares the effects of introducing new premiums and increasing premiums for children enrolled in CHIP in two states on enrollment in public coverage through CHIP or Medicaid. Kentucky introduced a $20 monthly premium for children in CHIP for the first time in 2003. In mid-2004, Georgia increased existing premiums in its CHIP program from $10 per family to sliding scale premiums ranging from $20-$40 for one child and $35-$70 for two or more children.
  • In both states, premium increases lead to increases in children leaving CHIP and having no public health insurance in the two months immediately following the premium changes. In both states, data also show increases in the probability of children moving to lower income eligibility categories of CHIP that have lower premiums following the premium increase. In Kentucky, there also was an increase in the likelihood of children moving to Medicaid in the two months following the increase; however, this was not observed in Georgia.
  • Not all changes persisted over the longer term. However, in Kentucky, children continued to be more likely to exit to no public health insurance in the remaining seven months of the study period.
James Marton and Jeffery C Talbert, “CHIP Premiums, Health Status, and the Insurance Coverage of Children,” Inquiry 47, 3 (Fall 2010):199-214.State administrative data 2001-2005 and a survey of families that disenrolled from CHIP due to premium nonpaymentKentucky: Children enrolled in CHIP
  • Examines whether the effects of new premiums in Kentucky’s CHIP program on enrollment varied by children’s health status and the extent to which children find alternative coverage after disenrolling due to premium nonpayment. In late 2003, Kentucky introduced a $20 per family per month premium for children in CHIP with family incomes between 151%-200% FPL.
  • Overall, the data show that children with a chronic condition are significantly less likely to disenroll from CHIP than children without a chronic condition.
  • The data suggest that introduction of the premium reduces the duration of CHIP coverage for the average child. However, the data suggest little differential impact of the premium increase by health status of children.
  • Survey results find 56% of families report alternative private or public health coverage for their children after losing CHIP coverage, while 44% had no insurance for their children following disenrollment.
Stephen Zuckerman, Dawn M Miller, and Emily Shelton Page, “Missouri’s 2005 Medicaid Cuts: How Did they Affect Enrollees and Providers?,” Health Affairs 28, 2, (2009):w335-w345.State administrative data; Current Population Survey (CPS) data, 2005-2007; provider utilization and financial reports; and structured interviewsMissouri: Nonelderly adults and children in Medicaid and CHIP
  • Examines the effects of a broad range of policy changes in Missouri Medicaid and CHIP coverage, including new monthly premiums for CHIP. In 2005, Missouri adopted large policy changes to Medicaid and CHIP, including new monthly premiums of 1-5% of family income for children in CHIP with incomes above 150% FPL.
  • CHIP enrollment fell 30% between June 2004 and June 2006. In contrast, nationally, CHIP enrollment rose 3.4% over the same time period.
  • The share of low-income children in Missouri with Medicaid or CHIP coverage fell from 50.2% in 2004 to 40.5% in 2006, but increases in other types of insurance coverage prevented an increase in the share that were uninsured.
Jill B Herndon, W Bruce Vogel, Richard L Bucciarelli and Elizabeth A Shenkman, “The Effect of Premium Changes on SCHIP Enrollment Duration,” Health Services Research 43, 2 (April 2008):458-477.State administrative data, 2002-2004Florida: Children enrolled in CHIP
  • Examines the impact of premium changes in Florida’s CHIP program on enrollment duration. Florida increased CHIP premiums for enrollees with incomes between 101-200% FPL by $5 per family per month in July 2002. These increases were reversed in October 2003 for those with incomes between 101-150% FPL, but maintained for those with incomes above 150% FPL.
  • Enrollment lengths decreased significantly immediately following the premiums increase, and the decrease was larger among lower income children (61%) than higher income children (55%). Enrollment lengths partially recovered in the longer term for both the temporary and permanent policy changes.
  • Children with significant acute or chronic health conditions had longer enrollment lengths and were less sensitive to premium changes than healthy children. Among lower income children, healthy children experienced a 61% decline in enrollment within the first three months compared to a 39% decline for children with significant acute conditions.
James Marton, “The Impact of the Introduction of Premiums into a SCHIP Program,” Journal of Policy Analysis and Management 26 (2007):237-255.State administrative data, 2001-2004Kentucky: Children enrolled in CHIP
  • Examines the impact of new premiums on enrollment duration for CHIP children in Kentucky. Kentucky introduced a $20 premium for children in CHIP with family incomes between 151-200% FPL in December 2003.
  • Results suggest that a premium reduces the length of enrollment, with the impact concentrated in the first three months after the introduction of the premium.
Genevieve Kenney, et. al., “Assessing Potential Enrollment and Budgetary Effects of SCHIP Premiums: Findings from Arizona and Kentucky,” Health Services Research 42, 6 Part 2 (2007):2354-2372.State administrative data, 2001 to 2004/2005Arizona and Kentucky: Children enrolled in CHIP with family incomes between 101-150% FPL in Arizona and 151-200% FPL in Kentucky.
  • Assesses whether new premiums in CHIP affect rates of disenrollment and reenrollment in CHIP and whether they have spillover enrollment effects on Medicaid. In July 2004, Arizona introduced CHIP premiums ranging from $10-$15 per month for families with incomes between 101-150% FPL. In December 2003, Kentucky introduced a premium of $20 per month per family for children in CHIP with family incomes between 151-200% FPL.
  • In both states, the premiums increased the rate of disenrollment among children subject to the premiums. The rate of disenrollment increased by 52% in Kentucky and by 38% in Arizona. All of the increases in disenrollment occurred during the first two or three months after introduction of the premium. Almost all the disenrollment is caused by children leaving public insurance rather than moving to Medicaid or other non-premium paying categories of CHIP. Findings also indicate a relatively small reduction in the rate of re-enrollment in both states.
  • In both states, the premiums were associated with a decline in overall enrollment among children subject to the premiums. The premium reduced enrollment in the premium paying group by 18% in Kentucky and by 5% in Arizona, with some of the children leaving public coverage all together. Unlike the impacts on disenrollment, these effects are not limited to the first 2–3 months following the introduction of the premium, suggesting that the premium may have dampened new enrollment into the premium-paying category over a longer period of time.
Gina A Livermore, et. al., “Premium Increases in State Health Insurance Programs: Lessons from a Case Study of the Massachusetts Medicaid Buy-in Program,” Inquiry 44 (Winter 2007):428-442.2002-2003 Medicaid Management Information System (MMIS) and administrative dataMassachusetts: Enrollees in the Massachusetts CommonHealth-Working (CH-W) Medicaid buy-in program for people with disabilities
  • Evaluates the impact of premium increases on disenrollment from a state-funded Medicaid buy-in program for people with disabilities in Massachusetts. In 2003, monthly premiums for the Massachusetts CommonHealth-Working (CH-W) program increased from $37 to $51.
  • After a period of steady growth, CH-W enrollment decreased marginally (.5% decrease) in the months surrounding the premium change (February-August 2003) compared with 12.4% increase during the same period in the previous year.
  • The premium increase increased the likelihood of enrollees leaving Medicaid (MassHealth) altogether, but had no effect on the likelihood of moving to another Medicaid (MassHealth) eligibility category. Although statistically significant, the effect is rather modest. All else held constant, a $10 increase in the premium would increase the odds of leaving Medicaid (MassHealth) by 3%.
  • The analysis suggests that the premium changes had a relatively small impact on disenrollment and alone cannot explain the decline observed between February and August 2003. Authors suggest that several aspects of the program may contribute to the limited impact on disenrollment, including it being a longstanding program, the changes increasing existing premiums rather than introducing new premiums, the exemption of enrollees with incomes under 150% FPL from premiums, the analysis accounting for the movement of enrollees to other categories of Medicaid coverage, and administrative procedures, including processes designed to minimize disenrollment due to nonpayment. Further, people with disabilities may be less price-sensitive to premiums given their significant health care needs.
Genevieve Kenney, et. al., “The Effects of Premium Increases on Enrollment in SCHIP Programs: Findings from Three States,” Inquiry 43, 4 (Winter 2006-2007):378-92.State administrative data, 2001-2004/2005.Kansas, Kentucky, and New Hampshire: Children enrolled in CHIP with incomes between 150-200% FPL in Kansas and Kentucky and with family incomes between 185-300% FPL in New Hampshire.
  • Examines the effects of new and higher premiums on CHIP enrollment in Kansas, Kentucky, and New Hampshire. In 2013, Kansas and Kentucky increased premium levels, while Kentucky introduced new premiums. Kansas increased premiums from $10 to $30 per family per month for families with incomes between 151-175% FPL and from $15 to $45 per family per month for those with incomes between 176-200% FPL. New Hampshire increased premiums for families with incomes between 185% to 249% FPL from $20 to $25 per child per month and from $40 to $45 for families with incomes between 250-300% FPL. Kentucky introduced a $20 premium per family per month for 151-200% FPL.
  • In all three states, caseload growth rates in the six months prior to the premium increase were consistently higher than those in the six months after the increase. In Kentucky, the caseload of children subject to premiums decreased by 16.4% following the premium’s introduction. The caseload stabilized after several months but did not return to pre-premium levels nine months after the premium was introduced. In Kansas and New Hampshire, small declines in the caseload occurred immediately following the premium increase. The caseload resumed growing three to five months after the premium increase, though at lower rates than before the increase. In contrast, caseloads among other categories of public coverage without premiums grew over the period.
  • Premiums were found to reduce new enrollment by 10.1% and 17.7% in Kansas and New Hampshire, respectively. They also led to faster disenrollment in Kentucky and New Hampshire.
  • In Kentucky, larger disenrollment effects were found for nonwhite children relative to white children while in New Hampshire, disenrollment effects were concentrated among children at the lower end of the income group subject to premiums.
Tricia J Johnson, Mary Rimsza, and William G Johnson, “The Effects of Cost-Shifting in the State Children’s Health Insurance Program,” American Journal of Public Health 96, 4 (April 2006):709-715.Yuma HealthQuery (YHQ) community health data, 2001Arizona: Children in Yuma County, Arizona who received non-traumatic care at an emergency room who were enrolled in CHIP or uninsured
  • Simulates the effects of increasing CHIP premiums on health care use and public costs using data for children in Yuma, Arizona.
  • Estimates that a $10 increase in monthly premiums for CHIP would induce 10% of CHIP children to disenroll.
Bill J Wright et. al., “The Impact of Increased Cost Sharing on Medicaid Enrollees,” Health Affairs 24, no. 4 (Jul/Aug 2005):1106-1116.Survey of enrollees, 2003 and analysis of Medicaid eligibility filesOregon: Adults enrolled in Medicaid
  • Examines longitudinal effects on enrollees of a range of policy changes that were made in Oregon’s Medicaid program. In 2003, Oregon made a range of policy changes to its Medicaid program, the Oregon Health Plan (OHP), which included benefit reductions, increased premiums and cost sharing and stricter premium payment policies for adults enrolled in its OHP Standard program. Enrollees in OHP Plus continued to receive benefits similar to the original OHP.
  • Nearly half (44%) of the OHP Standard members disenrolled in the six months after the program changes were implemented.
  • The increased premiums and cost sharing disproportionately affected the most economically vulnerable OHP members; for the vast majority of those who disenrolled, leaving OHP meant becoming uninsured. This was particularly true for those who left because of the increased costs.
  • Those who left OHP because of cost were more likely than those who left for other reasons not to have received needed care in the previous six months. Similarly, those who left because of cost were more likely to have skipped buying prescription medicines because of cost and were significantly less likely than those who left for other reasons to have a usual source of care.
  • Those who left because of cost were significantly less likely than those who left for other reasons to have had a least one primary care visit in the past six months and significantly more likely to have had at least one emergency department visit in those same six months.
  • Those who left OHP because of cost were significantly more likely to owe $500 or more in medical debt than those who left for other reasons. The increased debt burden may have negatively affected their access to care.
Matthew J Carlson and Bill Wright, “The Impact of Program Changes on Enrollment, Access, and Utilization in the Oregon Health Plan Standard Population,” Prepared for the Office for Oregon Health Policy and Research, Sociology Faculty Publications and Presentations, Paper 14 (March 2005).Survey conducted between November 2003 and February 2004Oregon: Adult Medicaid enrollees with incomes below 100% FPL
  • Assesses the impact of policy changes made to Oregon’s Medicaid program on enrollment, health care access, and use. In 2003, Oregon made a range of policy changes to its Medicaid program, the Oregon Health Plan (OHP), which included benefit reductions, increased premiums and cost sharing and stricter premium payment policies for adults enrolled in its OHP Standard program. Enrollees in OHP Plus continued to receive benefits similar to the original OHP.
  • 44% of individuals who disenrolled from OHP Standard following the changes reported that increased costs, including premiums, copays, and back-owed premiums, contributed to disenrollment; OHP Standard disenrollees with incomes between 0-10% FPL were significantly more likely to report difficulty paying premiums and copays than those with higher incomes.
  • Two-thirds of OHP Standard disenrollees became uninsured.
  • Disenrollees with very low incomes (43%) were more likely to have an emergency department visit than those still covered (35%); the difference was larger for those with chronic conditions.
Rachel Solotaroff, et. al., “Medicaid Programme Changes and the Chronically Ill: Early Results from a Prospective Cohort Study of the Oregon Health Plan,” Chronic Illness 1, (2005): 191-205.Mail survey of OHP beneficiaries, October 2003Oregon: Nonelderly adults enrolled in Medicaid
  • Assess the impacts of policy changes in Oregon’s Medicaid program on individuals living with chronic illness. In 2003, Oregon made a range of policy changes to its Medicaid program, the Oregon Health Plan (OHP), which included benefit reductions, increased premiums and cost sharing and stricter premium payment policies for adults enrolled in its OHP Standard program. Enrollees in OHP Plus continued to receive benefits similar to the original OHP.
  • Nearly half (46.3%) of OHP Standard beneficiaries disenrolled in the 10 months after the policy changes. Rates of disenrollment were lower among the chronically ill (42.8%) than those without chronic illness (49.6%). However, 68% of the chronically ill that did disenroll remained uninsured at the time of the survey.
  • When asked why they disenrolled, 45% of the chronically ill and 43% of those without a chronic illness identified a reason related to the increase in cost sharing, such as inability to afford the new premiums or copays and/or owing premiums.
  • Increased costs disproportionately affected enrollment for those with lower incomes. Among those who lost coverage, 68.2% of those with zero income indicated cost sharing as the major reason for their loss, compared to 38.7% of those with incomes between 26%-100% FPL and 23.9% of those with income above 100% FPL.
  • Chronically ill persons who became uninsured after leaving OHP fared worse in terms of access to care, use of care, and financial burden than those who became uninsured but did not have a chronic illness.
Gene LeCouteur, Michael Perry, Samantha Artiga and David Rousseau, The Impact of Medicaid Reductions in Oregon: Focus Group Insights, (Washington, DC: Kaiser Commission on Medicaid and the Uninsured, December 2004).Focus groups, 2004Oregon: Medicaid adults with incomes under 100% FPL.
  • Assesses the impact of policy changes made to Oregon’s Medicaid program on poor adults who were subject to benefit reductions and premium and cost sharing increases. In 2003, Oregon made a range of policy changes to its Medicaid program, the Oregon Health Plan (OHP), which included benefit reductions, increased premiums and cost sharing and stricter premium payment policies for adults enrolled in its OHP Standard program. Enrollees in OHP Plus continued to receive benefits similar to the original OHP.
  • Increased premiums and stricter payment policies led many to face difficult decisions such as paying other bills late or skipping meals. For many, the new premiums and the stricter payment policies led to loss of coverage, and they had significant problems accessing care after losing coverage.
Utah Department of Health Center for Health Data, Utah Primary Care Network Disenrollment Report, (Salt Lake City, UT: Utah Department of Health Center for Health Data, Office of Health Care Statistics, August 2004).State administrative and survey data, July and September 2003Utah: Adults with incomes below 150% FPL who disenrolled from Medicaid
  • Examines the effect of an enrollment fee and cost sharing on adults enrolled in a Medicaid limited benefit waiver program in Utah. In 2003, Utah implemented an annual enrollment fee and cost sharing in its Primary Care Network (PCN) waiver program for low-income adults.
  • During July-September 2003 (renewal period after first year), 27% were disenrolled. A survey of disenrollees found that 63% were uninsured at the time of the survey. Nearly half of surveyed disenrollees indicated that they were still eligible for the PCN program.
  • Nearly 30% of survey respondents indicated financial barriers to reenrollment. Most of those reporting financial barriers cited the $50 reenrollment fee as the barrier (63%) and 26% cited the copays. Over 75% of respondents who reported financial barriers to reenrollment reported being uninsured after exiting the program.
  • Of those indicating they did not reenroll because the program did not meet their health needs, 20% reported copays were too high to use services.
  • About half of all respondents who disenrolled, regardless of reason for disenrollment, indicated not having seen a health care provider in the previous 12 months. Many disenrollees reported difficulty accessing needed care, particularly mental health care, alcohol/drug treatment, and dental services.
Mark Gardner and Janet Varon, Moving Immigrants from a Medicaid Look-Alike Program to Basic Health in Washington State: Early Observations, (Washington, DC: Kaiser Family Foundation, May 2004).State administrative data, key informant interviews, a focus group, and interviews, September 2002-September 2003Washington State: Immigrant families moved from Medicaid to Basic Health in Washington State
  • Assesses the impact of changes in coverage options for low-income immigrants in Washington State. In 2002, Washington State eliminated three state-funded programs for individuals whose immigration status prevented them from qualifying for Medicaid. Instead, “slots” were set aside for them in the state’s Basic Health program, which charges premiums and has more limited benefits than Medicaid.
  • 48% of families in the transition population did not make the transition and disenrolled during the first few months of the transition.
  • Premiums were a significant barrier to families obtaining and maintaining Basic Health coverage; 35.9% of those from the transition group who disenrolled from Basic Health in the first 11 months did so because they did not pay premiums.
  • Most (61%) of the group that successfully transitioned to Basic Health relied on assistance from third parties to pay premiums.
Maryland Department of Health and Mental Hygiene, Maryland Children’s Health Insurance Program: Assessment of the Impact of Premiums, (Baltimore, MD: Department of Health and Mental Hygiene, April 2004).State administrative and survey data, February 2004Maryland: Children disenrolled from CHIP with incomes between 185-200% FPL
  • Studies the effects of a new monthly premium in Maryland’s CHIP program on program enrollment and health coverage. In 2003, Maryland made several changes to its CHIP program, including requiring families with incomes between 185-200% FPL to pay a new monthly premium of $37 per family.
  • Enrollment data showed about one-quarter of families subject to the new premiums disenrolled.
  • In surveys conducted with parents, the most common reason given was gaining other coverage (41%), but 20% cited a premium related reason.
John McConnell and Neal Wallace, Impact of Premium Changes in the Oregon Health Plan, Prepared for the Office for Oregon Health Policy & Research, (Portland, OR: Oregon Health & Science University, February 2004.State administrative data, January 2002 – October 2003Oregon: Adults with incomes below 100% FPL who disenrolled from Medicaid in Oregon
  • Examines the effects of changes to Oregon’s Medicaid program on enrollment and highlights the effects for enrollees at different income levels. In 2003, Oregon made a range of policy changes to its Medicaid program, the Oregon Health Plan (OHP), which included benefit reductions, increased premiums and cost sharing and stricter premium payment policies for adults enrolled in its OHP Standard program. Enrollees in OHP Plus continued to receive benefits similar to the original OHP.
  • OHP Standard experienced a nearly 50% drop in enrollment, with the largest declines experienced by those with no income (58% drop in October 2003 from 2002 levels).
  • Of those that left between May and October, 47% were disqualified for not paying premiums.
Norma I Gavin, et. al., Evaluation of the BadgerCare Medicaid Demonstration, Prepared by RTI International and MayaTech Corp. for the Centers for Medicare & Medicaid Services, (Research Triangle Park, NC: RTI International and MayaTech Corporation, December 2003).Case study, including site visit interviews, focus groups, and document review; administrative enrollment data 1997-2002; and surveys of BadgerCare participating, eligible nonparticipating, and disenrolled families.Wisconsin: Families enrolled in Medicaid/CHIP
  • Evaluates Wisconsin’s BadgerCare Medicaid/CHIP program for low-income families. BadgerCare, includes premiums for families with incomes over 150% FPL who must pay monthly premiums of approximately 3% of their income.
  • Premium paying families were less likely to remain enrolled over time, but the difference from families not subject to premiums was small. Premiums delayed reenrollment of families.
  • Of those disenrolled, 26% listed a problem with paying premiums as a reason for leaving BadgerCare. This was the most common reason for leaving the program.
Monette Goodrich, Joan Alker, and Judith Solomon, Families at Risk: The Impact of Premiums on Children and Parents in Husky A, Policy Brief (Washington, DC: Georgetown Center for Children and Families, November 2003), http://ccf.georgetown.edu/wp-content/uploads/2012/03/Far%20-%20impact%20of%20premiums.pdf.State administrative data, August 2003Connecticut: Children and adults enrolled in Medicaid
  • Models potential effects of adding new premiums to Connecticut’s Medicaid program. In 2003, Connecticut was planning to charge premiums for families with monthly incomes ranging from 50%-185% FPL for a family of three enrolled in Medicaid.
  • Estimates that premiums would contribute to an enrollment decline of by 86,744 adults and children. Of these persons who could be expected to lose coverage, 59,638 – approximately 69% – would be children; the remaining 27,106 would be parents or pregnant women.
  • Of the adults that could be expected to lose coverage, 1,006 would be pregnant women.
  • Just under half of those who could be expected to lose coverage would be children and parents whose income falls below the poverty level – 26,212 children and 15,070 adults – with monthly incomes ranging from $604 to $1,196 a month.
  • The remaining 33,426 children and 12,036 adults who could be expected to lose coverage come from families whose incomes range from 100-184% of the poverty line.
Elizabeth Shenkman, et. al., “Disenrollment and Re-Enrollment Patterns in a SCHIP Program,” Health Care Financing Review 23, 3 (Spring 2002:47-63.Census of all children enrolled in CHIP program for at least 1 month from October 1, 1997-September 30, 1999.Florida: Children enrolled in CHIP
  • Examines the impact of four policy changes made to Florida’s CHIP program on enrollment and re-enrollment, including a reduction in premiums. Prior to 1998, families paid $5-$27 per child per month (depending on the county where they lived) and family income while families above 186% FPL paid $55-$65 per child per month. In 1998, Florida changed its CHIP program, including extending subsidized premiums which reduced premiums to $15 per family per month for those 185%-200% FPL. Families above 200% FPL paid about $75 per child per month.
  • Larger decreases in monthly premiums had larger effects on reducing the likelihood of disenrollment. While an average of $5 per month decrease in premiums resulted in families being only 2% less likely to disenroll their children from the program, a $45 per month reduction in premiums meant that families were 17-20% less likely to disenroll their children from the program.
  • Families experiencing the mean premium change were slightly more likely to re-enroll their children following a disenrollment episode. For example, families experiencing the mean premium change were 6-7% more likely to re-enroll post- versus pre-April 1998.
Leighton Ku and Teresa A Coughlin, “Sliding-Scale Premium Health Insurance Programs: Four States’ Experiences,” Inquiry 36, 4 (Winter 1999/2000).Interviews with state officials, review of state documents, and 1995 state dataWashington, Tennessee, Hawaii, and Minnesota: Medicaid/CHIP enrollees
  • Examines the experiences in four states that implemented Medicaid expansion programs that include sliding-scale premiums for families. In the 1990s, Washington, Tennessee, Hawaii, and Minnesota initiated Medicaid expansion programs using sliding-scale premiums.
  • Participation in public health programs fell from 57% when premiums were equal to 1% of family income to 35% when premiums grew to 3% of family income. Participation continued to fall to 18% when premiums rose to 5% of family income.


Table 2: Effects Of Cost Sharing

National StudiesState Studies

Table 2: Effects of Cost Sharing
Citation DataStudy Population(s)Study Focus and Major Findings
National Studies
Charles Stoecker, Alexandra M Stewart, and Megan C Lindley, “The Cost of Cost-Sharing: The Impact of Medicaid Benefit Design on Influence Vaccination Uptake,” Vaccines 5, 8, (March 2017).Behavioral Risk Factor Surveillance System (BRFSS) data, 2003-2012Nonelderly adult Medicaid enrollees receiving care on a fee-for-service basis
  • Examines the effects of three aspects of Medicaid benefit design—coverage for vaccines, prohibiting cost sharing, and copayment amounts—on vaccine uptake among nonelderly adults enrolled in fee-for-service Medicaid.
  • Medicaid copayment charges negatively affected influenza vaccination levels. Each additional dollar of copayment for vaccination decreased influenza vaccination coverage by 1-6 percentage points.
Deliana Kostova and Jared Fox, “Chronic Health Outcomes and Prescription Drug Copayments in Medicaid,” Medical Care published ahead of print (February 2017).National Health and Nutrition Examination Survey (NHANES) data, 1999-2012.Adults age 20-64 enrolled in Medicaid in 18 states and those not enrolled in Medicaid with family incomes at or below 250% FPL who were identified to have hypertension or hypercholesterolemia
  • Evaluates the association between prescription drug copayments and uncontrolled hypertension, uncontrolled hypercholesterolemia, and prescription drug utilization among Medicaid beneficiaries with these conditions.
  • Introducing drug copayments to Medicaid beneficiaries with hypertension or hypercholesterolemia was associated with a rise in the average rates of uncontrolled hypertension and uncontrolled hypercholesterolemia by 7.7 and 13.2 percentage points, respectively. These copayment estimates translate into a relative increase of 15% in uncontrolled hypertension and 25% in uncontrolled hypercholesterolemia.
  • Introducing drug copayments also resulted in a 9.2 percentage point reduction in the average rate of taking medication among persons with hypercholesterolemia, while the resulting reduction among patients taking anti-hypertension medication was smaller and not statistically significant.
Lindsay M. Sabik and Sabina Ohri Gandhi, “Copayments and Emergency Department Use Among Adult Medicaid Enrollees,” Health Economics 25 (May 2016):529-542.National Hospital Ambulatory Medical Care Survey (NHAMCS) and state-level data, 2001-2009Nonelderly adult Medicaid enrollees
  • Examines the effect of copayments on non-urgent emergency department utilization among nonelderly adults enrolled in Medicaid.
  • Results suggest copayments for non-emergent use of the emergency department may reduce non-urgent visits. When a copayment is in place, there is a statistically significant 6.3 percentage point decrease in the probability that a given visit is non-urgent, compared to when there is no copayment.
Mona Siddiqui, Eric T Roberts, and Craig E Pollack, “The Effects of Emergency Department Copayments for Medicaid Beneficiaries Following the Deficit Reduction Act of 2005,” JAMA Internal Medicine 175,3 (March 2015):393-398.Medical Expenditure Panel Survey (MEPS) data, January 2001 to December 2010Adult Medicaid enrollees
  • Evaluates effect of allowing states to enforce emergency department copayments for non-urgent visits on emergency department utilization among Medicaid beneficiaries and compares the effects among beneficiaries living in states that did and did not adopt emergency department copayments.
  • Results suggest that copayments for non-emergent use of the emergency department did not affect use of the emergency department. There were no significant differences in the rate of emergency department visits per enrollee in states with copayments compared to states without copayments.
  • The findings also suggest that the non-emergent use of emergency department copays did not affect rates of outpatient medical provider visits or use of inpatient care.
Vicki Fung, et. al., “Financial Barriers to Care Among Low-Income Children with Asthma: Health Care Reform Implications,” JAMA Pediatrics 168, 7 (July 2014):649-656.2012 Telephone survey of 769 parentsChildren between ages 4-11 with asthma
  • Examines the associations between cost sharing, income, use of care, and financial stress among children with asthma.
  • Overall, findings show that cost-related barriers to care among children with asthma were concentrated among low-income families with higher cost sharing levels.
  • Among parents with incomes at or below 250% FPL, those with lower cost sharing levels were less likely than those with higher cost sharing levels to delay or avoid taking their children to a physician’s office visit (3.8% vs. 31.6%) and to delay or avoid using the emergency department (1.2% vs. 19.4%) because of cost. Higher income parents and children enrolled in public coverage were also less likely to forgo care for their children compared to parents with incomes at or below 250% FPL who had high cost sharing levels.
  • Overall, 15.6% of parents borrowed money or cut back on necessities to pay for their children’s asthma care. Families with incomes at or below 250% FPL with higher levels of cost sharing were more likely than those with lower cost sharing to borrow money to pay for their children’s asthma care.
Jessica Greene, Rebecca M Sacks, and Sara B McMenamin, “The Impact of Tobacco Dependence Treatment Coverage and Copayments in Medicaid,” American Journal of Preventive Medicine 46, 4 (April 2014):331-336.Current Population Survey  (CPS) Tobacco Use supplement data, 2001-2003, 2006-2007, and 2010-2011Adults enrolled in Medicaid who reported smoking 12 months prior to the survey and lived in 28 states with consistent tobacco dependence treatment coverage across Medicaid fee-for-service and managed care.
  • Examines whether more generous tobacco dependence treatment (TDT) coverage, in terms of cost sharing requirements and treatment covered, is associated with greater likelihood of quit attempts and successful quit rates.
  • States with the most generous Medicaid TDT coverage (pharmacotherapy with copayment and counseling without copayment) had the highest successful quit rates (9.1%) and the highest proportion of quit attempts that were successful (20.3%).
  • Data suggest that when cost sharing was required for counseling, quit rates were lower than when cost sharing was not required. However, the findings were not statistically significant.
Gery P Guy Jr., “The Effects of Cost Sharing on Access to Care among Childless Adults.” Health Services Research 45, 6 Pt. 1 (December 2010): 1720-1739.Behavioral Risk Factor Surveillance System (BRFSS) data, 1997–2007Nonelderly adults
  • Analyzes the impacts of public health expansions and differences in cost sharing requirements on insurance status and receipt of preventive screening and physician services.
  • Results indicate that childless adult expansion programs resulted in significant gains in coverage regardless of cost sharing requirements.
  • However, cost sharing requirements were found to play an important role in providing access to preventive health screenings. Use of preventive health screenings significantly increased among childless adults eligible for programs with traditional Medicaid cost sharing levels. In programs with higher cost sharing, there were no statistically significant gains in screening utilization.
  • Differences in cost sharing levels did not appear to impact the likelihood of having a personal doctor or health care provider or prevent adults from seeking needed medical care.
Karoline Mortensen, “Copayments Did Not Reduce Medicaid Enrollees’ Nonemergency Use of Emergency Departments,” Health Affairs 29, 9 (September 2010): 1643-1650 .Medical Expenditure Panel Surveys (MEPS) data, 2001-2006Nonelderly adults enrolled in Medicaid
  • Examines how changes in nine states’ copayment policies influence enrollees’ use of emergency departments.
  • Requiring copayments for nonemergency visits did not decrease emergency department use by Medicaid enrollees.
State Specific Studies Back to top
Leah Zallman, et. al., “Affordability of Health Care Under Publicly Subsidized Insurance After Massachusetts Health Care Reform: A Qualitative Study of Safety Net Patients,” International Journal for Equity in Health 14 (October 2015):112.Face to face interviews with 12 individualsMassachusetts: Individuals with Medicaid or subsidized coverage (Commonwealth Care) at a safety net hospital emergency department
  • Examines whether cost sharing levels in public insurance programs in Massachusetts led to unaffordability of care.
  • Individuals with higher cost sharing requirements described difficulties affording care, inability to get needed medical care due to cost, inability to afford other basic needs (e.g., rent, food, being unable to return to college) due to paying for medical care, and the need to rely on non-insurance based resources in order to pay for medical care.
  • Difficulty obtaining medical care was less common among those with low cost sharing. In fact, most low cost sharing participations reported no difficulty affording their care and the problems that were reported were of smaller magnitude compared to those with higher cost sharing. Individuals with lower cost sharing did not report inability to afford other basic needs.
  • For both higher and lower cost sharing participants, inability to afford care was associated with needing to rely on other sources, e.g., loans from family or friends, providers’ willingness to accept late payments, enrollment in other government programs.
Leah Zallman, et.al., “Perceived Affordability of Health Insurance and Medical Financial Burdens Five Years in to Massachusetts Health Reform,” International Journal for Equity in Health 14 (October 2015):113.Face to face surveysMassachusetts: A sample of 976 patients seeking care at three hospital emergency departments
  • Compares perceived affordability of insurance, financial burden, and satisfaction among individuals with low cost sharing public plans (Medicaid enrollees, and enrollees in Exchange-based plans with minimal cost sharing) and individuals with high cost sharing public plans (enrollees in Exchange-based plans with high cost sharing and commercially insured individuals).
  • Despite having higher incomes, individuals with higher cost sharing requirements were less satisfied with their insurance plans and perceived more difficulty affording their insurance than those with a low cost sharing plan. Individuals with a higher cost sharing public plan also reported more difficulty affording care as well as insurance premiums compared to those with commercial insurance.
  • Patients with low cost sharing public plans reported higher plan satisfaction and less financial concern than the commercially insured.
Daniel A Lieberman, et. al., “Unintended Consequences of a Medicaid Prescription Copayment Policy,” Medical Care 52, 5 (May 2014):422-427.State-level aggregate medication utilization data from the Center for Medicare and Medicaid Services (CMS), 2007-2011Massachusetts: Prescription medication utilization in Massachusetts Medicaid
  • Evaluates copayment policies implemented in Massachusetts Medicaid intended to incentivize the use of selected generic medications. In 2009, Massachusetts kept copayments for certain target generics at $1 while it increased copayments for all non-targets to $2-$3.
  • The increase in copayments modestly increased utilization of target generic medications. However, it had unintended consequences for other medications. In particular, the policy decreased and subsequently eliminated incentives for patients to use generic rather than brand name drugs among all other medication classes. After policy implementation, use of non-target essential generics decreased and use of name brand medications increased.
Bisakha Sen, et. al., “Can Increases in CHIP Copayments Reduce Program Expenditures on Prescription Drugs?,” Medicare & Medicaid Research Review 4, 2 (May 2014).State administrative and claims data, 1999-2007Alabama: Children enrolled in CHIP
  • Explores whether prescription expenditures by enrollees changed in Alabama’s CHIP program after copayment increases. In FY 2004, Alabama increased copayments for several non-preventive services, including prescription drugs, in its CHIP program. The magnitude of the increases varied across incomes, with lower fees in the 101-150% FPL group and higher fees in 151-200% FPL group.
  • The copay increase is associated with a statistically significant reduction in utilization for all prescription drugs (5.8%), brand name drugs (7%), and generic drugs (7.4%). However, there is substantial variation in responsiveness to the increased copayments across categories of drugs.
  • There is evidence of larger declines in utilization and expenditures among children with no chronic conditions versus those with chronic conditions, and of larger reductions among children between 101-150% FPL versus 150-200% FPL.
Amitabh Chandra, Jonathan Gruber and Robin McKnight, “The Impact of Patient Cost-Sharing on Low-Income Populations: Evidence from Massachusetts,” Journal of Health Economics 33 (2014): 57-66.State enrollment and claims data, July 2007-June 2009Massachusetts: Adults enrolled in Massachusetts Commonwealth Care, a state-funded program that subsidizes insurance for families with incomes <300% FPL
  • Examines the effects of increased copayments on low-income adults enrolled in the Massachusetts Commonwealth Care program.
  • A 10% increase in copayments faced by patients would reduce utilization by 1-2 percentage points.
  • Utilization among individuals with greater health needs appears to be less sensitive to copayments than those with fewer health needs.
James Marton, et. al., “The Effects of Medicaid Policy Changes on Adults’ Service Use Patterns in Kentucky and Idaho,” Medicare & Medicaid Research Review 2, 4 (February 2013).State administrative data, 2004-2008Kentucky: Nonelderly, non-institutionalized adults enrolled in Medicaid
  • Examines the impact of Medicaid policy changes implemented in Kentucky and Idaho on utilization of services, including increases in cost sharing requirements in Kentucky. Kentucky introduced new cost sharing in its Medicaid program in 2006, including a $50 copayment for inpatient hospitalization, 5% coinsurance for nonemergency use of the ER, $1–$3 copayments for prescription drugs, and $3–$6 copayments for physician visits.
  • New cost sharing requirements did not appear to have a substantial impact on service use in Kentucky. Authors note that reimbursement increases to providers introduced a year later may have neutralized the negative effects of the copayments. In addition, the extent to which these copayments were actually collected by providers at the point of service is not clear.
Bisakha Sen, et. al., “Did Copayment Changes Reduce Health Service Utilization among CHIP Enrollees? Evidence from Alabama,” Health Services Research 47, 4 (September 2012):1303-1620.State administrative data, 1999-2009Alabama: Children enrolled in CHIP
  • Explores whether health care utilization changed among enrollees in Alabama’s CHIP program following copayment increases. At the beginning of FY 2004, Alabama increased copayments for children enrolled in its CHIP program.
  • There are significant declines in utilization for inpatient care, physician visits, brand-name medications, and emergency department visits following the copayment increases.
  • Given that the copayment increases were mostly $3-$5, the study shows that even small increases in copayments may have significant effects on service utilization.
Sujha Subramanian, “Impact of Medicaid Copayments on Patients with Cancer,” Medical Care 49, 9 (September 2011): 842-847.Medicaid administrative data linked with cancer registry data, 1999-2004Georgia: Low-income nonelderly adult Medicaid enrollees diagnosed with cancer
  • Studies the impact of increased copayments in Georgia on nonelderly adult Medicaid beneficiaries with cancer. In 2002, Georgia significantly increased copayments for prescription drugs and other services. The experiences in Georgia are compared to experiences in two control states, South Carolina and Texas.
  • After the implementation of copay changes in Georgia, there was a substantial decrease in prescription drug use, while there was no decline in South Carolina or Texas. In Georgia, those with multiple comorbidities had larger reductions in their prescription use compared to those with a single comorbidity and those with no comorbidities. Patients with multiple comorbidities in South Carolina and Texas increased their prescription use.
  • The probability of having an emergency room visit increased in Georgia while the probability did not change in neither South Carolina nor Texas.
  • Authors conclude that copayments do not decrease Medicaid cost of care for patients with cancer, but may instead lead to unintended negative consequences and that the results show that even relatively small copayments impact utilization among Medicaid beneficiaries.
Marisa Elena Domino, et. al., “Increasing Time Cost and Copayments for Prescription Drugs: An Analysis of Policy Changes in a Complex Environment,” Health Services Research 46, 3 (June 2011):900-919.Medicaid claims data from CMS, 2000- 2002North Carolina: Nonelderly adults enrolled in Medicaid
  • Estimates the effects of policy changes in the North Carolina Medicaid program on medication adherence and expenditures. The North Carolina Medicaid program decreased the allowable supply per prescription from 100 days to 34 days on July 1, 2001, and then increased the copayment for brand name drugs in October 2001.
  • Both policies decreased medication adherence. The reduction in allowable days supply had a much larger effect on adherence than the copayment increase. Data also find an increase in the probability of filling medications from the copayment policy, but authors suggest this may be due to medication switches that might bring individuals to the pharmacy more often.
Bill J Wright, et. al., “Raising Premiums and Other Costs for Oregon Health Plan Enrollees Drove Many to Drop Out,” Health Affairs 29, 12 (December 2010):2311-2316.Survey, 2003, 2004, and 2005Oregon: Low-income adult Medicaid recipients with incomes under 100% FPL
  • Examines effects of premium and cost sharing increases for poor adults enrolled in Oregon’s Medicaid program. In 2003, Oregon made a range of policy changes to its Medicaid program, the Oregon Health Plan (OHP), which included benefit reductions, increased premiums and cost sharing and stricter premium payment policies for adults enrolled in its OHP Standard program. Enrollees in OHP Plus continued to receive benefits similar to the original OHP.
  • OHP Standard enrollees were nearly twice as likely to have unmet health care needs and cost was a more significant driver of unmet need than for Plus enrollees.
  • OHP Standard enrollees were less likely to have had a primary care or emergency room visit than Plus members, but were 68% more likely to have indicated financial strain due to medical costs.
Robert A Lowe, et. al., “Impact of Policy Changes on Emergency Department Use by Medicaid Enrollees in Oregon,” Medical Care 48,7 (July 2010): 619-627.State administrative data, 2001-2004.Oregon: Low-income nonelderly adults enrolled in Medicaid
  • Examines effects of premium and cost sharing increases for poor adults in Oregon affected emergency department use. In 2003, Oregon made a range of policy changes to its Medicaid program, the Oregon Health Plan (OHP), which included benefit reductions, increased premiums and cost sharing and stricter premium payment policies for adults enrolled in its OHP Standard program. Enrollees in OHP Plus continued to receive benefits similar to the original OHP. These changes included $50 copayments for emergency department use.
  • Following the change, emergency department utilization among OHP Standard enrollees dropped 18% compared to OHP Plus enrollees who did not have a copay increase for emergency department care. The rate of emergency department visits leading to hospitalization fell 24% and patterns for injury-related visits and psychiatric visits excluding chemical dependency exhibit a similar pattern to overall emergency department visits.
  • Additional analysis finds increases in inpatient costs and increases in cost per emergency department visits. The authors note that these additional findings suggest that the decrease in emergency department visits that led to hospitalizations may reflect OHP Standard enrollees deferring necessary care as much as they defer optional care.
Joel F Farley, “Medicaid Prescription Cost Containment and Schizophrenia: A Retrospective Examination,” Medical Care 48, 5 (May 2010): 440-447.CMS Medicaid Analytical Extract Data Files, 2001-2003Mississippi: Medicaid patients with schizophrenia
  • Examines the effects of Medicaid policy changes in Mississippi on compliance to anti-psychotic medications and mental health care utilization and payments among patients with schizophrenia. In 2002, Mississippi enacted several policies to curb prescription spending, including increasing prescription copayments from $1 to $3 per brand and instituting a cap of seven prescriptions per month, a 34-day supply limitation, and a 5% reduction in dispensing fees.
  • After the changes, patients in Mississippi were 4.87% less compliant with antipsychotic treatments and experienced 20.5% more antipsychotic treatment gaps than patients in control states. There also was a 3.7% reduction in outpatient mental health visits and a 4.2% reduction in mental health care payments.
Daniel M Hartung, et. al., “Impact of a Medicaid Copayment Policy on Prescription Drug and Health Services Utilization in a Fee-for-service Medicaid Population,” Medical Care 46, 6 (June 2008):565-572.State claims data, 2002- 2004


Oregon: Non-pregnant adults (parents receiving Temporary Assistance for Needy Families, individuals with disabilities, and elderly individuals) enrolled in Medicaid, receiving care on a fee-for-service basis
  • Assesses the impact of increased copayments for prescription drugs on medication and health services utilization among Medicaid enrollees in Oregon with certain chronic conditions. In 2003, Oregon implemented new copay requirements, including $2 for generic drugs, $3 for brand name drugs, and $3 for outpatient services.
  • Utilization of all prescription drugs decreased significantly by 17.2% immediately after the policy change, and there was no significant change in the overall trend. This finding suggests that the impact of the copay was immediately realized and sustained. However, because the trend did not change, there was not continued decline over time.
  • The impact of the copay differed across drug classes. The smallest decrease was among use of cardiovascular medications and the largest decreases were in use of drugs for depression (20%) and respiratory disease (19%).
  • Immediately following the policy change, patients with diabetes, respiratory disease, depression, and schizophrenia had smaller reductions in use of drugs for their conditions compared to non-indicated drugs. However, trend data suggest that, although patients may have initially resisted reducing use of medication for their condition, over the longer term this medication use was reduced.
  • Overall, there were no significant changes in utilization observed in outpatient office visits, hospitalizations, and emergency room encounters.
Gene LeCouteur, Michael Perry, Samantha Artiga and David Rousseau, The Impact of Medicaid Reductions in Oregon: Focus Group Insights, (Washington, DC: Kaiser Commission on Medicaid and the Uninsured, December 2004).Focus groups, 2004Oregon: Adults enrolled in Medicaid with incomes under 100% FPL
  • Assesses the impacts of policy changes in Oregon’s Medicaid program on poor adults. In 2003, Oregon made a range of policy changes to its Medicaid program, the Oregon Health Plan (OHP), which included benefit reductions, increased premiums and cost sharing and stricter premium payment policies for adults enrolled in its OHP Standard program. Enrollees in OHP Plus continued to receive benefits similar to the original OHP.
  • Many respondents indicated that the copayments were difficult to afford and impeded access to needed care and prescription drugs. Others noted that the small copayments added up quickly when ongoing care or multiple medications were needed.
Leighton Ku, et. al., The Effects of Copayments on the Use of Medical Services and Prescription Drugs in Utah’s Medicaid Program, (Washington, DC: Center on Budget and Policy Priorities, November 2004).Utah Department of Health (UDOH) data, 2001-2002Utah: Adults enrolled in Medicaid
  • Examines the effect of copayment increases in Utah’s Medicaid program. In 2001 and 2002, Utah began imposing copayments in its Medicaid program for low-income parents, as well as for low-income senior citizens and people with disabilities. The state subsequently increased copayments for certain groups.
  • The analysis showed that copays resulted in significant reductions in utilization of services, including physician and inpatient services, although an earlier Utah Department of Health study had shown no significant changes in utilization of these services. In contrast to the earlier analysis, this analysis used a new model that assumed either a flat or positive trend in utilization absent policy changes to determine if copays significantly affected utilization.
Office of the Executive Director, 2003 Utah Public Health Outcome Measures Report, (Salt Lake City, UT: UT Department of Health, December 2003), http://www.hpm.umn.edu/ ambul_db/db/pdflibrary/ DBfile_49007.pdfMedicaid Administrative Data 2001-2003 and Medicaid Benefits Survey 2003Utah: Adults enrolled in Medicaid
  • Examines the effect of copayment increases in Utah’s Medicaid program. In 2001 and 2002, Utah began imposing copayments in its Medicaid program for low-income parents, as well as for low-income senior citizens and people with disabilities. The state subsequently increased copayments for certain groups.
  • Copay requirements had no statistically significant impact on utilizations except in a few cases: prescriptions and outpatient claims.
  • For a subset of the population, the copays for physician services and pharmacy created a financial burden. While some enrollees reported getting needed dental care by paying for it themselves, a greater number had dental needs that were not addressed, primarily due to inability to pay.

Table 3: Effects On State Budgets & Providers

State Studies

Table 3: Effects on State Budgets & Providers
CitationData Study Population(s)Study Focus and Major Findings
State Specific Studies
Bisakha Sen, et. al., “Health Expenditure Concentration and Characteristics of High-Cost Enrollees in CHIP,” Inquiry 53 (May 2016):1-9.Claims data, 1999 – 2011Alabama: Children enrolled in CHIP
  • Determines whether expenditures for high-cost enrollees in a state public health program change in response to changes in cost sharing policies. In October 2003, Alabama raised premiums and copayments for most non-preventive services for children in its CHIP program.
  • Nominal increases in cost sharing are likely to have minimal effects on cost containment. Results show that cost sharing had limited impact on utilization among high-cost enrollees. Increased cost sharing does not reduce cost concentration or average expenditure among high-cost utilizers.
Marisa Elena Domino, et. al., “Increasing Time Cost and Copayments for Prescription Drugs: An Analysis of Policy Changes in a Complex Environment,” Health Services Research 46, 3 (June 2011):900-919.Medicaid claims data from the Centers for Medicare & Medicaid Services (CMS), 2000- 2002North Carolina: Nonelderly adults enrolled in Medicaid
  • Estimates the effects of policy changes in the North Carolina Medicaid program on medication adherence and expenditures. The North Carolina Medicaid program decreased the allowable supply per prescription from 100 days to 34 days on July 1, 2001, and then increased the copayment for brand name drugs in October 2001.
  • The copayment policy resulted in a net increase in Medicaid expenditures. Costs increased in five of the six examined drug classes, with increases ranging from 0.4% to 8.0%. This reflected increased probability of using services in four of the six drug categories, and increases in the level of spending among service users in two categories.
Maryland Department of Health and Mental Hygiene, Estimated Medicaid Savings and Program Impacts of Service Limitations, Copayments, and Premiums, (Baltimore, MD: Maryland Department of Health and Mental Hygiene, December 2010), https://mmcp.dhmh.maryland.gov/Documents/medicaidsavingsJCRfinal12-10.pdf.2009 state Medicaid dataMaryland: Medicaid and CHIP enrollees
  • Estimates potential state savings of implementing copayments in the Maryland Medicaid program.
  • After excluding exempt populations, increased copayments could be applied to only 21% of total Maryland Medicaid enrollees.
  • The maximum potential gross savings accrued from applying the highest allowable cost sharing across all categories of enrollees is estimated to be $8.5M in state funds. However, the study notes that this amount overestimates potential actual savings because it does not reflect the cap on cost sharing of 5% of household income, decreased or delays in utilization of essential and preventive health services that may result in increased utilization of more expensive services later on, or additional administrative costs of implementing new copayment requirements.
Stephen Zuckerman, Dawn M Miller, and Emily Shelton Page, “Missouri’s 2005 Medicaid Cuts: How Did they Affect Enrollees and Providers?,” Health Affairs 28, 2, (2009):w335-w345.State administrative data; Current Population Survey (CPS) data, 2005-2007; provider utilization and financial reports; and structured interviewsMissouri: Nonelderly adults and children in Medicaid and CHIP
  • Examines the effects of a broad range of policy changes in Missouri Medicaid and CHIP coverage, including new monthly premiums for CHIP. In 2005, Missouri adopted large policy changes to Medicaid and CHIP, including new monthly premiums of 1-5% of family income for children in CHIP with incomes above 150% FPL.
  • Community health centers saw a shift in patients from those covered to those who were uninsured, with the drop off most pronounced for CHIP, which experienced large enrollment declines following introduction of the new premiums. The number of CHIP visits to community health centers declined by about 25%, while the number of visits by uninsured patients increased 29%.
Robert A Lowe, et. al. “Impact of Medicaid Cutbacks on Emergency Department Use: The Oregon Experience,” Annals of Emergency Medicine 52, 6 (December 2008):626-534.Hospital billing data from 26 Oregon emergency departments, 2002-2004Oregon: Emergency department visits
  • Examines effects of benefit reductions in Oregon’s Medicaid program on emergency department use. In 2003, Oregon made a range of policy changes to its Medicaid program, the Oregon Health Plan (OHP), which included benefit reductions, increased premiums and cost sharing, and stricter premium payment policies for adults enrolled in its OHP Standard program. Enrollees in OHP Plus continued to receive benefits similar to the original OHP.
  • After the changes, there was an abrupt 20% increase in emergency department utilization by uninsured individuals, while there was a decrease in visits with OHP coverage. The increase was even larger among uninsured individuals with behavioral health conditions.
  • The proportion of emergency department visits that resulted in hospital admission also increased.
Health Management Associates, Co-pays for Nonemergent Use of Hospital Emergency Rooms: Cost Effectiveness and Feasibility Analysis, Prepared for the Texas Health and Human Services Commission, (Austin, TX: Health and Human Services Commission, May 2008).N/ATexas: Medicaid enrollees
  • Fiscal analysis on the cost effectiveness of charging a co-pay for non-emergency use of the emergency room in the Texas Medicaid program.
  • The savings that would likely be obtained from diversion from and avoidance of the emergency room would likely be less than the cost of administering the policy. The study estimated the state would save about $153,000 over a two-year period from emergency room diversions, but it would have cost the state $2.9 million to collect the payments.
Neal T Wallace, et. al., “How Effective are Copayments in Reducing Expenditures for Low-Income Adult Medicaid Beneficiaries? Experience from the Oregon Health Plan,” Health Services Research 43, 3 (April 2008):515-530.Medicaid eligibility, claims and encounter data, November 2001-October 2002 and May 2003-April 2004Oregon: Nonelderly adults enrolled in Medicaid
  • Determines the impact of introducing copayments on medical care use and expenditures for low-income adult Medicaid beneficiaries in Oregon. In 2003, Oregon made a range of policy changes to its Medicaid program, the Oregon Health Plan (OHP), which included benefit reductions, increased premiums and cost sharing and stricter premium payment policies for adults enrolled in its OHP Standard program. Enrollees in OHP Plus continued to receive benefits similar to the original OHP.
  • Total expenditures per person remained unchanged despite reductions in use. Use and expenditures per person decreased for pharmacy but increased for inpatient and hospital outpatient services. Ambulatory professional and emergency department use decreased, but expenditures remained unchanged as expenditures per service user rose.
  • Authors conclude that applying copayments shifted treatment patterns but did not provide expected savings.
Gina A Livermore, et. al., “Premium Increases in State Health Insurance Programs: Lessons from a Case Study of the Massachusetts Medicaid Buy-in Program,” Inquiry 44 (Winter 2007):428-442.2002-2003 Medicaid Management Information System (MMIS) and administrative dataMassachusetts: Enrollees in the Massachusetts CommonHealth-Working (CH-W) Medicaid buy-in program for people with disabilities
  • Evaluates the impact of premium increases on disenrollment in a state-funded Medicaid buy-in program for people with disabilities in Massachusetts. In 2003, monthly premiums for the Massachusetts CommonHealth-Working (CH-W) program increased from $37 to $51.
  • The revised premium schedule resulted in an estimated 39% increase in CH-W premium revenues during the six-month period following the change. Revenues increased without a significant reduction in enrollment.
  • Authors suggest that several aspects of the program may contribute to the limited impact on disenrollment, including it being a longstanding program, the changes increasing existing premiums rather than introducing new premiums, the exemption of enrollees with incomes under 150% FPL from premiums, the analysis accounting for the movement of enrollees to other categories of Medicaid coverage, and other administrative procedures, including processes designed to minimize disenrollment due to nonpayment. Further, people with disabilities may be less price-sensitive to premiums given their significant health care needs.
Genevieve Kenney, et. al., “Assessing Potential Enrollment and Budgetary Effects of SCHIP Premiums: Findings from Arizona and Kentucky,” Health Services Research 42, 6 Part 2 (2007):2354-2372.State administrative data, 2001 to 2004/2005Arizona and Kentucky: Children enrolled in CHIP with family incomes between 101-150% FPL in Arizona and 151-200% FPL in Kentucky.
  • Assesses whether new premiums in CHIP affect rates of disenrollment and reenrollment in CHIP and whether they have spillover enrollment effects on Medicaid. In July 2004, Arizona introduced CHIP premiums ranging from $10-$15 per month for families with incomes between 101-150% FPL. In December 2003, Kentucky introduced a premium of $20 per month per family for children in CHIP with family incomes between 151-200% FPL.
  • The amount of premiums collected net of the costs associated with administering premiums is small in both states. The maximum amount of projected state-level savings implied by this analysis represented just 1.2% of SCHIP spending in Arizona and 6.8% of SCHIP spending in Kentucky. Further, if premiums increase enrollment in other programs that would further limit savings to states.
Arizona Health Care Cost Containment System, Fiscal Impact of Implementing Cost Sharing and Benchmark Benefit Provisions of the Federal Deficit Reduction Act of 2005, (Phoenix, AZ: Arizona Health Care Cost Containment System, December 2006), http://citeseerx.ist.psu.edu/viewdoc/download?doi=10.1.1.482.6057&rep=rep1&type=pdf.N/AArizona: Medicaid program
  • Assesses fiscal impacts associated with implementing premiums and cost sharing as allowed under the Deficit Reduction Act in the Arizona Medicaid program.
  • The maximum amount that could be captured from premiums and cost sharing after accounting for the federal share would be significantly less than administrative costs.
  • Imposing additional cost sharing on enrollees receiving long term care services may have an adverse fiscal impact on the state; members unable to pay cost-sharing may need to forego necessary medical services while others may choose to move into nursing facilities.
  • New premiums may increase disenrollment, resulting in more uninsured and increased uncompensated care for the state’s hospitals.
  • Premiums can lead to high member turnover, making care management difficult.
Tricia J Johnson, Mary Rimsza, and William G Johnson, “The Effects of Cost-Shifting in the State Children’s Health Insurance Program,” American Journal of Public Health 96, 4 (April 2006):709-715.Yuma HealthQuery (YHQ) community health data, 2001Arizona: Children in Yuma County, Arizona who received non-traumatic care at an emergency room and were enrolled in CHIP or uninsured
  • Simulates the effects of increasing CHIP premiums on health care use and public costs using data for children in Yuma, Arizona.
  • Estimates that a $10 increase in monthly premiums for CHIP would induce 10% of CHIP children to disenroll, resulting in a 6% increase in public expenditures. Specifically, it is estimated that increases in the number of uninsured children would increase emergency department visits and inpatient hospitalization visits, and decrease the number of physician visits.
Mark Gardner and Janet Varon, Moving Immigrants from a Medicaid Look-Alike Program to Basic Health in Washington State: Early Observations, (Washington, DC: Kaiser Family Foundation, May 2004).State administrative data, key informant interviews, a focus group, and interviews, September 2002-September 2003Washington State: Immigrant families moved from Medicaid to Basic Health in Washington State
  • Assesses the impact of changes in coverage options for low-income immigrants in Washington State. In 2002, Washington State eliminated three state-funded programs for individuals whose immigration status prevented them from qualifying for Medicaid. Instead, “slots” were set aside for them in the state’s Basic Health program, which charges premiums and has more limited benefits than Medicaid.
  • Providers saw a substantial increase in the demand for charity care and emergency services after more than half of families lost coverage during the first few months of the transition.
John McConnell and Neal Wallace, Impact of Premium Changes in the Oregon Health Plan, Prepared for the Office for Oregon Health Policy & Research, (Portland, OR: Oregon Health & Science University, February 2004.State administrative data, January 2002 – October 2003Oregon: Adults with incomes below 100% FPL who disenrolled from Medicaid
  • Examines the effects of changes to Oregon’s Medicaid program on enrollment and highlights the effects for enrollees at different income levels. In 2003, Oregon made a range of policy changes to its Medicaid program, the Oregon Health Plan (OHP), which included benefit reductions, increased premiums and cost sharing and stricter premium payment policies for adults enrolled in its OHP Standard program. Enrollees in OHP Plus continued to receive benefits similar to the original OHP.
  • Potential premium revenues fell from approximately $800,000 per month to $500,000 per month in late 2003 due to large coverage losses following the premium increases. As such, potential premium revenues after the premium increase were equal to approximately 65% of potential revenues prior to the change.
Steven Crawford and Garth L Splinter, It’s Health Care, Not Welfare: Appropriate Rate Structure for Services Rendered and Estimated Percent of Co-Pays Collected Under the Medicaid Program, Prepared for the Oklahoma Health Care Authority, (Oklahoma City, OK: Oklahoma Health Care Authority, January 2004).Survey of physicians and other providers in OklahomaOklahoma: Physicians and other health care providers
  • Estimates the percentage of allowed copayments collected by Medicaid providers in Oklahoma.
  • On average, providers collected only 29% of the copay amounts from Medicaid recipients.


Pamela Hines, et. al., Assessing the Early Impacts of OHP2: A Pilot Study of Federally Qualified Health Centers Impact in Multnomah and Washington Counties, Prepared for Office for Oregon Health Policy & Research, (Salem, OR: Office for Oregon Health Policy & Research, December 2003).Interviews with health center administrators and physicians in the Portland, Oregon metropolitan area.Oregon: Health center administrators and physicians in the Portland, Oregon metropolitan area.
  • Assesses the impacts of changes in the Oregon Medicaid program on federally qualified health centers in the Portland, Oregon area. In 2003, Oregon made a range of policy changes to its Medicaid program, the Oregon Health Plan (OHP), which included benefit reductions, increased premiums and cost sharing and stricter premium payment policies for adults enrolled in its OHP Standard program. Enrollees in OHP Plus continued to receive benefits similar to the original OHP.
  • Administrators and physicians reported diverting considerable clinic resources to finding resources for patients who lost their Medicaid coverage following the premium increases and noted that copayments were causing an increased number of “no shows,” which also wastes resources and can contribute to provider revenue shortfalls.
  • Respondents indicated that limited resources intended to help the uninsured were stretched to meet the new gaps in coverage. For example, when Portland area physicians saw that many of their Medicaid patients were not filling their prescriptions due to copayments, they diverted some of the funds for the uninsured to help these patients.


Endnotes

  1. See Maine Department of Health and Human Services, 1115 Waiver Application, http://www.maine.gov/dhhs/oms/documents/Draft_MaineCare_1115_application.pdf; State of Wisconsin BadgerCare Reform Demonstration Project, Coverage of Adults Without Dependent Children with Income at or Below 100 Percent of the Federal Poverty Level, Draft 1115 Demonstration Waiver Amendment Application, https://www.dhs.wisconsin.gov/badgercareplus/clawaiver-app.pdf; Office of the Governor, Kentucky Health: Helping to Engage and Achieve Long Term Health, https://www.medicaid.gov/Medicaid-CHIP-Program-Information/By-Topics/Waivers/1115/downloads/ky/ky-health-pa.pdf; and Indiana Family and Social Services Administration, Health Indiana Plan (HIP) Section 1115 Waiver Extension Application, https://www.in.gov/fssa/hip/files/HIP_Extension_Waiver_FINAL1.pdf. ↩︎
  2. Tricia Brooks, et. al., Medicaid and HCIP Eligibility, Enrollment, Renewal, and Cost-Sharing Policies as of January 2017: Findings form a 50-State Survey, (Washington, DC: Kaiser Family Foundation, January 2017), https://modern.kff.org/report-section/medicaid-and-chip-eligibility-enrollment-renewal-and-cost-sharing-policies-as-of-january-2017-introduction/. ↩︎
  3. Ibid. ↩︎
  4. Ibid. ↩︎
  5. Gery P Guy, et. al., “The Role of Public and Private Insurance Expansions and Premiums for Low-Income Parents: Lessons from State Experiences,” Medical Care 55, 3 (March 2017):236-243. ↩︎
  6. Salam Abdus, et. al., “Children’s Health Insurance Program Premiums Adversely Affect Enrollment, Especially Among Lower-Income Children,” Health Affairs 33, no.8 (August 2014): 1353-1360. ↩︎
  7. Carole R Gresenz, Sarah E Edgington, Miriam J Laugesen and Jose J Escarce, “Income Eligibility Thresholds, Premium Contributions, and Children’s Coverage Outcomes: A Study of CHIP Expansions,” Health Services Research 48:2, Part II (April 2013):884-902. ↩︎
  8. Gery P Guy, Jr., E. Kathleen Adams, and Adam Atherly, “Public and Private Health Insurance Premiums: How do they Affect Health Insurance Status of Low-Income Childless Adults?” Inquiry 49 (Spring 2012):52-64. ↩︎
  9. Jack Hadley, et. al., “Insurance Premiums and Insurance Coverage of Near-Poor Children,” Inquiry 43, 4 (Winter 2006/2007). ↩︎
  10. Genevieve Kenney, Jack Hadley, and Fredric Blavin, “Effects of Public Premiums on Children’s Health Insurance Coverage: Evidence from 1999 to 2003,” Inquiry 43 (Winter 2006/2007):345-361. ↩︎
  11. The Lewin Group, Healthy Indiana Plan 2.0: POWER Account Contribution Assessment, Prepared for Indiana Family and Social Services Administration (FSSA), (Washington, DC: Lewin Group, March 2017). ↩︎
  12. MaryBeth Musumeci, et. al., An Early Look at Medicaid Expansion Waiver Implementation in Michigan and Indiana, (Washington, DC: Kaiser Family Foundation, January 2017), https://modern.kff.org/report-section/an-early-look-at-medicaid-expansion-waiver-implementation-in-michigan-and-indiana-key-findings/. ↩︎
  13. James Marton et. al., “Estimating Premium Sensitivity for Children’s Public Health Insurance Coverage: Selection but No Death Spiral,” Health Services Research 50, 2 (April 2015): 579-598. ↩︎
  14. Laura Dague, “The Effect of Medicaid Premiums on Enrollment: A Regression Discontinuity Approach,” Journal of Health Economics 37 (May 2014): 1-12. ↩︎
  15. Michael Hendryx, et al., “Effects of a Cost-Sharing Policy on Disenrollment from a State Health Insurance Program,” Social Work in Public Health, 27, 7 (2012):671-686. ↩︎
  16. Michael M Morrisey, et.al., “The Effects of Premium Changes on ALL Kids, Alabama’s CHIP Program,” Medicare & Medicaid Research Review 2,3 (2012):E1-E17. ↩︎
  17. Bill J Wright, et. al., “Raising Premiums and Other Costs for Oregon Health Plan Enrollees Drove Many to Drop Out,” Health Affairs, 29, 12 (December 2010):2311-2316. ↩︎
  18. Michael R Cousineau, Kai-Ya Tsai, and Howard A Kahn, “Two Responses to a Premium Hike in a Program for Uninsured Kids: 4 in 5 Families Stay In as Enrollment Shrinks by a Fifth,” Health Affairs 31, 2 (February 2012):360-366. ↩︎
  19. James Marton, Patricia G Ketsche, and Mei Zhou, “SCHIP Premiums, Enrollment, and Expenditures: A Two State, Competing Risk Analysis,” Health Economics 19 (2010):772-791. ↩︎
  20. James Marton and Jeffery C Talbert, “CHIP Premiums, Health Status, and the Insurance Coverage of Children,” Inquiry 47, 3 (Fall 2010):199-214. ↩︎
  21. Stephen Zuckerman, Dawn M Miller, and Emily Shelton Page, “Missouri’s 2005 Medicaid Cuts: How Did they Affect Enrollees and Providers?” Health Affairs 28, 2, (2009):w335-w345. ↩︎
  22. Jill B Herndon, W Bruce Vogel, Richard L Bucciarelli and Elizabeth A Shenkman, “The Effect of Premium Changes on SCHIP Enrollment Duration,” Health Services Research 43, 2 (April 2008):458-477. ↩︎
  23. James Marton, “The Impact of the Introduction of Premiums into a SCHIP Program,” Journal of Policy Analysis and Management 26 (2007):237-255. ↩︎
  24. Genevieve Kenney, et. al., “Assessing Potential Enrollment and Budgetary Effects of SCHIP Premiums: Findings from Arizona and Kentucky,” Health Services Research 42, 6 Part 2 (2007):2354-2372. ↩︎
  25. Gina A Livermore, et. al., “Premium Increases in State Health Insurance Programs: Lessons from a Case Study of the Massachusetts Medicaid Buy-in Program,” Inquiry 44 (Winter 2007):428-442. ↩︎
  26. Genevieve Kenney, et. al., “The Effects of Premium Increases on Enrollment in SCHIP Programs: Findings from Three States,” Inquiry, 43, 4 (Winter 2006/2007):378-92. ↩︎
  27. Tricia J Johnson, Mary Rimsza, and William G Johnson, “The Effects of Cost-Shifting in the State Children’s Health Insurance Program,” American Journal of Public Health, 96, 4 (April 2006):709-715. ↩︎
  28. Bill J Wright et. al., “The Impact of Increased Cost Sharing on Medicaid Enrollees,” Health Affairs 24, no. 4 (Jul/Aug 2005):1106-1116. ↩︎
  29. Matthew J Carlson and Bill Wright, “The Impact of Program Changes on Enrollment, Access, and Utilization in the Oregon Health Plan Standard Population,” Prepared for the Office for Oregon Health Policy and Research, Sociology Faculty Publications and Presentations, Paper 14 (March 2005). ↩︎
  30. Rachel Solotaroff, et. al., “Medicaid Programme Changes and the Chronically Ill: Early Results from a Prospective Cohort Study of the Oregon Health Plan,” Chronic Illness 1, (2005): 191-205. ↩︎
  31. Gene LeCouteur, Michael Perry, Samantha Artiga and David Rousseau, The Impact of Medicaid Reductions in Oregon: Focus Group Insights, (Washington, DC: Kaiser Commission on Medicaid and the Uninsured, December 2004). ↩︎
  32. Utah Department of Health Center for Health Data, Utah Primary Care Network Disenrollment Report, (Salt Lake City, UT: Utah Department of Health Center for Health Data, Office of Health Care Statistics, August 2004). ↩︎
  33. Mark Gardner and Janet Varon, Moving Immigrants from a Medicaid Look-Alike Program to Basic Health in Washington State: Early Observations, (Washington, DC: Kaiser Family Foundation, May 2004). ↩︎
  34. Maryland Department of Health and Mental Hygiene, Maryland Children’s Health Insurance Program: Assessment of the Impact of Premiums, (Baltimore, MD: Department of Health and Mental Hygiene, April 2004). ↩︎
  35. John McConnell and Neal Wallace, Impact of Premium Changes in the Oregon Health Plan, Prepared for the Office for Oregon Health Policy & Research, (Portland, OR: Oregon Health & Science University, February 2004. ↩︎
  36. Norma I Gavin, et. al., Evaluation of the BadgerCare Medicaid Demonstration, Prepared by RTI International and MayaTech Corp. for the Centers for Medicare & Medicaid Services, (Research Triangle Park, NC: RTI International and MayaTech Corporation, December 2003). ↩︎
  37. Monette Goodrich, Joan Alker, and Judith Solomon, Families at Risk: The Impact of Premiums on Children and Parents in Husky A, Policy Brief (Washington, DC: Georgetown Center for Children and Families, November 2003), http://ccf.georgetown.edu/wp-content/uploads/2012/03/Far%20-%20impact%20of%20premiums.pdf. ↩︎
  38. Elizabeth Shenkman, et. al., “Disenrollment and Re-Enrollment Patters in a SCHIP Program,” Health Care Financing Review 23, 3 (Spring 2002):47-63. ↩︎
  39. Leighton Ku and Teresa A Coughlin, “Sliding-Scale Premium Health Insurance Programs: Four States’ Experiences,” Inquiry 36, 4 (Winter 1999/2000). ↩︎
  40. Gery P Guy, et. al., “The Role of Public and Private Insurance Expansions and Premiums for Low-Income Parents: Lessons from State Experiences,” Medical Care 55, 3 (March 2017):236-243. ↩︎
  41. Salam Abdus, et. al., “Children’s Health Insurance Program Premiums Adversely Affect Enrollment, Especially Among Lower-Income Children,” Health Affairs 33, no.8 (August 2014): 1353-1360. ↩︎
  42. Carole R Gresenz, Sarah E Edgington, Miriam J Laugesen and Jose J Escarce, “Income Eligibility Thresholds, Premium Contributions, and Children’s Coverage Outcomes: A Study of CHIP Expansions,” Health Services Research 48:2, Part II (April 2013):884-902. ↩︎
  43. Bill J Wright, et. al., “Raising Premiums and Other Costs for Oregon Health Plan Enrollees Drove Many to Drop Out,” Health Affairs, 29, 12 (December 2010):2311-2316. ↩︎
  44. James Marton, Patricia G Ketsche, and Mei Zhou, “SCHIP Premiums, Enrollment, and Expenditures: A Two State, Competing Risk Analysis,” Health Economics 19 (2010):772-791. ↩︎
  45. Genevieve Kenney, et. al., “Assessing Potential Enrollment and Budgetary Effects of SCHIP Premiums: Findings from Arizona and Kentucky,” Health Services Research 42, 6 Part 2 (2007):2354-2372. ↩︎
  46. Bill J Wright et. al., “The Impact of Increased Cost Sharing on Medicaid Enrollees,” Health Affairs 24, no. 4 (Jul/Aug 2005):1106-1116. ↩︎
  47. Matthew J Carlson and Bill Wright, “The Impact of Program Changes on Enrollment, Access, and Utilization in the Oregon Health Plan Standard Population,” Prepared for the Office for Oregon Health Policy and Research, Sociology Faculty Publications and Presentations, Paper 14 (March 2005). ↩︎
  48. Gene LeCouteur, Michael Perry, Samantha Artiga and David Rousseau, The Impact of Medicaid Reductions in Oregon: Focus Group Insights, (Washington, DC: Kaiser Commission on Medicaid and the Uninsured, December 2004). ↩︎
  49. Utah Department of Health Center for Health Data, Utah Primary Care Network Disenrollment Report, (Salt Lake City, UT: Utah Department of Health Center for Health Data, Office of Health Care Statistics, August 2004). ↩︎
  50. Michael Hendryx, et al., “Effects of a Cost-Sharing Policy on Disenrollment from a State Health Insurance Program,” Social Work in Public Health, 27, 7 (2012):671-686. ↩︎
  51. Bill J Wright et. al., “The Impact of Increased Cost Sharing on Medicaid Enrollees,” Health Affairs 24, no. 4 (Jul/Aug 2005):1106-1116. ↩︎
  52. Matthew J Carlson and Bill Wright, “The Impact of Program Changes on Enrollment, Access, and Utilization in the Oregon Health Plan Standard Population,” Prepared for the Office for Oregon Health Policy and Research, Sociology Faculty Publications and Presentations, Paper 14 (March 2005). ↩︎
  53. Gene LeCouteur, Michael Perry, Samantha Artiga and David Rousseau, The Impact of Medicaid Reductions in Oregon: Focus Group Insights, (Washington, DC: Kaiser Commission on Medicaid and the Uninsured, December 2004). ↩︎
  54. Utah Department of Health Center for Health Data, Utah Primary Care Network Disenrollment Report, (Salt Lake City, UT: Utah Department of Health Center for Health Data, Office of Health Care Statistics, August 2004). ↩︎
  55. Matthew J Carlson and Bill Wright, “The Impact of Program Changes on Enrollment, Access, and Utilization in the Oregon Health Plan Standard Population,” Prepared for the Office for Oregon Health Policy and Research, Sociology Faculty Publications and Presentations, Paper 14 (March 2005). ↩︎
  56. Rachel Solotaroff, et. al., “Medicaid Programme Changes and the Chronically Ill: Early Results from a Prospective Cohort Study of the Oregon Health Plan,” Chronic Illness 1, (2005): 191-205. ↩︎
  57. Gery P Guy, et. al., “The Role of Public and Private Insurance Expansions and Premiums for Low-Income Parents: Lessons from State Experiences,” Medical Care 55, 3 (March 2017):236-243. ↩︎
  58. Genevieve Kenney, Jack Hadley, and Fredric Blavin, “Effects of Public Premiums on Children’s Health Insurance Coverage: Evidence from 1999 to 2003,” Inquiry 43 (Winter 2006/2007):345-361. ↩︎
  59. Michael M Morrisey, et.al., “The Effects of Premium Changes on ALL Kids, Alabama’s CHIP Program,” Medicare & Medicaid Research Review 2,3 (2012):E1-E17. ↩︎
  60. Jill B Herndon, W Bruce Vogel, Richard L Bucciarelli and Elizabeth A Shenkman, “The Effect of Premium Changes on SCHIP Enrollment Duration,” Health Services Research 43, 2 (April 2008):458-477. ↩︎
  61. Genevieve Kenney, et. al., “The Effects of Premium Increases on Enrollment in SCHIP Programs: Findings from Three States,” Inquiry, 43, 4 (Winter 2006/2007):378-92. ↩︎
  62. Bill J Wright et. al., “The Impact of Increased Cost Sharing on Medicaid Enrollees,” Health Affairs 24, no. 4 (Jul/Aug 2005):1106-1116. ↩︎
  63. Matthew J Carlson and Bill Wright, “The Impact of Program Changes on Enrollment, Access, and Utilization in the Oregon Health Plan Standard Population,” Prepared for the Office for Oregon Health Policy and Research, Sociology Faculty Publications and Presentations, Paper 14 (March 2005). ↩︎
  64. Rachel Solotaroff, et. al., “Medicaid Programme Changes and the Chronically Ill: Early Results from a Prospective Cohort Study of the Oregon Health Plan,” Chronic Illness 1, (2005): 191-205. ↩︎
  65. John McConnell and Neal Wallace, Impact of Premium Changes in the Oregon Health Plan, Prepared for the Office for Oregon Health Policy & Research, (Portland, OR: Oregon Health & Science University, February 2004. ↩︎
  66. The Lewin Group, Healthy Indiana Plan 2.0: POWER Account Contribution Assessment, Prepared for Indiana Family and Social Services Administration (FSSA), (Washington, DC: Lewin Group, March 2017). ↩︎
  67. Bill J Wright et. al., “The Impact of Increased Cost Sharing on Medicaid Enrollees,” Health Affairs 24, no. 4 (Jul/Aug 2005):1106-1116. ↩︎
  68. Matthew J Carlson and Bill Wright, “The Impact of Program Changes on Enrollment, Access, and Utilization in the Oregon Health Plan Standard Population,” Prepared for the Office for Oregon Health Policy and Research, Sociology Faculty Publications and Presentations, Paper 14 (March 2005). ↩︎
  69. Office of the Executive Director, 2003 Utah Public Health Outcome Measures Report, (Salt Lake City, UT: UT Department of Health, December 2003), http://www.hpm.umn.edu/ ambul_db/db/pdflibrary/ DBfile_49007.pdf ↩︎
  70. Rachel Solotaroff, et. al., “Medicaid Programme Changes and the Chronically Ill: Early Results from a Prospective Cohort Study of the Oregon Health Plan,” Chronic Illness 1, (2005): 191-205. ↩︎
  71. Gene LeCouteur, Michael Perry, Samantha Artiga and David Rousseau, The Impact of Medicaid Reductions in Oregon: Focus Group Insights, (Washington, DC: Kaiser Commission on Medicaid and the Uninsured, December 2004). ↩︎
  72. John McConnell and Neal Wallace, Impact of Premium Changes in the Oregon Health Plan, Prepared for the Office for Oregon Health Policy & Research, (Portland, OR: Oregon Health & Science University, February 2004. ↩︎
  73. The Lewin Group, Healthy Indiana Plan 2.0: POWER Account Contribution Assessment, Prepared for Indiana Family and Social Services Administration (FSSA), (Washington, DC: Lewin Group, March 2017). ↩︎
  74. Salam Abdus, et. al., “Children’s Health Insurance Program Premiums Adversely Affect Enrollment, Especially Among Lower-Income Children,” Health Affairs 33, no.8 (August 2014): 1353-1360. ↩︎
  75. Genevieve Kenney, Jack Hadley, and Fredric Blavin, “Effects of Public Premiums on Children’s Health Insurance Coverage: Evidence from 1999 to 2003,” Inquiry 43 (Winter 2006/2007):345-361. ↩︎
  76. Michael M Morrisey, et.al., “The Effects of Premium Changes on ALL Kids, Alabama’s CHIP Program,” Medicare & Medicaid Research Review 2,3 (2012):E1-E17. ↩︎
  77. Genevieve Kenney, et. al., “The Effects of Premium Increases on Enrollment in SCHIP Programs: Findings from Three States,” Inquiry, 43, 4 (Winter 2006/2007):378-92. ↩︎
  78. James Marton et. al., “Estimating Premium Sensitivity for Children’s Public Health Insurance Coverage: Selection but No Death Spiral,” Health Services Research 50, 2 (April 2015): 579-598. ↩︎
  79. Michael M Morrisey, et.al., “The Effects of Premium Changes on ALL Kids, Alabama’s CHIP Program,” Medicare & Medicaid Research Review 2,3 (2012):E1-E17. ↩︎
  80. James Marton and Jeffery C Talbert, “CHIP Premiums, Health Status, and the Insurance Coverage of Children,” Inquiry 47, 3 (Fall 2010):199-214. ↩︎
  81. Jill B Herndon, W Bruce Vogel, Richard L Bucciarelli and Elizabeth A Shenkman, “The Effect of Premium Changes on SCHIP Enrollment Duration,” Health Services Research 43, 2 (April 2008):458-477. ↩︎
  82. Ibid. ↩︎
  83. Rachel Solotaroff, et. al., “Medicaid Programme Changes and the Chronically Ill: Early Results from a Prospective Cohort Study of the Oregon Health Plan,” Chronic Illness 1, (2005): 191-205. ↩︎
  84. James Marton et. al., “Estimating Premium Sensitivity for Children’s Public Health Insurance Coverage: Selection but No Death Spiral,” Health Services Research 50, 2 (April 2015): 579-598. ↩︎
  85. Michael M Morrisey, et.al., “The Effects of Premium Changes on ALL Kids, Alabama’s CHIP Program,” Medicare & Medicaid Research Review 2,3 (2012):E1-E17. ↩︎
  86. Joseph P Newhouse and the Insurance Experiment Group, Free For All? Lessons from the RAND Health Insurance Experiment, (Arlington, VA, RAND, 1993). ↩︎
  87. Amitabh Chandra, Jonathan Gruber and Robin McKnight, “The Impact of Patient Cost-Sharing on Low-Income Populations: Evidence from Massachusetts,” Journal of Health Economics 33 (2014): 57-66. ↩︎
  88. Charles Stoecker, Alexandra M Stewart, and Megan C Lindley, “The Cost of Cost-Sharing: The Impact of Medicaid Benefit Design on Influence Vaccination Uptake,” Vaccines 5, 8, (March 2017). ↩︎
  89. Bisakha Sen, et. al., “Can Increases in CHIP Copayments Reduce Program Expenditures on Prescription Drugs?” Medicare & Medicaid Research Review 4, 2 (May 2014). ↩︎
  90. Bisakha Sen, et. al., “Did Copayment Changes Reduce Health Service Utilization among CHIP Enrollees? Evidence from Alabama,” Health Services Research 47, 4 (September 2012):1303-1620. ↩︎
  91. Daniel M Hartung, et. al., “Impact of a Medicaid Copayment Policy on Prescription Drug and Health Services Utilization in a Fee-for-service Medicaid Population,” Medical Care 46, 6 (June 2008):565-572. ↩︎
  92. Office of the Executive Director, 2003 Utah Public Health Outcome Measures Report, (Salt Lake City, UT: UT Department of Health, December 2003), http://www.hpm.umn.edu/ ambul_db/db/pdflibrary/ DBfile_49007.pdf ↩︎
  93. Ibid. ↩︎
  94. Bisakha Sen, et. al., “Did Copayment Changes Reduce Health Service Utilization among CHIP Enrollees? Evidence from Alabama,” Health Services Research 47, 4 (September 2012):1303-1620. ↩︎
  95. Bill J Wright, et. al., “Raising Premiums and Other Costs for Oregon Health Plan Enrollees Drove Many to Drop Out,” Health Affairs, 29, 12 (December 2010):2311-2316. ↩︎
  96. Leighton Ku, et. al., The Effects of Copayments on the Use of Medical Services and Prescription Drugs in Utah’s Medicaid Program, (Washington, DC: Center on Budget and Policy Priorities, November 2004). ↩︎
  97. Gery P Guy Jr., “The Effects of Cost Sharing on Access to Care among Childless Adults.” Health Services Research, 45, 6 Pt. 1 (December 2010): 1720-1739. ↩︎
  98. Vicki Fung, et. al., “Financial Barriers to Care Among Low-Income Children with Asthma: Health Care Reform Implications,” JAMA Pediatrics 168, 7 (July 2014):649-656. ↩︎
  99. Office of the Executive Director, 2003 Utah Public Health Outcome Measures Report, (Salt Lake City, UT: UT Department of Health, December 2003), http://www.hpm.umn.edu/ ambul_db/db/pdflibrary/ DBfile_49007.pdf ↩︎
  100. Leighton Ku, et. al., The Effects of Copayments on the Use of Medical Services and Prescription Drugs in Utah’s Medicaid Program, (Washington, DC: Center on Budget and Policy Priorities, November 2004). ↩︎
  101. Deliana Kostova and Jared Fox, “Chronic Health Outcomes and Prescription Drug Copayments in Medicaid,” Medical Care, published ahead of print (February 2017). ↩︎
  102. Marisa Elena Domino, et. al., “Increasing Time Cost and Copayments for Prescription Drugs: An Analysis of Policy Changes in a Complex Environment,” Health Services Research 46, 3 (June 2011):900-919. ↩︎
  103. Joel F Farley, “Medicaid Prescription Cost Containment and Schizophrenia: A Retrospective Examination,” Medical Care 48, 5 (May 2010): 440-447. ↩︎
  104. Bisakha Sen, et. al., “Can Increases in CHIP Copayments Reduce Program Expenditures on Prescription Drugs?” Medicare & Medicaid Research Review 4, 2 (May 2014). ↩︎
  105. Michael Chernew, et. al., “Effects of Increased Patient Cost Sharing on Socioeconomic Disparities in Health Care,” Journal of General Internal Medicine 23, 8 (August 2008):1131-1136. ↩︎
  106. Sujha Subramanian, “Impact of Medicaid Copayments on Patients with Cancer,” Medical Care 49, 9 (September 2011): 842-847. ↩︎
  107. Office of the Executive Director, 2003 Utah Public Health Outcome Measures Report, (Salt Lake City, UT: UT Department of Health, December 2003), http://www.hpm.umn.edu/ ambul_db/db/pdflibrary/ DBfile_49007.pdf ↩︎
  108. James Marton, et. al., “The Effects of Medicaid Policy Changes on Adults’ Service Use Patterns in Kentucky and Idaho,” Medicare & Medicaid Research Review 2, 4 (February 2013). ↩︎
  109. Ibid. ↩︎
  110. Bisakha Sen, et. al., “Can Increases in CHIP Copayments Reduce Program Expenditures on Prescription Drugs?” Medicare & Medicaid Research Review 4, 2 (May 2014). ↩︎
  111. Amitabh Chandra, Jonathan Gruber and Robin McKnight, “The Impact of Patient Cost-Sharing on Low-Income Populations: Evidence from Massachusetts,” Journal of Health Economics 33 (2014): 57-66. ↩︎
  112. Deliana Kostova and Jared Fox, “Chronic Health Outcomes and Prescription Drug Copayments in Medicaid,” Medical Care, published ahead of print (February 2017). ↩︎
  113. Sujha Subramanian, “Impact of Medicaid Copayments on Patients with Cancer,” Medical Care 49, 9 (September 2011): 842-847. ↩︎
  114. Daniel M Hartung, et. al., “Impact of a Medicaid Copayment Policy on Prescription Drug and Health Services Utilization in a Fee-for-service Medicaid Population,” Medical Care 46, 6 (June 2008):565-572. ↩︎
  115. Deliana Kostova and Jared Fox, “Chronic Health Outcomes and Prescription Drug Copayments in Medicaid,” Medical Care, published ahead of print (February 2017). ↩︎
  116. Jessica Greene, Rebecca M Sacks, and Sara B McMenamin, “The Impact of Tobacco Dependence Treatment Coverage and Copayments in Medicaid,” American Journal of Preventive Medicine 46, 4 (April 2014):331-336. ↩︎
  117. Vicki Fung, et. al., “Financial Barriers to Care Among Low-Income Children with Asthma: Health Care Reform Implications,” JAMA Pediatrics 168, 7 (July 2014):649-656. ↩︎
  118. Leah Zallman, et. al., “Affordability of Health Care Under Publicly Subsidized Insurance After Massachusetts Health Care Reform: A Qualitative Study of Safety Net Patients,” International Journal for Equity in Health 14 (October 2015):112. ↩︎
  119. Leah Zallman, et.al., “Perceived Affordability of Health Insurance and Medical Financial Burdens Five Years in to Massachusetts Health Reform,” International Journal for Equity in Health 14 (October 2015):113. ↩︎
  120. Bill J Wright, et. al., “Raising Premiums and Other Costs for Oregon Health Plan Enrollees Drove Many to Drop Out,” Health Affairs, 29, 12 (December 2010):2311-2316. ↩︎
  121. Gene LeCouteur, Michael Perry, Samantha Artiga and David Rousseau, The Impact of Medicaid Reductions in Oregon: Focus Group Insights, (Washington, DC: Kaiser Commission on Medicaid and the Uninsured, December 2004). ↩︎
  122. Office of the Executive Director, 2003 Utah Public Health Outcome Measures Report, (Salt Lake City, UT: UT Department of Health, December 2003), http://www.hpm.umn.edu/ ambul_db/db/pdflibrary/ DBfile_49007.pdf ↩︎
  123. Deliana Kostova and Jared Fox, “Chronic Health Outcomes and Prescription Drug Copayments in Medicaid,” Medical Care, published ahead of print (February 2017). ↩︎
  124. Vicki Fung, et. al., “Financial Barriers to Care Among Low-Income Children with Asthma: Health Care Reform Implications,” JAMA Pediatrics 168, 7 (July 2014):649-656. ↩︎
  125. Peter J Cunningham, Affording Prescription Drugs: Not Just a Problem for the Elderly, (Washington, DC: Center for Studying Health System Change, April 2002), http://www.hschange.org/CONTENT/430/430.pdf. ↩︎
  126. Rachel Solotaroff, et. al., “Medicaid Programme Changes and the Chronically Ill: Early Results from a Prospective Cohort Study of the Oregon Health Plan,” Chronic Illness 1, (2005): 191-205. ↩︎
  127. Lindsay M Sabik and Sabina Ohri Gandhi, “Copayments and Emergency Department use Among Adult Medicaid Enrollees,” Health Economics 25 (May 2016):529-542. ↩︎
  128. Karoline Mortensen, “Copayments Did Not Reduce Medicaid Enrollees’ Nonemergency Use of Emergency Departments,” Health Affairs 29, 9 (September 2010): 1643-1650. ↩︎
  129. Mona Siddiqui, Eric T Roberts, and Craig E Pollack, “The Effects of Emergency Department Copayments for Medicaid Beneficiaries Following the Deficit Reduction Act of 2005,” JAMA Internal Medicine 175,3 (March 2015):393-398. ↩︎
  130. Bisakha Sen, et. al., “Health Expenditure Concentration and Characteristics of High-Cost Enrollees in CHIP,” Inquiry 53 (May 2016):1-9. ↩︎
  131. Marisa Elena Domino, et. al., “Increasing Time Cost and Copayments for Prescription Drugs: An Analysis of Policy Changes in a Complex Environment,” Health Services Research 46, 3 (June 2011):900-919. ↩︎
  132. Maryland Department of Health and Mental Hygiene, Estimated Medicaid Savings and Program Impacts of Service Limitations, Copayments, and Premiums, (Baltimore, MD: Maryland Department of Health and Mental Hygiene, December 2010), https://mmcp.dhmh.maryland.gov/Documents/medicaidsavingsJCRfinal12-10.pdf. ↩︎
  133. Health Management Associates, Co-pays for Nonemergent Use of Hospital Emergency Rooms: Cost Effectiveness and Feasibility Analysis, Prepared for the Texas Health and Human Services Commission, (Austin, TX: Health and Human Services Commission, May 2008). ↩︎
  134. Neal T Wallace, et. al., “How Effective are Copayments in Reducing Expenditures for Low-Income Adult Medicaid Beneficiaries? Experience from the Oregon Health Plan,” Health Services Research 43, 3 (April 2008):515-530. ↩︎
  135. Arizona Health Care Cost Containment System, Fiscal Impact of Implementing Cost Sharing and Benchmark Benefit Provisions of the Federal Deficit Reduction Act of 2005, (Phoenix, AZ: Arizona Health Care Cost Containment System, December 2006), http://citeseerx.ist.psu.edu/viewdoc/download?doi=10.1.1.482.6057&rep=rep1&type=pdf. ↩︎
  136. Steven Crawford and Garth L Splinter, It’s Health Care, Not Welfare: Appropriate Rate Structure for Services Rendered and Estimated Percent of Co-Pays Collected Under the Medicaid Program, Prepared for the Oklahoma Health Care Authority, (Oklahoma City, OK: Oklahoma Health Care Authority, January 2004). ↩︎
  137. Gina A Livermore, et. al., “Premium Increases in State Health Insurance Programs: Lessons from a Case Study of the Massachusetts Medicaid Buy-in Program,” Inquiry 44 (Winter 2007):428-442. ↩︎
  138. Stephen Zuckerman, Dawn M Miller, and Emily Shelton Page, “Missouri’s 2005 Medicaid Cuts: How Did they Affect Enrollees and Providers?,” Health Affairs 28, 2, (2009):w335-w345. ↩︎
  139. Mark Gardner and Janet Varon, Moving Immigrants from a Medicaid Look-Alike Program to Basic Health in Washington State: Early Observations, (Washington, DC: Kaiser Family Foundation, May 2004). ↩︎
  140. Pamela Hines, et. al., Assessing the Early Impacts of OHP2: A Pilot Study of Federally Qualified Health Centers Impact in Multnomah and Washington Counties, Prepared for Office for Oregon Health Policy & Research, (Salem, OR: Office for Oregon Health Policy & Research, December 2003). ↩︎
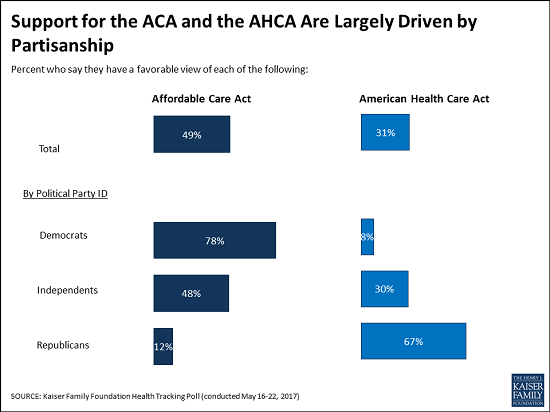
  141. Robert A Lowe, et. al. “Impact of Medicaid Cutbacks on Emergency Department Use: The Oregon Experience,” Annals of Emergency Medicine 52, 6 (December 2008):626-534. ↩︎
  142. Mark Gardner and Janet Varon, Moving Immigrants from a Medicaid Look-Alike Program to Basic Health in Washington State: Early Observations, (Washington, DC: Kaiser Family Foundation, May 2004). ↩︎
  143. Pamela Hines, et. al., Assessing the Early Impacts of OHP2: A Pilot Study of Federally Qualified Health Centers Impact in Multnomah and Washington Counties, Prepared for Office for Oregon Health Policy & Research, (Salem, OR: Office for Oregon Health Policy & Research, December 2003). ↩︎
News Release

How do Premiums and Cost Sharing Affect Low-Income People in Medicaid?

Published: Jun 1, 2017

A new issue brief from the Kaiser Family Foundation reviews what the research shows about the effects of premiums and cost sharing on low-income populations in Medicaid and the Children’s Health Insurance Program (CHIP), drawing upon 65 peer-reviewed studies and government and research and policy organization reports and studies published between 2000 and March 2017.

The review comes at a time when some state and federal policymakers have proposed allowing state Medicaid programs to charge higher premiums and cost sharing of enrollees, either through changes in law or new Medicaid waivers. Proponents of increasing these costs say that it will promote personal responsibility, prepare people to transition to private insurance and prompt consumers to be conscious of value in making health and health care decisions.

The review of the research shows that premiums serve as a barrier to obtaining and maintaining coverage for low-income individuals, particularly for those with the most limited incomes. It also shows that even relatively small levels of cost sharing of $1 to $5 are associated with reduced utilization of services, including vaccines and preventive and primary care, and negative health outcomes, such as increased rates of uncontrolled hypertension and reduced treatment for children with asthma. Further, the research suggests that state budget savings from premiums and cost sharing in Medicaid and CHIP are limited and offset by administrative expenses, increased disenrollment from coverage and increased use of more expensive services, such as emergency room care. Research also finds premiums and cost sharing can put pressures on safety net providers, with increases in uninsured patients in hospital emergency rooms and community health centers. Specific effects on individuals, providers, and state costs depend on how premiums and cost sharing are structured and implemented.

News Release

Poll: Public Views the ACA More Favorably Than Congress’ Plan to Replace It, Though Republicans Favor the Replacement

Majority Says the Senate Either Should Make Major Changes or Not Pass The House Bill At All, While About a Third Want the Senate to Pass It As Is or With Only Minor Changes

Published: May 31, 2017

Public Grows More Pessimistic About How Repeal Will Affect Them Personally

Most (55%) of the public holds an unfavorable view of the Congressional plan that would repeal and replace the Affordable Care Act, and the same share (55%) want the Senate either to make major changes to the House-passed bill or not pass it all, finds the latest Kaiser Health Tracking Poll.

Three in 10 (31%) of the public hold favorable views of the American Health Care Act, which narrowly passed the House on May 4 and is now under consideration in the Senate. In comparison, about half (49%) of the public hold a favorable views of the Affordable Care Act.

There are large partisan divisions on these questions, with far more Republicans holding favorable views of the replacement plan (67%) than of the ACA (12%).  The opposite is true for Democrats, and among independents, more also hold favorable views of the ACA (48%) than of the replacement bill (30%).

In spite of these views, a majority of the public (74%) believe it is” likely” that the president and Congress will repeal and replace the ACA. At the same time, relatively few say the Senate should adapt the American Health Care Act as passed by the House (8%) or with only minor changes (24%). Most want the Senate either to make major changes (26%) or not pass it at all (29%).

Public Growing More Pessimistic About How Repeal Would Affect Them Personally

The poll also finds the public more pessimistic about the replacement bill now than they were in December after the elections but before Congress put forward specific legislation. Nearly half (45%) of the public now says the replacement bill would result in higher health care costs for their family, compared to about a quarter (28%) who said so in December. In addition, a third now expect their ability to get and keep health insurance and the quality of their health care to get worse under the pending bill, compared to about one in five that said so in December.

Other findings include:

  • A majority of the public (63%) continue to say that President Trump and Republicans in Congress are responsible for any problems with the Affordable Care Act moving forward, more than twice the share who say President Obama and Democrats in Congress are responsible. Those considering Republicans responsible includes most Democrats (77%) and independents (63%), and half (49%) of Republicans.
  • Few (14%) believe that the House-passed bill fulfills all or most of President Trump’s promises on health care, while three quarters (76%) say it fulfills none (35%) or some (40%) of them. Among Republicans, twice as many say it fulfills none or some of the President’s promises (59%) as say it fulfills all or most of them (30%).

The poll also includes additional questions on Medicaid, which will be released separately later this week.

Designed and analyzed by public opinion researchers at the Kaiser Family Foundation, the poll was conducted from May 16 – 22 among a nationally representative random digit dial telephone sample of 1,205 adults. Interviews were conducted in English and Spanish by landline (421) and cell phone (784). The margin of sampling error is plus or minus 3 percentage points for the full sample. For results based on subgroups, the margin of sampling error may be higher.

Kaiser Health Tracking Poll – May 2017: The AHCA’s Proposed Changes to Health Care

Authors: Ashley Kirzinger, Bianca DiJulio, Liz Hamel, Elise Sugarman, and Mollyann Brodie
Published: May 31, 2017

Findings

KEY FINDINGS:

  • With Congress currently discussing the American Health Care Act (AHCA), a plan that would repeal and replace the 2010 health care law, this month’s Kaiser Health Tracking Poll finds that more Americans have an unfavorable view of the plan than a favorable one (55 percent vs. 31 percent, respectively). The share with favorable views of the AHCA is about 20 percentage points lower than the share with favorable views (49 percent) of the 2010 Affordable Care Act (ACA). The majority of Republicans (67 percent) have a favorable view of the AHCA.
  • This month’s survey finds the public has increasingly negative views of how their health care will be affected by proposed changes. In December 2016, after the presidential election but before the release of the Republican plan, less than one-third of the public thought their health care would get worse if the 2010 health care law was repealed. This month’s survey, fielded after House Republicans passed the AHCA, finds larger shares say the cost of health care for them and their family (45 percent), their ability to get and keep health insurance (34 percent), and the quality of their own health care will get worse if Congress passes the AHCA (34 percent).
  • About one in ten (8 percent) think the Senate should pass the AHCA as is, without making any changes to the plan passed by the House. Similar shares – about one-fourth of the public – think the Senate should make either major changes to the legislation (26 percent) or minor changes to it (24 percent), while about three in ten (29 percent) say they do not think the Senate should pass this bill.

The American Health Care Act

On May 4, 2017, the U.S. House of Representatives passed the American Health Care Act (AHCA), the House Republicans’ plan to repeal and replace the Affordable Care Act (ACA).1  With the Senate currently debating the plan and discussing their own approach, the most recent Kaiser Health Tracking Poll finds more Americans have an unfavorable view of the AHCA than a favorable one (55 percent vs. 31 percent, respectively). There is also a considerable enthusiasm gap with a larger share saying that they have a “very unfavorable” view (40 percent) than saying they have a “very favorable” view (12 percent).

Figure 1: More View the AHCA Unfavorably than Favorably

Majority of Republicans Hold A Favorable View of the AHCA

The AHCA has solid support among the Republican base. Two-thirds of Republicans say they have a favorable view of the plan including three in ten (29 percent) who say they have a “very favorable” view.

Figure 2: More Republicans Have a Favorable View of the AHCA than Independents and Democrats

Few See AHCA As Fulfilling President Trump’s Promises About Health Care

Three-fourths (76 percent) of the public thinks the health care plan recently passed by the House does not fulfill most of the promises President Trump has made about health care while 14 percent say it fulfills most or all of his promises.

Figure 3: Few Think the AHCA Fulfills All or Most of President Trump’s Promises on Health Care

This viewpoint is shared regardless of party identification with majorities of Democrats (86 percent), independents (79 percent), and Republicans (59 percent) saying the AHCA fulfills some or none of the promises President Trump has made about health care.

Table 1: Majorities of Democrats, Independents, and RepublicansDo Not Think the AHCA Fulfills Most of President Trump’s Health Care Promises
Do you think that the health care plan that recently passed the House fulfills all, most, some, or none of the promises President Trump has made about health care?TotalDemocratsIndependentsRepublicans
All/Most (NET)14%8%11%30%
    All4346
    Most104724
Some/None (NET)76867959
    Some40274651
    None3559338
Don’t know/Refused1171012

More Americans View The ACA Favorably Than The AHCA

The Kaiser Family Foundation has been tracking public opinion on the ACA since its passage in 2010. This month’s survey continues to find the public leans more favorable than unfavorable in their views of the 2010 health care law, with 49 percent expressing a favorable view of the ACA compared to 42 perecent expressing an unfavorable view.

Figure 4: Public Continues to Lean Favorable in Views of ACA

In fact, more of the public is favorable in their overall views of the ACA than in their views of the Republican plan to replace the 2010 health care law. About half of Americans have a favorable view of the ACA compared to about three in ten who have a favorable view of the new Republican plan.

Figure 5: More View the ACA Favorably than View the AHCA Favorably

Partisanship is the main driver behind support for either the ACA or the AHCA, with a majority of Republicans viewing the AHCA favorably (67 percent), while a majority of Democrats view the ACA favorably (78 percent). More independents view the ACA favorably (48 percent) than view the AHCA favorably (30 percent).

Despite the lack of support for the House Republican plan, a majority of the public (74 percent) say they think it is either “very likely” (37 percent) or “somewhat likely” (36 percent) that the president and Congress will repeal and replace the ACA. About one-fourth of the public say it is either “not too likely” (15 percent) or “not likely at all” (9 percent).

Figure 6: Three-Fourths of the Public Say They Think It’s Likely that the President and Congress Will Repeal and Replace the ACA

Most Americans Want Changes to the AHCA Before Senate Passes the Bill

About one in ten (8 percent) think the Senate should pass the AHCA as is, without making any changes to the plan passed by the House. Similar shares – about one-fourth of the public – think the Senate should make either major changes to the legislation (26 percent) or minor changes to it (24 percent), while about three in ten say they do not think the Senate should pass this bill.

Figure 7: Few Want Senate to Pass AHCA As Is, Half Want Major or Minor Changes to Legislation

Attitudes toward what the Senate should do when it comes to the AHCA are largely driven by partisanship with most Republicans (60 percent) saying they think it should pass as is (15 percent) or with minor changes (45 percent) while half of Democrats (51 percent) say the Senate should not pass this bill. Independents are more divided but one-third (34 percent) say the Senate should make major changes to the bill.

Table 2: Most Republicans Want the Senate to Pass Bill As Is or Make Minor Changes to It, While Democrats Do Not Want the Senate to Pass It
A health care plan, known as the American Health Care Act, recently passed the U.S. House of Representatives and is now being debated by the Senate. Do you think the Senate should pass this bill as is, make minor changes to it, make major changes to it, or not pass this bill?TotalDemocratsIndependentsRepublicans
Pass this bill as is8%6%5%15%
Make minor changes to it24152245
Make major changes to it26223417
Not pass this bill2951255
Don’t know/Refused1371417

Attitudes Towards AHCA Provisions

The AHCA – like other health care plans – includes complex policies that the public may not fully understand or pay attention to. In an effort to examine general attitudes towards several of the more well-known provisions, we ask respondents whether after hearing about the specific provision they are “more likely” or “less likely” to support the plan. Much like overall attitudes towards the AHCA, various provisions of the law asked about in this survey do not garner large levels of support from the public. When asked whether individual elements of the Republican replacement plan would make them “more likely” or “less likely” to support the plan, none of the elements receive a majority of the public saying it would make them “more likely” to support it.  The only provision that has a larger share of the public saying it makes them “more likely” than say it makes them “less likely” to support the law is allowing states to implement a Medicaid work requirement (42 percent compared to 28 percent).

There are several provisions currently included in the plan that a majority of the public say makes them “less likely” to support the legislation. These include allowing states to decide if health insurance companies can charge sick people more than healthy people if they haven’t had continuous coverage (65 percent), eliminating the individual mandate and instead allowing insurance companies to charge people 30% higher premiums for a year if they haven’t had continuous coverage (62 percent), allowing states to eliminate the essential health benefit requirement (60 percent), and making changes that would generally decrease what younger people pay for insurance and increase what older people pay (58 percent).

Table 3: Individual Elements of AHCA Affect Likelihood of Support for Plan
I’m going to read you several specific elements included in the health care plan that passed the House. Please tell me if each makes you more or less likely to support the plan, or does not make much difference.More likely to supportLess likely to supportDoes not make much difference
Allows states to require adults without disabilities to be working or looking for work in order to get health insurance through Medicaid42%28%27%
Provides federal funding for states to cover people with pre-existing conditions through separate high-risk pools363231
Cuts federal funding that was included in the 2010 health care law for states that expanded Medicaid to cover more lower-income people234334
Changes Medicaid so that instead of matching state spending, the federal government reduces what it pays states and gives states more flexibility to decide who and what services to cover234232
Stops federal payments to Planned Parenthood clinics for health care services provided to people on Medicaid for one year224830
Allows states to let health insurance companies cut back on the benefits they cover so they could sell cheaper plans that do not cover benefits like hospitalization, prescription drugs, maternity care, and mental health services206020
Eliminates the taxes and tax increases on higher-income people imposed by the Affordable Care Act184930
Decreases the financial help available to lower-income people who buy their own insurance and increases the financial help available to middle- and upper-income people155132
Makes changes that would generally decrease what younger people pay for insurance and increase what older people pay145828
Allows states to decide if health insurance companies can charge sick people more than healthy people if they haven’t had continuous coverage126522
Eliminates the requirement for nearly all Americans to have health insurance but allows insurance companies to charge people 30% higher premiums for a year if they haven’t had continuous coverage126224
NOTE: Items asked of half samples. Don’t know/Refused responses not shown.

Republican Support for Some Aspects of the AHCA

There is some support for aspects of the AHCA among Republicans. For example, a majority of Republicans say that the Medicaid work requirement (75 percent) and federal funding for states to set up high-risk pools (59 percent) makes them more likely to support the plan. In addition, about four in ten Republicans say the same about the provisions which stop federal Medicaid payments to Planned Parenthood (45 percent), change Medicaid funding to a per capita cap or block grant system (45 percent), allow states to change the essential health benefits (42 percent), and end the funding for Medicaid expansion (40 percent).

Figure 8: Some AHCA Provisions Popular Among Republicans

Perceived Effects of the AHCA

Overall, about half of Americans say the quality of their own health care (48 percent) and their own ability to get and keep health insurance (47 percent) will stay about the same if the president and Congress pass the health care plan currently being discussed. When it comes to the cost of health care for them and their family, almost half say it will get worse (45 percent) while about one-third say it will stay about the same (36 percent) and 16 percent say it will get better.

Figure 9: Half Say Their Own Quality of Care and Access to Coverage Won’t Change Under AHCA; But Half Expect Their Costs to Be Worse

Immediately following the 2016 presidential election and prior to the release of the Republican plan, most Americans thought that their health care would stay about the same if the 2010 health care law was repealed. Yet, in this month’s survey which was fielded after House Republicans passed the AHCA, larger shares say the cost of health care for them and their family, their ability to get and keep health insurance, and the quality of their own health care will get worse if Congress passes the AHCA.

Figure 10: Public Now More Pessimistic About How Changes to ACA Will Impact Their Quality, Access to Care & Cost

Medicaid

KEY FINDINGS:

  • The American Health Care Act (AHCA) includes substantial changes to Medicaid – the program that provides coverage for medical care and long-term care services to low-income people. Overall, six in ten Americans (58 percent) say Medicaid is either “very” or “somewhat” important for them and their family – including a majority of Democrats (64 percent) and independents (57 percent) and nearly half (46 percent) of Republicans.
  • The AHCA reduces federal funding for Medicaid expansion in states. The vast majority of the public – including a majority of Democrats (93 percent), independents (83 percent), and Republicans (71 percent) – say it is important that states that received federal funds to expand Medicaid continue to receive those funds.
  • Currently, Medicaid is jointly financed by federal and state governments, with each state deciding how to structure benefits, eligibility, and care delivery within guidelines set by the federal government. Seven in ten (71 percent) Americans prefer keeping Medicaid largely as it is today while fewer (26 percent) support changing Medicaid to allow states more flexibility in determining which groups of people and what services are covered under the program.

Proposed Changes to Medicaid

This month’s Kaiser Health Tracking Poll examines attitudes towards the AHCA’s changes to Medicaid2  – the program that provides coverage for medical care and long-term care services to low-income people. Overall, six in ten Americans (58 percent) say Medicaid is either “very” or “somewhat” important for them and their family – including a majority of Democrats (64 percent) and independents (57 percent) and 46 percent of Republicans.

Figure 1: More than Half of Americans Say Medicaid Is Important for Their Family; Fewer Republicans Say So

Those who say Medicaid is either “very” or “somewhat” important for them and their family are more pessimistic about how their own health care will be affected if the president and Congress pass the health care plan currently being discussed. About half (53 percent) of those who say Medicaid is important for them and their family say their cost of health care will get worse compared to one-third of those who say Medicaid is not important for them. The shares who say their ability to get and keep health insurance and the overall quality of their own health care would get worse are also larger among those who say Medicaid is important compared to those who say it is not important for them (42 percent vs. 23 percent, 41 percent vs. 25 percent, respectively).

Figure 2: Those Who Say Medicaid Is Important Are More Negative About How AHCA Will Impact Their Quality, Access, and Cost

Public Supports Continued Funding for Medicaid Expansion

The 2010 Affordable Care Act expanded Medicaid coverage to over 11 million low-income, uninsured adults.3  The AHCA reduces federal funding for Medicaid expansion by 2020. The vast majority of the public – including a majority of Democrats, independents, and Republicans – say it is important that states that received federal funds to expand Medicaid continue to receive those funds.

Table 1: Majorities of Democrats, Independents, and Republicans Say Continued Federal Funding for Medicaid Expansion Is Important

If lawmakers decide to repeal and replace the 2010 health care law, how important is it to you that a replacement plan makes sure states that received federal funds to expand Medicaid continue to receive those funds?


TotalDemocratsIndependentsRepublicans
Important (NET)84%93%83%71%
    Very important58785635
    Somewhat important26162736
Not important (NET)1461528
    Not too important73715
    Not at all important73813
Don’t know/Refused1121

Support for continued funding for Medicaid expansion is even popular among individuals living in states that have not expanded their Medicaid program.

Figure 3: Large Majorities Say Continued Funding for Medicaid Expansion Is Important

Changes to Federal Funding for Medicaid

Currently, Medicaid is jointly financed by federal and state governments, with each state deciding how to structure benefits, eligibility, and care delivery within guidelines set by the federal government. The federal government matches state spending on an open-ended basis but the AHCA proposes changing this system so that instead of matching state Medicaid spending, the federal government would limit the amount it gives states to help pay for Medicaid coverage but could allow states more flexibility in determining which groups of people and what services are covered under the program.

When asked about a change to the financing structure, 71 percent say they think Medicaid should largely continue as it is today with the federal government guaranteeing coverage, setting standards and benefits, and matching state spending while fewer (26 percent) say Medicaid should be changed. Democrats and independents largely favor the status quo (90 percent and 70 percent, respectively) while Republicans are more divided, with a similar share supporting the status quo (47 percent) as do the proposal to change the funding structure (48 percent).

Figure 4: Most Americans Oppose Changing Medicaid to Block Grant System, But Republicans Are Divided

Partisanship Affects Basic Perceptions of Medicaid

Partisanship contributes to the public’s general perceptions of the Medicaid program. When asked whether Medicaid is more similar to other health insurance programs or to welfare programs, more Americans view Medicaid like other health insurance programs (60 percent) that help people pay for health care than view it as a welfare program (37 percent). Yet, these perceptions are largely driven by partisanship with Democrats and independents more likely to view Medicaid as a health insurance program and Republicans more likely to view it as a welfare program.

Figure 5: Democrats and Independents More Likely to View Medicaid as Health Insurance; Half of Republicans See It More Like Welfare

Methodology

This Kaiser Health Tracking Poll was designed and analyzed by public opinion researchers at the Kaiser Family Foundation (KFF). The survey was conducted May 16-22, 2017, among a nationally representative random digit dial telephone sample of 1,205 adults ages 18 and older, living in the United States, including Alaska and Hawaii (note: persons without a telephone could not be included in the random selection process). Computer-assisted telephone interviews conducted by landline (421) and cell phone (784, including 470 who had no landline telephone) were carried out in English and Spanish by Princeton Data Source under the direction of Princeton Survey Research Associates International (PSRAI). Both the random digit dial landline and cell phone samples were provided by Survey Sampling International, LLC. For the landline sample, respondents were selected by asking for the youngest adult male or female currently at home based on a random rotation. If no one of that gender was available, interviewers asked to speak with the youngest adult of the opposite gender. For the cell phone sample, interviews were conducted with the adult who answered the phone. KFF paid for all costs associated with the survey.

The combined landline and cell phone sample was weighted to balance the sample demographics to match estimates for the national population using data from the Census Bureau’s 2015 American Community Survey (ACS) on sex, age, education, race, Hispanic origin, and region along with data from the 2010 Census on population density. The sample was also weighted to match current patterns of telephone use using data from the January-June 2016 National Health Interview Survey. The weight takes into account the fact that respondents with both a landline and cell phone have a higher probability of selection in the combined sample and adjusts for the household size for the landline sample. All statistical tests of significance account for the effect of weighting.

The margin of sampling error including the design effect for the full sample is plus or minus 3 percentage points. Numbers of respondents and margins of sampling error for key subgroups are shown in the table below. For results based on other subgroups, the margin of sampling error may be higher. Sample sizes and margins of sampling error for other subgroups are available by request. Note that sampling error is only one of many potential sources of error in this or any other public opinion poll. Kaiser Family Foundation public opinion and survey research is a charter member of the Transparency Initiative of the American Association for Public Opinion Research.

GroupN (unweighted)M.O.S.E.
Total1205±3 percentage points
Party Identification
   Democrats404±6 percentage points
   Republicans279±7 percentage points
   Independents398±6 percentage points
Trump Approval
   Approve of President Trump446±5 percentage points
   Disapprove of President Trump697±4 percentage points

Endnotes

  1. H.R. 1628 – American Health Care Act of 2017,  115th Congress https://www.congress.gov/bill/115th-congress/house-bill/1628 ↩︎
  2. Kaiser Family Foundation, Compare Proposals to Replace the Affordable Care Act. https://modern.kff.org/interactive/proposals-to-replace-the-affordable-care-act/ ↩︎
  3. Kaiser Family Foundation, Key Facts About the Uninsured Population. https://modern.kff.org/uninsured/fact-sheet/key-facts-about-the-uninsured-population/ ↩︎

Comparison of Medicare Provisions in Recent Bills and Proposals to Repeal and Replace the Affordable Care Act

Authors: Gretchen Jacobson, Shannon Griffin, Cristina Boccuti, and Juliette Cubanski
Published: May 26, 2017

Introduction

Repealing and replacing the Affordable Care Act (ACA) is a top priority of the Trump Administration and the Republican leadership, and is a prominent issue on the agenda of the 115th Congress. The ACA includes many provisions affecting the Medicare program, and lawmakers have taken different approaches to the ACA’s Medicare provisions. Some proposals would fully repeal the ACA, including all Medicare provisions. Other proposals, including the “American Health Care Act of 2017” (AHCA) as passed by the House of Representatives on May 4, 2017, would repeal some but not all Medicare provisions in the ACA.

This brief provides a side-by-side comparison of the Medicare-related provisions in seven bills and proposals that would repeal the ACA, excluding proposals that would not directly affect Medicare. Two of these proposals would repeal the ACA in its entirety, including all Medicare provisions. Three of the proposals, including the AHCA, would repeal some but not all Medicare provisions in the ACA, one proposal would retain all Medicare provisions in the ACA, and one does not specify. The first part of the side-by-side describes the Medicare provisions in the ACA that would be retained or repealed in each bill or proposal. The second part of the side-by-side describes the additional ways in which the bills and proposals would change Medicare, such as structural modifications to the Medicare program (e.g., premium support).

The bills and proposals in this comparison include:

  • “American Health Care Act of 2017,” H.R. 1628, introduced on March 20, 2017 by Rep. Black (R-TN) as chairperson of the House Budget Committee and passed by the House on May 4, 2017.
  • “American Health Care Reform Act of 2017,” H.R. 277, introduced by Rep. Roe (R-TN), on behalf of the Republican Study Committee, in January 2017.
  • “A Better Way,” released by Speaker Ryan (R-WI) in June 2016.
  • “World’s Greatest Healthcare Plan Act of 2016,” H.R. 5284 and S. 2985, introduced by Rep. Sessions (R-TX) and Sen. Cassidy (R-LA) in May 2016.
  • “A Balanced Budget for a Stronger America,” FY2017 Budget Resolution, released by the House Budget Committee, chaired by former Rep. Price (R-GA) (now HHS Secretary), in March 2016.
  • “Restoring Americans’ Healthcare Freedom Reconciliation Act of 2015,” H.R. 3762, introduced by former Rep. Price (R-GA) (now HHS Secretary), passed by the House and Senate, and vetoed by the President in February 2016.
  • “Empowering Patients First Act of 2015,” H.R. 2300, introduced by former Rep. Price (R-GA) (now HHS Secretary) in May 2015.

Each of these bills and proposals make changes to the Medicare program that could have important implications for Medicare beneficiaries, the federal budget, health care providers, or private plans. This brief focuses on the key provisions in each of these bills and proposals that would directly affect Medicare, but is not a comprehensive summary of these bills and proposals.

Table

Comparison of Medicare Provisions in Recent Bills and Proposals to Repeal and Replace the Affordable Care Act (ACA)

“American Health Care Act of 2017,” as passed by the House of Representatives on May 4, 2017Rep. Roe:”American Health Care Reform Act of 2017″Speaker Ryan:”A Better Way”(2016)Rep. Sessions and Sen. Cassidy:”World’s Greatest Healthcare Plan Act of 2016″House Budget Committee:”A Balanced Budget for a Stronger America”(2016)Rep. Price:”Restoring Americans’ Healthcare Freedom Reconciliation Act of 2015″Rep. Price:”Empowering Patients First Act of 2015″
Bill NumberH.R. 1628H.R. 277Not applicableH.R. 5284 / S. 2985Not applicableH.R. 3762H.R. 2300
Medicare-Related Provisions in the ACA
General treatment of Medicare provisions in the ACAWould repeal some ACA Medicare provisions.Would repeal all ACA Medicare provisions.Would repeal some ACA Medicare provisions.No change to ACA Medicare provisions.Would repeal all of “Obamacare”; unspecified whether Medicare provisions would be repealed.Would repeal some ACA Medicare provisions.Would repeal all ACA Medicare provisions.
Reductions in Medicare Payments to Providers and Plans in the ACA
Hospitals and other health care providers: Reduced payments to providers by lowering market basket updates and productivity adjustments and other changesNo change.Would repeal.Would repeal the changes to the hospital wage index system. No other changes specified.No change.Unspecified.No change.Would repeal.
Disproportionate Share Hospital (DSH) payments: Reduced DSH payments to hospitals for uncompensated careWould repeal DSH cuts for FY2020 – FY2025; non-expansion states exempt from DSH cuts for FY2018 – FY2019.Would repeal.Would repeal the FY2018 & FY2019 cuts in Medicare DSH, and create a national pool of uncompensated care funds for DSH hospitals beginning in FY2021.No change.Unspecified.No change.Would repeal.
Medicare Advantage: Reduced federal payments to plans and other provisionsNo change.Would repeal.Would retain ACA reductions in payments to plans.Would repeal the benchmark cap that prevents some plans from receiving full bonus amounts.Would freeze the HHS Secretary’s authority to adjust plan payments for “coding intensity.”No change.Unspecified.No change.Would repeal.
Other Medicare-Related Provisions in the ACA
Delivery system reforms: Established “Innovation Center” (CMMI), new patient care and payment models (such as ACOs), and penalties for hospital readmissions and hospital-acquired conditionsNo change.Would repeal.Would repeal CMMI, beginning in 2020.No change.Unspecified.No change.Would repeal.
Independent Payment Advisory Board (IPAB): Authorized creation of the BoardNo change.Would repeal.Would repeal.No change.Would repeal.No change.Would repeal.
Physician-owned hospitals: Established a moratorium on physician-owned hospitalsNo change.Would repeal.Would repeal.No change.Unspecified.No change.Would repeal.
Part D: Closed the coverage gap (by 2020)No change.Would repeal.No change.No change.Unspecified.No change.Would repeal.
Preventive benefits: Eliminates cost-sharing for most preventive servicesNo change.Would repeal.Unspecified; would charge 20% cost-sharing for all covered services under a restructured benefit redesign (see entry below).No change.Unspecified.No change.Would repeal.
Medicare Premiums and Related Revenue Provisions in the ACA
Income-related premiums: Added income-related Part D premiums and modified income-related Part B premiumsNo change.Would repeal.No change.No change.Unspecified whether provision would be repealed as part of full “Obamacare” repeal.Would require seniors with annual incomes over $1 million to fully cover cost of Part B & D premiums.No change.Would repeal.
Fee on manufacturers and importers of branded prescription drugs: Imposed new feeWould repeal, beginning after December 31, 2016.Would repeal.Would repeal.No change.Unspecified.Would repeal.Would repeal.
Fees on health insurers: Imposed new fees on insurers, including Medicare Advantage and Part D plansWould repeal.Would repeal.Would repeal.No change.Unspecified.Would repeal.Would repeal.
Part A payroll tax: Imposed Part A payroll tax increase on high-earnersWould repeal, beginning after December 31, 2022.Would repeal.Would repeal.No change.Unspecified.Would repeal.Would repeal.
Tax deduction for retiree drug subsidy: Eliminated employer tax deduction of retiree drug subsidy amountWould repeal, beginning after December 31, 2016.Would repeal.Would repeal.No change.Unspecified.Would repeal.Would repeal.
Non-ACA Medicare-Related Provisions
Structural Changes to Medicare
Premium support: Transform Medicare into a premium support systemNot included.Not included.Would implement a premium support system that would include traditional Medicare and private plans for new beneficiaries beginning in 2024, with support payments adjusted for health status and income; no plan could deny coverage to a beneficiary.Would require MedPAC to develop a prototype competitive bidding system by June 2021 that would adjust beneficiaries’ support payments for plans’ historical bids and performance on quality measures.Not included.Would implement a premium support system that would include traditional Medicare and private plans for new beneficiaries, beginning in 2024. Plans would be required to provide the same benefits and services of traditional Medicare, and no plan could deny coverage to a beneficiary.Not included.Not included.
Redesign Parts A and B benefits: Change Medicare’s benefits and cost-sharingNot included.Not includedWould combine Parts A & B with a single deductible, 20% cost-sharing on all covered services, and annual limit on out-of-pocket expenses, beginning in FY2020.Not includedWould combine Parts A & B with a single deductible and annual limit on out-of-pocket expenses, beginning in 2024.Not includedNot included
Raise the age of Medicare eligibilityNot included.Not included.Would increase the age of Medicare eligibility (65) to correspond with that of Social Security (67), beginning in FY2020.Not included.Not included.Not included.Not included.
Medigap and other supplemental coverage: Limit supplemental coverageNot included.Not includedWould restrict Medigap plans from providing first-dollar coverage, beginning in FY2020.Not included.Would reform supplemental insurance; details not specified.Not included.Not included.
Changes Pertaining to Low-Income Beneficiaries (People Dually Eligible for Medicare and Medicaid)
Medicaid block grant for dual eligibles and other Medicaid beneficiariesWould provide a per capita allotment beginning in FY2020. Would provide states the choice between a per capita allotment or a block grant for Medicaid for certain populations for 10 fiscal years, beginning in FY2020 (block grant option not allowed for elderly or blind/disabled population). In 2021 and beyond, per capita amounts would increase by an inflationary factor, which would be medical CPI plus 1 percentage point for the elderly and blind-disabled groups, and medical CPI for other populations.Not included.Would provide states the choice between a per capita allotment or a block grant for Medicaid. States that selected block grants would be required to provide “required services” to dual eligibles. Per capita allotments would begin in 2019.Would provide a per capita allotment for Medicaid. Would not exempt Medicaid-covered services provided to dual eligibles, such as nursing home care. Would exempt Medicaid cost-sharing for qualified Medicare beneficiaries (QMB) and Medicaid administrative costs for determining Part D Low-Income Subsidy eligibility.Would implement “State Flexibility Funds”; details not specified.Not included.Not included.
Medicare Savings Programs (MSPs)Not included.Not included.Would combine all MSPs into one program and require states to use one (unspecified) asset test for beneficiary qualification, beginning in FY2020.Not included.Not included.Not included.Not included.
Changes to Provider Payments
Physician private contracting: Ease constraints on physicians to enter into contracts with beneficiariesNot included.Not included.Would create a “personalized care demonstration” that would allow physicians to enter into private contracts with beneficiaries and provide items/services outside of Medicare.Not included.Not included.Not included.Would allow physicians to enter into contracts with beneficiaries on a patient-by-patient basis and charge prices that are different from Medicare’s physician fee schedule. States would be prohibited from limiting the amount a physician could charge. Would allow patients to seek some reimbursement from Medicare for services received under private contract.
Physician self-referralsNot included.Not included.Not included.Would allow HHS Secretary to waive the ban on physician self-referrals if the Secretary determines it would increase competition, reduce costs, and increase the quality of health care.Not included.Not included.Not included.
Out-of-network emergency careNot included.Not included.Not included.Would limit the amount that could be charged to patients, including Medicare beneficiaries, for out-of-network emergency care.Not included.Not included.Not included.
Other Provisions
Health Savings Accounts (HSAs) for Medicare beneficiariesWould allow persons over age 55 to make catch-up contribution of up to $1,000.Would allow beneficiaries 65 and older who are only enrolled in Part A to enroll in an HSA.Not included.Not included.Not included.Not included.Would allow beneficiaries 65 and older who are only enrolled in Part A to enroll in an HSA.
Medicare Advantage Medical Savings Accounts (MSAs)Not included.Would allow beneficiaries enrolled in Medicare Advantage MSAs to contribute their own money to the MSA.Not included.Not included.Not included.Not included.Would allow beneficiaries enrolled in Medicare Advantage MSAs to contribute their own money to the MSA.
Medicare Advantage quality relative to traditional MedicareNot included.Not included.Would require HHS Secretary to report on Medicare Compare the performance of Medicare Advantage and traditional Medicare for each MSA on a core set of quality measures, beginning in CY2020.Not included.Not included.Not included.Not included.
Medicare claims data: Make data more available and transparentNot included.Would require HHS Secretary to make Medicare claims data public in a searchable database beginning in FY2016.States support for “sharing and analyzing health data”; unspecified whether the statement includes Medicare claims data.Not included.Not included.Not included.Not included.
Budget Instructions and/or Impact
Budget instructions and/or impact as stated in the bill or proposalCBO/JCT estimate: insurance-covered provisions (mostly from changes in DSH payments) would increase Medicare net spending by $43 billion from 2017 through 2026. This estimate does not include changes to Medicare spending and revenue due to other provisions.Budgetary effects would not be entered on PAYGO scorecards.Offsets include lowering the discretionary spending limits (in the BBEDC) for FY2018 though 2021.Not available.Not available.Would reduce Medicare spending by $449 billion from FY2017 through 2026, according to the proposal.Would transfer $379.3 billion to the Federal Hospital Insurance (Part A) Trust Fund, which, according to the bill, represents the amount of on-budget Medicare savings in the bill for FY2016 through 2025.Not available.
NOTES:Additional Acronyms: PAYGO (pay-as-you-go); BBEDC (Balanced Budget and Emergency Deficit Control Act of 1985)Income-related premiums: Income-related, higher premiums apply for incomes over $85,000/year (single) or $170,000/year (couple).”High-earners” (“Part A payroll tax” row) refers to individuals with incomes over $200,000/year (single) or $250,000 (couple).SOURCES:H.R. 1628, 115th Congress (2017-2018), “American Health Care Act of 2017,” introduced March 2017Republican Study Committee, H.R. 277, 115th Congress (2016-2017), “The American Health Care Reform Act,” January 2017A Better Way: Our Vision for a Confident America, Health Care section, June 2016, http://abetterway.speaker.gov/_assets/pdf/ABetterWay-HealthCare-PolicyPaper.pdfH.R. 5284, 114th Congress (2015-2016), “World’s Greatest Healthcare Plan Act of 2016,” May 2016FY2017 Budget Resolution: A Balanced Budget for a Stronger America, March 2016, http://budget.house.gov/uploadedfiles/fy2017_a_balanced_budget_for_a_stronger_america.pdfH.R. 3762, 114th Congress (2015-2016), “To provide for reconciliation pursuant to section 2002 of the concurrent resolution on the budget for fiscal year 2016,” January 2016H.R. 2300, 114th Congress (2015-2016), “Empowering Patients First Act,” May 2015, http://tomprice.house.gov/sites/tomprice.house.gov/files/HR%202300%20Empowering%20Patients%20First%20Act%202015.pdfCongressional Budget Office (CBO) score of H.R. 3762 as of January 4, 2016 available at: https://www.cbo.gov/publication/51107.

American Health Care Act (AHCA) Quiz

Published: May 25, 2017

On May 4, 2017, the US House of Representatives approved the American Health Care Act (AHCA), legislation to repeal and replace the Affordable Care Act (ACA).  On May 24, the Congressional Budget Office scored the latest version of this bill.

Do you think you’re an expert on the AHCA?  Take this quiz to test your knowledge.

Step 1 of 10

Under the AHCA, the individual mandate tax penalty is repealed effective as of what date?(Required)

New England Journal of Medicine: Undermining Genetic Privacy? Employee Wellness Programs and the Law

Authors: Karen Pollitz and Kathy Hudson
Published: May 24, 2017

In this May 2017 post, the Kaiser Family Foundation’s Karen Pollitz and co-author Kathy L. Hudson of Hudson Works LLC, discuss how H.R. 1313, the Preserving Employee Wellness Programs Act, could substantially change current legal protections for the collection and treatment of genetic information and other personal health information under workplace wellness programs. The post is now available from the New England Journal of Medicine.

Implications of Reduced Federal Medicaid Funds: How Could States Fill the Funding Gap?

Authors: Allison Valentine, Robin Rudowitz, and Don Boyd and Lucy Dadayan, Rockefeller Institute of Government
Published: May 24, 2017

Executive Summary

The Congress is currently debating the American Health Care Act (AHCA), which would not only repeal and replace the Affordable Care Act (ACA) but also make far-reaching changes to the structure and financing of Medicaid. The AHCA would use a per capita cap policy or block grants to cap federal funds to states for Medicaid. Facing reductions in federal Medicaid funding, states could offset lost federal dollars by raising taxes or reducing other state spending (like K-12 education), or states could reduce spending in Medicaid by finding savings or (more likely) by restricting eligibility, benefits, or payments to providers. However, many efficiencies were adopted by state Medicaid programs during the last two major recessions when revenues dropped and budgets were constrained leaving states with few options for easy ways to trim additional spending in the future. On March 13, 2017 the Congressional Budget Office (CBO) estimated that the AHCA would reduce federal Medicaid spending by $880 billion over the 2017-2026 period. By 2026, Medicaid spending would be about 25% less than what CBO projects under current law.

In this analysis, we examine the fiscal implications of state actions to offset the loss of federal Medicaid funding to maintain rather than cut Medicaid programs. This analysis is intended to be illustrative and not predictive of actual state outcomes. In contrast, the CBO estimate of a 25% reduction in federal Medicaid funding by 2026 reflects projections and accounts for federal changes in policy, state responses to the policy change, and reductions in coverage.

What does this analysis do? In this analysis, we present three scenarios of reductions in federal Medicaid spending and examine fiscal implications if all reductions had been in full effect in FFY 2015 (the most recent year for which Medicaid spending data is available). In these scenarios, we assume states fill the gaps caused by federal funding reductions by increasing state spending for Medicaid. To achieve those increases, we examine potential implications for state taxes and education spending by state and by groups of states including expansion status, political party, region and poverty quartile and highlight the groups that could experience the largest effects. These results are illustrative: each state would likely make different policy choices, and states could implement a combination of approaches, or choose not to completely offset the federal reduction.

What does this analysis not do? Unlike the CBO estimates, this analysis does not make projections or anticipate changes to state Medicaid programs through reducing eligibility levels, benefits, or reimbursement rates. If states do undertake these changes to their Medicaid programs, federal reductions would likely be larger. This analysis of the impact in FFY 2015 does not assume that states will drop coverage and does not account for states that may have adopted the expansion in the future.

What were the estimated reductions in federal spending in three scenarios? This analysis estimated reductions in federal Medicaid spending under three scenarios: (1) repeal of the ACA enhanced match rate for expansion adults ($27 billion), (2) repeal of the ACA plus a 10% reduction in federal Medicaid spending for the non-expansion population ($53 billion), and (3) repeal of the ACA plus a 20% reduction in federal Medicaid spending for the non-expansion population ($79 billion). All estimates assume that the full effect of the reductions are experienced in FFY 2015. Beyond the repeal of the ACA enhanced matching funds, the reductions are not based on specific policy changes but rather are based on illustrative potential federal Medicaid spending reductions. If states were to maintain Medicaid services, these reductions would require increases in state Medicaid funding to fill in the gaps in federal funding. Median state Medicaid spending per resident was $534 in FFY 2015. Under the three scenarios, the reduction in federal Medicaid funds would result in a median increase of state Medicaid spending per resident ranging from 17.2% to 40.3%.

What are the potential implications for state taxes and education? States could choose to respond in many ways. For example, they could raise taxes or reduce education spending to fill in gaps in federal funding for Medicaid. Median state tax per resident was $2,715 in 2015. If states opt to raise taxes, the median increase in state taxes per resident would range from 3.5% to 8.1% under the three scenarios; if states increased the largest state tax, the median would range from 8.4% to 18.1%. For most states (29 states), the income tax is the largest state tax followed by sales tax (15 states). Median total spending per pupil for education was $10,961 in 2015. If states opted to fill the gap by reducing state government spending for education, states could face median reductions in state funding for K-12 education per pupil of 10.9% to 24.1% and total funding for K-12 education spending per pupil of 5.5% to 13.7%.

How are different groups of states affected by reductions? Due to the changes in the enhanced match rate, states that have adopted the Medicaid expansion will experience larger federal funding reductions; this outcome is true across states with Republican and Democratic governors. For example, in the scenario that would repeal the ACA enhanced match rate and reduce traditional Medicaid spending by 20%, expansion states would face higher median tax increases and larger reductions in education to fill the federal funding gaps compared to non-expansion states (ES 1). This increased budget pressure could make it difficult for states to maintain the Medicaid expansion. Funding reductions that go beyond eliminating the enhanced match for the ACA Medicaid expansion and entail cuts to the traditional Medicaid program could have a disproportionate effect on states with high poverty. Even though these poorer states spend less per resident on Medicaid, their federal reimbursement rate is relatively high, and so the impact of federal cuts is large.

Figure ES1: How Could States Fill the Gaps in Reduced Federal Medicaid Funding?

Issue Brief

Introduction

Medicaid has a unique role in state budgets. As a result of the federal matching structure, Medicaid is a spending item but also the largest source of federal revenues for state budgets. In FY 2015, Medicaid accounted for 28.2% (or $523 billion) of total state spending (including state and federal funding) for all items in the state budget, but 15.6% (or $193 billion) of all state spending (from general fund and other state funds), a far second to spending on K-12 education (24.8%, or $307 billion). Medicaid is the largest single source of federal funds for states, accounting for more than half (56.8%, or $329 billion) of all federally supported spending by states in SFY 2015, according to data from the National Association of State Budget Officers (Figure 1). Due to the federal match rate, as state Medicaid spending increases during economic downturns, so does federal funding. The match rate also gives states support and flexibility to address health care emergencies, needs and state health priorities without a pre-set limit on federal funds. States must balance their budgets annually. Since states pay for more than 40% of total Medicaid on average, states have incentives to constrain Medicaid spending by restricting provider payment rates, controlling prescription drug costs and implementing payment and delivery system reforms.

Figure 1: Medicaid in State Budgets, 2015

Congress is debating the AHCA, which includes reductions to federal financing combined with fundamental restructuring of Medicaid financing. On March 13, 2017 the Congressional Budget Office (CBO) estimated that the AHCA would reduce federal Medicaid spending by $880 billion over the 2017-2026 period. By 2026, Medicaid spending would be about 25% less than what CBO projects under current law. The CBO estimate reflects projections and accounts for federal changes in policy, state responses to the policy change, and reductions in coverage.

In this analysis, we present three scenarios of reductions in federal Medicaid spending and examine fiscal implications if states fill these financing gaps to maintain their programs and if all reductions are assumed to be in full effect in FFY 2015 (the most recent year for which Medicaid spending data is available). To fill these gaps in financing and maintain current Medicaid programs, we assume states will increase state spending for Medicaid by increasing state taxes or reducing education spending. This analysis is unlike the CBO estimate, which makes projections and accounts for changes in policy, state responses to make changes to Medicaid programs, and reductions in coverage (Figure 2).

Figure 2: State Implications of Reduced Federal Medicaid Spending

Study Design

This brief explores three scenarios of federal Medicaid spending reductions and the potential fiscal implications of different state responses to offset such losses. The analysis was conducted by the Kaiser Program on Medicaid and the Uninsured and the Rockefeller Institute of Government. We assumed that policies were fully effective in FFY 2015 (the most recent year for which Medicaid spending data is available). As noted earlier, unlike the CBO estimate, this analysis does not make projections and does not assume that states make changes to Medicaid programs or reduce coverage.

Scenarios

This analysis examined three scenarios of reductions in federal Medicaid spending. The magnitude of the reductions was calculated by adjusting the match rate for the expansion population from an estimated 90% when fully implemented to a state’s traditional match rate. We used estimated spending for the expansion group for FFY 2015 (spending data for states that expanded mid-year in FFY 2015 or in FFY 2016 were adjusted to account for increases in enrollment and spending for the expansion population). Beyond the repeal of the ACA enhanced matching funds, the reductions are not based on specific policy changes but rather based on estimates of potential federal Medicaid spending reductions. The total amount of federal Medicaid reductions in each scenario is displayed in Figure 3 and described below:

Figure 3: Estimated Reduction in Federal Medicaid Funds for Each Scenario

(1) Repeal ACA enhanced matching funds. Assumes states would get the traditional match rate for the expansion population and only includes states that have expanded Medicaid, since there would be no effect on states that did not expand. Total federal cut: $26.7 billion.

(2) Repeal ACA enhanced matching funds + 10% cut in Medicaid for non-expansion populations. Total federal cut: $52.8 billion.

(3) Repeal ACA enhanced matching funds + 20% cut in Medicaid for non-expansion populations. Total federal cut: $78.9 billion.

For each of these scenarios, we examined the outcomes (increased state-financed Medicaid spending per resident) and responses (increased state taxes or decreased K-12 education spending) by state and by groups of states including state expansion status, by political party of the governor (or mayor, for DC), by region and poverty rate. (See Table 1 for more information on state groupings). See Table 1 for median reductions by group and Appendix Table 2 for reductions by state in each of these scenarios. As noted above, the first scenario calculates medians across groups for only expansion states since non-expansion states are not affected.

Outcome and Potential Responses

To fill the gaps created by reductions, states would need to increase state-financed Medicaid spending per resident (outcome). To achieve those increases, states could opt to increase state taxes or reduce education spending (potential responses). These outcomes and responses are illustrative. In reality, faced with reductions in federal Medicaid funding, each state would make different policy choices and states could implement a combination of approaches, or not completely offset the federal reduction. For more details on the methods and data sources, see the Appendix.

Table 1. Median Federal Medicaid Cuts by State Characteristics, FFY 2015
Repeal Enhanced ACA MatchRepeal + 10% CutRepeal + 20% Cut
All States$26,676,000,000$52,805,000,000$78,933,000,000
By Expansion Status
Expansion$26,676,000,000$43,608,000,000$60,540,000,000
Non-expansionN/A$9,197,000,000$18,393,000,000
By Political Party of the Governor
Democratic$17,994,000,000$29,037,000,000$40,081,000,000
Republican$8,589,000,000$23,583,000,000$38,576,000,000
Independent$93,000,000$185,000,000$277,000,000
By Region   
Northeast$8,363,000,000$14,066,000,000$19,768,000,000
South$2,296,000,000$11,674,000,000$21,052,000,000
Midwest$4,581,000,000$9,920,000,000$15,259,000,000
West$11,436,000,000$17,145,000,000$22,854,000,000
By Poverty Quartile
Low Poverty$3,801,000,000$6,700,000,000$9,600,000,000
Low-Mid Poverty$5,642,000,000$10,720,000,000$15,798,000,000
Mid-Upper Poverty$15,012,000,000$28,575,000,000$42,139,000,000
High Poverty$2,222,000,000$6,809,000,000$11,397,000,000
By Expansion Status and Political Party of the Governor
Expansion – Dem/Ind$17,994,000,000$27,788,000,000$37,581,000,000
Expansion – Rep$8,589,000,000$15,636,000,000$22,682,000,000
Non-expansion – Dem/IndN/A$1,250,000,000$2,499,000,000
Non-expansion – RepN/A$7,947,000,000$15,894,000,000
NOTE: Data are rounded to the nearest million.SOURCE: KFF/Rockefeller Institute of Government analysis of data from the Medicaid Budget and Expenditure System (MBES), CMS, accessed December 2016.

Key Findings

Outcome: Implications for State-Financed Medicaid Spending Per Resident

Median state-financed Medicaid spending per resident was $534 in FFY 2015. To fill gaps in federal Medicaid funding assumed in the three scenarios, states would need to increase in state-financed Medicaid spending. Median increases in state-financed spending per resident would range from 17.2% if the enhanced match were repealed up to 40.3% to offset reductions from both the repeal of the matching funds and a 20% reduction of federal funds (Figure 4). These increases for the largest reduction scenario would range from a 20.5% increase in state per resident spending in Virginia to an 68.2% increase in Kentucky.

Figure 4: Median Increase in State-Financed Medicaid Spending Per Resident

The federal cuts under all of the scenarios would result in larger state spending increases per resident in expansion states compared to non-expansion states (across states with Republican and Democratic governors). High poverty states, where median state Medicaid spending per resident is the lowest ($458) compared to low-poverty states ($655), would experience the largest percent increase, particularly under the largest reduction scenario (Figures 5 and 6).

For median results by group for each scenario, see Table 2. For state-by-state results of changes in state Medicaid spending per resident, see Figure 7 and Appendix Table 3.

Figure 5: Median Increase in State-Financed Medicaid Spending Per Resident, by Expansion Status and Political Party of Governor
Figure 6: Median Increase in State-Financed Medicaid Spending Per Resident, by Poverty Quartile
Table 2. Median Increase in State Medicaid Spending per Resident by State Characteristics, 2015
State Medicaid Spending Per Resident,FFY 2015Repeal Enhanced ACA MatchRepeal + 10% CutRepeal + 20% Cut
Increase in State Medicaid Spending per ResidentIncrease in State Medicaid Spending per ResidentIncrease in State Medicaid Spending per Resident
All States$53417.2%27.2%40.3%
By Expansion Status
Expansion$57117.2%31.3%43.2%
Non-expansion$450N/A17.4%34.8%
By Political Party of the Governor
Democratic$65617.1%28.3%42.6%
Republican$47217.7%25.2%39.9%
Independent$88914.2%28.2%42.2%
By Region
Northeast$91715.9%26.3%36.1%
South$47417.4%24.6%42.6%
Midwest$55415.8%26.0%36.9%
West$52923.9%36.0%50.0%
By Poverty Quartile
Low Poverty$65516.5%26.3%36.2%
Low-Mid Poverty$56917.9%27.4%38.2%
Mid-Upper Poverty$47817.1%27.2%39.2%
High Poverty$45818.5%30.4%55.9%
By Expansion Status and Political Party of the Governor
Expansion – Dem/Ind$78016.9%30.0%43.2%
Expansion – Rep$55717.7%31.3%44.4%
Non-expansion – Dem/Ind$451N/A14.9%29.8%
Non-expansion – Rep$450N/A17.4%34.8%
SOURCE: KFF/Rockefeller Institute of Government analysis of data from the Medicaid Budget and Expenditure System (MBES), CMS, accessed December 2016 and the U.S. Bureau of the Census, State Population Totals Tables: 2010-2016, accessed December 2016.
Figure 7: Increase in State-Financed Medicaid Spending per Resident Under Repeal of the ACA Enhanced Match + 20% Cut

Potential State Responses

Fill the Funding Gap with Increases in State Government Taxes

One potential state response to offset the loss of federal Medicaid funds is to increase state taxes. We examine the percent increase in state government taxes that would be required if states were to raise taxes to offset the entire federal Medicaid spending reduction—measured by the Medicaid cut as a percentage of state tax revenue. We also examined the percent increase that would be required in a state’s largest state-government tax, if the state raised that tax to offset Medicaid cuts—measured by the Medicaid cut as a percentage of the state’s largest tax revenue.

Median state tax per resident was $2,715 in 2015. The analysis shows that the median state would need to increase taxes per resident by 3.5% to 8.1% to offset reductions in federal Medicaid funding under the three scenarios, with increases ranging from 2.4% in Wyoming to 32.1% in Alaska for the largest reduction scenario (Figure 8). When only looking at the largest state tax, the median state tax per resident was $1,144 in 2015 and the median increase would be 8.4% to 18.1%. Under the largest reduction scenario, the increase in the largest state tax would range from 6.3% in Wyoming to 121.6% in Alaska. For most states, the income tax is the largest state tax (29 states), followed by sales tax (15 states), corporate taxes (AK), property taxes (DC and VT), and severance taxes (in ND and WY).

Figure 8: Median Increase in State Government Taxes Per Resident

All of the scenarios would result in larger increases in state taxes in expansion states compared to non-expansion states (across states with Republican and Democratic governors). High poverty states could experience the highest median percentage increase in state taxes to offset federal reductions in federal Medicaid funding under the largest reduction scenario (Figures 9 and 10).

For median results by group for each scenario, see Table 3. For state-by-state results of changes in state taxes per resident, see Figure 11 and Appendix Table 4.

Figure 9: Median Increase in Percent State Government Tax Per Resident, by Expansion Status and Political Party of Governor
Figure 10: Median Increase in Percent State Government Tax Per Resident, by Poverty Quartile
Table 3. Median Increase in State Taxes per Resident by State Characteristics, 2015
Total State Tax Revenue per Resident, 2015Revenue from the Largest Tax per resident, 2015Repeal Enhanced ACA MatchRepeal + 10% CutRepeal + 20% Cut
Increase in Total State Taxes per ResidentIncrease in the Largest State Tax per ResidentIncrease in Total State Taxes per ResidentIncrease in the Largest State Tax per ResidentIncrease in Total State Taxes per ResidentIncrease in the Largest State Tax per Resident
All States$2,715$1,1443.5%8.4%5.2%11.5%8.1%18.1%
By Expansion Status
Expansion$2,983$1,2053.5%8.4%6.1%14.3%9.1%20.5%
Non-expansion$2,405$1,077N/AN/A3.4%6.7%6.7%13.5%
By Political Party of the Governor
Democratic$3,023$1,4233.9%9.5%6.4%13.2%8.9%17.9%
Republican$2,631$1,0843.2%8.2%4.9%10.6%7.5%18.1%
Independent$1,171$30910.8%40.9%21.4%81.2%32.1%121.6%
By Region
Northeast$3,533$1,4833.6%9.3%5.6%15.5%8.1%21.2%
South$2,454$1,0693.5%8.4%4.5%11.2%7.6%19.5%
Midwest$2,715$1,1222.9%7.4%4.9%10.9%6.8%16.4%
West$2,628$1,1704.4%8.9%6.5%13.1%8.9%17.7%
By Poverty Quartile
Low Poverty$3,311$1,4233.5%8.9%5.3%11.2%7.3%15.7%
Low-Mid Poverty$2,883$1,1703.3%8.1%5.2%12.6%8.1%17.5%
Mid-Upper Poverty$2,612$1,1323.4%8.6%5.0%10.6%9.0%18.1%
High Poverty$2,514$9493.5%8.3%5.5%14.0%9.6%24.3%
By Expansion Status and Political Party of the Governor
Expansion – Dem/Ind$3,026$1,5134.0%9.6%6.5%14.1%9.4%19.6%
Expansion – Rep$2,916$1,1063.2%8.2%5.7%15.3%8.6%22.7%
Non-expansion – Dem/Ind$2,476$1,269N/AN/A2.7%5.5%5.3%10.9%
Non-expansion – Rep$2,241$1,056N/AN/A3.4%6.7%6.7%13.5%
SOURCE: KFF/Rockefeller Institute of Government analysis of data from the Medicaid Budget and Expenditure System (MBES), CMS, accessed December 2016; the U.S. Bureau of the Census, State Population Totals Tables: 2010-2016, accessed December 2016; and U.S. Bureau of the Census, 2015 Annual Survey of State Government Tax Collections, accessed December 2016.
Figure 11: Increase in State Government Taxes Per Resident Under Repeal of the ACA Enhanced Match + 20% Cut
Fill the Funding Gap with Decreases in Education Spending

Another potential state response to decreased federal Medicaid funds is to shift state dollars from other spending, such as education spending. This analysis assesses the percentage cut in state spending for K-12 education per pupil that would be required if state governments were to reduce spending on education (essentially school aid) to offset Medicaid cuts. Median state funding for education per pupil was $5,961 in 2015. The analysis shows that states could experience median decreases in per pupil state funding for K-12 of 10.9% to 24.1% to offset federal Medicaid reductions under the three scenarios (Figure 12).

Total spending for education is primarily from state and local governments, with a small share financed by the federal government. Reductions in state government spending for K-12 education would have a direct impact on total spending per-pupil. Median total spending per pupil was $10,961 in 2015. For total spending on K-12 education per pupil, states could face reductions in spending of 5.4% to 13.7% (Figure 12). Reductions would vary significantly across states.

Figure 12: Median Decrease in K-12 Education Spending Per Pupil

All of the scenarios would result in larger decreases in total K-12 per pupil spending for expansion states compared to non-expansion states (across states with Republican and Democratic governors). Mid- to high poverty states, could experience the largest reductions in per pupil spending to offset federal reductions in Medicaid. Figures 13 and 14 show estimated reductions in total spending for education to fill gaps in federal Medicaid funding.

For median results by group for each scenario, see Table 4. For state-by-state results of changes in K-12 education spending per pupil, see Figure 15 and Appendix Table 5.

Figure 13: Median Decrease in K-12 Spending Per Pupil, by Expansion Status and Political Party of Governor
Figure 14: Median Decrease in K-12 Spending Per Pupil, by Poverty Quartile
Table 4. Median Decrease in Spending for K-12 Education per Pupil by State Characteristics, 2015
State Aid for K-12 per pupil,2015Total K-12 Spending Per Pupil, 2015Repeal Enhanced ACA MatchRepeal + 10% CutRepeal + 20% Cut
Decrease in State Aid for K-12 Per PupilDecrease in Total K-12 Spending Per PupilDecrease in State Aid for K-12 Per PupilDecrease in Total K-12 Spending Per PupilDecrease in State Aid for K-12 Per PupilDecrease in Total K-12 Spending Per Pupil
All States$5,961$10,961-10.9%-5.5%-15.4%-9.4%-24.1%-13.7%
By Expansion Status
Expansion$6,987$11,510-10.9%-5.5%-19.4%-10.5%-27.0%-15.5%
Non-expansion$4,555$9,077N/AN/A-9.4%-5.1%-18.8%-10.2%
By Political Party of the Governor
Democratic$6,948$11,475-12.0%-7.1%-19.1%-11.7%-26.5%-16.4%
Republican$5,476$9,968-10.6%-5.1%-13.8%-6.7%-22.0%-12.5%
Independent$14,650$19,132-4.8%-3.7%-9.6%-7.4%-14.4%-11.0%
By Region
Northeast$7,026$16,159-11.6%-5.2%-19.1%-9.5%-30.7%-14.1%
South$5,309$9,406-10.1%-5.4%-13.2%-6.7%-23.3%-13.3%
Midwest$6,380$11,243-8.4%-4.9%-13.9%-7.9%-21.0%-13.0%
West$6,127$9,842-12.4%-7.4%-20.2%-10.3%-27.6%-14.5%
By Poverty Quartile
Low Poverty$8,209$15,080-10.5%-5.6%-11.5%-7.4%-15.8%-11.0%
Low-Mid Poverty$6,079$11,117-12.0%-5.1%-18.4%-9.5%-25.5%-13.9%
Mid-Upper Poverty$5,961$9,441-14.7%-6.3%-14.5%-10.0%-26.7%-13.7%
High Poverty$5,429$9,418-10.1%-5.4%-16.9%-10.9%-28.1%-17.4%
By Expansion Status and Political Party of the Governor
Expansion – Dem/Ind$7,467$12,173-12.0%-6.8%-19.7%-11.8%-27.0%-16.5%
Expansion – Rep$6,879$11,262-10.6%-5.1%-19.2%-10.2%-27.8%-14.6%
Non-expansion – Dem/Ind$4,952$9,622N/AN/A-8.6%-4.8%-17.3%-9.5%
Non-expansion – Rep$4,535$9,077N/AN/A-9.4%-5.1%-18.8%-10.2%
SOURCE: KFF/Rockefeller Institute of Government analysis of data from the Medicaid Budget and Expenditure System (MBES), CMS, accessed December 2016; NCES, Revenues for public elementary and secondary schools, by source of funds and state or jurisdiction; and National Center on Education Statistics, Digest of Education Statistics, K-12 Enrollment – Total Students, All Grades (Excludes AE) [Public School].
Figure 15: Decrease in Total K-12 Spending Per Pupil Under Repeal of the ACA Enhanced Match + 20% Cut

Conclusion

The Congress is currently debating the American Health Care Act (AHCA), which would not only repeal and replace the Affordable Care Act (ACA) but also make far reaching changes to the structure and financing of Medicaid. The AHCA would use a per capita cap policy or block grants to cap federal funds to states for Medicaid. These reductions in federal Medicaid funding, could have implications for other areas of the state budget if states chose to offset the decreases in federal spending with state funds by raising taxes or reducing other state spending (like K-12 education). States could also reduce spending in Medicaid by finding savings but more likely by restricting eligibility or benefits.

This analysis found that under various scenarios of reductions in federal Medicaid funding in FFY 2015, states would have to increase their per resident state Medicaid spending by a median of 17.2% to 40.3% to maintain total Medicaid spending. To pay for these increases, states could increase total state tax revenue per resident by a median of 3.5% to 8.1% or decrease K-12 education funding per pupil by a median of 10.9% to 24.1%. Because states have different starting points for taxes and education spending, the effects could vary by state and by groups of states. However, due to assumptions about changes in the ACA enhanced match rate, states that have adopted the Medicaid expansion will experience larger implications from the federal Medicaid funding reductions; this is true across states with Republican and Democratic governors. This increased budget pressure could make it difficult for states to maintain the Medicaid expansion. Federal funding reductions could have a disproportionate effect on states that spend less per resident on Medicaid and education, and have lower tax revenues, typically high poverty states. The responses presented in the report are illustrative. In reality, each state would make different policy choices and states could implement a combination of approaches, or not completely offset the federal reductions. However, the results show that depending on the size of the gap to fill, the responses could be significant.

Methods

The following details the methods and data used to examine the outcomes for reductions in federal Medicaid spending.

  • Estimated Reductions in federal Medicaid spending. FY 2015 spending for each state was obtained from the Medicaid Budget and Expenditure System (MBES). Adjustments were made for states that expanded mid-year in FY 2015 or in FY 2016. Since Indiana and Pennsylvania expanded early in FY 2015, spending for the expansion population was adjusted to represent a full year of spending. Enrollment data for Alaska (as of April 2017), Louisiana (as of February 2017), and Montana (as of October 2016) were obtained from state resources. The latest enrollment data for these three states were multiplied by the federal per enrollee spending across all Medicaid enrollees in the state to estimate spending for the expansion population.-Using the adjusted FY 2015 spending for the expansion group, we assumed a 90% match rate (the rate when the ACA is in full effect) and then took the difference between that match rate and spending assuming a state’s traditional match rate. For the other effects, we estimated a 10% and a 20% reduction in federal funding off of FY 2015 spending for the traditional Medicaid population. We did not estimate the specifics of per capita cap or block grant proposals.-(KFF analysis of Centers for Medicare and Medicaid Services, Expenditure Reports from MBES, https://www.medicaid.gov/medicaid/financing-and-reimbursement/state-expenditure-reporting/expenditure-reports/index.html; Centers for Medicare and Medicaid Services, Quarterly Medicaid Enrollment Report, https://www.medicaid.gov/medicaid/program-information/medicaid-and-chip-enrollment-data/enrollment-mbes/index.html; Alaska Department of Health and Social Services, Medicaid in Alaska Dashboard, accessed May 23, 2017, http://dhss.alaska.gov/HealthyAlaska/Pages/dashboard.aspx; Louisiana Department of Health, Medicaid Dashboard, accessed March 3, 2017, http://ldh.la.gov/healthyladashboard/; Montana Department of Public Health and Human Services, Monthly enrollments, accessed March 3, 2017, http://dphhs.mt.gov/StatisticalInformation.)
  • Change in Medicaid spending per state resident: Medicaid cut divided by state population as of July 1, 2015. (U.S. Bureau of the Census, State Population Totals Tables: 2010-2016, https://www2.census.gov/programs-surveys/popest/tables/2010-2016/state/totals/nst-est2016-01.xlsx.)
  • Change in state government taxes: The percentage increase in state government taxes that would be required if states were to raise taxes to offset Medicaid cuts. The calculation is the Medicaid cut as a percentage of state taxes, based upon state fiscal year 2015 state government tax collections. For the District of Columbia, which does not have a state government, we used District tax collections. (U.S. Bureau of the Census, 2015 Annual Survey of State Government Tax Collections, https://www.census.gov/govs/statetax/.)
  • Change in largest state government tax: The percentage increase that would be required in a state’s largest state-government tax, if the state raised that tax to offset Medicaid cuts. The calculation is the Medicaid cut as a percentage of the state’s largest tax, where the largest tax is determined based upon detailed item-code data for state fiscal year 2015. For the District of Columbia, which does not have a state government, we used the largest District tax. (U.S. Bureau of the Census, 2015 Annual Survey of State Government Tax Collections, https://www.census.gov/govs/statetax/.)
  • Change in state aid for K-12 education: The percentage cut in state aid for K-12 education that would be required if states were to cut this aid to offset Medicaid cuts. The calculation is the Medicaid cut as a percentage of state aid for K-12 education. Revenue of public schools from state governments is used as a proxy for state aid because data that explicitly measure state aid and that are both timely and comparable across states are not available. (Revenue from the state government may differ from what states show in their budgets for state aid. For example, Hawaii operates all of its schools, rather than providing aid to school districts. This approach treats revenue from the state of Hawaii as state aid.) For the District of Columbia, which does not have a state government, we used District revenue used to support schools. The latest available data for revenue of public schools is for 2014, from the National Center for Education Statistics NCES. (NCES, Revenues for public elementary and secondary schools, by source of funds and state or jurisdiction, https://nces.ed.gov/programs/digest/d16/tables/dt16_235.20.asp.) We estimated values for 2015 by adding one year of estimated growth to each state’s value for 2014, based on the compound annual growth rate for the prior five years (2009 to 2014).
  • Change in K-12 education per-pupil spending: The cut that would be required in K-12 education spending per pupil if the entire Medicaid cut were offset by cuts in spending by school districts. The per-pupil cut is calculated as the Medicaid cut divided by the number of public school pupils in the state in the 2014-15 school year, excluding adult education enrollment. (National Center on Education Statistics, Digest of Education Statistics, K-12 Enrollment – Total Students, All Grades (Excludes AE) [Public School], http://nces.ed.gov/ccd/elsi.) To provide context for these numbers, we then compute this cut as a percentage of total public school expenditures per pupil (excluding adult education enrollment). The latest available data for revenue of public schools is for 2014, from the National Center for Education Statistics NCES. We estimated values for 2015 by adding one year of estimated growth to each state’s value for 2014, based on the compound annual growth rate for the prior five years (2009 to 2014).

Grouping States by Characteristics

State Tables

Appendix Table 1. State Characteristics, as of January 2017

SOURCES: Kaiser Family Foundation’s State Health Facts, Status of State Action on the Medicaid Expansion Decision, as of January 1, 2017. National Governors Association, Governors Roster 2017, as of January 25, 2017. U.S.

Appendix Table 2. Federal Medicaid Cuts by State, FFY 2015

>

NOTE: Adjustments were made for the five states that expanded mid-year in FY15 or in FY16 (AK, IN, LA, MT, PA). Data are rounded to the nearest million and may not sum to the US total. SOURCE: KFF/Rockefeller Institute of Government analysis of data from the Medicaid Budget and Expenditure System (MBES), CMS, accessed December 2016.

Appendix Table 3. Increase in State Medicaid Spending per Resident by State, 2015

>

SOURCE: KFF/Rockefeller Institute of Government analysis of data from the Medicaid Budget and Expenditure System (MBES), CMS, accessed December 2016 and the U.S. Bureau of the Census, State Population Totals Tables: 2010-2016, accessed December 2016.

Appendix Table 4. Increase in State Taxes per Resident by State, 2015

>

SOURCE: KFF/Rockefeller Institute of Government analysis of data from the Medicaid Budget and Expenditure System (MBES), CMS, accessed December 2016; the U.S. Bureau of the Census, State Population Totals Tables: 2010-2016, accessed December 2016; and U.S. Bureau of the Census, 2015 Annual Survey of State Government Tax Collections, accessed December 2016.

Appendix Table 5. Decrease in Spending for K-12 Education per Pupil by State, 2015

>

SOURCE: KFF/Rockefeller Institute of Government analysis of data from the Medicaid Budget and Expenditure System (MBES), CMS, accessed December 2016; NCES, Revenues for public elementary and secondary schools, by source of funds and state or jurisdiction; and National Center on Education Statistics, Digest of Education Statistics, K-12 Enrollment – Total Students, All Grades (Excludes AE) [Public School].
News Release

New Dashboard Provides Key Data on U.S. Health System Quality, Spending, Access, Outcomes

Published: May 24, 2017

A new feature launched today on the redesigned Peterson-Kaiser Health System Tracker website provides quick and easy access to the latest key data measuring quality, spending, access, and outcomes in the U.S. health system.

Compiled by Kaiser Family Foundation analysts in consultation with other top experts, the Health System Dashboard presents users with both a broad view of the system’s performance compared to similar countries, and a detailed look at specific indicators within the areas of health and wellbeing, quality of care, health spending, and access and affordability.

A new brief on the Tracker, U.S. Health System is Performing Better, Though Still Lagging Behind Other Countries, pulls together the dashboard’s data to illustrate the current status of the U.S. health system’s performance and its progress in relation to countries that are similarly large and wealthy. It finds that the United States has improved on several measures, such as life expectancy, disease burden, and uninsured rate; but that it continues to be outperformed by other countries.

Overall, the new dashboard features more than 50 measures, ranging from life expectancy to spending by diagnosis, from prices and utilization to percent of workers in high deductible health plans. Users can explore trends over time, as well as differences and disparities across demographic groups.

In addition to the Health System Dashboard, the redesigned Tracker includes the interactive Health Spending Explorer, the educational video Health of the Healthcare System, analyses, and dozens of collections of downloadable charts. All of the resources are sharable on Facebook and Twitter.

The Tracker, a partnership between the Peterson Center on Healthcare and the Kaiser Family Foundation, was launched in 2014 to monitor the U.S. health system’s performance on key quality and cost measures.

White House Releases FY18 Budget Request

Published: May 24, 2017

The White House released its FY 2018 budget request to Congress on May 23, 2017, which includes significant cuts to global health funding. It seeks to shift the U.S. approach to development, stating that, the request “prioritizes and focuses foreign assistance in regions and on programs that advance U.S. national security by helping countries of strategic importance meet near- and long-term political, economic, development, and security needs.”  It further states that “While the United States will continue significant funding for global health programs, even while refocusing foreign assistance, other stakeholders must do more to contribute their fair share to global health initiatives.”

Key highlights are as follows (see table for additional detail):

  • Funding provided to the State Department and USAID (through the Global Health Programs account), which represents the bulk of global health assistance, would decline by more than $2.2 billion (-26%), from $8,725 million in FY 2017 to $6,481 million, which would be the lowest level of funding since FY 2008.
  • Funding for global health provided to CDC would decline by $85 million (-20%), from $435 million in FY 2017 to $350 million in FY 2018.
  • Funding for almost all global health programs is reduced or eliminated in the budget request:
    • PEPFAR funding for bilateral programs would decline overall by $860 million (-18%) including a decrease of $470 million (-11%) at State, $330 million (-100%) at USAID, and $59 million (-46%) at CDC.
    • The U.S. contribution to the Global Fund to Fight AIDS, Tuberculosis and Malaria would decline by $225 million (-17%).
    • Funding for the Family Planning and Reproductive Health (FP/RH) and Vulnerable Children (VC) programs under the Global Health Programs account, respectively, would be eliminated.
    • Funding would decrease for TB (-$63 million or -26%), Neglected Tropical Diseases (-$25 million or -25%), and nutrition (-$47 million or -37%).
    • Funding for malaria would also decrease (-$331 million or -44%) although a one-time transfer of $250 million in unspent emergency Ebola funding would be used for malaria efforts.
    • Gavi, the Vaccine Alliance, which is included under maternal and child health (MCH) funding, is the only area to increase – from $275 million in FY 2017 to $290 million in FY 2018.
    • Aside from Gavi, other MCH funding decreased by $80 million (-15%).
    • Funding for Global Health Security would be eliminated, although a one-time transfer of $72.5 million would be provided in unspent emergency Ebola funding.
    • Several international organizations (including UNICEF, UNAIDS, microbicides research, IAVI, and others) that have historically received specified funding amounts in the budget are not allocated any funding in the FY 2018 request. While it is possible that the Administration could provide funding to these organizations, such funding would have to be taken from either bilateral programs or other accounts.

Resources:

The table (.xls) below compares the FY 2018 request to the FY 2017 enacted funding amounts as outlined in the “Consolidated Appropriations Act, 2017” (P.L. 115-31; KFF summary here). Note that total funding for global health is not currently available as some funding provided through USAID, Health and Human Services (HHS), and the Department of Defense (DoD) is not yet available.