How the Senate Better Care Reconciliation Act (BCRA) Could Affect Coverage and Premiums for Older Adults

Authors: Tricia Neuman, Karen Pollitz, and Larry Levitt
Published: Jun 29, 2017

Issue Brief

Prior to the Affordable Care Act (ACA), adults in their 50s and early 60s were arguably most at risk in the private health insurance market. They were more likely than younger adults to be diagnosed with certain conditions, like cancer and diabetes, for which insurers denied coverage. They were also more likely to face unaffordable premiums because insurers had broad latitude (in nearly all states) to set high premiums for older and sicker enrollees.

The ACA included several provisions that aimed to address problems older adults faced in finding more affordable health insurance coverage, including guaranteed access to insurance, limits on age rating, and a prohibition on premium surcharges for people with pre-existing conditions. Following passage of a bill to repeal and replace the ACA in the House of Representatives on May 4, 2017, the Senate has released a discussion draft of its proposal, called the Better Care Reconciliation Act of 2017 (BCRA) on June 26, 2017, that follows a somewhat different approach.

The Senate BCRA discussion draft would make a number of changes to current law that would result in an increase of four million 50-64-year-olds without health insurance in 2026, according to CBO’s analysis (Figure 1).

Figure 1: 4 million more older adults are projected to be uninsured by 2026 under the BCRA

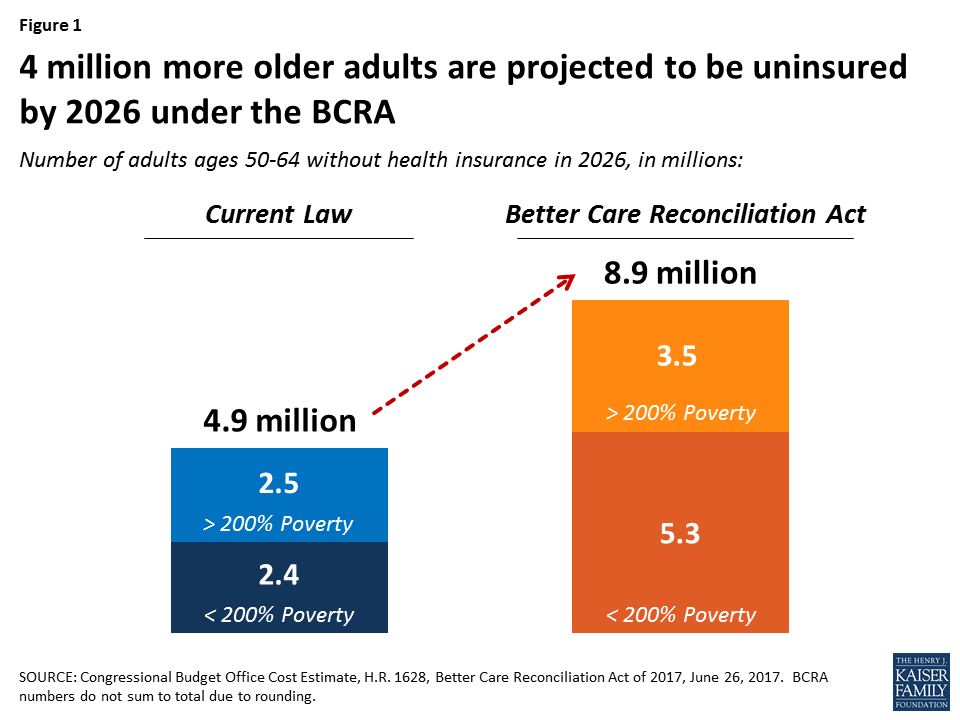
The Senate proposal would disproportionately affect low-income older adults with incomes below 200% of the federal poverty level (FPL): three of the four million 50-64-year-olds projected to lose health insurance in 2026 would be low-income. CBO projects the uninsured rate for low-income older adults would rise from 11% under current law to 26% under the BCRA by 2026.

The increase in the number and share of uninsured older adults would be due to several changes made by the BCRA to private health insurance market rules and subsidies, as well as changes to the Medicaid program.

Changes affecting Private Health Insurance

Age Bands. Under current law, insurers are prohibited from charging older adults more than 3-times the premium amount for younger adults. The Senate bill would allow insurers to charge older adults five-times more than younger adults, beginning in 2019. States would have flexibility to establish different age bands (broader or narrower). CBO estimates that age rating would increase premiums significantly for plans at all metal levels for older adults. The impact of age rating would be such that, for a 64-year-old, the national average premium for an unsubsidized bronze plan in 2026 would increase from $12,900 (current law) to $16,000 (BCRA). The wider age bands permitted under the BCRA would result in higher premiums for an unsubsidized bronze plan than the premium for an unsubsidized silver plan under the current law age-rating standard (Table 1).

Table 1: Estimated National Average Unsubsidized Premiums for Bronze and Silver Health Plans for a 64-year-old, 2026
National Avg. Premium, UnsubsidizedACA Age Bands (3:1)BCRA Age Bands (5:1)
Bronze$12,900$16,000
Silver$15,300$20,500

Tax Credits. The Senate’s BCRA makes three key changes affecting premium tax credits for people in the non-group insurance market. First, it changes the income eligibility for tax credits, extending eligibility to people with income below the FPL but capping eligibility at income of 350% FPL. Under current law, income eligibility for tax credits is 100%-400% FPL. This change has the effect of reducing premiums for people with incomes below poverty in the marketplace who are not otherwise eligible for Medicaid (discussed further below) while increasing premiums for people with incomes between 350%-400% FPL.

Second, BCRA changes the level of subsidy for people based on age. Under both current law and the BCRA, individuals must pay a required contribution amount, based on income, toward the cost of a benchmark plan; the premium tax credit equals the difference between the cost of the benchmark plan and the required individual contribution. Under current law, the required contribution rate is the same for all people at the same income level regardless of age. However, under the BCRA, the required contribution amount would increase with age for people with an income above 150% FPL. For example, under current law, at 350% FPL, individuals are required to contribute the same percentage of income toward the benchmark plan, regardless of age (9.69% in 2017). Under the BCRA, starting in 2020, a 24-year-old would contribute about 6.4% of income, while a 60-year-old would have to contribute 16.2% of income.1 

Third, the Senate proposal reduces the value of the benchmark plan used to determine premium tax credits from a more generous silver-level plan (under current law) to the equivalent of a bronze plan (under BCRA). Deductibles under bronze plans are much higher than under silver plans (in 2017, on average, $6,105 for bronze plans vs. $3,609 for silver plans). Under current law, silver plan deductibles are further reduced by cost-sharing subsidies for eligible individuals with incomes below 250% FPL (on average to $255, $809, or $2,904, depending on income). The BCRA eliminates cost-sharing subsidies starting in 2020. As a result, people using tax credits to buy a “benchmark” bronze plan would face significantly higher deductibles under the Senate proposal than under current law.

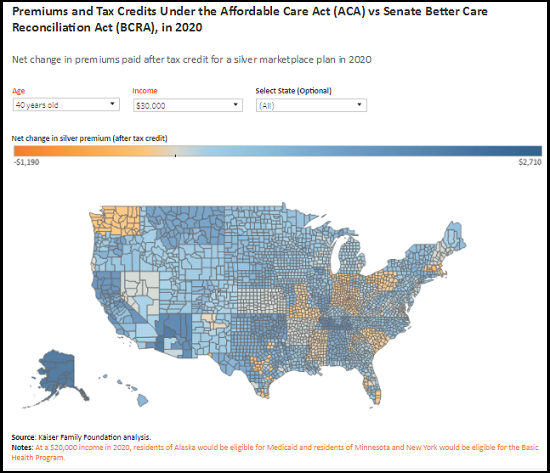
For older adults with income above the poverty level, the combined impact of these changes would be to increase the out-of-pocket cost for premiums at all income levels. For example, a 64-year old with an income of $26,500 would see premiums increase by $4,800 on average for a silver plan in 2026; a 64-year old with an income of $56,800 could see premiums increase of $13,700 in 2026, according to CBO. (Figure 2).

Figure 2: Silver plan net premiums would be higher under the BCRA than under current law for older adults at various income levels

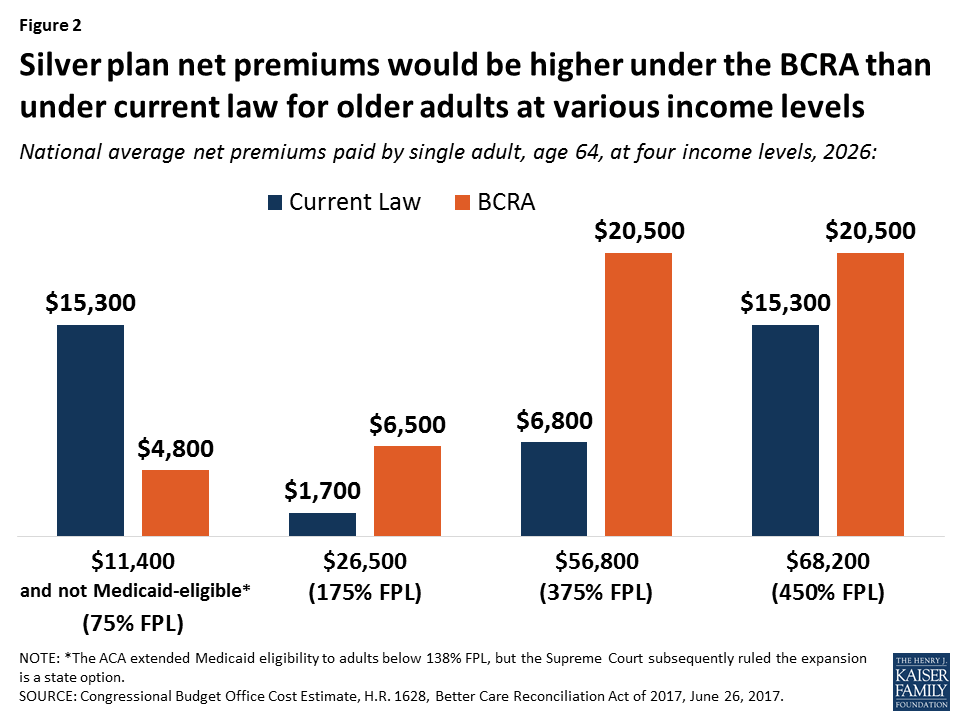
Premium tax credits under the BCRA would continue to be based on the cost of a local benchmark policy, so results would vary geographically. Older adults living in higher cost areas could see greater dollar increases, while people living in lower cost areas could see lower increases.

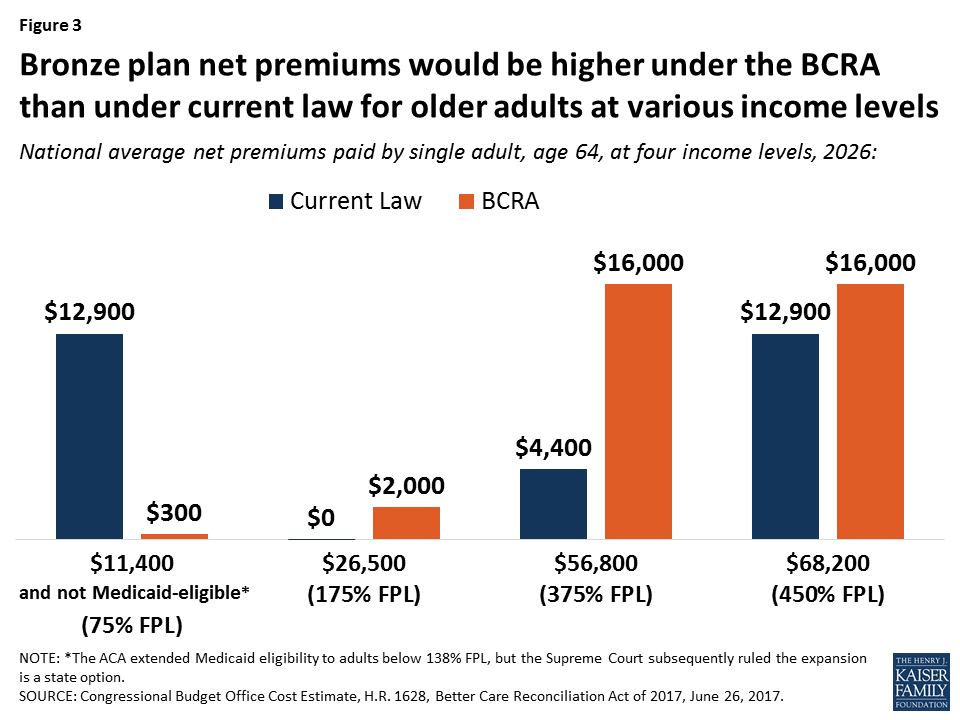
For a bronze plan, the national average premium expense for a 64-year old could increase by $2,000 for an individual with an income of $26,500 in 2026 and by as much as $11,600 for an older adult with $56,800 in income (Figure 3).

Figure 3: Bronze plan net premiums would be higher under the BCRA than under current law for older adults at various income levels

Under current law, people with income below 100% FPL generally are not eligible for premium tax credits. The ACA extended Medicaid eligibility to adults below 138% FPL, but the Supreme Court subsequently ruled the expansion is a state option. To date 19 states have not elected the Medicaid expansion, leaving 2.6 million uninsured low-income adults in this coverage gap.

For older adults with income below 100% FPL who are not eligible for Medicaid, CBO estimates the extension of premium tax credit eligibility will significantly reduce the net premium expense for a 64-year-old in 2026 relative to current law (e.g., by more than $12,000 for an individual at 75% FPL).

However, CBO estimates that few low-income people would purchase any plan. Even with relatively low premiums, older adults with very low incomes may choose to go without coverage due to relatively high, unaffordable deductibles. For example, an individual with an income of $11,400 (75% FPL) who is not eligible for Medicaid, would pay $300 in premiums in 2026 under BCRA but face a deductible in excess of $6,000 – which amounts to more than half of his or her income that year.

On average, 55-64 year-olds would pay 115% higher premiums for a silver plan in 2020 under the BCRA after taking tax credits into account. Low-income 55-64-year-olds would pay 294% higher premiums relative to current law.

Changes to Medicaid

Changes to Medicaid proposed in the Senate bill also contribute to the increase in the projected increase in the number of uninsured older adults nationwide. The BCRA would limit federal funds for states that have elected to expand coverage under Medicaid for low-income adults, phasing down the higher federal match for these expansion states over three years (2021-2023). This provision, coupled with a new cap on the growth in federal Medicaid funding over time on a per capita basis, would result in an estimated 15 million people losing Medicaid coverage by 2026 according to CBO, some of whom are counted among the four million older adults projected to lose health insurance under the BCRA, shown in Figure 1. In 2013, about 6.5 million 50-64-year-olds relied on Medicaid for their health insurance coverage, a number that has likely increased due to the Medicaid expansion.2  Since 2013, Medicaid enrollment overall has grown by nearly 30%.

Impact on Older Adults on Medicare

The loss of coverage for adults in their 50s and early 60s could have ripple effects for Medicare, a possibility that has received little attention. If the BCRA results in a loss of health insurance for a meaningful number of people in their late 50s and early 60s, as CBO projects, there is good reason to believe that people who lose insurance will delay care, if they can, until they turn 65 and become eligible for Medicare, and then use more services once on Medicare. This could cause Medicare spending to increase, which would lead to increases in Medicare premiums and cost-sharing requirements.3 

The proposed BCRA changes to Medicaid are also expected to affect benefits and coverage for older, low-income adults on Medicare. Today, 11 million low-income people on Medicare have supplemental coverage under Medicaid that helps cover the cost of Medicare’s premiums and cost-sharing requirements, and the cost of services not covered by Medicare, such as nursing home and home- and community-based long-term services and supports. The BCRA reduces the trajectory of Medicaid spending, with new caps on the growth of benefit spending per person; these constraints are expected to put new fiscal pressure on states to control costs that could ultimately affect coverage and benefits available to low-income people on Medicare. Under the BCRA, the growth in Medicaid per capita spending for elderly and disabled beneficiaries is dialed down to a slower growth rate, from CPI-M+1 to CPI-U beginning in 2025, below currently projected growth rates, just as the first of the Boomer generation reaches their 80s and is more likely to need Medicaid-funded long-term services and supports.

Discussion

The Senate bill to repeal and replace the ACA, known as the Better Care Reconciliation Act of 2017 (BCRA), if enacted, would be expected to result in an increase of four million uninsured 50-64-year olds in 2026, relative to current law. The increase is due to a number of factors, including higher premiums at virtually all income levels for older adults, potentially unaffordable deductibles for older adults with very low incomes, , and reductions in coverage under Medicaid. Reductions in coverage could have unanticipated spillover effects for Medicare in the form of higher premiums and cost sharing, if pre-65 adults need more services when they age on to Medicare as a result of being uninsured beforehand. The BCRA would also impose new, permanent caps on Medicaid spending which could affect coverage and costs for low-income people on Medicare.

Other changes in BCRA will affect Medicare directly. The BCRA would repeal the Medicare payroll tax imposed on high earners included in the ACA. This provision, according to CMS, will accelerate the insolvency of the Medicare Hospital Insurance Trust Fund and put the financing of future Medicare benefits at greater risk for current and future generations of older adults – another factor to consider as this debate moves forward.

This issue brief was funded in part by The Retirement Research Foundation.

Endnotes

  1. The actual applicable percentages would be somewhat higher. The language in the BCRA amends the 2014 required contribution rates outlined in current law. Each year, these percentages have been increased by an inflation factor and would continue to be indexed in the future. By 2020, the actual percentage amounts would be more than the 2014 amounts. ↩︎
  2. Kaiser Family Foundation analysis of MSIS data, 2013. ↩︎
  3. A 2007 study published in the New England Journal of Medicine that looked at previously uninsured Medicare beneficiaries helps explain this dynamic. It showed a direct relationship between lack of insurance (pre-65) to higher service use and spending (post-65). Previously uninsured adults were more likely than those with insurance to report a decline in health, and a decline in health (pre-65) was associated with 23.4% more doctor visits and 37% more hospitalizations after age 65. Depending on the number of people who lose coverage and how long they remain uninsured, the impact for Medicare may initially be modest, but could compound with time. ↩︎

Medicaid’s Role in Covering Veterans

Published: Jun 29, 2017
Medicaid’s Role in Covering Veterans by State
StateNumber of Nonelderly Veterans with Medicaid(2015)Number of Nonelderly Veterans who are Uninsured(2015)
Expanded Medicaid/ Republican Governor
Arizona24,10011,593
Arkansas15,0088,396
Illinois31,52015,676
Indiana12,71614,549
Iowa8,8982,926
Kentucky19,3946,119
Maryland19,2766,003
Massachusetts25,6522,723
Michigan39,95412,937
Nevada8,9395,438
New HampshireN/A4,634
New Jersey11,6425,997
New Mexico12,5866,194
North DakotaN/AN/A
Ohio40,57317,722
Vermont3,672N/A
Total273,930120,907
Expanded Medicaid/ Democrat or Independent Governor
AlaskaN/A4,849
California92,02135,322
Colorado22,3979,897
Connecticut6,8722,513
Delaware3,160N/A
District of Columbia1,907N/A
Hawaii4,232N/A
Louisiana14,28113,232
Minnesota17,0544,882
Montana3,0213,917
New York44,65714,099
Oregon20,5956,008
Pennsylvania36,57518,097
Rhode Island3,779NA
Washington31,20312,058
West Virginia8,7642,927
Total310,518127,801
Did Not Expand Medicaid/ Republican Governor
Alabama14,28312,908
Florida52,31047,783
Georgia24,86727,874
Idaho4,4514,724
Kansas6,6886,555
Maine5,3105,638
Mississippi8,1437,432
Missouri11,70415,003
Nebraska3,2621,913
Oklahoma7,58711,929
South Carolina15,30113,171
South DakotaN/AN/A
Tennessee20,51116,931
Texas46,93960,415
Utah4,2223,224
Wisconsin17,9778,125
WyomingN/A2,129
Total243,555245,754
Did Not Expand Medicaid/ Democrat Governor
North Carolina27,05526,680
Virginia13,30018,446
Total40,35545,126
N/A: Estimates with relative standard errors greater than 30% are not provided.Data table prepared by Kaiser Family Foundation.

Sources:

Kaiser Family Foundation analysis of 2013 and 2015 American Community Survey, 1-year estimates.Kaiser Family Foundation analysis of 2015 National Health Interview Survey data.Kaiser Family Foundation analysis of 2015 National Survey on Drug Use and Health data.

Medicaid’s Role in Financing Behavioral Health Services for Low-Income Individuals

Authors: Julia Zur, MaryBeth Musumeci, and Rachel Garfield
Published: Jun 29, 2017

Issue Brief

Behavioral health conditions affect a substantial number of people in the U.S. and are especially common among people with low incomes.1 ,2 ,3  Behavioral health conditions include mental illnesses, such as anxiety disorders, major depression, bipolar disorder, schizophrenia, and post-traumatic stress disorder, as well as substance use disorders (SUD), such as opioid addiction. These conditions range in severity, with some being more disabling than others.  People with behavioral health needs may require a range of services, from outpatient counseling or prescription drugs to inpatient treatment.

As a major source of insurance coverage for low-income Americans, and as the only source of funding for some specialized behavioral health services, Medicaid plays a key role in covering and financing behavioral health care. In 2015, Medicaid covered 21% of adults with mental illness, 26% of adults with serious mental illness (SMI), and 17% of adults with SUD.4  In comparison, Medicaid covered 14% of the general adult population.5  In total, approximately 9.1 million adults with Medicaid had a mental illness and over 3 million had an SUD in 2015. Nearly 1.8 million of these adults had both a mental illness and an SUD.6 ,7 

Current Medicaid program financing guarantees federal financial support to states with no pre-set limit. The Better Care Reconciliation Act (BCRA), as proposed by the Senate, restructures federal Medicaid financing by changing it to a per capita cap or block grant, which would likely impact states’ ability to provide coverage for and access to behavioral health services for people who need them. This issue brief provides an overview of Medicaid’s role for people with behavioral health needs, including eligibility, benefits, service delivery, access to care, spending, and the potential implications of the BCRA.

How do people with behavioral health needs qualify for Medicaid?

Many people with behavioral health needs are eligible for Medicaid, although there is no single pathway dedicated to covering them. Most beneficiaries with behavioral health conditions qualify for Medicaid because of their low incomes. For example, adults may be eligible for Medicaid if they live in a state that expanded its program under the Affordable Care Act (ACA) and have incomes up to 138% of the federal poverty level (FPL) ($12,060/year for an individual). In states that did not expand their programs, coverage for non-disabled individuals is typically limited to parents, pregnant women, and children. In non-expansion states, the median income eligibility level for parents is 44% FPL in 2017, but eligibility for children and pregnant women is higher.  As of 2017, most states provide Medicaid or CHIP to children (49 states) and pregnant women (34 states) at or above 200% FPL.8  In total, over one in five (21%) adults and one in 10 (11%) children eligible for Medicaid based on income have a behavioral health diagnosis as of 2011.9 

People with behavioral health needs, especially those with serious mental illness, may also qualify for Medicaid based on having a disability. In most states, individuals who have a mental illness that makes them eligible for Supplemental Security Income (SSI), the federal cash assistance program for low-income aged, blind, or disabled individuals, are automatically eligible for Medicaid.10 ,11  To be eligible for SSI, individuals must have low incomes, limited assets, and an impaired ability to work at a substantial gainful level as a result of old age or significant disability.  However, SUD is not considered a disability for purposes of qualifying for SSI.

Fifty percent of adults and 47% of children eligible for Medicaid based on having a disability have a behavioral health diagnosis as of 2011.12  Additionally, among Medicaid beneficiaries with behavioral health conditions (excluding those who also qualify for Medicare), over four in 10 adults (41%) and one in six children (17%) are eligible for Medicaid based on having a disability (Figure 1).13 

Figure 1: Eligibility Pathways Among Non-Elderly, Non-Dual, Medicaid Enrollees with a Behavioral Health Diagnosis, 2011

States can choose to offer other disability-related Medicaid eligibility pathways to people whose incomes exceed the SSI limit.14  For example, in 21 states, people with disabilities may be eligible for Medicaid up to 100% FPL, as of 2015.15  In 44 states, working individuals with disabilities whose incomes and/or assets exceed the limits for other pathways, may “buy-in” to Medicaid coverage. Over 400,000 people have been able to obtain coverage through the buy-in option as of 2015.16 

In addition, children who are eligible for Medicaid because of their involvement with the foster care system may have behavioral health needs. Among children with Medicaid/CHIP who had behavioral health conditions in 2011, nearly one in ten (8%) entered the program through the child welfare assistance pathway (Figure 1).17 

What behavioral health services does Medicaid cover?

People with behavioral health conditions may require a broad range of medical and long-term care services. These include outpatient services, such as individual therapy, group therapy, partial hospitalization, and case management; inpatient services, such as detoxification, hospital visits, and residential treatment; medications as part of psychiatric treatment for mental illness or medication-assisted treatment for SUD; and home and community-based services, such as supportive housing and supported employment.

Behavioral health services are not a specifically defined category of Medicaid benefits, but the program covers many behavioral health benefits. Some behavioral health benefits fall under mandatory Medicaid benefit categories that all states must cover by federal law. For example, psychiatrist services may be covered under the “physician services” category, and inpatient psychiatric treatment for individuals under age 21 or over age 65 may be covered under the “inpatient hospital services” category.18  Historically, federal law has prohibited federal Medicaid payments for services provided in “institutions for mental disease” (IMD) (generally defined as having more than 16 beds) to adults age 21-64. However, in April 2016, the Centers for Medicare & Medicaid Services (CMS) issued final Medicaid managed care regulations that allow states to receive federal matching funds for managed care capitation payments for adults age 21-64 who receive psychiatric or SUD inpatient or residential services in an IMD for up to 15 days in a month as of 2016. States are able to receive these funds under the authority for health plans to cover services “in lieu of” those available under the Medicaid state plan.19  In addition, in July 2015, CMS provided guidance stating that states could request federal funding for services delivered to nonelderly adults residing in IMDs through Section 1115 demonstration waivers in order to be able to provide a full continuum of care.20 

States also cover behavioral health benefits through optional benefit categories that they may choose to include in their Medicaid programs, such as case management services and prescription drugs. One important benefit category for behavioral health is rehabilitative services option, through which states commonly cover non-clinical behavioral health services such as peer support and community residential services.21   In addition, under waiver or state plan authority, states can provide home and community-based long-term care behavioral health services that support independent community living, such as day treatment, and psychosocial rehabilitation services.22  For examples of the types of behavioral health services covered by Medicaid, see Bill and Eric’s stories below.

Bill, age 42, Arizona
Bill was going to school and working as a nurse when he was first hospitalized for a mental health condition.  While in the hospital, he was diagnosed with bipolar disorder and found out that he qualified for Medicaid. Medicaid covers the day treatment program that he attends for 30 hours a week, along with medication and doctor visits, to manage his condition.  Bill says that Medicaid means he has “been given a second chance.” 

Medicaid covers services that enable people with disabilities to work.  In addition to providing personal care and transportation services that help people with disabilities get ready for the day and get to work, states also can cover supported employment services, such as job coaching, to help people with behavioral health conditions obtain and maintain employment.

Under the ACA Medicaid expansion, states must offer a set of benefits for those newly eligible for Medicaid, known as alternative benefit plans (ABP), and they may choose to offer ABPs to most other Medicaid adults.23  While the traditional Medicaid state plan benefit package does not include a minimum set of federal behavioral health benefits, ABPs must cover the ACA’s ten essential health benefits (EHB), which include both mental health and SUD benefits.24 

Eric, age 31, Virginia
Eric is a community college student. He had to stop working in 2003, when he was admitted to a psychiatric hopsital and diagnosed with schizoaffective disorder.  He spent the next four years in and out of the hospital, although he has not been hospitalized since 2007.  Medicaid covers his medication, regular outpatient behavioral health treatment, and medical care, including treatment for high blood pressure. Eric is grateful to have more stability, to be responding well to his medication, and to have Medicaid coverage for his routine care.

Like most other insurers, Medicaid ABPs and MCOs that cover behavioral health services must do so at parity, or to the same extent and on the same terms that they cover physical health services.25 ,26  States are encouraged, but not required, to apply the parity rules to their traditional (non-ABP) Medicaid fee-for-service (FFS) programs as well.

Medicaid coverage of behavioral health services is sometimes more comprehensive than private insurance coverage. While many insurance plans cover psychiatric hospital visits, in some states, Medicaid is more likely than many private insurance plans to cover additional services, such as case management, individual and group therapy, detoxification, and medication management, in addition to psychiatric hospital visits.27 

Behavioral health services for children are particularly comprehensive due to Medicaid’s Early, Periodic Screening, Diagnosis, and Treatment (EPSDT) benefit for children. EPSDT includes all medically necessary Medicaid services permitted under federal law and is required for children from birth to age 21. Under this benefit, states must provide access to behavioral health care, including screenings and assessments. Children diagnosed with behavioral health conditions receive any service available under federal Medicaid law necessary to correct or ameliorate the condition, even if the state does not cover the service for adults.28 ,29 

How are behavioral health services delivered to Medicaid enrollees?

States use a combination of fee-for-service and managed care arrangements to deliver behavioral health care to Medicaid beneficiaries. Historically, Medicaid paid for services, including those for behavioral health conditions, on a FFS basis, through which providers are paid for each billable service they deliver. During the past several decades, Medicaid payment has shifted to managed care arrangements, through which providers are paid for some or all services at a prepaid rate. Behavioral health services are increasingly provided through managed care arrangements, but some states “carve out” behavioral health services from their managed care contracts, and these services are instead provided and financed under another contractual arrangement, such as a prepaid health plan, or on a FFS basis.30  However, many of these states are moving to “carve in” these services and deliver them through the same managed care contracts as physical health services.31   For example, in 2016, 20 states covered outpatient mental health services, 24 covered inpatient mental health services, and 24 covered SUD services through comprehensive managed care contracts.32 

States and health plans have undertaken a range of reforms to delivering behavioral health services to Medicaid beneficiaries. Many state Medicaid agencies, health plans, and providers are implementing physical and behavioral health integration strategies in Medicaid to address longstanding fragmentation between these services.33  These strategies include universal screening for behavioral health conditions during medical appointments and vice versa, using patient navigators, co-locating services at a single site, sharing data and information, blending funding streams, and incentivizing providers to work together to coordinate care.34 ,35   

States are also using the health homes plan option, created under the ACA, to deliver care to beneficiaries with chronic physical or mental health conditions. Under this model, states cover care management and coordination services designed to integrate physical and behavioral health services, acute care and long-term services and supports, and referrals to community-based social services and supports. Of the 21 states that had implemented health homes as of January 2017, 17 included beneficiaries with behavioral health conditions, primarily serious mental illness (Figure 2).36 

The ACA also expanded the Section 1915 (i) home and community-based services (HCBS) state plan option, which allows states to offer HCBS to beneficiaries who have some functional needs but who do not yet require an institutional level of care.37   This option enables states to provide HCBS as a preventive measure to avoid the need for more costly care in the future, such as institutional care, if beneficiaries’ conditions were to worsen without services.38  Under Section 1915 (i), states can target services to specific populations, including people with behavioral health needs. Twelve states have opted to operate Section 1915 (i) programs targeting people with behavioral health conditions as of 2015 (Figure 2).39 

In addition, the Money Follows the Person (MFP) demonstration provided states with enhanced federal funding for 12 months for every beneficiary who transitioned from an institution to the community. Of the 44 states participating in the MFP demonstration, 19 focused on increasing the number of transitions for people with mental illness (Figure 2). These states used a number of strategies, such as conducting outreach at nursing facilities, working with MCOs to coordinate services, and adding new demonstration services such as SUD treatment and peer support. As a result of this program, there was a 77 percent increase in transitions for individuals with mental illness from 2013 to 2015.40   Although states can continue to spend their existing grant money until 2020, MFP funding expired in September 2016, and has not been reauthorized by Congress.

Figure 2: Number of States Using ACA Options for Behavioral Health Service Delivery

Are Medicaid enrollees able to access behavioral health care?

Compared to people who are uninsured, individuals who are covered by Medicaid have better access to behavioral health services. Among adults with behavioral health conditions in 2015, those with Medicaid were more likely than those without coverage to receive mental health treatment (43 percent versus 18 percent) and SUD treatment (9 percent versus 6 percent) (Figure 3).41   Research has also demonstrated that adults with Medicaid who had mental health conditions were significantly less likely than those who were uninsured to report unmet need for health care.42  Additionally, increased availability of Medicaid coverage has been associated with a decreased likelihood of having an unmet need for behavioral health care43  and an improvement in mental health status.44  One study found that, among adults with mental illness, those with Medicaid were over two and a half times as likely as those without insurance to have received treatment in the previous year, even after accounting for demographic differences between the two groups.45 

Figure 3: Proportion of Adults with Behavioral Health Conditions who Received Treatment, 2015

However, some gaps remain in access to behavioral health care for many people, including those with Medicaid. In 2015, approximately 2.5 million people with Medicaid reported an unmet need for mental health treatment.46  Some of the barriers to accessing behavioral health treatment in Medicaid reflect larger system-wide access problems. Many individuals with behavioral health conditions, with and without Medicaid, report not receiving treatment for their conditions. The overall shortage of behavioral health providers in the United States,47  and the relatively small number of psychiatrists who accept insurance,48  both present barriers to accessing behavioral health care. Additional barriers may exist for individuals with SUD because SUD coverage has traditionally been even more limited than that of mental health in both private insurance and Medicaid.49  Social stigma associated with mental illness and SUD as well as individuals’ perception that they do not need treatment may also pose barriers to accessing care.50 ,51 

How much does Medicaid spend on behavioral health services?

Medicaid expenditures for enrollees with behavioral health conditions are relatively high due to this group’s substantial health needs. Compared to enrollees without behavioral health conditions, Medicaid beneficiaries with these needs are more likely to have comorbid chronic physical conditions and to rate their overall health as fair or poor.52  As a result, they have more intensive service use than other beneficiaries, including office visits, inpatient stays, emergency visits, and prescription drugs.53   Though enrollees with behavioral health conditions accounted for just 20 percent of enrollees in 2011, this population accounted for almost half (48%) of Medicaid spending (Figure 4).

Figure 4: Proportion of Medicaid Enrollment and Spending on Enrollees with and without Behavioral Health Conditions, 2011

On a per enrollee basis, average Medicaid spending for people with behavioral health diagnoses was nearly four times what it was for enrollees without these diagnoses ($13,303 vs. $3,564).  (Figure 5).  This includes both behavioral and physical health care as well as long-term care, reflecting enrollees’ greater needs in a variety of areas.54 ,55 

Figure 5: Medicaid Spending on Enrollees with and without Behavioral Health Conditions, 2011

Medicaid accounted for 25% of all spending on mental health services and 21% of all spending on SUD services in 2014, making it one of the largest financing sources (Figure 6).  Private insurance accounted for 28% of mental health spending and 18% of SUD spending, and state and local funds accounted for 14% and 29%, respectively.56 

Figure 6: Proportion of Total Spending on Behavioral Health Services in 2014, by Payer

Medicaid spending on behavioral health grew substantially following the ACA’s Medicaid expansion. In 2014, spending on mental health was approximately $46.5 billion, a 23% increase from 2009. During the same period, spending on SUD increased 43%, totaling $7.1 billion in 2014.57  Many adults who gained coverage under the ACA’s expansion were previously uninsured and, through Medicaid, they were able to access treatment for behavioral health needs.

States are able to use Medicaid as a platform to support changing patterns of care for behavioral health over time.  For example, Medicaid has supported the shift from institutional to community-based care, the adoption of new psychotropic drugs, and the use of assertive community treatment (ACT) and other rehabilitative programs. Medicaid financing has also enabled states to provide a full continuum of care, including prevention, screening, evidence-based treatment, and recovery support. As a result, Medicaid is now a crucial component of state behavioral health systems.

Looking Ahead

Individuals with behavioral health conditions often require costly medical and long-term services. As a result, although they make up only 20% of the Medicaid population, they account for 48% of Medicaid spending. Medicaid facilitates access to a broad range of mandatory and optional behavioral health services, including psychiatric care, counseling, prescription medications, inpatient treatment, case management, and supportive housing. The ACA has played an important role in increasing access to behavioral services among Medicaid enrollees by expanding eligibility.  Many states have also taken advantage of newer HCBS service delivery options in recent years, which have enabled beneficiaries with behavioral health conditions to live in the community while they receive care.  States also are exploring new models to better integrate physical and behavioral health care.

Medicaid’s financing structure currently guarantees federal financial support to states with no pre-set limit and allows federal spending to increase as state spending increases. The BCRA would fundamentally change the Medicaid program’s federal financing structure and substantially decrease the amount federal funds available to states through a per capita cap or block grant, which has implications for enrollees with behavioral health conditions. The BCRA would also eliminate the enhanced federal financing for the ACA’s expansion, which could lead expansion adults to lose coverage.  The Congressional Budget Office estimates that the BCRA would result in 15 million fewer Medicaid enrollees and a $772 billion reduction in federal Medicaid spending from 2017 to 2016 as a result of the elimination of the enhanced federal funding for the ACA’s expansion and the creation of a per capita cap or block grant.58 

In response to the BCRA’s changes, states may restrict Medicaid eligibility and may be incentivized to limit coverage for enrollees with behavioral health conditions, who are especially costly. States may also trim benefit packages and remove optional services that are particularly valuable to enrollees with behavioral health conditions. In addition, states may decrease provider payment rates, which may lead to decreased provider participation in Medicaid and further limit access to behavioral health services. Finally, states currently benefit from the guarantee of federal Medicaid financing with no pre-set limit, which allows them to respond to emerging issues, such as the opioid epidemic. Faced with increased pressure to limit costs, states will likely struggle to address these issues. States with certain risk factors, such as a high share of the population reporting poor mental health and a high opioid death rate, may be especially challenged to respond to federal Medicaid cuts and caps.

Decreases in eligibility, coverage, provider payment rates, and, ultimately, access could result in high levels of unmet need for behavioral health services among Medicaid enrollees. In addition to impacting health outcomes, untreated behavioral health conditions are associated with many societal costs, resulting from increased emergency department utilization, criminal justice involvement, and loss of productivity.59 ,60 ,61 ,62 

Individuals with behavioral health conditions have a unique and complex set of needs, and Medicaid plays a large role in facilitating access to necessary treatment. As the debate about fundamentally restructuring Medicaid program financing continues, the unique needs of these enrollees warrant consideration.

Endnotes

  1. Committee to Evaluate the Supplemental Security Income Disability Program for Children with Mental Disorders; Board on the Health of Select Populations; Board on Children, Youth, and Families; Institute of Medicine; Division of Behavioral and Social Sciences and Education; The National Academies of Sciences, Engineering, and Medicine, Mental Disorders and Disabilities Among Low-Income Children, ed. Boat TF and Wu JT, (Washington, DC: National Academies Press (US); October 2015), http://www.ncbi.nlm.nih.gov/pubmed/26632628.   ↩︎
  2. Jitender Sareen, et al., “Relationship Between Household Income and Mental Disorders: Findings From a Population-Based Longitudinal Study,” Archives of General Psychiatry, 68, 4(2011):419-27.   ↩︎
  3. Bridget F. Grant, et al., “Epidemiology of DSM-5 Alcohol Use Disorder: Results From the National Epidemiologic Survey on Alcohol and Related Conditions III,” JAMA Psychiatry, 72, 8(2015):757-66.   ↩︎
  4. Kaiser Family Foundation analysis of 2015 National Survey on Drug Use and Health. ↩︎
  5. [v] Ibid. ↩︎
  6. [vi] Center for Behavioral Health Statistics and Quality, 2015 National Survey on Drug Use and Health: Detailed Tables (Rockville, MD: Substance Abuse and Mental Health Services Administration, September 2016), https://www.samhsa.gov/data/sites/default/files/NSDUH-DetTabs-2015/NSDUH-DetTabs-2015/NSDUH-DetTabs-2015.pdf   ↩︎
  7. Kaiser Family Foundation analysis of 2015 National Survey on Drug Use and Health ↩︎
  8. Tricia Brooks et al., Medicaid and CHIP Eligibility, Enrollment, Renewal, and Cost Sharing Policies as of January 2017: Findings from a 50-State Survey (Washington, DC: Kaiser Family Foundation, January 2017), https://modern.kff.org/medicaid/report/medicaid-and-chip-eligibility-enrollment-renewal-and-cost-sharing-policies-as-of-january-2017-findings-from-a-50-state-survey/.   ↩︎
  9. Medicaid and CHIP Payment and Access Commission (MACPAC), Report to Congress on Medicaid and CHIP (Washington, DC: MACPAC, June 2015), https://www.macpac.gov/wp-content/uploads/2015/06/June-2015-Report-to-Congress-on-Medicaid-and-CHIP.pdf. ↩︎
  10. [x] States that elect the § 209 (b) option are permitted to use definitions of disability or financial eligibility standards that are more restrictive than the federal SSI rules, so long as the state’s rules are not more restrictive than those in effect in January 1972.  Section 209 (b) states must allow SSI beneficiaries to establish Medicaid eligibility through a spend-down by deducting unreimbursed out-of-pocket medical expenses from their countable income.  Section 209 (b) states also must provide Medicaid to children who receive SSI and who meet the state’s financial eligibility rules for the AFDC program as of July 16, 1996.   ↩︎
  11. Molly O’Malley Watts, et al., Medicaid Financial Eligibility for Seniors and People with Disabilities in 2015 (Washington, DC: Kaiser Family Foundation, March 2016), https://modern.kff.org/medicaid/report/medicaid-financial-eligibility-for-seniors-and-people-with-disabilities-in-2015/. ↩︎
  12. Medicaid and CHIP Payment and Access Commission (MACPAC), Report to Congress on Medicaid and CHIP (Washington, DC: MACPAC, June 2015), https://www.macpac.gov/wp-content/uploads/2015/06/June-2015-Report-to-Congress-on-Medicaid-and-CHIP.pdf. ↩︎
  13. Medicaid and CHIP Payment and Access Commission (MACPAC), Report to Congress on Medicaid and CHIP (Washington, DC: MACPAC, June 2015), https://www.macpac.gov/wp-content/uploads/2015/06/June-2015-Report-to-Congress-on-Medicaid-and-CHIP.pdf. ↩︎
  14. [xiv] Ibid.   ↩︎
  15. Ibid. ↩︎
  16. Ibid. ↩︎
  17. Ibid. ↩︎
  18. Substance Abuse and Mental Health Services Administration, Medicaid Handbook: Interface with Behavioral Health Services (Rockville, MD: US Department of Health and Human Services, 2013), http://store.samhsa.gov/shin/content//SMA13-4773/SMA13-4773.pdf.   ↩︎
  19. Julia Paradise and MaryBeth Musumeci, CMS’s Final Rule on Medicaid Managed Care: A Summary of Major Provisions (Washington, DC: Kaiser Family Foundation, June 2016), https://modern.kff.org/medicaid/issue-brief/cmss-final-rule-on-medicaid-managed-care-a-summary-of-major-provisions/.   ↩︎
  20. Centers for Medicare & Medicaid Services, New Service Delivery Opportunities for Individuals with a Substance Use Disorder (Baltimore, MD: Centers for Medicare & Medicaid Services, July 2015), https://www.medicaid.gov/federal-policy-guidance/downloads/SMD15003.pdf. ↩︎
  21. Substance Abuse and Mental Health Services Administration, Medicaid Handbook: Interface with Behavioral Health Services (Rockville, MD: US Department of Health and Human Services, 2013), http://store.samhsa.gov/shin/content//SMA13-4773/SMA13-4773.pdf. ↩︎
  22. [xxii] MaryBeth Musumeci and Henry Claypool, Olmstead’s Role in Community Integration for People with Disabilities Under Medicaid: 15 Years After the Supreme Court’s Olmstead Decision (Washington, DC: Kaiser Family Foundation , June 2014), https://modern.kff.org/medicaid/issue-brief/olmsteads-role-in-community-integration-for-people-with-disabilities-under-medicaid-15-years-after-the-supreme-courts-olmstead-decision/.   ↩︎
  23. 42 U.S.C. § 1396u-7; 42 U.S.C. § 1396a (k) (1); 42 C.F.R. § § 440.300-440.390.  Beneficiaries who are “medically frail” cannot be required to receive an ABP and instead must have access to the state plan benefit package.  42 U.S.C. § 1396u-7 (a) (2) (vi); 42 C.F.R. § 440.315 (f).   ↩︎
  24. States that expanded Medicaid can choose to align their ABP for expansion adults with their Medicaid state plan benefit package. However, in states that do not align the two benefit packages, adult beneficiaries may have access to different behavioral health and other services based on their eligibility pathway. In these states, people who qualify for Medicaid both through a disability-related pathway and based on their low income can choose their coverage group and, therefore, their benefit package. ↩︎
  25. [xxv] MaryBeth Musumeci, Behavioral Health Parity and Medicaid (Washington, DC: Kaiser Family Foundation, June 2015), http://modern.kff.org/report-section/behavioral-health-parity-and-medicaid-issue-brief/. ↩︎
  26. [xxvi] CMS has published a final rule that applies federal mental health parity requirements to all Medicaid services provided to MCO enrollees, whether those services are delivered on a capitated or FFS basis. ↩︎
  27. [xxvii] Ken Cannon, Jenna Burton, and MaryBeth Musumeci, Adult Behavioral Health Benefits in Medicaid and the Marketplace (Washington, DC: Kaiser Family Foundation, June 2015), https://modern.kff.org/medicaid/report/adult-behavioral-health-benefits-in-medicaid-and-the-marketplace/. ↩︎
  28. [xxviii] 42 U.S.C. § § 1396a (a) (43), 1396d (r) (5). ↩︎
  29. [xxix] Substance Abuse and Mental Health Services Administration, Medicaid Handbook: Interface with Behavioral Health Services (Rockville, MD: US Department of Health and Human Services, 2013), http://store.samhsa.gov/shin/content//SMA13-4773/SMA13-4773.pdf.   ↩︎
  30. Vernon K. Smith, et al., Implementing Coverage and Payment Initiatives: Results from a 50-State Medicaid Budget Survey for State Fiscal Years 2016 and 2017 (Washington, DC: Kaiser Family Foundation, October 2016), https://modern.kff.org/medicaid/report/implementing-coverage-and-payment-initiatives-results-from-a-50-state-medicaid-budget-survey-for-state-fiscal-years-2016-and-2017/.   ↩︎
  31. Ibid. ↩︎
  32. Ibid. ↩︎
  33. [xxxiii] Mike Nardone, Sherry Snyder, and Julia Paradise, Integrating Physical and Behavioral Health Care: Promising Medicaid Models (Washington, DC: Kaiser Family Foundation, February 2014) https://modern.kff.org/medicaid/issue-brief/integrating-physical-and-behavioral-health-care-promising-medicaid-models/. ↩︎
  34. [xxxiv] David Mechanic and Mark Olfson, “The Relevance of the Affordable Care Act for Improving Mental Health Care.” Annual Review of Clinical Psychology 12 (2016):515-42.     ↩︎
  35. Medicaid and CHIP Payment and Access Commission (MACPAC), Report to Congress on Medicaid and CHIP (Washington, DC: MACPAC, March 2016), https://www.macpac.gov/wp-content/uploads/2016/03/March-2016-Report-to-Congress-on-Medicaid-and-CHIP.pdf. ↩︎
  36. Center for Health Care Strategies, Medicaid Health Homes: Implementation Update, (Hamilton, NJ: Center for Health Care Strategies, Inc., January 2017), http://www.chcs.org/media/Health_Homes_FactSheet-01-18-17.pdf.   ↩︎
  37. Molly O’Malley Watts, et al., Medicaid Financial Eligibility for Seniors and People with Disabilities in 2015 (Washington, DC: Kaiser Family Foundation, March 2016), https://modern.kff.org/medicaid/report/medicaid-financial-eligibility-for-seniors-and-people-with-disabilities-in-2015/.   ↩︎
  38. MaryBeth Musumeci and Henry Claypool, Olmstead’s Role in Community Integration for People with Disabilities Under Medicaid: 15 Years After the Supreme Court’s Olmstead Decision (Washington, DC: Kaiser Family Foundation , June 2014), https://modern.kff.org/medicaid/issue-brief/olmsteads-role-in-community-integration-for-people-with-disabilities-under-medicaid-15-years-after-the-supreme-courts-olmstead-decision/.   ↩︎
  39. Medicaid and CHIP Payment and Access Commission, Behavioral health services covered under HCBS waivers and 1915(i) SPAs (Washington, DC: Medicaid and CHIP Payment and Access Commission, September 2015), https://www.macpac.gov/subtopic/behavioral-health-services-covered-under-hcbs-waivers-and-spas/. ↩︎
  40. Molly O’Malley Watts, Erica L. Reaves, and MaryBeth Musumeci, Money Follows the Person: A 2015 State Survey of Transitions, Services, and Costs (Washington, DC: Kaiser Family Foundation, October 2015), https://modern.kff.org/medicaid/report/money-follows-the-person-a-2015-state-survey-of-transitions-services-and-costs/. ↩︎
  41. Kaiser Family Foundation Analysis of 2015 National Survey on Drug Use and Health. ↩︎
  42. [xlii] Lisa Clemans-Cope, et al, “The Expansion of Medicaid Coverage under the ACA: Implications for Health Care Access, Use, and Spending for Vulnerable Low-income Adults,” Inquiry 50, 2(2013):135-49.   ↩︎
  43. Hefei Wen, Benjamin G. Druss, and Janet R. Cummings, “Effect of Medicaid Expansions on Health Insurance Coverage and Access to Care among Low-Income Adults with Behavioral Health Conditions,” Health Services Research 50, 6(2015):1787-809. ↩︎
  44. [xliv] Katherine Baicker, et al., “The Oregon Experiment – Effects of Medicaid on Clinical Outcomes,” New England Journal of Medicine. 368, 18(2013):1713-22. ↩︎
  45. [xlv] Elizabeth Reisinger Walker, et al., “Insurance Status, Use of Mental Health Services, and Unmet Need for Mental Health Care in the United States,” Psychiatric Services, 66, 6(2015):578-84. ↩︎
  46. [xlvi] Center for Behavioral Health Statistics and Quality, 2015 National Survey on Drug Use and Health: Detailed Tables (Rockville, MD: Substance Abuse and Mental Health Services Administration, September 2016), https://www.samhsa.gov/data/sites/default/files/NSDUH-DetTabs-2015/NSDUH-DetTabs-2015/NSDUH-DetTabs-2015.pdf.   ↩︎
  47. Substance Abuse and Mental Health Services Administration, Report to Congress on the Nation’s Substance Abuse and Mental Health Workforce Issues (Rockville, MD: US Department of Health and Human Services, January 2013), https://store.samhsa.gov/shin/content/PEP13-RTC-BHWORK/PEP13-RTC-BHWORK.pdf.   ↩︎
  48. Tara F. Bishop, et al., “Acceptance of Insurance by Psychiatrists and the Implications for Access to Mental Health Care,” JAMA Psychiatry, 71, 2(2014):176-81.   ↩︎
  49. Richard G. Frank, Kirsten Beronio, and Sherry A. Glied, “Behavioral Health Parity and the Affordable Care Act,” Journal of Social Work in Disability & Rehabilitation, 13, 1-2(2014):31-43.   ↩︎
  50. Ramin Mojtabai, Mark Olfson, Nancy Sampson, et al., “Barriers to Mental Health Treatment: Results from the National Comorbidity Survey Replication,” Psychological Medicine, 41, 8(2011):1751-61.   ↩︎
  51. Ramin Mojtabai, Lian Yu Chen, Christopher Kaufmann, et al., “Comparing Barriers to Mental Health Treatment and Substance Use Disorder Treatment Among Individuals with Comorbid Major Depression and Substance Use Disorders,” Journal of Substance Abuse Treatment, 46, 2(2014)268-73.   ↩︎
  52. Kaiser Family Foundation, The Role of Medicaid for People with Behavioral Health Conditions (Washington, DC: Kaiser Family Foundation, November 2012), https://modern.kff.org/wp-content/uploads/2013/01/8383_bhc.pdf.   ↩︎
  53. Ibid.   ↩︎
  54. Full-benefit dual eligibles and seniors were included; however, partial-benefit enrollees and states with incomplete or low-quality managed care encounter data (11 states including DC) were excluded from the analysis.   ↩︎
  55. Medicaid and CHIP Payment and Access Commission (MACPAC), Report to Congress on Medicaid and CHIP (Washington, DC: MACPAC, June 2015), https://www.macpac.gov/wp-content/uploads/2015/06/June-2015-Report-to-Congress-on-Medicaid-and-CHIP.pdf.   ↩︎
  56. Tami L. Mark, Tracy Yee, Katharine R. Levit, et al. “Insurance Financing Increased for Mental Health Conditions But Not For Substance Use Disorders, 1986-2014,” Health Affairs (Millwood) 35, 6(2016):958-965.   ↩︎
  57. Ibid.   ↩︎
  58. Congressional Budget Office, H.R. 1628 American Health Care Act of 2017 Cost Estimate (Washington, DC: Congressional Budget Office, May 2017), https://www.cbo.gov/system/files/115th-congress-2017-2018/costestimate/hr1628aspassed.pdf. ↩︎
  59. Ronald C. Kessler, et al., “Depression in the Workplace: Effects on Short-Term Disability,” Health Affairs, 18, 5(1999):163-71.   ↩︎
  60. Neil Jordan, et al., “Economic Benefit of Chemical Dependency Treatment to Employers,” Journal of Substance Abuse Treatment, 34, 3(2008):311-319.   ↩︎
  61. Doris J. James and Lauren E. Glaze. Mental Health Problems of Prison and Jail Inmates (Washington, DC: US Department of Justice, December 2006), https://www.bjs.gov/content/pub/pdf/mhppji.pdf.   ↩︎
  62. Cheryl J. Cherpitel and Yu Ye, “Drug Use and Problem Drinking Associated with Primary Care and Emergency Room Utilization in the US General Population: Data from the 2005 National Alcohol Survey,” Drug and Alcohol Dependence, 97, 3(2008):226-230. ↩︎

States and Medicaid Provider Taxes or Fees

Published: Jun 27, 2017

Medicaid is jointly financed by states and the federal government. Provider taxes are an integral source of Medicaid financing governed by long-standing regulations. All but one state (Alaska) reported a provider tax in FY 2016 (Figure 1).  Under current regulations, states may not use provider tax revenues for the state share of Medicaid spending unless the tax meets three requirements: must be broad-based, uniformly imposed, and cannot hold providers harmless from the burden of the tax. Federal regulations create a safe harbor from the hold-harmless test for taxes where collections are 6.0 percent or less of net patient revenues.1  However, federal health reform legislation under consideration in the Senate as of June 2017 would phase down the maximum federally allowable safe harbor limit under the “hold-harmless” rule, beginning in fiscal year (FY) 2021, to 5.0 percent of net patient revenues by FY 2025.

Figure 1: States with provider taxes or fees in place in FY 2016

This would restrict states’ ability to come up with the state share to finance Medicaid and could therefore shift additional costs to states. If states were not able to find additional funds to replace provider tax funding with other state sources, limits on provider taxes could result in program cuts with implications for Medicaid providers and beneficiaries. Since states use provider taxes differently, limits would have different effects across states. This fact sheet briefly highlights the role of provider taxes in states and the possible impact of limiting the use of these taxes. Data is based on findings from the 50-state Medicaid budget survey conducted in July 2016 by the Kaiser Commission on Medicaid and the Uninsured and Health Management Associates.

HOW IS THE MEDICAID PROGRAM FINANCED?

States and the federal government share in the financing of the Medicaid program. Under federal Medicaid law, the federal government pays between 50 and 74 percent of all the costs of providing services to beneficiaries under the program. These matching rates (FMAPs) vary across states based on the state’s per capita income in comparison to the national average (i.e., states with lower per capita income have higher matching rates). The remaining share of program funding comes from state and local sources. One of the ways states raise funds for their share of Medicaid spending is through provider taxes/fees. Eight states, of the 32 states (including DC) that have adopted the ACA Medicaid expansion, also indicated that they planned to use provider taxes/fees to fund the state share of the Medicaid expansion when the federal match dropped from 100% to 95% in January 2017.2 

WHAT ROLE DO PROVIDER TAXES PLAY IN STATE FINANCING OF MEDICAID?

Provider taxes are imposed by states on health care services where the burden of the tax falls mostly on providers, such as a tax on inpatient hospital services or nursing facility beds. Provider taxes have become an integral source of financing for Medicaid. For FY 2016, all but one state (Alaska) reported having at least one Medicaid provider tax and two-thirds of states reported three or more provider taxes (Table 1, Figure 1).

States use the additional revenue collected by provider taxes in a number of ways to support Medicaid programs. For example, provider taxes help to support provider rate increases or to help mitigate provider rate cuts. States also have used funds collected from provider taxes to support the Medicaid program more broadly. For example, Colorado used some of the funds raised through their hospital provider fee to expand eligibility to parents and children. During economic downturns, when state tax revenues fall at the same time that demand for public services like Medicaid increases, states are more likely to impose or increase provider taxes to help fund the state share of Medicaid.

In the past, states were able to use provider taxes and other state financing arrangements to enable states to receive higher effective federal matching rates than the statutory formula provides. However, legislation enacted in 1991 restricted the use of provider taxes to curb abusive practices. Under current regulations, states may not use provider tax revenues for the state share of Medicaid spending unless the tax meets three requirements: must be broad-based, uniformly imposed, and cannot hold providers harmless from the burden of the tax. Federal regulations create a safe harbor from the hold-harmless test for taxes where collections are 6.0 percent or less of net patient revenues.3 

WHAT WOULD THE IMPACT OF LIMITING THE USE OF PROVIDER TAXES BE ON STATES?

On June 22, 2017, the Senate released the “Better Care Reconciliation Act of 2017” which proposes a phase down of the provider tax safe harbor threshold from 6.0 percent to 5.0 percent of net patient revenues over 5 years beginning in 2021. The threshold would be reduced to 5.8 percent in 2021, 5.6 percent in 2022, 5.4 percent in 2023, 5.2 percent in 2024, and 5.0 percent in 2025 and beyond. The 2016 Kaiser Medicaid budget survey asked states to identify whether each of the provider taxes they reported exceeded 3.5 percent of net patient revenues and/or exceeded 5.5 percent of net patient revenues as of July 1, 2016. States indicated that over 3 in 10 provider taxes in use were above the 5.5 percent threshold. In the 2016 survey, 28 states estimated that at least one provider tax was above this 5.5 percent threshold (Figure 2) and 11 of these states reported 2 or more provider taxes/fees above this threshold4  (Table 1). Broken out by type of provider tax, 20 states reported having nursing facility taxes exceeding 5.5 percent of net patient revenues, 15 states reported having taxes on intermediate care facilities for the intellectually disabled exceeding 5.5 percent, and 6 states reported having hospital taxes exceeding 5.5 percent as of July 1, 2016 (Table 2).

Figure 2: States with at least 1 provider tax or fee over 3.5% and over 5.5% net patient revenues

Limitations on provider taxes would have a more notable impact in those states that are heavily dependent on provider tax revenues to fund their state share of Medicaid spending. If provider taxes are limited, states would need to increase state funds to maintain current programs or make program cuts. Such changes in available financing could have negative implications for providers and beneficiaries under the current operation of the program as well as for the implementation of the ACA.

Table 1: Provider Taxes and Fees in Place in FY 2016
StateHave at least 1 provider taxHave at least 1 provider tax over 3.5% of net patient revenue# of taxes over 3.5%Have at least 1 provider tax over 5.5% of net patient revenue# of taxes over 5.5%
AK00
ALXX2X1
ARXX2X2
AZXX10
CAXX3X3
COXX30
CTXX4X3
DCXX20
DEXX10
FLXX2X2
GAXX1X1
HIX00
IAXX10
IDXX10
ILXX10
INXX3X1
KSX00
KYXX30
LAX00
MAXX1X1
MDXX3X2
MEXNRNRNRNR
MIXX20
MNXX10
MOXX4X3
MSXX4X4
MTX00
NCXX2X1
NDXX1X1
NEXX1X1
NHXX20
NJXX1X1
NMXX10
NVXX1X1
NYXX30
OHXX3X3
OKXX2X2
ORXX2X1
PAXX5X2
RIXX2X1
SCX00
SDXX10
TNXX4X1
TXXX10
UTXX2X1
VAXX10
VTXX4X4
WAXX2X1
WIXX2X1
WVXX3X1
WYXX1X1
Total5044922847
NOTES: This table includes Medicaid provider taxes as reported by states. Some states also have premium or claims taxes that apply to managed care organizations and other insurers. Since this type of tax is not considered a provider tax by CMS, these taxes are not counted as provider taxes in this report. CA, DC, MD, NM, OH, PA, RI, TN, TX reported MCO taxes that were counted as Medicaid provider taxes; these taxes exceed 5.5% of net patient revenues in OH and TN. NR=Not reported by state.

SOURCE: Kaiser Commission on Medicaid and the Uninsured Survey of Medicaid Officials in 50 states and DC conducted by Health Management Associates, October 2016.

Table 2: Provider Taxes and Fees in Place in FY 2016, by Provider Type

State

Nursing FacilitiesICF/IDHospitalsTotal
Tax in placeOver 3.5%Over 5.5%Tax in placeOver 3.5%Over 5.5%Tax in placeOver 3.5%Over 5.5%Total # taxesTotal over 3.5%Total over 5.5%
AK000
ALXXXXX321
ARXXXXXXX322
AZXXX210
CAXXXXXXXXX433
COXXXXXX330
CTXXXXXXXX443
DCXXXXX420
DEXX110
FLXXXXXXX322
GAXXXX211
HIXX200
IAXXXX310
IDXXXX310
ILXXXX310
INXXXXXXX331
KSXX200
KYXXXXX530
LAXX300
MAXXXX311
MDXXXXXXXX432
MEXNRNRXNRNRXNRNR4NRNR
MIXXXX220
MNXXXX410
MOXXXXXXXXX543
MSXXXXXXXXX444
MTXXX300
NCXXXXXX321
NDXXX111
NEXXXX211
NHXXXX220
NJXXXXX511
NM310
NVXXX111
NYXXXXXX530
OHXXXXXXX433
OKXXXXXXX322
ORXXXXX221
PAXXXXXXXX552
RIXXXXX321
SCXX200
SDXX110
TNXXXXXX441
TXXX210
UTXXXXXX421
VAXX110
VTXXXXXXXXX444
WAXXXXXX321
WIXXXX421
WVXXXXXX531
WYXXX111
Total443220363115401761529247
NOTES: This table includes Medicaid provider taxes in place as of FY 2016 and state-reported data on whether each provider tax exceeded 3.5% and/or 5.5% of net patient revenues as of July 1, 2016. Total numbers of provider taxes in place, over 3.5%, and over 5.5% include some “other” provider taxes reported by states that are not included in this table. Therefore, state counts across the three categories do not sum to totals for all states. ICF/ID=Intermediate care facilities for the intellectually disabled. NR=Not reported by state.

SOURCE: Kaiser Commission on Medicaid and the Uninsured Survey of Medicaid Officials in 50 states and DC conducted by Health Management Associates, October 2016.

  1. Prior to October 2011, this safe harbor threshold was temporarily reduced to 5.5 percent of net patient revenues. ↩︎
  2. As of the survey conducted in July 2016, eight states (Arkansas, Arizona, Colorado, Illinois, Indiana, Louisiana, New Hampshire, and Ohio) reported plans to use new or increased provider taxes/fees, or insurance premium taxes, to fund at least some of the state share of Medicaid expansion costs in 2017 when the federal match rate declined from 100% for those newly eligible under expansion. ↩︎
  3. Prior to October 2011, this safe harbor threshold was temporarily reduced to 5.5 percent of net patient revenues. ↩︎
  4. State responses reflect estimates; some taxes are imposed in a way that is not directly tied to the % of net patient revenue (e.g. nursing home bed tax). ↩︎

Premiums under the Senate Better Care Reconciliation Act

Authors: Gary Claxton, Anthony Damico, Larry Levitt, and Cynthia Cox
Published: Jun 26, 2017

Issue Brief

The Senate Better Care Reconciliation Act (BCRA) would make significant changes to the amounts that people pay for nongroup coverage and for the care they receive under the Affordable Care Act (ACA). The tables below provide estimates of how premiums after taking into account tax credits would change for people currently enrolled in the federal and state marketplaces.

Under current law, people with incomes between 100 percent and 400 percent of the federal poverty level are eligible for premium tax credits to help them pay the premium for nongroup coverage purchased through the federal or a state marketplace if they do not have access to other affordable coverage. People are responsible for paying a specified percent of their income (“required income percentage”) toward the cost of the benchmark plan (the second-lowest cost silver plan in their area), and the federal government pays the remainder of the premium to their insurer; this amount is the person’s premium tax credit. The required income percentages people are responsible to pay vary with income: In 2017, people with incomes between 100 percent and 133 percent of poverty contribute 2.04 percent of income, while people with incomes between 300 percent and 400 percent of poverty contribute 9.69 percent of their income.1  Because premiums vary with age but the share of income people are responsible to pay does not, older people receive larger premium tax credits than younger people with the same income but pay the same amount for the benchmark plan.

Beginning in 2020, the BCRA would make several significant revisions that affect the premium tax credits that people receive when they purchase nongroup coverage. First, the bill would revise income eligibility for premium tax credits, extending eligibility to people with incomes below poverty but capping eligibility at 350 percent of poverty. Second, the bill amends the way that premium tax credits are calculated so that the required income percentages vary with age and with income. Our estimates of the required income percentages under current law and the BCRA for 2020 are shown in the Appendix. The result is that on average people at younger ages would pay a lower share of their income to purchase a benchmark plan than they today while people at older ages would pay a higher share. Third, the bill reduces the value of the benchmark plans that are used to determine premium tax credits. The result is that a person who used their premium tax credit to purchase a benchmark plan would get a plan that on average would pay 58 percent of expected covered costs (a bronze plan), compared to 70 percent (a silver plan) under current law. A plan paying 58 percent of expected covered costs would have much higher cost sharing (e.g., deductibles) than a plan covering 70 percent of costs. This change is particularly important because the BCRA also would eliminate the cost sharing subsidies available under current law that reduce cost sharing and out-of-pocket limits for marketplace enrollees with incomes at or below 250 of poverty.

The bill also authorizes states to change the amount that premiums for adults can vary due to age, from 3:1 under current law to 5:1 (or a different ratio at state discretion). This would lower premiums for younger adults and raise them for older adults in states that made the change.2 

Results

We estimated the average premiums that current marketplace enrollees would pay, after receiving any premium tax credit, for a benchmark silver plan in 2020 under current law and under the BCRA. Most current marketplace enrollees purchase silver plans, so we used those as the basis for a comparison of how much people would pay for equivalent coverage under the ACA versus the BCRA. The methods we used in making our estimates are described in more detail below.

Overall, marketplace enrollees would pay on average 74 percent more towards the premium for a benchmark silver plan in 2020 under the BCRA than under current law (Table 1). Younger enrollees would see modest increases on average (10 percent for those under age 18; 17 percent for those ages 18 to 34), while average premiums would more than double for enrollees ages 55 to 64. State-level results are in Appendix Table 2.

Table 1: Monthly Premium for a Silver Plan Among Exchange Enrollees (By Age), 2020
AgeACA Premium After Tax CreditBCRA Premium After Tax Credit% Change
Under 18$110$12010%
18-34$145$16917%
35-44$194$27139%
45-54$208$40394%
55-64$271$583115%
65 and Older$310$660113%
Overall (All Ages)$197$34274%
Source: Kaiser Family Foundation

These results vary significantly by income as well (Table 2). Marketplace enrollees with incomes below 200 percent of poverty would see an average increase in their premium costs of 177 percent, while higher income enrollees would see an increase of 57 percent.

Table 2: Monthly Premium for a Silver Plan Among Exchange Enrollees (By Income and Age), 2020
Income Below 200% of PovertyIncome 200% of Poverty or Above
AgeACA Premium After Tax CreditBCRA Premium After Tax Credit% ChangeACA Premium After Tax CreditBCRA Premium After Tax Credit% Change
< 18$26$58121%$176$170-4%
18-34$57$10382%$247$2470%
35-44$69$149117%$296$36925%
45-54$67$215223%$323$55672%
55-64$69$272294%$399$78296%
65 +$76$296288%$439$86296%
Overall $61$168177%$311$48957%
Source: Kaiser Family Foundation

There are important differences by age within these income groups: among enrollees with incomes below 200 percent of poverty, those in 18 to 34 age group would see an average increase of 82 percent while those in the 55 to 64 age group would see an average increase of 288 percent. Among enrollees with incomes 200 percent of poverty and above, enrollees in the 18 to 34 age group would not see an increase while those age 55 to 64 would see their premium costs almost double.

Discussion

The vast majority of marketplace enrollees would pay higher premiums in 2020 for a silver plan. Older and lower income enrollees see the biggest increases. These results are driven by several provisions in the BCRA. First, the BCRA reduces the value of the benchmark plan used to calculate the premium tax credits (from a plan that, on average, pays 70 percent of expected costs to a plan that pays 58 percent of expected costs). Lowering the benchmark means that marketplace enrollees could enroll in what is roughly a bronze plan by paying their required income percentage, but that they would need to pay the entire difference in premium to enroll in the silver level plans that are most prevalent today. The second factor is the change in the required income percentages under the BCRA, which generally would reduce what younger adults would be required to pay but increases the amounts paid by older adults, particularly those at higher incomes. Among people with higher incomes, reducing the maximum income eligibility for premium tax credits from 400 percent of poverty to 350 percent of poverty increases costs for some marketplace enrollees, particularly people at higher ages who face relatively high premiums. Increasing the permitted premium variation due to age also would increase premiums for older adults not eligible for premium tax credits.

These significant increases in the costs for silver plans may cause some or many marketplace enrollees to look to lower-value bronze-level plans, which they could purchase by paying their required income percentage. For younger marketplace enrollees, they generally would pay less under the BCRA to purchase a bronze level plan than they would pay for a silver plan under current law; older enrollees, however, generally would pay more for a bronze level plan under the BCRA than they would pay for a silver plan under current law. Moving down to bronze level plans, however, would expose enrollees to much higher cost sharing than in silver plans, and for many enrollees who now receive cost-sharing subsidies, the increases would be very large. The BCRA would eliminate the cost sharing subsidies provided under current law beginning in 2020.

The reduction in the value of the benchmark plan, along with the elimination of cost sharing subsidies, raises questions about whether lower income people would continue their coverage under the BCRA. While premiums after premium tax credits might be somewhat lower for younger enrollees purchasing bronze plans, their cost sharing would likely be thousands of dollars higher; the average deductible for bronze plans in 2017 with a combined deductible for medical and prescription expenses is $6,105; this compares to an average deductible of $809 for plans with cost sharing reductions for people with incomes between 150 and 200 percent of poverty and $255 for people with incomes between 100 and 150 percent of poverty. Many people with low incomes would have a difficult time paying the cost sharing under the benchmark plans in the BCRA, and may decide they do not want to pay even a relatively small premium for a plan that they would struggle to use.

Because of the short time between the release of the discussion draft and the planned debate and vote in the Senate, we were unable to address all of the provisions that might affect premiums under the BCRA. Our analysis assumes that unsubsidized premiums for a 40-year-old would ultimately be the same under the ACA and BCRA. In the score released today (June 26), the Congressional Budget Office expects the difference in unsubsidized premiums for a 40-year-old between the ACA and BCRA to be quite small in 2026, which is consistent with our assumption; however, they expect BCRA premiums to be relatively lower in 2020, due in part to larger federal funding available in 2020 to reduce premiums. While these changes would have some impact on our results, the impact would be muted because we have focused on the amount that people pay after tax credits, and for most marketplace enrollees, those amounts are determined by their required income percentage and not the actual plan premium. For these people, the actual premium affects the amount of their tax credit, but not what they would pay for a benchmark plan. Generally lower premiums would affect our results primarily for those marketplace enrollees who would pay the full premium with no premium tax credit under the BCRA. These generally would be people with higher incomes or younger people facing very low premiums such that the full premium would be less than their required income percentage.

Methods

We used data from the March 2016 Current Population Survey, the 2016 National Health Interview Survey and administrative data about the income and demographic distribution of the population enrolled in the federal and state marketplaces to construct a model of nongroup enrollees.

To impute marketplace enrollment status for each individual reporting directly purchased private health insurance to the March 2016 Current Population Survey, we applied a series of modeling techniques to the health insurance units (HIUs) described here in order to model the division of individuals holding nongroup coverage between those enrolled in a marketplace and those enrolled outside of a marketplace. Using the same multiply-imputed technique described here, we repeated our draw of each state’s nongroup population ten times to accurately account for sampling error.

We revised our Uninsured Calibration described in here to more closely align with the insurance coverage movements shown by the recent CDC publication of full-year 2016 National Health Interview Survey (NHIS) estimates.3  This CDC document shows continued gains in public coverage during the year and a leveling-off of private insurance coverage gains after the early 2016 Marketplace enrollment surge that mirrors administrative data sources. Our previous publications on this topic were calibrated to NHIS 2016 first quarter estimates; however, both HHS-published effectuated enrollment in the Exchanges at the end of March 2016 and also the insurer rate filings used to estimate the size of the off-marketplace population more closely align with the trends exhibited by NHIS 2016 full-year statistics.4  Calibrating to national CDC estimates allowed for on- and off-marketplace sampling targets consistent with administrative enrollment at the state level.

For each state’s on-marketplace and off-marketpace nongroup population, we drew purchasing units across five strata, each informed by federal data. For each state and the District of Columbia, we sampled subsidy-eligible marketplace enrollees both above and below 250% FPL, followed by a small group of ACA subsidy-eligibles forgoing help in the off-exchange market.5  Consistent with this administrative data, we also sampled a small group of wealthier nongroup enrollees (those not eligible for subsidies) into the Exchanges, and moved the remaining nongroup individuals into the off-exchange market. For non-immigrants with incomes below 100% of poverty, we calculate the amount of their required premium contribution as though their income were 138% of poverty. To most accurately reflect the age and income distribution of the Exchanges, each marketplace-purchasing unit received a sampling probability proportional to the average monthly subsidy per person within the state. At the conclusion of these ten repeated state sample draws, our average advanced premium tax credit (APTC) per month landed at $284 nationwide (compared to the $291 reported by HHS) and within $30 of the actual amounts displayed on table two of the HHS effectuated enrollment report for every geography except for the state of Connecticut.6  This close match of estimated APTC dollars for forty-nine states and the District of Columbia reflected a high degree of accuracy of the demographic (primarily age and income) distribution of our sampled exchange population.

To compare the effect of the Senate’s proposed Better Care Reconciliation Act (BCRA) against current law under the Affordable Care Act (ACA), we attached both the second lowest cost silver and the lowest cost bronze plan premiums to each individual in each local market.  These 2017 premiums from the Kaiser Family Foundation’s Subsidy Calculator matched CPS respondents at the state and metropolitan area-level, with smaller areas not disclosed by the U.S. Census Bureau computed using a population-weighted average premium across the aggregation of non-metro areas.  Matching our prior eligibility analyses, we computed ACA eligibility and subsidy receipt using the second lowest cost silver plan available to the HIU as the benchmark plan.  To reflect the 58% Actuarial Value (AV) level stated by the BCRA, we used each geographic area’s lowest cost bronze plan as the benchmark plan for each HIU.  In a small number of geographies without a bronze plan option for purchase on the 2017 exchanges, we used 85% of the silver plan as that local area’s benchmark plan premium.  For each individual’s premium calculations under the BCRA, we relaxed the ACA’s 3:1 age rating to a 5:1 age band in all states that did not have community rating requirements in place prior to 2014.  We followed CBO and HHS inflation factors to project all dollar values and thresholds to calendar year 2020.  Using CBO’s economic projections,7  we inflated the 2015 income amounts in the 2016 CPS for each HIU to 2020 dollars.  We increased premium dollars from 2017 to 2020 and both ACA and BCRA premium caps from 2014 to 2020 using Centers for Medicare & Medicaid Services Office of the Actuary projections.8  Our analysis assumes that states do not take up a waiver under the BCRA.

Gary Claxton, Larry Levitt, and Cynthia Cox are with the Kaiser Family Foundation. Anthony Damico is an independent consultant to the Kaiser Family Foundation.

Appendix

Appendix Table 1: Required Premium Contribution (Premium Payment as Percent of Income) Under the Affordable Care Act (ACA) and Better Care Reconciliation Act (BCRA), 2020
ACABCRA
Income (% FPL)All AgesUnder age 3030 – 3940 – 4950 – 5960 and older
Below 100%No Cap*2.14%2.14%2.14%2.14%2.14%
100%2.14%2.142.142.142.142.14
1333.222.682.682.682.682.68
1504.304.304.304.304.304.30
2006.774.625.696.777.848.91
2508.644.626.338.649.6610.74
30010.204.626.338.9711.2712.35
35010.206.879.5613.4216.9617.39
40010.20No CapNo CapNo CapNo CapNo Cap
Source: Kaiser Family Foundation*Note: In states that expand Medicaid under the ACA, people with incomes below 138% of poverty are eligible for Medicaid.
Appendix Table 2: Monthly Premium for a Silver Plan Under the ACA and BCRA
StateACA Premium After Tax CreditBCRA Premium After Tax Credit% Change
U.S. Average$197$34274%
Alabama$156$411164%
Alaska$332$804142%
Arizona$328$50353%
Arkansas$188$29960%
California$190$386103%
Colorado$333$55265%
Connecticut$280$48875%
Delaware$241$38560%
DC$409$49722%
Florida$140$23769%
Georgia$170$29171%
Hawaii$208$39489%
Idaho$171$29171%
Illinois$248$39057%
Indiana$207$30748%
Iowa$224$39175%
Kansas$208$37982%
Kentucky$236$35249%
Louisiana$179$368105%
Maine$203$30148%
Maryland$191$33374%
Massachusetts$149$16914%
Michigan$165$27969%
Minnesota$389$64065%
Mississippi$120$21579%
Missouri$175$30877%
Montana$269$50789%
Nebraska$223$44299%
Nevada$168$29273%
New Hampshire$242$34743%
New Jersey$223$33349%
New Mexico$248$39559%
New York$358$40012%
North Carolina$187$391109%
North Dakota$217$38176%
Ohio$223$33852%
Oklahoma$199$477140%
Oregon$257$39554%
Pennsylvania$234$40372%
Rhode Island$162$25960%
South Carolina$157$26266%
South Dakota$238$501111%
Tennessee$233$43486%
Texas$182$32578%
Utah$144$24167%
Vermont$292$35421%
Virginia$182$30266%
Washington$213$28233%
West Virginia$282$585108%
Wisconsin$234$41878%
Wyoming$197$36384%
Source: Kaiser Family Foundation

Endnotes

  1. If the premium for the benchmark plan is lower than the share of income a person is responsible for, the person is not eligible for a premium tax credit. ↩︎
  2. Because premium tax credits are calculated based on the premium for the benchmark plan, the change in age rating from 3:1 to 5:1, taken by itself, would reduce premium tax credits for younger adults and increase them for older adults. The changes to the income percentages shown in table XX, however, generally move in the opposite direction. ↩︎
  3. https://www.cdc.gov/nchs/data/nhis/earlyrelease/insur201705.pdf ↩︎
  4. https://www.cms.gov/Newsroom/MediaReleaseDatabase/Fact-sheets/2016-Fact-sheets-items/2016-06-30.html ↩︎
  5. https://aspe.hhs.gov/system/files/pdf/208306/OffMarketplaceSubsidyeligible.pdf ↩︎
  6. https://www.cms.gov/Newsroom/MediaReleaseDatabase/Fact-sheets/2016-Fact-sheets-items/2016-06-30.html ↩︎
  7. https://www.cbo.gov/sites/default/files/recurringdata/51135-2017-01-economicprojections.xlsx ↩︎
  8. https://www.cms.gov/research-statistics-data-and-systems/statistics-trends-and-reports/nationalhealthexpenddata/nationalhealthaccountsprojected.html ↩︎
News Release

Estimates: Average Monthly Premium after Tax Credit Would Be 74% Higher Under Senate Health Bill in 2020

In 8 States, Average Benchmark Premium after Tax Credit Would Be More than 100% Higher, Analysis Finds

Published: Jun 26, 2017

A new analysis from the Kaiser Family Foundation estimates that the average monthly premium for a benchmark silver plan after tax credits in 2020 would be 74 percent higher under the Senate’s Better Care Reconciliation Act (BCRA) compared to the Affordable Care Act (ACA).

Overall, most marketplace enrollees would pay higher premiums under the Senate bill than current law, the analysis finds. Older and lower-income enrollees would see the biggest increases, with people age 55-64 paying 115 percent more under the Senate bill and people with incomes under 200% of the federal poverty level paying 177 percent more.

Increases for younger people are modest, and they could lower their premiums if they opt for higher deductible plans.

In 8 states, the average premium under the Senate bill in 2020 would be more than twice the amount under the ACA, including Alabama (164%), Alaska (142%), Oklahoma (140%), South Dakota (111%), North Carolina (109%), West Virginia (108%), Louisiana (105%), and California (103%).

The states with the lowest increases would be New York (12%), Massachusetts (14%), Vermont (21%), and Washington, D.C. (22%), according to the analysis.

The analysis provides estimated premiums after tax credits under the BCRA and ACA for all 50 states and Washington, D.C., and nationally for six age groups with incomes both above and below 200 percent of the federal poverty level.

Both the ACA and the Senate bill offer tax credits to help people pay premiums for individual insurance; however, the Senate bill revises eligibility and calculates the tax credits differently. Additionally, the BCRA reduces the value of the benchmark plan used to determine premium tax credits.

News Release

New County-Level Map Compares Premiums and Tax Credits Under Senate Health Bill and ACA

Published: Jun 23, 2017

A new interactive map from the Kaiser Family Foundation compares county-level estimates of premiums that consumers would pay under the Affordable Care Act (ACA) in 2020 with what they’d pay under the Senate’s discussion draft, Better Care Reconciliation Act (BCRA), a replacement plan unveiled last Thursday.

The maps include premium and tax credit estimates by county for current ACA marketplace enrollees at age 27, 40, or 60 with an annual income of $20,000, $30,000, $40,000, $50,000, $60,000, $75,000, $100,000, or 351 percent of the federal poverty level (which is just above the cutoff for tax credits under the BCRA). The map includes estimates for premiums, tax credits, and premiums after tax credits, for bronze and silver marketplace plans in each county in 2020.

senate map email snip.png

Both the ACA and the Senate’s bill include tax credits to help consumers pay premiums for individual insurance. Both take into account family income, local cost of insurance, and age in calculating tax credits; however, they differ in how they determine the percentage of income an individual must pay toward their premium. The ACA and Senate bill also base tax credits on different benchmark plans, with the Senate bill tying the credits to plans with higher cost sharing for consumers.

An earlier map from the Foundation compares ACA premiums and tax credits to those in the House-passed American Health Care Act.

Also new from the Foundation: a detailed summaryof the Senate’s new discussion draft, the Better Care Reconciliation Act, a plan released Thursday to repeal and replace the Affordable Care Act (ACA). Users can compare the Senate bill to current law and the House-passed American Health Care Act in 17 key areas of health policy, including Medicaid, premium subsidies to individuals, state role, financing, women’s health, and individual health insurance market rules.

News Release

Now Available: Summary of Senate Repeal/Replace Bill in 17 Key Areas

Published: Jun 23, 2017

An interactive tool from the Kaiser Family Foundation now includes a detailed summary of the Senate’s new discussion draft, the Better Care Reconciliation Act, a plan released Thursday to repeal and replace the Affordable Care Act (ACA).

With the tool, users can compare the Senate bill to current law and the House-passed American Health Care Act in 17 key areas of health policy, including Medicaid, premium subsidies to individuals, state role, financing, women’s health, and individual health insurance market rules.

Additional analyses related to the new legislation and its implications are forthcoming. Previous reports related to key aspects of ACA replacement, including state data on coverage and financing at stake; factors affecting state’ ability to respond to federal Medicaid cuts; and the potential impact of reducing government funding for family planning care, are also available at kff.org.

News Release

Favorability of the Affordable Care Act Tops 50%, While Across Many Measures, Majorities Oppose the Republican Plan to Replace It

Most Republicans Continue to View Replacement Plan Favorably, But Their Support Has Slipped

Published: Jun 23, 2017

Three-Quarters of the Public, Including Most Republicans, View Medicaid Favorably; Most Oppose Federal Funding Cuts to States

As the Senate prepares to vote on the Republican bill to repeal and replace the Affordable Care Act and cap federal Medicaid funding, a new Kaiser Family Foundation Tracking Poll finds most Americans oppose the Republican plan and many of its key provisions. A majority of Republicans, however, continue to support the Republican plan, though by a significantly narrower margin than last month.

Most (55%) of the public holds an unfavorable view of the Republican plan, while 30 percent hold a favorable one. There is also a large intensity gap, with far more saying they have “very unfavorable” views (38%) than “very favorable” ones (11%).

While a large majority of Democrats (85%) and most independents (52%) hold unfavorable views of the plan, most Republicans (56%) and supporters of President Trump (55%) continue to hold favorable views – though support among these groups has fallen significantly since May, when two-thirds of Republicans (67%) and seven in 10 Trump supporters (69%) viewed it favorably.

In contrast, the Affordable Care Act itself remains far more popular than the plan that would replace it.  Half (51%) of the public now views the Affordable Care Act favorably – the first time favorability has topped 50 percent in the 79 Kaiser polls taken since it began tracking public opinion on the law in 2010.

Half of the public (50%) also believe that they and their family will be better off if the Affordable Care Act remains the law of the land, compared to a little more than a third (36%) who think they will be better off under the Republican plan. Most Democrats (80%) and half of independents (50%) say they would be better off under the status quo, while three-quarters of Republicans (74%) say they would be better off under the replacement plan.

“The public at large is deeply skeptical about the repeal-and-replace plan, with support among the Republican base hanging in but slipping and in danger of falling further,” says Drew Altman, president and CEO of the Kaiser Family Foundation.

On Medicaid, the federal and state program that provides health insurance and long-term care to low-income Americans, three-quarters (74%) of the public – including most (61%) Republicans – have a favorable view. Most, including majorities across parties, also say the program is working well for most low-income people nationally (61%) and in their state (67%).

Just over a third of the public supports two key elements of the Republican plan that would limit federal funding to states: reducing federal funding for the ACA’s Medicaid expansion (36% support this) and changing federal Medicaid funding to limit how much money states receive (35% support). Limiting federal Medicaid funding for long-term care for seniors and people with disabilities draws less support (21%). In contrast, majorities of the public support attaching conditions to Medicaid coverage – allowing states to condition Medicaid eligibility on work requirements for non-disabled adults (70% support) and drug testing (64% support).

Republicans are more likely to support most of these potential Medicaid changes than are Democrats or independents.

The public is not clued in to the major changes proposed to Medicaid. About four in 10 Americans (38%) are aware that the House-passed Republican plan makes “major reductions” to federal funding for Medicaid over the next ten years, while an additional quarter (27%) say the health care plan makes “minor reductions.” Some (13%) incorrectly say the plan makes “no reductions” to Medicaid, while one in five (20%) say they don’t know if it makes any reductions.

The poll also finds the public prefers the status quo to the Republican plan in other ways, in some cases with majority support across party lines:

  • A large majority (70%) say the federal government should continue to prohibit health insurance companies from charging people with pre-existing health conditions more for their coverage, while one-quarter (26%) say that states should be able to decide whether insurers can charge people with pre-existing conditions more as in the House-passed bill. Majorities of Democrats (84%), independents (68%), and Republicans (59%) want the federal government to continue protections for people with pre-existing conditions.
  • Two-thirds of the public (66%) want the federal government to continue to require health insurance companies to cover specific benefits, twice the share (31%) who say states should be able to allow insurers to sell plans with more limited benefits as under the House-passed bill. Again, majorities of Democrats (81%), independents (65%), and Republicans (52%) prefer the status quo.
  • Few Americans (8%) say repealing and replacing the Affordable Care Act should be the “most important priority” for President Trump and Congress. This is true across political identification, though half (50%) of Republicans view repealing and replacing the law as at least a “very important” priority. Far fewer Democrats (18%) or independents (28%) say the same.

If the current repeal and replace plan fails to pass Congress, nearly equal shares of the public say they want President Trump and Congress to keep working on the issue (49%) as say they want them to stop working on health care and move on to other priorities (45%). Partisans split on this question, with most Republicans (80%) wanting work on repeal to continue, most Democrats (67%) wanting to move on to other issues, and independents divided (49% want work to continue, 45% want to move on).

Either way, the vote could carry political consequences for members of Congress. While about three in 10 of the public say their representative’s vote for or against the plan would have “no effect” on their support, half of Democrats say they would be “more likely” to support a representative who voted against the Republican plan (51%) while most (61%) Republicans say they would “more likely” to support a representative who voted for the plan. Independents are more divided, with about one-third of independents saying they are “more likely” to support a representative who voted against the plan (35%) and “less likely” to support a representative who voted for the plan (36%).

Designed and analyzed by public opinion researchers at the Kaiser Family Foundation, the poll was conducted from June 14 – 19 among a nationally representative random digit dial telephone sample of 1,208 adults. Interviews were conducted in English and Spanish by landline (427) and cell phone (781). The margin of sampling error is plus or minus 3 percentage points for the full sample. For results based on subgroups, the margin of sampling error may be higher.