Health Plan Enrollment in the Capitated Financial Alignment Demonstrations for Dual Eligible Beneficiaries

Published: Aug 3, 2017

As of July 2017, nearly 400,000 beneficiaries who are dually eligible for Medicare and Medicaid were enrolled and receiving services from health plans in 10 states with capitated financial alignment demonstrations. These demonstrations, jointly managed by the Centers for Medicare and Medicaid Services (CMS) and the participating states, seek to maintain or decrease costs while maintaining or improving health outcomes for this vulnerable population of seniors and non-elderly people with disabilities. This fact sheet provides a snapshot of enrollment in the demonstrations by state, as of July 2017. Key facts include the following:

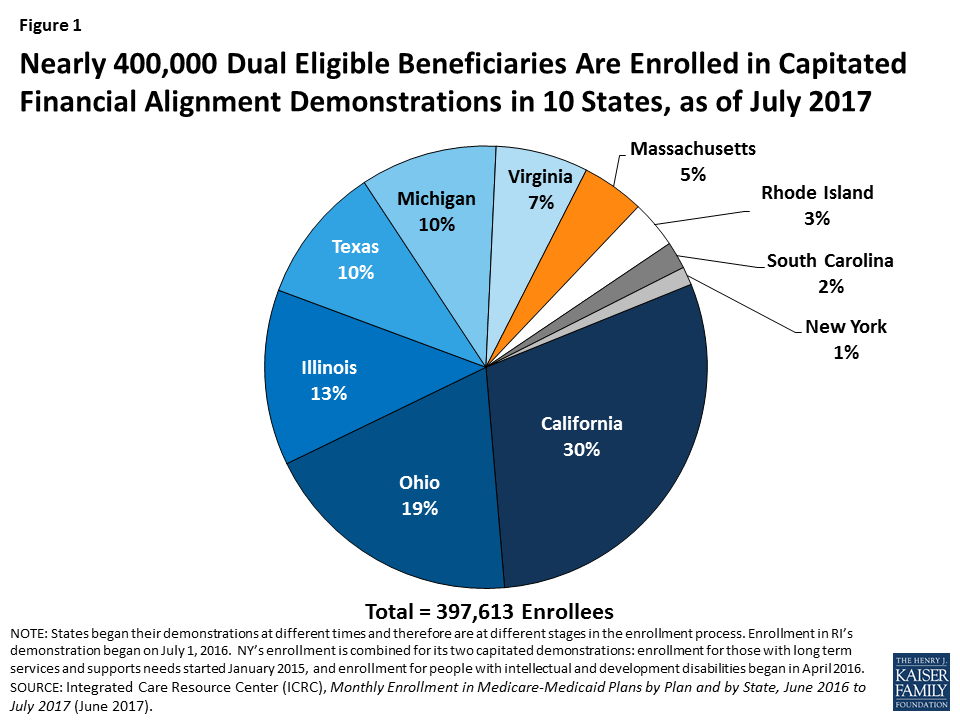
There were nearly 400,000 dual eligible beneficiaries enrolled in capitated financial alignment demonstrations in 10 states as of July 2017 (Figure 1). These states include California, Illinois, Massachusetts, Michigan, New York, Ohio, Rhode Island, South Carolina, Texas, and Virginia. All states that currently have demonstrations approved by CMS have enrolled beneficiaries. The final state, Rhode Island, began enrollment in its capitated demonstration on July 1, 2016. In addition, Colorado and Washington have beneficiaries enrolled in managed fee-for-service (FFS) demonstrations, and Minnesota is implementing an administrative alignment demonstration using Medicare Advantage Special Needs Plans for Dual Eligible Beneficiaries.

Figure 1: Nearly 400,000 Dual Eligible Beneficiaries Are Enrolled in Capitated Financial Alignment Demonstrations in 10 States, as of July 2017

At least two states (Colorado and Virginia) are planning to discontinue their demonstrations at the end of 2017. Colorado beneficiaries will transition from the demonstration to the state’s managed FFS accountable care collaborative program without any changes in benefits. Virginia beneficiaries will transition to mandatory Medicaid capitated managed long-term care health plans and have the option to receive their Medicare benefits through a Medicare Advantage health plan or Medicare fee-for-service.

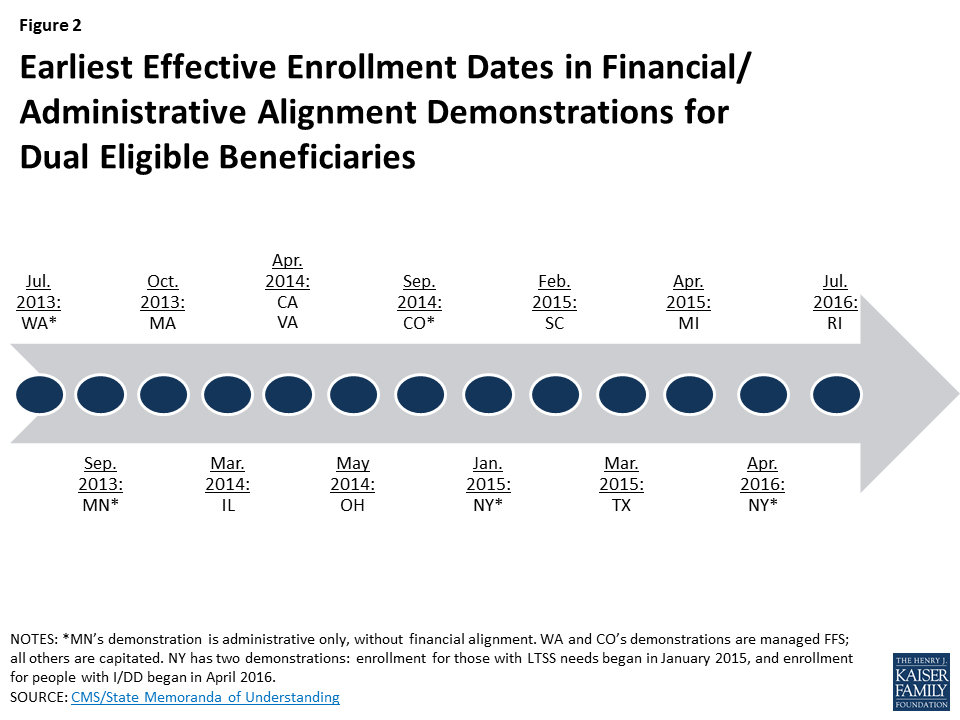
As of July 2017, California’s demonstration had the largest enrollment, comprising nearly one-third (over 118,000) of current enrollees, followed by Ohio, Illinois, Texas, Michigan, Virginia, Massachusetts, Rhode Island, South Carolina, and New York (Figure 1). These states’ demonstrations have been in effect for different lengths of time, with Massachusetts first enrolling beneficiaries in October 2013 and Rhode Island beginning voluntary enrollment in July 2016 (Figure 2). The states also vary in the number of waves of passive enrollment and the methods used to phase-in enrollment.

Figure 2: Earliest Effective Enrollment Dates in Financial/ Administrative Alignment Demonstrations for Dual Eligible Beneficiaries

As of July 2017, out of 63 health plans participating in the demonstrations, nine plans (or their parent companies) were enrolling beneficiaries in more than one state’s demonstration (Table 1). These nine are Aetna, Anthem, Centene, Cigna, Humana, Independence Health Group, Meridian, Molina, and UnitedHealth Group. Among these companies, Molina has the most enrollees (54,000 beneficiaries in six states), followed by Anthem (33,000 beneficiaries in three states), Centene (32,000 beneficiaries in five states), Aetna (31,000 beneficiaries in four states), UnitedHealth Group (19,000 beneficiaries in two states), Humana (16,000 beneficiaries in two states), Meridian (13,000 beneficiaries in two states), Independence Health Group (7,000 beneficiaries in two states), and Cigna (6,000 beneficiaries in two states), as of July 2017. The number of health plans from which beneficiaries can choose varies by county or region in each state’s demonstration. In addition, whether all health plans are participating in all the demonstration regions/counties within each state or only in selected geographic areas also varies by state.

Looking Ahead

As some states begin winding down their demonstrations, other states may opt to extend their models. The demonstrations initially were approved for three years, but CMS subsequently offered states two year extensions to provide additional time and data for the demonstrations’ evaluations. Some early federal evaluation results have been released, including reports on the initial six months of implementation; the demonstrations’ impact on special populations such as people who use long-term services and supports, those with behavioral health needs, and linguistic, ethnic, and racial minorities; care coordination; and beneficiary experience, along with reports specific to Massachusetts and Washington. Delays in the availability of data required to fully understand the impact of the demonstrations led CMS to offer an additional two year extension to Massachusetts, Minnesota, and Washington, the first three states to have implemented a demonstration in 2013; these extensions would change the demonstration end date from December 2018 to December 2020. As additional information becomes available, CMS, states, beneficiaries, health plans, providers, and other stakeholders will be interested to learn whether the demonstrations have improved health outcomes, how the demonstrations have affected state and federal costs, and whether the models will be expanded.

Table 1: Enrollment in Health Plans Participating in More Than One State’s Financial Alignment Demonstration, as of July 2017
Health Plan/ Parent CompanyCAILMAMINYOHRISCTXVATotalenrollment
Aetna7,1007,70010016,20031,000
Anthem7,00013,60012,20033,000
Centene6,5002,40012,4002,2008,50032,000
Cigna4,4001,3006,000
Humana6,4009,20016,000
Independence Health Group3,4003,8007,000
Meridian6,8005,80013,000
Molina12,3003,80011,00013,2001,90012,20054,000
UnitedHealth Group14,4004,50019,000
Other health plans99,10016,00018,2009,5005,30020,10013,8005,500187,000
Total enrollment by state118,00051,00018,00040,0005,00076,00014,0008,00040,00027,000398,000
NOTES: Health plans may operate under different names in individual states. Blank cells indicate that selected health plans are not participating in the demonstration in that state. All data have been rounded, and totals may not sum due to rounding.SOURCE: Integrated Care Resource Center (ICRC), Monthly Enrollment in Medicare-Medicaid Plans by Plan and by State, June 2016 to July 2017 (June 2017), http://www.integratedcareresourcecenter.com/PDFs/MMP_Enroll_by_State_July_2017.pdf.

The Requirement to Buy Coverage Under the Affordable Care Act

Published: Aug 2, 2017

Note:  Congress eliminated the federal tax penalty for not having health insurance, effective January 1, 2019.

Along with changes to the health insurance system that guarantee access to coverage to everyone regardless of pre-existing health conditions, the Affordable Care Act includes a requirement that many people be insured or pay a penalty. This simple flowchart illustrates how that requirement (sometimes known as an “individual mandate”) works.


>>Download the PDF

News Release

Many More Counties Lack Medicare Advantage Plans Today than are at Risk for Lacking an ACA Marketplace Insurer in 2018

Published: Aug 2, 2017

A new analysis from the Kaiser Family Foundation finds that 147 counties lack Medicare Advantage plans – many more than the 19 counties expected to lack an Affordable Care Act (ACA) marketplace insurer next year. Yet Medicare Advantage, the private plans that cover a third of all Medicare beneficiaries, is often described as an example of a robust insurance market, while some policymakers say the “bare” counties under the ACA are evidence that the law is failing. A key difference is that Medicare beneficiaries can always get coverage under traditional Medicare, while no similar option exists in the marketplaces. The new analysis highlights the number of counties that lack Medicare Advantage plans and assesses some of the potential reasons why such counties have trouble attracting insurers.

Some Counties May Lack an ACA Marketplace Insurer Next Year – But Many More Lack Medicare Advantage Plans Today

Authors: Gretchen Jacobson and Tricia Neuman
Published: Aug 1, 2017

With efforts to repeal and replace the Affordable Care Act (ACA) apparently on hold, some policymakers may ramp up efforts to strengthen the individual market, particularly in areas with few if any insurers. During the recent debate, a fair amount of attention was focused on counties at risk of having no health insurers in the ACA markets in 2018. As of July 31, 2017, 19 ACA marketplaces nested in mostly rural parts of Nevada, Indiana, and Ohio are at risk of having no insurer next year, according to the latest Kaiser Family Foundation analysis. Critics of the ACA say that the potential lack of insurers in these counties offers proof that the ACA is failing. But, does it?

We analyzed these counties to see whether the story looks similar for Medicare Advantage plans, and found relatively few insurers offering Medicare Advantage plans in the counties that could have no exchange plans next year. In 7 of these 19 counties, there are no Medicare Advantage insurers, and in another 8 counties, there are two or fewer firms now offering a Medicare Advantage plan – well below the national average (Figure 1).

Figure 1: Counties with No Medicare Advantage Insurers in 2017 and Potentially No Marketplace Insurers in 2018

In fact, 147 counties, across 14 states, have no Medicare Advantage insurer at all this year – nearly 8 times the number of counties that may not have a marketplace insurer in 2018.1  These counties tend to be rural, with few people on Medicare, and relatively few health care providers – conditions that are generally sub-optimal for private health insurance markets. It is not entirely clear why insurers are not offering Medicare Advantage plans in these mostly rural counties, but it could be because they have less leverage to negotiate rates with hospitals and other health care providers, making these counties potentially less profitable than others. Of course, there is less distress about the lack of Medicare Advantage insurers in these counties because people can always get coverage under traditional Medicare. There is no similar option in the ACA marketplaces.

This is interesting because Medicare Advantage is often described as an example of a robust insurance market. This year, the average person on Medicare can choose among 19 Medicare Advantage plans offered by 6 firms. Federal payments to plans generally compensate insurers well and the Medicare Advantage market tends to be regarded as profitable for insurers. Even so, the lesson learned from the Medicare Advantage experience thus far is that some markets are simply not attractive to private insurers.

In other words, insurers’ lack of interest in offering coverage in the ACA marketplaces of these 19 counties may have less to do with the ACA and more to do with the characteristics of those counties, more generally. As policymakers consider ways to improve access to health insurance, areas that historically have had difficulty attracting private insurers, which are often rural, may require a special approach.

  1. The number of counties with no Medicare Advantage plans has increased since 2010, although in each year no more than 1 percent of all beneficiaries lived in a county without a Medicare Advantage plan.  The increase in the number of counties without a Medicare Advantage plan appears to be primarily due to the withdrawal of Private Fee-For Service (PFFS) plans in relatively rural areas, following new network requirements for these plans. ↩︎

Visualizing Health Policy: The Costs and Outcomes of Mental Health and Substance Use Disorders in the US

Published: Aug 1, 2017

This Visualizing Health Policy infographic looks at costs and outcomes of mental health and substance use disorders in the United States (US). Nearly 18% of adults reported having a mental, behavioral, or emotional disorder in 2015, including more than 1 in 5 women. Furthermore, nearly 3% of people aged 12 years or older reported addiction to or misuse of an illicit drug in 2015, including more than 7% of people aged 18 to 25 years. However, 1 in 5 people say they or a family member had to forego needed mental health services because they couldn’t afford the cost, their insurance wouldn’t cover it, they were afraid or embarrassed, or they didn’t know where to go. Mental illness treatment accounted for $89 billion, or 5%, of total medical services spending in 2013, behind checkups/prevention and circulatory disorders. Mental health and substance use disorders together were the leading cause of disease burden in 2015, surpassing cancer and cardiovascular disease, among others. Relative to countries of similar size and wealth, the US has had higher rates of death from unintentional poisonings, the majority of which were due to drug overdoses. In 2013 the age-standardized rate of death from unintentional poisonings per 100 000 population was 12.4 in the US compared with 2.5 on average in comparable countries.

Visualizing Health Policy is an infographic series produced in partnership with the Journal of the American Medical Association (JAMA). The full-size infographic is freely available on JAMA’s website and is published in the print edition of the journal. For more information on trends in costs and outcomes of mental health and substance abuse disorders, go to the Peterson-Kaiser Health System Tracker.


View Source Slides

News Release

Visualizing Health Policy: The Costs and Outcomes of Mental Health and Substance Use Disorders in the US

Published: Aug 1, 2017

This Visualizing Health Policy infographic looks at costs and outcomes of mental health and substance use disorders in the United States (US). Nearly 18% of adults reported having a mental, behavioral, or emotional disorder in 2015, including more than 1 in 5 women. Furthermore, nearly 3% of people aged 12 years or older reported addiction to or misuse of an illicit drug in 2015, including more than 7% of people aged 18 to 25 years. However, 1 in 5 people say they or a family member had to forego needed mental health services because they couldn’t afford the cost, their insurance wouldn’t cover it, they were afraid or embarrassed, or they didn’t know where to go. Mental illness treatment accounted for $89 billion, or 5%, of total medical services spending in 2013, behind checkups/prevention and circulatory disorders. Mental health and substance use disorders together were the leading cause of disease burden in 2015, surpassing cancer and cardiovascular disease, among others. Relative to countries of similar size and wealth, the US has had higher rates of death from unintentional poisonings, the majority of which were due to drug overdoses. In 2013 the age-standardized rate of death from unintentional poisonings per 100 000 population was 12.4 in the US compared with 2.5 on average in comparable countries.

 Visualizing Health Policy is an infographic series produced in partnership with the Journal of the American Medical Association (JAMA). The full-size infographic is freely available on JAMA’s website and is published in the print edition of the journal. For more information on trends in costs and outcomes of mental health and substance abuse disorders, go to the Peterson-Kaiser Health System Tracker.

Health Affairs Blog: What US Budget Cuts To Global Health Could Mean For Future Funding

Authors: Jennifer Kates, Nafis Sadat, Adam Wexler, and Joseph Dieleman
Published: Jul 26, 2017

In a Health Affairs blog post, Jen Kates and Adam Wexler of the Kaiser Family Foundation and Nafis Sadat and Joseph Dieleman of the Institute for Health Metrics and Evaluation assess what cuts to U.S. global health funding as proposed in the Trump Administration FY 2018 budget request might mean in the larger context of development assistance for health.

Using Medicaid to Wrap Around Private Insurance: Key Questions to Consider

Authors: MaryBeth Musumeci, Robin Rudowitz, and Rachel Garfield
Published: Jul 25, 2017

Issue Brief

Key Take-Aways

  • Medicaid premium assistance is not widely used today, and there are limited data on how well it works.
  • Blending Medicaid and private insurance is administratively complex for states, and some states have discontinued their programs.
  • Details about a new Senate proposal to use Medicaid funds to wrap around private insurance subsidized with federal tax credits are unclear and changing but seem to provide federal funding through Section 1115 waivers, which are granted at the discretion of the HHS Secretary and must be budget neutral to the federal government, leaving states with no guarantee of funding amounts or longevity.

The Senate is currently considering the Better Care Reconciliation Act (BCRA). This bill goes beyond repeal and replacement of the Affordable Care Act (ACA) to make major changes in Medicaid program financing that would reduce federal funding by $756 billion from 2017-2026 and lead to 15 million fewer people covered by Medicaid by 2026, according to the latest Congressional Budget Office estimate.  Most of this reduction is due to changing federal Medicaid financing to a per capita cap beginning in 2020 and eliminating the enhanced federal matching funds for the ACA’s Medicaid expansion by 2024.

There have been recent reports of potential new funding being added to the BCRA to replace some of the anticipated loss of federal expansion funding and help states fill in gaps for private coverage obtained through tax credits for people who lose Medicaid coverage. Details about the amount of funding and the exact structure of the proposal are unclear and changing but reportedly would be made available to states through Section 1115 waivers and use Medicaid to subsidize or wrap around private insurance purchased with federal tax credits.  These funds are not expected to equal the loss of federal Medicaid expansion funding, and they would not replace federal Medicaid funding cuts through the BCRA’s per capita cap that most Medicaid enrollees would experience.

Using Medicaid to wrap around private coverage is known as premium assistance and has been part of the Medicaid program for a long time (see Box 1 for more background on Medicaid premium assistance).  The current proposal reportedly would be modeled on Arkansas‘ use of this approach in its Medicaid expansion, although other state experience indicates many challenges in premium assistance programs. While no legislative text has been released to date, and details remain uncertain, this issue brief raises three key questions for consideration if Medicaid “wrap around” proposals are considered.

Box 1:  What is Medicaid Premium Assistance? 

Medicaid premium assistance programs allow states to use Medicaid funds to purchase private coverage for Medicaid beneficiaries. Generally, federal law also requires states using these programs to provide supplemental benefits and cost-sharing protections to make the private coverage purchased with Medicaid dollars on par with what a beneficiary would receive if covered directly by the state’s Medicaid program; these supplemental payments are referred to as Medicaid benefit and cost-sharing “wrap arounds.”  Wrap arounds are necessary because, reflecting the low incomes and greater health care needs of Medicaid beneficiaries, federal Medicaid law stipulates minimum benefit standards and maximum cost-sharing limitations for state Medicaid programs.  Private insurance typically offers fewer benefits than Medicaid, and a service that is not covered by private insurance is likely to be unobtainable for people with low incomes if it must be paid out-of-pocket.  Medicaid limits cost-sharing to nominal amounts for adults below poverty, while private insurance is likely to have cost-sharing in excess of Medicaid limits.  A large body of research has established that cost-sharing creates a barrier to accessing needed health services.

Key Questions

1.   What Do We Know From States’ Experience Using Medicaid to Wrap Around Private insurance?

2.   What Administrative Complexity Does Using Medicaid to Wrap Around Private Insurance Create?

  • Overseeing multiple private health plans and delivery systems. Most of the states adopting the ACA’s Medicaid expansion do not use a premium assistance model and instead cover expansion enrollees through their existing Medicaid managed care programs. Medicaid managed care programs deliver care through a limited number of health plans that contract with the state to provide the Medicaid benefit package covered at Medicaid cost-sharing levels; these plans are generally offered by private insurers. This approach allows states to oversee one set of health plans for all Medicaid enrollees, with covered benefits and cost-sharing determined by state contract consistent with Medicaid rules. States monitor their health plans to ensure that Medicaid funds are spent appropriately.  For example, states must ensure that health plan provider networks are adequate to provide enrollees with access to care, and states set quality measures to evaluate the care provided by plans.

Unlike many other states, Arkansas did not have an established Medicaid managed care delivery system in place prior to implementing its Marketplace premium assistance model and instead moved directly from a fee-for-service delivery system to premium assistance when implementing its Medicaid expansion. Under the state’s program, it contracts with a limited number of standardized plans.

  • Administering exemptions. Arkansas’ model exempts people who are medically frail from premium assistance, instead providing them with direct Medicaid fee-for-service coverage. The medical frailty evaluation involves additional time and resources for the state, health plans, and providers but has been identified as important by stakeholders to ensure that enrollees receive the benefits that best meet their needs.  This is because in some cases, Medicaid provides benefits that private coverage does not, such as mental health, substance use treatment, prescription drugs, and rehabilitative and habiliative services.  These often include benefits needed by people with disabilities, some of whom are eligible for coverage as expansion adults.
  •  Tracking and wrapping cost-sharing. Regardless of the number of plans in the premium assistance program, states face the challenge of tracking and managing cost-sharing under each enrollee’s private plan to identify where it exceeds Medicaid limits and a Medicaid wrap is needed. Cost-sharing can vary among private market plans, creating complexity for states to track and administer. Stakeholders observed that Arkansas’ Medicaid premium assistance model standardizes the participating Marketplace plans’ cost-sharing design and arranges for the state to pay premiums and cost-sharing reductions directly to the plans.  The direct payment from the state to the plans protects low-income premium assistance enrollees from having to make burdensome out-of-pocket payments upfront to access care and then be reimbursed.
  •  Tracking and wrapping covered benefits. As with cost-sharing, states using Medicaid premium assistance also must evaluate the benefits offered by each enrollee’s private health plan to identify where Medicaid must wrap around to cover benefits that are missing. A model that offers some benefits through one delivery system and other benefits through another delivery system can be confusing for enrollees to navigate and for states to administer. The 2014 survey found that the clarity of states’ written beneficiary education materials varied widely in explaining how to access wrapped benefits. Benefits can vary among private market plans, creating complexity for states to track and administer. Stakeholders noted a limited number of health plans participate in Arkansas’ premium assistance program and those plans offer a standardized set of benefits, including nearly all of those covered by Medicaid.  This arrangement minimizes the need for Medicaid to provide wrapped benefits.  Stakeholders report some concern that beneficiaries do not always know how to access the two benefits that are provided as wrapped coverage through Arkansas’ fee-for-service Medicaid program (non-emergency medical transportation and EPSDT for 19 and 20 year olds).  While few details exist about the current Medicaid wrap proposal, it appears that it may be limited only to a cost-sharing wrap.  In that case, Medicaid funds would be used to purchase private market coverage that includes fewer benefits than an enrollee would receive under the state’s traditional benefit package.
  •  Administrative or other issues lead to program discontinuation. Indiana recently asked CMS to discontinue its Medicaid premium assistance program for employer-sponsored insurance because “[u]tilization of HIP Link has been low and administrative burden has been high.”  The state reports that the program had 60 enrollees as of March, 2017.  Iowa had to discontinue its Medicaid premium assistance for expansion enrollees from 100-138% FPL because the participating health plans left the program; instead, Iowa now covers all expansion enrollees through its Medicaid managed care delivery system. From 2014 to 2015, at least two states (Louisiana and Vermont) discontinued their pre-ACA premium assistance programs.

3.   What are the Financing Implications of Using Medicaid to Wrap Around Private Insurance Under the BCRA?

  • Funding adequacy compared to ACA expansion funding. Details about the amount of funding involved in the current proposal are unclear and changing, but there have been news reports of adding $100 billion or $200 billion in federal funding to help states obtain private market coverage subsidized with tax credits for people who would lose Medicaid expansion coverage.  It is unlikely that this amount of federal funds over 10 years can replace the lost federal funding for expansion coverage under the existing Medicaid program, assuming all expansion states receive some of the funding.  According to recent estimates, states would see a $700 billion reduction in federal Medicaid funds over the 2020-2026 period if they all drop the ACA expansion, far more than the amounts being discussed in current debate. In addition, it is not clear whether all states would be helped or whether these funds would be targeted to a few states, and there is no guarantee of final funding levels after waiver negotiations.  Moreover, spending under the BCRA proposal would likely be higher compared to current Marketplace premium assistance models like Arkansas, because deductibles under the private market plans would be substantially higher than under the ACA, due to changes in the private market subsidies offered and the actuarial value of the benchmark plan.  This has implications for both the federal cost-effectiveness and budget neutrality tests involved in Medicaid premium assistance waivers as explained below.
  •  Cost-effectiveness compared to traditional Medicaid. Federal law requires Medicaid premium assistance programs to be cost-effective compared to coverage under the state’s traditional Medicaid program.2  However, the cost of providing private market coverage through Medicaid premium assistance under the BCRA proposal is unlikely to be comparable to the cost of providing coverage directly through Medicaid. While all enrollees likely would not use enough services to meet their plan deductible, under BCRA, the CBO estimates that the benchmark plan deductible for a single individual purchasing a plan with 58% actuarial value would be $13,000 in 2026.  For comparison, Arkansas’ ACA Medicaid expansion premium assistance model uses health plans with 94% actuarial value, and the state funds the deductible, which was $664 in 2014.  Arkansas uses plans with 94% actuarial value because that number is set under the ACA; however, the BCRA would substantially lower the benchmark plan actuarial value to 58%.
  •  Federal budget neutrality under Section 1115 waivers. Federal Medicaid funding under the proposal would flow to states through Section 1115 waivers, although it is unclear if the $100 or $200 billion would be dispersed through waivers or outside waivers. Under long-standing policy, spending under these waivers must be budget neutral to the federal government, meaning that federal costs under the waiver must not exceed what they would be without the waiver.  It is unclear how federal costs under a waiver that uses Medicaid to wrap around private market coverage subsidized with tax credits would be lower than the costs that the federal government would incur without the waiver if the ACA expansion financing is eliminated. The BCRA repeals the ACA’s federal Medicaid expansion funding, phasing the enhanced matching rate down to the state’s regular matching rate by 2024. So, if the BCRA were to pass, there would be less federal funding available in the “without waiver” analysis leaving states fewer dollars for providing wrap around cost-sharing amounts.
  •  Limited state funds to finance waiver coverage. While details about the proposal remain unclear, traditionally, states still need to come up with the state share of funds under Section 1115 Medicaid waivers. This will be difficult given broader Medicaid cuts in the BCRA under the move to a per capita cap or block grant.  The CBO estimates that federal Medicaid spending will fall by 26% compared to current law in 2026, leaving states with difficult choices about how to administer their programs with substantially less federal funding. It is unclear whether the $100 or $200 billion to be added to the BCRA would be additional federal funding on top of waiver funding.
  •  Financing complexity. The flow of dollars to finance coverage by using Medicaid to wrap around individual market plans obtained with tax credits in an attempt to make coverage under the BCRA affordable for those who would lose Medicaid expansion coverage would be more complex compared to traditional Medicaid financing.  Under the current Medicaid program, funds flow from the federal government to the states, then from the states to plans. In comparison, the proposed approach could have federal funds flow to both states (for the wrap around) and individuals (for tax credits to purchase private coverage), and state funds could flow to individuals or plans to offset costs incurred that should be covered by the wrap around. As described above, this flow of funds would in turn require administrative costs to determine the scope of each person’s wrap around and track benefits and cost-sharing. In Arkansas’ model, funding flows directly from the federal government to the state to a limited number of health plans with standardized benefits and cost-sharing, protecting individuals from having to advance burdensome costs out-of-pocket.
  •  Temporary and discretionary fixes. Unlike Medicaid’s traditional financing structure, including the ACA expansion, funding available under these waivers would be limited in duration and amount, and whether they would be approved at all for a given state and on what terms would be subject to the discretion of the HHS Secretary.  Today, as state spending increases as a result of state policy choices and priorities, federal spending is there to meet it.  There is no guarantee of additional federal funds once the initial funding is exhausted, making it difficult for states to plan their budgets.  Section 1115 waivers are time-limited and authorized at the discretion of the HHS Secretary for demonstrations that further program purposes, creating additional uncertainty about whether states could access these funds in the future.  Whether a particular state could obtain a Section 1115 waiver under this proposal, the amount of federal funding available, and the specific terms also would be determined at the Secretary’s discretion.

Endnotes

  1. Data for the remaining state was unavailable. ↩︎
  2. Cost-effectiveness requires the total cost of Medicaid premium assistance (including premiums, administrative costs, cost-sharing wraps and benefits wraps) to be comparable to cost of providing direct coverage through the Medicaid state plan. Additional factors can be taken into account when determining cost-effectiveness under Section 1115 waivers, such as savings from reduced churn between Medicaid and the Marketplace as enrolleesu2019 income fluctuates and the effect of increased Marketplace enrollment and competition due to Medicaid premium assistance.nu00a0 ↩︎