KFF designs, conducts and analyzes original public opinion and survey research on Americans’ attitudes, knowledge, and experiences with the health care system to help amplify the public’s voice in major national debates.
Over 564,000 people in West Virginia are covered by Medicaid (29% of the population), making West Virginia the state with the highest share of its population enrolled in Medicaid.
Three-fourths (74%) of enrollees are children and adults, but nearly two-thirds (61%) of the state’s Medicaid spending is for the elderly and people with disabilities.
87,200 (22%) of West Virginia’s Medicare enrollees are also covered by Medicaid, which accounts for over a third (36%) of Medicaid spending.
53% of all children in West Virginia are covered by Medicaid, including 56% of children with special health care needs.
76% of nursing home residents in West Virginia are covered by Medicaid and 41% of Medicaid long-term care spending is for nursing home care. Medicare beneficiaries rely on Medicaid for assistance with services not covered by Medicare, particularly long-term care.
Nearly half (46%) of people in West Virginia live in rural areas. People who live in rural areas are more likely to be dependent on Medicaid.
West Virginia has the second lowest per capita income in the country and therefore one of the highest federal Medicaid matching assistance percentage (FMAP) at 73%. For every $1 spent by the state, the Federal government matches $2.55. Over three-fourths (79%) of all federal funds West Virginia receives are for Medicaid. In Calendar Year 2017, the federal match rate for the Medicaid expansion population is 95%.
What is at Risk under a Per Capita Cap?
Capping Medicaid funding would reduce the federal assistance for West Virginia to maintain its current Medicaid program.
Under the Better Care Reconciliation Act of 2017 (BCRA), to maintain its current Medicaid program, West Virginia would have to make up $3.4 billion in loss of federal funds between 2020-2029, including $1.5 billion for the phase-out of the enhanced match for the ACA expansion and $1.9 billion for the per enrollee cap on all groups.
If West Virginia dropped the Medicaid expansion in response to the loss of enhanced federal financing, the state would forgo an additional $7.6 billion over the 2020-2029 period, and by 2029, 227,000 West Virginians estimated to be covered in the expansion group would lose Medicaid coverage.
Capping federal Medicaid funding could jeopardize Medicaid programs designed to improve quality of life and access to long-term care for people with disabilities. 20% of West Virginia non-institutionalized population reported a disability, the highest reported percentage compared to a U.S. average of 13%.
West Virginia’s population faces multiple high health needs and limited access to care. Reducing federal funds through a per capita cap or block grant would limit West Virginia’s ability to respond to public health crises such as the opioid epidemic, HIV, or Zika.
West Virginia had the highest opioid death rate in the country in 2015 (36 deaths per 100,000 population). From 2013 to 2015, West Virginia’s opioid death rate grew by 29%. West Virginia also has the highest obesity rate in the country (71.1%).
West Virginia ranks 43 in overall health status. In addition, 30% of people in West Virginia live in a health professional shortage area for primary care and have limited access to the services they need while 14% of adults report not seeing a doctor due to cost.
Nearly 1.6 million people in Tennessee are covered by Medicaid (19% of the total population). While seven in ten (72%) enrollees are children and adults, more than half (54%) of the state’s Medicaid spending is for the elderly and people with disabilities.
279,100 (26%) of Tennessee’s Medicare enrollees are also covered by Medicaid, accounting for nearly one-third (31%) of Medicaid spending.
43% of all children in Tennessee are covered by Medicaid, including 51% of children with special health care needs.
60% of nursing home residents in Tennessee are covered by Medicaid and 42% of Medicaid long-term care spending in Tennessee is for nursing home care. Medicare beneficiaries rely on Medicaid for assistance with services not covered by Medicare, particularly long-term care.
Nearly one-third (30%) of people in Tennessee live in rural areas, which is higher than the national average of 19%. People who live in rural areas are more likely to be dependent on Medicaid.
100% of Medicaid enrollees in Tennessee are in managed care. Since Tennessee has already transitioned to managed care, it would not be able to recoup the one-time savings that some states experience during that transition.
Tennessee has a low per capita income and therefore a relatively high federal Medicaid matching assistance percentage (FMAP) at 66%. For every $1 spent by the state, the Federal government matches $1.85. Over half (51%) of all federal funds Tennessee receives are for Medicaid.
What is at Risk under a Per Capita Cap?
Capping Medicaid funding would reduce the federal assistance for Tennessee to maintain its current Medicaid program.
Under the Better Care Reconciliation Act of 2017 (BCRA), to maintain its current Medicaid program, Tennessee would have to make up $5.5 billion in loss of federal funds between 2020-2029 for the per enrollee cap on all groups.
Due to limited availability of revenue resources in the state, Tennessee would be at high risk under BCRA legislation. Tennessee has low state and local spending per capita from all sources and the lowest tax collections as a share of personal income.
Capping federal Medicaid funding could put Medicaid programs designed to improve quality of life and access to new therapies and long-term care for people with disabilities at risk. 16% of Tennessee’s non-institutionalized population reported a disability, the 7th highest reported percentage compared to a U.S. average of 13%.
Reducing federal funds through a per capita cap or block grant would limit Tennessee’s ability to respond to public health crises such as the opioid epidemic, HIV, or Zika.
Tennessee ranks 11th for the highest rate of opioid deaths at 16 deaths per 100,000 population in 2015. In the last two years, Tennessee’s opioid death rate has grown by more than one-third (34%).
There are more than 16,000 people living with HIV in Tennessee and Medicaid is the single largest source of coverage for people with HIV in the U.S.
Over 184,000 people in Alaska are covered by Medicaid. While eight in ten (80%) enrollees are children and adults, more than half (55%) of the state’s Medicaid spending is for the elderly and people with disabilities.
15,100 (21%) of Alaska’s Medicare enrollees are also covered by Medicaid, which accounts for over a quarter (27%) of Medicaid spending.
32% of all children in Alaska are covered by Medicaid, including 39% of children with special health care needs.
79% of nursing home residents in Alaska are covered by Medicaid and 32% of Medicaid long-term care spending in Alaska is for nursing home care. Medicare beneficiaries rely on Medicaid for assistance with services not covered by Medicare, particularly long-term care.
Over half (59%) of people in Alaska live in rural areas, which is higher than the national average of 19%. People who live in rural areas are more likely to be dependent on Medicaid.
In Alaska, Medicaid covers two in three (66%) American Indian and Alaska Native children and more than one in four (28%) American Indian and Alaska Native adults.
Alaska has a federal Medicaid matching assistance percentage (FMAP) of 50%. For every $1 spent by the state, the Federal government matches $1. Nearly a third (30%) of all federal funds Alaska receives are for Medicaid. In Calendar Year 2017, the federal match rate for the Medicaid expansion population is 95%.
What is at Risk under a Per Capita Cap?
Capping Medicaid funding would reduce the federal assistance for Alaska to maintain its current Medicaid program.
Under the Better Care Reconciliation Act of 2017 (BCRA), to maintain its current Medicaid program, Alaska would have to make up $1.8 billion in loss of federal funds between 2020-2029, including $1.1 billion for the phase-out of the enhanced match for the ACA expansion and $776 million for the per enrollee cap on all groups.
If Alaska dropped the Medicaid expansion in response to the loss of enhanced federal financing, the state would forgo an additional $2 billion over the 2020-2029 period, and by 2029, 41,000 Alaskans estimated to be covered in the expansion group would lose Medicaid coverage.
The Medicaid expansion has helped reduce longstanding disparities in health coverage faced by American Indians and Alaska Natives and increased Medicaid revenues for IHS- and Tribally-operated facilities, enhancing their capacity to provide services.
Capping Medicaid can limit states’ ability to respond to economic downturns and demographic changes in their state that affect demand for Medicaid and other public health services.
Alaska has one of the highest rates of unemployment in the country (7%). During an economic downturn, demand for public programs such as Medicaid increases.
Alaska has the highest projected growth rate of its 85+ population (135%) between 2015 and 2030, a population more likely to require nursing home care. Medicaid is the primary payer for nursing home care.
Capping federal Medicaid funding could jeopardize Medicaid programs designed to improve quality of life and access to long-term care for people with disabilities. 12% of Alaska’s non-institutionalized population reported a disability.
States with high health care costs and limited access may find it increasingly difficult to purchase services in a high cost market or make improvements in access to care under reductions or caps in federal financing. Alaska’s has the second highest health spending per capita ($11,064).
Reducing federal funds through a per capita cap or block grant would limit Alaska’s ability to respond to public health crises such as the opioid epidemic, HIV, or Zika.
Alaska’s opioid death rate is 11 deaths per 100,000 population in 2015. Between 2013 and 2015, Alaska’s opioid death rate has grown by 16%.
Nearly 68% of people in Alaska are overweight or obese and over one-third (37%) report poor mental health status.
Nearly 1.4 million people in Colorado are covered by Medicaid (19% of the population). While eight in ten (80%) enrollees are children and adults, more than half (59%) of the state’s Medicaid spending is for the elderly and people with disabilities.
77,500 (12%) of Colorado Medicare enrollees are also covered by Medicaid, which accounts for over a third (34%) of Medicaid spending.
40% of all children in Colorado are covered by Medicaid, including 29% of children with special health care needs.
61% of nursing home residents in Colorado are covered by Medicaid and 33% of Medicaid long-term care spending is for nursing home care. Medicare beneficiaries rely on Medicaid for assistance with services not covered by Medicare, particularly long-term care.
Colorado has a federal Medicaid matching assistance percentage (FMAP) of 50%. For every $1 spent by the state, the Federal government matches $1. Over half (52%) of all federal funds Colorado receives are for Medicaid. In Calendar Year 2017, the federal match rate for the Medicaid expansion population is 95%.
What is at Risk under a Per Capita Cap?
Capping Medicaid funding would reduce the federal assistance for Colorado to maintain its current Medicaid program.
Under the Better Care Reconciliation Act of 2017 (BCRA), to maintain its current Medicaid program, Colorado would have to make up $9.2 billion in loss of federal funds between 2020-2029, including $6.4 billion for the phase-out of the enhanced match for the ACA expansion and $2.8 billion for the per enrollee cap on all groups.
If Colorado dropped the Medicaid expansion in response to the loss of enhanced federal financing, the state would forgo an additional $12 billion over the 2020-2029 period, and by 2029, 534,000 Coloradoans estimated to be covered in the expansion group would lose Medicaid coverage.
Capping Medicaid could lock in historical state differences in state spending, disproportionately affecting states with low Medicaid spending per enrollee. Colorado has lower than national average Medicaid spending per enrollee ($4,898).
Capping federal Medicaid funding could jeopardize Medicaid programs designed to improve quality of life and access to long-term care for people with disabilities. 10% of Colorado’s non-institutionalized population reported a disability.
Reducing federal funds through a per capita cap or block grant would limit Colorado’s ability to respond to public health crises such as the opioid epidemic, HIV, or Zika.
Colorado’s opioid death rate is 8.7 deaths per 100,000 population in 2015. From 2013 to 2015, Colorado’s opioid death rate has grown by 9%.
There are more than 11,000 people living with HIV in Colorado and Medicaid is the single largest source of coverage for people with HIV in the U.S.
Colorado has one of the highest share of reported poor mental health status (37%) in the country and more than half (57%) of people are overweight or obese.
Capping Medicaid can limit states’ ability to respond to demographic changes in their state that affect demand for Medicaid and other public health services. The projected growth rate of the 85+ population in Colorado is 54% between 2015 and 2030, a population more likely to require nursing home care. Medicaid is the primary payer for nursing home care.
Over 631,000 people in Nevada are covered by Medicaid (17% of the population). While eight in ten (80%) enrollees are children and adults, more than half (59%) of the state’s Medicaid spending is for the elderly and people with disabilities.
50,500 (13%) of Nevada Medicare enrollees are also covered by Medicaid, which accounts for over a quarter (28%) of Medicaid spending.
61% of all children in Nevada are covered by Medicaid, including 32% of children with special health care needs.
58% of nursing home residents in Nevada are covered by Medicaid and 35% of Medicaid long-term care spending is for nursing home care. Medicare beneficiaries rely on Medicaid for assistance with services not covered by Medicare, particularly long-term care.
Nevada has a low per capita income and therefore a relatively high federal Medicaid matching assistance percentage (FMAP) at 66%. For every $1 spent by the state, the Federal government matches $1.85. More than half (59%) of all federal funds Nevada receives are for Medicaid. In Calendar Year 2017, the federal match rate for the Medicaid expansion population is 95%.
What is at Risk under a Per Capita Cap?
Capping Medicaid funding would reduce the federal assistance for Nevada to maintain its current Medicaid program.
Under the Better Care Reconciliation Act of 2017 (BCRA), to maintain its current Medicaid program, Nevada would have to make up $4.3 billion in loss of federal funds between 2020-2029, including $2.7 billion for the phase-out of the enhanced match for the ACA expansion and $1.6 billion for the per enrollee cap on all groups.
If Nevada dropped the Medicaid expansion in response to the loss of enhanced federal financing, the state would forgo an additional $9.4 billion over the 2020-2029 period, and by 2029, 256,000 Nevadans estimated to be covered in the expansion group would lose Medicaid coverage.
The Medicaid expansion has helped reduce longstanding disparities in health coverage faced by Hispanics in Nevada. Between 2013 and 2015, the uninsured rate for nonelderly Hispanics in Nevada fell from 34% to 19%.
Reducing federal funds through a per capita cap or block grant would limit Nevada’s ability to respond to public health crises such as the opioid epidemic, HIV, or Zika.
Nevada has an estimated HIV diagnosis rate of 20.1 per 100,000 population compared to a national average of 14.7 per 100,000 population, the 7th highest in the country. Medicaid is the single largest source of coverage for people with HIV in the U.S.
Nevada’s opioid death rate is 13.8 deaths per 100,000 population in 2015, compared to a national average of 10.4 deaths per 100,000 population.
Nearly two-thirds (65%) of people in Nevada are overweight or obese and more than one-third (35%) report poor mental health status.
Limited availability of revenue resources in the state puts states at higher risk under reductions or caps in federal financing as it would be more difficult to offset the loss of federal funds with state funds. Nevada has low state and local spending per capita from all sources.
Capping federal Medicaid funding could jeopardize Medicaid programs designed to improve quality of life and access to long-term care for people with disabilities. 13% of Nevada’s non-institutionalized population reported a disability.
Capping Medicaid can limit states’ ability to respond to demographic changes in their state that affect demand for Medicaid and other public health services. Nevada has the second highest projected growth rate of its 85+ population (95%) between 2015 and 2030, a population more likely to require nursing home care. Medicaid is the primary payer for nursing home care.
Over 1.4 million people in Louisiana are covered by Medicaid (20% of the total population). While seven in ten (72%) of enrollees are children and adults, more than two-thirds (68%) of the state’s Medicaid spending is for the elderly and people with disabilities.
201,600 (28%) of Louisiana’s Medicare enrolleesare also covered by Medicaid, which accounts for nearly one-third (30%) of Medicaid spending.
44% of all children in Louisiana are covered by Medicaid, including 56% of children with special health care needs.
74% of nursing home residents in Louisiana arecovered by Medicaid and 42% of Medicaid long-term care spending in Louisiana is for nursing home care. Medicare beneficiaries rely on Medicaid for assistance with services not covered by Medicare, particularly long-term care.
One-third (33%) of people in Louisiana live in rural areas, which is higher than the national average of 19%. People who live in rural areas are more likely to be dependent on Medicaid.
70% of Medicaid enrollees in Louisiana arein managed care. Since Louisiana has already transitioned most enrollees to managed care, it would not be able to recoup much of the one-time savings that some states experience during that transition.
Louisiana has a low per capita income and therefore a relatively high federal Medicaid matching assistance percentage (FMAP) at 64%. For every $1 spent by the state, the Federal government matches $1.65. More than half (54%) of all federal funds Louisiana receives are for Medicaid. In Calendar Year 2017, the federal match rate for the Medicaid expansion population is 95%.
What is at Risk under a Per Capita Cap?
Capping Medicaid funding would reduce the federal assistance for Louisiana to maintain its current Medicaid program.
Under the Better Care Reconciliation Act of 2017 (BCRA), to maintain its current Medicaid program, Louisiana would have to make up $7.8 billion in loss of federal funds between 2020-2029, including $4.3 billion for the phase-out of the enhanced match for the ACA expansion and $3.5 billion for the per enrollee cap on all groups.
If Louisiana dropped the Medicaid expansion in response to the loss of enhanced federal financing, the state would forgo an additional $13.5 billion over the 2020-2029 period, and by 2029, 510,000 Louisianans estimated to be covered in the expansion group would lose Medicaid coverage.
Capping federal Medicaid funding could put Medicaid programs designed to improve quality of life and access to new therapies and long-term care for people with disabilities at risk. 15% of Louisiana’s non-institutionalized population reported a disability, the 11th highest reported percentage compared to a U.S. average of 13%.
Access to care could be reduced under a federal capsince it would be difficult to increase provider rates beyond the caps to promote additional provider participation.
Medicaid in Louisiana pays providers 71% on average of what Medicare pays and just 57% of physicians in the state are accepting new Medicaid patients, one of the lowest rates in the country.
Louisiana’s population faces many health challenges, ranking second to last in overall health status. In addition, 41% of people in Louisiana live in a health professional shortage area for primary care and have limited access to the services they need.
Reducing federal funds through a per capita cap or block grant would limit Louisiana’s ability to respond to public health crises such as the opioid epidemic, HIV, or Zika.
There are nearly 19,000 people living with HIV in Louisiana and the state has the second highest rate of new HIV cases in the country (24.2 per 100,000). Medicaid is the single largest source of coverage for people with HIV in the U.S.
The opioid death rate in Louisiana has more than doubled since 2010, reaching 6.3 deaths per 100,000 population in 2015.
The Better Care Reconciliation Act (BCRA) under consideration in Congress includes provisions that would fundamentally change Medicaid by phasing out extra federal funding for states’ Medicaid expansions and for the first time limiting federal spending on Medicaid through a per enrollee cap on financing or a block grant for certain adults.
While those measures account for most of the bill’s $756 billion reduction in federal Medicaid spending over the next decade, there are other big changes in the bill that would reshape the federal health insurance program that covers 74 million low-income Americans. A new issue brief from the Kaiser Family Foundation highlights several less-discussed Medicaid provisions in the bill, including:
An option for states to require work as a condition of Medicaid eligibility for the first time in the program’s history.
A provision to direct the Health and Human Services Secretary to adjust target per enrollee amounts to bring states closer to national average Medicaid spending. Specifically, the Secretary would adjust a state’s target per enrollee amounts by 0.5% to 2% for states spending 25% or more either above or below the national average per enrollee expenditures beginning in 2020.
The cancellation of scheduled disproportionate share hospital (DSH) payment reductions for non-expansion (but not for expansion) states.
New limits on states’ ability to use provider taxes to finance their share of Medicaid spending.
Changes in eligibility and enrollment processes that would make it more difficult for eligible individuals to obtain and maintain Medicaid coverage.
As the Senate considers the Better Care Reconciliation Act (BCRA), a proposal to repeal and replace the Affordable Care Act (ACA), amendments have been discussed to further change private health insurance market rules that apply under current law. Under the BCRA, current law health insurance market rules would still apply: Insurers in the non-group health insurance market are prohibited from turning applicants down or charging higher premiums based on health status and from excluding coverage for pre-existing conditions. In addition, all policies must provide major medical coverage for 10 categories of essential health benefits and must limit the annual out-of-pocket cost sharing (deductibles, co-pays and coinsurance) that people must pay for covered services in network (although states can alter those requirements through waivers).
However, one discussion draft amendment to the BCRA, suggested by Senator Ted Cruz (R-TX) as part of the July 13 version of the bill, would allow insurers in the non-group market to also sell some policies that would not be required to follow all of the ACA market rules. These noncompliant policies could turn people down or charge them more based on health status and could exclude coverage for pre-existing conditions. In addition, noncompliant policies would not have to meet ACA essential health benefit and cost sharing standards.
This brief examines the likely impact of such a change on the stability of coverage offered through non-group markets and on the number of individuals who might be affected.
Insurer Option to Sell Noncompliant Policies
The July 13 version of the BCRA provides that insurers in the non-group market would have the option to sell policies outside of the marketplace that would not be subject to most ACA market rules. These noncompliant policies could be medically underwritten (that is, they could turn applicants down, charge premiums based on health status, and deny coverage for pre-existing health conditions.) In addition, noncompliant policies would not have to cover essential health benefits, including preventive health services, and would not be limited in deductibles and other cost sharing they could require. Any insurer that sells compliant ACA policies in a marketplace rating area could elect to also sell noncompliant policies in that rating area outside of the marketplace. Insurers would be required to notify the Secretary of their election annually.
In practice, only those individuals healthy enough to pass medical underwriting would be able to choose between coverage under compliant vs. noncompliant plans. Prior to the ACA, people with certain medical conditions were routinely denied coverage under medically underwritten non-group policies. “Deniable” pre-existing conditions included cancer, HIV, diabetes, opioid addiction and other substance use disorders, severe mental health disorders, and pregnancy. People with less severe pre-existing conditions, including asthma, high blood pressure, depression, and allergies, could face other adverse underwriting actions, as well. Consequently, under a Consumer Freedom Option, people would be able to choose between compliant plans and less expensive noncompliant policies while they were in perfect health. By contrast, people with deniable pre-existing conditions would not be able to buy noncompliant policies at any price.
This uneven playing field of market rules would dramatically increase premiums compliant policies in the marketplace. Sicker people would be concentrated in marketplace plans. In effect, marketplace plans would become more like high-risk pools, and the price of these plans would skyrocket.
To offset premium increases, the July 13 version of the BCRA would take $70 billion in funding otherwise available to states, to finance a federal reinsurance program during the period 2020-2026. (The bill established a State Stability and Innovation Program with grants to states totaling $132 billion over this period. States could apply for program grants for several purposes – including funding coverage for high-risk individuals, funding cost sharing subsidies, making direct payments to providers, or funding state reinsurance programs to help stabilize the non-group insurance market.) The federal reinsurance program would make direct payments to insurers to help stabilize premiums for compliant marketplace plans. Federal reinsurance payments would be made to compliant plans offered by health insurers that also offer noncompliant plans. It is unclear whether funding would be sufficient to stabilize compliant plan premiums. However, leaders from the health insurance industry have urged that, even with new dedicated resources, the asymmetry of rules within the non-group market would be “simply unworkable in any form and would undermine protections for those with pre-existing medical conditions, increase premiums and lead to widespread terminations of coverage for people currently enrolled in the individual market.”
Finally, the BCRA clarifies that states retain authority to regulate the non-group health insurance market. States could limit the ability of insurers to elect to offer noncompliant plans by prohibiting the option entirely or by limiting the non-applicability of ACA market rules. Whether and how states might exercise this flexibility is difficult to predict.
Impact on Consumers Ineligible for Premium Subsidies
The Senate BCRA would continue ACA-like premium tax credits to subsidize the cost of coverage for low-and middle-income individuals. Like the ACA, premium tax credits under the BCRA would be tied to the cost of a benchmark marketplace plan, though the benchmark would have higher patient cost-sharing than under the ACA. Eligibility for premium tax credits would be capped at income of 350% of the federal poverty level (FPL), compared to 400% FPL under current law. Individuals eligible for tax credits would be required to pay a set percentage of their annual income toward a benchmark plan; the premium tax credit amount for each individual would be the difference between the actual cost of the benchmark plan and a person’s required contribution. Under this formula, as under current law, subsidy-eligible people would generally be shielded from annual premium cost increases, which would instead be absorbed by federal premium tax credits.
While people with pre-existing conditions eligible for premium tax credits would be cushioned from premium increases in compliant plans under the Cruz amendment, those ineligible for credits would not be protected.
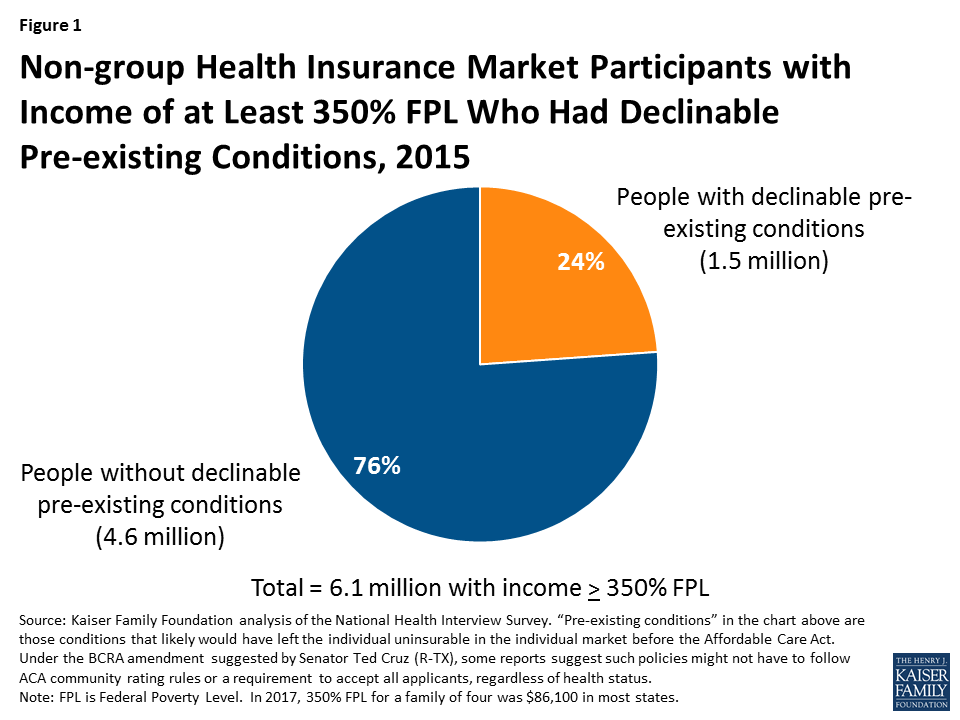
According to the National Health Interview Survey, approximately 40% of non-group market participants in 2015, or 6.1 million people, had income above 350% FPL. Most of these individuals purchased non-group coverage outside of the marketplace. Under the BCRA, these individuals would not be eligible for premium tax credits.
We estimate that, among the 6.1 million non-group market participants with incomes of at least 350% FPL, 24% (or about 1.5 million) would have pre-existing conditions that would have been considered automatically deniable by insurers prior to the ACA. (Figure 1)
Figure 1: Non-group Health Insurance Market Participants with Income of at Least 350% FPL Who Had Declinable Pre-existing Conditions, 2015
These 1.5 million individuals would likely be unable to buy non-compliant plans at any price. Among the three-quarters of other market participants with income over 350% FPL, millions would have other types of pre-existing conditions that were not considered automatically declinable prior to ACA, such as high-blood pressure, high cholesterol, asthma, and depression. Many in this group also could see a substantial increase in out-of-pocket spending for medical care that would offset any premium savings associated with less comprehensive policies.
Methods
To calculate nationwide prevalence rates of declinable health conditions, we reviewed the survey responses of nonelderly adults for all question items shown in Methods Table 1 using the CDC’s 2015 National Health Interview Survey (NHIS). Approximately 27% of 18-64 year olds, or 52 million nonelderly adults, reported having at least one of these declinable conditions in response to the 2015 survey. For more details on methods and a list of declinable conditions included in this analysis, see our earlier brief: Pre-existing Conditions and Medical Underwriting in the Individual Insurance Market Prior to the ACA.
The programming code, written using the statistical computing package R, is available upon request for people interested in replicating this approach for their own analysis.
The Senate released an updated discussion draft of legislation called the Better Care Reconciliation Act of 2017 (BCRA) on July 20, 2017. For Medicaid, the overall framework is very similar to earlier versions of the bill in the Senate as well as the American Health Care Act (AHCA) that passed in the House. Both the BCRA and the AHCA go beyond repeal and replacement of the Affordable Care Act (ACA) to make fundamental changes to Medicaid by setting a limit on federal funding through a per capita cap or block grant. The BCRA also includes additional changes that would further reduce federal spending for states with high per enrollee spending, limit state financing mechanisms, allow states to impose work requirements, and make other eligibility changes. The revised draft of the BCRA leaves many provisions up to HHS Secretary discretion, creating further uncertainty for states about how implementation of the legislation would proceed. Across the board, these changes would have significant implications for the 74 million people covered by the Medicaid program and for states that jointly finance and administer the program.
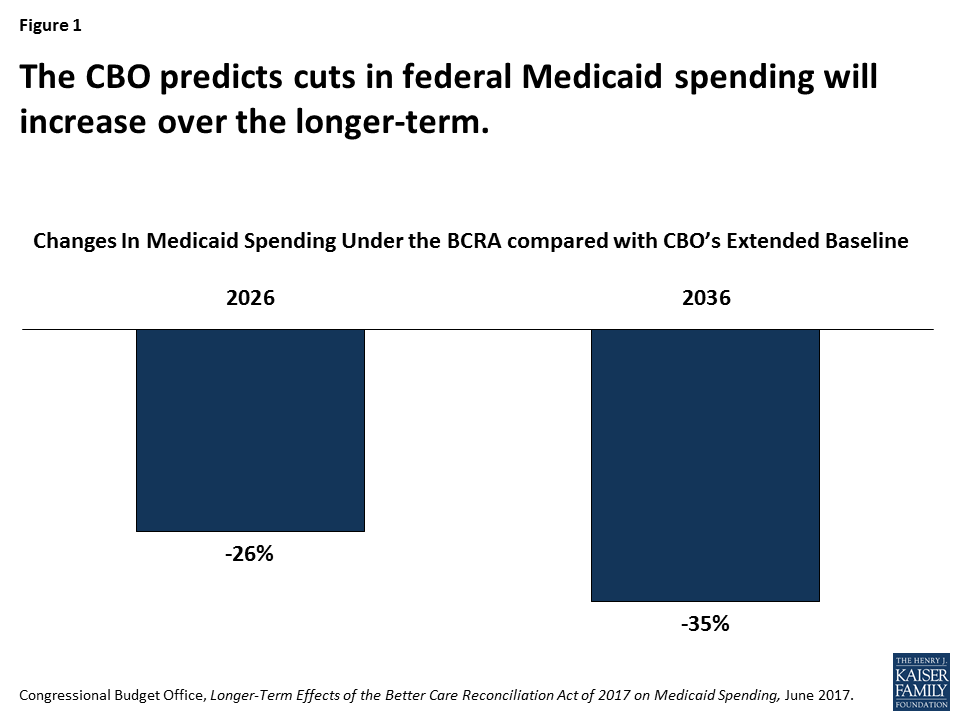
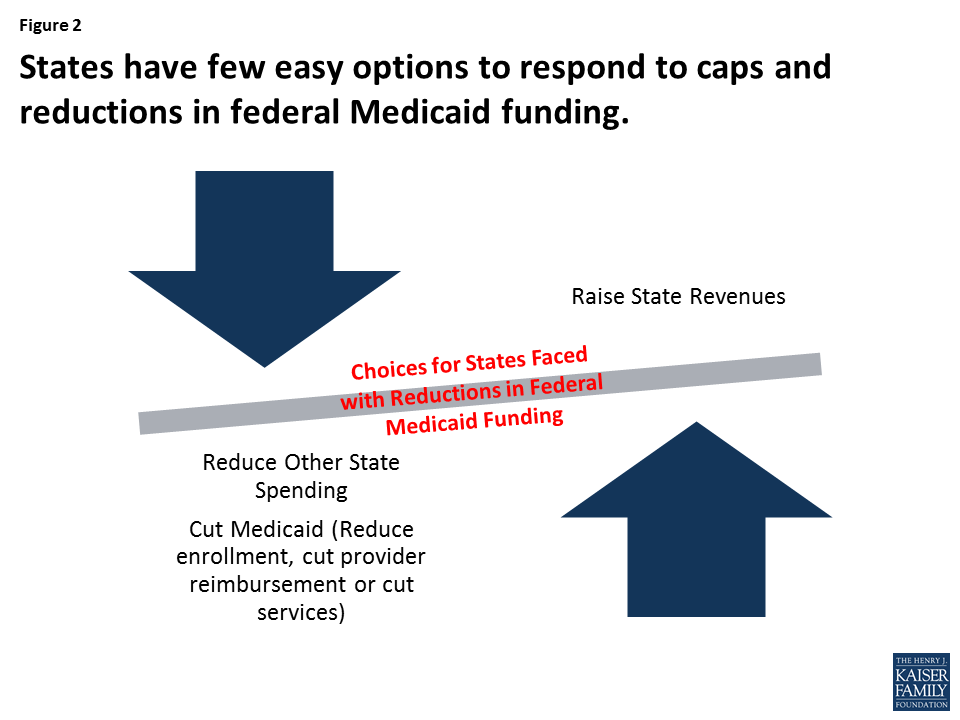
The Congressional Budget Office estimates that under current draft of the BCRA, federal Medicaid spending related to the coverage provisions would decline by $756 billion over the 2017-2026 period or $739 billion accounting for all Medicaid provisions in the bill. According to CBO’s longer-term projections, the BCRA would reduce federal Medicaid spending by 35% in 2036 (Figure 1). These reductions would leave states with difficult choices about how to fill in the gaps in federal funding or cut back on Medicaid eligibility, benefits, or reimbursement rates (Figure 2). This brief explains the five most significant Medicaid changes in the BCRA as well as additional Medicaid changes that could have major implications for states, providers, and beneficiaries.
Figure 1: The CBO predicts cuts in federal Medicaid spending will increase over the longer-term.Figure 2: States have few easy options to respond to caps and reductions in federal Medicaid funding.
5 Most Significant Medicaid Financing Changes in the BCRA
1. Phase out the enhanced federal financing for the ACA Medicaid expansion.
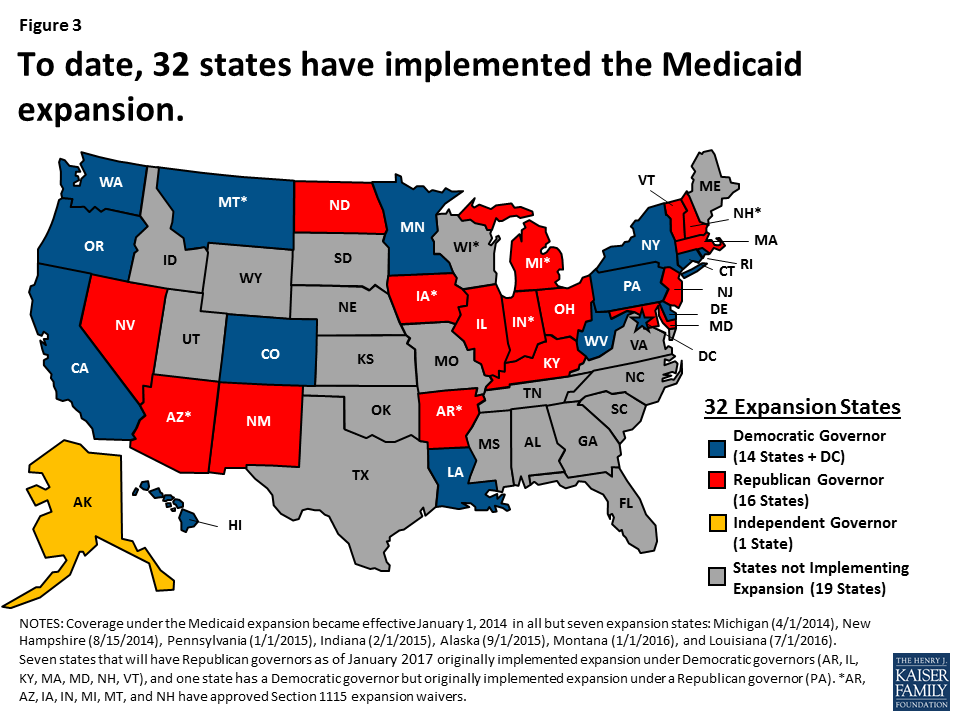
Under the BCRA, for states that adopted the expansion as of March 1, 2017, the enhanced federal match would phase-out from 90% in CY 2020, to 85% in 2021, 80% in 2022, 75% in 2023 and then to the regular state match rate in 2024 and beyond. Thirty-one states plus DC have implemented the Medicaid expansion (Figure 3). On average, expansion enrollees account for 20% of all Medicaid enrollees (as of early 2016) and federal expansion financing accounts for about 21% of all Medicaid funding (for FY 2015). However, these shares are much higher in some states, placing them at higher risk for facing challenges in responding to the reduction in the federal match. Multiple states are likely to eliminate or scale back their expansion coverage due to the increased cost if federal funding is reduced, including eight expansion states (AR, AZ, IL, IN, MI, NH, NM, and WA) that have legislation requiring them to reduce or eliminate the expansion if the federal match rate is reduced. Given the magnitude of estimates of how much it would cost states to replace federal expansion funds, it appears that it is unrealistic to suggest that expansion states would be able to replace those funds and continue their expansion programs at current levels without the enhanced expansion match rate. Reports suggest that waivers or additional grant funding may be offered to states in place of the enhanced funding for the expansion, however, it is unlikely that such amounts would fully offset federal funding reductions in the BCRA tied to the expansion.
Figure 3: To date, 32 states have implemented the Medicaid expansion.
2. Limit federal Medicaid funding through a per capita, or per enrollee, cap on financing.
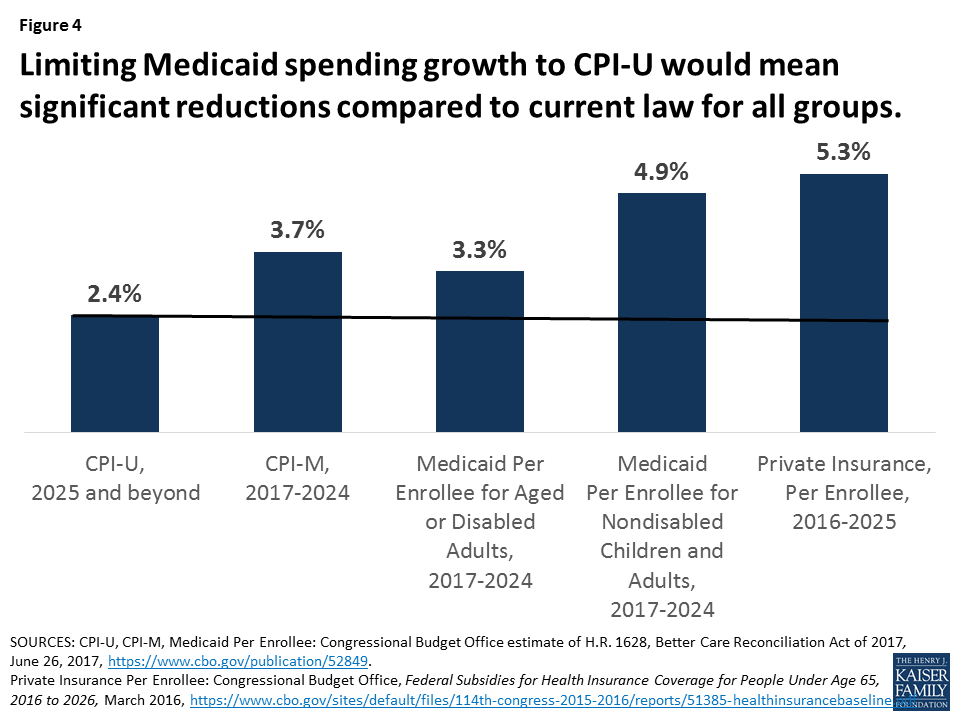
Under current law, Medicaid provides a guarantee of coverage for individuals who are eligible for the program and a guarantee to states of federal matching dollars for spending on Medicaid services. Beginning in FY 2020, the BCRA would limit federal Medicaid funding to each state based on the sum of the costs per enrollee for five beneficiary groups – elderly, blind and disabled adults,1 children, expansion adults, and other adults – multiplied by the number of enrollees in the group and the state’s federal match rate. The proposed legislation specifies a uniform national inflation factor for the federal financing growth rate. Under both AHCA and BCRA, the per enrollee amounts would increase annually at slower rates than projected growth for Medicaid (Figure 4).
Figure 4: Limiting Medicaid spending growth to CPI-U would mean significant reductions compared to current law for all groups.
The caps are estimated to result in large reductions in federal Medicaid spending over time. Under BCRA, the caps would initially grow by the Consumer Price Index for medical care (CPI-M) for adults and children and by the CPI-M plus one percentage point for elderly and disabled groups. Starting in 2025, per enrollee amounts for all groups would increase by the historically lower CPI for urban consumers (CPI-U). All of these rates are lower than projected growth for private health insurance spending per enrollee. Reductions in federal Medicaid funding from the caps are expected to grow over time, especially after 2025 when the inflation factor is limited to CPI-U. Current projections have CPI-M growing at 3.7% and CPI-U at 2.4% annually; however, the rate of growth for these indices can vary and fluctuate over time which could cause uncertainty and instability in state budgeting.
3. Provides Secretary discretion to adjust per enrollee spending down for states with per enrollee spending 25% higher than the national average.
The BCRA also includes a provision not included in the AHCA, which would direct the HHS Secretary to adjust target per enrollee amounts under the per capita cap to bring states closer to national average spending. Specifically, the Secretary would adjust a state’s target per enrollee amounts by 0.5% to 2% for states spending 25% or more either above or below the national average per enrollee expenditures beginning in 2020. These adjustments are applied to overall per enrollee spending in 2020 and 2021 and then for each enrollment group in subsequent years. Adjustments are to be budget neutral to the federal government (meaning they would not result in a net increase of federal payments under the per capita caps for the fiscal year). Certain states with population densities less than 15 individuals per square mile (currently: AK, MT, ND, SD, and WY) would be exempt from this provision. Data for 2014 show that the number of states with high per capita spending that face tighter caps exceeds the number of states that would experience relief for having low spending overall and for each eligibility group (Table 1). Secretary discretion and actual spending patterns will make it difficult for states to estimate the effect of this provision.
Table 1: States Potentially Subject to Target Spending Adjustment Under the BCRA Based on FY 2014 Medicaid Spending Per Enrollee
Group
States 25% or More AboveU.S. Average Per Enrollee Spending
States 25% or More BelowU.S. Average Per Enrollee Spending
4. Allow states the option to choose block grant financing for non-expansion Medicaid adults.
Beginning in FY 2020 under the BCRA, states could elect to receive federal financing for nonelderly/non-disabled traditional adults (low-income parents and pregnant women) and/or adults eligible through the ACA Medicaid expansion in the form of block grant instead of per capita cap funding. The block grant amount that states would receive from the federal government is initially based on the state’s target per capita spending amount for the fiscal year multiplied by the number of adult enrollees and the federal average Medicaid matching rate. The amount would grow annually by CPI-U even prior to 2025 when the per capita cap amounts would grow by the higher CPI-M inflation factor. States have a maintenance of effort (MOE) requirement—essentially, a minimum amount states must spend each year—that is the state share of the enhanced CHIP match rate (without the 23 percentage point increase provided under the ACA) multiplied by the block grant amount. If a state fails to meet the MOE requirement in a given year, its federal block grant amount for the following year would be reduced. States that meet MOE and continue to elect the block grant option can rollover unused block grant funds into the next fiscal year.
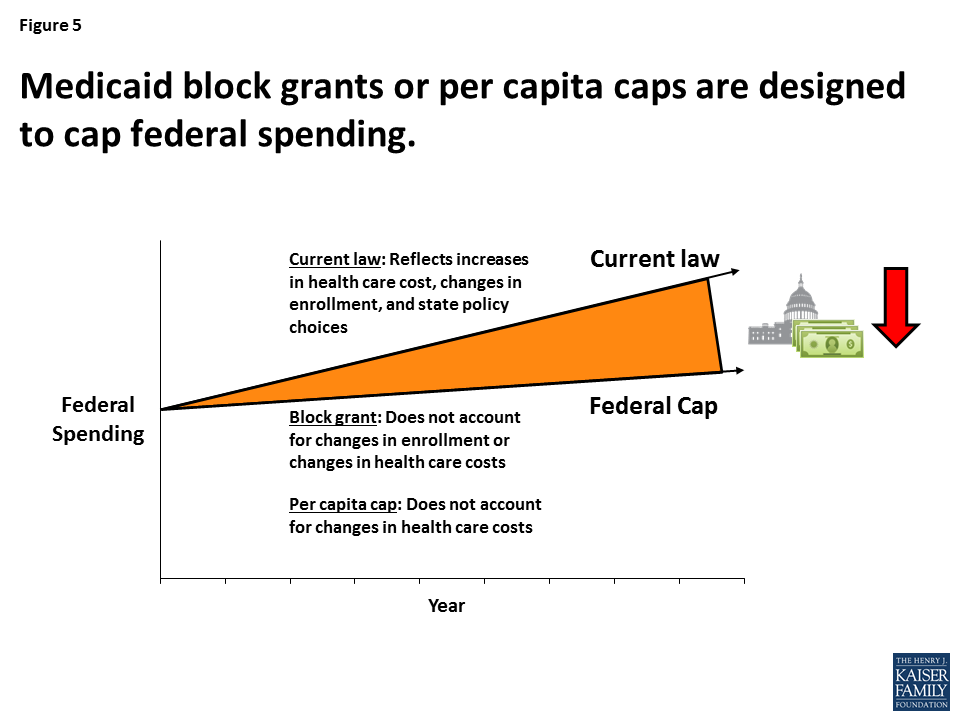
Under the block grant option, states could impose conditions of eligibility and not comply with key provisions in current law like comparability and state-wideness. Under the block grant option, states would be required to cover low-income parents and pregnant women at current federal minimum income levels and provide certain benefits. However, states could set conditions of eligibility for groups beyond these federal minimum groups, including for ACA expansion adults. Additionally, states electing the BCRA block grant option would not have to comply with other federal requirements, including comparability (the requirement that Medicaid-covered benefits be provided in the same amount, duration, and scope to all enrollees), state-wideness (the requirement that bars Medicaid programs from excluding enrollees or providers because of where they live or work in the state), and freedom of choice of provider (that allows beneficiaries to be permitted to choose among any provider participating in Medicaid). Like per capita caps, Medicaid block grants fail to account for changes in health care costs over time. Block grants also carry additional risk for states, providers, and beneficiaries because they do not account for changes in Medicaid enrollment (which could increase during an economic downturn) (Figure 5).
Figure 5: Medicaid block grants or per capita caps are designed to cap federal spending.
5. Provides the HHS Secretary discretion to allocate funds to address the opioid crisis and public health emergencies. The BCRA appropriates $45 billion for FY 2018 through FY 2026 for grants to states to support substance use disorder treatment and recovery support services with significant discretion to the HHS Secretary to allocate the funds. The BCRA also provides the HHS Secretary with discretion to exclude from a state’s per capita cap or block grant limit a total of $5 billion across all states for Medicaid spending in response to a public health emergency from January 2020 through December 2024. This exclusion would only apply during a period in which the HHS Secretary has declared a public health emergency in a state or region and also deemed an exclusion appropriate. Under current law, states can increase spending with a guaranteed federal match or seek waivers (like in Flint, MI or for states hit by hurricane Katrina) to address public health emergencies.
Other Significant BCRA Medicaid Changes
Other BCRA Medicaid changes with significant implications for states, providers, and beneficiaries include the following:
Creating a state option to require work as a condition of eligibility for nondisabled, nonelderly Medicaid adults as of October 1, 2017 (with some exemptions for certain groups including pregnant women or the sole caretaker of a child under age 6 or a child with a disability). Depending on how they are implemented, work requirements could increase administrative burdens on states and adversely affect some people, who are unable to comply due to their health, family caregiving obligations, or other reasons, by preventing them from accessing needed health coverage through Medicaid.3
Cancelling scheduled disproportionate share hospital (DSH) payment reductions for non-expansion (but not for expansion) states. The BCRA would exempt non-expansion states from the DSH reductions that were included in the ACA. During FY 2020-FY 2023, the BCRA would also provide a DSH payment increase to non-expansion states with per capita FY 2016 DSH allotment amounts (the FY 2016 DSH allotment divided by the number of uninsured individuals in the state for the fiscal year) that are below the national average per capita amount. A state qualifies as a non-expansion state if it is not covering expansion adults on or after January 1, 2021. This means that current expansion states that discontinue their expansions by the end of 2020 could qualify for increased DSH funds after their expansion ends. In addition, the BCRA would provide certain non-expansion states with $10 billion over 5 years (FY 2018-FY 2022) for safety-net funding.
Changing eligibility and enrollment processes with new requirements for eligible individuals to obtain and maintain Medicaid coverage. Changes include: repealing the requirement for states to cover Medicaid benefits retroactively for three months prior to the month of an individual’s enrollment in the program except for enrollees who are eligible based on old age or disability only); prohibiting hospitals from temporarily enrolling individuals in Medicaid if they are likely to be eligible under a state’s Medicaid eligibility rules (a policy known as “hospital presumptive eligibility”); removing a presumptive eligibility option that includes health care providers other than hospitals for expansion adults; and giving states the option to renew eligibility of Medicaid expansion adults every six months (or more frequently) compared to the current 12 month redetermination period.
Prohibiting federal Medicaid funding for Planned Parenthood for one year (beginning on the date of enactment). The Hyde Amendment already prevents the use of federal funds for abortion services,4 so the effect of this proposed policy would be to limit Planned Parenthood’s capacity to provide preventive care and other services to women (such as clinical breast exams or birth control).
Repealing the enhanced federal match rate available under the ACA for the Community First Choice (CFC) state plan option, as of January 1, 2020. The ACA established the CFC option to allow states to provide home and community-based attendant services and supports to Medicaid enrollees who would otherwise require an institutional level of care. States taking up the option currently receive a 6% increase in their federal match rate for CFC services, and without this additional funding states may eliminate the option. The BCRA also creates a demonstration that would provide 100% federal matching funds for certain states selected by the HHS Secretary providing home and community-based services (HCBS) for seniors or adults with disabilities under a Section 1915 (c) or (d) waiver or Section 1915 (i) state plan authority, limited to $8 billion over four years, from 2020 through 2023. The Secretary would select participating states with priority given to the 15 states with the lowest population density. Unlike CFC, the authority for this new demonstration is time-limited, all states likely could not participate, and federal funding is capped. The $8 billion allocated to the new demonstration is less than half of the cost of the elimination of CFC funding, estimated by the CBO at $19 billion over 10 years.
Repealing the essential health benefit requirement in Medicaid alternative benefit plans, beginning in 2020. The alternative benefit plans are required for expansion adults and a state option for benefit package design for certain other populations. While the Medicaid benefit package for children under Early and Periodic Screening, Diagnostic and Treatment (EPSDT) is comprehensive, states have flexibility to design benefit packages for adults, and many services for adults are offered at state option. If the essential health benefits requirement were repealed, there would be no federal minimum requirement in Medicaid to ensure that adults have coverage in certain areas such as mental health and substance use disorder treatment.
Endnotes
The BCRA would exempt spending on children who are eligible based on a disability. However, most Medicaid children with special health care needs are eligible based on low family income and not based on a disability. For example, 82% of Medicaid children with special health care needs do not receive SSI. ↩︎
Under current regulations, provider taxes must be broad-based, uniformly imposed, and cannot hold providers harmless from the burden of the tax (i.e., providers cannot be guaranteed that their tax payment will be paid back). Federal regulations create a safe harbor from the hold-harmless test for taxes where collections are 6% or less of net patient revenues. ↩︎
Research shows that nearly 8 in 10 adult Medicaid enrollees live in working families, and a majority are working themselves. Among the adult Medicaid enrollees who are not working, most report major impediments in their ability to work. ↩︎
Except to save the life of the woman, or if the pregnancy arises from incest or rape. ↩︎
President Trump’s FY 18 budget request to Congress includes unprecedented cuts to global health. If enacted, they would total approximately $2.5 billion and bring funding below FY 08 levels. Still, the President’s budget is just the first step in a longer process where Congress now takes center stage.
We developed “budget impact models” to assess the impact of funding cuts. We modeled three budget scenarios – the Administration’s proposed cuts as well as two more modest decreases – in countries that receive U.S. global health assistance for HIV, TB, family planning, and maternal, newborn, and child health.
Based on our models, the potential health impacts of these one-year cuts is significant across all three budget scenarios. For example, depending on the size of the cut, we estimate that starting next year:
Additional new HIV infections would range from 49,100 to 198,700; the number of people on antiretrovirals could decline by more than 830,000 in the steepest budget cut scenario;
Additional new TB cases would range from 7,600 to 31,100;
The number of women and couples receiving contraceptives would decline, ranging from 6.2 million to almost 24 million; the increase in the number of abortions would range between 778,000 to almost 3 million; and
Additional maternal, newborn, and child deaths would range between 7,000 and 31,300.
While the fate of this year’s global health budget remains uncertain, these models illustrate the relationship between such decisions and health outcomes in low- and middle-income countries and provide one important tool for assessing future budget choices.
Introduction
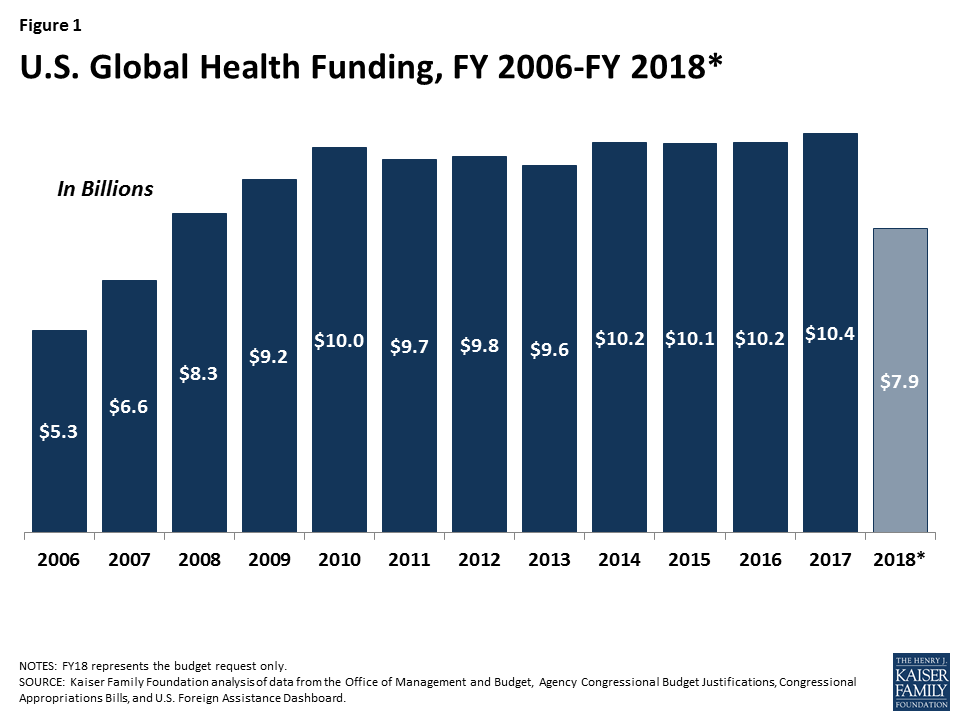
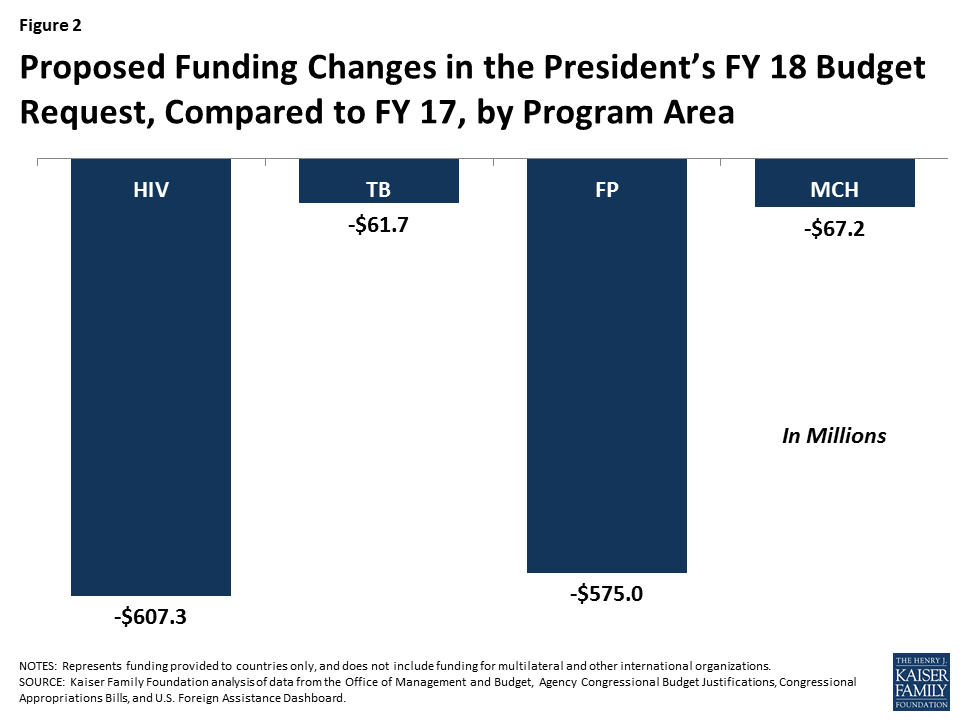
President Trump’s FY 18 budget request to Congress includes significant cuts to global health. If enacted, these cuts would total approximately $2.5 billion compared to FY 17 (a 23% reduction), and bring funding below FY 2008 levels (see Figure 1). For some global health program areas, the cuts are particularly steep. For example, PEPFAR funding to countries is cut by more than $600 million in the request and all $575 million for bilateral family planning1 is eliminated (see Figure 2). Still, the President’s budget is just the first step in a longer process where Congress now takes center stage and already, many members of Congress have indicated that they do not support cuts of this magnitude.2 At the same time, the proposed cuts – which represent the Administration’s statement of its policy priorities and set the initial framework for budget discussions in the coming year – in an already difficult budget environment suggest that the road ahead may be difficult for U.S. global health programs and the people they serve.
As Congress begins considering the request, it is important to understand how different budget choices could affect the health of those served by U.S. efforts. To do so, we developed “budget impact models” to examine the relationship between funding levels in U.S.-supported countries and health outcomes. We looked at four program areas of U.S. support – HIV, TB, family planning, and maternal, newborn, and child health. For each, we ran three budget scenarios, including the Administration’s proposed cuts as well as two more modest decreases (see Tables 1-4). We include only bilateral funding provided to countries; funding for multilateral and other international organizations was not included in our assessment. To the extent that support for these organizations is also cut (as proposed for several in the budget request), this approach would understate the impact.
Figure 1: U.S. Global Health Funding, FY 2006-FY 2018*Figure 2: Proposed Funding Changes in the President’s FY 18 Budget Request, Compared to FY 17, by Program Area
Results
Our models show that any cuts to global health funding by the U.S. will affect health outcomes in low- and middle-income countries, though they range significantly by budget scenario. (see Tables 1-4). For example, depending on the size of the cut, our models estimates that starting next year:
Additional new HIV infections would range from approximately 49,100 to 198,700; similarly, additional HIV deaths would range from 22,300 to 90,500, and the number of people on antiretrovirals could decline by more than 830,000 in the steepest budget cut scenario.
Additional new TB cases would range from 7,600 to 31,100 and TB deaths would range from 1,700 to 6,800;
Decreases in the number of women and couples receiving contraceptives would range from approximately 6.2 million to almost 24 million; the increase in the number of abortions (most of which are unsafe 3 ) would range between 778,000 to almost 3 million; and
Additional maternal, newborn, and child deaths would range between 7,000 and 31,300.
These estimates are based on one-year budget cuts only; if funding levels remain at the new, reduced level in the subsequent year, the cumulative impact would be doubled.
It is important to note that, while based on the latest available data, these models are intended to be illustrative only. They rely on certain assumptions that may or may not bear out in reality. For example, they assume that a change in U.S. funding will not result in a change in funding decisions made by other donors or host governments. In addition, they assume that any change in funding in a given program area is distributed proportionally, according to current spending allocations by country and type of intervention. Still, they provide one way to gauge the magnitude and direction of different budget choices. While the fate of this year’s global health budget remains uncertain, these models illustrate the relationship between such decisions and the health of those in low- and middle-income countries and provide one important tool for assessing future budget choices.
NOTES: All figures are rounded. Scenario 3 (the Administration’s proposal) is based on analysis of bilateral funding provided to countries only, and includes funding provided through the Global Health Programs account at State and USAID; funding provided to CDC, the Global Fund to Fight AIDS, Tuberculosis and Malaria, IAVI, microbicides, UNAIDS, and for technical assistance and oversight, was not included.SOURCE: Kaiser Family Foundation analysis.
NOTES: All figures are rounded. Scenario 3 (the Administration’s proposal) is based on analysis of bilateral funding provided to countries only, and includes funding provided through the Global Health Programs and ESF accounts at USAID (ESF funding was estimated for FY17); funding provided to CDC, the TB Drug Facility and for MDR Financing was not included.SOURCE: Kaiser Family Foundation analysis.
NOTES: All figures are rounded. Scenario 3 (the Administration’s proposal) is based on analysis of bilateral funding provided to countries only, and includes funding provided through the Global Health Programs and ESF accounts at USAID.SOURCE: Guttmacher Institute, Just the Numbers: The Impact of U.S. International Family Planning Assistance, July 2017; Kaiser Family Foundation analysis.
TABLE 4: BUDGET IMPACT: MATERNAL, NEWBORN, & CHILD HEALTH
NOTES: All figures are rounded. Scenario 3 (the Administration’s proposal) is based on analysis of bilateral funding provided to countries only, and includes funding provided through the Global Health Programs and ESF accounts at USAID (ESF funding was estimated for FY17); funding provided to GAVI and the Global Development Lab was not included.SOURCE: Kaiser Family Foundation analysis.
Appendix
Methods Appendix
Below are methodological details for each budget impact model. Our approach was similar across program areas: we identified estimated cost and health impacts of interventions and linked changes in funding to health outcomes. For each area, we examined changes in U.S. bilateral funding proposed in the FY 18 budget request compared to FY 17 levels in countries that receive U.S. support. We assume that the effect of a loss of funding is equal to the effect of a similar gain in funding. We excluded funding provided to multilateral and other international organizations and, where identifiable, funding provided for administrative/headquarters purposes. By excluding the former, we are likely to under- (in the case of cuts) or over- (in the case of increases) estimate health impacts. It is important to note that the models do not consider interactions between program areas, which could have multiplier effects. For example, decreases in PEPFAR funding could lead to fewer HIV positive pregnant women receiving services to prevent mother-to-child transmission, which in turn would lead to additional new child infections and child deaths.
HIV Budget Impact Model
The HIV budget impact model was developed with Avenir Health and uses data from Stover J, Bollinger L, Izazola JA, Loures L, DeLay P, Ghys PD, “What is Required to End the AIDS Epidemic as a Public Health Threat by 2030? The Cost and Impact of the Fast-Track Approach” (2016) PLoS ONE 11(5):e0154893 (available at http://journals.plos.org/plosone/article?id=10.1371/journal.pone.0154893). Stover et al. model the impact of scaling up the global response to HIV, using the Spectrum Goals and Resource Needs models (for further details, see original article and http://www.avenirhealth.org/software-spectrum.php). They compare the cost of scaling up HIV interventions in low-and middle-income countries over a five-year period (2015-2020) to a constant level of coverage to determine the incremental cost of scaling up. They also compare the impact of scaling up on new HIV infections, deaths, and number on antiretrovirals (ARTs) to constant coverage levels. The impacts over the 5-year period are used to determine average annual impacts. Data inputs for each country were drawn from national surveys and national progress reports and adjusted to match the prevalence trends from national estimates. Country-specific coverage rates were used. When country-specific data were not available, regional averages were used. Costs were estimated by intervention and year, country, and intervention (see article for additional detail).
For purposes of the HIV budget impact model, only data from the 31 countries that received funding from PEPFAR in FY 2016 and are required to submit a Country Operational Plan (COP)4 were used to assess an estimated cost per infection averted, cost per death averted, and cost per person on ART in PEPFAR countries. Each of these unit costs was used to assess how changes in funding would affect outcomes. It is important to note that the cost data used for PEPFAR countries represent average total costs per intervention, not USG-specific costs. In some cases, PEPFAR may only be supporting one component of an intervention (e.g., ARV drugs) but the total cost per patient (drugs, tests, personnel) is used. However, since PEPFAR is the largest source of funding in most of these countries, this assumption does not significantly distort the impact estimate; additionally, it is likely that in many cases, without the PEPFAR component, the full service would not be provided. The model also assumes that any funding change is distributed proportionately according to the current allocation of funding by service and by country. Finally, the health impacts modeled in PEPFAR countries represent estimated outcomes based on a one-year funding change (e.g., additional deaths that would not have occurred if there had been no cut), although some of these outcomes may take longer than one year to occur. If funding levels remain at the new reduced level in the subsequent year, the cumulative impact compared to the baseline level would be doubled.
TB Budget Impact Model
The TB budget impact model was developed with Avenir Health and uses data from The Global Plan to End TB 2016–2020 (available at: http://www.stoptb.org/global/plan/plan2/). The Global Plan models the impact of scaling up the global response to the TB epidemic, based on the SPECTRUM TB Impact Model and Estimates (TIME) model (for further details, see Global Plan appendix and http://www.avenirhealth.org/software-spectrum.php). The Global Plan compares the cost of scaling up TB interventions over a five-year period (2016-2020) to a constant level of coverage to determine the incremental cost of scaling up. It also compares the impact of scaling up on new TB cases and new TB deaths to constant coverage levels. Data inputs from India, China and 7 other countries, representing 7 different TB contexts, were used to model the impact of the Global Plan. The results were then extrapolated to produce estimates for 154 countries in total, representing most of the global TB burden.
For purposes of the TB budget impact model, only data from the 22 countries that received funding from the USAID TB program in FY 2016 are used, resulting in an estimated cost per TB case averted and cost per TB death averted in USAID TB countries. It is important to note that the cost data used for these countries represent average total costs per intervention, not USG-specific costs. In some cases, USAID may only be supporting one component of an intervention but the total cost per patient is used. Where USG support is critical to the provision of the entire service, this approach would not significantly distort the impact estimate. Where USG support does not affect the overall provision of a service, this approach could overestimate the impact. The model also assumes that any funding change is distributed proportionately according to the current allocation of funding by service and country. Finally, the health impacts modeled in TB countries represent estimated outcomes based on a one-year funding change (e.g., additional deaths that would not have occurred if there had been no cut), although some of these outcomes may take longer than one year to occur. If funding levels remain at the new reduced level in the subsequent year, the cumulative impact compared to the baseline level would be doubled.
Family Planning Budget Impact Model
Family planning budget impacts are based on unrounded estimates provided by the Guttmacher Institute from their analysis in Just the Numbers: The Impact of U.S. International Family Planning Assistance, July 2017. They estimated country-level costs (direct and indirect) per use of modern contraceptive methods and impacts of changes in levels of use on unintended pregnancies, abortions, and maternal deaths. These were applied to country-level funding provided by the U.S. family planning program in FY16 to estimate the number of women/couples receiving contraceptive services and supplies from USG funding, and the subsequent impacts on unintended pregnancies, induced abortions, and maternal deaths. It is important to note that the cost data used for these countries represent average total costs, not USG-specific costs. Where USG support is critical to the provision of the entire service, this approach would not significantly distort the impact estimate. Where USG support does not affect the overall provision of a service, this approach could overestimate the impact.
Maternal and Child Health Budget Impact Model
The Maternal and Child health budget impact model was developed with Avenir Health and in consultation with researchers at Johns Hopkins University. A review of the literature* was used to obtain estimates of the cost per maternal, neonatal, or child life saved in low- and middle- income countries based on multi-country analyses. A median cost estimate across these studies was used. The change in funding provided by USAID for maternal and child health programs in countries was used to estimate the additional maternal, neonatal, or child death in these countries. It is important to note that the cost data used for these countries represent average total costs, not USG-specific costs. In addition, it was not possible to separate out the effects of funding changes on neonatal, child, and maternal deaths, given their intersectional nature. However, it is expected that most of the effect would be on child (under five) mortality.
*Bhutta Z et al., “Can available interventions end preventable deaths in mothers, newborn babies, and stillbirths, and at what cost?” Lancet 2014, 384: 347–70; Darmstadt et al., “Evidence-based, cost-effective interventions: how many newborn babies can we save?”, Lancet 2005, 365: 977–88; Bartlett et al., “The Impact and Cost of Scaling up Midwifery and Obstetrics in 58 Low- and Middle-Income Countries”, PLoS ONE 2014, 9(6): e98550; Murray C, Chambers R, “Keeping score: fostering accountability for children’s lives”, Lancet 2015, Vol 386: 3-5.
Endnotes
“Family Planning” is used here to describe the USAID Family Planning and Reproductive Health Program. ↩︎