KFF designs, conducts and analyzes original public opinion and survey research on Americans’ attitudes, knowledge, and experiences with the health care system to help amplify the public’s voice in major national debates.
A stronger economy was a primary factor driving lower Medicaid enrollment growth and relatively steady spending growth as states finished state fiscal year (FY) 2018 and adopted budgets for FY 2019. This brief analyzes Medicaid enrollment and spending trends for FY 2018 and FY 2019 based on interviews and data provided by state Medicaid directors as part of the 18th annual survey of Medicaid directors in all 50 states and the District of Columbia. The methodology used to calculate enrollment and spending growth as well as additional information about Medicaid financing can be found at the end of the brief. Key findings are described below and in a companion report.
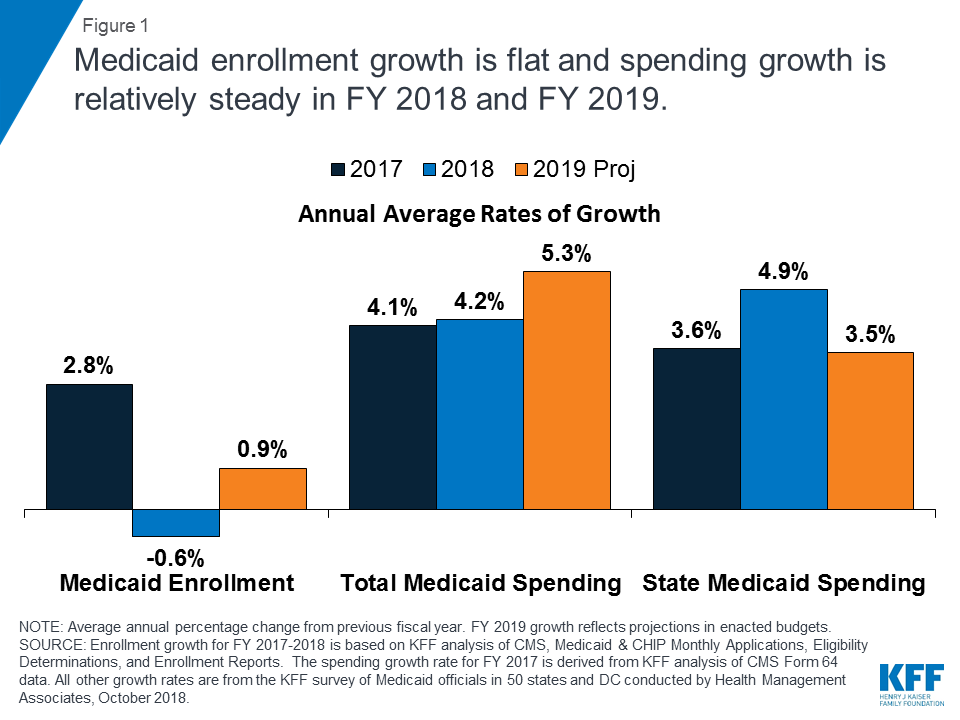
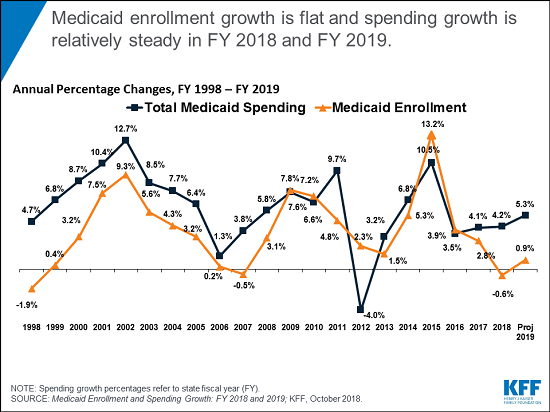
Enrollment: A stronger economy, elimination of redetermination delays in states that had previously implemented new or upgraded eligibility systems, and enhanced verifications and data matching in a number of states resulted in flat enrollment growth in FY 2018 (-0.6%) and projected for FY 2019 (0.9%) (Figure 1). Since peaking in FY 2015, enrollment growth has continued to slow due, in part, to the tapering of ACA enrollment growth.
Figure 1: Medicaid enrollment growth is flat and spending growth is relatively steady in FY 2018 and FY 2019.
50-state Medicaid survey finds average spending growth outpaces enrollment due to pressure from rising costs for prescription drugs and long-term services and supports
Spending: Compared to FY 2017, total spending growth was steady in FY 2018 (4.2%) but is projected to accelerate modestly in FY 2019 (5.3%). While slower caseload growth helped to mitigate spending growth in FYs 2018 and 2019, higher costs for prescription drugs, long-term services and supports and behavioral health services, and policy decisions to implement targeted provider rate increases were cited as factors putting upward pressures on total Medicaid spending.
ACA Expansion Financing: After receiving a 100% federal match rate for the expansion group for CYs 2014-2016, states began paying 5% of the costs of the Affordable Care Act (ACA) Medicaid expansion group starting in January 2017 and 6% beginning in January 2018. The declining federal match for the expansion group (which will continue to phase down to 90% by 2020) resulted in state Medicaid spending growth outpacing total spending growth (4.9% compared to 4.2%) in FY 2018, the first full state fiscal year that states were required to pay a share of expansion costs. States anticipate, however, that total spending growth will increase faster than state spending growth for FY 2019. While most states reported financing the state share of expansion costs with general fund dollars, a number of states listed other sources of financing including new or increased provider taxes / fees or savings that accrue from the expansion.
Looking ahead, economic conditions and the outcome of federal and state elections are likely to have implications for Medicaid policymaking as well as for spending and enrollment trends. Potential federal efforts to further change the ACA or cap Medicaid financing as well as state ballot initiatives and other state efforts to adopt the Medicaid expansion are key issues to watch.
Context
Medicaid provided coverage to about one in five Americans, or about 73 million people, as of June 2018.1 Total Medicaid spending was $557 billion in FY 2017 with 62% paid by the federal government and 38% financed by states.2 Medicaid accounts for one in six dollars spent in the health care system, but more than 50% of long-term care spending.3 Key factors affecting total Medicaid spending and enrollment trends over the last decade include the lingering effects of the Great Recession followed by the implementation of the Affordable Care Act (ACA). As of September 2018, 34 states including DC have adopted the ACA Medicaid expansion with Virginia implementation planned for January 1, 2019 and Maine implementation planned for sometime in FY 2019 (the exact date is to be determined).4
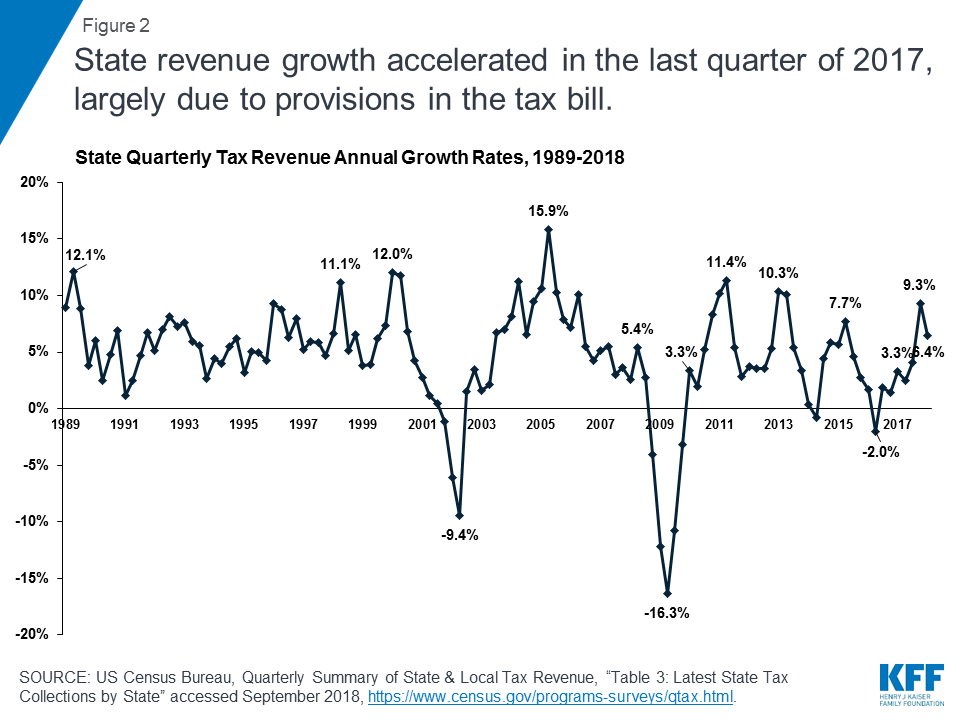
As states finished FY 2018, the economy was still improving compared to prior years. The unemployment rate continued to decline to 3.7% in September 2018, relieving pressure on Medicaid enrollment growth.5 Revenue collections were strong in the 4th quarter of 2017 (halfway through FY 2018), increasing by 9.3% over the same quarter in the prior year (Figure 2). This increase was largely due to accelerated state personal income tax and local property tax payments, as individuals sought to take advantage of state and local tax deductions that became subject to a cap beginning in January 2018 (due to the passage of the Tax Cuts and Jobs Act (TCJA) in December 2017).6 Data from the National Association of State Budget Officers (NASBO) show estimated state revenue growth of 4.9% for FY 2018 with collections at or above original budget projections in 39 states, and 5% or greater in 15 states.7
Figure 2: State revenue growth accelerated in the last quarter of 2017, largely due to provisions in the tax bill.
For most states, revenue growth in FY 2019 is expected to be more moderate than in FY 2018. Most enacted budgets reflect moderate growth in both state revenues and spending. While complete data is not available, governors’ proposed budgets for FY 2019, on average, proposed an increase in nominal general fund revenues of 2.1% and spending of 3.2%.8 New spending allocations in adopted budgets for FY 2019 were frequently directed toward elementary and secondary education (including teacher pay). Other key priorities across states included expanding postsecondary educational opportunities, controlling health care costs, addressing infrastructure demands, reforming corrections systems, and focusing on efforts to address the opioid crisis.9
The economy was still lagging in FY 2018 and FY 2019 in some states. Underneath national trends lies considerable state variation, with a number of states still dealing with economic and/or state budget challenges. For example, Alaska, DC, West Virginia, Louisiana, and Mississippi had the highest state unemployment rates in August 2018, exceeding the national rate by one percentage point or more.10 According to NASBO, seven states estimated zero or negative general fund revenue growth in FY 2018 and 10 states were projecting similar growth rates in FY 2019 at the time of the governor’s budget release; 11 states estimated zero or negative general fund expenditure growth in FY 2018 and eight states were projecting similar expenditure growth in FY 2019 at the time of the governor’s budget release.11
Key Findings
Trends in Enrollment Growth FY 2018 and FY 2019
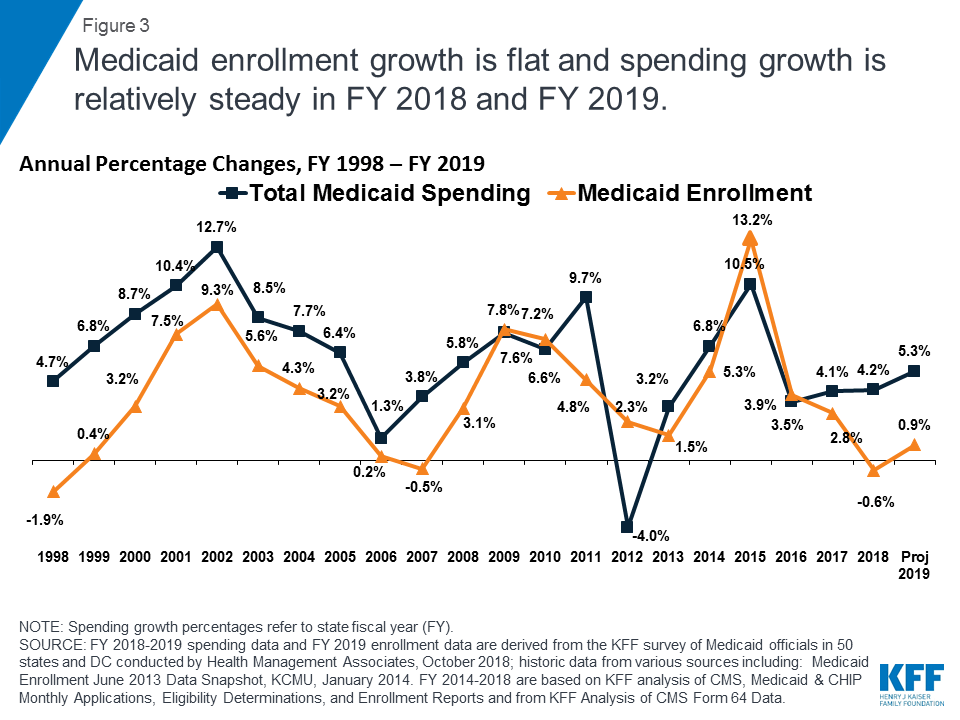
Medicaid enrollment growth was flat in in FY 2018 and FY 2019. Historically, Medicaid enrollment drives growth in Medicaid spending, and enrollment increases during economic downturns and in response to major policy changes. High growth in FY 2015 was largely due to the implementation of the ACA while trends in subsequent years reflect the tapering of ACA-related enrollment and an improving economy. In FY 2018, overall enrollment growth declined slightly (-0.6%). For FY 2019, states similarly project relatively flat enrollment growth of 0.9% (Figure 3).
Figure 3: Medicaid enrollment growth is flat and spending growth is relatively steady in FY 2018 and FY 2019.
In addition to the economy and similar to findings reported last year, a number of states that had previously implemented new or upgraded eligibility systems noted that they had eliminated redetermination delays and backlogs, which also contributed to slower, flat, or declining enrollment growth. In addition, some states noted that upgraded systems enabled enhanced verifications of enrollment data that resulted in further downward enrollment pressure. Some states reporting positive enrollment growth noted overall population growth as a factor contributing to upward enrollment growth. About half the states (27 states) reported enrollment declines for FY 2018 and 10 states reported declines for FY 2019.
Relative to other groups, expansion adults had the highest median growth rate in both FY 2018 and FY 2019, followed by the median growth rate for the aged and persons with disabilities. In contrast, many states reported slow or negative growth for children and non-expansion adults in FY 2018 and FY 2019. Lower enrollment growth for children and adults (lower-cost populations) relative to the aged and persons with disabilities (more costly groups) changes the case mix of the overall Medicaid population with implications for spending growth.
Trends in Spending Growth FY 2018 and FY 2019
Growth in total Medicaid spending was relatively steady in FY 2018 and 2019. High rates of enrollment growth, tied first to the Great Recession and later to the implementation of the ACA, were the primary drivers of total Medicaid spending growth over the last decade. Compared to FY 2017, total Medicaid spending growth held steady at 4.2% in FY 2018 but is projected to accelerate modestly to 5.3% in FY 2019. State Medicaid directors noted that slower enrollment growth driven by an improved economy and low unemployment as well as care management and other cost containment measures were helping to curb growth in Medicaid spending.
Medicaid officials identified increasing costs for prescription drugs (particularly for specialty drugs), long-term services and supports and behavioral health services, and policy decisions to increase payment rates to specific provider groups as factors putting upward pressure on total Medicaid spending. A few states mentioned enrollment growth overall or for particular groups as a spending driver, sometimes citing expansion adults or high cost populations. Other states noted that medical inflation, which trends higher than general inflation, pushes Medicaid spending growth higher than spending growth in other programs. When asked about trends in spending per enrollee, about one in four states reported that per enrollee costs for the aged and persons with disabilities was growing faster than for other groups, potentially amplifying underlying changes in the case mix of the overall Medicaid population.
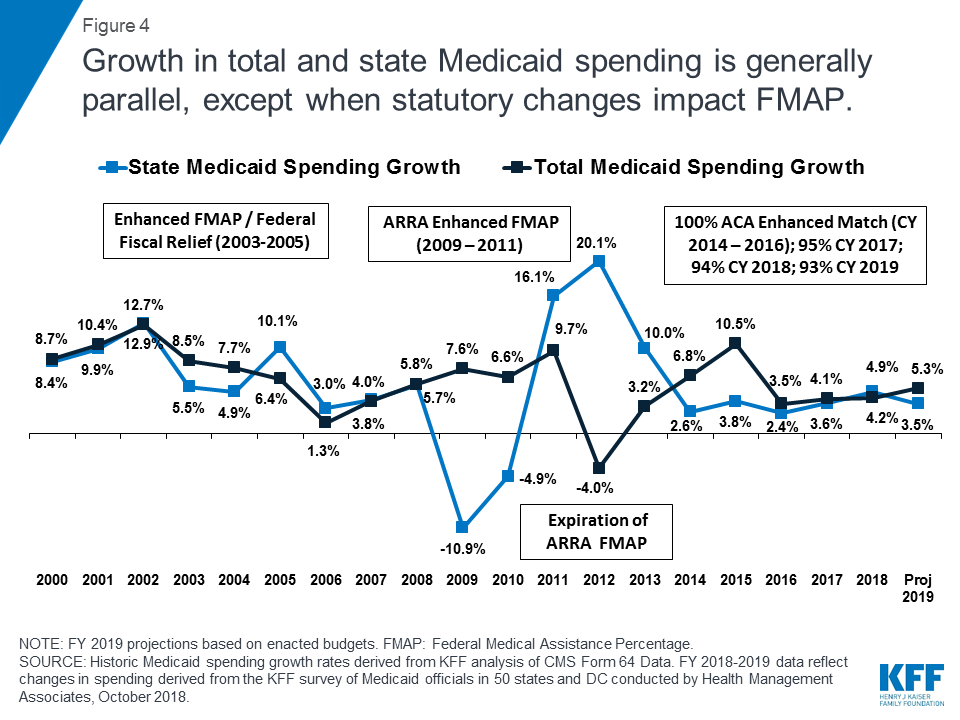
Total spending and the state share of Medicaid spending grow in tandem unless there is a change in the federal match rate. Following the implementation of the ACA, the enrollment of millions of expansion adults at a 100% federal match rate resulted in lower overall state spending growth compared to total spending growth. Mid-way through FY 2017, expansion states began paying 5% of the costs of the new group, and this amount increased to 6% in January 2018. FY 2018 was therefore the first full state fiscal year that states were responsible for paying for a share of the Medicaid expansion. As a result, state Medicaid spending growth slightly outpaced total Medicaid spending growth in FY 2018 (4.9% growth in state spending compared to 4.2% overall). While states will begin to pay 7% of the costs of the expansion group in January 2019, total Medicaid spending growth is nevertheless projected to outpace state Medicaid spending growth (5.3% growth in total spending compared to 3.5% state spending growth) (Figure 4).
Figure 4: Growth in total and state Medicaid spending is generally parallel, except when statutory changes impact FMAP.
State spending growth for Medicaid typically outpaces overall state general fund growth as medical costs have historically grown faster than inflation. During the first three years of ACA implementation (2014-2016), however, state spending for Medicaid grew at a slower pace compared to overall state general fund growth due to the enhanced federal match rate for expansion adults. In FY 2017 and FY 2018, the historic trend resumed with average general fund spending growth of 3.0% and 3.4%, respectively, slightly lower than state Medicaid spending growth of 3.6% and 4.9%, respectively.
While most states reported financing the state share of expansion costs with general fund dollars, a number of states listed other sources of financing including new or increased provider taxes / fees or savings accrued as a result of the expansion. Some states listed other funding including local government funds in Illinois, cigarette taxes in Indiana, increases in drug rebates in Kentucky, and “other revenue” in New Hampshire. Several expansion states reported multiple sources of financing (Exhibit 1).
Exhibit 1: Medicaid Expansion Population Non-Federal Share Financing
# of States
States
New Provider Tax/Fee
5
AZ, LA, OR, PA, VA
Increase of Existing Provider Tax/Fee
7
AR, CO, IL, IN, MI, OR, PA
Savings from Medicaid Expansion*
7
CA, DE, MI, MT, NH, NY, PA
State General Fund
28
AK, AR, CA, CT, DC, DE, HI, IA, IL, KY, LA, MA, MD, MI, MN, MT, ND, NJ, NM, NV, NY, OH, OR, PA, RI, VT, WA, WV
Other^
4
IL, IN, KY, NH
*States reported financing the non-federal share with savings from the Medicaid expansion in a number of areas, including corrections, mental health, and transition of previously state-funded populations into the expansion group.
^ “Other” entries reflect local government funds in IL, cigarette taxes in IN, increases in drug rebates in KY, and “other revenue” in NH.
Conclusion and Looking Ahead
States started FY 2019 bolstered by strong revenue growth in FY 2018 and projecting continued revenue and spending growth for FY 2019. A stronger economy contributed to flat enrollment growth, which in turn mitigated Medicaid spending growth. However, rising costs for prescription drugs and long-term services and supports as well as targeted provider rate increases and medical inflation were cited as factors contributing to upward spending growth. Looking ahead, federal and state elections in November 2018 are likely to have important implications for Medicaid. The outcome of federal elections could determine whether Congress takes up legislation to make further changes to the ACA or to reform and cap Medicaid financing. State-level gubernatorial and legislative elections could have implications for states considering Medicaid expansion or Section 1115 demonstration waivers. Thirty-six states have gubernatorial elections this year and three states (Idaho, Nebraska, and Utah) have ballot initiatives to newly adopt the ACA Medicaid expansion. FY 2019 will be a year to watch how Medicaid’s role evolves on the ground in the 50 states and DC.
Methods
Definition of Medicaid Spending. Total Medicaid spending includes all payments to Medicaid providers for Medicaid-covered services provided to enrolled Medicaid beneficiaries. Medicaid spending also includes special disproportionate share hospital (DSH) payments that subsidize uncompensated hospital care for persons who are uninsured and unreimbursed costs of care for persons on Medicaid. Not included in total Medicaid spending are Medicaid administrative costs and federally mandated state “Clawback” payments to Medicare (to help finance the Medicare Part D prescription drug benefit for Medicaid beneficiaries who are also enrolled in Medicare). States are also asked to exclude costs for the Children’s Health Insurance Program (CHIP), though a few states provided percentage changes for spending that reflected Medicaid and CHIP combined. Total Medicaid spending includes payments financed from all sources, including state funds, local contributions, and federal matching funds. Historical state Medicaid spending refers to all non-federal spending, which may include local funds and provider taxes and fees as well as state general fund dollars.
Methodology. The Kaiser Family Foundation (KFF) commissioned Health Management Associates (HMA) to survey Medicaid directors in all 50 states and DC to identify and track trends in Medicaid spending, enrollment, and policy making. Given differences in the financing structure of their programs, the U.S. territories were not included in this analysis. This is the eighteenth annual survey, conducted at the beginning of each state fiscal year from FY 2002 through FY 2018. The KFF/HMA Medicaid survey for this report was sent to each Medicaid director in June 2018. Medicaid directors and staff responded to the written survey and participated in follow-up telephone interviews from June through September 2018. The telephone discussions are an integral part of the survey to ensure complete and accurate responses and to record the complexities of state actions. Forty-nine states and DC completed surveys and participated in telephone discussions, while the survey responses for one state (North Dakota) reflect information gathered during a telephone interview in early September 2018 and related research.
For FY 2018 and FY 2019, annual rates of growth for Medicaid spending were calculated as weighted averages across all states. Weights for spending were derived from the most recent state Medicaid expenditure data for FY 2017, based on estimates prepared for KFF by the Urban Institute using CMS Form 64 reports, adjusted for state fiscal years. These data were also used for historic Medicaid spending. In FY 2013, however, wide, inexplicable variation across the states inflated the overall growth rate. To adjust for this anomaly, spending growth from FYs 2012, FY 2013, and FY 2014 was averaged to estimate growth in FY 2013. The resulting estimate is similar to trends reported by the National Association of State Budget Officers (NASBO).
Medicaid average annual growth rates for enrollment were calculated using weights based on Medicaid and CHIP monthly enrollment data for June 2018 published by CMS. Historical enrollment trend data for FY 1998 to FY 2013 reflects the annual percentage change from June to June of monthly enrollment data for Medicaid beneficiaries collected from states. Enrollment trend data for FY 2014 to FY 2018 reflects growth in average monthly enrollment based on Medicaid & CHIP Monthly Applications, Eligibility Determinations, and Enrollment Reports from CMS. The baseline for FY 2013 was the monthly average of July 2013 through September 2013 as of August 2015. FY 2014 was estimated by averaging the monthly average of July 2013 through September 2013 with the monthly average of January 2014 through June 2014. The data reported for FYs 2018 and FY 2019 for Medicaid spending and FY 2019 for Medicaid enrollment are weighted averages, and therefore, data reported for states with larger enrollment and spending have a greater effect on the national average. Additional information collected in the survey on policy actions taken during FY 2018 and FY 2019 can be found in the companion report.
Appendix
Background on Medicaid Financing
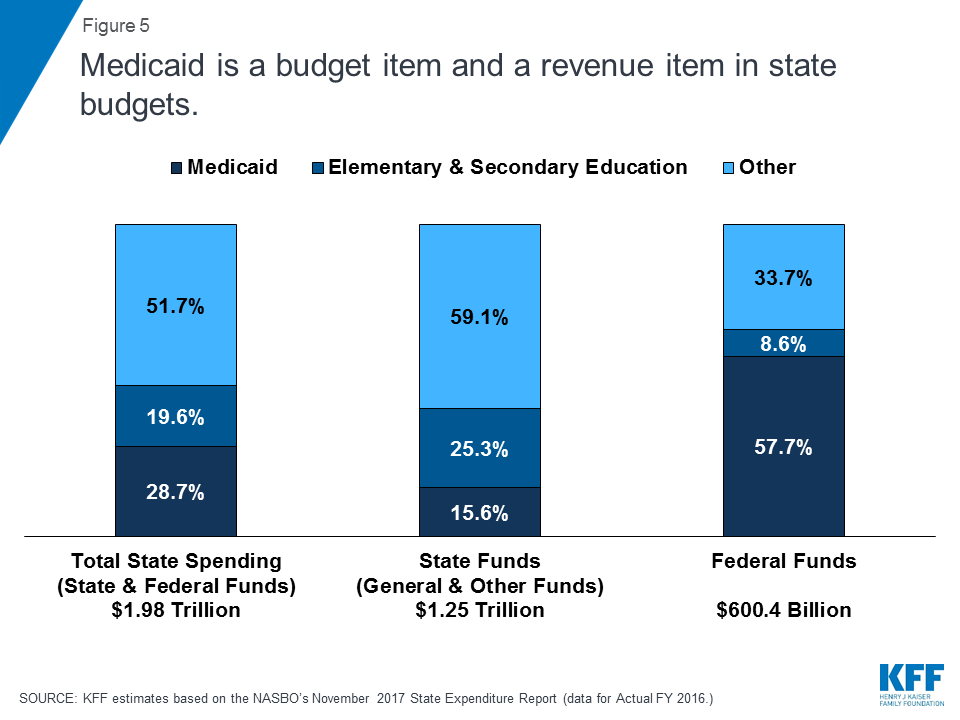
Medicaid Financing Structure. The federal government jointly funds the Medicaid program with states by matching qualifying state Medicaid expenditures. The federal match rate (known as the Federal Medical Assistance percentage, or FMAP) is calculated annually for each state using a statutory formula based on a state’s average personal income relative to the national average which results in higher FMAP rates for poorer states. The FMAP formula relies on three years of lagged personal income data, so data for FFYs 2014 to 2016 was used to calculate FFY 2019 FMAP rates which range from a floor of 50% (applicable to 14 states) to a high of 76.3% (for Mississippi).12 As a result of the federal matching structure, Medicaid is both a state budget expenditure item and a source of federal revenue for states. In FY 2016 (the latest year of actual data), Medicaid accounted for 28.7% of total state spending, but 15.6% of state funds (general fund plus other state funds), a far second to spending on K-12 education (25.3% of state funds). Medicaid is the largest single source of federal funds for states, accounting for half (57.7%) of all federal funds for states. (Figure 5).13
Figure 5: Medicaid is a budget item and a revenue item in state budgets.
Medicaid and the Economy. Medicaid is a countercyclical program. During economic downturns, more people qualify and enroll in Medicaid, increasing program spending at the same time that state tax revenues may be stagnating or falling. To mitigate these budget pressures, Congress has twice passed temporary FMAP increases to help support states during economic downturns, most recently in 2009 as part of the American Recovery and Reinvestment Act (ARRA). The ARRA-enhanced FMAP rates were the primary vehicle for federal fiscal relief to states during the “Great Recession,” providing states over $100 billion in additional federal funds over 11 quarters, ending in June 2011.14
Medicaid and the ACA. Effective January 1, 2014, the ACA expanded Medicaid eligibility to millions of non-elderly adults with income at or below 138% of the federal poverty level (FPL) – about $16,753 per year for an individual in 2018. The law also provided 100% federal funding for expansion adults through 2016, phasing down to 90% in 2020 and future years. While the June 2012 Supreme Court ruling on the ACA effectively made the Medicaid expansion optional for states, as of September 2018, 34 states (including the District of Columbia) had adopted the expansion. The ACA also required all states to implement new streamlined and coordinated application, enrollment, and renewal processes, including transitioning to a new income standard (Modified Adjusted Gross Income or MAGI) and eliminating asset tests to determine Medicaid financial eligibility for non-elderly, non-disabled populations.
To be eligible for ARRA funds, states could not restrict eligibility or tighten enrollment procedures in Medicaid or CHIP. Vic Miller, Impact of the Medicaid Fiscal Relief Provisions in the American Recovery and Reinvestment Act (ARRA) (Washington, DC: Kaiser Commission on Medicaid and the Uninsured, October 2011), https://modern.kff.org/medicaid/issue-brief/impact-of-the-medicaid-fiscal-relief-provisions/. ↩︎
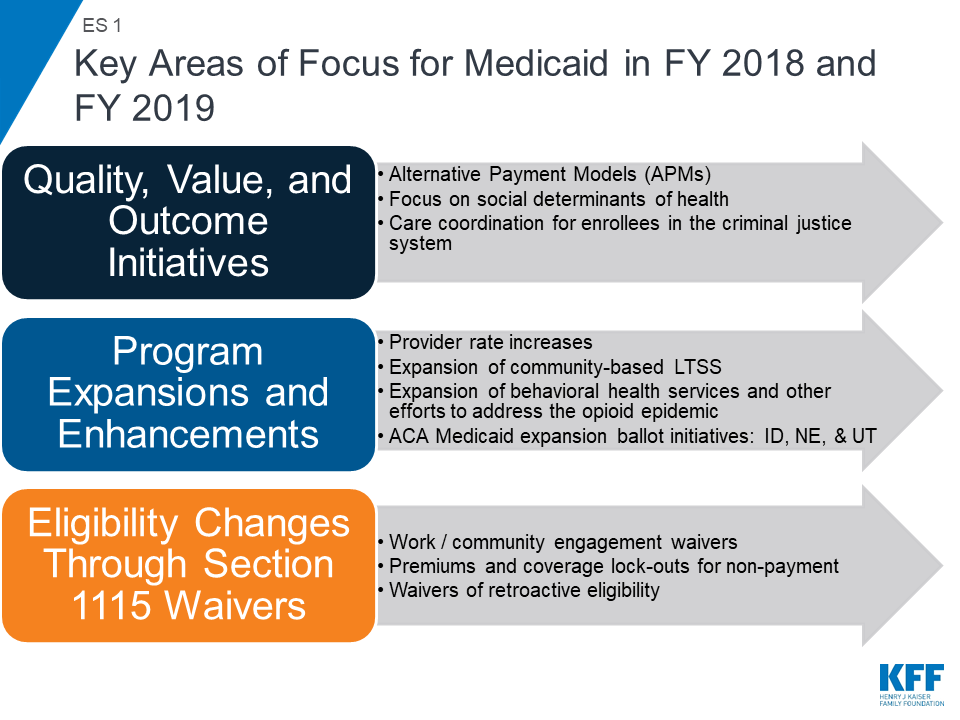
Medicaid covers one in five Americans, accounts for one in six dollars spent on health care in the United States, and makes up more than half of all spending on long-term services and supports. Medicaid is a state budget driver as well as the largest source of federal revenue to states. The program is constantly evolving in response to federal policy changes, the economy, and state budget and policy priorities. As states began state fiscal year (FY) 2019, the economy in most states was stable or improving and 36 states faced upcoming gubernatorial elections. With fewer budget pressures, a number of states reported expansions or enhancements to provider rates and benefits (including expansions for community-based long-term services and supports (LTSS) and behavioral health services). In addition, ballot initiatives in three states could result in adoption of the ACA Medicaid expansion. States also continue to focus on improvements in outcomes and value through delivery system changes and managed care requirements. In response to policy directions promoted by the Trump administration, an increasing number of states are pursuing demonstration waivers that include work requirements and the elimination or restriction of retroactive eligibility — policies that could result in enrollment declines (ES 1).
Figure ES-1: Key Areas of Focus for Medicaid in FY 2018 and FY 2019
This report provides an in-depth examination of the changes taking place in Medicaid programs across the country. The findings are drawn from the 18th annual budget survey of Medicaid officials in all 50 states and the District of Columbia conducted by the Kaiser Family Foundation (KFF) and Health Management Associates (HMA), in collaboration with the National Association of Medicaid Directors (NAMD). This report highlights certain policies in place in state Medicaid programs in FY 2018 and policy changes implemented or planned for FY 2019. The District of Columbia is counted as a state for the purposes of this report. Given differences in the financing structure of their programs, the U.S. territories were not included in this analysis but a separate survey was fielded and results will be released in another report. Key findings include the following:
A growing number of states are pursuing federal waivers to add work requirements in Medicaid, impose new or increased premiums and lock-out periods, and waive retroactive eligibility
A growing number of states are implementing or planning Section 1115 waivers with policies that have or could result in enrollment declines, while three states (Idaho, Nebraska, and Utah) could adopt the ACA Medicaid expansion through ballot initiatives. Policies that have or are likely to result in enrollment declines are counted as restrictions in this report. Eligibility restrictions implemented in FY 2018 (by six states) or planned for implementation in FY 2019 (in 11 states) generally target broad Medicaid populations, including parents/caretakers and expansion adults. These changes are primarily occurring through Section 1115 waiver demonstration authority because they are not allowed under current law. Restrictions for FY 2018 or FY 2019 include eight states implementing or planning to implement work or community engagement requirements as a condition of Medicaid eligibility, eight states eliminating or restricting retroactive eligibility, and three states implementing or proposing lock-out periods for non-payment of premiums, failure to complete redetermination, and/or failure to timely report changes affecting eligibility. In contrast, with the exception of planned implementation of the ACA Medicaid expansion in Maine and Virginia in FY 2019, most Medicaid eligibility expansions for FY 2018 or FY 2019 are narrow and targeted to a limited number of beneficiaries. Most states are working with corrections agencies and with local jails to facilitate Medicaid enrollment prior to release and the majority of states do not terminate Medicaid coverage for enrollees who become incarcerated.
What to Watch: Three states have proposals to adopt the Medicaid expansion on the November 2018 ballot (Idaho, Nebraska, and Utah) and many states have Section 1115 waivers pending or under development that could be implemented after FY 2019 and would impact eligibility, if approved by CMS.
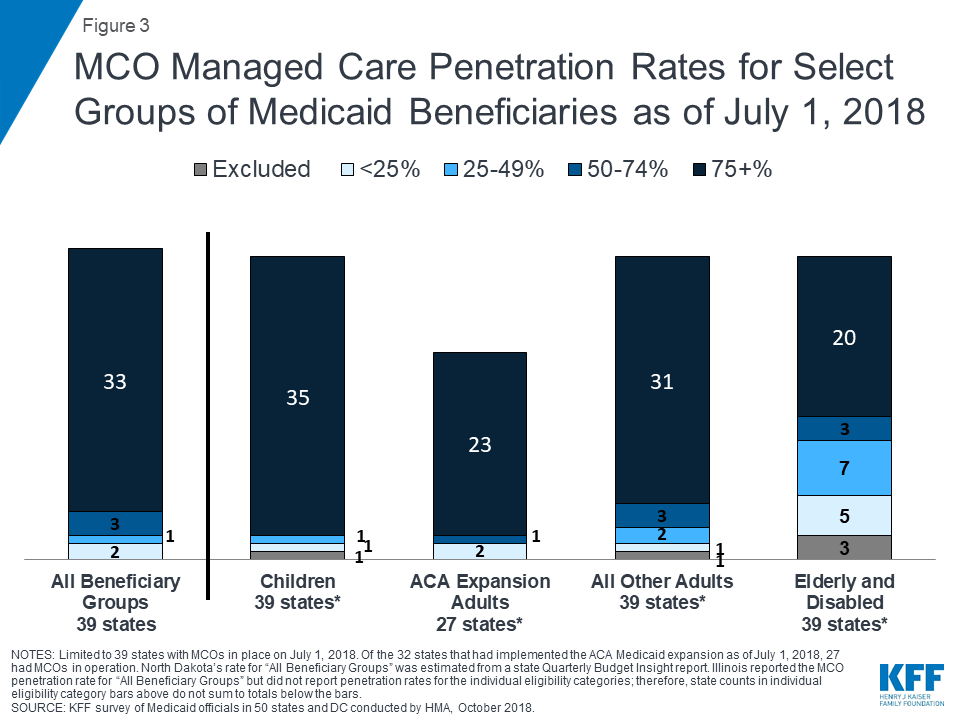
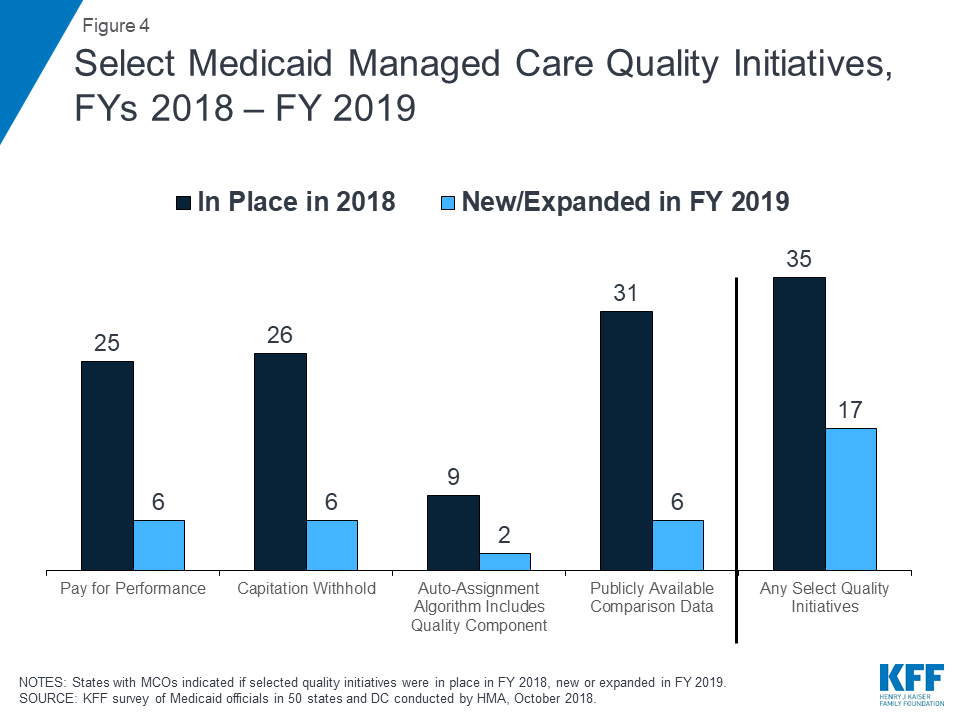
Risk-based managed care continues to be the predominant delivery system for Medicaid services, and states are focused on implementing alternative payment models and improving quality within MCOs. Among the 39 states with comprehensive risk-based managed care organizations (MCOs), 33 states reported that 75% or more of their Medicaid beneficiaries were enrolled in MCOs as of July 1, 2018. Although many states still carve-out behavioral health services from MCO contracts, movement to carve-in these services continues. Nearly all states have managed care quality initiatives in place such as pay for performance or capitation withholds and an increasing number of states (23 in FY 2018) set a target percentage of MCO provider payments that must be in alternative payment models (APMs).
What to Watch: Alaska and Arkansas reported plans to implement an MCO program for the first time in FY 2019. States continue to focus on improving value, quality, and outcomes through managed care arrangements. CMS has announced plans to release revised Medicaid managed care regulations for public comment later this fall.
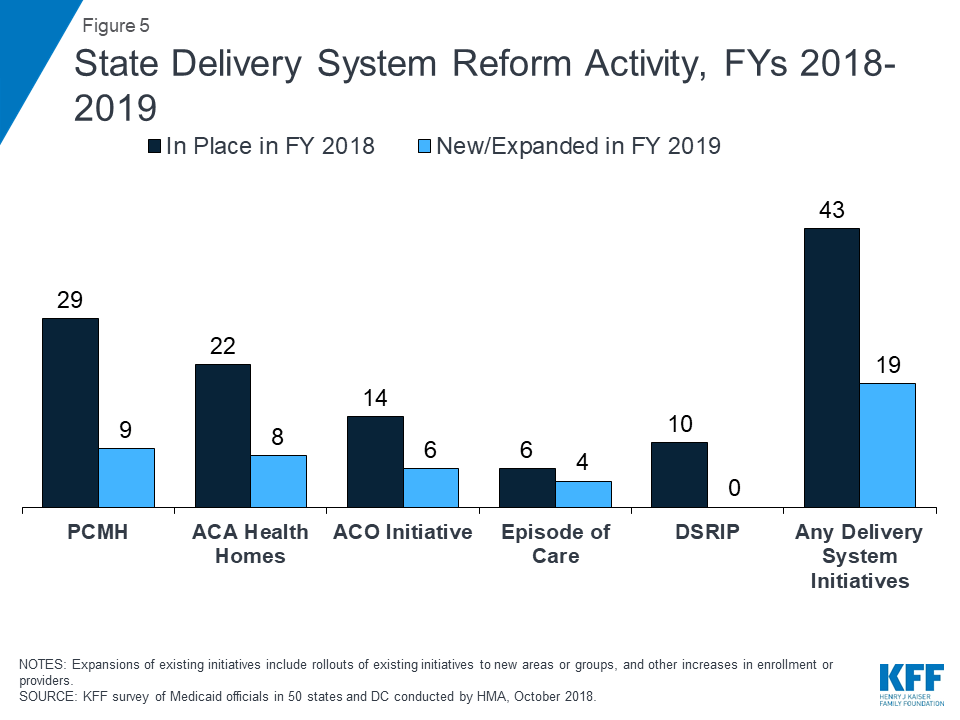
States are working to address social determinants of health both within and outside of MCO contract requirements. Medicaid programs have been expanding their use of other service delivery and payment reform models to achieve better outcomes and lower costs. Forty-three states had one or more delivery system or payment reform initiatives in place in FY 2018 (e.g., patient-centered medical homes (PCMHs), ACA Health Homes, accountable care organizations (ACOs), episode of care payments, or delivery system reform incentive programs (DSRIPs)).
What to Watch: About one-third of the states reported a wide variety of initiatives implemented in FY 2018 or planned for FY 2019 that address the social determinants of health (SDOH) outside of managed care and more than one-third reported collecting or plans to collect SDOH data from various sources including screenings and assessments, data collected for other state programs, claims data, beneficiary surveys, or as part of a care management or home visiting program.
Nearly all states in FY 2018 (46 states) and FY 2019 (48 states) are employing one or more strategies to expand the number of people served in home and community-based settings. Almost all states continue to report using home and community-based services (HCBS) waivers and/or state plan options (i.e., 1915(c), 1115, 1915(i), and 1915(k)) to serve more individuals in the community. As of July 1, 2018, 24 states covered LTSS through one or more capitated managed care arrangements (“MLTSS”). Pennsylvania introduced MLTSS in FY 2018, with a plan to phase-in statewide over time. Virginia ended its Financial Alignment Demonstration (FAD) but adopted statewide MLTSS for a broader population, including dual eligible individuals. To address challenges in finding and retaining LTSS direct care workers, a number of states reported wage increases for these workers in FY 2018 and/or FY 2019.
What to Watch: Housing-related supports remain an important part of state LTSS benefits, even as Money Follows the Person (MFP) grant funds expire. While 30 states reported that they expect to continue to offer housing-related supports after MFP funds are exhausted, about half of states reported plans to discontinue at least some housing-related services or administrative functions when MFP ends.
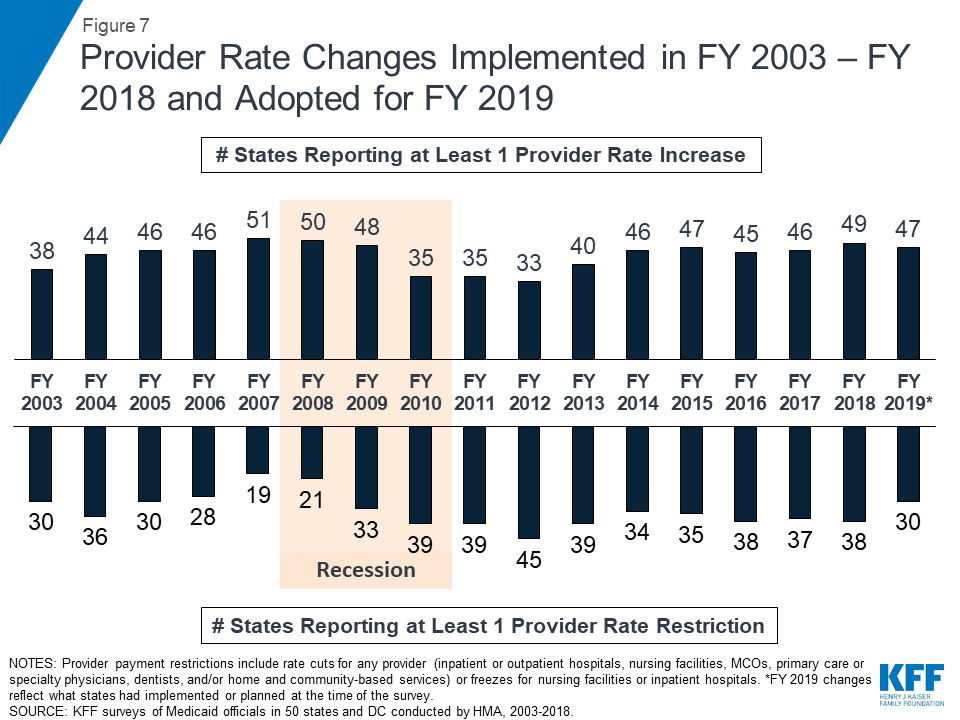
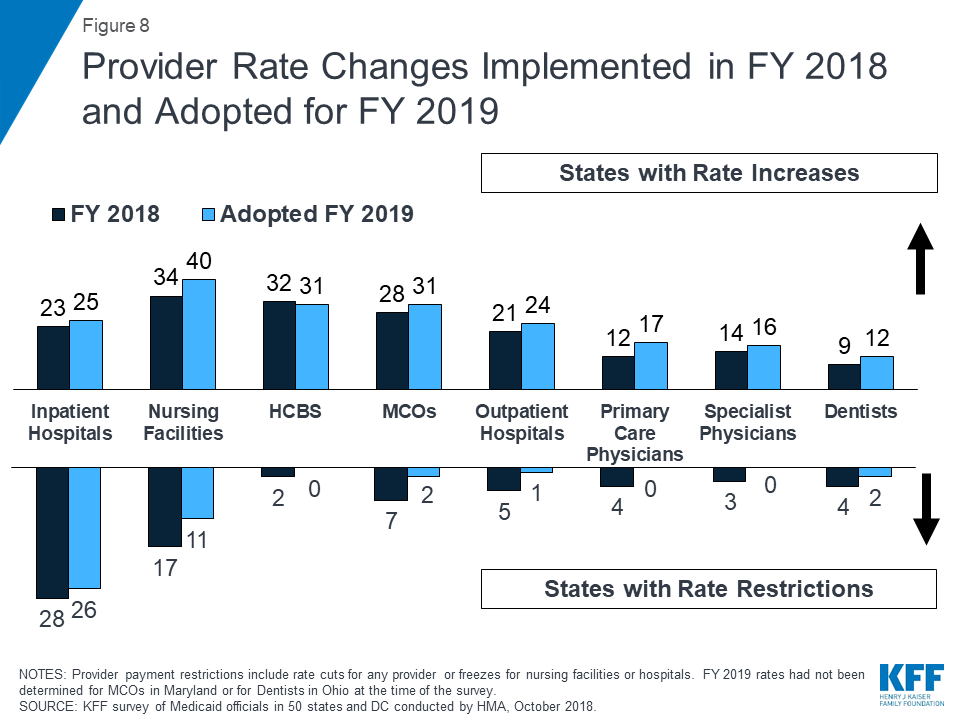
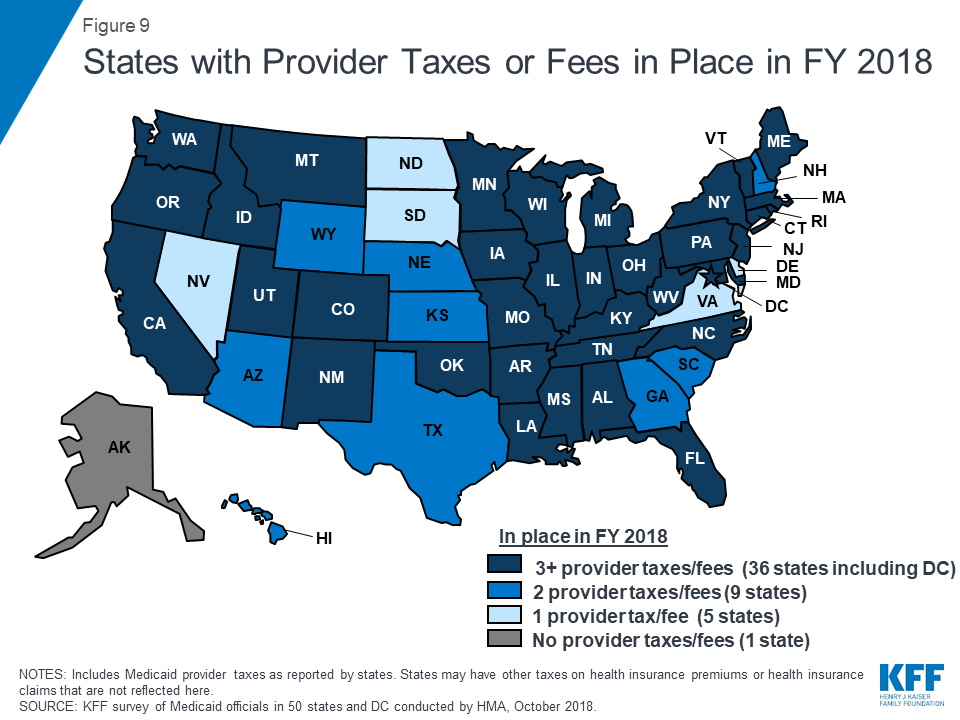
In FY 2018 and FY 2019, with favorable economic conditions in most states, more states made or are planning provider rate increases compared to restrictions, and there is little new activity around provider taxes. More rate increases relative to decreases holds true across major provider types, with the exception of inpatient hospitals (where inpatient hospital rate “restrictions” are primarily rate freezes that are counted as restrictions in this report). About half of MCO states (21 of 39) require MCO payments to some or all types of providers to follow percent or level changes in fee-for-service (FFS) rates. Twenty-seven states require minimum MCO payments (rate floors) for some provider types, and five states reported minimum MCO payment requirements for all types of Medicaid providers. All states except Alaska rely on provider taxes and fees to fund a portion of the non-federal share of the costs of Medicaid. Two states indicated plans for new provider taxes in FY 2019, including Virginia that plans a new hospital provider tax to finance state costs of the newly adopted Medicaid expansion.
What to Watch: As enrollees are predominantly in MCOs, the significance of changes in FFS payment rates is difficult to assess without a better understanding of how changes in FFS rates affect changes in MCO rates paid to providers. Twenty-nine states have at least one provider tax that is at or above 5.5% of net patient revenues (close to the maximum safe harbor threshold of 6%). Therefore, federal action to lower that threshold as proposed in the past would have financial implications for many states.
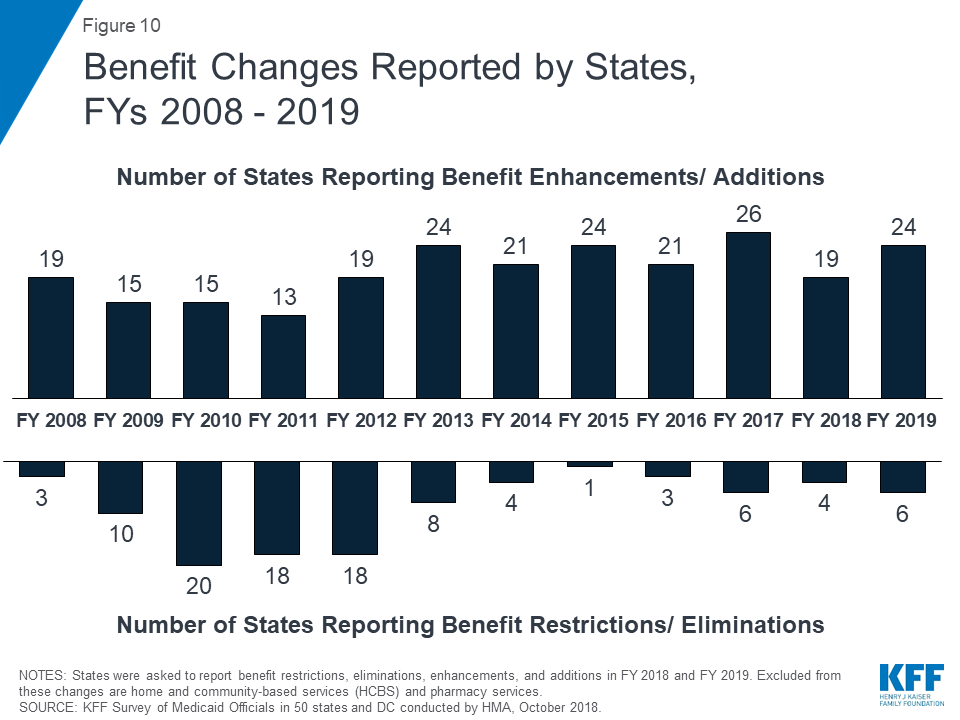
Positive economic conditions and state priorities resulted in a number of states increasing benefits, particularly for mental health and substance use disorder (SUD) treatment. A total of 19 states expanded or enhanced covered benefits in FY 2018 and 24 states plan to add or enhance benefits in FY 2019. The most common benefit enhancements reported were for mental health/SUD services (including waiver of the IMD exclusion). A handful of states also reported expansions related to dental services, telemonitoring/telehealth, physical or occupational therapy services, and screening or home visiting services for pregnant women and/or children.
What to Watch: Medicaid continues to play an important role in addressing the opioid epidemic and more broadly in connecting Medicaid beneficiaries to behavioral health services. Going forward, it will be important to follow trends and innovations in how states use Medicaid to increase access to behavioral health services and contain the growth of the opioid and broader SUD crisis.
States continue to focus on cost containment efforts to address rising prescription drug costs and on pharmacy benefit management strategies to address the opioid crisis. Prescription drug costs continue to exert pressure on Medicaid spending, and most states identified specialty and high-cost drugs (individually or in general) as the most significant driver of these costs. Many states reported implementing or making changes to a wide variety of prescription drug cost containment initiatives in FY 2018 or FY 2019, especially initiatives to generate greater rebate revenue and implement new utilization controls (e.g., prior authorization requirements, step therapy, other clinical criteria, or dose optimization). Almost all MCO states generally carve the pharmacy benefit into managed care, and many MCO states are moving to align MCO pharmacy policies with FFS policies. In FY 2018, all states report implementing one or more FFS pharmacy management strategies targeted at opioid harm reduction, including quantity limits, clinical criteria claim system edits, step therapy, other prior authorization requirements, and requirements for Medicaid prescribers to check their states’ Prescription Drug Monitoring Program before prescribing opioids to a Medicaid patient. States continue to increase access to Medication Assisted Treatment (MAT) for opioid use disorder, and 38 states reported coverage of methadone in FY 2018.
What to Watch: Several states noted the emerging cost challenge posed by gene therapies and immunotherapies like “CAR-T” (Chimeric Antigen Receptor-T cell) therapies,1 designated by CMS as covered outpatient drugs. While states are expanding coverage of MAT, many reported access challenges, especially in rural areas.
Challenges and Priorities FY 2019 and Beyond: Continuing to tackle the opioid epidemic is a key priority for states in FY 2019 and beyond. New federal legislation expected to be signed into law as this report was being finalized, the Substance Use Disorder Prevention that Promotes Opioid Recovery and Treatment for Patients and Communities (SUPPORT) Act, contains a number of provisions related to Medicaid’s role in helping states provide coverage and services to people who need SUD treatment,2 particularly those needing opioid use disorder (OUD) treatment. These provisions include the ability to use federal Medicaid funds for services in “institutions for mental disease” (IMDs) for nonelderly adults for up to 30 days from October 1, 2019 to September 30, 2023; required coverage of all FDA-approved drugs for medication-assisted treatment (MAT) as well as counseling and behavioral therapy services from October 2020 through September 2025; required suspension of Medicaid eligibility for individuals under age 21 or former foster care youth up to age 26 while incarcerated, and restoration of coverage upon release; creation of new demonstrations to help states increase Medicaid SUD provider capacity; and tighter prescription drug oversight.
In addition, states reported a wide variety of other priorities for FY 2019 and beyond, including implementing managed care, payment, and delivery system reform initiatives; undertaking major information technology system procurements and upgrades; pursuing new Section 1115 demonstration waivers, and managing their Medicaid budgets. The trajectory of the economy, the direction of federal policies around Medicaid Section 1115 waivers, and the outcomes of state and federal elections in November 2018 will be factors that shape Medicaid in FY 2019 and beyond.
Report: Introduction
Medicaid now provides health insurance coverage to one in five Americans and accounts for nearly one-sixth of all U.S. health care expenditures.3 The Medicaid program constantly evolves due to changes in federal and state policies, the economy, and other state budget and policy priorities. As of July 26, 2018, all states had enacted a new or revised budget for FY 2019 with only three states enacting a budget after the fiscal year began.4,5 This represented a significant improvement from the prior year when a number of states called special sessions in 2017 to complete their FY 2018 budgets and 11 states started FY 2018 without a fully enacted budget.6 A stable economy and improvements in state revenue growth resulted in surpluses in many states at the beginning of FY 2019 when this survey was conducted.7
Report findings are drawn from the 18th annual budget survey of Medicaid officials in all 50 states and the District of Columbia conducted by the Kaiser Family Foundation (KFF) and Health Management Associates (HMA), in collaboration with the National Association of Medicaid Directors (NAMD). (Previous reports are archived here.8 ) This year’s KFF/HMA Medicaid budget survey was conducted from June through September 2018 via a survey sent to each state Medicaid director in June 2018 and then a follow-up telephone interview. An acronym glossary and the survey instrument are included as appendices to this report.
The District of Columbia is counted as a state for the purposes of this report; the counts of state policies or policy actions that are interspersed throughout this report include survey responses from the 51 “states” (including DC). All 50 states and DC completed surveys and participated in telephone interview discussions between July and September 2018.9 Given differences in the financing structure of their programs, the U.S. territories were not included in this analysis but a separate survey was fielded and results will be released in another report.
This report examines Medicaid policies in place or implemented in FY 2018, policy changes implemented at the beginning of FY 2019, and policy changes for which a definite decision has been made to implement in FY 2019 (which began for most states on July 1, 201810 ). Policies adopted for the upcoming year are occasionally delayed or not implemented for reasons related to legal, fiscal, administrative, systems, or political considerations, or due to delays in approval from CMS. Key findings of this survey, along with state-by-state tables, are included in the following sections of this report:
Since 2014, most major Medicaid eligibility policy changes have been related to adoption of the ACA Medicaid expansion. Thirty-two states have implemented the expansion to date and two additional states adopted the expansion in FY 2018 and plan to implement the policy in FY 2019 (Maine and Virginia). Other Medicaid eligibility expansions for FY 2018 or FY 2019 were narrow and targeted to a limited number of beneficiaries. In contrast, eligibility restrictions implemented in FY 2018 (by six states) or planned for implementation in FY 2019 (in 11 states) generally target broader Medicaid populations including expansion adults and parents/caretakers. Policies that have or are likely to result in enrollment declines are counted as restrictions in this report. The vast majority of states implementing or planning eligibility policies that are counted as restrictions in FY 2018 or FY 2019 are doing so through Section 1115 waiver authority, whereas most states implementing or planning eligibility expansions are doing so through state plan amendment (SPA) authority.
What to watch:
Three states have proposals to adopt the Medicaid expansion on the November 2018 ballot (Idaho, Nebraska, and Utah).
In FY 2019, eleven states are planning to implement Medicaid Section 1115 waivers with policies that would result in eligibility restrictions including the addition of work requirements and the elimination or limitation of retroactive eligibility. Some states indicated that significant administrative resources will be needed to implement these initiatives, including one-time costs such as systems modifications and ongoing annual costs such as increased staffing.
Most states are working with corrections agencies and with local jails to facilitate Medicaid enrollment prior to release and the majority of states do not terminate Medicaid coverage for enrollees who become incarcerated. The SUPPORT Act would be prohibit states from terminating Medicaid eligibility for an individual under age 21 or former foster care youth up to age 26 while incarcerated beginning in October 2019.
Seven states reported planned changes related to new or increased premiums in FY 2019, six of which are through Section 1115 waivers.
Tables 1, 2, and 3 at the end of this section include additional details on eligibility, premium, and corrections-related policy changes in FY 2018 and FY 2019.
Changes to Eligibility Standards
Eligibility Restrictions
A growing number of states are pursuing Section 1115 waivers that include policies that would result in eligibility restrictions in FY 2018 and FY 2019 (Exhibit 1). Some of these policies are in response to January 2018 CMS guidance11 indicating the agency’s support for Section 1115 waiver proposals that would require certain Medicaid enrollees to meet a work requirement in order to maintain coverage. Policies that have or are likely to result in enrollment declines are counted as restrictions in this report.
Exhibit 1: Eligibility Restrictions by Policy Authority
*Indicates the Section 1115 Waiver has not yet been approved by CMS.^CMS’ approval of Kentucky’s waiver authorizing FY 2019 restrictions was set aside by a court order in June 2018 that also remanded the waiver to CMS for reconsideration regarding how the waiver would meet the medical assistance objectives of the Medicaid statute.
Six states reported implementing restrictions in FY 2018 and 11 states reported restrictions already implemented or planned for implementation in FY 2019 (Exhibit 1 and Table 1). This year’s survey reports changes that states plan to implement in FY 2019, even if the changes are in Section 1115 waiver proposals that are still pending approval12 at CMS. Waiver provisions that states plan to implement in FY 2020 or after are described later in the “Challenges and Priorities” section of this report.
Eight states reported implementing or plans to implement work requirements under Section 1115 waiver authority in FY 2018 or FY 2019 (Table 2).13 These policies generally require beneficiaries to verify their participation in approved activities, such as employment, job search, or job training programs, for a certain number of hours per week or month to receive health coverage or qualify for an exemption. Data show, however, that most Medicaid enrollees are already working or would qualify for exemptions from these requirements, yet these individuals would still need to navigate a reporting or exemption process to retain their Medicaid coverage. In this report, work requirement policies are counted based on the initial date of implementation rather than the date on which the first coverage terminations will occur.
Five additional states reported pending work requirement proposals that they plan to implement in FY 2019. Four of these states (Alabama, Maine, Ohio, and South Dakota) have proposals pending approval by CMS and one state (Kentucky) received approval for a work requirement waiver that was set aside by court order. That waiver is now back with CMS for reconsideration (see the Kentucky HEALTH waiver box below). Kentucky’s waiver is referred to as “pending” throughout the rest of this report.
Many of these states reported new administrative requirements or costs associated with implementation of work requirement policies, including those related to vendor contracts for call centers, systems modifications, increased state and local office staff, outreach to beneficiaries and providers, and increased MCO personnel costs.
Kentucky HEALTH Waiver
In January 2018, Kentucky received initial CMS approval for the Kentucky HEALTH Section 1115 waiver. The waiver included several provisions approved for the first time in Medicaid — a work requirement, monthly premiums up to 4% of income, and coverage lock-outs for failure to timely renew eligibility or timely report changes affecting eligibility — as well as heightened cost-sharing for non-emergency ER use, elimination of retroactive eligibility, and elimination of non-emergency medical transportation. A court order issued in Stewart v. Azar on June 29, 2018, however, set aside the CMS approval and remanded the waiver to CMS for reconsideration regarding how the Kentucky waiver would meet the medical assistance objectives of the Medicaid statute. At the time of the survey, CMS had completed an additional federal public comment period and the state was preparing for FY 2019 implementation, but the waiver remained under consideration at CMS.
Eight states indicated that they have eliminated or propose to eliminate or restrict retroactive eligibilityfor one or more groups in FY 2018 and FY 2019 (Table 2).14 In FY 2018, Arkansas limited retroactive eligibility from 90 to 30 days, Iowa eliminated retroactive eligibility for all groups other than children under age one and pregnant women (but restored retroactive eligibility for nursing facility residents in July 2018), and Utah eliminated retroactive eligibility for Primary Care Network (PCN) waiver adults. In FY 2019, five states (Florida, Kentucky, Maine, New Hampshire, and New Mexico) plan to eliminate retroactive eligibility or limit it to a single month for most enrollees.
Other examples of reported eligibility restrictions in FY 2018 or FY 2019 include:
In FY 2018, as part of their HIP 2.0 waiver renewal (a waiver that already included other eligibility restrictions), Indiana15 imposed a three-month lock-out from coverage on expansion adults who fail to comply with redetermination. Enrollees who do not verify eligibility at renewal are disenrolled but can re-enroll without a new application if they provide necessary documentation within 90 days. After 90 days, individuals are subject to a three-month lock-out before they can re-enroll.16
In FY 2019, New Mexico plans to implement proposals included in a pending waiver application to disenroll and lock-out expansion adults who do not pay required Medicaid premiums and a “reasonable promptness” waiver that would delay coverage until the first day of the first month following receipt of required premiums.
In FY 2019, Maine17 plans to implement (if their pending waiver is approved) several restrictions on their traditional Medicaid populations in addition to their planned waiver of retroactive eligibility and the work requirement. These include applying a $5,000 asset test to all coverage groups that currently do not have an asset test and eliminating hospital presumptive eligibility for all coverage groups. The state’s pending waiver application proposes to implement these initiatives within six months of demonstration approval.
Eligibility expansions
Aside from planned implementation of the ACA Medicaid expansion in two states in FY 2019, most other eligibility expansions for FY 2018 and FY 2019 are narrow in scope. Overall, ten states implemented Medicaid eligibility expansions in FY 2018, and seven states plan to implement expansions in FY 2019.
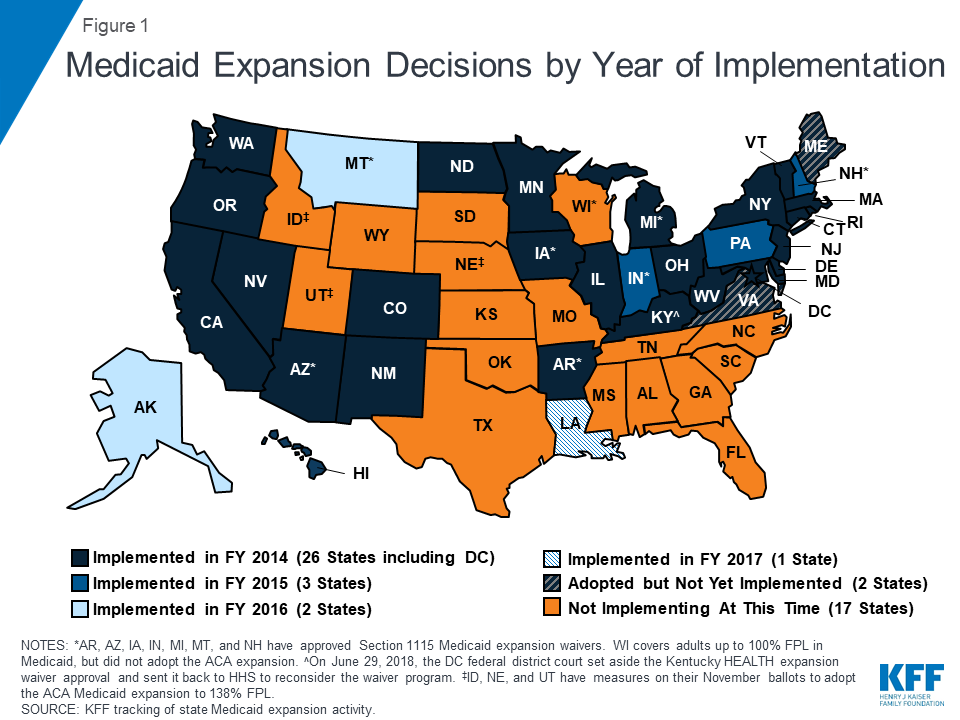
Two states (Maine and Virginia) plan to implement the ACA Medicaid expansion in FY 2019. These expansions will add to the 32 states that had already implemented the ACA Medicaid expansion as of July 2018 (Figure 1). In Virginia, the expansion was adopted as part of the FY 2019-2020 Medicaid budget, with implementation planned for January 1, 2019. Maine voters adopted the Medicaid expansion through a ballot initiative in November 2017 that required submission of a state plan amendment (SPA) within 90 days and implementation of expansion within 180 days of the measure’s effective date.18 After failing to meet the SPA submission deadline (April 3, 2018), Maine’s Governor complied with a Maine Supreme Judicial Court order to submit an expansion SPA on September 4, 2018 but also sent a letter to the federal government asking CMS to reject the SPA. The expansion had not yet been implemented at the time of the survey, and implementation will fall to the new governor after the November 2018 election.
Figure 1: Medicaid Expansion Decisions by Year of Implementation
Three additional states (Idaho, Nebraska, and Utah) will have referendum initiatives to adopt the Medicaid expansion on the November 2018 ballot. Montana also has an expansion-related initiative for voters on the November ballot that would eliminate the state’s June 2019 expansion program sunset date and raise tobacco taxes to fund the state’s share of expansion costs.
Exhibit 2: Eligibility Expansions by Policy Authority
FY 2018
FY 2019*
SPA
8 States
AR, CO, ID, MO, PA, SC, UT, VT
6 States
CT, MD, ME, MO, NJ, VA
Section 1115 Waiver
3 States
DE, UT, VA
0 States
*Iowa’s FY 2019 eligibility expansion that reinstated 3-month retroactive eligibility for Medicaid-eligible nursing facility residents did not require new Section 1115 or SPA authority.
Ten states implemented more narrow eligibility expansions in FY 2018 and five states plan to implement more limited expansions in FY 2019. In contrast to eligibility restrictions, which states are primarily implementing under Section 1115 authority, most states implementing or planning eligibility expansions in FY 2018 or FY 2019 are doing so through optional authority using a state plan amendment (SPA) (Exhibit 2). Some examples of these other expansions include the following:
In FY 2018 under Section 1115 waiver authority, Utah implemented coverage for individuals with income below 5% of the federal poverty level (FPL) who are chronically homeless, justice-involved, or in need of substance use and/or mental health treatment. The state also has approval to implement 12 month continuous eligibility for this population.
Missouri increased asset limits in both FY 2018 and FY 2019 for aged and disabled beneficiaries and Vermont increased asset limits in FY 2018 for their Working People with Disabilities Program.
In FY 2018, Arkansas and SouthCarolina eliminated the five-year waiting period on Medicaid eligibility for lawfully-residing immigrant children and pregnant women.19
Premiums
The Medicaid statute generally does not allow states to charge premiums to most Medicaid beneficiaries. Historically, premiums were limited to special higher income categories of beneficiaries such as expanded Medicaid for the working disabled. However, some states have obtained waiver authority to charge higher premiums and/or copayments than otherwise allowed.
Only Indiana reported activity related to Medicaid premiums in FY 2018 (Table 2). Effective January 1, 2018, the state changed its monthly premiums (which are paid into a health account) for expansion adults from 2% of income to tiered amounts based on income ranges (expressed as a percentage of the FPL). The result is reduced fluctuation of premiums. This report considers the change neutral from the beneficiary’s perspective.
Seven states report proposed implementation of new premium programs or changes to existing premiums for FY 2019 (Table 2). Three of these states (Idaho, Indiana, and Iowa) have already received approval for these changes, while they are still pending as part of Section 1115 waiver requests in four states (Kentucky, Maine, Michigan, and New Mexico). Notable FY 2019 premium policy changes include an approved waiver provision in Indiana to implement a premium surcharge for tobacco users and a pending waiver request in Michigan to require premiums of up to 5% of income (a higher amount than CMS has ever approved for any state) for expansion adults after 48 cumulative months of expansion eligibility.
Coverage Initiatives for the Criminal Justice Population
In recent years, many states have implemented new policies to connect individuals involved with the criminal justice system to Medicaid, as the Medicaid expansion extended new coverage to these individuals in many states (especially childless adults who were not previously eligible in most states). Connecting these individuals to health coverage20 can facilitate their integration back into the community upon release. While individuals may be enrolled in Medicaid while they are incarcerated, Medicaid cannot cover the cost of their care during incarceration, except for inpatient services. Nearly all states have policies in place to cover inpatient care under Medicaid for eligible, incarcerated individuals (Exhibit 3 and Table 3). Most states are also working with corrections agencies and with local jails to facilitate Medicaid enrollment prior to release. The majority of states do not terminate Medicaid coverage for enrollees who become incarcerated: states either maintain the eligibility of the incarcerated individual with benefits limited to inpatient hospital care, or they suspend eligibility. When coverage is suspended, it can be reinstated more easily and quickly upon release from incarceration or when an inpatient hospital stay occurs.
As this report was being finalized, the Substance Use Disorder Prevention that Promotes Opioid Recovery and Treatment for Patients and Communities (SUPPORT) Act was expected to be signed into law. Beginning in October 2019, the Act would prohibit states from terminating Medicaid eligibility for an individual under age 21 or former foster care youth up to age 26 while incarcerated. States would also be required to redetermine eligibility prior to release without requiring a new application and restore coverage upon release.
While both Medicaid expansion and non-expansion states have adopted strategies to connect justice-involved individuals to Medicaid coverage, these initiatives affect many more people in expansion states compared to non-expansion states where Medicaid eligibility for adults remains restrictive.
Exhibit 3: Coverage Initiatives for the Criminal Justice Population in FY 2018 and/or FY 2019 (# of States)
Select Medicaid Coverage Policies for the Criminal Justice Population
Jails
Prisons*
Parolees
Medicaid coverage for inpatient care provided to incarcerated individuals
42
48
N/A
Medicaid outreach/assistance strategies to facilitate enrollment prior to release from incarceration or for parolees
34
39
26
Eligibility maintained or suspended (rather than terminated) for Medicaid enrollees who become incarcerated^
36
38
N/A
^States that continue Medicaid eligibility for incarcerated individuals but limit covered benefits to inpatient hospitalization are also included in the count of states that suspend eligibility.
*The District of Columbia has jails but not a prison system. However, DC is counted under Medicaid outreach/assistance strategies because some individuals who serve prison terms outside of DC may be placed in residential re-entry centers upon returning to DC and may apply for Medicaid to access coverage for 24-hour inpatient care and to facilitate enrollment prior to release.
Table 1: Changes to Eligibility Standards in all 50 States and DC, FY 2018 and FY 2019
Eligibility Standard Changes
States
FY 2018
FY 2019
(+)
(-)
(#)
(+)
(-)
(#)
Alabama
X
Alaska
Arizona
Arkansas
X
X
X
California
Colorado
X
Connecticut
X
X
Delaware
X
DC
X
Florida
X
Georgia
Hawaii
Idaho
X
Illinois
Indiana
X
X
X
Iowa
X
X
Kansas
Kentucky
X
Louisiana
Maine
X
X
Maryland
X
Massachusetts
X
Michigan
X
Minnesota
Mississippi
Missouri
X
X
Montana
Nebraska
Nevada
New Hampshire
X
New Jersey
X
New Mexico
X
X
New York
X
North Carolina
North Dakota
Ohio
X
Oklahoma
Oregon
Pennsylvania
X
Rhode Island
South Carolina
X
South Dakota
X
Tennessee
Texas
Utah
X
X
Vermont
X
Virginia
X
X
Washington
West Virginia
Wisconsin
Wyoming
Totals
10
6
3
7
11
1
NOTES: From the beneficiary’s perspective, eligibility expansions or policies likely to increase Medicaid enrollment are denoted with (+), eligibility restrictions or policies likely to decrease enrollment are denoted with (-), and neutral changes are denoted with (#). This table captures eligibility changes that states have implemented or plan to implement in FY 2018 or FY 2019, including changes that are part of pending Section 1115 waivers. For pending waivers, only provisions planned for implementation before the end of FY 2019 (according to waiver application documents and/or interviews with state Medicaid staff) are counted in this table. Waiver provisions in pending waivers that states plan to implement in FY 2020 or after are not counted here.
SOURCE: Kaiser Family Foundation Survey of Medicaid Officials in 50 states and DC conducted by Health Management Associates, October 2018.
Table 2: States Reporting Eligibility21 and/or Premium22 Changes in FY 2018 and FY 201923
State
Fiscal Year
Eligibility Changes
Alabama
2019
Parents & Caretaker Relatives (-): Pending Section 1115 Waiver: Add a work/community engagement requirement for non-disabled, non-pregnant individuals under age 60 (75,000 individuals).
Arkansas
2018
Expansion Adults (-) Approved Sec. 1115 Waiver: Limit retroactive coverage from 90 to 30 days.
Expansion Adults (-) Approved Sec. 1115 Waiver: Work requirement for expansion adults (40,000 individuals) (first case closures occurred 9/1/2018).
Expansion Adults (#) Approved Sec. 1115 Waiver: End premium assistance program for employer sponsored insurance and transition individuals to QHP coverage (40 individuals).
Children and Pregnant Women (+): Implement the CHIPRA option to eliminate the 5-year waiting period on Medicaid eligibility for lawfully-residing immigrant children and pregnant women.
Colorado
2018
Aged & Disabled (+): Medicaid buy-in option for individuals in support living services, spinal cord injury, & brain injury waivers (40 individuals).
Connecticut
2018
Parents & Caretaker Relatives (-): Reduce the income threshold for Husky A from 155% FPL to 138% FPL (12,000 individuals).
2019
Parents & Caretaker Relatives (+): Increase the income threshold for Husky A from 138% FPL to 155% FPL (12,000 individuals).
Delaware
2018
Former Foster Youth (+) Approved Sec. 1115 Waiver: Add coverage for individuals who were in foster care and on Medicaid in another state at the time they aged out of the foster care system (under age 26 and under 133% FPL) (3 individuals).
District of Columbia
2019
Medically Needy (#): Clarification of Medically Needy eligibility criteria (with regard to countable medical expenditures) (7,000 individuals).
Florida
2019
Non-Pregnant Adults (-): Pending Sec. 1115 Waiver:Discontinue retroactive eligibility beyond the current application month.
Idaho
2018
Children (+): Cover children with serious emotional disturbance (SED) in families with income between 185% and 300% FPL (SED YES program) (2,000 to 10,000 children).
2019
Premiums (New): Children enrolled in the 1915(i) SED YES program will be subject to a premium in early 2019.
Indiana
2018
Expansion Adults (-) Approved Sec. 1115 Waiver: Three-month lock-out of coverage following a 90-day period of disenrollment for failure to comply with redetermination.
Expansion Adults (#) Approved Sec. 1115 Waiver: End HIP Link premium assistance program for employer-sponsored insurance (enrollees will be moved to other HIP 2.0 coverage).
Parents & Caretaker Relatives (#) Approved Sec. 1115 Waiver: Transitional Medical Assistance (TMA) is now for families in which a qualified HIP low-income parent/caretaker would otherwise fail financial eligibility due to new or increased earned income from a job or from self-employment exceeding the 133% FPL MAGI income limit.
Premiums (Neutral) for Expansion and Other Adults Approved Sec. 1115 Waiver: Monthly POWER Account contributions are now tiered based on income. The tiered amounts, effective January 1, 2018, are $1.00, $5.00, $10.00, $15.00, and $20.00.
2019
Expansion and Other Adults (-) Approved Sec. 1115 Waiver: Work/community engagement requirement, phased implementation beginning 1/1/2019.
Premiums (New) for Expansion Population Approved Sec. 1115 Waiver: Add a 50% premium surcharge for tobacco users beginning in the second year of enrollment.
Iowa
2018
All Groups but Pregnant Women and Children Under Age 1 (-) Approved Sec. 1115 Waiver: Eliminate retroactive eligibility.
2019
Nursing Facility Residents (+): Reinstate 3-month retroactive eligibility for Medicaid-eligible nursing facility residents, effective July 1, 2018.
Premiums (New) Approved Section 1115 Waiver: Adults must complete healthy behaviors (preventive dental visit and health risk assessment) or pay a $3 monthly premium for the Dental Wellness Plan.
Kentucky
2019
Expansion Adults and Parents/Caretakers (-) Sec. 1115 Waiver Approval Set Aside by Court, CMS Reconsidering:24 Work/community engagement requirement.
Expansion Adults and Parents/Caretakers (-) Sec. 1115 Waiver Approval Set Aside by Court, CMS Reconsidering: Eliminate retroactive eligibility.
Expansion Adults and Parents/Caretakers (-) Sec. 1115 Waiver Approval Set Aside by Court, CMS Reconsidering: Reasonable promptness waiver to delay coverage until the first day of the first month following receipt of the required premium.
Expansion Adults and Parents/Caretakers (-) Sec. 1115 Waiver Approval Set Aside by Court, CMS Reconsidering: Disenrollment and lock-out of coverage if renewal is not completed timely.
Expansion Adults and Parents/Caretakers (-) Sec. 1115 Waiver Approval Set Aside by Court, CMS Reconsidering: Disenrollment and lock-out of coverage if changes affecting eligibility are not reported timely.
Expansion Adults (-) Sec. 1115 Waiver Approval Set Aside by Court, CMS Reconsidering: Disenrollment and lock-out of coverage for non-payment of premiums.
Premiums (New) for Expansion Adults and Parents/Caretakers Sec. 1115 Waiver Approval Set Aside by Court, CMS Reconsidering: Up to 4% of income but at least $1.
Maine
2019
Adults (-) Pending Sec. 1115 Waiver: Add a work requirement for many groups of traditional adults. Those who do not comply with work requirement would be limited to no more than 3 months coverage in a 36-month period.
All Groups (-) Pending Sec. 1115 Waiver: Eliminate retroactive eligibility.
Adults (-) Pending Sec. 1115 Waiver: Apply a $5,000 asset test to all coverage groups that do not currently have an asset test (under current law there is no asset test for coverage groups based solely on low income (vs. old age/disability)).
All Groups (-) Pending Sec. 1115 Waiver: Eliminate hospital presumptive eligibility.
Expansion Adults (+): Implement ACA Medicaid expansion (approved by referendum in November 2017) via a SPA.25
Premiums (New) for Adults Ages 19 to 64 Pending Sec 1115 Waiver: Premiums of between $10 and $40 per month, not to exceed 2% of income.
Maryland
2019
Adults (+): Increased income threshold for limited family planning benefit from 200% FPL to 250% FPL, remove age limit, and expanded coverage to include men. Switched from 1115 to SPA authority (9,000 individuals).
Massachusetts
2019
Adults (-) Approved Sec. 1115 Waiver: Eliminate 90-day period of provisional eligibility for adults under age 65 without verified income. The following groups will continue to be eligible for 90-day provisional eligibility pending verification of income: (1) pregnant women with self-attested MAGI income less than or equal to 200% FPL; (2) individual with HIV-positive status with self-attested MAGI income less than or equal to 200% FPL; or (3) individual in active treatment for breast or cervical cancer with self-attested MAGI income less than or equal to 250% FPL. (135,000).26
Michigan
2019
Expansion Adults 100-138% FPL (-) Pending Sec. 1115 Waiver: Disenroll individuals for non-payment of required premiums after reaching 48 months of cumulative Healthy Michigan Plan eligibility.
Expansion Adults 100-138% FPL (-) Pending Sec. 1115 Waiver: Disenroll individuals for failure to complete an annual healthy behavior requirement after reaching 48 months of cumulative Healthy Michigan Plan eligibility.
Premiums (Increased) Pending Sec. 1115 Waiver: Require premium of 5% of income for expansion population with incomes between 100% and 133% FPL.
Missouri
2018
Aged & Disabled (+): Asset limit increase (phased increase from FY 2018 through FY 2022) (2,865 individuals).
2019
Aged & Disabled (+): Asset limit increase (phased increase from FY 2018 through FY 2022) (992 individuals)
New Hampshire
2019
Expansion Adults (-): Approved Sec. 1115 Waiver: Work/community engagement requirement for expansion population, implementation beginning 1/1/2019.
Expansion Adults (-): Approved Sec. 1115 Waiver: Eliminate retroactive eligibility for expansion population.
New Jersey
2019
Family Planning Enrollees (+): Expansion of family planning to cover men and women ages 19 to 65 between 138% and 205% FPL (over 30,000 individuals).
New Mexico
2018
Aged & Disabled (-): Home equity exclusion changed from the federal maximum of $840,000 to the federal minimum of $560,000 (fewer than 5 individuals).
2019
Family Planning (-) Pending Sec. 1115 Waiver: Limit family planning to age 51 and under (or under 65 with Medicare) (15,200 individuals).
Most Managed Care Members (-) Pending 1115 waiver: Limit retroactive Medicaid to one month for most managed care members (8,000 individuals).
Expansion Adults (-): Pending Sec. 1115 Waiver: Reasonable promptness waiver to delay coverage until the first day of the first month following receipt of the required premium (pending CMS approval of proposed premiums).
Expansion Adults (-): Pending Sec. 1115 Waiver: Disenrollment and lock-out of coverage for non-payment of premiums.
Transitional Medical Assistance Parents/Caretakers (-): Pending Sec. 1115 Waiver: Eliminate TMA coverage pathway for parents/caretakers.
Premiums for Expansion Adults above 100% FPL (New) Pending Sec. 1115 Waiver: New monthly premiums, which could be lowered under provisions of the healthy behavior incentive program.
New York
2018
Former Foster Youth (#): Eliminate coverage category for individuals under age 26 who were in foster care and on Medicaid in another state at the time they aged out of the foster care system (0 individuals in this category).
Ohio
2019
Expansion Adults (-): Pending Sec. 1115 Waiver: Work/community engagement requirement for Group VIII (expansion) MAGI adults (701,707 individuals).
Pennsylvania
2018
Children Under Age 4 (+): Continuous eligibility (7,746 children).
South Carolina
2018
Children & Pregnant Women (+): Implemented the CHIPRA option to eliminate the 5-year waiting period on Medicaid eligibility for lawfully-residing immigrant children and pregnant women.
South Dakota
2019
Adults in Minnehaha and Pennington Counties (-): Pending Sec. 1115 Waiver: Work/community engagement requirement, with offer of 12 months TMA and an additional 12 months premium assistance to individuals who continue to meet the work requirement but whose income increases above the Medicaid eligibility limit as a result of meeting the requirement (1,300 individuals).
Utah
2018
Parents & Caretakers (+): Increased the Basic Maintenance Standard to 55% FPL (3,000 individuals).
Adults (+) Approved Sec. 1115 Waiver: New eligibility group for chronically homeless, justice-involved individuals and those in need of substance abuse and/or mental health treatment, with income below 5% FPL (2,800 individuals).
Adults (-) Approved Sec. 1115 Waiver: Eliminate retroactive eligibility for Primary Care Network (PCN) adults.
Adults (+) Approved Sec. 1115 Waiver: Twelve months continuous eligibility for targeted childless adult population.
Vermont
2018
Aged & Disabled (+): Increased asset level for Working People with Disabilities program (from $5,000 to $10,000 for an individual and from $6,000 to $15,000 for a couple) (70 individuals).
Virginia
2018
Disabled (+) Approved Sec. 1115 Waiver: Increased eligibility from 80% to 100% FPL for waiver services for people with serious mental illness (GAP waiver program, full restoration to pre-2016 level) (2,000 adults with SMI).
2019
Expansion Adults (+): ACA expansion of eligibility to non-caretaker, low-income adults between 0% and 138% of FPL (400,000 individuals).
Table 3: Corrections-Related Enrollment Policies in all 50 States and DC, in Place in FY 2018 And Actions Taken in FY 2019
States
Medicaid Coverage For Inpatient Care Provided to Incarcerated Individuals
Medicaid Outreach/Assistance Strategies to Facilitate Enrollment Prior to Release^
Medicaid Eligibility Suspended Rather Than Terminated For Enrollees Who Become Incarcerated^
Jails
Prisons
Jails
Prisons
Jails
Prisons
In place FY 2018
New or Expanded FY2019
In place FY 2018
New or Expanded FY2019
In place FY 2018
New or Expanded FY2019
In place FY 2018
New or Expanded FY2019
In place FY 2018
New or Expanded FY2019
In place FY 2018
New or Expanded FY2019
Alabama
X
X
X
X
X
X
Alaska
X
X
X
X
X
X
Arizona
X
X
X
X
X
X
Arkansas
X
X
X
X
X
X
California
X
X
X
X
X
X
Colorado
X
X
X
X
X
X
Connecticut
X
X
X
X
X
X
Delaware
X
X
X
X
X*
X*
DC
X
N/A
N/A
X
X
X
N/A
N/A
Florida
X
X
Georgia
X
Hawaii
X
X
X
X
Idaho
X
X
Illinois
X
X
X
X
Indiana
X
X
X
X
X
X
Iowa
X
X
X
X
X
Kansas
X
X*
X
Kentucky
X
X
X
X
X
X
X
X
X
X
Louisiana
X
X
X*
X
X
X
Maine
X
X
X
X
Maryland
X
X
X
X
X*
X
X
Massachusetts
X
X
X
X
X
X
Michigan
X
X
X
X
X
X
Minnesota
X
X
Mississippi
X
X
X
Missouri
X
X
X
X
Montana
X
X
X
X
X
X
Nebraska
X
X
X
X
Nevada
X
X
X
X
X
New Hampshire
X
X
X
X
X
X
New Jersey
X
X
X
X
X
X
New Mexico
X
X
X
X
X
X
New York
X
X
X
X
X
X
North Carolina
X
X
North Dakota
X
X
X
Ohio
X
X
X
X
X
Oklahoma
X
Oregon
X
X
X
X
X
X
Pennsylvania
X
X
X
X
X
X
Rhode Island
X
X
X
X
X
X
South Carolina
X
X
X
X
X
X
South Dakota
X
X
X
X
Tennessee
X
X
X
X
Texas
X
X
X
X
X
Utah
X
X
X
X
X
X
Vermont
X
X
X
X
Virginia
X
X
X
X
X
X
Washington
X
X
X
X
X
X
West Virginia
X
X
X
X
X
X
Wisconsin
X
X
X
X
Wyoming
Totals
42
1
48
1
32
5
38
4
35
2
37
1
NOTES: ^States with “Medicaid outreach assistance strategies to facilitate enrollment prior to release” include those implementing a variety of strategies. In many cases, staff of the prison or jail provide most of the assistance in collaboration with the Medicaid agency. ^States that continue Medicaid eligibility for incarcerated individuals but limit covered benefits to inpatient hospitalization are also included in the count of states that suspend eligibility. “*” indicates that a policy was newly adopted in FY 2019, meaning that the state did not have any policy in that category/column in place in FY 2018.N/A: The District of Columbia has jails but no prisons (however, individuals returning to DC from federal prisons may be placed in residential re-entry centers and have the opportunity to apply for Medicaid from there in order to attain coverage for 24 hour inpatient care and to facilitate enrollment prior to release).
SOURCE: Kaiser Family Foundation Survey of Medicaid Officials in 50 states and DC conducted by Health Management Associates, October 2018.
Report: Managed Care Initiatives
Key Section Findings
Managed care is the predominant delivery system for Medicaid in most states. As of July 1, 2018, among the 39 states with comprehensive risk-based managed care organizations (MCOs), 33 states reported that 75% or more of their Medicaid beneficiaries were enrolled in MCOs, a notable increase from the 29 states reporting 75% or more as of July 1, 2017. Although many states still carve-out behavioral health services from MCO contracts, movement to carve-in these services continues – two states in FY 2018 and 11 states in FY 2019 reported BH service carve-ins or implementation of an integrated MCO arrangement. Nearly all states have managed care quality initiatives in place such as pay for performance or capitation withholds.
What to watch:
The current administration is expected to release revised Medicaid managed care regulations for public comment.
Alaska and Arkansas reported plans to implement an MCO program for the first time in FY 2019. Alaska is contracting with one MCO to serve one geographic area, and Arkansas will begin making actuarially sound “global payments” to “Provider-led Arkansas Shared Savings Entities” (PASSEs) that serve Medicaid beneficiaries who have complex behavioral health and intellectual and developmental disabilities service needs.
The 2016 Medicaid MCO rule allows states to use “in lieu of” authority to cover services for adults who receive inpatient psychiatric or SUD treatment services in an IMD for no more than 15 days in a month. In this survey, 28 of the 39 MCO states reported that they are using this authority for both FYs 2018 and 2019, and three states reported plans to begin using this authority in FY 2019. The SUPPORT Act would create a new state option from October 1, 2019 to September 30, 2023 to cover IMD services for up to 30 days in a year for individuals with an SUD and also would codify the provision allowing MCOs to offer “in lieu of” IMD coverage for up to 15 days in a month.
An increasing number of states (23 in FY 2018) set a target percentage of MCO provider payments that must be in alternative payment models (APMs), up from 13 states in FY 2017 and 5 states in FY 2016. States are also increasingly requiring MCOs to screen beneficiaries for social needs (16 states in FY 2018 and 3 additional states in FY 2019); and to provide care coordination pre-release to incarcerated individuals (6 states in FY 2018 and 2 additional states in FY 2019).
Tables 4 through 7 include more detail on the populations covered under managed care (Tables 4 and 5), behavioral health services covered under MCOs (Table 6), and managed care quality initiatives (Table 7).
NEW: 50-state Medicaid survey finds that states are increasingly relying on managed care. In 33 states of 39 states with managed care organizations (MCOs), at least 75% of all Medicaid beneficiaries are in managed care.
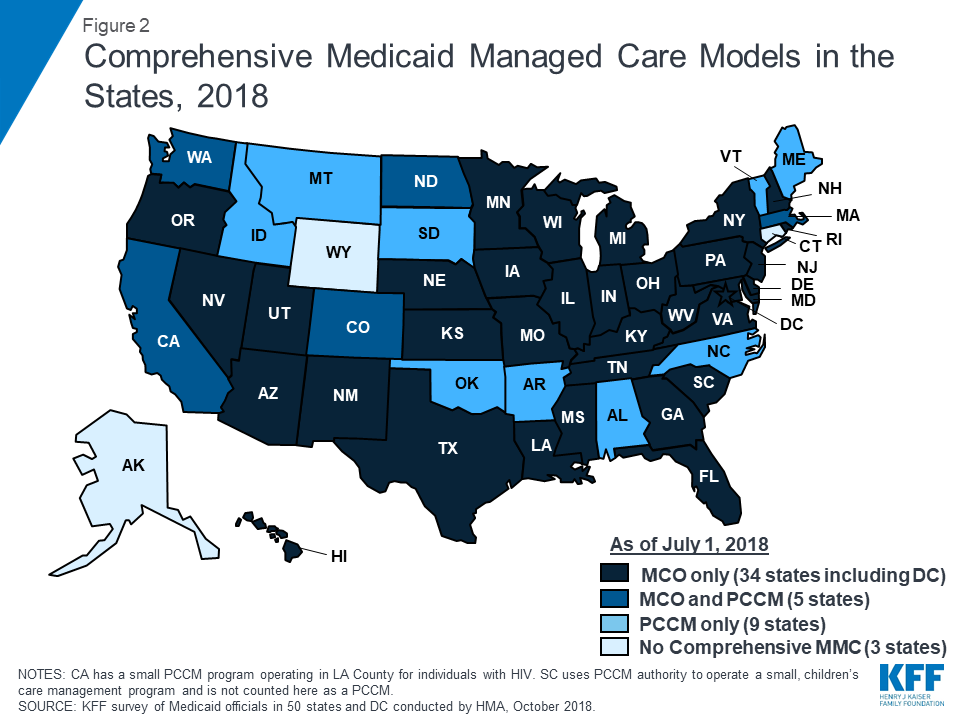
Managed care remains the predominant delivery system for Medicaid in most states. As of July 2018, all states except three – Alaska, Connecticut,27 and Wyoming – had some form of managed care in place, unchanged from July 2017. Compared to the prior year, the number of states contracting with comprehensive risk-based managed care organizations (MCOs) (39 states) also remained unchanged while two fewer states reported operating a Primary Care Case Management (PCCM) program (14 states). PCCM is a managed fee-for-service (FFS) based system in which beneficiaries are enrolled with a primary care provider who is paid a small monthly fee to provide case management services in addition to primary care.
Of the 48 states that operate some form of managed care, five operate both MCOs and a PCCM program while 34 states operate MCOs only and nine states operate PCCM programs only28 (Figure 2 and Table 4). In total, 28 states contracted with one or more PHPs to provide Medicaid benefits including, behavioral health care, dental care, vision care, non-emergency medical transportation (NEMT), or long-term services and supports (LTSS).
Figure 2: Comprehensive Medicaid Managed Care Models in the States, 2018
The current administration is expected to release revised Medicaid managed care regulations for public comment. Under the previous administration in April 2016, CMS issued a final rule on Medicaid managed care providing a framework of plan standards and requirements designed to improve the quality, performance, and accountability of these programs.29,30 The new rule represented a major revision and modernization of federal regulations in this area. The Trump Administration, however, is expected to release revised Medicaid managed care regulations before the end of CY 2018.31
In advance of releasing revised Medicaid managed care regulations, CMS released an Informational Bulletin32 in June 2017 indicating they would use “enforcement discretion” to work with states on achieving compliance with the new managed care regulations, except for specific areas that “have significant federal fiscal implications.” In this year’s survey, MCO states were asked whether they have asked CMS for flexibility in meeting managed care regulation deadlines. States answering “yes” most frequently reported requesting relief on deadlines related to member services (e.g., grievance and appeals procedures or member handbooks and enrollment requirements) and provider/network requirements (e.g., screening and enrollment of network providers or provider directory requirements).
Populations Covered by Risk-Based Managed Care
The share of Medicaid beneficiaries enrolled in MCOs has steadily increased as states have expanded their managed care programs to new regions and new populations and made MCO enrollment mandatory for additional eligibility groups. This year’s survey showed continued notable growth. Among the 39 states with MCOs, 33 states33 reported that 75% or more of their Medicaid beneficiaries were enrolled in MCOs as of July 1, 2018 (up from 29 states in last year’s survey), including nine of the ten states with the largest total Medicaid enrollment. These nine states (California, New York, Texas, Florida, Pennsylvania, Illinois, Ohio, Michigan, and Georgia) account for over half of all Medicaid beneficiaries across the country (Figure 3 and Table 4).34
Children and adults, particularly those enrolled through the ACA Medicaid expansion, are much more likely to be enrolled in an MCO than elderly Medicaid beneficiaries or persons with disabilities. Thirty-five35 of the 39 MCO states reported covering 75% or more of all children through MCOs. Of the 32 states that had implemented the ACA Medicaid expansion as of July 1, 2018, 27 were using MCOs to cover newly eligible adults.36 The large majority of these states (23 states) covered more than 75% of beneficiaries in this group through capitated managed care. New Hampshire reported that most of its ACA expansion adults are enrolled in Qualified Health Plans (with premium assistance, under Section 1115 authority) and only 20% are enrolled in MCOs.37 The state reported, however, that it will end its premium assistance waiver (as of December 31, 2018) and will transition QHP-enrolled members to MCOs. Thirty-one of the 39 MCO states reported covering 75% or more of low-income adults in pre-ACA expansion groups (e.g., parents, pregnant women) through MCOs. In contrast, the elderly and people with disabilities were the group least likely to be covered through managed care contracts, with only 20 of the 39 MCO states reporting coverage of 75% or more such enrollees through MCOs (Figure 3).
Figure 3: MCO Managed Care Penetration Rates for Select Groups of Medicaid Beneficiaries as of July 1, 2018
In states with both MCOs and PCCM programs, MCOs cover a larger share of beneficiaries than PCCM programs in a majority of these states. However, Colorado is an exception: as of July 1, 2018, a majority of Colorado’s enrollees were in the PCCM program, which is the foundation of the state’s “Accountable Care Collaboratives.”
Alaska and Arkansas reported plans to implement an MCO program for the first time in FY 2019. Alaska is contracting with one MCO to serve one geographic area that includes Anchorage and the Mat-Su Valley, and Arkansas will begin making actuarially sound “global payments” (beginning January 1, 2019) to “Provider-led Arkansas Shared Savings Entities” (PASSEs) that will serve Medicaid beneficiaries who have complex behavioral health and intellectual and developmental disabilities service needs. Only one state reported policies that reduced the state’s reliance on the MCO model of managed care: Massachusetts reported that the implementation of its Accountable Care Organization (ACO) program beginning in FY 2018 has resulted in decreased MCO enrollment as MCO enrollees may choose to enroll in ACOs instead.
Populations with Special Needs
For geographic areas where MCOs operate, this year’s survey asked MCO states whether, as of July 1, 2018, certain subpopulations with special needs were enrolled in MCOs for their acute care services on a mandatory or voluntary basis or were always excluded. This year’s survey further grouped subpopulations by dual eligible and by LTSS status (Exhibit 4 and Table 5).
Pregnant women were the group most likely to be enrolled on a mandatory basis while persons with I/DD were among the least likely to be enrolled on mandatory basis. As a group, foster children were most likely to be enrolled on a voluntary basis, although they were enrolled on a mandatory basis in a larger number of states. Among states indicating that the enrollment approach for a given group or groups varied, the location of LTSS services provided (residential versus community-based) was a frequently cited basis of variation. States with Financial Alignment Demonstrations for dual eligibles in addition to other managed care programs also often cited varying enrollment criteria for dual eligibles.
Exhibit 4: MCO Enrollment of Populations with Special Needs, July 1, 2018(# of States)
Non-Dual/Non-LTSS:
Non-Dual/Receives LTSS:
Dual Eligibles
Pregnant women
Foster children
CSHCNs
Persons with SMI/SED
Persons with I/DD
Persons w/ physical disabilities
Seniors
Always mandatory
36
22
25
23
10
17
15
11
Always voluntary
2
8
6
3
6
4
4
4
Varies
0
6
6
11
13
10
9
14
Always excluded
1
3
2
2
10
8
11
10
Notes: “CSHCNs” – children with special health care needs, “SMI/SED” – persons with serious mental illness or serious emotional disturbance, “I/DD” – persons with intellectual and developmental disabilities.
Acute Care Managed Care Population Changes
In both FY 2018 and FY 2019, only a few states reported actions to increase enrollment in acute care managed care, reflecting full or nearly full MCO saturation in most MCO states. As described above, Alaska and Arkansas reported plans to implement an MCO program for the first time in FY 2019. Of the 39 states with MCOs already in place as of July 1, 2018, five states in FY 2018 and five states in FY 2019 indicated that they made specific policy changes to increase the number of enrollees in MCOs through geographic expansion, voluntary or mandatory enrollment of new groups into MCOs, or mandatory enrollment of specific eligibility groups that were formerly enrolled on a voluntary basis (Exhibit 5). Thirty-seven states reported that acute care MCOs were operating statewide as of July 2018, including Illinois, which expanded MCOs statewide in FY 2018. The remaining two MCO states without statewide programs (Colorado and Nevada) did not report a geographic expansion planned for FY 2019.
Exhibit 5: Medicaid Acute Care Managed Care Population Expansions, FY 2018 and FY 2019
FY 2018
FY 2019
Geographic Expansions
IL
—
New Population Groups Added
PA, TX, VA
IL, NH, OH, PA, VA
Voluntary to Mandatory Enrollment
WI
—
Implementing an MCO program for the first time
—
AK, AR
Two notable acute care MCO expansions relate to programs that combine both acute care and LTSS:
In January 2018, Pennsylvania began to phase-in its Community HealthChoices (CHC) program which provides both physical health and long-term services and supports through newly contracted MCOs. CHC enrollees include individuals in nursing facilities (currently carved out of managed care after 30 days), full benefit dually-eligible individuals, and individuals receiving home and community-based services.
Virginia implemented its CCC Plus (Commonwealth Coordinated Care) program in FY 2018 making MCO enrollment mandatory for most LTSS populations.
In FY 2018 and FY 2019, states expanded MCO enrollment (either voluntary or mandatory) to other groups including state wards and foster children (Illinois), expansion adults transitioning from the state’s premium assistance program to MCO coverage (New Hampshire), workers with disabilities and persons receiving Specialized Recovery Services (Ohio), the Breast and Cervical Cancer and Adoption Assistance eligibility groups (Texas), and persons with third party liability coverage (Virginia).
Only one state made enrollment mandatory for a specific eligibility group that was formerly enrolled on a voluntary basis: Wisconsin made enrollment mandatory in FY 2018 for SSI adults with disabilities that do not have long-term care needs, are not enrolled in HCBS or MLTSS, are not tribal members, and are not dual eligibles.
Services Covered Under MCO Contracts
Behavioral Health Services Covered Under MCO Contracts
Although MCOs are at risk financially for providing a comprehensive set of acute care services, nearly all states exclude or “carve-out” certain services from their MCO contracts, frequently behavioral health services. States with acute care MCOs were asked to indicate whether specialty outpatient mental health (MH) services, inpatient mental health services, and outpatient and inpatient substance use disorder (SUD) services are always carved-in (i.e., virtually all services are covered by the MCO), always carved-out (to PHP or FFS), or the carve-in status varies by geographic or other factors. More than half of the 39 MCO states reported that specific behavioral health service types were carved into their MCO contracts, with specialty outpatient mental health services somewhat less likely to be carved in (Exhibit 6 and Table 6).
Exhibit 6: MCO Coverage of Behavioral Health, July 1, 2018 (# of States)
Specialty Outpatient MH*
Inpatient MH
Outpatient SUD
Inpatient SUD
Always carved-in
22
24
27
26
Always carved-out
10
7
7
6
Varies
7
8
5
7
*“Specialty outpatient mental health” services mean services used by adults with Serious Mental Illness (SMI) and/or youth with serious emotional disturbance (SED), commonly provided by specialty providers such as community mental health centers.
In FY 2018, Mississippi and South Carolina reported actions to carve behavioral health services into their MCO contracts and Washington reported implementing integrated MCO contracts in additional geographic areas.
In FY 2019, 11 states reported actions impacting the coverage of behavioral health services under MCO contracts:
Six states (Mississippi, New Jersey, New York, South Carolina, Virginia, and West Virginia) reported actions to carve behavioral health services into their MCO contracts.
Arizona and Washington reported plans to implement additional integrated MCO contracts.
Michigan reported a plan to implement pilot programs that would provide both physical and behavioral health services.
Ohio reported a full carve-in of behavioral health services as of July 1, 2018.
Arkansas reported plans to implement a new MCO program to serve beneficiaries who have complex behavioral health and intellectual and developmental disabilities needs.
Institutions for Mental Disease (IMD) “In Lieu OF” Rule
The 2016 Medicaid Managed Care Final Rule38 allows states (under the authority for health plans to cover services “in lieu of” those available under the Medicaid state plan), to receive federal matching funds for capitation payments on behalf of adults who receive inpatient psychiatric or substance use disorder (SUD) treatment or crisis residential services in an IMD for no more than 15 days in a month.39 States were asked whether or not they planned to use this new authority. Of the 39 states with MCOs as of July 1, 2018, 28 states answered “yes” for both FYs 2018 and 2019; three states reported plans to begin using this authority in FY 2019; and five states answered “no.”40 Also, North Carolina reported using “in lieu of” authority in its PHP contract and Arkansas reported plans to use this authority when it launches its new MCO program in January 2019. At the time this report was being finalized, however, the SUPPORT Act41 was expected to be signed into law creating a new state option from October 1, 2019 to September 30, 2023 to cover IMD services for up to 30 days in a year for individuals with an SUD. The SUPPORT Act also codified the 2016 Medicaid Managed Care Final Rule provision allowing MCOs to offer “in lieu of” IMD coverage for up to 15 days in a month.
Additional Services
Thirty-seven states with MCO contracts as of July 1, 2018, reported that MCO plans in their states may offer a range of services beyond those described in the state plan or waivers. The most common additional services reported were limited or enhanced adult dental services beyond contractually required state plan benefits, enhanced vision services for adults, and enhanced transportation services. Other value-added services reported included enhanced care coordination, wellness incentives, waiving co-payments, routine or school/sports physicals, and diabetic, weight-loss, tobacco cessation, and chiropractic services. Several states noted that MCOs offer services that address social determinants of health, including GED coaching, housing support, mother and baby supports, educational services and food access services. Others reported offering services/items to promote safety, including helmets and infant car seats.
Managed Care (Acute and LTSS) Quality, Contract Requirements, and Administration
Quality Initiatives
Over time, the expansion of comprehensive risk-based managed care in Medicaid has been accompanied by greater attention to measuring quality and plan performance and, increasingly, to measuring health outcomes. After years of comprehensive risk-based managed care experience within the Medicaid program, many states now incorporate quality into the procurement process, as well as into ongoing program monitoring.42
States procure MCO contracts using different approaches; however, most states use competitive bidding, in part because the dollar value is so large. Under these procurements, states can specify requirements and criteria that go beyond price, and may expect plans to compete on the basis of value-based payment arrangements with network providers, specific policy priorities such as improving birth outcomes, strategies to address social determinants of health, and/or other specific performance and quality criteria. In this year’s survey, states were asked if they used, or planned to use, the National Committee for Quality Assurance’s (NCQA’s) Healthcare Effectiveness Data and Information Set (HEDIS®) scores as criteria for selecting MCOs. Of the 39 states with MCOs, 14 indicated that they use or plan to use HEDIS scores as criteria for selecting MCOs.
Nearly all MCO states (35 states) reported using at least one select Medicaid managed care quality initiative in FY 2018 (Figure 4 and Table 7). States were asked to indicate whether they had specific managed care quality strategies (acute and/or MLTSS) in place in FY 2018 and to identify newly added or expanded initiatives for FY 2019. More than three quarters of MCO states reported having initiatives in place in FY 2018 that make MCO comparison data publicly available. More than half of MCO states reported capitation withhold arrangements and/or pay for performance incentives in FY 2018. Fewer states reported use of an auto-assignment algorithm that includes quality performance measures.
In FY 2019, 17 MCO states expect to implement new or expanded quality initiatives (Figure 4). The predominance of states reporting new or expanded activity in FY 2019 reported activity related to enhancing/expanding existing initiatives. However, two states reported new initiatives. Utah is planning to create a public facing dashboard for its acute care MCOs to make comparison data publicly available in FY 2019 and Louisiana is planning to add quality as a component to its auto-assignment algorithm for acute care contracts in calendar year 2019 (Table 7).
Federal regulations mandate that states must require, under contracts starting on or after July 1, 2017, each MCO or PHP to establish and implement an ongoing comprehensive quality assessment and performance improvement program for Medicaid services. Performance Improvement Projects (PIPs) may be designated by CMS, by states, or developed by health plans, but must be designed to achieve significant, sustainable improvement in health outcomes and enrollee satisfaction. In this year’s survey, states were asked to indicate whether they mandate MCO PIPs in a particular focus area. States reported a range of state-mandated PIP focus areas, including prenatal smoking and antipsychotic medication use in children (Kentucky), diabetes prevention and management and clinical depression screening and management (New Mexico), child health (Ohio), strengthening care coordination and encouraging transitions from nursing facilities to community care (Pennsylvania), and individuals with complex needs, especially those with comorbid anxiety and depression (Texas).
Contract Requirements
Alternative [Provider] Payment Models Within MCO Contracts
Value-based purchasing (VBP) strategies are important tools for states pursuing improved quality and outcomes and reduced costs of care within Medicaid and across payers. Generally speaking, VBP strategies include activities that hold a provider or MCO accountable for cost and quality of care.43 This often includes efforts to implement alternative payment models (APMs) which replace FFS/volume-driven provider payments with payment models that incentivize quality, coordination, and value (e.g., shared savings/shared risk arrangements and episode-based payments). Many states included a focus on adopting and promoting APMs as part of their federally-supported State Innovation Model (SIM) projects and as part of delivery system reform efforts approved under Section 1115 Medicaid waivers.44 A growing number of states are encouraging or requiring Medicaid MCOs to adopt APMs to advance VBP in Medicaid.
More than half of MCO states (23 states) identified a specific target in their MCO contracts for the percentage of provider payments, network providers, or plan members that MCOs must cover via alternative provider payment models in FY 2018 (Exhibit 7). (Only 13 states identified having a target percentage in place in FY 2017 and five states in FY 2016.) Four additional states plan to add a target percentage in FY 2019.
Exhibit 7: States that Require MCOs to Meet a Target % for Provider APMs
# of States
States
In Place FY 2018
23
AZ, CA, DC, DE, HI, IA, LA, MA, MN, MO, NE, NH, NM, NY, OH, PA, RI, SC, TN, TX, WA, WI, WV
Plan to Begin in FY 2019
4
FL, OR, UT, VA
In FY 2018, 10 states had contracts that required Medicaid MCOs to adopt specific alternative provider payment models (e.g., episode of care payments, shared savings/shared risk, etc.), while eight states had contracts that encouraged MCOs to adopt specific APMs (Exhibit 8). In FY 2019, three additional states plan to require the use of specific APMs while four additional states plan to encourage specific APMs. CMS launched a Learning and Action Network (LAN) in 2015 to encourage alignment across public and private sector payers by providing a forum for sharing best practices and developing common approaches to designing and monitoring of APMs, as well as by developing evidence on the impact of APMs.45 Several states reported use of the LAN framework in devising MCO APM requirements (see examples below).
Exhibit 8: States that Require vs. Encourage the Use of Specific APMs
FY 2018
FY 2019
Require
10 States
IA, LA, NE, NM, OH, PA, RI, TN, WA, WV
3 States
AZ, KS, MI
Encourage
8 States
DC, DE, IL, MA, NH, NY, TX, VA
4 States
NJ, OR, UT, WI
State APM Strategies for Medicaid MCO Contracts
Arizona has set value-based APM targets at 50% for acute care MCOs, 35% for LTSS MCOs, and 25% for its seriously mentally ill (SMI) integrated population. The state plans to require use of strategies in LAN-APM46 categories 3 and 4 with targets of 40% for acute care MCOs, 25% for MLTSS, and 10% for SMI plans in FY 2019.
Louisiana requires MCOs to implement APMs that fall within the LAN category 2A, 2C, 3, or 4, with an expectation that the MCO will implement one new contract in category 3 or 4 by 2019.
Massachusetts requires that 60% of enrollees are covered by APM arrangements in years 1 and 2 of the current MCO contract, with 70% of enrollees in APM arrangements by years 3 and 4.
Michigan plans to require use of the state preferred patient-centered medical home (PCMH) model in FY 2019.
New Mexico requires that MCOs implement APM arrangements that: include a quality/outcome-based bonus or withhold for a minimum of 7% of all MCO provider payments; have an upside-only shared savings arrangement or two or more bundled payments (for episodes of care) for a minimum of 10% of all MCO provider payments; and have an upside and downside risk or a full-risk global payment arrangement for at least 3% of all MCO provider payments.
Social Determinants of Health
In April 2017, the CMS Center for Medicare and Medicaid Innovation selected 32 organizations to implement and test models to support local communities in addressing the health-related social needs of Medicare and Medicaid beneficiaries, aiming to bridge the gap between clinical and community service providers. This “Accountable Health Communities” (AHC) model represents the first CMS innovation model that focuses on social determinants of health. The goal of the five-year program is to encourage innovation to deliver local solutions that improve access to community-based services.47 As part of this effort, CMS has developed an AHC Health-Related Social Needs Screening Tool. This increased attention to social determinants of health is also seen at the state level, where many states have looked to Medicaid MCOs to develop strategies to identify and address social determinants of health.
The survey found that 16 states required, while 10 states encouraged MCOs to screen enrollees for social needs and/or provide referrals to social services in FY 2018 (Exhibit 9). In FY 2019, three additional states plan to require, while six additional states plan to encourage MCOs to screen/refer enrollees for social needs in FY 2019.
Exhibit 9: States that Require vs. Encourage MCOs to Screen for Social Needs and/or Provide Referrals to Social Services
FY 2018
FY 2019
Require
16 States
CA, DC, DE, GA, IL, LA, MA, MD, MO, NE, NM, PA, RI, TN, VA, WI
State Strategies to Address Social Determinants of Health
Hawaii will require MCOs in FY 2019 to identify individuals who are chronically homeless and to develop strategies to address housing instability; the state will also offer a new MCO-delivered community-based benefit to this target population under its Section 1115 waiver.
Michigan requires MCOs to incorporate social determinants of health into their process for analyzing data to support population health management.
Missouri requires MCOs to offer local community care coordination programs that promote improved outcomes through use of a physician-directed, integrated team that also provides referrals to community and social supports. Missouri MCOs also offer members with multiple chronic conditions an opportunity to participate in primary care health homes and behavioral health homes, which provide care coordination and linkages/referrals to social supports.
Ohio is developing a uniform health risk assessment for MCOs to use that includes questions on social determinants of health.
Wisconsin requires MCOs that provide services to SSI-eligible individuals to include social needs in the member health assessment and to refer as needed for housing services, adult protective services, crisis resolution for long-term care, etc.
In response to a new survey question, three states (Iowa, Massachusetts, and New Jersey) reported that they tie MCO incentive payments or withholds to a social determinants-related measure. One state (Colorado) reports that Rocky Mountain Health Plan, which participates in the federal AHC pilot described above, will adopt a social determinant-related measure in FY 2019. In Massachusetts, the state’s approach to accountable care organizations includes shared savings and losses that they expect will also be impacted by an organization’s attention to social determinants. In addition, Massachusetts uses a social determinants of health model to risk adjust MCO capitation rates for Medicaid ACO/MCO contracts, and the state plans to have a continuous risk adjuster for Senior Care Options and One Care that will include social determinants of health in a similar manner.
Criminal Justice-Involved PopulationsEngaging Medicaid MCOs in efforts to improve continuity of care for individuals released from correctional facilities into the community is important to ensure that individuals with complex or chronic health conditions, including behavioral health needs, have an effective transition to treatment in the community. In FY 2018, six states required MCOs to provide care coordination services to at least some enrollees prior to release from incarceration, while five states encouraged MCOs to provide care coordination services prior to release. Four states intend to use contracts to require or encourage such care coordination in FY 2019 (Exhibit 10). New Mexico will move from encouraging to requiring plans to participate in care coordination to facilitate the transition of members from prisons, jails, and detention facilities into the community.
Exhibit 10: States that Require vs. Encourage MCOs to Provide Care Coordination Services to Enrollees Prior to Release from Incarceration
FY 2018
FY 2019
Require
6 States
AZ, KS, LA, OH, WA, WI
2 States
NM, VA
Encourage
5 States
CO, IA, KY, NM, PA
2 States
DE, MA
State Care Coordination Examples for Enrollees Pre-Release from Incarceration
Arizona requires MCOs to participate in “reach-in” care coordination, allowing for immediate service delivery and care coordination activity upon release from incarceration.
Louisiana specifies that individuals are eligible for at least one pre-release case management visit, conducted via teleconference with the MCO, to allow a case manager to determine post-release healthcare and other needs and to facilitate a linkage to care.
Wisconsin requires pre-release care management for individuals who require long-term services and supports to better assure smooth transitions back to the community.
Administrative Policies
Minimum Medical Loss Ratios
The Medical Loss Ratio (MLR) is the proportion of total capitation payments received by an MCO spent on clinical services and quality improvement. CMS published a final rule in 2016 that requires states to develop capitation rates for Medicaid to achieve an MLR of at least 85% in the rate year, for rating periods and contracts starting on or after July 1, 2019. States must include requirements for plans to calculate and report an MLR for contracts that take effect on or after July 1, 2017.49 This 85% minimum MLR is the same standard that applies to Medicare Advantage and private large group plans. There is no federal requirement that Medicaid plans must pay remittances to the state if they fail to meet the MLR standard, but states have discretion to require remittances.
Some states reported that their MLR requirement for acute care contracts and/or MLTSS exceeds the 85% minimum, while other states noted that they do not yet specify an MLR.50 States were asked whether they require MCOs that do not meet the minimum MLR requirement to pay remittances. Twenty states reported that they always require MCOs to pay remittances, while five states indicated they sometimes require MCOs to pay remittances (Exhibit 11).
Exhibit 11: Medicaid MCO Minimum Medical Loss Ratio (MLR) Remittance Requirements as of July 1, 2018
# of states
States
State always requiring remittance
20
CO, DE, IA, IL, IN, KY, LA, MD, MN, MO, NE, NV, NJ, NY, OR, PA, SC, VA, WA, WV
State sometimes requiring remittance
5
CA, KS, MA, MS, OH
PCCM and PHP Program Changes
Primary Care Case Management (PCCM) Program Changes
Of the 14 states with PCCM programs, two reported enacting policies to increase PCCM enrollment in FY 2018 or FY 2019. Colorado reported growth in its PCCM-based Accountable Care Collaboratives in both FY 2018 and FY 2019. Massachusetts reported that member transitions related to the implementation of its Accountable Care Organization (ACO) program in FY 2018 had the overall effect of increasing PCCM enrollment in FY 2018.
Two other states reported new PCCM programs:
Alabama reported plans for FY 2019 to replace its current PCCM program (Patient 1st) and Maternity PHP program with a new PCCM entity program (the Alabama Coordinated Health Network) that will cover care coordination services. Alabama is also planning to implement a second PCCM entity program in FY 2019 (the Alabama Integrated Care Network) that will provide enhanced case management, education, and outreach services to most LTSS recipients in both HCBS and institutional settings.
Arizona implemented an American Indian Medical Home in FY 2018 using PCCM authority and enrollment is expected to expand in FY 2019.
Four states (Idaho, Illinois, Nevada, and Vermont) reported actions to decrease enrollment in a PCCM program in FY 2018 or FY 2019. Idaho is transitioning dual eligibles from PCCM to its Medicaid-Medicare Coordinated Plan in FY 2019; Illinois reported ending its PCCM program when its MCO program was expanded statewide in FY 2018; Nevada ended its Health Care Guidance Program on June 30, 2018; and Vermont is decreasing its PCCM payment over the first half of FY 2019 and will end the payment effective January 1, 2019.
Limited-Benefit Prepaid Health Plans (PHP) Changes
In this year’s survey, the 28 states contracting with at least one PHP as of July 1, 2018, were asked to indicate whether certain services (listed in Exhibit 12 below) were provided under these arrangements. The most frequently cited services provided (of those included in the question) were outpatient mental health services (14 states), followed by outpatient substance use disorder (SUD) treatment services, non-emergency medical transportation (NEMT), and dental services (13 states each).
Exhibit 12: Services Covered Under PHP Contracts, July 1, 2018
CA, CO, HI, ID, LA, MA, MI, NC, OR, PA, TN*, UT, WA, WI
Inpatient Mental Health
12
CA, CO, HI, LA, MA, MI, NC, PA, TN*, UT, WA, WI
Outpatient SUD Treatment
13
CA, CO, ID, LA, MA, MI, NC, OR, PA, TN*, UT, WA, WI
Inpatient SUD Treatment
10
CA, CO, MA, MI, NC, PA, TN*, UT, WA, WI
Non-Emergency Medical Transportation (NEMT)
13
FL, IA, IN, KY, ME, MI, NJ, OK, RI, TN*, TX, UT, WI
Dental
13
AR, CA, IA, ID, LA, MI, NE, NV, RI, TN*, TX, UT, WI
Long-Term Services and Supports
6
ID, MI, NC, NY, TN*, WI
Vision
2
TN*, WI
* In addition to separate dental and vision PHPs, TN contracts with a non-risk PHP to provide comprehensive benefits (physical health, behavioral health and LTSS) to children who are in foster care, receive Supplemental Security Income (SSI), or receive care in certain institutional settings.
Twelve states reported implementing policies to increase PHP enrollment in FY 2018 or FY 2019. Seven states (Arkansas, Florida, Iowa, Nebraska, Nevada, Utah, and Washington) reported new or expanded dental PHPs in FY 2018 or planned for FY 2019. Other states reported the following changes: increased enrollment in its Drug Medi-Cal PHPs (California); increased enrollment in its dual eligible PHP (Idaho); implementation of a NEMT PHP (Indiana); enrollee transitions related to the implementation of its ACO initiative which increased behavioral health PHP enrollment (Massachusetts); and increased enrollment in its LTSS PHPs (New York).
Four states also reported actions that decreased PHP enrollment in FY 2018 or FY 2019. Alabama reported plans to end its maternity care PHP (when its new PCCM-entity program is implemented); Kentucky reported that it is planning to eliminate coverage under its NEMT PHP for expansion adults; Washington reported that enrollment in its behavioral health PHPs is decreasing as the state converts behavioral health PHPs to fully integrated MCO contracts in additional geographic areas; and Wyoming reported ending its PHP arrangement for children with emotional disturbance.
In this year’s survey, states with PHPs were also asked to briefly describe PHP contract quality strategies in place in FY 2018 or planned for FY 2019. Nearly two-thirds of states with PHPs reported a variety of quality strategies including tracking of HEDIS and/or other measures; requiring Performance Improvement Projects; incentive payments; withholds tied to performance measures; public reporting of performance results (e.g., report cards or dashboards); imposition of penalties or liquidated damages; and use of alternative payment methods.
Table 4: Share of the Medicaid Population Covered Under Different Delivery Systems in all 50 States and DC, as of July 1, 2018
States
Type(s) of Managed Care In Place
Share of Medicaid Population in Different Managed Care Systems
MCO
PCCM
FFS / Other
Alabama
PCCM
—
93.5%
6.5%
Alaska
FFS
—
—
100.0%
Arizona
MCO
93.0%
—
7.0%
Arkansas*
PCCM
—
NR
NR
California
MCO and PCCM*
83.0%
—
17.0%
Colorado
MCO and PCCM*
10.1%
89.9%
0.0%
Connecticut
FFS*
—
—
100.0%
Delaware
MCO
97.0%
—
3.0%
DC
MCO
77.0%
—
23.0%
Florida
MCO
92.0%
—
8.0%
Georgia
MCO
83.0%
—
17.0%
Hawaii
MCO
99.9%
—
0.1%
Idaho*
PCCM
—
92.0%
8.0%
Illinois
MCO
80.0%
—
20.0%
Indiana
MCO
84.0%
—
16.0%
Iowa
MCO
92.6%
—
7.4%
Kansas
MCO
95.0%
—
5.0%
Kentucky
MCO
91.0%
—
9.0%
Louisiana
MCO
91.2%
—
8.8%
Maine
PCCM
—
50.0%
50.0%
Maryland
MCO
86.0%
—
14.0%
Massachusetts
MCO and PCCM
43.0%
25.0%
32.0%
Michigan
MCO
77.6%
—
22.4%
Minnesota
MCO
84.0%
—
16.0%
Mississippi
MCO
65.0%
—
35.0%
Missouri
MCO
76.0%
—
24.0%
Montana
PCCM
—
73.0%
27.0%
Nebraska
MCO
99.7%
—
0.4%
Nevada
MCO
79.0%
—
21.0%
New Hampshire*
MCO
73.8%
—
3.9%
New Jersey
MCO
95.0%
—
5.0%
New Mexico
MCO
90.1%
—
9.9%
New York
MCO
77.2%
—
22.8%
North Carolina
PCCM
—
90.0%
10.0%
North Dakota
MCO* and PCCM
22.0%
NR
NR
Ohio
MCO
89.5%
—
10.5%
Oklahoma
PCCM
—
74.9%
25.1%
Oregon
MCO*
93.0%
—
7.0%
Pennsylvania
MCO
84.6%
—
15.4%
Rhode Island
MCO
91.0%
—
9.0%
South Carolina
MCO*
77.0%
—
23.0%
South Dakota
PCCM
—
80.0%
20.0%
Tennessee
MCO
100.0%
—
0.0%
Texas
MCO
94.0%
—
6.0%
Utah
MCO
80.2%
—
19.9%
Vermont
PCCM
—
63.0%
37.0%
Virginia
MCO
95.0%
—
5.0%
Washington
MCO and PCCM
92.0%
2.0%
6.0%
West Virginia
MCO
80.0%
—
20.0%
Wisconsin
MCO
67.0%
—
33.0%
Wyoming
FFS
—
—
100.0%
‘NOTES: NR – not reported. MCO refers to risk-based managed care; PCCM refers to Primary Care Case Management. FFS/Other refers to Medicaid beneficiaries who are not in MCOs or PCCM programs. *AR – Most expansion adults served by Qualified Health Plans through “Arkansas Works” premium assistance waiver. *CA – PCCM program operates in LA county for those with HIV. *CO – PCCM enrollees are part of the state’s Accountable Care Collaboratives (ACCs). *CT – Terminated its MCO contracts in 2012 and now operates its program on a fee-for-service basis using three ASO entities. *ID – The Medicaid-Medicare Coordinated Plan (MMCP) has been recategorized by CMS as an MCO but is not counted here as such since it is secondary to Medicare. *ND’s total MCO penetration rate estimated from ND DHS Quarterly Budget Insight data for quarter ending 6/30/2018. *NH – 22.3% of overall population and 77% of expansion adults are served by Qualified Health Plans under NH’s premium assistance program waiver *OR – MCO enrollees include those enrolled in the state’s Coordinated Care Organizations. *SC – Uses PCCM authority to provide care management services to approximately 200 medically complex children.
SOURCE: Kaiser Family Foundation Survey of Medicaid Officials in 50 states and DC conducted by Health Management Associates, October 2018.
Table 5: Enrollment of Special Populations Under Medicaid Managed Care Contracts for Acute Care in all 50 States and DC, as of July 1, 2018
States
Non-Dual, Non-LTSS Populations
Non-Dual LTSS populations
Duals
Pregnant Women
Foster Children
CSHCNs
Persons with SMI/SED
Persons with ID/DD
Persons w/ physical disabilities
Seniors
Alabama
—
—
—
—
—
—
Alaska
—
—
—
—
—
—
—
—
Arizona
Mandatory
Mandatory
Mandatory
Mandatory
Mandatory
Mandatory
Mandatory
Mandatory
Arkansas
—
—
—
—
—
—
—
—
California
Mandatory
Varies
Mandatory
Mandatory
Varies
Varies
Varies
Varies
Colorado
Voluntary
Voluntary
Voluntary
Voluntary
Voluntary
Voluntary
Voluntary
Voluntary
Connecticut
—
—
—
—
—
—
—
—
Delaware
Mandatory
Mandatory
Mandatory
Mandatory
Varies
Mandatory
Mandatory
Varies
DC
Mandatory
Varies
Voluntary
Varies
Excluded
Varies
Excluded
Varies
Florida
Mandatory
Mandatory
Mandatory
Mandatory
Voluntary
Mandatory
Mandatory
Mandatory
Georgia
Mandatory
Mandatory
Excluded
Excluded
Excluded
Excluded
Excluded
Excluded
Hawaii
Mandatory
Mandatory
Mandatory
Mandatory
Mandatory
Mandatory
Mandatory
Mandatory
Idaho
—
—
—
—
—
—
—
—
Illinois
Mandatory
Excluded
Varies
Varies
Varies
Varies
Varies
Varies
Indiana
Mandatory
Voluntary
Mandatory
Mandatory
Excluded
Excluded
Excluded
Excluded
Iowa
Mandatory
Mandatory
Mandatory
Mandatory
Mandatory
Mandatory
Mandatory
Mandatory
Kansas
Mandatory
Mandatory
Mandatory
Mandatory
Mandatory
Mandatory
Mandatory
Mandatory
Kentucky
Mandatory
Mandatory
Mandatory
Mandatory
Excluded
Excluded
Excluded
Varies
Louisiana
Mandatory
Mandatory
Mandatory
Varies
Varies
Varies
Varies
Excluded
Maine
—
—
—
—
—
—
—
—
Maryland
Mandatory
Mandatory
Varies
Varies
Varies
Varies
Excluded
Excluded
Massachusetts
Voluntary
Voluntary
Voluntary
Voluntary
Voluntary
Voluntary
Voluntary
Voluntary
Michigan
Mandatory
Mandatory
Mandatory
Mandatory
Varies
Varies
Varies
Voluntary
Minnesota
Mandatory
Voluntary
Voluntary
Varies
Voluntary
Voluntary
Mandatory
Varies
Mississippi
Mandatory
Voluntary
Voluntary
Varies
Excluded
Excluded
Excluded
Excluded
Missouri
Mandatory
Mandatory
Varies
Varies
Excluded
Excluded
Excluded
Excluded
Montana
—
—
—
—
—
—
—
—
Nebraska
Mandatory
Mandatory
Mandatory
Varies
Mandatory
Mandatory
Mandatory
Mandatory
Nevada
Mandatory
Voluntary
Voluntary
Voluntary
Excluded
Excluded
Excluded
Excluded
New Hampshire
Mandatory
Mandatory
Mandatory
Mandatory
Mandatory
Mandatory
Mandatory
Mandatory
New Jersey*
Mandatory
Mandatory
Mandatory
Mandatory
Varies
Mandatory
Voluntary
Mandatory
New Mexico
Mandatory
Mandatory
Mandatory
Mandatory
Mandatory
Mandatory
Mandatory
Mandatory
New York
Mandatory
Varies
Mandatory
Mandatory
Excluded
Mandatory
Mandatory
Excluded
North Carolina
—
—
—
—
—
—
—
—
North Dakota
Excluded
Excluded
Excluded
Excluded
Excluded
Excluded
Excluded
Excluded
Ohio
Mandatory
Mandatory
Mandatory
Mandatory
Varies
Varies
Varies
Varies
Oklahoma
—
—
—
—
—
—
—
—
Oregon
Mandatory
Varies
Mandatory
Mandatory
Varies
Mandatory
Mandatory
Voluntary
Pennsylvania
Mandatory
Mandatory
Mandatory
Mandatory
Varies
Varies
Varies
Varies
Rhode Island
Mandatory
Mandatory
Mandatory
Mandatory
Voluntary
Voluntary
Voluntary
Varies
South Carolina
Mandatory
Voluntary
Varies
Varies
Varies
Varies
Excluded
Varies
South Dakota
—
—
—
—
—
—
—
—
Tennessee
Mandatory
Mandatory
Mandatory
Mandatory
Mandatory
Mandatory
Mandatory
Mandatory
Texas
Mandatory
Mandatory
Mandatory
Mandatory
Mandatory
Mandatory
Mandatory
Varies
Utah
Mandatory
Varies
Mandatory
Mandatory
Varies
Varies
Varies
Varies
Vermont
—
—
—
—
—
—
—
—
Virginia
Mandatory
Mandatory
Mandatory
Mandatory
Mandatory
Mandatory
Mandatory
Mandatory
Washington
Mandatory
Voluntary
Mandatory
Mandatory
Varies
Mandatory
Varies
Varies
West Virginia
Mandatory
Excluded
Varies
Varies
Excluded
Excluded
Excluded
Excluded
Wisconsin
Mandatory
Varies
Varies
Varies
Voluntary
Mandatory
Varies
Varies
Wyoming
—
—
—
—
—
—
—
—
Mandatory
36
22
25
23
10
17
15
11
Voluntary
2
8
6
3
6
4
4
4
Varies
0
6
6
11
13
10
9
14
Excluded
1
3
2
2
10
8
11
10
‘NOTES: “–” indicates there were no MCOs operating in that state’s Medicaid program as of July 1, 2018. I/DD – intellectual and developmental disabilities, CSHCN – Children with special health care needs, SMI – Serious Mental Illness, SED – Serious Emotional Disturbance. States were asked to indicate for each group if enrollment in MCOs is “Mandatory,” “Voluntary,” “Varies,” or if the group is “Excluded” from MCOs as of July 1, 2018. *NJ: Nursing facility residents as of July 1, 2014 were grandfathered and remain excluded from MCO enrollment unless they experience a change in eligibility status or are discharged from the nursing facility.
SOURCE: Kaiser Family Foundation Survey of Medicaid Officials in 50 states and DC conducted by Health Management Associates, October 2018.
Table 6: Behavioral Health Services Covered Under Acute Care MCO Contracts in all 50 States and DC, as of July 1, 2018
States
Specialty OP Mental Health
Inpatient Mental Health
Outpatient SUD
Inpatient SUD
Alabama
—
—
—
—
Alaska
—
—
—
—
Arizona
Varies
Varies
Varies
Varies
Arkansas
—
—
—
—
California
Always Carved-out
Always Carved-out
Always Carved-out
Always Carved-out
Colorado
Always Carved-out
Always Carved-out
Always Carved-out
Always Carved-out
Connecticut
—
—
—
—
DC
Varies
Varies
Always Carved-in
Always Carved-in
Delaware
Always Carved-out
Always Carved-in
Always Carved-out
Always Carved-in
Florida
Always Carved-in
Always Carved-in
Always Carved-in
Always Carved-in
Georgia
Always Carved-in
Always Carved-in
Always Carved-in
Always Carved-in
Hawaii
Always Carved-out
Always Carved-out
Always Carved-in
Always Carved-in
Idaho
—
—
—
—
Illinois
Always Carved-in
Always Carved-in
Always Carved-in
Always Carved-in
Indiana
Varies
Always Carved-in
Always Carved-in
Always Carved-in
Iowa
Always Carved-in
Always Carved-in
Always Carved-in
Always Carved-in
Kansas
Always Carved-in
Always Carved-in
Always Carved-in
Always Carved-in
Kentucky
Always Carved-in
Always Carved-in
Always Carved-in
Always Carved-in
Louisiana
Always Carved-in
Always Carved-in
Always Carved-in
Always Carved-in
Maine
—
—
—
—
Maryland
Always Carved-out
Always Carved-out
Always Carved-out
Always Carved-out
Massachusetts
Always Carved-in
Always Carved-in
Always Carved-in
Always Carved-in
Michigan
Always Carved-out
Always Carved-out
Always Carved-out
Always Carved-out
Minnesota
Always Carved-in
Always Carved-in
Always Carved-in
Always Carved-in
Mississippi
Always Carved-in
Always Carved-in
Varies
Varies
Missouri
Always Carved-out
Varies
Varies
Varies
Montana
—
—
—
—
Nebraska
Always Carved-in
Always Carved-in
Always Carved-in
Always Carved-in
Nevada
Always Carved-in
Always Carved-in
Always Carved-in
Always Carved-in
New Hampshire
Always Carved-in
Always Carved-in
Always Carved-in
Always Carved-in
New Jersey
Varies
Varies
Varies
Varies
New Mexico
Always Carved-in
Always Carved-in
Always Carved-in
Always Carved-in
New York
Always Carved-in
Always Carved-in
Always Carved-in
Always Carved-in
North Carolina
—
—
—
—
North Dakota
Always Carved-in
Always Carved-in
Always Carved-in
Always Carved-in
Ohio
Always Carved-in
Always Carved-in
Always Carved-in
Always Carved-in
Oklahoma
—
—
—
—
Oregon
Always Carved-in
Always Carved-in
Always Carved-in
Always Carved-in
Pennsylvania
Always Carved-out
Always Carved-out
Always Carved-out
Always Carved-out
Rhode Island
Always Carved-in
Always Carved-in
Always Carved-in
Always Carved-in
South Carolina
Always Carved-in
Varies
Always Carved-in
Always Carved-in
South Dakota
—
—
—
—
Tennessee
Always Carved-in
Always Carved-in
Always Carved-in
Always Carved-in
Texas
Varies
Always Carved-in
Always Carved-in
Always Carved-in
Utah
Always Carved-out
Always Carved-out
Always Carved-out
Always Carved-out
Vermont
—
—
—
—
Virginia
Always Carved-out
Varies
Always Carved-in
Varies
Washington
Varies
Varies
Varies
Varies
West Virginia
Always Carved-in
Varies
Always Carved-in
Varies
Wisconsin
Varies
Always Carved-in
Always Carved-in
Always Carved-in
Wyoming
—
—
—
—
Always Carved-in
22
24
27
26
Always Carved-out
10
7
7
6
Varies
7
8
5
7
NOTES: OP – Outpatient. SUD – Substance Use Disorder. “–” indicates there were no MCOs operating in that state’s Medicaid program in July 2018. For beneficiaries enrolled in an MCO for acute care benefits, states were asked to indicate whether these benefits are always carved-in (meaning virtually all services are covered by the MCO), always carved-out (to PHP or FFS), or whether the carve-in varies (by geography or other factor). “Specialty outpatient mental health” refers to services utilized by adults with Serious Mental Illness (SMI) and/or youth with serious emotional disturbance (SED) commonly provided by specialty providers such as community mental health centers.
SOURCE: Kaiser Family Foundation Survey of Medicaid Officials in 50 states and DC conducted by Health Management Associates, October 2018.
Table 7: Select Medicaid Managed Care Quality Initiatives in all 50 States and DC, In Place in FY 2018 and Actions Taken in FY 2019
States
Pay for Performance/Performance Bonus
Capitation Withhold
Auto-Assignment Algorithm Includes Quality Performance Measures
Publicly Available Comparison Data About MCOs
Any Select Quality Initiatives
In PlaceFY 2018
New or ExpandedFY 2019
In PlaceFY 2018
New or ExpandedFY 2019
In PlaceFY 2018
New or ExpandedFY 2019
In PlaceFY 2018
New or ExpandedFY 2019
In PlaceFY 2018
New or ExpandedFY 2019
Alabama
Alaska
Arizona
X
X
X
Arkansas
California
X
X
X
X
Colorado
X
X
X
Connecticut
DC
X
X
X
X
X
X
Delaware
X
X
X
X
Florida
X
X
X
X
X
X
Georgia
X
X
Hawaii
X
X
X
X
X
X
X
Idaho
Illinois
X
X
X
X
Indiana
X
X
X
Iowa
X
X
X
X
X
X
X
Kansas
X
X
X
X
X
X
Kentucky
X
X
Louisiana
X
X*
X
X
X
Maine
Maryland
X
X
X
X
X
X
Massachusetts
X
X
X
X
X
X
Michigan
X
X
X
X
X
Minnesota
X
X
X
Mississippi
Missouri
X
X
X
X
X
X
Montana
Nebraska
X
X
X
Nevada
X
X
X*
X
X
X
New Hampshire
X
X
New Jersey
X
X
X
X
X
X
New Mexico
X
X
X
New York
X
X
X
North Carolina
North Dakota
Ohio
X
X
X
X
X
X
X
Oklahoma
Oregon
X
X
X
Pennsylvania
X
X
X
X
X
Rhode Island
X
X
X
X
X
X
South Carolina
X
X
X
X
X
South Dakota
Tennessee
X
X
X
X
Texas
X
X
X
X
Utah
X*
X
Vermont
Virginia
X
X
X
X
X
X
Washington
X
X
X
X
X
X
West Virginia
Wisconsin
X
X
X
X
Wyoming
Totals
25
6
26
6
9
2
31
6
35
17
NOTES: States with MCO contracts were asked to report if select quality initiatives were included in contracts in FY 2018, or are new or expanded in FY 2019. The table above does not reflect all quality initiatives states have included as part of MCO contracts. “*” indicates that a policy was newly adopted in FY 2019, meaning that the state did not have any policy in that category/column in place in FY 2018.
SOURCE: Kaiser Family Foundation Survey of Medicaid Officials in 50 states and DC conducted by Health Management Associates, October 2018.
Report: Emerging Delivery System And Payment Reforms
Key Section Findings
Medicaid programs have been expanding their use of other service delivery and payment reform models to achieve better outcomes and lower costs. Forty-three states have one or more delivery system or payment reform initiatives in place in FY 2018 (e.g., patient-centered medical home (PCMH), ACA Health Home, accountable care organization (ACO), episode of care payment, or delivery system reform incentive program (DSRIP)).
What to watch:
About one-third of the states reported a wide variety of initiatives implemented in FY 2018 or planned for FY 2019 that address the social determinants of health (SDOH) outside of managed care and more than one-third reported collecting or plans to collect SDOH data from various sources including screenings and assessments, data collected for other state programs, claims data, beneficiary surveys, or as part of a care management or home visiting program.
Nearly three-quarters of the states reported broader initiatives to expand access to mental health or SUD services in FY 2018 or FY 2019, however, the most common element is to expand coverage for mental health or SUD services (especially IMD services).
Table 8 contains more detailed information on emerging delivery system and payment reform initiatives in place in FY 2018 and new or expanded initiatives in FY 2019.
Over three-quarters of all state Medicaid programs (43 states) had at least one of the specified delivery system or payment reform models in place in FY 2018, a modest increase over the 40 states reporting at least one model in place in 2017 (Figure 5 and Table 8). This year’s survey asked states whether certain delivery system and payment reform models (defined in the box below) designed to improve health outcomes and constrain cost growth were in place in FY 2018, and whether they planned to adopt or enhance these models in FY 2019. For FY 2019, 19 states (all states with at least one model already in place) reported plans to adopt or expand one or more of the models to reward quality and encourage integrated care. Key initiatives include patient-centered medical homes (PCMHs), ACA Health Homes, and Accountable Care Organizations (ACOs).
Figure 5: State Delivery System Reform Activity, FYs 2018-2019
Delivery System Reform Initiatives Defined
Patient-Centered Medical Home (PCMH). Under a PCMH model, a physician-led, multi-disciplinary care team holistically manages the patient’s ongoing care, including recommended preventive services, care for chronic conditions, and access to social services and supports. Generally, providers or provider organizations that operate as a PCMH seek recognition from organizations like the National Committee for Quality Assurance (NCQA).52 PCMHs are often paid (by state Medicaid agencies directly or through MCO contracts) a per member per month (PMPM) fee in addition to regular FFS payments for their Medicaid patients.
ACA Health Home. The ACA Health Homes option, created under Section 2703 of the ACA, builds on the PCMH concept. By design, Health Homes must target beneficiaries who have at least two chronic conditions (or one and risk of a second, or a serious and persistent mental health condition), and provide a person-centered system of care that facilitates access to and coordination of the full array of primary and acute physical health services, behavioral health care, and social and long-term services and supports. This includes services such as comprehensive care management, referrals to community and social support services, and the use of health information technology (HIT) to link services, among others. States receive a 90% federal match rate for qualified Health Home service expenditures for the first eight quarters under each Health Home State Plan Amendment; states can (and have) created more than one Health Home program to target different populations.53
Accountable Care Organization (ACO). While there is no uniform, commonly accepted federal definition of an ACO, an ACO generally refers to a group of health care providers or, in some cases, a regional entity that contracts with providers and/or health plans, that agrees to share responsibility for the health care delivery and outcomes for a defined population.54 An ACO that meets quality performance standards that have been set by the payer and achieves savings relative to a benchmark can share in the savings. States use different terminology in referring to their Medicaid ACO initiatives, such as Regional Care Collaborative Organizations (RCCOs) in Colorado55 and Accountable Entities in Rhode Island.
Episode of Care Initiatives. Unlike FFS reimbursement, where providers are paid separately for each service, or capitation, where a health plan receives a PMPM payment for each enrollee intended to cover the costs for all covered services, episode-of-care payment provides a set dollar amount for the care a patient receives in connection with a defined condition or health event (e.g., heart attack or knee replacement). Episode-based payments usually involve payment for multiple services and providers, creating a financial incentive for physicians, hospitals, and other providers to work together to improve patient care and manage costs.
Delivery System Reform Incentive Payment (DSRIP) Programs. DSRIP initiatives,56 which emerged under the Obama administration, provide states with significant federal funding to support hospitals and other providers in changing how they provide care to Medicaid beneficiaries.[endnote 375783-11] DSRIP initiatives link funding for eligible providers to process and performance metrics. Although some states may be interested in developing new DSRIP initiatives, the Trump administration has not indicated an intent to use this tool to advance delivery system reform.
PCMH and Health Home initiatives were the most common delivery system reform initiatives in place in states in FY 2018 (Table 8). PCMH initiatives operated in over half (29 states) of Medicaid programs in FY 2018. Nine states reported plans to expand or enhance existing PCMH programs in FY 2019, often citing increased provider participation. Over one-third of states (22 states) had at least one Health Home initiative in place in FY 2018. Six states reported plans to adopt and two states reported plans to expand Health Homes in FY 2019. One state (Alabama) reported that its PCMH and Health Home programs would end in FY 2019 when its new PCCM-entity program is implemented.
About a quarter of states had ACO initiatives in place and fewer states have episode of care initiatives in place in FY 2018 (Table 8). Fourteen states reported having ACOs in place for at least some of their Medicaid beneficiaries in FY 2018.57 Six states reported plans to expand an existing initiative in FY 2019. Six states reported that they had episode-of-care payment initiatives in place in FY 2018, unchanged from 2017. Three of these states also reported planned expansions of these initiatives in FY 2019. Idaho reported plans to implement a new episode-of-care payment related to births in FY 2019.
State Delivery System Reform Examples
Montana reported plans to add an additional tier level for complex patients that require in-home visits to its PCMH program in FY 2019.
Michigan reported that a new opioid Health Home is planned for FY 2019.
Massachusetts reported that its ACO pilot program expanded statewide with over 870,000 of the state’s 1.2 million enrollees transferred to ACOs as of March 1, 2018. Massachusetts employs three different ACO models: an ACO/MCO partnership model; an ACO contracting directly with the state (without an MCO partner); and an exclusively MCO administered model (currently one small plan).
RhodeIsland reported that its “Accountable Entity” program, administered in partnership with its existing MCOs, continues to expand.
Ten states reported DSRIP initiatives in place in FY 2018, unchanged from FY 2017 (Table 8). DSRIP initiatives, which emerged under the Obama administration, have provided states with significant federal funding to support hospitals and other providers in changing how they provide care to Medicaid beneficiaries. No states reported expansions or enhancements to existing initiatives or reported new DSRIP initiatives planned for FY 2019. One state (Kansas) reported that its DSRIP program would end in FY 2019. These initiatives were not intended to be permanent and the Trump administration has not signaled an intent to promote these initiatives going forward.
OTHER INITIATIVES
All-payer claims database (APCD) systems are large-scale databases that systematically collect medical claims, pharmacy claims, dental claims (typically, but not always), and eligibility and provider files from both private and public payers. APCDs can be used to help identify areas to focus reform efforts and for other purposes. Seventeen states reported having an APCD in place. Two states (Florida and New York) reported that their APCD would be expanded in FY 2019 and four states (Alaska, Connecticut, Delaware, and Hawaii) reported plans for new APCDs in FY 2019.
In addition to the initiatives discussed above, states mentioned a variety of other delivery system and payment reform initiatives (not counted in the totals for Figure 5 and Table 8), including value-based purchasing initiatives, pay for performance payments, or other incentive arrangements targeted at hospitals, nursing facilities, federally qualified health centers (FQHCs), or other provider types. Examples of other initiatives reported include the following: Alaska is contracting with a health system in FY 2019 to provide case management services on a non-risk basis; Maryland reported on its recently approved Total Cost of Care All-Payer Model (an expansion of the existing all-payer model for hospital services) that will take effect in January 2019; Michigan reported on its Direct Primary Care Pilot that began August 1, 2018 (providing same or next business day primary care appointments for a fixed monthly fee); Rhode Island reported plans to implement a bundled payment for mental health and SUD crisis stabilization services limited to state certified providers; and Wyoming reported on its plans to implement a super-utilizer program targeted at high-cost, high-risk adults.
States with significant populations and/or services delivered outside of contracted MCO arrangements also reported on a wide range of non-MCO quality activities including collection of HEDIS data and other performance measures, conducting beneficiary satisfaction (CAHPS58 ) surveys, collecting LTSS measures, conducting performance improvement projects, public reporting quality data, and taking steps to expand the use of health information technology and health information exchange. One state (Connecticut) with a comprehensive quality strategy for its managed fee-for-service delivery system approach is highlighted below.
Connecticut operates a self-insured, managed fee-for-service model, contracting with three Administrative Service Organizations (ASOs) that focus, respectively, on medical, behavioral health, and dental services. The state withholds a percentage of the ASO administration fees on a rolling basis in consideration of performance on a range of indicators related to member health outcomes and member and provider satisfaction. The medical ASO monitors a broad range of HEDIS and hybrid measures, administers CAHPS through a subcontractor, employs the Johns Hopkins CareAnalyzer tool and a fully integrated statewide claims data set to do predictive modeling, risk stratification, and other quality activities, and conducts mystery shopper and other analyses of access and provider capacity. The state pushes considerable claims data, some clinical data, and admission, discharge, or transfer (ADT) data through a portal to PCMH practices, which they use in support of interventions for their panels. Finally, the medical ASO produces an annual provider practice profile report for each provider that details their performance, in context of peers.
STATE initiatives to address social Determinants of Health
In addition to imposing requirements on MCOs to screen enrollees for social needs and make referrals to other services, many states have initiatives outside of their MCO programs to address one or more of their enrollees’ social determinants of health (SDOH), such as food insecurity, housing, employment, or education. In this year’s survey, states were asked to briefly describe any initiatives implemented in FY 2018 or planned for FY 2019 that address SDOH outside of managed care and/or the housing supports discussed in the “Long-Term Services and Supports” section below.
About one-third of the states described a wide variety of initiatives including case management strategies that include the identification of social factors and appropriate referrals; initiatives that employ community health workers; and participation in the CMS Accountable Health Communities grant program. Other examples of initiatives reported for non-MCO populations include the following: Colorado reported plans to implement multiple SDOH initiatives in FY 2019, mostly through its Regional Accountable Entities that are responsible for collaborating with community-based organizations and promoting member engagement with SNAP, WIC, and other local programs; DC reported that it is working with its NEMT provider to promote the increased use of transportation benefits for fee-for-service beneficiaries in order to alleviate challenges with transport to urgent care and primary care; Maine reported that employment is a focus area for its behavioral health homes; and Massachusetts is seeking federal approval to allow its ACOs to use “flex funds” (under DSRIP expenditure authority) to pay for certain health-related social services.
Colorado Opportunity Framework
The Colorado Opportunity Framework is a life stage, indicator-based framework designed to develop a health care delivery system that incorporates key SDOH. The Framework separates the human life cycle into 9 stages and tracks over 27 unique metrics from 12 sources including Medicaid claims data, the Behavioral Risk Factor Surveillance System (BRFSS), Public Health and State Education data sets, and other population surveys. Colorado will be collecting data on these metrics on an ongoing basis, as well as data on a set of public reporting measures that include a number of SDOH such as high school graduation rates and math and reading testing scores.
States were also asked if the Medicaid agency collected SDOH-related data for enrollees and, if so, how that data was used. Over one-third of states, including both MCO and non-MCO states, reported that SDOH data was collected as of FY 2018 or would be collected beginning in FY 2019. These states reported a variety of SDOH data sources including screenings or assessments at the time of or following the eligibility determination process, data collected for other state programs, data derived from claims or encounter data, beneficiary surveys, information collected as a part of a care management or home visiting program, and other data submitted by providers. The most common uses reported for this data were to inform care coordination or care management, for quality improvement initiatives, and for performance measurement. Other uses mentioned included rate setting, to fulfill federal reporting requirements, and to make referrals.
Several states also reported providing or plans to provide fee-for-service care coordination services to incarcerated persons prior to release. For example, Colorado reported that its Regional Accountable Entities were encouraged, but not required, to provide pre-release care coordination services; Connecticut connects incarcerated individuals, pre-release, with the state’s medical Administrative Services Organization (ASO) to help smooth the transition to community-based medical services; and Kentucky reported plans for a care coordination pilot program targeting incarcerated individuals with SMI.
Access Improvement Focus Areas
This year’s survey included additional questions for states with initiatives to increase access to care in rural areas and to increase access to mental health and SUD services. States were asked to briefly describe initiatives implemented in FY 2018 or planned for FY 2019.
Improving Access to Care in Rural Areas
Medicaid is a vital source of health care coverage in rural areas and small towns that tend to have lower household incomes, lower rates of workforce participation, and higher rates of disability compared to the rest of the nation.59 Nearly half of states reported a variety of new or expanded initiatives to improve access to care in rural areas implemented in FY 2018 or FY 2019. The most frequently mentioned type of initiative related to telehealth, including e-Consult, telemedicine, tele-monitoring, and Project ECHO60 programs. Strategies mentioned by at least two states included funding increases for rural providers, expanded SUD treatment services in rural areas, expanded funding for primary care residency programs, and participation in multi-payer initiatives that promote rural access to care.
Improving Access to Mental Health and SUD Services
Nearly three-quarters of states reported initiatives to expand access to mental health (MH) or SUD services in FY 2018 or FY 2019 (MH/SUD policy changes that expand access are also discussed in the “Eligibility and Premiums” and “Benefits and Copayments” sections of this report). The most commonly reported actions were seeking waiver authority to expand coverage of services provided in an Institute for Mental Disease (IMD) and adding coverage for new MH or SUD services, often under waiver authority. Several states also reported delivery system reforms expected to improve access, such as adoption of the Hub & Spoke model, MCO integration efforts and establishment of mental health and SUD Health Homes.61
Other initiatives reported included access-related incentive payments; allowing up to 5% of the cost of MCO behavioral health-related “community investments” to be counted as benefit expenditures rather than administrative costs; promoting the use of the SBIRT (Screening, Brief Intervention, and Referral to Treatment) tool in physician offices, FQHCs, and intake areas of institutional settings; participating in the CMS Innovation Accelerator Program, the Opioid Data Analytic Cohort; participating in a state SUD Treatment and Reentry Center Project for offenders; eliminating copays for pharmacy SUD treatment services; and geographically expanding an HCBS program for persons with severe disabling mental illness.
Table 8: Select Delivery System and Payment Reform Initiatives in all 50 States and DC, In Place in FY 2018 and Actions Taken in FY 2019
States
Patient-Centered Medical Homes(PCMH)
ACA Health Homes
Accountable Care Organizations (ACO)
Episode of Care Payments
Delivery System Reform Incentive Payment Program(DSRIP)
Any Delivery System or Payment Reform Initiatives
In Place FY 2018
New/ Expand FY 2019
In Place FY 2018
New/ Expand FY 2019
In Place FY 2018
New/ Expand FY 2019
In Place FY 2018
New/ Expand FY 2019
In Place FY 2018
New/ Expand FY 2019
In place FY 2018
New/ Expand FY 2019
Alabama
X
X
X
Alaska
Arizona
X
X
Arkansas
X
X
X
California
X*
X
X
X
Colorado
X
X
X
X
X
X
Connecticut
X
X
X
X
X
X
Delaware
DC
X
X
Florida
X
X
X
X
Georgia
X
X
Hawaii
Idaho
X
X
X*
X
X
Illinois
X
X*
X
X
Indiana
Iowa
X
X
X
Kansas
X*
X
X
X
Kentucky
Louisiana
X
X
Maine
X
X
X
Maryland
X
X
Massachusetts
X
X
X
X
X
Michigan
X
X
X
X
X
Minnesota
X
X
X
X
Mississippi
Missouri
X
X
X
X
Montana
X
X
X
X
Nebraska
X
X*
X
X
X
Nevada
X
X
New Hampshire
X
X
New Jersey
X
X
X
X
New Mexico
X
X
X
X
X
X
X
X
New York
X
X
X
X
X
X
X
X
X
X
North Carolina
X
X
X
North Dakota
Ohio
X
X
X
X
X
X
X
X
Oklahoma
X
X
X
Oregon
X
X
Pennsylvania
X
X
X
X
X
X
X
Rhode Island
X
X
X
X
X
X
South Carolina
X
X
South Dakota
X
X
Tennessee
X
X
X
X
X
X
Texas
X
X
X
Utah
Vermont
X
X
X
X
X
X
Virginia
X
X
Washington
X
X
X
West Virginia
X
X
Wisconsin
X
X
X
Wyoming
X
X
X
X
Totals
29
9
22
8
14
6
6
4
10
0
43
19
NOTES: Expansions of existing initiatives include rollouts of existing initiatives to new areas or groups and significant increases in enrollment or providers. “*” indicates that a policy was newly adopted in FY 2019, meaning that the state did not have any policy in that category/column in place in FY 2018.
SOURCE: Kaiser Family Foundation Survey of Medicaid Officials in 50 states and DC conducted by Health Management Associates, October 2018.
Report: Long-term Services And Supports Reforms
Key Section Findings
Nearly all states in FY 2018 (46 states) and FY 2019 (48 states) are employing one or more strategies to expand the number of people served in home and community-based settings. A majority of states continue to report using HCBS waivers and/or state plan options (i.e., 1915(c), 1115, 1915(i), and 1915(k)) to serve more individuals in the community. As of July 1, 2018, 24 states covered LTSS through one or more capitated managed care arrangements.
What to watch:
States continue to report challenges finding and retaining LTSS direct care workers. Fifteen states raised wages for direct care workers in FY 2018 and 24 states report wage increases in FY 2019.
Housing supports remain an important part of state LTSS benefits, even as Money Follow the Person (MFP) grant funds expire. Thirty states reported that they expect to continue to offer housing-related supports even after MFP funds are exhausted. However, about half of the states reported plans to discontinue at least some housing-related services or administrative functions when MFP ends.
Pennsylvania introduced MLTSS in FY 2018, with a plan to phase-in statewide over time. Virginia ended its Financial Alignment Demonstration (FAD) but adopted statewide MLTSS for a broader population, including dual eligible individuals. Only one state expects to adopt MLTSS in FY 2019.
Additional information on HCBS expansions implemented in FY 2018 or planned for FY 2019 as well as state-level details on capitated MLTSS models can be found in Tables 9 and 10.
Medicaid is the nation’s primary payer for long-term services and supports (LTSS), covering a continuum of services ranging from home and community-based services (HCBS) that allow people to live independently in their own homes or in other community settings to institutional care provided in nursing facilities (NFs) and intermediate care facilities for individuals with intellectual disabilities (ICF-IDs). In federal fiscal year 2016, spending on Medicaid LTSS totaled $167 billion, and HCBS represented 57% of these expenditures. In recent years, growth in Medicaid LTSS expenditures has been largely concentrated in HCBS. In 2016, spending on HCBS grew by 10% while spending on institutional LTSS decreased 2%.62
This year’s survey shows the vast majority of states in FY 2018 (46 states) and the vast majority of states in FY 2019 (48 states) are using one or more strategies to expand the number of people served in home and community-based settings (Figure 6). States were asked about their use of the following rebalancing tools/methods: use of HCBS waivers and/or State Plan Amendments (SPAs) (including 1915(c), Section 1115, 1915(i), and 1915(k)); use of rebalancing incentives in managed care contracts; use of Programs of All-Inclusive Care for the Elderly (PACE); and efforts to downsize state institutions. A large majority of states in FY 2018 (40 states) and in FY 2019 (42 states) reported adopting new HCBS waivers/SPAs and/or serving more individuals through existing HCBS waivers/SPAs. About a third of states reported using rebalancing incentives in managed care contracts and about the same share reported implementing PACE expansions in FY 2018 and FY 2019. Fewer states report efforts to downsize state institutions. Table 9 shows state use of selected LTSS rebalancing tools in FY 2018 and FY 2019.
Figure 6: Long-Term Care Actions to Serve More Individuals in Community Settings, FYs 2018-2019
Fewstates reported actions to reduce or restrict the number of persons served in home and community-based settings in FY 2018 or in FY 2019. In FY 2018, Missouri increased the state’s institutional level of care standard, which affected the eligibility of 445 waiver participants upon reassessment and of over 1,200 waiver applicants on pre-assessment screening. In FY 2019, Michigan may reduce the number of slots available under its MI Choice 1915(c) waiver, which serves seniors and adults with physical disabilities, to reflect available funding.
Tennessee Rebalancing Incentives in MCO Contracts
Tennessee pays its MLTSS health plans a blended capitation rate for older adults and adults with physical disabilities who meet Nursing Facility (NF) level of care (LOC) and are receiving services in a NF or HCBS. First, the state develops actuarially sound rates for each service setting. The mix of individuals receiving services in each setting (NF vs. HCBS) is determined and a target is established for how the percentages are expected to change during the rating period. The two capitation rates are blended according to those percentages, resulting in a single capitation payment for all persons who meet NF LOC. This is done separately for the dual eligible and the non-dual populations in each region. Because reimbursement is the same for NFs or HCBS, there is an incentive to serve people in the community whenever possible (both delaying or preventing NF placement as well as transitioning from NF placement to the community when appropriate). MCOs are also incentivized to ensure that services in the community are sufficient to meet the person’s needs since they are at financial risk for the higher cost NF placement.
In this year’s survey, states were also asked to identify the most significant rebalancing challenges they currently face. Among states that responded, the challenges most frequently cited included lack of affordable and accessible housing, gaps in community-based provider capacity (especially in rural areas) and/or direct care workforce shortages, reimbursement challenges (e.g., rising and/or more favorable rates paid to nursing facilities compared to HCBS providers and the need to risk adjust rates as patterns of utilization change), and the expiration of the Money Follows the Person (MFP) program.
LTSS Direct Care Workforce
Many states are struggling to find sufficient numbers of trained direct care workers to meet the demand for services, including the demand for care in home and community-based settings.63,64 Low wages, few benefits, limited opportunities for career advancement, inadequate training, and high rates of worker injury are factors that also contribute to a workforce shortage and high workforce turnover among paid LTSS direct care workers. The National Center for Health Workforce Analysis projects that demand for direct care workers (including nursing assistants, home health aides, personal care aides, and psychiatric assistants/aides) could grow by 48% between 2015 and 2030, growth that is expected to far exceed the available workforce.65
To address LTSS direct care workforce shortages and turnover, increasingly states are reporting implementing wage increases and workforce development activities (Exhibit 13). In FY 2018, 15 states reported implementing wage increases for Medicaid-reimbursed direct care workers, while 24 states report implementing wage increases in FY 2019 (14 states in both years). In addition, 12 states had direct care workforce development strategies (e.g., recruiting, training, credentialing) in place in FY 2018, and 10 states reported expanding or implementing new workforce development strategies in FY 2019 (Exhibit 13).
Exhibit 13: Strategies to Address LTSS Direct Care Workforce Shortages & Turnover
Fiscal Year
# of States
States
Wage Increases
2018
15
AZ, CA, CO, CT, MA, MD, MI, MT, NH, NY, TN, UT, VT, WA, WI
2019
24
AZ, CA, CO, CT, DE, HI, IL, MA, MD, MI, MN, MT, NC, NJ, NY, OK, OR, TN, UT, VA, VT, WA, WI, WV
LTSS Direct Care Workforce Initiatives – State Examples
Arizona requires Medicaid MCOs to incorporate and monitor a workforce development plan as a component of its network development and management plan, with the Medicaid program partnering with the LTSS industry to determine workforce development priorities.
North Carolina is expanding workforce options by adopting a new live-in support service that allows a caregiver to move into a beneficiary’s home or for the beneficiary to move into the caregiver’s home.
Tennessee is using federal State Innovation Model (SIM) test grant funding to create new education and training curriculum for direct care workers, where individuals will be able to earn college credit, complete a post-secondary certificate, and apply credits toward a new Associate’s degree.
HCBS Benefit Changes
More states reported actions to add or enhance HCBS benefits than states reporting actions to reduce or restrict HCBS benefits in FY 2018 and FY 2019. HCBS benefits include those in Section 1915(c) or Section 1115 waivers, under Section 1915(i) authority or Section 1915(k) authority (“Community First Choice” or “CFC”), PACE, and state plan personal care services, home health services, or private duty nursing. Eighteen states in FY 2018 and 26 states in FY 2019 reported a wide variety of HCBS benefit additions or expansions (Exhibit 14). Most HCBS benefit changes reported involve the addition of HCBS services to existing waiver or state plan programs. Examples of HCBS services added by states include new housing-related services or embedded post-MFP community transition services in HCBS authorities; changes to increase access to respite services or to provide training for family, consumers, and unpaid caregivers; enhanced transportation services; and pest eradication services.
A few states implemented new HCBS programs in FY 2018 or FY 2019. In FY 2018, Idaho added a new 1915(i) state plan program for children to offer respite and person-specific planning supports. Maryland added two new 1915(c) waivers to provide family and community support for individuals with intellectual and developmental disabilities (I/DD). In FY 2019, California will implement a new 1915(i) program that will add housing access, family support, and other services for individuals with I/DD. Rhode Island proposes to add a Section 1915(k) Community First Choice program, and Alaska plans to add a new Section 1915(k) program. Seven states reported adding new PACE sites in both FY 2018 and FY 2019. Nine additional states will add new PACE sites in FY 2019 (Exhibit 14).
Exhibit 14: HCBS Benefit Enhancements or Additions
Benefit
FY 2018
FY 2019
HCBS Enhancements or Additions to Existing HCBS Authority
12 States
CA, LA, MA, MI, MN, OH, PA, RI, SC, TX, UT, VA
15 States
CO, HI, ID, IN, MA, MI, NC, ND, NM, NY, OH, PA, SD, TN, VA
New Section 1915(c), (i), or (k)
2 States
ID, MD
3 States
AK, CA, RI
New PACE Sites Added
7 States
CA, MI, NJ, NY, OR, PA, WA
16 States
AR, CA, CO, DC, DE, FL, IN, MI, NC, ND, NJ, NY, OR, PA, TX, WA
Rhode Island Proposed Section 1115 HCBS
Rhode Island is proposing to add additional preventive HCBS for target populations to further reduce or prevent the use of high cost services under its Section 1115 waiver renewal. Examples of new preventive services the state is proposing include home stabilization, peer support, chore services, and personal emergency response systems. The state also proposes to add services to its core HCBS, including but not limited to career planning, community transition, home stabilization, and training and counseling services for unpaid caregivers.
Three states in FY 2018 (Missouri, Montana, and Oregon) and two states in FY 2019 (DC and Montana) implemented or plan to implement benefit changes that will reduce services under HCBS authorities. States reported targeted restrictions, noting they are being introduced to meet budget neutrality requirements or to reflect changes in available state funding. For example, DC proposes restricting the number of personal care assistance hours available under its Section 1915(i) elderly and persons with physical disabilities state plan option, and Montana is eliminating several services from its Section 1915(c) waivers for individuals with I/DD and those with severe disabling mental illness.66
Money Follows the Person and Housing Supports
Money Follows the Person (MFP) is a federal grant program, enacted under the Deficit Reduction Act of 2005 and extended through September 2016 by the Affordable Care Act, which operated in 44 states.67,68 Enhanced federal funding under MFP has supported the transition of over 75,151 individuals from institutional to home and community-based long-term care settings as of December 2016.69 This includes the transition of older adults, individuals with physical disabilities, individuals with mental illness, and individuals with intellectual and developmental disabilities. Although states are developing sustainability plans and completing tasks to close the current MFP grant program, states can use unexpended MFP grant funds through the end of federal FY 2020. However, a few states reported in this year’s survey that they have already exhausted their MFP grants.
Although many states are still developing sustainability plans and making determinations about whether and which services may continue, 30 states identified specific housing-related services that they plan to continue after MFP funding expires. With MFP resources, many states have offered new housing-related services, incorporated housing expertise within the Medicaid program to increase the likelihood of successful community living for persons who need supports, and engaged in strategic activities to assist in identifying and securing housing resources for individuals who choose HCBS.70 In this year’s survey, states were asked to describe housing-related services that will continue (under SPA or waiver authority) after the MFP funding expires.71 The most common services that states expect to continue are transition or relocation services (e.g., case management, coverage for one-time set up costs etc.) and services designed to help individuals locate and maintain housing in the community (e.g., tenancy supports, housing coordination, or supported housing).
About half of MFP-funded states anticipate they will have to discontinue services or administrative activities due to the expiration of MFP funding. States identified a wide range of services and key administrative functions that they expect to discontinue. Examples of services some states may discontinue include intensive transition case management, supportive living services, community transition/housing relocation services, transitional behavioral health supports, and residential environmental modifications. Examples of administrative functions some states may discontinue include statewide housing coordinator, local housing specialists, transition and outreach workers, options counseling, and assistance for individuals to access Section 811 vouchers.
Capitated Managed Long-Term Services and Supports (MLTSS)
As of July 1, 2018, almost half of states (24 states) covered LTSS through oneor more of the following types of capitated managed care arrangements:
Medicaid MCO covering Medicaid acute care and LTSS (20 states)
PHP covering only Medicaid LTSS (6 states)
MCO arrangement for dual eligible beneficiaries covering Medicaid and Medicare acute care and Medicaid LTSS services in a single, financially aligned contract under the federal Financial Alignment Demonstration (FAD) (9 states)
Of the 24 states that reported using one or more of these MLTSS models, nine states reported using two models, and one state (New York) reported using all three. Of the states with capitated MLTSS, 17 offered some form of MLTSS plan on a statewide basis for at least some LTSS populations as of July 1, 2018 (Table 10). Almost every MLTSS state includes both institutional and HCBS in the same contractual arrangement, while three states (California, Michigan, and Tennessee) report that this varies by MLTSS arrangement.
Nine states offered an MCO-based FAD (California, Illinois, Massachusetts, Michigan, New York, Ohio, Rhode Island, South Carolina, and Texas) as of July 1, 2018.72 The FAD model involves a three-way contract between an MCO, Medicare, and the state Medicaid program.73,74 Four states have requested an extension of the FAD beyond the current end date of the demonstration at the time of the survey (California, Massachusetts, Ohio, and South Carolina). Virginia closed its FAD at the end of calendar year 2017.
Many states encourage improved coordination and integration of services for the dually eligible population under MCO arrangements outside of the FAD. Massachusetts and Minnesota operate an administrative alignment demonstration (with no financial alignment) for some dually eligible beneficiaries. Nine states75 reported that they require Medicaid-contracting MCOs to be Medicare Dual Eligible Special Needs Plans (D-SNP)76 or Fully Integrated Dual Eligible (FIDE) Special Needs Plans77 in some or all MLTSS models offered in the state, creating an opportunity for improved coordination and integration for beneficiaries. Five states78 reported that they encourage MCOs to be a D-SNP or a FIDE-SNP.
MLTSS Enrollment
For geographic areas where MLTSS operates, this year’s survey asked whether, as of July 1, 2018, certain populations were enrolled in MLTSS on a mandatory or voluntary basis or were always excluded. On the survey, states selected from “always mandatory,” “always voluntary,” “varies,” or “always excluded” for the following dually eligible and non-dually eligible populations: seniors, persons with I/DD, and nonelderly persons with physical disabilities. Dual eligible and non-dual eligible seniors were most likely to be enrolled on a mandatory basis followed closely by persons with physical disabilities. Dual and non-dual persons with I/DD were most likely to be excluded from MLTSS enrollment. No state offering MLTSS always excludes full benefit dual eligible seniors or persons with physical disabilities from MLTSS enrollment (Exhibit 15).
Exhibit 15: MLTSS Enrollment by Populations (# of States)
In FY 2018, Pennsylvania implemented MLTSS, with a plan to phase-in statewide over time, and Virginia ended its FAD but adopted statewide MLTSS for a wider population, including dual eligible individuals. Also, one state, Arkansas, reported that it will implement a capitated model of MLTSS for the first time in FY 2019 when it plans to adopt a global payment approach for its new “PASSE” program that provides comprehensive services, including personal care and other HCBS specialty services, for individuals who have the need for an intensive level of community based behavioral health or developmental disabilities services. While the state will exempt individuals who are receiving services under the DD waiver from this model, individuals who are on the waiting list for waiver services will be enrolled, as well as individuals who reside in private ICF-IDs.
In total, two states expanded the geographic reach of MLTSS in FY 2018 and five states are expanding MLTSS geographically in FY 2019 (Exhibit 16). Also, four states added previously excluded populations to MLTSS arrangements in FY 2018 and five states will add previously excluded populations in FY 2019. In all states except for South Carolina (where the state is expanding voluntary enrollment options under its FAD to all Medicare Advantage enrolled seniors statewide), the new populations covered are subject to mandatory enrollment. Rhode Island reported ending its MLTSS contract for individuals who opt out of the FAD, effective September 2018. After that date, individuals who opt out of the FAD will return to Medicaid fee-for-service.
Exhibit 16: MLTSS Population Expansions, FY 2018 and FY 2019
FY 2018
FY 2019
Geographic Expansions
ID, MA
ID, IL, MA, PA, SC
New Population Groups Added
FL, ID, NY, VA
ID, NY, OH, PA, SC
Implementing an MLTSS program for the First Time
PA
AR
Table 9: Long-Term Care Actions to Serve More Individuals in Community Settings in all 50 States and DC, FY 2018 and FY 2019
States
Sec. 1915(c)or Sec. 1115
HCBS Waiver
Sec. 1915(i) HCBS State Plan Option
Sec. 1915(k) “Community First Choice” Option
Building Rebalancing Incentives into MLTSS
PACE(* indicatesnew sites)
Close/ Downsize Institution
Total States with HCBS Expansions
2018
2019
2018
2019
2018
2019
2018
2019
2018
2019
2018
2019
2018
2019
Alabama
X
X
X
X
Alaska
X
X
X
Arizona
X
X
X
X
Arkansas
X
X
X*
X
X
California
X
X
X
X
X
X
X
X*
X*
X
X
X
X
Colorado
X
X
X
X
X
X*
X
X
Connecticut
X
X
X
X
X
X
X
X
X
DC*
X
X
X
X
X
X
X
X*
X
X
Delaware
X*
X
Florida
X
X
X
X
X*
X
X
Georgia
X
X
X
X
Hawaii
X
X
X
X
Idaho
X
X
X
X
X
X
Illinois
X
X
X
X
X
X
Indiana
X
X
X
X
X
X*
X
X
Iowa
X
X
X
X
X
X
X
X
Kansas
X
X
X
X
Kentucky
Louisiana
X
X
X
X
Maine
X
X
X
X
Maryland
X
X
X
X
X
X
X
X
X
Massachusetts
X
X
X
X
Michigan
X
X
X
X
X
X*
X*
X
X
Minnesota
Mississippi
X
X
X
X
X
X
Missouri
X
X
Montana
X
X
X
X
X
X
X
Nebraska
X
X
X
X
Nevada
X
X
X
X
X
New Hampshire
X
X
X
X
New Jersey
X
X
X*
X*
X
X
New Mexico
X
X
X
X
X
X
X
New York
X
X
X
X
X
X
X
X
X*
X*
X
X
X
X
North Carolina
X*
X
North Dakota
X
X
X*
X
X
X
Ohio
X
X
X
X
X
X
X
X
X
Oklahoma
X
X
X
X
X
X
Oregon
X
X
X
X
X*
X*
X
X
Pennsylvania
X
X
X
X
X*
X*
X
X
X
X
Rhode Island
X
X
X
X
X
South Carolina
X
X
X
X
X
X
X
X
South Dakota
X
X
X
X
Tennessee
X
X
X
X
X
X
Texas
X
X
X
X
X
X
X
X
X*
X
X
Utah
X
X
X
X
Vermont
X
X
X
X
Virginia
X
X
X
X
X
X
X
Washington
X
X
X
X
X*
X*
X
X
X
X
West Virginia
X
X
X
X
Wisconsin
X
X
X
X
X
X
X
Wyoming
X
X
X
X
X
X
Totals
40
40
12
14
8
9
17
18
16
22
10
7
46
48
NOTES: “1915(c) or Sec. 1115 Waiver” actions include: adopting new waivers; adding and filling more waiver slots; or filling more waiver slots. Actions under “1915(i) and 1915(k)” include adding new 1915(i) or 1915(k) SPAs or serving more individuals through existing 1915(i) or 1915(k) SPAs. Actions under PACE include more individuals served in existing and/or new PACE sites, with an * indicating which states expect new sites in FY 2018 or FY 2019. NY noted they will add one or more PACE sites in FY 2018 and FY 2019 but also indicated enrollment in PACE has declined.
SOURCE: Kaiser Family Foundation Survey of Medicaid Officials in 50 states and DC conducted by Health Management Associates, October 2018.
Table 10: Capitated MLTSS Models in all 50 States and DC, as of July 1, 2018
States
Medicaid MCO
PHP
Financial Alignment Demonstration(FAD) for Duals
Any MLTSS
Statewide
Alabama
Alaska
Arizona
X
X
X
Arkansas
California
X
X
X
Colorado
Connecticut
Delaware
X
X
X
DC
Florida
X
X
X
Georgia
Hawaii
X
X
X
Idaho
X
X
Illinois
X
X
X
Indiana
Iowa
X
X
X
Kansas
X
X
X
Kentucky
Louisiana
Maine
Maryland
Massachusetts
X
X*
X
Michigan
X
X
X
X
Minnesota*
X*
X
X
Mississippi
Missouri
Montana
Nebraska
Nevada
New Hampshire
New Jersey
X
X
X
New Mexico
X
X
X
New York
X
X
X
X
X
North Carolina
X
X
X
North Dakota
Ohio
X
X
X*
Oklahoma
Oregon
Pennsylvania
X
X
Rhode Island
X
X
X
X
South Carolina
X
X
South Dakota
Tennessee
X
X
X
X
Texas
X
X
X
X
Utah
Vermont
Virginia
X
X
X
Washington
West Virginia
Wisconsin
X
X
X
X
Wyoming
Totals
20
6
9
24
17
NOTES: States were asked whether they cover long-term services and supports through any of the following managed care (capitated) arrangements as of July 1, 2018: Medicaid MCO (MCO covers Medicaid acute + Medicaid LTSS); PHP (covers only Medicaid LTSS); MCO arrangement for dual eligibles under the Financial Alignment Demonstration (Medicaid MCO covers Medicaid and Medicare acute + Medicaid LTSS). *ID operates a PHP that covers LTSS in conjunction with an Medicare Advantage plan in selected counties and expects to expand to new counties in FY 2018 and FY 2019. *MA operates a FAD and a separate administrative alignment-only demonstration for dually eligible beneficiaries. *MN operates an administrative alignment-only demonstration for dually eligible beneficiaries using an MCO arrangement. *OH offers a Medicaid MCO (MCO offers Medicaid acute + Medicaid LTSS) only in those counties where the FAD is offered; dually eligible seniors who opt out of the FAD must enroll in this Medicaid MCO model for Medicaid services.
SOURCE: Kaiser Family Foundation Survey of Medicaid Officials in 50 states and DC conducted by Health Management Associates, October 2018.
Report: Provider Rates And Taxes
Key Section Findings
Provider rate changes are often tied to the economy. In FY 2018 and FY 2019, with stable economic conditions in most states, more states made or are planning provider rate increases compared to restrictions. This holds true across provider types, except for inpatient hospital rates (inpatient hospital rate restrictions are primarily rate freezes, which are counted as restrictions in this report). Further, the number of states that reported at least one rate restriction in FY 2019 is the smallest number since FY 2008. All states except Alaska rely on provider taxes and fees to fund a portion of the non-federal share of the costs of Medicaid. Two states indicate plans for new provider taxes in FY 2019, including Virginia that plans a new hospital provider tax to finance state costs of the newly adopted Medicaid expansion. Over half of MCO states (21 of 39) require MCO payments for some or all types of providers to follow percent or level changes made in comparable FFS rates. Twenty-seven states reported that their MCO contracts include rate floors for some provider types, and five states reported they had minimum MCO payment requirements for all types of Medicaid providers.
What to watch:
As enrollees are predominantly in MCOs, the significance of changes in FFS payment rates is difficult to assess without a better understanding of how changes in FFS rates affect changes in MCO rates paid to providers.
Twenty-nine states have at least one provider tax that is at or above 5.5% of net patient revenues (close to the maximum safe harbor threshold of 6%). Therefore, federal action to lower that threshold as proposed in the past would have financial implications for many states.
Tables 11 through 13 provide complete listings of Medicaid provider rate changes and provider taxes and fees in place in FY 2018 and FY 2019.
Provider Rates
Provider rate changes are often tied to the economy. During economic downturns and budget shortfalls, states often turn to rate restrictions to contain costs, and during periods of recovery and revenue growth, states are more likely to increase rates. This report examines rate changes across major provider categories: inpatient hospitals, nursing facilities, MCOs, outpatient hospitals, primary care physicians, specialists, dentists, home and community-based services (HCBS), and pharmacy dispensing fees. States were asked to report aggregate rate changes for each provider category in their FFS programs.
The number of states that made or are planning rate increases exceeds the number implementing or planning rate restrictions in both FY 2018 and FY 2019. In FY 2018, almost every state implemented rate increases for at least one category of providers (49 states), while fewer implemented rate restrictions (38 states) (Figure 7 and Table 11). For FY 2019, the number of states with at least one implemented or planned rate increase (47 states) is greater than the number of states with at least one implemented or planned rate restriction (31 states) (Figure 7 and Table 12). The number of states that reported at least one rate restriction in FY 2019 is the smallest number since FY 2008.
Figure 7: Provider Rate Changes Implemented in FY 2003 – FY 2018 and Adopted for FY 2019
The number of states with rate increases exceeds the number of states with restrictions in FY 2018 and FY 2019 across all major categories of providers, with the exception of rates for inpatient hospital services (Figure 8 and Tables 11 and 12). For the purposes of this report, cuts or freezes in rates for inpatient hospitals and nursing facilities are counted as restrictions.80 Most of the restrictions of inpatient hospital rates are rate freezes. Three states in FY 2018 and three states in FY 2019 had implemented or planned cuts to inpatient hospital rates. While three states cut nursing facility rates in FY 2018, no states indicate plans to cut nursing facility rates in FY 2019.
The number of states planning to increase nursing facility rates in FY 2019 (40 states) is greater than the number of states increasing those rates in FY 2018 (34 states). HCBS providers were also among those most likely to receive rate increases (32 states in FY 2018 and 31 states in FY 2019) (Figure 8).
Figure 8: Provider Rate Changes Implemented in FY 2018 and Adopted for FY 2019
State authority to adjust capitation payments for MCOs is limited by the federal requirement that states pay actuarially sound rates. In FY 2018 and FY 2019, the majority of the 39 states with Medicaid MCOs either implemented or planned increases in MCO rates. While seven states reported MCO rate cuts in FY 2018, only two states plan to cut MCO rates in FY 2019.81
MCO Rate Requirements
Over half of MCO states require MCOs to change provider payment rates in accordance with FFS payment rate changes. In many states, MCOs make most of the Medicaid payments to providers. This year’s survey asked states to report whether they require their MCOs to make changes to their provider payments that follow percent or level changes in FFS rates. Of the 39 states with MCOs, 18 states indicated that they had no such requirement, 19 states have such a requirement for some provider types, and two states (Louisiana and Mississippi) required MCOs to make these changes for all types of Medicaid providers.
Most MCO states mandate minimum provider reimbursement rates in their MCO contracts. Of the 39 MCO states, seven indicated that they had no rate floors, 27 states indicated that they had rate floors for some provider types, and five states said they had minimum MCO payment requirements for all Medicaid provider types. Among states with rate floors for some provider types, the most commonly mentioned providers were long term care providers (nursing facilities and home and community-based service providers), community health centers (federally qualified health centers and rural health centers), and various providers of behavioral health services.
Provider Taxes and Fees
Provider taxes are an integral source of Medicaid financing. In this year’s survey, states reported continuing or increased reliance on provider taxes and fees to fund a portion of the non-federal share of Medicaid costs in FY 2018 and FY 2019. At the beginning of FY 2003, 21 states had at least one provider tax in place. Over the next decade, a majority of states imposed new taxes or fees and increased existing tax rates and fees to raise revenue to support Medicaid. By FY 2013, all but one state (Alaska) had at least one provider tax or fee in place.82 In FY 2018, 36 states, including DC, had three or more provider taxes in place (Figure 9).
Figure 9: States with Provider Taxes or Fees in Place in FY 2018
Very few states made or are making any changes to their provider tax structure in FY 2018 or FY 2019. The most common Medicaid provider taxes in place in FY 2018 were taxes on nursing facilities (44 states), followed by taxes on hospitals (42 states) and taxes on intermediate care facilities for people with intellectual disabilities (36 states) (Table 13). Two states reported plans to add new taxes in FY 2019. Virginia is implementing a new hospital tax to fund the state’s share of Medicaid expansion costs, and California is implementing a new tax on Ground Emergency Medical Transportation (GEMT or ambulance).
Eleven states report planned increases to one or more provider taxes in FY 2019, while six states report provider tax decreases. In addition, 29 states reported at least one provider tax that is at or above 5.5% of net patient revenues, which is close to the maximum federal safe harbor threshold of 6%. Federal action to lower that threshold, as has been proposed in the past, would therefore have financial implications for many states.
Twelve states report that they have taxes on MCOs as of FY 2018. Federal Medicaid law was changed83 effective July 1, 2009 to restrict the use of Medicaid provider taxes on managed care organizations such as HMOs. Prior to that date, states could apply a provider tax to Medicaid HMOs that did not apply to MCOs more broadly and could use that revenue to match Medicaid federal funds. In recent years, several states have implemented new MCO taxes that tax member months rather than premiums and that meet the federal statistical requirements for broad-based and uniform taxes. As a result, the number of MCO taxes has increased in recent years. In addition to the 12 states reporting MCO taxes, some states have implemented taxes on health insurers more broadly that generate revenue for their Medicaid programs.
An increasingly common provider tax is a tax on Ground Emergency Medical Transportation, or an ambulance tax. As noted above, California is implementing such a tax in FY 2019, bringing the number of states with an ambulance tax to eight states.
Table 11: Provider Rate Changes in all 50 States and DC, FY 2018
States
Inpatient Hospital
Outpatient Hospital
Primary Care Physicians
Specialists
Dentists
MCOs
Nursing Facilities
HCBS
Pharmacy Dispensing Fee
Total
Rate Change
+
–
+
–
+
–
+
–
+
–
+
–
+
–
+
–
+
–
+
–
Alabama
X
—
—
X
X
X
X
Alaska
X
X
X
X
X
—
—
X
X
Arizona
X
X
X
X
X
X
X
X
X
Arkansas
X
—
—
X
X
X
California
X
X
X
X
X
X
X
X
X
X
Colorado
X
X
X
X
X
X
X
X
Connecticut
X
X
—
X
X
X
Delaware
X
X
X
X
X
X
X
X
X
DC
X
X
X
X
X
X
X
Florida
X
X
X
X
X
X
X
X
Georgia
X
X
X
X
X
X
X
X
Hawaii
X
X
X
X
X
X
X
Idaho
X
X
X
X
—
—
X
X
X
X
Illinois
X
X
X
X
X
Indiana
X
—
X
X
X
X
X
Iowa
X
X
X
X
X
X
Kansas
X
X
X
X
X
X
X
X
X
Kentucky
X
X
X
X
X
X
Louisiana
X
X
X
X
X
X
Maine
X
—
—
X
X
X
X
X
Maryland
X
X
X
X
X
X
X
X
Massachusetts
X
X
X
X
X
X
X
X
X
Michigan
X
X
X
X
X
X
X
Minnesota
X
X
X
X
X
X
X
X
Mississippi
X
X
X
X
X
X
X
X
Missouri
X
X
X
X
X
X
X
X
X
X
X
Montana
X
X
X
X
X
—
—
X
X
X
X
X
Nebraska
X
X
X
X
X
X
Nevada
X
X
X
X
X
X
X
X
X
New Hampshire
X
X
X
X
NR
X
X
New Jersey
X
X
X
X
X
X
X
New Mexico
X
X
X
X
New York
X
X
X
X
X
X
North Carolina
X
—
—
X
X
X
North Dakota
X
X
X
X
X
Ohio
X
X
X
X
X
X
Oklahoma
X
—
—
X
X
Oregon
X
X
X
X
X
X
X
X
Pennsylvania
X
X
X
X
X
X
X
Rhode Island
X
X
X
X
X
NR
X
X
South Carolina
X
X
X
X
X
X
X
South Dakota
X
—
—
X
X
X
X
Tennessee
X
X
X
X
X
X
X
Texas
X
X
X
X
X
Utah
X
X
X
X
X
X
Vermont
X
X
X
—
—
X
X
X
X
Virginia
X
X
X
X
X
Washington
X
X
X
X
West Virginia
X
X
X
X
X
X
Wisconsin
X
X
X
X
X
X
X
X
Wyoming
X
—
—
X
X
X
X
Totals
23
28
21
5
12
4
14
3
9
4
28
7
34
17
32
2
12
1
49
38
NOTES: “+” refers to provider rate increases and “-” refers to provider rate restrictions. MCOs: Managed care organizations. HCBS: Home and community-based services. For the purposes of this report, provider rate restrictions include cuts to rates for physicians, dentists, outpatient hospitals, managed care organizations, HCBS, and pharmacy dispensing fees as well as both cuts or freezes in rates for inpatient hospitals and nursing facilities. There are 12 states that did not have Medicaid MCOs in operation in FY 2018; they are denoted as “—” in the MCO column. NR: State did not report.
SOURCE: Kaiser Family Foundation Survey of Medicaid Officials in 50 states and DC conducted by Health Management Associates, October 2018.
Table 12: Provider Rate Changes in all 50 States and DC, FY 2019
States
Inpatient Hospital
Outpatient Hospital
Primary Care Physicians
Specialists
Dentists
MCOs
Nursing Facilities
HCBS
Pharmacy Dispensing Fee
Total
Rate Change
+
–
+
–
+
–
+
–
+
–
+
–
+
–
+
–
+
–
+
–
Alabama
X
—
—
X
X
X
X
Alaska
X
X
X
X
X
—
—
X
X
X
Arizona
X
X
X
X
X
X
X
X
Arkansas
X
—
—
X
X
X
California
X
X
X
X
X
X
X
X
X
X
Colorado
X
X
X
X
X
X
X
X
X
Connecticut
X
—
—
X
X
Delaware
X
X
X
X
X
X
X
X
X
X
DC
X
X
X
X
X
X
X
X
X
Florida
X
X
X
X
X
X
X
Georgia
X
X
X
X
X
X
X
Hawaii
X
X
X
X
X
X
Idaho
X
X
X
X
—
—
X
X
X
X
Illinois
X
X
X
X
Indiana
X
X
X
Iowa
X
X
X
X
X
X
Kansas
X
X
X
X
X
X
Kentucky
X
X
X
X
X
X
Louisiana
X
X
X
X
X
Maine
X
—
—
X
X
X
X
Maryland
X
X
X
X
TBD
TBD
X
X
X
Massachusetts
X
X
X
X
X
X
Michigan
X
X
X
X
X
X
X
Minnesota
X
X
X
X
X
X
X
X
Mississippi
X
X
X
X
X
X
X
Missouri
X
X
X
X
X
X
X
X
X
X
Montana
X
X
X
X
X
—
—
X
X
X
X
Nebraska
X
X
X
Nevada
X
X
X
X
X
X
New Hampshire
X
X
X
NR
X
X
New Jersey
X
X
X
X
X
X
X
X
X
New Mexico
X
X
X
X
X
X
X
New York
X
X
X
X
X
X
North Carolina
X
—
—
X
X
X
North Dakota
X
X
X
X
X
Ohio
X
X
TBD
TBD
X
X
X
X
Oklahoma
X
X
X
X
X
—
—
X
X
X
X
Oregon
X
X
X
Pennsylvania
X
X
X
X
X
X
Rhode Island
X
X
X
X
X
NR
X
X
South Carolina
X
X
X
X
X
X
South Dakota
X
X
X
X
X
—
—
X
X
X
Tennessee
X
X
X
X
X
Texas
X
X
X
X
X
X
Utah
X
X
X
X
X
X
Vermont
X
X
X
—
—
X
X
X
Virginia
X
X
X
X
X
Washington
X
X
X
X
X
X
West Virginia
X
X
X
X
X
Wisconsin
X
X
X
X
X
TBD
TBD
X
Wyoming
X
—
—
X
X
X
X
Totals
25
26
24
1
17
0
16
0
12
2
31
2
40
11
31
0
7
0
47
31
NOTES: “+” refers to provider rate increases and “-” refers to provider rate restrictions. MCOs: Managed care organizations. HCBS: Home and community-based services. For the purposes of this report, provider rate restrictions include cuts to rates for physicians, dentists, outpatient hospitals, managed care organizations, HCBS, and pharmacy dispensing fees as well as both cuts or freezes in rates for inpatient hospitals and nursing facilities. There are 12 states that did not have Medicaid MCOs in operation in FY 2019; they are denoted as “–” in the MCO column. TBD: At the time of the survey, calendar year 2019 MCO rates had not been set for Maryland, rates for dentists were in development in Ohio, and Wisconsin was considering changes to pharmacy dispensing fees. NR: State did not report.
SOURCE: Kaiser Family Foundation Survey of Medicaid Officials in 50 states and DC conducted by Health Management Associates, October 2018.
Table 13: Provider Taxes in Place in all 50 States and DC, FY 2018 and FY 2019
States
Hospitals
Intermediate Care Facilities
Nursing Facilities
Other
2018
2019
2018
2019
2018
2019
2018
2019
Alabama
X
X
X
X
X
X
Alaska
Arizona
X
X
X
X
Arkansas
X
X
X
X
X
X
California
X
X
X
X
X
X
X
X*
Colorado
X
X
X
X
X
X
Connecticut
X
X
X
X
X
X
X
X
Delaware
X
X
DC
X
X
X
X
X
X
X
X
Florida
X
X
X
X
X
X
Georgia
X
X
X
X
Hawaii
X
X
X
X
Idaho
X
X
X
X
X
X
Illinois
X
X
X
X
X
X
Indiana
X
X
X
X
X
X
Iowa
X
X
X
X
X
X
Kansas
X
X
X
X
Kentucky
X
X
X
X
X
X
X*
X*
Louisiana
X
X
X
X
X
X
X*
X*
Maine
X
X
X
X
X
X
X
X
Maryland
X
X
X
X
X
X
X
X
Massachusetts
X
X
X
X
X
X
Michigan
X
X
X
X
X
X
Minnesota
X
X
X
X
X
X
X
X
Mississippi
X
X
X
X
X
X
X
X
Missouri
X
X
X
X
X
X
X*
X*
Montana
X
X
X
X
X
X
X
X
Nebraska
X
X
X
X
Nevada
X
X
New Hampshire
X
X
X
X
New Jersey
X
X
X
X
X
X
X*
X*
New Mexico
X*
X*
New York
X
X
X
X
X
X
X*
X*
North Carolina
X
X
X
X
X
X
North Dakota
X
X
Ohio
X
X
X
X
X
X
X
X
Oklahoma
X
X
X
X
X
X
Oregon
X
X
X
X
X
X
Pennsylvania
X
X
X
X
X
X
X*
X*
Rhode Island
X
X
X
X
X
X
South Carolina
X
X
X
X
South Dakota
X
X
Tennessee
X
X
X
X
X
X
X*
X*
Texas
X
X
X
X
Utah
X
X
X
X
X
X
X
X
Vermont
X
X
X
X
X
X
X*
X*
Virginia
X
X
X
Washington
X
X
X
X
X
X
West Virginia
X
X
X
X
X
X
X*
X*
Wisconsin
X
X
X
X
X
X
Wyoming
X
X
X
X
Totals
42
43
36
36
44
44
26
26
NOTES: This table includes Medicaid provider taxes as reported by states. Some states also have premium or claims taxes that apply to managed care organizations and other insurers. Since this type of tax is not considered a provider tax by CMS, these taxes are not counted as provider taxes in this report. (*) has been used to denote states with multiple “other” provider taxes.
SOURCE: Kaiser Family Foundation Survey of Medicaid Officials in 50 states and DC conducted by Health Management Associates, October 2018.
Report: Benefits And Copayments
Key Section Findings
A total of 19 states expanded or enhanced covered benefits in FY 2018 and 24 states plan to add or enhance benefits in FY 2019. The most common benefit enhancements reported were for mental health/substance use disorder (SUD) services (including waiver of the IMD exclusion for SUD treatment). A handful of states reported expansions related to dental services, telemonitoring/telehealth, physical or occupational therapies, and screening and home visiting services for pregnant women. Eight states reported new or increased copayments and nine states reported policies to eliminate or reduce a copay requirement for FY 2018 or FY 2019.
What to watch:
Medicaid continues to play an important role in addressing the opioid epidemic and more broadly in connecting Medicaid beneficiaries to behavioral health services. The SUPPORT Act, expected to be signed into law as this report was being finalized, creates a state option to cover IMD services for up to 30 days in a year for non-elderly adults with an SUD and codifies the 2016 Medicaid Managed Care Final Rule provision allowing “in lieu of” IMD coverage for up to 15 days in a month. Going forward, it will be important to follow the impact of this legislation as well as trends and innovations in how states use Medicaid to increase access to behavioral health services.
Tables 14 and 15 provide a complete listing of Medicaid benefit changes for FY 2018 and FY 2019. Table 16 provides a list of states that reported copayment actions for FY 2018 and FY 2019.
Benefit Changes
The number of states reporting new benefits and benefit enhancements continues to significantly outpace the number of states reporting benefit cuts and restrictions. Nineteen states reported new or enhanced benefits in FY 2018, and 24 states are adding or enhancing benefits in FY 2019. Few states reported benefit cuts or restrictions – four in FY 2018 and six in FY 2019 (Figure 10 and Table 14).
The most common benefit enhancements reported were for mental health and substance use disorder (SUD) services. Exhibit 17 also highlights states implementing other select benefit enhancements for dental, telemonitoring/telehealth, physical and occupational therapies, screening and home visiting services for pregnant women and children, and alternative therapies.
Exhibit 17: Select Categories of Benefit Enhancements or Additions
Benefit
FY 2018
FY 2019
Mental Health/Substance Use Disorder Services
9 States
IN, MD, MA, NE, OH, RI, UT, VA, WV
18 States
AK, DC, HI, IL, IN, KS, KY, MD, NC, NH, NJ, NM, RI, SD, TN, TX, WI, WV
Dental Services
3 States
AZ, CA, UT
2 States
IL, MD
Telemonitoring/ Telehealth Services
4 States
IN, MD, NY, SC
1 State
TX
Therapy Services (PT, OT)
3 States
AZ, CO, WI
1 State
NY
Screening and Home Visiting Services for Pregnant Women and/or Children
3 States
CO, TX, VT
2 States
IL, NM
Alternative Therapies (e.g., Chiropractic and Acupuncture)
2 States
IN, OH
1 State
MO
Similar to our findings in last year’s budget survey, a number of states continue to report expanded mental health and/or SUD services. Many of these expansions are state initiatives to use Medicaid funds for services provided in institutions for mental disease (IMDs) under approved or pending Section 1115 waivers. These expansions include states responding to July 2015 CMS guidance84 stating that states can request federal funding for SUD services delivered to nonelderly adults in IMDs through Section 1115 demonstration waivers, as well as revised November 2017 guidance85 that continues to allow states to seek Section 1115 waivers to pay for SUD services provided in IMDs.
While IMD waivers approved under the previous administration were contingent on coverage of services across the care continuum, recently approved IMD waivers generally do not address coverage of community-based SUD services. Also, the SUPPORT Act,86 which was expected to be signed into law as this report was being finalized, would create a state plan option from October 1, 2019 to September 30, 2023 to cover IMD services for up to 30 days in a year for non-elderly adults with an SUD. The SUPPORT Act also would codify the 2016 Medicaid Managed Care Final Rule provision allowing “in lieu of” IMD coverage for up to 15 days in a month.
Other non-IMD mental health and SUD service expansions that states reported include expanding access to screening and intervention services and supporting recovery with new services such as peer supports. States also continue to increase access to naloxone and medication assisted treatment (MAT) services. See the “Opioid Harm Reduction Strategies” section of this report for details on these initiatives.
Other noteworthy benefit expansions include:
Neonatal Abstinence Syndrome (NAS) Treatment Services: In FY 2018, West Virginia became the first state to receive CMS SPA approval to finance NAS services using a bundled payment for providers outside the hospital inpatient setting. The incidence of NAS is directly related to the nation’s opioid epidemic and involves infant withdrawal symptoms due to in utero exposure to certain substances.87 West Virginia’s NAS benefit package includes pharmacological and non-pharmacological interventions to holistically treat the withdrawal symptoms, which can include tremors, seizures, and vomiting. CMS highlighted West Virginia’s approach in a June Informational Bulletin88 as a model that pays an all-inclusive rate for neonatal abstinence treatment professional services and other ancillary services in a pediatric residential center specializing in NAS treatment. In addition, the SUPPORT Act89 would create a new State Plan option, effective upon enactment, to provide inpatient or outpatient residential pediatric recovery centers services for infants under age 1 with NAS and their families.
Community Health Workers: Both Indiana and South Dakota reported plans to cover services provided by Community Health Workers (CHWs). Indiana began covering CHW services on July 1, 2018, adopting the American Public Health Association’s definition of a CHW. For services to be covered, the CHW must be certified by a recognized organization, employed by a Medicaid-enrolled provider, and have delivered services under their supervision. The CHW is part of the health care team and provides patient education, facilitates communication when cultural factors may be a barrier to care, promotes healthy behaviors, and provides direct preventive services or services intended to slow the progression of chronic disease.90
Diabetes Prevention: Two states reported plans to cover Diabetes Prevention Program services in FY 2019. Diabetes Prevention Programs aim to delay or prevent the onset of type 2 diabetes with targeted health behavior interventions. California will start covering these services for beneficiaries diagnosed with prediabetes in FY 2019. New Jersey is also adding coverage of Diabetes Prevention Program services in FY 2019, as well as diabetes self-management education.
Enhanced Screening, Identification, and Other Support Services for New Mothers: In FY 2018, Colorado and Texas started covering depression screenings for mothers in the first 12 months of a child’s life. In Texas, the screening is provided through the child’s benefit package as part of a well child visit. In FY 2019, New Mexico will pilot a home visiting program as part of its pending Section 1115 waiver that will focus on prenatal care, postpartum care, and early childhood development. Home visits will include patient education, skill building, screenings for risk factors (including depression and substance misuse), breast feeding support and education, and child developmental screenings. Illinois also plans to cover home visiting services for new mothers and/or at risk children in FY 2019, targeting women who give birth to babies born with withdrawal symptoms.
Most benefit restrictions in FY 2018 or FY 2019 are narrowly targeted. Benefit restrictions reflect the elimination of a covered benefit, benefit caps, or the application of utilization controls for existing benefits. The most common benefit restrictions limited dental coverage (Alaska, Connecticut, Iowa, Kentucky, Nevada, and Oklahoma) or implemented new prior authorization requirements (Colorado and Nevada). Other notable benefit restrictions that are pending CMS approval include proposals in New Mexico and Utah to eliminate Early and Periodic Screening, Diagnostic, and Treatment (EPSDT) coverage for individuals ages 19 and 20 in FY 2019 and Kentucky’s proposals to eliminate non-emergency medical transportation (NEMT) services for the Medicaid expansion group and eliminate NEMT for methadone services for all non-pregnant adults in FY 2019 (Table 15).
Copayments
Federal law limits cost-sharing for people with income below 100% FPL to “nominal” amounts (defined in federal regulations), with higher amounts allowed for beneficiaries at higher income levels. Certain groups are exempt from cost-sharing, including mandatory eligible children, pregnant women, most children and adults with disabilities, people residing in institutions, and people receiving hospice care. In addition, certain services are exempt from cost-sharing: emergency services, preventive services for children, pregnancy-related services, and family planning services. Also, total Medicaid premiums and cost-sharing for a family cannot exceed 5% of the family’s income on a quarterly or monthly basis.91
Most state Medicaid programs require beneficiary copayments, but to varying degrees. Thirteen states reported changes to copayment requirements in either FY 2018, FY 2019, or both years. Details about state actions related to copayments can be found in Table 16 and key changes are described below.
Eight states reported new or increased copayment requirements for FY 2018 or FY 2019. Key changes include:
Five states (Colorado, Kentucky, Maine,92 Massachusetts, and New Mexico) reported new or increased copayments for non-emergency use of a hospital emergency department (ED). These changes are part of pending Section 1115 waiver requests in Kentucky, Maine, and New Mexico.
Colorado, New Mexico, and Utah are adding or increasing pharmacy copayments. Colorado, Michigan, and Utah reported increased copayments for hospital outpatient services.
Nine states reported policies that eliminate or reduce a copayment requirement for some or all covered populations in FY 2018 or FY 2019. Key changes include:
One state (Indiana)93 decreased copays in FY 2018 for non-emergency use of the ED to the state plan amount ($8). The state previously imposed graduated copays of up to $25 for non-emergency ED use under Section 1115 waiver authority.
New Mexico is eliminating copayments for behavioral health services for working disabled adults and Michigan is eliminating behavioral health copays for all beneficiaries.
Delaware is eliminating copayments for naloxone, Massachusetts is eliminating copayments for SUD treatment, aspirin, and statin drugs, and South Carolina is eliminating copayments for a subset of prescription drug classes deemed to be of the highest value.
TABLE 14: BENEFIT CHANGES IN ALL 50 STATES AND DC, FY 2018 AND FY 2019
States
FY 2018
FY 2019
Enhancements/Additions
Restrictions/Eliminations
Enhancements/Additions
Restrictions/Eliminations
Alabama
Alaska
X
X
Arizona
X
Arkansas
California
X
X
Colorado
X
X
X
Connecticut
X
Delaware
DC
X
Florida
Georgia
X
Hawaii
X
Idaho
Illinois
X
Indiana
X
X
Iowa
X
Kansas
X
Kentucky
X
X
Louisiana
X
Maine
Maryland
X
X
Massachusetts
X
Michigan
Minnesota
Mississippi
X
Missouri
X
Montana
Nebraska
X
Nevada
X
X
X
New Hampshire
X
New Jersey
X
New Mexico
X
X
New York
X
X
North Carolina
X
North Dakota
Ohio
X
Oklahoma
X
Oregon
Pennsylvania
Rhode Island
X
X
South Carolina
X
South Dakota
X
Tennessee
X
Texas
X
X
Utah
X
X
Vermont
X
Virginia
X
Washington
West Virginia
X
X
Wisconsin
X
X
Wyoming
Totals
19
4
24
6
NOTES: States were asked to report benefit restrictions, eliminations, enhancements, and additions in FY 2018 and FY 2019. Home and community-based services (HCBS) and pharmacy benefit changes are excluded from this table.
SOURCE: Kaiser Family Foundation Survey of Medicaid Officials in 50 states and DC conducted by Health Management Associates, October 2018.
Table 15: States Reporting Benefit Actions Taken in FY 2018 and FY 2019[endnote 375798-11]
State
Fiscal Year
Benefit Changes
Alabama
2019
Children (nc): Add coverage of Applied Behavior Analysis (ABA) services for individuals under age 21 (October 1, 2018).
Alaska
2018
Adults (-): Recategorize emergent and enhanced dental service codes, and eliminate coverage of other codes.
2019
Children (nc): Add coverage of Applied Behavior Analysis (ABA) services under the EPSDT benefit.
All (+) Pending Sec. 1115 Waiver: Begin phasing in a revised and expanded behavioral health services benefit package (TBD).
Arizona
2018
Non-LTSS Adults (+): Add a $1,000 per year benefit for emergency dental services (October 1, 2017).
Children (nc): Expand coverage of Behavioral Health Treatment (BHT) to individuals under age 21 without a diagnosis of Autism Spectrum Disorder (ASD) (March 1, 2018).
2019
Adults (+): Add Diabetes Prevention Program (DPP) for individuals diagnosed with prediabetes who meet qualifying criteria (January 1, 2019).
Colorado
2018
Pregnant Women (+): Add coverage of up to three postpartum depression screenings in the first year following a child’s birth (July 1, 2017).
Children (+): Restore coverage of routine circumcisions as an elective benefit (July 1, 2017).
Adults (+): Add coverage for physical therapy/occupational therapy services above the 12-hour cap with prior authorization (November 1, 2017).
2019
All (+): Add coverage of 12-month supply of birth control pills, after an initial three-month dispensing period (January 1, 2019).
All (+): Expand non-emergency medical transportation (NEMT) services benefit to meet urgent transportation needs (January 1, 2019).
All (-): Implement prior authorization requirements for certain medical benefits and physician administered drugs (January 1, 2019).
All (-): Implement a comprehensive hospital admission review program (January 1, 2019).
Connecticut
2018
Adults (-): Apply $1,000 annual cap on coverage for dental services, with exception for medical necessity (January 1, 2018).
District of Columbia
2019
All (+): Add coverage of Clubhouse peer support services for individuals with a mental health diagnosis living in the community (TBD).
Georgia
2018
Children (nc): Add coverage for Autism Spectrum Disorders (ASD) services for individuals under the age of 21 (January 1, 2018).
2019
All (+): Add coverage of Emergency Medical Services (EMS) transportation to a non-hospital destination and treatment without transport (July 1, 2018).
Pregnant Women (+): Add coverage for group prenatal care services/CenteringPregnancy (October 1, 2018).
Hawaii
2019
Adults (+) Pending Sec. 1115 Waiver: Expand mental health and substance abuse benefits including addition of intensive case management and tenancy supports for beneficiaries classified as chronically homeless (TBD).
All (+) Approved Sec. 1115 Waiver: Add coverage of residential and inpatient treatment for individuals with substance use disorder at institutions for mental disease (IMD) under a statewide pilot (January 1, 2019).
All (+) Approved Sec. 1115 Waiver: Expand coverage of the following behavioral health services through pilot programs approved under a Section 1115 waiver: clinically managed residential withdrawal management; substance use disorder case management services; peer recovery support services; crisis intervention services; and supported employment services (January 1, 2019).
Pregnant women and children (+) Approved Sec. 1115 Waiver: Cover evidence-based home visiting services under a pilot program, including postpartum home visits and child home visits to postpartum mothers who gave birth to a baby born with withdrawal symptoms (January 1, 2019).
Children (+) Approved Sec. 1115 Waiver: Add coverage of intensive in-home clinical and support services under a pilot program to support and stabilize a child/youth in their home or home-like setting (January 1, 2019).
Children (+) Approved Sec. 1115 Waiver: Add coverage of respite services under a pilot program to provide families scheduled relief to help prevent stressful situations (January 1, 2019).
Indiana
2018
Adults (+): Add coverage of chiropractic spinal manipulation for Healthy Indiana Plan (HIP) Plus enrollees (January 1, 2018).
Adults (+) Approved Sec. 1115 Waiver: Expand coverage of opioid use disorder and substance use disorder treatment services to include inpatient substance use treatment at institutions for mental disease (IMD) (February 1, 2018).
All (+) Approved Sec. 1115 Waiver: Add coverage for short-term low-intensity and high-intensity residential treatment for opioid use disorder and substance use disorder in settings of all sizes, including IMDs (March 1, 2018).
All (+): Revise coverage for telemedicine services, including an elimination of the distance requirement between distant and originating sites (April 1, 2018).
2019
All (+): Add coverage for certain services provided by community health workers, including but not limited to patient education, health promotion, and facilitation of cultural brokering between an individual and their health care team (July 1, 2018).
All (+): Expand coverage for peer support recovery, crisis intervention, and intensive outpatient behavioral health services (TBD).
Iowa
2019
Adults (-): Apply a $1,000 annual maximum to dental benefits, excluding preventive services and dentures (September 1, 2018).
Kansas
2019
Adults (+) Pending Sec. 1115 Waiver: Add coverage of inpatient behavioral health services at publicly-owned and non-public institutions for mental disease (IMD) for Medicaid managed care enrollees (January 1, 2019).
Kentucky
2018
All (nc): Expand non-emergency medical transportation services to include travel to pharmacies (July 1, 2017).
2019
Adults (-) Sec. 1115 Waiver Approval Set Aside by Court, CMS Reconsidering:Change access to enhanced benefits, such as vision and dental, such that individuals must access through My Rewards Account (TBD).
All (+): Approved Sec. 1115 Waiver: Add coverage of substance use disorder treatment services at institutions for mental disease (IMD) under pilot program (TBD).
Expansion Adults (-) Sec. 1115 Waiver Approval Set Aside by Court, CMS Reconsidering: Waive coverage of NEMT services (TBD).
Adults (-) Sec. 1115 Waiver Approval Set Aside by Court, CMS Reconsidering: Waive coverage of NEMT services for methadone treatment, with exceptions for children under age 21 (EPSDT), former foster care youth, and pregnant women (TBD).
Louisiana
2018
All (+): Remove home health visit limits (January 20, 2018).
Family Planning Eligibility Group (+): Remove family planning services visit limit (March 20, 2018).
Maryland
2018
Adults (+) Approved Sec. 1115 Waiver: Add coverage of substance use disorder residential treatment services in ASAM Level 3.3, 3.5, and 3.7 settings (July 1, 2017).
All (+): Add coverage of remote patient monitoring for beneficiaries who meet qualifying medical criteria (January 1, 2018).
2019
Adults (nc): Add coverage of audiology services and hearing aids (July 1, 2018).
Adults (+) Approved Sec. 1115 Waiver: Add coverage of substance use disorder residential treatment services in ASAM Level 3.1 settings (January 1, 2019).
Dual Eligibles (+): Implement pilot for coverage of adult dental services (January 1, 2019).
Massachusetts
2018
All (+) Approved Sec. 1115 Waiver: Add coverage of recovery support navigator services and recovery coach services (March 1, 2018).
Michigan
2018
Adults (nc): Add coverage of hearing aids for adults age 21 and older (September 1, 2018).
Mississippi
2019
Children (+): Add coverage of pharmacist-administered vaccines for children ages 10 to 18 years old (TBD).
Missouri
2019
All (+): Add coverage of acupuncture and chiropractic services in lieu of an opioid prescription as an alternative pain management strategy (February 2019).
Nebraska
2018
All (+): Add coverage of nutrition services (July 1, 2017).
All (+): Add coverage of peer support services (July 1, 2017).
Nevada
2018
All (-): Implement a prior authorization requirement for hospice services (July 1, 2017).
Children (-): Limit coverage of orthodontia services (July 1, 2017).
All (+): Add coverage of gender dysphoria services (January 1, 2018).
All (+): Add coverage of medical nutrition therapy services (January 1, 2018).
All (+): Add coverage of 12-month supply of birth control pills (January 1, 2018).
Adults (+): Add coverage of podiatry services (January 1, 2018).
All (nc): Expand definition of covered durable medical equipment services (June 26, 2018).
2019
All (-): Establish basic skills training services tiers (TBD).
New Hampshire
2019
Adults (+) Approved Sec. 1115 Waiver: Add coverage of substance use disorder treatment services at institutions for mental disease (IMD) (TBD).
Expansion Adults (nc) Pending Sec. 1115 Waiver: Align alternative benefit package with standard Medicaid benefits as state terminates the current Premium Assistance Program and transitions Medicaid expansion beneficiaries into the state’s Medicaid managed care delivery system (January 1, 2019).
New Jersey
2019
All (+): Eliminate prior authorization requirements for nicotine replacement therapies (July 1, 2018).
Adults (+) Approved Sec. 1115 Waiver: Add coverage of short-term residential services for substance use disorder and withdrawal management services at an institution for mental disease (IMD) (July 1, 2018).
Adults (+) Approved Sec. 1115 Waiver: Add coverage of long-term residential services for substance use disorder at an institution for mental disease (IMD) (October 1, 2018).
Children (nc): Expand coverage of Autism Spectrum Disorder (ASD) services statewide (January 1, 2019).
All (+): Add coverage of Diabetes Prevention Program services and self-management education (TBD).
New Mexico
2019
All (+) Pending Sec. 1115 Waiver: Add coverage of behavioral health services, substance use disorder treatment in adult residential treatment centers, expanded Opioid Treatment Program services, expanded provider types for Comprehensive Community Support Services, and teaming crisis treatment services (January 1, 2019).
All (+): Add coverage of Screening, Brief Intervention, and Referral to Treatment (SBIRT) services.
All (+) Pending Sec. 1115 Waiver: Add coverage of inpatient services in an institution for mental disease (IMD) for beneficiaries with severe mental illness or a substance use disorder (January 1, 2019).
Children (-) Pending Sec. 1115 Waiver: Waive coverage of Early and Periodic Screening, Diagnosis, and Treatment (EPSDT) services for 19- and 20-year-olds (January 1, 2019).
Pregnant Women (+) Pending Sec. 1115 Waiver: Pilot home visiting program that focuses on prenatal care, postpartum care, and early childhood development (January 1, 2019).
Adults (+) Pending Sec. 1115 Waiver: Add coverage of pre-tenancy and tenancy support services to adults who are Seriously Mentally Ill (January 1, 2019).
New York
2018
All (+): Add coverage of digital breast tomosynthesis (DBT) screening services (September 1, 2017 for fee-for-service and November 1, 2017 for Medicaid managed care).
All (+): Add coverage of continuous glucose monitoring devices for beneficiaries with Type 1 diabetes (November 1, 2017 for fee-for-service and January 1, 2018 for Medicaid managed care).
Children (+): Add coverage of pasteurized donor human breast milk for infants <1500 grams (December 1, 2017 for fee-for-service and February 15, 2018 for Medicaid managed care).
2019
All (+): Expand coverage of physical therapy services by increasing cap from 20 visits to 40 visits for eligible beneficiaries (July 1, 2018).
All (+): Add limited infertility benefit for beneficiaries between the ages of 21 to 44 (TBD, pending CMS approval).
Adults (+) Pending Sec. 1115 Waiver: Add coverage of substance use disorder services in institutions for mental disease (IMD) (TBD).
North Dakota
2018
All (nc): Update and clarify the services covered under the Rehabilitation Services benefit category, and the provider types who may render the service (April 1, 2018).
Ohio
2018
All (+): Expand coverage of behavioral health services to include assertive community treatment for adults, family counseling, intensive home-based treatment for youth at risk of out-of-home placement, and primary care services delivered by a behavioral health provider (January 1, 2018).
All (+): Expand provider types who may provide acupuncture services to treat pain (January 1, 2018).
Oklahoma
2018
Adults (-): Limit cap on Targeted Case Management services from 25 units per month to 16 units per year (September 1, 2017).
Adults (-): Limit coverage of tooth extractions to emergency services only (September 14, 2017).
Adults (+) Approved Sec. 1115 Waiver: Add coverage of Recovery Navigation Program services for individuals with substance use disorder.
2019
Adults (+) Approved Sec. 1115 Waiver: Add coverage of peer recovery specialist services for individuals with substance use disorder.
Adults (+) Pending Sec. 1115 Waiver: Add coverage of residential mental health and substance use disorder treatment services in institutions for mental disease (IMD) (TBD).
All (+) Pending Sec. 1115 Waiver: Add coverage for a Behavioral Health Link triage center to support crisis stabilization and short-term treatment for individuals experiencing a mental health or substance use disorder crisis (TBD).
South Carolina
2018
All (+): Expand coverage of telemedicine services (July 1, 2017).
Children (nc): Add Autism Spectrum Disorder (ASD) services to the State Plan for eligible beneficiaries up to age 21 (July 1, 2017).
South Dakota
2019
Adults (+): Expand coverage of substance use disorder treatment services to all adults (SUD services were previously only covered for pregnant women) (July 1, 2018).
All (+): Expand definition of mental health practitioners (January 1, 2019).
All (+): Add coverage of services provided by community health workers (April 1, 2019).
Tennessee
2019
Adults (+) Pending Sec. 1115 Waiver: Add coverage of inpatient and residential substance use disorder treatment services in institutions for mental disease (IMD) (TBD).
Texas
2018
Children (+): Add coverage for one postpartum depression screening for mother during infant’s Texas Health Steps medical visit during the first year (July 1, 2018).
2019
Children (+): Expand coverage of telemedicine services to occupational therapy and speech-language pathology provided in a school-based setting (TBD).
Adults (+): Add coverage of peer specialist services for adults with mental health conditions or substance use disorders (TBD).
Utah
2018
All (+): Add coverage of Screening, Brief Intervention, and Referral to Treatment (SBIRT) services for beneficiaries age 13 and older (July 1, 2017).
People with Disabilities (+): Add coverage of dental services for individuals with disabilities (July 1, 2017).
Adults (+) Approved Sec. 1115 Waiver: Add coverage of residential treatment services in an institution of mental disease (IMD) for individuals with a substance use disorder (November 9, 2017).
2019
Children (-) Pending Sec. 1115 Waiver: Waive coverage of Early and Periodic Screening, Diagnosis, and Treatment (EPSDT) services for certain 19 and 20 year olds (TBD).
Vermont
2018
All (+): Add coverage of in-home lactation consultations (June 1, 2018).
Virginia
2018
All (+): Add coverage for peer support services for beneficiaries with serious mental illness and/or substance use disorders (for all members other than family planning-only beneficiaries) (July 1, 2017).
Limited Adult Coverage Group (+) Approved Sec. 1115 Waiver: Expand coverage of residential addiction recovery and treatment services for beneficiaries with serious mental illnesses and/or substance use disorders in the GAP waiver population (October 1, 2017).
West Virginia
2018
Children (+): Add coverage of neonatal abstinence syndrome (NAS) treatment services (October 31, 2017).
All (+) Approved Sec. 1115 Waiver: Add coverage of screening, brief intervention, and referral to treatment (SBIRT) services (January 14, 2018).
2019
All (+) Approved Sec. 1115 Waiver: Add coverage of substance use disorder services, including adult residential treatment services, peer recovery support services, and withdrawal management services (July 1, 2018).
Wisconsin
2018
Children (+): Redesign targeted case management services for children with complex medical conditions (September 1, 2017).
All (+): Eliminate prior authorization requirements for therapy services evaluations and re-evaluations (January 1, 2018).
Children (+): Add coverage of pharmacist-administered vaccines for children ages six to 18 years old (January 1, 2018).
Children (+): Eliminate prior authorization requirements for environmental lead investigation services (March 1, 2018).
2019
Adults (+) Pending Sec. 1115 Waiver: Add coverage of residential substance use disorder treatment services in institutions for mental disease (IMD) for managed care and fee-for-service populations (TBD).
table 16: Copayment actions taken in the 50 states and dc, FY 2017 and 2018
State
Fiscal Year
Copayment Changes
Colorado
2018
Increase (all non-exempt eligibility groups): Increase pharmacy copayment to $3.00 per prescription (January 1, 2018).
Decrease (LTSS population): Treatment of pre-eligibility medical expenses in determining post eligibility cost of care contribution for LTSS population; “look-back” period expanded from 30 days to 90 days. Potential to reduce the monthly “patient pay” amount (July 1, 2017).
Decrease (for HIP 2.0 expansion population): Eliminating the graduated copayment for non-emergent ER use and replaced with a flat $8 copay (February 1, 2018) (Approved Sec. 1115 Waiver).
Kentucky
2019
Increase (Expansion Adults and Parents/Caretakers): MCOs will not be authorized to waive copayments that apply in fee-for-service (TBD).
New (Expansion Adults and Parents/Caretakers): Incentive account funds deducted for non-emergent use of the ER (Sec. 1115 Waiver Approval Set Aside by Court, CMS Reconsidering).
New (Expansion Adults and Parents/Caretakers): Incentive account funds deducted for missed appointments (Sec. 1115 Waiver Approval Set Aside by Court, CMS Reconsidering).
Maine
2019
New (all non-exempt groups): Impose a copayment of $10 on all populations for non-emergent use of the ED (dual eligibles, those in institutions and a few other groups are exempt) (Pending Sec. 1115 Waiver).
Massachusetts
2019
Elimination (all groups): Eliminate pharmacy copays for SUD treatment, aspirin, and statin drugs (TBD).
Elimination (Persons with income at or below 50% FPL): Eliminate all copayments for those with income below 50% FPL (TBD).
Increase (adults above 50% FPL); Implement new copayments for specialty services and non-emergent use of the emergency room (TBD).
Decrease (all groups): Implementing a 2% cost-sharing cap for those below 150% FPL and 5% for those above 150% FPL (TBD).
Michigan
2019
Increase (all non-exempt groups): Increase outpatient hospital copay from $1 to $2 (October 1, 2018).
Elimination (all groups): Eliminate cost sharing for mental health and substance use disorder services (October 1, 2018).
Montana
2018
Increase (expansion population with incomes from 51% to 138% FPL): Premium credit of 2% eliminated and members now pay point of service copayments (January 1, 2018) (Approved Sec. 1115 Waiver).
New Hampshire
2019
Decrease (adult enrollees with incomes between 100% and 133% FPL): Cost sharing will be aligned with standard Medicaid (January 1, 2019) (Approved Sec. 1115 Waiver).
New Jersey
2018
Decrease (nursing facility residents): Personal needs allowance was increased from $35 to $50 per month (July 1, 2017).
New Mexico
2018
Elimination (for Working Disabled Adults): Eliminated copayments for behavioral health services (January 1, 2018).
2019
New (for most populations): Copays for brand-name prescriptions when there is a less expensive generic equivalent medicine available (March 1, 2019).
New (for most populations): Copays for non-emergent use of the emergency department (March 1, 2019) (Pending Sec. 1115 Waiver).
New (for most populations): A fee of $5 for missing 3 or more appointments in a calendar year (March 1, 2019) (Pending Sec. 1115 Waiver).
Elimination (for Working Disabled Adults): Eliminate most copayments (January 1, 2019).
South Carolina
2019
Elimination (all populations): Copayments eliminated for a subset of prescription drug classes deemed to be of the highest value.
Utah
2018
Neutral (all but children and pregnant women): Change inpatient copayments from $220 per year to $75 per stay (October 1, 2017).
Increase (all but children and pregnant women): Increase outpatient copayments (July 1, 2017).
Increase (all but children and pregnant women): Increase pharmacy copayment from $2 to $4 per prescription (July 1, 2017).
Report: Pharmacy And Opioid Strategies
Key Section Findings
Most states identified specialty and high-cost drugs (individually or in general) as the most significant cost driver of Medicaid pharmacy spending. Twenty-two states in FY 2018 and 19 states in FY 2019 reported new or enhanced pharmacy cost containment initiatives, especially initiatives to generate greater rebate revenue and implementation of new utilization controls (e.g., prior authorization requirements, step therapy, other clinical criteria, or dose optimization). Thirty-five of 39 MCO states reported that the pharmacy benefit was “generally carved-in,” unchanged from 2017. Of these 35 states, the majority reported requirements that MCOs have uniform clinical protocols (31 states) or uniform preferred drug lists (PDLs) (17 states) in place for one or more drugs as of the end of FY 2019.
In FY 2018, all states report FFS pharmacy management strategies targeted at opioid harm reduction including quantity limits (50 states); clinical criteria claim system edits (48 states); step therapy (39 states), and other prior authorization requirements (44 states). Somewhat fewer states (32) reported requirements in place for Medicaid prescribers to check their states’ Prescription Drug Monitoring Program (PDMP) before prescribing opioids to a Medicaid patient. Of the 35 states that used MCOs to deliver pharmacy benefits, 26 reported that they required MCOs to follow some or all of their FFS pharmacy management policies for opioids.
What to watch:
For FY 2019, several states noted the emerging cost challenge posed by gene therapies and CAR-T cell therapies, which are designated by CMS as covered outpatient drugs.
States continue to increase access to Medication Assisted Treatment (MAT) for opioid use disorder, and 38 states reported coverage of methadone in FY 2018. Many states reported experiencing challenges related to access to MAT, especially in rural areas. Looking ahead, the SUPPORT Act requires state Medicaid programs to cover all FDA-approved MAT drugs from October 2020 through September 2025.
Table 17 provides additional details on Medicaid FFS pharmacy benefit management strategies for opioids.
Prescription Drug Utilization and Cost Control Initiatives
Under federal law, once a manufacturer enters into a rebate agreement with the Secretary of HHS, states must generally cover (with limited exceptions) all drugs produced by that manufacturer. Because approximately 600 manufacturers currently have rebate agreements,94 states cover nearly all FDA-approved drugs. As pharmacy expenditure growth became a greater Medicaid budget concern in the late 1990’s and early 2000’s, most states implemented aggressive pharmacy cost containment strategies, including preferred drug lists (PDLs), supplemental rebate programs, state maximum allowable cost programs, and prior authorization policies linked to clinical criteria. While these programs have matured, they are also subject to ongoing updates and refinements as states respond to changes, especially new product offerings, in the pharmaceutical marketplace. In recent years, however, a disproportionate increase in prescription drug costs relative to overall spending has heightened state attention on pharmacy reimbursement and coverage policies. In this year’s survey, states reported a variety of actions in FY 2018 and FY 2019 to refine and enhance their pharmacy programs, including actions to react to new and emerging specialty and high-cost drug therapies.
PHARMACY COST DRIVERS
Specialty and high-cost drugs remain the biggest cost driver of pharmacy spending growth in most states. This year’s survey asked states to identify the biggest cost drivers that affected growth in total pharmacy spending95 (federal and state) in FY 2018 and projected for FY 2019. Consistent with the results of prior surveys in recent years, most states again identified specialty and high-cost drugs (individually or in general) as the most significant pharmacy cost driver. While several states noted that the cost of hepatitis C antivirals had recently come down due to the market entry of a competitor drug, a significant number of states specifically identified this drug class as a major cost driver. Other drug classes frequently cited as major cost drivers include hemophilia factor and oncology, mental health, and HIV/AIDS drugs. For FY 2019, several states also noted the emerging cost challenge posed by gene therapies and immunotherapies like “CAR-T” (Chimeric Antigen Receptor-T cell) therapies,96 designated by CMS as covered outpatient drugs. For example, the first gene therapy approved by the Food and Drug Administration in 2017 to treat congenital blindness was priced at $850,000 ($425,000 per eye).97 One state noted that gene therapies and CAR-T cell therapies currently under development could have a “huge” impact on states in coming years.
States also reported facing a variety of challenges in controlling pharmacy costs. A majority of states noted the burden of covering high-cost drugs (including gene therapies and CAR-T cell therapies) or increasing drug prices generally. Other challenges cited by several states include:
The federal requirement to cover all rebateable drugs – despite the cost and even when evidence of clinical effectiveness or safety is poor
State law limitations, including those that shield certain drugs or drug classes from utilization management efforts
Other challenges mentioned include limited administrative resources to provide clinical oversight to implement evidence-based coverage policies; the difficulty of appropriately accounting for the cost of new and emerging drugs within actuarially sound capitation rates; claims system constraints that make it difficult to add clinical utilization edits; and a lack of transparency related to PBM pricing policies and rebate collections.
Pharmacy Cost Containment Actions in FY 2018 and FY 2019
Almost all states had prescription drug cost containment policies (including prior authorization requirements and PDLs) in place prior to FY 2018, and most are constantly refining and updating these policies. While states were not asked to report every refinement or routine change in this year’s survey, 22 states in FY 2018 and 19 states in FY 2019 reported newly implementing or making changes to a wide variety of cost containment initiatives in the area of prescription drugs. The most frequently cited action was new or expanded initiatives to generate greater rebate revenue (including PDL expansions) (eight states in both FY 2018 and FY 2019). These initiatives include the following notable actions in three states:
New York implemented a new state law in FY 2018 that applies a cap on Medicaid drug expenditures as a separate component of the global state Medicaid spending cap that the state has had in place since 2011. If the state determines that drug spending will exceed the annual growth limit, the Commissioner of the Department of Health may identify and refer drugs to the Drug Utilization Review (DUR) Board for additional review and recommendations regarding appropriated supplemental rebates. At the time of the survey, the DUR Board had taken action to recommend a supplemental rebate target amount for one drug,98 and negotiations between the state and the drug’s manufacturer were ongoing.
Oklahoma became the first state in the nation to receive CMS approval to pursue value-based supplemental rebate agreements with pharmaceutical manufacturers. The first contract took effect in August 2018 and relates to adherence and persistency for an injectable atypical anti-psychotic.
West Virginia reported that its July 1, 2017 MCO pharmacy carve-out (applicable to point-of-sale pharmacy benefits but not drugs covered as a medical benefit in an inpatient or outpatient setting), resulted in lower administration costs and increased federal and supplemental rebate collections. West Virginia also reported plans to expand supplemental rebates to certain additional diabetic supplies in FY 2019.
Seven states in both FY 2018 and FY 2019 also reported the application of new or expanded utilization controls (e.g., prior authorization requirements, step therapy, other clinical criteria, or dose optimization). Other frequently cited newly implemented or expanded pharmacy cost containment actions were:
Ingredient cost reductions: six states in FY 2018 and one state in FY 2019 reported reductions in certain ingredient cost reimbursements, and one state ended reimbursement for non-rebatable products and implemented system changes to recognize 340B pricing. Conversely, in FY 2019, Arizona reported plans to negotiate with CMS to obtain better reimbursement for high-cost specialty drugs for Medicaid enrollees utilizing Indian Health Service (IHS) facilities.
Medication therapy management, case management, or adherence programs: these programs were implemented or expanded by five states in FY 2018 and four in FY 2019.
Managed Care’s Role in Delivering Pharmacy Benefits
Since the passage of the ACA, states have been able to collect rebates on prescriptions purchased by managed care organizations (MCOs) operating under capitated arrangements. As a result, many states have chosen to “carve-in” the pharmacy benefit to their managed care benefits. As more states have enrolled additional Medicaid populations into managed care arrangements over time, MCOs have played an increasingly significant role in administering the Medicaid pharmacy benefit. In this year’s survey, states with MCO contracts were asked whether pharmacy benefits were covered under those contracts as of July 1, 2018. Of the 39 states contracting with comprehensive risk-based MCOs, 35 states reported that the pharmacy benefit was “generally carved-in (with possible exceptions),” unchanged from FY 2017.
Among the states that carved drugs into MCOs, several reported carve-outs for selected drug classes. The most commonly reported carved-out drugs were hemophilia clotting factor reported by at least eight states, hepatitis C antivirals reported by at least six states, mental health drugs reported by at least five states, HIV drugs reported by at least three states, and selected substance use disorder (SUD) treatment drugs reported by at least three states. At least nine states noted carve-outs for other selected high-cost drugs, and some of these states cited the challenge of accurately developing capitation rates when new high-cost drugs enter the market with no available historical utilization data. Washington reported that a state workgroup was currently working to define “high-cost drugs” and establish consistent policies (that would begin in FY 2020) for drug carve-ins and carve-outs that would also include policies for pass-through payments for drugs that are carved-out.
Consistent with last year’s survey results, four states (Missouri, Tennessee, West Virginia, and Wisconsin) reported that the pharmacy benefit was “generally carved-out.” While Wisconsin noted that pharmacy was carved into its Family Care Partnership program (an integrated health and long-term care program for frail elderly and people with disabilities), the state noted that this program had a very small enrollment (approximately 3,300 as of June 201899 ) and that all other Wisconsin Medicaid enrollees received their pharmacy benefit through the FFS delivery system.
States with MCOs are moving to align MCO pharmacy policies with FFS policies. Prior reports show that nearly all states use prior authorization and PDLs in FFS programs. This year’s survey asked whether MCOs were required (in FY 2018) or would be required (in FY 2019) to adhere to uniform clinical protocols (state prescribed medical necessity criteria) for one or more drugs or a uniform PDL (state prescribed requirements for designating a specified drug product as either preferred, meaning covered without the need to obtain prior authorization, or non-preferred). This means that to the extent states impose these policies in FFS, the same policies would apply in managed care. The survey also asked whether MCO contracts included risk-sharing provisions for one or more drugs (e.g., risk corridors, risk pools, reinsurance, etc.) (Exhibit 18).
Exhibit 18: Managed Care Pharmacy Policies
Policy
In Place in FY 2018
FY 2019 Changes
New
Expanded
Uniform Clinical Protocols(1 or more drugs)
30 States
AZ, CA, DC, DE, GA, HI, IA, IL, IN, KS, KY, LA, MA, MD, MI, MN, MS, ND, NE, NJ, NM, NY, OH, OR, PA, RI, SC, TX, VA, WA
1 States
UT
6 States
KY, LA, OH, SC, VA, WA
Uniform PDL(1 or more drug classes)
14 States
AZ, DE, FL, IA, KS, MA, MN, MS, ND, NE, OR, TX, VA, WA
3 States
LA, OH, UT
2 States
VA, WA
Risk-sharing(for 1 or more drugs)
14 States
AZ, DE, HI, IN, KS, MA, NM, NV, OH, OR, PA, RI, VA, WV
2 States
FL, UT
2* States
IN, VA
*Delaware reported plans to remove hepatitis C antivirals from its risk pool in CY 2019.
Uniform clinical protocols and PDL requirements for MCOs reported by states were often limited to one or a few specific drug classes. Hepatitis C antivirals were the most commonly mentioned drug class targeted by uniform clinical protocols (reported by California, DC, Georgia, Hawaii, Illinois, Kentucky, Maryland, Minnesota, New Mexico, Oregon, Rhode Island, and Virginia) and were also reported as a specific focus of uniform PDL requirements in Massachusetts, Minnesota and Oregon. Four states also reported uniform protocols in place or planned for opioids and/or Medication Assisted Treatment drugs (Kentucky, New York, South Carolina and Virginia). Of the five states that reported plans to implement or expand a uniform PDL in FY 2019, one state (Washington) specifically noted plans to phase-in a comprehensive uniform PDL while two states (Louisiana and Virginia) reported that their uniform PDLs would be limited to certain therapeutic classes.
Strategies reported by states to mitigate or share financial risk with MCOs for certain high cost drugs included selected drug carve-outs (mentioned above), “kick payments,”100 risk corridors, and risk pools, and were most commonly applied to hepatitis C antivirals and hemophilia clotting factor, but in some cases were applied to other high cost drugs (Indiana and Kansas), drugs above a certain dollar threshold (Hawaii), and cystic fibrosis drugs (Pennsylvania). Florida, for example, reported plans to add a new prescribed high-risk drug pool to its CY 2019 MCO contracts. While the pool parameters were still under negotiation at the time of the survey, the state indicated that it is planning to withhold a portion of the capitation payment to fund the pool, which will be paid out to the MCOs at a later date based on utilization. Two states also reported interest in value-based purchasing approaches for drugs: Virginia reported plans to explore value-based purchasing agreements (and other risk-sharing opportunities for high-cost drugs), and West Virginia reported that payments for certain physician-administered cancer treatments are made only if the patient is in remission 30 days after treatment.
Opioid Harm Reduction Strategies
According to the U.S. Department of Health and Human Services, 2.1 million people in the United States have an opioid use disorder and 11.5 million people misuse prescription opioids as of 2016.101 The Centers for Disease Control and Prevention (CDC) indicates the number of drug overdose deaths continues to increase, and the majority (around 66%) involve an opioid (prescription opioids, synthetic opioids, and heroin).102 The number of opioid overdose deaths is five times higher than it was in 1999, with 115 people dying from opioid-related drug overdoses each day.103 The opioid epidemic was declared a nationwide public health emergency on October 26, 2017.104
Medicaid plays an important role in addressing the epidemic, covering 4 in 10 people with opioid use disorder in 2016 and providing access to a range of treatment services.105 These expansions include states responding to July 2015 CMS guidance106 stating that states can request federal funding for substance use disorder services delivered to nonelderly adults in Institutions for Mental Disease (IMDs) through Section 1115 demonstration waivers, as well as revised November 2017 guidance107 that continues to allow states to seek Section 1115 waivers to pay for SUD services provided in IMDs. Both state Medicaid director letters set out parameters for states to obtain Section 1115 waivers to test using federal Medicaid funds to provide short-term inpatient and residential SUD treatment services in IMDs.108
As this report was being finalized, the Substance Use Disorder Prevention that Promotes Opioid Recovery and Treatment for Patients and Communities (SUPPORT) Act was expected to be signed into law. While very broad in scope, the SUPPORT Act109 contains a number of provisions related to Medicaid’s role110 in helping states provide coverage and services to people who need SUD treatment, particularly those needing opioid use disorder (OUD) treatment. These provisions include new authority to cover services in IMDs for up to 30 days in a year for non-elderly adults with a SUD from October 2019 through September 2023, a requirement that state Medicaid programs cover all FDA-approved MAT drugs as well as counseling and behavioral therapy services from October 2020 through September 2025, authority for new demonstrations to help states increase Medicaid SUD provider capacity, and a prohibition on states terminating Medicaid eligibility for individuals under age 21 or former foster care youth up to age 26 while incarcerated.
Medicaid Pharmacy Benefit Management Strategies
This year’s survey asked states to report Medicaid pharmacy benefit management strategies for preventing opioid-related harms that were in place in FY 2018 for FFS and changes to these strategies planned for FY 2019. Specifically, the survey asked about the following strategies: opioid quantity limits,111 clinical criteria claim system edits112 (subject to prior authorization (PA) override), step therapy PA criteria,113 other PA requirements for opioids, and requirements that prescribers check the state’s Prescription Drug Monitoring Program (PDMP) before prescribing opioids.114 All states and DC reported having at least one of these opioid-focused pharmacy management policies in FFS in place in FY 2018, and more than three-fourths of states (40 states) plan to take at least one action in FY 2019 to newly implement or increase opioid controls through one of these strategies. Some states also identified early successes in their current initiatives, such as reducing the number of opioids prescribed. See Exhibit 19 and Table 17 for details on states implementing or expanding these controls.
Exhibit 19: States Implementing Opioid-Focused Pharmacy Benefit Management Strategies in FFS
Strategy
In Place in FY 2018(# of states)
FY 2019 (# of states)
New
Expanded
Quantity Limits
50
1
25
Clinical criteria claim system edits (subject to Prior Authorization override)
48
0
30
Step Therapy PA criteria
39
1
5
Other Prior Authorization
44
2
15
Required Use of Prescription Drug Monitoring Programs By Prescribers
32
4
4
Many states reported changes in clinical criteria claims system edits, limits on days supply, and/or cumulative morphine milligram equivalent (MME) limits and utilization controls for FY 2019. At least four states reported changes targeted to a narrow population, such as more restrictive quantity limits for children or when the opioid prescription is written by a dentist. Thirty-six states reported that they either have a legislative mandate or other policy that requires prescribers to check the state PDMP prior to prescribing opioids in place or will be implementing this type of policy by the end of FY 2019. To strengthen the effectiveness of a PDMP requirement, Oklahoma reports the ability to impose sanctions for non-compliance and New Mexico will be establishing recoupment authority for prescribers who do not check the database.
Specific trends in pharmacy management strategies recently adopted or planned include but are not limited to the following:
Prior authorization, step therapy, and/or other requirements/utilization controls for long acting opioids
Prior authorization, claims system edits, and/or other utilization controls related to co-prescribing or concurrent use of benzodiazepines
Expanded pharmacy and/or prescriber profiling, alerts or education
Policies to encourage or require non-opioid or non-pharmacologic treatment for pain prior to prescribing an opioid
Pain management contract for chronic pain patients
SBIRT screening, patient education regarding risks, and contraception counseling for women of childbearing age
A majority of states that use MCOs to deliver pharmacy benefits require or partially require MCOs to follow the state’s FFS pharmacy benefit management policies for opioids. Of the 35 states with MCOs that deliver pharmacy benefits, 17 states responded “yes” to a survey question asking whether MCOs were required to follow the state’s FFS pharmacy benefit management policies for opioids as of July 1, 2018, and 9 states responded “yes, in part.”115 Of the nine states answering “yes in part,” most reported some level of flexibility for MCOs to establish their own PDL and/or coverage criteria. At least two states require that MCOs be no more restrictive in their prior authorization or other criteria than FFS, while other states reported ongoing efforts to develop a more uniform, comprehensive strategy across their FFS and managed care delivery systems.
Looking ahead, beginning in October 2019 the SUPPORT Act116would require states to have drug utilization review safety edits in place for opioid refills and monitor concurrent prescribing of opioids and other drugs. Medicaid MCOs would be required to have these processes in place as well. The SUPPORT Act also requires each state to have Medicaid providers check the state’s PDMP before prescribing controlled substances and offers enhanced federal matching funds for implementation activities if states have agreements with contiguous states for providers to access these programs.
Medication-Assisted Treatment coverage and access
The ACA requires state Medicaid programs to provide SUD treatment coverage for their ACA expansion populations, but does not specify which SUD services must be included. This requirement, however, has bolstered states’ work to respond to the opioid epidemic. The standard of care for opioid use disorder is medication-assisted treatment (MAT), which combines psychosocial treatment with medication.117 Compared to psychosocial treatment alone, MAT is associated with greater adherence to treatment, decreased opioid use, and reduced likelihood of overdose fatalities.118 There are three medications used as part of MAT for opioid use disorder: methadone, buprenorphine, and both oral and extended-release injectable naltrexone.119 All state Medicaid programs cover at least one MAT medication, and most cover all three.120,121
About three-quarters of states reported coverage of methadone in FY 2018. State Medicaid programs are less likely to cover methadone than buprenorphine or naltrexone.122,123 In this year’s survey, thirty-eight states reported coverage of methadone in FY 2018.124 Two states reported plans to add coverage for methadone in FY 2019 (Kentucky and Louisiana) and three states reported that methadone coverage was under consideration (Nebraska, North Dakota, and South Carolina). Six states (Alabama, Idaho, Kansas, Oklahoma, Tennessee, and Wyoming) reported no coverage or plans to add coverage for methadone.
In this year’s survey, states identified a range of challenges related to access to MAT. Many states reported lack of waivered physicians to prescribe buprenorphine and a need for additional opioid treatment programs, especially in rural areas. Shortages of ancillary behavioral health providers contributes to the problem, since MAT must be provided as part of a comprehensive treatment plan that includes counseling and social support services. Seven states identified cash-only methadone clinics that do not participate in Medicaid as a barrier to access, and one state noted that these clinics also pose quality concerns. A few states reported challenges related to philosophical differences among providers or populations served (such as preference for an abstinence-based approach), lack of awareness about MAT, and low reimbursement rates. Other states identified challenges when MAT medication is covered as a medical benefit versus a pharmacy benefit. For example, some clinics are hesitant to “buy and bill” for injectable MAT treatments and prefer the medication be dispensed by a pharmacy. One state cited local zoning ordinances as a barrier to increasing the number of available opioid treatment programs.
Although this year’s survey did not ask directly about initiatives to address these challenges, states identified a handful of new initiatives and strategies related to MAT. Multiple states are leveraging technology or telemedicine to increase access, including Indiana University’s Opioid ECHO project to expand the number of trained MAT prescribers in the state. Tennessee reports working in close partnership with its MCOs to develop a statewide MAT provider network and uniform clinical guidelines for effective MAT treatment. Several states mentioned using Substance Abuse and Mental Health Services Administration (SAMHSA) Opioid State Targeted Response (STR) grant funding to support their efforts to increase access to MAT treatment. For example, Arizona is using STR grant funds to establish 24/7 opioid treatment on demand Centers of Excellence and Medication Units in rural hospitals in the state. Other states identified increasing MAT reimbursement rates or removing prior authorization requirements on different MAT therapies to promote access.
The SUPPORT Act expands access to MAT drugs and includes funding to address provider capacity. Looking ahead, the SUPPORT Act,125 expected to be signed into law as this report was being finalized, would require state Medicaid programs to cover all FDA-approved MAT drugs as well as counseling and behavioral therapy services from October 2020 through September 2025, unless a state certifies to the Secretary’s satisfaction that statewide implementation is infeasible due to provider shortages. The Act also would authorize new demonstrations to help states increase Medicaid SUD provider capacity. It would allow for 18-month planning grants, totaling $50 million, for 10 states, giving preference to those with average or higher SUD prevalence, particularly opioid use disorder. Up to five of these states would receive enhanced federal matching funds for Medicaid SUD treatment services during the 36-month waiver implementation.
Table 17: Medicaid FFS Pharmacy Benefit Management Strategies for Opioids in all 50 States and DC, in Place in FY 2018 and Actions Taken in FY 2019
States
Opioid Quantity Limits
Clinical Edits in Claim System
Opioid Step Therapy Requirements
Other Prior Authorization Requirements for Opioids
Required use of Prescription Drug Monitoring Programs
Any Opioid Management Strategies
In place FY 2018
New/Exp FY 2019
In place FY 2018
New/Exp FY 2019
In place FY 2018
New/Exp FY 2019
In place FY 2018
New/Exp FY 2019
In place FY 2018
New/Exp FY 2019
In place FY 2018
New/Exp FY 2019
Alabama
X
X
X
X
X
X
X
Alaska
X
X
X
X
X
X
X
X
X
X
X
Arizona
X
X
X
X
X
X
X
X
Arkansas
X
X
X
X
X
X
X
X
X
X
X
California
X
X
X
X
Colorado
X
X
X
X
X
X
X
Connecticut
X
X
X
X
X
X
X
X
Delaware
X
X
X
X
X
X
X
X
X
X
DC
X
X
X
X
X
X
X
Florida
X
X
X
X
X
X
X
X
X
X
X
X
Georgia
X
X
X
X
X*
X
X
Hawaii
X
X*
X
X
Idaho
X
X
X
X
X
X
X
Illinois
X
X
X
X
X
Indiana
X
X
X
X
X
X
X
X*
X
X
Iowa
X
X
X
X
X
X
X
X
X
X
Kansas
X*
X
X
X*
X*
X
X
Kentucky
X
X
X
X
X
X
X
X
X
X
X
Louisiana
X
X
X
X
X
X
Maine
X
X
X
X
X
X
Maryland
X
X
X
X
X
Massachusetts
X
X
X
X
X
X
X
X
X
Michigan
X
X
X
X
X
X
X
X
X
Minnesota
X
X
X
X
X
X
X
X
Mississippi
X
X
X
X
X
X
X
Missouri
X
X
X
X
X
X
Montana
X
X
X
X
X
X
X
X
Nebraska
X
X
X
X
X
X
X
X
Nevada
X
X
X
X
X
New Hampshire
X
X
X
X
X
X
X
X
X
X
New Jersey
X
X
X
X
X
X
New Mexico
X
X
X
X
X
New York
X
X
X
X
X
X
X
X
X
North Carolina
X
X
X
X
X
X
North Dakota
X
X
X
X
X
X
X
X
Ohio
X
X
X
X
X
X
X
X
X
Oklahoma
X
X
X
X
X
X
X
X
X
X
X
Oregon
X
X
X
X
X
X
X*
X
X
X
Pennsylvania
X
X
X
X
X
X
X
Rhode Island
X
X
X
X
X
X
South Carolina
X
X
X
X
X
X
X
X
South Dakota
X
X
X
X
X
X
X
X
X
Tennessee
X
X
X
X
X
X
Texas
X
X
X
X
X
X
X
Utah
X
X
X
X
X
X
X*
X
X
Vermont
X
X
X
X
X
X
X
X
X
Virginia
X
X
X
X
X
X
Washington
X
X
X
X
West Virginia
X
X
X
X
X
X
X
Wisconsin
X
X
X
X
X
X
X
X
X
Wyoming
X
X
X
X
X
X
X
Totals
50
26
48
30
39
6
44
17
32
8
51
40
NOTES: States were asked to report whether they had select pharmacy benefit management strategies in place in their FFS programs in FY 2018, and/or had plans to adopt or expand these strategies in FY 2019. “*” indicates that a policy was newly adopted in FY 2019, meaning that the state did not have any policy in that category/column in place in FY 2018.
SOURCE: Kaiser Family Foundation Survey of Medicaid Officials in 50 states and DC conducted by Health Management Associates, October 2018.
Report: Challenges And Priorities In Fy 2019 And Beyond Reported By Medicaid Directors And Conclusion
States reported a wide variety of priorities for FY 2019 and beyond, including implementing managed care, payment and delivery system reform initiatives; undertaking major information technology system procurements and upgrades; amending or pursuing new Section 1115 demonstration waivers; continuing to tackle the opioid epidemic; and managing their Medicaid budgets.
Over two-thirds of states reported improving quality and focusing on health outcomes as a key priority. Consistent with survey findings in recent years, most states are continuing to develop and implement initiatives to improve the quality of care and patient health outcomes while containing costs. States are doing this through managed care expansions, reforms, and improvements; value-based purchasing initiatives; and other delivery system reforms. In addition, a number of states mentioned addressing the opioid epidemic and expanding the availability of SUD treatment as top priorities (sometimes through Section 1115 demonstration waivers mentioned below).
A number of states mentioned implementation or pursuit of new Section 1115 demonstration waivers or waiver amendments as key priorities beyond 2019. Section 1115 Medicaid demonstration waivers provide states an avenue to test new approaches in Medicaid that differ from federal program rules. While previous sections of this report capture Section 1115 waiver-related policy actions implemented in FY 2018 or planned for implementation in FY 2019, the survey also asked states whether they are planning program changes under Section 1115 authority that would be implemented after FY 2019. The most frequently reported waiver concepts for implementation after FY 2019 address behavioral health services and/or the IMD exclusion, followed by waivers that would implement work and community engagement requirements. Many waivers require significant administrative time and resources to develop, negotiate with CMS, and implement. Waivers also often necessitate system changes (MMIS and/or eligibility), contracting with new support vendors, MCO coordination (including contract amendments), outreach and engagement of members, providers, and other stakeholders, state regulatory changes, and other administrative tasks. For additional details on pending or approved Section 1115 waivers, see the KFF Medicaid Waiver Tracker.
Continuing to tackle the opioid epidemic is another key priority for states in FY 2019 and beyond. New federal legislation expected to be signed into law as this report was being finalized, the Substance Use Disorder Prevention that Promotes Opioid Recovery and Treatment for Patients and Communities (SUPPORT) Act, contains a number of provisions related to Medicaid’s role in helping states provide coverage and services to people who need SUD treatment,126 particularly those needing opioid use disorder (OUD) treatment. These provisions include the ability to use federal Medicaid funds for services in “institutions for mental disease” (IMDs) for nonelderly adults for up to 30 days from October 1, 2019 to September 30, 2023; required coverage of all FDA-approved drugs for medication-assisted treatment (MAT) from October 2020 through September 2025; required suspension of Medicaid eligibility for individuals under age 21 or former foster care youth up to age 26 while incarcerated, and restoration of coverage upon release; creation of new demonstrations to help states increase Medicaid SUD provider capacity; and tighter prescription drug oversight.
As in the past, a significant number of states reported information technology systems projects currently underway or planned as high priorities. These are usually related to Medicaid Management Information Systems (MMIS) procurements and eligibility system upgrades and replacements. A few states commented on the need to redesign their MMIS procurements to meet new federal MMIS architecture “modularity” requirements, which are intended to promote the reuse of technical solutions among states, minimize customization and configuration needs, and increase vendor competition. States also commented on the need for system improvements or enhancements to better support other program objectives related, for example, to delivery system reform and value-based purchasing, quality improvement, provider and MCO monitoring, data analytics, and cost control strategies.
States noted that a number of federal regulations pose challenges for Medicaid agencies. Medicaid agencies must comply with ongoing changes in federal and state laws and regulations. Passage of the ACA in 2010, for example, was followed by years of administrative efforts and initiatives to implement the coverage expansions and other Medicaid policy changes required by the ACA and its related regulations. This year’s survey asked states to describe any notable expected administration effects or challenges of recent or anticipated federal regulations. Key findings include:
States most frequently noted challenges related to the implementation timeline for the electronic visit verification system as required under the 21st Century Cures Act (although the compliance deadline was recently extended from January 1, 2019 to January 1, 2020 for personal care services and to January 1, 2023 for home health).
Several states cited compliance challenges with the Access Rule, which requires states to develop and periodically update Access Monitoring Review Plans and to perform access reviews when FFS reimbursement cuts are proposed.
Some states noted challenges with the provider enrollment and screening requirements in the Medicaid managed care regulation.
Some states cited ongoing challenges with the HCBS Settings rule that establishes requirements for the qualities of settings that are eligible for reimbursement as Medicaid HCBS.
A few states also pointed to challenging budget implications of the Home Health Rule, as it requires documentation of a face-to-face encounter between a certifying physician and a home health beneficiary and also expands the definition of medical equipment and supplies that are covered under the home health benefit.
Since the survey was fielded, the administration issued proposed rules related to changes in federal “public charge” policies that govern how the use of public benefits may affect individuals’ ability to enter the U.S. or adjust to legal permanent resident (LPR) status (i.e., obtain a “green card”). In anticipation of these regulations, a few states mentioned challenging potential effects including concerns that the anticipated policy changes would further burden the state’s safety net and public health system by depressing Medicaid and CHIP enrollment or result in fear of accessing services, which could increase uncompensated care costs or the frequency of adverse labor and delivery events.
Conclusion
State actions in FY 2018 and FY 2019 show that the Medicaid program is constantly evolving in response to federal policy changes, the economy, and state budget and policy priorities. With less economic stress, more states reported expansions or enhancements to provider rates and benefits (including expansions for community based long-term services and supports and behavioral health services) as well as a focus on improvements in outcomes and value through delivery system reforms and requirements imposed on managed care plans. On the other hand, consistent with policies promoted by the Trump administration, an increasing number of states are pursuing demonstration waivers that include provisions that could result in enrollment declines such as work requirements and retroactive eligibility elimination or restriction. As states continue to work to tackle the opioid epidemic, new federal legislation (the SUPPORT Act) could help states provide coverage and services to people who need SUD treatment. Looking ahead, the trajectory of the economy, the direction of federal policies around Medicaid Section 1115 waivers, and the outcomes of state and federal elections in November 2018 will be factors that continue to shape Medicaid in FY 2019 and beyond.
Methods
The Kaiser Family Foundation (KFF) commissioned Health Management Associates (HMA) to survey Medicaid directors in all 50 states and the District of Columbia to identify and track trends in Medicaid spending, enrollment, and policy making. This is the 18th annual survey, each conducted at the beginning of the state fiscal year from FY 2002 through FY 2019. Additionally, eight mid-fiscal year surveys were conducted during state fiscal years 2002-2004 and 2009-2013, when a large share of states were considering mid-year Medicaid policy changes due to state budget and revenue shortfalls. Findings from previous surveys are referenced in this report when they help to highlight current trends. Archived copies of past reports are available on the following page.127
The KFF/HMA Medicaid survey on which this report is based was conducted from June through September 2018. The survey instrument (in the Appendix) was designed to document policy actions in place in FY 2018 and implemented or adopted for FY 2019 (which began for most states on July 1, 2018).128 The survey captures information consistent with previous surveys, particularly for eligibility, provider payment rates, benefits, long-term care, and managed care, to provide some trend information. Each year, questions are added or revised to address current issues.
Medicaid directors and staff provided data for this report in response to a written survey and a follow-up telephone interview. The survey was sent to each Medicaid director in June 2018. All 50 states and DC completed surveys and participated in telephone interview discussions between July and September 2018.129 The telephone discussions are an integral part of the survey to ensure complete and accurate responses and to record the complexities of state actions.
The survey does not attempt to catalog all Medicaid policies in place for each state. The focus is on changes in Medicaid policy and new initiatives that are planned for FY 2018. Experience has shown that adopted policies are sometimes delayed or not implemented for reasons related to legal, fiscal, administrative, systems, or political considerations, or due to delays in approval from CMS. Policy changes under consideration without a definite decision to implement are not included in the survey. The District of Columbia is counted as a state for the purposes of this report; the counts of state policies or policy actions that are interspersed throughout this report include survey responses from the 51 “states” (including DC). Given differences in the financing structure of their programs, the U.S. territories were not included in this analysis but a separate survey was fielded and results will be released in another report.
Glossary
Acronym Glossary
AAC – Actual Acquisition Cost
ACA – Affordable Care Act
ACO – accountable care organization
ASO – Administrative Services Organization
APCD – all-payer claims database
APM – alternative payment model
BH – behavioral health
CDC – The Centers for Disease Control and Prevention
CFC – Community First Choice
CHIP – Children’s Health Insurance Program
CHIPRA – Children’s Health Insurance Program Reauthorization Act of 2009
CMS – The Centers for Medicare and Medicaid Services
CON – Certificate of Need
CSHCNs – children with special health care needs
DBM – dental benefit manager
D-SNP – Medicare Dual Eligible Special Needs Plans
DSRIP – Delivery System Reform Incentive Program
DUR – drug utilization review
EAC – Estimated Acquisition Cost
ECHO, Project – Extension for Community Healthcare Outcomes
ED – emergency department
EPSDT – Early and Periodic Screening, Diagnostic, and Treatment
FAD – Financial Alignment Demonstration
FDA – Food and Drug Administration
FFS – fee-for-service
FFY – federal fiscal year
FIDE-SNP – Fully Integrated Dual Eligible Special Needs Plans
FPL – federal poverty level
FQHC – federally qualified health center
FY – state fiscal year
GED – general educational development or diploma
HSA – health savings account
HCBS – home and community-based services
HEDIS – Healthcare Effectiveness Data and Information Set
HIT – health information technology
ICF-ID – intermediate care facilities for individuals with intellectual disabilities
I/DD – intellectual and developmental disabilities
IEP – individualized education program
IMD – institutions for mental diseases
LTSS – long-term services and supports
MAGI – modified adjusted gross income
MAT – medication-assisted treatment
MCO – managed care organization
MED – morphine equivalent dose
MFP – Money Follows the Person (federal grant program)
MH – mental health
MLTSS – managed long-term services and supports
MLR – medical loss ratio
MME – morphine milligram equivalent
MMIS – Medicaid Management Information System
NADAC – National Average Drug Acquisition Costs
NCQA – National Committee for Quality Assurance
NEMT – non-emergency medical transportation
NF – nursing facility
OT – occupational therapy
OUD – opioid use disorder
P4P – pay for performance
PA – prior authorization
PACE – Programs of All-Inclusive Care for the Elderly
PCCM – primary care case management
PCMH – patient-centered medical home
PDL – preferred drug list
PDMP – Prescription Drug Monitoring Program
PHP – prepaid health plan
PIP – performance improvement projects
PMPM – per-member per-month
PT – physical therapy
RHC – rural health center
SAMHSA – Substance Abuse and Mental Health Services Administration
SBIRT – Screening, Brief Intervention, and Referral to Treatment
SED – serious emotional disturbance
SIM – State Innovation Models federal grant program
SMI – serious mental illness
SNAP – Supplemental Nutrition Assistance Program
SPA – State Plan Amendment
SSI – supplemental security income
SUD – substance use disorder
TPL – third party liability
VBP – value-based purchasing
WIC – Special Supplemental Nutrition Program for Women, Infants, and Children
Gene therapy is used to treat or prevent genetic diseases by seeking to augment, replace or suppress one or more mutated genes with functional copies. CAR T-cell therapy is a form of immunotherapy that uses specially altered T cells (part of the immune system) collected from the patient to fight cancer. ↩︎
In this report, work requirement policies are counted based on the initial date of implementation rather than the date on which the first coverage terminations will occur. ↩︎
Medicaid statute requires that Medicaid coverage for most eligibility groups include coverage for a period of 90 days prior to the date of the application for medical assistance. ↩︎
The member can reenroll within 90 days from the end of the expired benefit period if they submit the requested redetermination information. However, after the 90-day period, the member is required to wait another three months, or six months from the initial date of disenrollment, until their next open enrollment before being permitted to reenroll in HIP. Indiana has also proposed a work requirement, but that provision would not be effective until FY 2019. ↩︎
Positive changes from the beneficiary’s perspective that were counted in this report are denoted with (+). Negative changes from the beneficiary’s perspective that were counted in this report are denoted with (-). Reductions to Medicaid eligibility pathways in response to the availability of other coverage options (including Marketplace or Medicaid expansion coverage) were denoted as (#). ↩︎
New premiums are denoted as (New). Changes to premium policies that have a neutral impact from the beneficiary’s perspective are denoted as (Neutral). ↩︎
This table captures eligibility and premium changes that states have implemented or plan to implement in FY 2018 or 2019, including changes that are part of pending Section 1115 waivers. For pending waivers, only provisions planned for implementation before the end of FY 2019 (according to the state or waiver application documents) are counted in this table. Waiver provisions in pending waivers that states plan to implement in FY 2020 or after are not counted here. ↩︎
A court order issued on June 29, 2018 vacated the CMS approval of the Kentucky HEALTH waiver and remanded it to CMS for reconsideration regarding how the waiver would meet the medical assistance objectives of the Medicaid statute. At the time of the survey, the waiver remained under consideration at CMS. ↩︎
After failing to meet the SPA submission deadline (April 3, 2018), Maine’s Governor complied with a Maine Supreme Judicial Court order to submit an expansion SPA on September 4, 2018. However, he also sent a letter to the federal government asking CMS to reject the SPA. Expansion has not yet been implemented as of the time of this survey. ↩︎
Massachusetts’ pending amendment would remove an existing waiver provision that allows it to enroll expansion adults and other populations in coverage during a 90-day provisional eligibility period while income verification is pending. ↩︎
Connecticut does not have capitated managed care arrangements, but does carry out many managed care functions, including ASO arrangements, payment incentives based on performance, intensive care management, community workers, educators, and linkages with primary care practices. ↩︎
California has a small PCCM program operating in LA County for those with HIV. South Carolina uses PCCM authority to provide care management services to approximately 200 medically complex children, but is not counted as a PCCM program for purposes of this report. ↩︎
Illinois reported the MCO penetration rate for all beneficiaries but did not report penetration rates for the individual eligibility categories. ↩︎
The five Medicaid expansion states without risk-based managed care were Alaska, Arkansas, Connecticut, Montana, and Vermont. ↩︎
Two other states (Colorado and Massachusetts) reported covering less than 75% MCO penetration for this group. Illinois reported the MCO penetration rate for all beneficiaries but did not report penetration rates for the individual eligibility categories. ↩︎
In the rule, CMS formalized its policy around “in lieu of,” which is an authority that a number of states were using to cover stays in IMDs prior to this rule. Some of these states must now adapt policies to meet the 15-day requirement, which may have fiscal and programmatic implications for these states. ↩︎
28 states answered “yes” for FYs 2018 and 2019: AZ, CO, DC, DE, FL, GA, HI, IA, IL, IN, KY, LA, MA, MI, MN, NJ, NM, NV, OH, OR, PA, RI, TN, TX, UT, VA, WA, and WI. 3 states (MO, SC, WV) plan to start using this authority in FY 2019. CA, MD, MS, NE and NH reported “no” and 3 MCO states – KS, NY, ND – did not provide a response. ↩︎
U.S. Congress, House, HR 6, 115th Congress (2017-2018)., September 28, 2018, Substance Use–Disorder Prevention that Promotes Opioid Recovery and Treatment (SUPPORT) for Patients and Communities Act https://www.congress.gov/115/bills/hr6/BILLS-115hr6eah.pdf↩︎
In April 2016, CMS issued a final rule on managed care in Medicaid and CHIP that provided a framework of plan standards and requirements designed to improve the quality, performance, and accountability of these programs. The current administration, however, is expected to release revised Medicaid managed care regulations for public comment. ↩︎
CMS, through the Health Care Payment Learning and Action Network, developed an APM Framework to create a common framework for measuring progress toward VBP. Category 1 includes fee-for-service strategies with no link to payment quality; Category 2 includes fee-for-service strategies with a link of payment to quality and value; Category 3 includes alternative payment models built on fee-for-service architecture; and Category 4 includes population-based payment. Information found at https://innovation.cms.gov/initiatives/Health-Care-Payment-Learning-and-Action-Network. ↩︎
Six states reported that they had no MLR specified in MCO contracts as of July 1, 2018 (GA, HI, NH, TN, TX and WI) but are monitoring MLR reporting by plans. Tennessee and Texas both noted that they rely on a methodology that controls for excess MCO profits. ↩︎
One of the 28 states reporting a PHP arrangement that is not included in Exhibit 12 is Alabama, which reported having a PHP for maternity care. ↩︎
In this report, Oregon’s Coordinated Care Organization (CCO) program is counted as an MCO program, but not as an ACO program, consistent with its CMS designation and the state’s survey response. According to the state, “A coordinated care organization is a network of all types of health care providers (physical health care, addictions and mental health care and sometimes dental care providers) who have agreed to work together in their local communities to serve people who receive health care coverage under the Oregon Health Plan (Medicaid).” (Oregon Health Authority website accessed at: http://www.oregon.gov/oha/HPA/Pages/CCOs-Oregon.aspx.) ↩︎
Consumer Assessment of Healthcare Providers and Systems ↩︎
Jack Hoadley, Karina Wagnerman, Joan Alker, and Mark Holmes, Medicaid in Small Towns and Rural America: A Lifeline for Children, Families, and Communities, Georgetown University Center for Children and Families and the University of North Carolina, NC Rural Health Research Program, (Washington D.C., June 2017), https://ccf.georgetown.edu/wp-content/uploads/2017/06/Rural-health-final.pdf. ↩︎
Project ECHO (Extension for Community Health Outcomes) increases access to specialty treatment in rural and underserved areas by using telehealth to link front-line clinicians with specialist mentors at an academic medical center or hub. ↩︎
The Substance Use Disorder Prevention that Promotes Opioid Recovery and Treatment for Patients and Communities (SUPPORT) Act, expected to be signed into law as this report was being finalized, contains a number of provisions related to Medicaid’s role in helping states provide coverage and services to people who need substance use disorder (SUD) treatment, particularly those needing opioid use disorder (OUD) treatment. For example, the Act includes new authority to cover IMD services for up to 30 days in a year for persons with an SUD. ↩︎
In FY 2019, Montana is eliminating live-in caregiver services and children’s case management under the 1915(c) waiver for individuals with I/DD and eliminating occupational therapy, dietician/nutrition services, overnight support, and companion services from the Severe Disabling Mental Illness (SDMI) waiver. ↩︎
After September 2016, with CMS approval, states can continue to transition eligible individuals through 2018 and expend remaining MFP funds through federal FY 2020. ↩︎
Oregon is not included in this count. The state terminated its MFP program, effective June 30, 2015. ↩︎
Most of these states are using current Section 1915(c) waivers that provide community transition services and environmental modifications for seniors, individuals with physical disabilities and/or individuals with intellectual or developmental disabilities, and some states offer housing coordinators or other search services to assist waiver beneficiaries. ↩︎
In June 2015, CMS issued an Informational Bulletin to clarify when and how Medicaid reimburses for certain housing-related activities, including individual housing transition services, individual housing and tenancy sustaining services, and state-level housing-related collaborative activities. CMS’s intent was to assist states in designing on-going benefits that support community integration for seniors, individuals with disabilities, and individuals experiencing chronic homelessness. Many of the services outlined in CMS’s Informational Bulletin were initially developed under the auspices of MFP… ↩︎
Fully Integrated Dual Eligible SNPs were created by Congress in Section 3205 of the Affordable Care Act to promote full integration and coordination of Medicaid and Medicare benefits for dual eligible beneficiaries by a single managed care organization. They must have a MIPPA compliant contract with a State Medicaid Agency that includes coverage of specified primary, acute and long-term care benefits and services under risk-based financing. For more information see: https://www.cms.gov/Medicare/Health-Plans/SpecialNeedsPlans/DualEligibleSNP.html#s3. ↩︎
Delaware, Florida, Iowa, Massachusetts, and New Jersey. ↩︎
Rhode Island did not provide response to enrollment policy for dual eligible persons with I/DD. ↩︎
Historically, Medicaid reimbursement for hospitals and nursing homes was cost-based, automatically reflecting incurred cost increases. When rates for these providers are frozen, such annual increases do not occur; hence for this report, rate freezes are counted as restrictions. ↩︎
Maryland was not able to report MCO rate changes for FY 2019 because rate development was not complete. ↩︎
Some states also have premium or claims taxes that apply to managed care organizations and other insurers. Since this type of tax is not considered a provider tax by CMS, these taxes are not counted as provider taxes in this report. ↩︎
The Deficit Reduction Act of 2005 modified section 1903(w)(7)(A) of the Social Security Act. This statute and the implementing regulations eliminated states’ ability to tax only Medicaid MCOs. ↩︎
U.S. Congress, House, HR 6, 115th Congress (2017-2018)., September 28, 2018, Substance Use–Disorder Prevention that Promotes Opioid Recovery and Treatment (SUPPORT) for Patients and Communities Act https://www.congress.gov/115/bills/hr6/BILLS-115hr6eah.pdf↩︎
U.S. Congress, House, HR 6, 115th Congress (2017-2018), September 28, 2018, Substance Use–Disorder Prevention that Promotes Opioid Recovery and Treatment (SUPPORT) for Patients and Communities Act https://www.congress.gov/115/bills/hr6/BILLS-115hr6eah.pdf↩︎
Gene therapy is used to treat or prevent genetic diseases by seeking to augment, replace or suppress one or more mutated genes with functional copies. CAR T-cell therapy is a form of immunotherapy that uses specially altered T cells (part of the immune system) collected from the patient to fight cancer. ↩︎
A “kick payment” is a supplemental payment over and above the capitation payment made to the MCO for beneficiaries utilizing a specified set of services or having a certain condition. ↩︎
Neither letter addresses the use of federal Medicaid funds for IMD mental health services. ↩︎
U.S. Congress, House, HR 6, 115th Congress (2017-2018)., September 28, 2018, Substance Use–Disorder Prevention that Promotes Opioid Recovery and Treatment (SUPPORT) for Patients and Communities Act https://www.congress.gov/115/bills/hr6/BILLS-115hr6eah.pdf↩︎
Several states mentioned plans to implement quantity limits based on a “morphine equivalent dose” (MED), which is the amount of opioid prescription drugs, converted to a common “standard” unit (milligrams of morphine). For example, both 60 mg of oxycodone (approximately 2 tablets of oxycodone sustained-release 30 mg) and approximately 20 mg of methadone (4 tablets of methadone 5 mg) are equal to 90 MMEs (morphine milligram equivalents). ↩︎
“Clinical edits” are clinically-based claims adjudication rules that a claims system will follow when processing a pharmacy claim. ↩︎
Step therapy prior authorization criteria involves requiring the use of another agent or therapy prior to the use of a specific opioid. ↩︎
Prescription Drug Monitoring Programs (PDMPs) are state-run electronic databases that are valuable tools for addressing prescription drug diversion and abuse. Currently, except for Missouri, every state and the District of Columbia operates a PDMP. ↩︎
In this year’s survey, Illinois did not report whether MCOs are required to follow Medicaid fee-for-service policies related to opioids and pharmacy benefit management. ↩︎
U.S. Congress, House, HR 6, 115th Congress (2017-2018)., September 28, 2018, Substance Use–Disorder Prevention that Promotes Opioid Recovery and Treatment (SUPPORT) for Patients and Communities Act https://www.congress.gov/115/bills/hr6/BILLS-115hr6eah.pdf↩︎
Substance Abuse and Mental Health Services Administration, “Medication-Assisted Treatment (MAT),” (Substance Abuse and Mental Health Services Administration, last updated 02/07/2018), https://www.samhsa.gov/medication-assisted-treatment. ↩︎
Substance Abuse and Mental Health Services Administration, “Medication-Assisted Treatment (MAT),” Substance Abuse and Mental Health Services Administration, last updated 02/07/2018, https://www.samhsa.gov/medication-assisted-treatment. ↩︎
Naltrexone does not carry abuse or diversion potential, and any provider licensed to prescribe medications can prescribe naltrexone. However, to prescribe or dispense buprenorphine, physicians must obtain a “waiver”. This process involves 1) registering with the Drug Enforcement Administration (DEA) to dispense controlled substances; 2) certifying intent to treat no more than 30 patients at one time in the first year; and 3) receipt of required training or certification. Physicians may apply to increase the allowable patient caseload, and if approved may treat up to 100 patients in their first year and up to 275 patients in subsequent years. Methadone may only be dispensed by opioid treatment programs certified by the Substance Abuse and Mental Health Services Administration (SAMHSA). Opioid treatment programs may also dispense buprenorphine. ↩︎
On last year’s budget survey, all 49 states that responded to a question about coverage of each of the MAT drugs reported coverage of buprenorphine and both oral and injectable naltrexone, but fewer states reported coverage of methadone. ↩︎
In this year’s survey, Illinois and Arkansas did not report whether their state covers Methadone to treat opioid use disorders. ↩︎
U.S. Congress, House, HR 6, 115th Congress (2017-2018)., September 28, 2018, Substance Use–Disorder Prevention that Promotes Opioid Recovery and Treatment (SUPPORT) for Patients and Communities Act https://www.congress.gov/115/bills/hr6/BILLS-115hr6eah.pdf↩︎
For the first time in a decade, states are reporting no overall growth in Medicaid enrollment last year and expecting minimal growth this year amid a stronger economy, a new Kaiser Family Foundation survey finds.
The 18th annual 50-state survey of Medicaid directors reveals that enrollment was flat in state fiscal year (FY) 2018 (down an average 0.6 percent), and states are budgeting for minimal increases during FY 2019 (up an average 0.9 percent).
States largely attribute the enrollment slowdown to a strengthening economy, resulting in fewer new low-income people qualifying for Medicaid. Some states also cited new efforts and systems to verify enrollees’ continued eligibility for the program as a factor.
At the same time, average combined federal and state Medicaid spending grew by 4.2 percent in FY 2018, similar to the previous year’s growth, and states project an average 5.3 percent increase in Medicaid spending in FY 2019.
The gap between enrollment and spending growth in part reflects lower enrollment growth for children and adults, who are relatively inexpensive to cover, compared to seniors and people with disabilities, who have more expensive needs. Other factors include:
High costs for prescription drugs, particularly specialty drugs such as hepatitis C antivirals, hemophilia factor, and some oncology, mental health and HIV drugs.
Increased spending on substance-use treatment, mental health services, and long-term care for seniors and people with disabilities; and
Policy decisions in many states to raise payment rates for certain Medicaid providers, such as nursing facilities, home- and community-based services, managed care organizations, and physicians.
In FY 2018, state spending grew slightly faster (4.9 percent) than total Medicaid spending (4.2 percent), as this was the first full state fiscal year that states were responsible for a share of the Affordable Care Act’s Medicaid expansion. Despite a modest increase in the state share of the expansion costs, states’ adopted budgets for FY 2019 anticipate that state spending for Medicaid will grow more slowly than total Medicaid spending (3.5 percent compared to 5.3 percent).
The annual survey provides an in-depth, state-specific examination of changes taking place in Medicaid programs. Some common themes include:
Changing eligibility. In response to the Trump administration’s encouragement, a growing number of states are pursuing federal waivers to add work requirements to Medicaid that are likely to result in enrollment declines. In FY 2019, eight states are planning to implement work or community engagement requirements, though some still are awaiting federal approval to implement. Three states (Idaho, Nebraska and Utah) could adopt the ACA Medicaid expansion through November 2018 ballot initiatives.
Controlling drug costs. In FY 2018, 22 states reported new or enhanced pharmacy cost-containment initiatives, and 19 plan to implement such initiatives in FY 2019. These changes often aim to boost rebate revenue or implement new prior authorization requirements, step therapy or other utilization controls.
Focusing on quality and value. States are continuing to focus on delivery system changes and managed care requirements to improve quality, outcomes and value. Nearly all states with comprehensive, risk-based managed care reported various quality initiatives. An increasing number of states (23 in FY 2018) are setting targets for alternative provider payment arrangements in managed care contracts. Many states encourage or require managed care organizations to screen enrollees for social needs, and about one-third of all states report initiatives for FY 2018 and FY 2019 that address social determinants of health outside of managed care.
Reducing opioid risks. All 50 states and the District of Columbia reported at least one pharmacy-management strategy aimed at addressing the opioid epidemic, including quantity limits on opioid drugs (50 states), clinical criteria claims system edits (48 states), step therapy (39 states) and other prior authorization requirements (44 states). In addition, most states that use managed care to deliver drug benefits require those organizations to follow some or all of these opioid policies.
Expanding benefits. In FY 2018, 19 states expanded their Medicaid benefits, and 24 plan to do so in FY 2019. The most common benefit enhancements involve substance use and mental health services, including waivers to allow Medicaid to pay for care in institutions for mental disease.
The 50-state survey, conducted by analysts at KFF and Health Management Associates in partnership with the National Association of Medicaid Directors (NAMD), will be discussed today at a briefing held jointly by KFF and NAMD. An archived webcast of the briefing, as well as copies of presentation slides and other materials, will be available online later today.
This year, during the annual Medicare Open Enrollment period, more than 60 million people on Medicare have the opportunity to choose between traditional Medicare and Medicare Advantage plans. In making this decision, they are encouraged to take into account a number of factors, including premiums, cost-sharing, extra benefits, drug coverage, quality of care, and provider networks. A potentially overlooked consideration is access to covered services; specifically, how prior authorization may affect beneficiaries’ access to covered services.
Medicare Advantage plans can require enrollees to get approval from the plan prior to receiving a service, and if approval is not granted, then the plan generally does not cover the cost of the service. Medicare Advantage enrollees can appeal the plan’s decision, but relatively few do so. Traditional Medicare, in contrast, does not require prior authorization for the vast majority of services, except under limited circumstances, although some think expanding use of prior authorization could help traditional Medicare reduce inappropriate service use and related costs. Optimally, prior authorization deters patients from getting care that is not truly medically necessary, reducing costs for both insurers and enrollees. Prior authorization requirements can also create hurdles and hassles for beneficiaries (and their physicians) and may limit access to both necessary and unnecessary care.
In this data note, we examine the share of Medicare Advantage enrollees in plans that impose prior authorization requirements for Medicare-covered services.
Findings
80 percent of Medicare Advantage enrollees are in plans that require prior authorization for at least one Medicare-covered service (Figure 1).
Figure 1: 4 in 5 Medicare Advantage enrollees are in plans that require prior authorization for some services
At least 70 percent of enrollees are in plans that require prior authorization for durable medical equipment, Part B drugs, skilled nursing facility stays, and inpatient hospital stays.
60 percent of enrollees are in plans that require prior authorization for ambulance, home health, procedures, and laboratory tests.
More than half of enrollees are in plans that require prior authorization for mental health services.
In general, Medicare Advantage plans typically use prior authorization for relatively high cost services used by enrollees with significant medical needs, such as inpatient care and drugs covered under Medicare Part B. Prior authorization is also being used to limit access to services for which there has been evidence of fraud, such as durable medical equipment, and for services, such as home health, that have experienced disproportionately rapid growth in Medicare spending, at least in certain parts of the country. Beginning in 2019, Medicare Advantage plans will also be allowed to use prior authorization in conjunction with step therapy for Part B (physician-administered) drugs, which could result in some enrollees being required to try a less expensive drug before a more expensive one is covered.
Whether prior authorization serves as an appropriate tool for limiting use of unnecessary care or a worrisome barrier to medically necessary care is an important question for both lawmakers and beneficiaries. Recently, more than 100 Members of Congress sent a letter to the Centers for Medicare and Medicaid Services (CMS) Administrator, Seema Verma, expressing concern about Medicare Advantage plans’ use of prior authorization, and asked CMS to collect data on the scope of prior authorization practices to enable better oversight. The HHS Office of the Inspector General (OIG) recently found that Medicare Advantage plans deny care – inappropriately – at relatively high rates. To the extent that the OIG findings are more the norm than the exception, they raise concerns for enrollees and questions as to whether prior authorization rules contribute to the relatively high rates of disenrollment among sicker Medicare Advantage enrollees.
Currently, CMS does not collect or disseminate plan-specific denial rates, as it is required to do for plans offered in the ACA marketplaces, nor assess the extent to which prior authorization rules affect enrollees’ access to various types of services. Greater transparency with respect to prior authorization could help explain how Medicare Advantage plans are managing care and costs, help beneficiaries choose among the many Medicare coverage options offered in their area, and help CMS carry out its important oversight responsibilities on behalf of the rapidly growing Medicare Advantage population.
Methods
This analysis uses data from the CMS Medicare Advantage Plan Benefits Package Files for 2018. The data indicate the services for which prior authorization is ever required, but do not convey the specific conditions under which prior authorization is required for a given service. Plan data are weighted by March 2018 enrollment.
While health care is an issue that touches almost everyone’s lives regardless of gender, there are ways in which women’s relationship with the health care system differs from that of their male counterparts. Previous research has found that compared to men, women use more health services, are more likely to take prescription medication, and are more likely to experience problems paying medical bills or forgoing needed health care because of the cost.1 In addition, women have particular needs for managing their health care during their reproductive years, when many women utilize family planning services, pregnancy-related health care, and maternity care. Finally, research has also found that among parents, women are more likely than men to have primary responsibility for managing the health care needs of children in their households.2
In Texas, three in ten women are low-income, almost one in five are uninsured, and the state has not expanded Medicaid as most others have.3 Over the last several years, there have been a number of changes in the state affecting women’s health care. This includes a decision to eliminate a federally-supported Medicaid family planning program and replace it with a narrower state-funded program. More recently, there has been widespread debate and attention to maternal mortality in the state. In fact, increasing access to health services for women during the year after pregnancy and throughout the interconception period was one of the major recommendations of the State Maternity Mortality and Morbidity Task Force and Department of State Health Services in a recently released report.
Given the relative importance of health care in women’s lives and the changes in Texas affecting women’s health care over the last several years, this report presents analysis from the Kaiser Family Foundation/Episcopal Health Foundation Texas Health Policy Survey to examine how women and men in Texas view health policy priorities in the state, including issues of particular importance to women such as maternal mortality and access to contraception. It also explores gender differences in the share of Texans who report problems paying medical bills and skipping or postponing health care because of the cost.
Findings
Women’s and Men’s Views on Health Care as a Priority in Texas
For both women and men in Texas, health care ranks among many priorities that residents would like the state legislature to prioritize. However, when it comes to both public education (76 percent versus 66 percent) and health care programs (59 percent versus 50 percent), a slightly larger share of women than men say the state legislature should increase spending. When it comes to other areas like infrastructure, public safety, transportation, and welfare programs, women and men are about equally likely to support state spending increases.
Figure 1: Texas Women More Likely Than Men To Support Increased State Spending On Public Education And Health Care
Looking deeper at the question of state health care spending, the overall gender difference on this question appears to be driven largely by differing attitudes between women and men who identify as Republicans. While majorities of both women and men who identify as Democrats and independents say the state legislature should increase spending on health care programs, there is a large gap among Republicans, with 51 percent of Republican women supporting increased state spending on health care programs compared with 29 percent of Republican men.
Figure 2: Biggest Gender Difference In Opinion On State Health Spending Is Among Republicans
When it comes to legislative priorities within health care, women and men in Texas generally rank priorities in a similar order, with a few exceptions. Among both women and men, majorities say lowering the cost of health care and prescription drugs, reducing maternal mortality, and increasing access to health insurance should be a “top priority.” The most notable exception to this agreement between women and men is related to increasing funding for mental health programs, which 63 percent of women say should be a top health priority, compared to just under half (46 percent) of men. Similarly, Texas women are more likely than men to say top priority should be given to expanding Medicaid to cover more low-income Texans (50 percent versus 42 percent), improving access to hospitals in rural areas (43 percent versus 33 percent), and increasing women’s access to family planning and contraception (41 percent versus 29 percent).
Figure 3: Women More Likely Than Men To Prioritize Mental Health, Medicaid Expansion, Rural Hospitals, Contraception Access
Poll: Most Texans say reducing the number of women who die from pregnancy / childbirth should be a top state priority even though few know about a recent increase in the state’s maternal mortality rate
Reducing the number of women who die from causes related to pregnancy and childbirth ranks high on the list of health priorities that both men and women in Texas want the state legislature to address. However, awareness about recent changes in the maternal mortality rate in the state is low. Although there has been some scientific controversy over the best way to measure maternal mortality, recent studies have observed a rise in these rates in Texas.4 When asked about maternal mortality in the state, a plurality of Texans (43 percent) say the rate has stayed about the same in recent years, while just 17 percent correctly answer that it has increased, another 17 percent think it has decreased, and 23 percent do not know enough to say. College graduates (24 percent) and women of reproductive age (23 percent of those ages 18-44) are only slightly more likely than their counterparts to correctly answer that the rate has increased.
Figure 4: Few Women Or Men In Texas Are Aware Of Recent Increase In Maternal Mortality Rate
Increasing women’s access to family planning services and contraception in Texas is an issue that is rated as a top health priority by a larger share of women than men (41 percent versus 29 percent). Despite this, women and men report similar views about the current state of access to such services in Texas. Overall, about half of Texans (48 percent) say women’s access to family planning services in the state is about right, including similar shares of women and men. However, among women of reproductive age (18-44 years), almost four in ten (37 percent) say it is too difficult for women in Texas to access these services. Partisan differences exist, too, with Democrats and independents more likely to say it’s too difficult for women to get these services, and Republicans about twice as likely as independents or Democrats to say it’s too easy.
Figure 5: Half Say Access To Family Planning In Texas Is About Right, But Many Reproductive-Age Women Say It’s Too Difficult
In addition to somewhat different opinions about health care priorities for the state, women and men in Texas report different experiences when it comes to health care affordability. While paying for health care can be a burden for both women and men, women are more likely than men to report that their families are struggling with the cost of health care. For example, over four in ten Texas women (44 percent) say they or someone in their family has had problems paying medical bills in the past 12 months, compared with about a third (32 percent) of men.
Women in the state are also more likely than men to say that they or someone in their household has skipped or postponed some type of medical care in the past 12 months because of the cost. Roughly half of women say affordability concerns have led someone in their household to skip dental care or checkups (51 percent) or put off getting needed health care (47 percent); four in ten say a household member has skipped a recommended medical test or treatment (40 percent) or not filled a prescription (38 percent); about a quarter (26 percent) report cutting pills in half or skipping doses of a medicine; and 17 percent say someone in their household has had problems getting mental health care because of the cost. Overall, seven in ten Texas women (69 percent) report at least one of these experiences, compared with just over half (53 percent) of men. These results are consistent with previous national studies that have found women are more likely than men to report problems paying medical bills or forgoing health care because of the cost.5
Figure 6: Texas Women More Likely Than Men To Report Skipping Or Postponing Health Care Due To Cost
Low-income adults are particularly vulnerable to problems with health care affordability; however it is notable that gender differences in the rates of such problems exist among both lower-income and higher-income Texans. For example, roughly half (53 percent) of Texas women with incomes below 250 percent of the federal poverty level (FPL) say they or a family member had problems paying medical bills in the previous 12 months, compared with about four in ten men (43 percent) with similar incomes. Similarly, lower-income women are more likely than lower-income men to report that someone in their household skipped or postponed some type of medical care in the past year because of the cost (78 percent versus 65 percent). Similar gender differences exist among higher-income households (those with incomes at least 250 percent FPL), with women more likely than men to report problems paying medical bills (32 percent versus 21 percent) and postponing or forgoing care (55 percent versus 41 percent).
Figure 7: Texas Women More Likely Than Men To Report Problems With Health Care Affordability, Regardless Of Income
Looking within racial/ethnic groups in Texas, a similar pattern by gender emerges. Among individuals who are non-Hispanic whites, women are more likely than men to report having problems paying medical bills (42 percent versus 25 percent) and forgoing health care because of the cost (67 percent versus 48 percent). Among Hispanics, women are more likely than men to report skipping or postponing some type of health care in the past year because of the cost (72 percent versus 58 percent), but roughly equal shares of Hispanic women and men report problems paying medical bills in the previous year (44 percent and 40 percent, respectively). In addition, 49 percent of Black women in Texas say they had problems paying household medical bills and 62 percent say someone in the household skipped or postponed some type of medical care due to cost (there were too few Black male respondents in the survey sample to report their responses separately.
Figure 8: Gender Differences On Health Care Affordability Exist Within Racial/Ethnic Groups In Texas
Poll: Most Texans say reducing the number of women who die from pregnancy / childbirth should be a top state priority even though few know about a recent increase in the state’s maternal mortality rate
Methodology
The Kaiser Family Foundation/Episcopal Health Foundation Texas Health Policy Survey was conducted by telephone March 28 – May 8, 2018 among a random representative sample of 1,367 adults age 18 and older living in the state of Texas (note: persons without a telephone could not be included in the random selection process). Interviews were administered in English and Spanish, combining random samples of both landline (439) and cellular telephones (928, including 688 who had no landline telephone). Sampling, data collection, weighting and tabulation were managed by SSRS in close collaboration with Kaiser Family Foundation and Episcopal Health Foundation researchers. Episcopal Health Foundation paid for the costs of the survey fieldwork, and Kaiser Family Foundation contributed the time of its research staff. Both partners worked together to design the survey and analyze the results.
The sampling and screening procedures included an oversample component designed to increase the number of respondents ages 18-64 with Medicaid or non-group health insurance coverage. This included 180 respondents who were reached by calling back respondents in Texas who had previously completed an interview on either the SSRS Omnibus poll or the Kaiser Health Tracking Polls and indicated they fit one of the oversample criteria (based on age and type of health insurance coverage). It also included an oversample of counties with higher shares of Medicaid recipients.
The dual frame cellular and landline phone sample was generated by Marketing Systems Group (MSG) using random digit dial (RDD) procedures. All respondents were screened to verify that they resided in Texas. For the landline sample, respondents were selected by asking for the youngest adult male or female currently at home based on a random rotation. If no one of that gender was available, interviewers asked to speak with the youngest adult of the opposite gender. For the cell phone sample, interviews were conducted with the qualifying adult who answered the phone.
A multi-stage weighting design was applied to ensure an accurate representation of the Texas adult population. The first stage of weighting involved corrections for sample design, including accounting for oversampling of high-Medicaid counties, as well as non-response for the callback sample. In the second weighting stage, demographic adjustments were applied to account for systematic non-response along known population parameters. Population parameters included gender, age, race, Hispanicity (broken down by nativity), educational attainment, phone status (cell phone only or reachable by landline), state region, and residence in a low-income county. This stage excluded the Medicaid and non-group oversample components. Based on this second stage of weighting, estimates were derived for types of health insurance coverage (Medicaid, non-group, employer-sponsored, all else) in the Texas population. The last stage of weighting included all respondents and included health insurance coverage based on the previous stage’s outcomes. Weighting parameters were based on estimates from the U.S. Census Bureau’s March 2017 Current Population Survey (CPS), with the exception of population density of the respondent’s county of residence which was based on the 2010 Census, and telephone use (cell phone-only, landline-only, dual-user) which was based on data from the January-June 2016 National Health Interview Survey.
The margin of sampling error including the design effect for the full sample is plus or minus 3 percentage points. The margin of sampling error for men and women in the sample is plus or minus 5 percentage points. For results based on other subgroups, the margin of sampling error may be higher. Sample sizes and margins of sampling error for subgroups are available by request. Note that sampling error is only one of many potential sources of error in this or any other public opinion poll. Kaiser Family Foundation public opinion and survey research is a charter member of the Transparency Initiative of the American Association for Public Opinion Research.
With the 2018 midterm election season in full swing, health care has emerged as one of the top issues for voters. The issue is playing a prominent role in many House, Senate, and gubernatorial races, and health-related measures have made it onto the ballot in several states. Democratic candidates, in particular, have made health care a central part of their campaigns and a focus of their political ads, highlighting popular provisions in the Affordable Care Act (ACA), including protections for people with pre-existing medical conditions. Republican candidates, in contrast, are talking less about health care following their failed attempt to repeal and replace the ACA last year, focusing more on taxes and immigration in their ads.1 Based on a review of media coverage and political advertising by candidates during the current election cycle, this election update explores select health care issues being discussed by candidates in key gubernatorial and Senate campaigns across the country as voters prepare to go to the polls in November. The tables in the Appendix highlight which of these select health care issues have been prominent or served as topics of candidate debate in each of the 71 races for Governor and Senate; a third table lists state ballot initiatives on these health care issues. The aim of this review is to assess where health care issues have been a focus of the candidates, not to assess the impact of these issues on voters.
Key Health Care Issues in Statewide Races and Ballot Measures
Medicaid Expansion and Other Program Changes
While not typically an election issue, Medicaid — particularly the Medicaid expansion created under the Affordable Care Act (ACA) — has become an important issue in a number of campaigns throughout the country. To date, 34 states including the District of Columbia have adopted the ACA’s Medicaid expansion. States may implement the expansion at any time, and while they can no longer receive 100% federal financing for three years, they remain eligible for enhanced federal financing of 93% in 2019 and 90% in 2020 and beyond.
Medicaid expansion has been more prominent in gubernatorial races than in Senate races, though it has surfaced in key Senate races in Florida and Texas. Particularly in non-expansion states, gubernatorial candidates have staked out opposing positions on whether to adopt the expansion, largely mirroring the long-standing ideological divide surrounding the ACA. In key races in Florida, Georgia, and Kansas, Democratic candidates have expressed support for Medicaid expansion as a way to increase coverage and improve access to care. Several Democratic candidates in red states where past efforts to expand Medicaid have stymied, particularly Stacey Abrams in Georgia and Laura Kelly in Kansas, tie Medicaid expansion to the future of rural health care in their states by arguing that Medicaid expansion will bolster rural hospital finances and prevent further rural hospital closures.23 Citing financial concerns and fears that it would be a step toward a single-payer health care system, Republican candidates in these states have opposed expanding Medicaid.
In addition, candidates in two key open gubernatorial races in states that have expanded Medicaid have softened positions on the Medicaid expansion since their states’ primaries. In Michigan, Republican candidate Bill Schuette, the current Attorney General, has long opposed the ACA in general and the Medicaid expansion in particular, vowing during the primary campaign to repeal the expansion. More recently, during the general election campaign, he has said Medicaid expansion is “the law” and “it’s not going anywhere.”4 Next door in Ohio, Republican candidate Mike DeWine also retreated from opposition to Medicaid expansion following his primary win, indicating that he would maintain the program if work requirements are implemented.5 Democratic gubernatorial candidates in both states support expansion and oppose adding work or other requirements.
Medicaid expansion has also made it onto the ballot in three states — Idaho, Nebraska, and Utah — giving voters the authority to decide whether their states will adopt the expansion. Voters in Montana will also decide whether to extend Medicaid expansion beyond 2019. Not surprisingly, Medicaid expansion has been a point of disagreement in Idaho and Nebraska, where both Democratic candidates support expansion and the Republican candidates oppose the expansion but have indicated that they will enforce the will of the people.
While expansion has dominated campaign platforms that include Medicaid, other Medicaid issues have entered the campaigns in a few states. In Iowa, the shift of the state’s Medicaid program to managed care has been controversial. Republican Governor Kim Reynolds, who is running for reelection, supports the effort, while her opponent, Democrat Fred Hubbell, does not.6 Implementation of Medicaid managed care has also proven contentious in Kansas.
The Affordable Care Act
Protections for people with pre-existing conditions
Among the most popular provisions in the ACA are the protections provided to people with pre-existing medical conditions. The ACA prohibits insurers from denying people coverage or charging them more because they have a health condition. The ACA also outlaws pre-existing condition exclusions as well as annual and lifetime limits on coverage, which curb insurer liability but often leave people with significant health needs with inadequate coverage. According to recent polls, a majority of the public says that it is very important to maintain these protections.
Among health care issues, the debate over pre-existing condition protections has been most in the spotlight in the 2018 midterm elections. In many races, Democrats who support these protections have made the issue the centerpiece of their campaigns. In light of the strong public support for protecting those with pre-existing medical conditions, nearly all candidates from both parties say they want to see these protections maintained. However, a number of Republican candidates have had to defend prior positions that many argue would undermine these protections, including backing repeal of the ACA or supporting current legal challenges to the ACA that, if upheld, would eliminate these protections. For example, in the tight Senate race in Missouri, Republican candidate and state Attorney General Josh Hawley has signed on to Texas v. Azar, the latest legal challenge to the ACA. In response to criticism of this position,7 Hawley has also said that he supports maintaining pre-existing condition protections in any ACA replacement proposal and has proposed an invisible reinsurance program as a better approach.8
While candidates are discussing pre-existing condition protections in a number of races, the issue is particularly salient for Senate Democratic incumbents running for reelection in states that President Donald Trump won in 2016. Claire McCaskill, who is running against Hawley, is one such Democrat, as is Joe Manchin of West Virginia, who is running against Republican candidate and state Attorney General Patrick Morrisey, who also signed on to Texas v. Azar.9 In North Dakota, Democratic incumbent Heidi Heitkamp is fighting the same battle against Republican challenger Kevin Cramer, who as a congressional representative voted in 2017 to repeal and replace the Affordable Care Act and weaken its pre-existing condition protections. Other Republican candidates who voted for this bill — the American Health Care Act of 2017 — are facing attacks from their Democratic opponents and outside groups, including Martha McSally in Arizona’s Senate race.10 Incumbent Senator Joe Donnelly, Democratic nominee in Indiana, has strongly emphasized his support for pre-existing conditions while his Republican opponent, Mike Braun, claims support for pre-existing condition protections despite supporting legislation and lawsuits to weaken them.11 While this issue is more central in the Senate races, it has featured prominently in several key gubernatorial races, including Florida, Ohio, and Wisconsin.
The Individual market
While the debate over pre-existing conditions has dominated many campaigns, other issues related to the ACA and its future have also been important. Although efforts to repeal and replace the ACA failed last year, some candidates in midterm races continue to call for repeal. In Michigan, for example, Republican gubernatorial candidate Bill Schuette has expressed support for repealing and replacing the ACA. However, this position is not as common as it was in the previous two midterm elections (2010 and 2014).12
Rather than trying to avoid talking about the ACA as they have in past elections, Democratic candidates are focusing on ways to improve it through proposals to stabilize and shore up the individual market. For example, the Democratic gubernatorial candidate in Michigan, Gretchen Whitmer, supports the ACA but acknowledges that premiums are too high. To address these costs, she has proposed stabilizing premiums in the individual market through a state reinsurance program, similar to those adopted in several states.13
Single Payer/Medicare-for-All
The concept of a single payer health system gained attention during the 2016 presidential campaign, with Bernie Sanders making his “Medicare-for-All” proposal a foundation of his platform. This issue, more than others, highlights the wide gulf between progressive Democratic candidates who view the proposal as a way to address affordability and access challenges and conservative Republican candidates who characterize the proposal as a step toward socialism.
While candidates in traditionally blue states, such as Kirsten Gillibrand in New York, can safely advocate for a Medicare-for-All proposal, Democratic senatorial candidates in traditionally red states, facing strong attacks from Republican opponents on the issue, have taken more nuanced positions or have stated their opposition to the idea. Democrat Beto O’Rourke in Texas, who is running against incumbent Republican Ted Cruz, has not shied away from support for universal coverage; however, he does not advocate Medicare-for-All as the only approach.14 Instead, he has highlighted his goal of universal health care coverage through solutions such as Medicaid expansion, ACA market stabilization, and creating a public option on the exchanges, while acknowledging that single-payer would also achieve this goal. Kyrsten Sinema, who is locked in a tight race against Martha McSally in Arizona, is similarly focusing on “realistic and pragmatic solutions” but has said that she does not support Medicare-for-All.15
Democratic candidates in gubernatorial races have been more forthright with their support for a single-payer or Medicare-for-All system, even those in more conservative states. For example, Democratic candidate Andrew Gillum in Florida beat more moderate rivals in the state primary and is running on Medicaid expansion and movement to a single-payer health care system.16 While he would not be in a position to vote on federal health care laws such as Bernie Sanders’ “Medicare for All” bill that he supports, Gillum has made progressive health care positions central to his campaign. Gavin Newsom in California and Jared Polis in Colorado have also voiced support for Medicare-for-All.
At the same time, Republican candidates have intensified attacks on Democrats’ support for Medicare-for-All as a step toward socialism. Gillum’s Republican rival, Ron DeSantis, has not yet unveiled a detailed health care platform but has consistently opposed the ACA and Medicaid expansion. He has attacked Gillum’s positions and health care platform as “socialist.”17
Abortion and Women’s Reproductive Health
With the confirmation in October of Supreme Court Justice Brett Kavanaugh, abortion is once again in the political spotlight. In the near future, the Supreme Court could hear a case that could challenge existing federal protections of abortion rights under Roe v. Wade, as well as other subsequent Supreme Court rulings. Sixteen states already have laws in place that would prohibit abortions in the state if Roe were to be overturned, and other states have passed laws expressing their intent to limit access to abortion to the maximum extent possible. In contrast, nine states have laws protecting women’s access to abortion in the possible absence of Roe.18
During their general elections, Senate and gubernatorial candidates have treated abortion as a divisive issue and varied regarding whether or not to highlight it in their races. In the Tennessee Senate race, for example, Republican candidate and incumbent Marsha Blackburn has a strong pro-life history, including as a leader of past efforts to investigate and stop all public payments to Planned Parenthood for family planning services.19 Despite that history and the fact that Blackburn’s opponent, Democrat Phil Bredesen, has expressed his pro-choice views and support for continued funding of Planned Parenthood, abortion has not come to the forefront in the race. In Iowa, the Republican nominee is current Governor Kim Reynolds, who in May 2018 signed the “heartbeat” bill — one of the country’s most restrictive abortion prohibitions — into law.20 She has maintained solid support for this bill, which is currently being stayed during litigation, while her Democratic opponent Fred Hubbell has expressed his opposition to the bill and highlighted his support for Planned Parenthood funding.21 On the campaign trail, some candidates have addressed state and federal payments to Planned Parenthood. For example, incumbent Republican Senator Roger Wicker of Mississippi has been outspoken in his support of state efforts to exclude Planned Parenthood from receiving Medicaid reimbursement for family planning services, whereas his opponent, Democrat David Baria, has voiced support for continuing funding to Planned Parenthood.
Ballot measures in three states — Alabama, Oregon, and West Virginia — also address abortion. The West Virginia measure, if approved, would amend the state constitution to stipulate that there is no state protection of abortion rights, laying the groundwork for state prohibition of abortion if the Supreme Court overturns Roe v. Wade. In Alabama, the ballot measure goes further, adding language to “recognize and support the sanctity of unborn life and the rights of unborn children, including the right to life.” If enacted, this language could have wide-ranging implications, including making abortion illegal in the state. It could also affect state policies on access to contraception and in vitro fertilization services. In Oregon, a state with generally broad protections for abortion, the ballot measure would prohibit public funding for abortions, jeopardizing state funding for abortions under Medicaid, except when medically necessary or when required by federal law (when pregnancy is the result of rape or incest or poses a threat to the pregnant woman’s life).
Looking Ahead
Health care is shaping up to be a central issue in this year’s midterm elections. In a number of key gubernatorial and Senate races, protections for people with pre-existing conditions, Medicaid expansion, and even Medicare-for-all are important campaign issues. Although not included in the discussion here, these issues are resonating in House races across the country as well. This year, with increased public support for the ACA, the traditional battle lines over these issues have been upended. Democrats, who had been defensive on the ACA in past elections, are now embracing aspects of the law, even if they do not reference the law by name. While many Republican candidates still oppose the ACA, the simple message of repealing the ACA risks alienating moderates and even some Republican voters who have benefited from the ACA’s coverage expansions and insurance market changes. Instead, these candidates are now pledging support for maintaining popular pre-existing condition protections, even as they criticize other aspects of the law.
The outcome of the election could prove pivotal to the future of the ACA and the Medicaid expansion. Despite the popularity of some provisions of the law, Republicans in Congress have indicated that if they retain control, they will try once again to repeal and replace the ACA. If, however, Democrats gain control of the House, it is likely the ACA will remain in place. At the same time, voters in Idaho, Nebraska, and Utah will have a direct say in whether their states adopt the Medicaid expansion. In several other non-expansion states, the outcome of gubernatorial races could move their states closer to expanding Medicaid. Although health care has been an important topic in the midterm campaigns, voters’ response to a broad range of issues will determine the outcome of elections for Governor and Congress and will ultimately shape the next round of health care policy.
Appendix: Governor Races
>
NOTES: The Race Rating is based off the Cook Political Report identification of toss-up races or where party affiliation is expected to change. * denotes the incumbent. The tables list candidates from the two major parties as well as any third-party candidates identified by RealClearPolitics. There are additional third-party candidates not listed here who are on the ballot in the following states: AK, AZ, AR, CO, CT, FL, GA, HI, ID, IL, IA, KS, MD, MI, MN, NV, NY, OH, OK, OR, PA, RI, SD, TX, VT, WI, and WY. On October 19, 2018, Alaska Gov. Walker announced the suspension of his campaign, but he is included in this table, as his name will still appear on the ballot.
NOTES: The Race Rating is based off the Cook Political Report identification of toss-up races or where party affiliation is expected to change. * denotes the incumbent. The tables list candidates from the two major parties as well as any third-party candidates identified by RealClearPolitics. There are additional third-party candidates not listed here who are on the ballot in the following states: AZ, CT, DE, MA, MD, MI, MN, MS, MO, MT, NE, NV, NJ, PA, TN, TX, UT, VT, VA, WV, and WY.
To identify races in which health care was a key topic in the campaigns as well as a point of difference between the candidates, we scanned coverage of candidate debates, speeches, and platforms following state primaries. These tables highlight our findings for Governor and Senate races along with key ballot measures. Our goal was to identify where health care is a hot topic, but not to rank health care as an issue for voters.
The tables above aggregate information on health policy issues that are salient in statewide political races (Governor and Senate) or ballot measures in the 2018 midterm elections. The selected issues do not represent the universe of health policy topics discussed in 2018 campaigns but were chosen to highlight issues on which the candidates were more likely to differ. The order of the columns does not reflect the importance of the topics. Highlighted states indicate those considered “toss-up” races or most likely to flip parties, based on Cook Political Report ratings current as of October 19, 2018.
The sources for the tables are media reports and political advertisements and statements collected during the midterm general election season, through October 19, 2018. The cited reports include only those after a given race’s primaries, in an effort to present candidates’ most current positions. Thus, the timeframes vary by state and race.
Media sources were collected through a two-part process: first, a daily scan of 10 newsletters (including the Washington Post’s “The Health 202” and Morning Consult’s “Health”) for coverage of health care in key statewide midterm races; second, a state-by-state internet search across four topic areas (Medicaid, Affordable Care Act, single payer, and reproductive health, as well as their sub-topics) to capture media reports on races that may not have risen to the level of national coverage. Candidates’ campaign websites were generally not used as primary sources but as a check against positions presented in the media.
For the Governor and Senate tables, sources prompted check marks for a health care issue if they described differences between candidates on that issue or characterized the issue as important to the race. Issues did not receive check marks solely for appearing on a candidate’s campaign website or in a media report’s list of candidate positions. Rather, they received check marks for rising to the level of discussion in the campaign. This discussion took the form of media sources describing differences in candidates’ positions, a candidate’s political advertisement attacking an opponent’s position and presenting an alternative view, or media sources describing candidates’ changes in position.
The KFF Election Tracking Poll finds the Democratic Party has the edge over the Republican Party on the public’s trust to do a better job dealing with a series of health issues. Six in ten say they trust the Democratic Party to do a better job dealing with women’s access to reproductive health services (61 percent), maintaining Medicaid expansion (58 percent), continuing the Affordable Care Act’s protections for people with pre-existing conditions (58 percent), and improving the health of minority populations (58 percent). In fact, at least twice as many say they trust the Democratic Party to do a better job on these issues than say the same about the Republican Party. The Democratic Party also has an edge over the Republican Party on the future of the ACA (54 percent vs. 30 percent) and improving rural health care (50 percent vs. 32 percent). Less than half of the public say they trust either party on addressing the prescription painkiller addiction epidemic, reducing health care costs, and controlling Medicaid spending.
Figure 1: Public More Likely To Trust Democratic Party To Do A Better Job Dealing With Most Health Care Issues
The public’s trust in parties largely falls along partisan lines with majorities of Democrats saying they trust the Democratic Party and majorities of Republicans trusting the Republican Party. A larger share of independents say they trust the Democratic Party than the Republican Party on many issues including women’s access to reproductive health services (60 percent vs. 21 percent), continuing protections for people with pre-existing conditions (60 percent vs. 19 percent), improving the health of minority populations (55 percent vs. 24 percent), maintaining Medicaid expansion (55 percent vs. 23 percent), the future of the ACA (53 percent vs. 25 percent), and improving rural health care (44 percent vs. 29 percent).
Table 1: Which Party Do Independents Trust On Health Issues?
AMONG INDEPENDENTS:Which party do you trust to do a better job of dealing with the following?
Democratic Party
Republican Party
Women’s access to reproductive health services
60%
21%
Continuing the ACA’s protections for people with pre-existing conditions
60
19
Improving the health of minority populations
55
24
Maintaining Medicaid expansion*
55
23
The future of the ACA
53
25
Improving rural health care
44
29
Reducing health care costs
42
32
Addressing the prescription painkiller addiction epidemic
36
34
Controlling Medicaid spending
33
42
Note: Medicaid expansion was only asked among those living in states that have expanded their Medicaid programs.
In an expansive look at the 2018 midterm elections, the latest KFF Health Tracking Poll includes an in-depth examination of the role health care may be playing in midterm elections nationally, as well as in Florida and Nevada, two bellwether states with competitive Senate and Gubernatorial elections in which candidates from both parties are talking about health care issues.
Poll: As Midterms Approach, Health Care Remains Voters’ Top Issue, But President Trump and Other Factors Also Loom Large
A majority of voters – nationally, in battleground areas with competitive elections, and in Florida and Nevada – say health care is “very important” in making their voting decisions for Congress this year, and at least a quarter choose health care as the “most important issue,” topping all other issues. Health care ranks lower for Republican voters, behind immigration and the economy and jobs, but tops the list for Democrats and independents. Health care costs unite voters nationally and in the bellwether states, with voters offering costs as the top health care issue in this election. Other issues vary by partisanship with partisan voters mentioning party platform issues such as increasing access and repealing the Affordable Care Act (ACA).
In Bellwether Elections in Florida and Nevada, Voters Want Candidates to Protect People with Pre-Existing Conditions from Insurance Discrimination
A majority of Florida and Nevada voters say they are more likely to vote for a candidate who supports maintaining the ACA’s protections for people with pre-existing conditions, making this the most popular candidate position on health care across partisanship in both bellwether states. Slightly more than half of people living in Nevada and Florida say they or someone in their household has a pre-existing condition.
Medicaid expansion is another health care issue that could be on the minds of voters living in non-expansion states (including those living in states with Medicaid expansion ballot measures). In Florida, where the Democratic gubernatorial candidate supports Medicaid expansion, majorities of Democratic voters (74 percent) and independent voters (53 percent) say they are more likely to vote for a candidate who supports expansion, while a majority of Republican voters in the state (52 percent) say they are more likely to vote for a candidate who wants to “keep Medicaid as is.” Overall, a majority of people living in non-expansion states would like to see their state expand Medicaid.
The poll also finds while most voters say they are prioritizing candidates’ position on issues above the political environment, majorities of voters say candidate and political dynamics – including the candidates’ support for or opposition to President Trump – will be major factors in voting decisions.
Health Care Ranks As Voters’ Most Important Issue, But There Are Partisan Splits
Leading up to the 2018 midterm elections, seven in ten voters (71 percent) say health care is “very important” in making their voting decision for Congress this year, slightly larger than the shares that say the same about the economy and jobs (64 percent). Majorities also say the same about gun policy (60 percent), immigration (55 percent), tax cuts and tax reform (53 percent) and foreign policy (51 percent).
While at least half of voters say all of the issues provided are “very important” to their vote, when asked to choose the one issue that is the “most important” in their voting decision for Congress this year, the largest share of voters chooses health care (30 percent). This is followed by the economy and jobs (21 percent), gun policy (15 percent), and immigration (15 percent). This is consistent with previous KFF polling throughout the 2018 midterm cycle, which has regularly found health care among the top issues voters want to hear candidates talk about during their campaigns.
Figure 1: Health Care Is Top Issue For Voters In the Midterm Elections
Health care is also chosen as the “most important” issue by Democratic voters (40 percent) and independent voters (31 percent) but ranks lower for Republican voters (17 percent) behind immigration (25 percent) and the economy and jobs (23 percent) and similar to gun policy (17 percent).
Figure 2: Health Care Tops Issues Among Democratic And Independent Voters, Ranks Lower Among Republican Voters
Health care is also the top issue chosen by voters who live in battleground areas (28 percent), ranking above the economy and jobs (22 percent), immigration (16 percent), gun policy (15 percent), tax cuts and tax reform (8 percent), and foreign policy (5 percent).
2018 Midterm Election Analysis
As part of Kaiser Family Foundation’s effort to examine the role of health care in the 2018 midterm elections, throughout the year we will be tracking the views of voters – paying special attention to those living in states or congressional districts in which both parties have a viable path to win the election. This group, referred to in our analysis as “voters in battlegrounds” is defined by the 2018 Senate, House, and Governor ratings provided by The Cook Political Report. Congressional and Governor races categorized as “toss-up” were included in this group. A complete list of the states and congressional districts included in the comparison group is available in Appendix A.
While health care is the top issue for voters living in battleground areas overall, similar to the national picture – the ranking of issues varies by partisanship. Nearly four in ten Democratic battleground voters (37 percent) chose health care as the “most important issue” in their voting decision for Congress this year as did three in ten independent battleground voters (28 percent), making it among the top issues for both groups. However, among Republican battleground voters, immigration is the top issue (29 percent) while health care ranks among other issues such as gun policy (16 percent) and the economy and jobs (15 percent).
Table 1: Top Issues for 2018 Battleground Voters
Percent who say each of the following is the “most important” issue in making their decision about who to vote for Congress this year:
AllBattleground Voters
Democratic Battleground Voters
Independent Battleground Voters
Republican Battleground Voters
Health care
28%
37%
28%
17%
The economy and jobs
22
22
27
15
Immigration
16
11
11
29
Gun policy
15
16
15
16
Tax cuts and tax reform
8
7
8
12
Foreign policy
5
3
6
6
Although health care is a top issue for voters leading into the midterm elections, less than half of voters say they are hearing “a lot” from political candidates about specific health care issues. While a majority of voters say they are hearing “a lot” from political candidates about immigration (58 percent) and half say they are hearing “a lot” about the candidates’ support for or opposition to President Trump (48 percent), fewer voters say they are hearing “a lot” about health care issues such as the ongoing prescription painkiller addiction epidemic (38 percent), the 2010 health care law (35 percent), and continuing protections for people with pre-existing conditions (23 percent). Even fewer voters say they have heard about a national health plan, or Medicare-for-all plan (17 percent), the future of Medicare (17 percent), or unexpected or surprise medical bills (11 percent).
Figure 3: Voters Say They Are Hearing About Immigration, President Trump From 2018 Candidates
There are thirteen gubernatorial elections taking place this fall in states that have not expanded their Medicaid programs as part of the implementation of the 2010 Affordable Care Act (ACA); as well as four states where Medicaid expansion is on the ballot (Utah, Idaho, Nebraska, and Montana). In states without Medicaid expansion, few voters say they have heard “a lot” about this issue (15 percent).
Health Care Costs CONTINUE TO be top Health CaRE iSSUE for voters, VOTERS ALSO TALK ABOUT INCREASED ACCESS
As in previous KFF Tracking Polls, this month’s tracking poll continues to find health care costs as one of the top health care issues to voters. When voters who say health care is “very important” to their decision about who to vote for are asked to say in their own words what health care issue they mean, one-fourth (24 percent of all voters) offer health care costs including prescription drug costs. Voters also mention increasing access to health care (19 percent of all voters). Fewer voters mention opposition to or repealing the ACA (8 percent of all voters), Medicare or senior concerns (7 percent of all voters), or concerns about quality of coverage or care (5 percent of all voters). A small share of voters mention, either positively or negatively, single-payer or Medicare-for-all (4 percent of all voters).
Figure 4: Health Care Costs, Increased Access Are Top Health Care Issues For Voters
Health care costs are also among the top health care issue offered by all partisan voters including about one-fourth of independent voters (27 percent) and Republican voters (23 percent), and about one-fifth of Democratic voters (22 percent). Other issues vary by partisanship with three in ten Democratic voters offering increased access (31 percent) as the most important health care issue while one-fifth of Republican voters (18 percent) offer opposition to/repealing the ACA.
Figure 5: Health Care Costs Is Among The Top Health Care Issues Across Partisans
Health Care Voters
Over the past six months, the Kaiser Family Foundation has been tracking a unique group of voters – health care voters. When asked how important a series of issues will be in their 2018 congressional vote choice, these voters say health care is the “most important issue.” The share of voters who are categorized as “health care voters,” has increased only slightly over the past six months, from 23 percent to 30 percent of all voters. To compare the demographic profile of health care voters to other voters, see our health care voter interactive.
2018 Voters Are Weighing Various Factors in Their Decisions
In addition to candidates’ position on issues, other factors could play a role in voters’ decisions about who to vote for this year. When asked which will play a bigger role in their voting decisions, six in ten voters (57 percent) say “the candidates’ positions on specific issues” will play a bigger role in their decision about who to vote for than “the broader political environment, including a candidate’s support for or opposition to President Trump” (38 percent). Larger shares of independent voters (64 percent) and Democratic voters (56 percent) prioritize the candidates’ positions on specific issues while Republican voters are more divided with similar shares saying candidates’ positions on issues (49 percent) and the broader political environment (48 percent) will play the biggest role. Voters in battleground areas also say they prioritize candidates’ positions on issues (58 percent vs. 38 percent).
Figure 6: More Voters Say Issues Will Matter More Than Politics During Upcoming Election
Yet, majorities of voters say various political and candidate dynamics will be major factors in 2018. At least two-thirds of voters say the candidates’ character and experience (73 percent), which party controls Congress (66 percent), or the candidates’ support for or opposition to President Trump (66 percent) will be a “major factor” in their voting decision for Congress this year. Fewer voters say the same about the candidates’ political party (51 percent). Despite the recent attention to the increase in female candidates running in 2018, a majority of voters (78 percent) say the candidates’ gender is “not a factor” in their voting decisions.
Figure 7: Majority Of Voters Say Candidate Characteristics And Politics Will Be Major Factors In 2018 Vote
A larger share of Democratic voters (81 percent) say candidate dynamics such as their character and experience will be a “major factor” in their voting decisions compared to Republican voters (69 percent) and independent voters (68 percent). In addition, eight in ten Democratic voters say a candidate’s position on President Trump (79 percent) will be a “major factor,” compared to two-thirds of Republican voters and half (53 percent) of independent voters. Majorities of both Democratic voters (78 percent) and Republican voters (73 percent) say that political dynamics such as which party controls Congress as well as the candidates’ political parties will be major factors in voting decisions (63 percent and 62 percent, respectively).
Table 2: Major Factors in 2018 Vote Vary by Partisanship
Percent who say each of the following is a major factor in their decision about who to vote for Congress:
Democratic voters
Independent voters
Republican voters
The candidates’ character and experience
81%
68%
69%
The candidates’ support for or opposition to President Trump
79
53
66
Which party controls Congress, the Republicans or the Democrats
78
52
73
The candidates’ political party
63
34
62
The candidates’ gender
10
4
4
Health Care Is Most Important Issue Among Voters In Bellwether States
In addition to this month’s KFF Health Tracking Poll, this report also includes two state-based surveys: Florida and Nevada. Both of these bellwether states have competitive Gubernatorial and Senate elections in which candidates are campaigning on various health care issues. According to a recent report from the Wesleyan Media Project, two-thirds of Nevada Senate and congressional campaign advertisements during September focused on health care issues as did one-fourth of Florida Senate and congressional campaign ads.1
Health care is the top issue among Florida voters (26 percent) and among the top issues for Nevada voters (24 percent), along with immigration (23 percent) and the economy and jobs (21 percent).
Figure 8: Health Care Is Top Issue In Florida And Ranks Among Top Issues In Nevada
Similar to the national findings, when asked what they mean when they say health care is very important to their vote in 2018, Florida and Nevada voters most frequently mention health care costs. Three in ten Florida voters (29 percent) mention health care costs as do one-fourth of Nevada voters (24 percent). Health care costs were also among the most frequently mentioned health care issue across partisan voters in both bellwether states, but other issues in each of the states vary slightly across party identification.
Specific Health Care Issues May Drive Partisan Voters In Bellwether States
While health care is a top national issue, the role that candidates’ positions on specific health care issues play in elections can vary in states and by party identification. This month’s look at the role of health care in two bellwether states finds that majorities of voters in Florida and Nevada say they are more likely to vote for a candidate who wants to maintain the ACA’s protections for people with pre-existing conditions; voters are more divided on whether they would vote for a candidate who holds other health care positions.
A majority of Florida voters (69 percent) say they are more likely to vote for a candidate who wants to “maintain the ACA’s protections for people with pre-existing conditions” while few (9 percent) say they are more likely to vote for a candidate who wants to eliminate these protections, regardless of the fact that this may lead to increased costs for some healthy people.
On the other five health care issues provided, no one side of the position received majority support. About half of Florida voters say they are more likely to vote for a candidate who wants to expand Medicaid (49 percent), supports increasing regulation of prescription drug prices (47 percent), or wants to increase women’s access to reproductive health services (47 percent), in each case substantially larger than the share who say they’d be more likely to vote for a candidate who takes the opposite position. A slightly larger share of Florida voters (43 percent vs. 33 percent) say they are more likely to vote for a candidate who supports passing a national health plan, a proposal being pushed by Democratic gubernatorial candidate Andrew Gillum. When it comes to the ACA, Florida voters are divided with similar shares saying they are more likely to support a candidate who wants to repeal or protect the ACA.
Figure 9: Most Florida Voters Say They Are More Likely To Vote For Candidate Who Supports Pre-Existing Condition Protections
Similarly, seven in ten Nevada voters (68 percent) say they are more likely to vote for a candidate who wants to maintain the ACA protections for people with pre-existing conditions. In addition, a slight majority of Nevada voters (53 percent) say they are more likely to vote for a candidate who wants to increase women’s access to reproductive health services while one in five (18 percent) say they are more likely to vote for a candidate who wants to decrease access.
Nearly half of Nevada voters also say they are more likely to vote for a candidate who wants to protect the ACA (47 percent) or supports passing a national health plan, or Medicare-for-all (47 percent), while about three in ten say they’d be more likely to vote for a candidate who takes the opposite position on each of these issues. Nevada voters are more divided on the regulation of prescription drug prices, with similar shares saying they are more likely to vote for a candidate who supports increasing regulation (39 percent) as opposes increasing regulation (32 percent).
Figure 10: Most Nevada Voters Will Vote For Candidates Who Support Pre-Existing Protections, Access To Reproductive Services
Across Parties, Significant Shares of nevada and Florida Voters Say they Are More Likely to Vote for A Candidate Who Wants to Keep Pre-existing protections
Significant shares of partisan voters in Florida and Nevada say they are more likely to vote for a candidate who wants to maintain the ACA’s protections for people with pre-existing conditions – including majorities of Democratic voters (90 percent and 71 percent in Florida and Nevada, respectively), independent voters (73 percent and 72 percent, respectively), and a majority Republican voters in Nevada (60 percent) and nearly half of Republican voters in Florida (46 percent).
Figure 11: Large Shares Of Florida And Nevada Voters Say They Will Vote For Candidate Who Maintains Pre-Existing Conditions
One reason why maintaining the ACA’s protections for people with pre-existing conditions is a popular candidate position in both bellwether states may be because slightly more than half of Nevadans (55 percent) and Floridians (54 percent) live in households with someone who has a pre-existing condition. This is consistent with the share of the public overall who live in households with someone who has a pre-existing condition (53 percent).
Figure 12: Slightly More Than Half Of Florida And Nevada Residents Say They Or Household Member Has Pre-Existing Condition
Partisan Voters Differ On Most Important health Care Positions
The KFF Tracking Poll also asked Florida and Nevada voters which of the provided health care positions was the most important to their vote choice this fall. No one position garnered majority support with partisans in both states selecting various party platforms as most important.
Three in ten Republican voters in Florida (31 percent) say repealing the ACA is the most important candidate position on a health care issue in determining their vote for Congress. On the other hand, nearly one-fourth of independent voters (23 percent) and two in ten Democratic voters (21 percent) in Florida say a candidate supporting a national health plan, or Medicare-for-all plan is the most important health care position for a candidate to take in determining their vote. The only health care position that ranks among the top three for all partisan voters in Florida is maintaining the ACA’s protections for people with pre-existing conditions with more than one in ten Democratic voters (18 percent), independent voters (15 percent), and Republican voters (12 percent) saying this is the most important position in determining their vote.
Figure 13: Florida Voters Divided On Which Health Care Position Matters Most To Their Vote
Similar to Florida, three in ten Republican voters (29 percent) in Nevada say repealing the ACA is the most important candidate position on a health care issue in determining their vote for Congress. On the other hand, a nearly similar share of Democratic voters (31 percent) say a candidate supporting a national health plan, or Medicare-for-all plan is the most important health care position for a candidate to take in determining their vote. For independent voters in the state, continuing the ACA’s protections for people with pre-existing conditions tops the list of candidate positions on health care issues (27 percent). Once again, maintaining the ACA’s protections for people with pre-existing conditions is the only health care position that ranks among the top three for all partisan voters in Nevada (24 percent of Republicans and 21 percent of Democrats).
Figure 14: Nevada Voters Choose Pre-Existing Condition Protections And Partisan Issues As Most Important Health Care Positions
Medicaid Expansion in Florida
Poll: Most Florida Voters Favor Expanding Medicaid in their State, As Do Voters across All Non-Expansion States
As of October 2018, Florida is one of 17 states who have not expanded their Medicaid programs.2 Majorities of Democratic voters (74 percent) and independent voters (53 percent) say they are more likely to vote for a candidate who “wants to expand Medicaid to cover more low-income uninsured adults” while a majority of Republican voters in the state (52 percent) say they are more likely to vote for a candidate who wants to “keep Medicaid as is.” Nearly one-fourth of Republican voters (22 percent) say that a candidate’s position on this issue doesn’t make a difference in their vote choice as do one-fifth of independent voters (19 percent) and one in seven Democratic voters (15 percent).
Figure 15: Partisan Voters Divided On Whether They Are More Likely To Vote For Candidate Who Wants To Expand Medicaid
Overall support for Medicaid expansion in Florida is similar to the share seen in other non-expansion states with nearly six in ten residents saying their state should expand Medicaid, while nearly four in ten say their state should “keep Medicaid as it is today.”
Figure 16: Majorities In Non-Expansion States Support Medicaid Expansion
Larger Shares of Floridians Trust Democratic Gubernatorial Candidate To DO A Better Job On Health Care Issues
With competitive gubernatorial elections this fall, this poll also asked the public which gubernatorial candidate they trust on key health care issues. Overall, the Democratic candidate in Florida has a clear advantage on most health care issues while in Nevada, the Republican candidate has an advantage on some spending issues and the public is more divided on other issues.
When looking at the gubernatorial election in Florida, a larger share of Floridians say they trust Democratic candidate Andrew Gillum than Republican candidate Ron DeSantis to do a better job on health care issues – with some notable exceptions. Similar shares say they trust each candidate to do a better job of addressing the prescription painkiller addiction epidemic (37 percent vs. 34 percent, respectively) and controlling Medicaid spending (36 percent, for both). Floridians gave a slight edge to Gillum on improving rural health care (40 percent vs. 32 percent), and reducing health care costs (40 percent vs. 33 percent)
Figure 17: Larger Shares Of Floridians Say They Trust Democratic Governor Candidate On Key Health Care Issues
In Nevada, a larger share say they trust Republican candidate Adam Laxalt than his Democratic challenger Steve Sisolak to do a better job reducing health care costs (36 percent vs. 26 percent), addressing the prescription painkiller addiction epidemic (37 percent vs. 24 percent), and controlling Medicaid spending (40 percent vs. 22 percent). Nevadans are divided on which gubernatorial candidate they trust to do a better job on continuing the ACA’s protections for people with pre-existing conditions with one-third saying they trust Republican candidate Laxalt compared to three in ten who say they trust Democratic candidate Sisolak.
Figure 18: Larger Share Of Nevadans Trust Republican Candidate On Opioid Addiction Epidemic, Health Care Costs, And Spending
Women Voters in the 2018 Midterm Elections
One of the major narratives throughout this election cycle has been the impact that women voters may have on issues and candidates with ongoing attention to the #MeToo Movement especially in light of Justice Kavanaugh’s confirmation hearing and primary wins by female candidates. In July, the KFF Tracking Poll examined which women’s issues may be playing a role in voters’ decisions as well as the views of women 18-44 years old. The most recent tracking poll, which was conducted during the Senate judiciary hearings on allegations against Justice Kavanaugh’s finds that nearly half of women voters, overall, and women voters in Florida and Nevada are more enthusiastic about voting in this year’s election.3
Figure 19: About Half Of Women Voters Say They Are More Enthusiastic About Voting In This Year’s Election
Nationally, independent women voters (30 percent) and Republican women voters (45 percent) are about as enthusiastic as their male counterparts (31 percent and 42 percent, respectively), while Democratic women voters report slightly higher levels of enthusiasm about voting in this year’s election (55 percent) compared to Democratic men voters (48 percent). Across the board, enthusiasm about voting is higher in 2018 than it was in the last midterm elections in 2014.
Yet, few women voters say the candidates’ gender will be a major factor (6 percent) in their decision about who to vote for Congress this year. One in five (19 percent) say the candidates’ gender will be a minor factor while three-fourths say it won’t be a factor. This is similar across women voters, regardless of party identification with seven percent of Democratic women voters saying the candidates’ gender will be a major factor compared to four percent of Republican women voters and independent women voters.
Figure 20: Most Women Voters Say Candidates’ Gender Isn’t A Factor In Voting Decision
Health care is among the top issue for women voters regardless of party identification and across states. More than one-third of women voters overall (36 percent) say health care is the most important issue in deciding who to vote for Congress – including four in ten Democratic women voters (43 percent) and independent women voters (38 percent) and one-fifth of Republican women voters (22 percent).
Figure 21: Health Care Is A Top Issue For All Women Voters, Across Party Identification And In Bellwether States
Methodology
This Kaiser Health Tracking Poll was designed and analyzed by public opinion researchers at the Kaiser Family Foundation (KFF). The survey was conducted September 19th–October 2nd 2018, among a nationally representative random digit dial telephone sample of 1,201 adults ages 18 and older, living in the United States, including Alaska and Hawaii (note: persons without a telephone could not be included in the random selection process). Computer-assisted telephone interviews conducted by landline (301) and cell phone (900, including 605 who had no landline telephone) were carried out in English and Spanish by SSRS of Glen Mills, PA. To efficiently obtain a sample of lower-income and non-White respondents, the sample also included an oversample of prepaid (pay-as-you-go) telephone numbers (25% of the cell phone sample consisted of prepaid numbers) as well as a subsample of respondents who had previously completed Spanish language interviews on the SSRS Omnibus poll (n=10). In addition to the national sample, an oversample was conducted among Florida (599) and Nevada adults 18 and older (599) using both random digit dial technology as well as call backs from the SSRS Omnibus poll of registered voters in each state (including 224 from Florida and 151 from Nevada). Both the random digit dial landline and cell phone samples were provided by Marketing Systems Group (MSG). For the landline sample, respondents were selected by asking for the youngest adult male or female currently at home based on a random rotation. If no one of that gender was available, interviewers asked to speak with the youngest adult of the opposite gender. For the cell phone sample, interviews were conducted with the adult who answered the phone. KFF paid for all costs associated with the survey.
The combined landline and cell phone sample was weighted to balance the sample demographics to match estimates for the national population using data from the Census Bureau’s 2016 American Community Survey (ACS) on sex, age, education, race, Hispanic origin, and region along with data from the 2010 Census on population density. The sample was also weighted to match current patterns of telephone use using data from the July-December 2017 National Health Interview Survey. The weight takes into account the fact that respondents with both a landline and cell phone have a higher probability of selection in the combined sample and also adjusts for the household size for the landline sample, and design modifications, namely, the oversampling of prepaid cell phones and likelihood of non-response for the re-contacted sample. Since the callback sample included registered voters only, the weighted RDD sample was used to estimate the share of registered voters in Florida and Nevada (by party identification). Weighting adjustments for the state samples included specific nonresponse to the callbacks, as well as, in Florida, balancing leaned party identification to the previous 6-month average on the KFF Health Tracking Poll (Nevada and the national sample did not require this adjustment). All statistical tests of significance account for the effect of weighting.
The margin of sampling error including the design effect for the full sample is plus or minus 3 percentage points. Numbers of respondents and margins of sampling error for key subgroups are shown in the table below. For results based on other subgroups, the margin of sampling error may be higher. Sample sizes and margins of sampling error for other subgroups are available by request. Note that sampling error is only one of many potential sources of error in this or any other public opinion poll. Kaiser Family Foundation public opinion and survey research is a charter member of the Transparency Initiative of the American Association for Public Opinion Research.
One of the major changes brought on by the 2010 Affordable Care Act was the option for states to expand Medicaid to cover more low-income people. ↩︎
Interviews conducted after September 26th, the evening before the Senate judiciary hearing, found an increase in the share of women voters who said they were “more enthusiastic” about voting in this year’s election. ↩︎
Most Florida Voters Favor Expanding Medicaid in their State, As Do Voters across All Non-Expansion States
In an expansive look at the role issues and politics may play in the 2018 midterm elections, the latest KFF Health Tracking Poll continues to find health care as the top issue for voters, but large shares of voters also say candidate characteristics, President Trump, and party control over Congress will be major factors.
In the last KFF tracking poll conducted prior to the midterms and in two separate surveys of bellwether states Florida and Nevada, voters, nationally, in key battlegrounds, and in Florida and Nevada, rank health care above other issues.
Midterm elections are often viewed as a referendum on the president, and two-thirds (66%) of voters say a candidates’ support for or opposition to President Trump will be a major factor in their voting decision. Other important factors include the candidates’ character and experience (73%) and which party controls Congress (66%).
Fewer voters (51%), but still a majority of Democrats and Republicans, say the candidates’ political party will be a major factor. Despite the recent attention given to female candidates, only a small share (6%) say the candidates’ gender will be a major factor.
When looking at the role of issues in the 2018 midterms, health care is voters’ top issue with seven in 10 (71%) saying health care is “very important” in deciding who they will vote for. Other top issues are the economy and jobs (64%), gun policy (60%), and immigration (55%).
While at least half of voters say all of the issues are “very important” to their vote, when asked to choose the one issue that is the most important, health care is chosen by at least one-fourth of voters nationally, in key battlegrounds, and in Florida and Nevada, ranking among the top issues in each election. It is the top issue for Democratic voters, yet, in all of these elections, the issue ranks lower for Republican voters, who rank immigration and the economy and jobs at the top of their list.
Health care is also among the top voting issues chosen by women voters of all partisan stripes. Nationally more than one-third of women voters (36%) say health care is the most important issue, including four in ten Democratic women voters (43%) and independent women voters (38%) and one-fifth of Republican women voters (22%).
Democratic women voters could be particularly important in this year’s elections, as the poll finds that more than half (55%) of this group nationally say they are more enthusiastic about voting this year compared to past years. Less than half of Republican (45%) and independent (30%) women say they are more enthusiastic this year.
In spite of health care’s high ranking, the poll finds fewer than half of voters say they are hearing “a lot” from political candidates about specific health care issues. Immigration is the only issue that a majority (58%) say they are hearing a lot about, while half (51%) say they are hearing a lot about candidates’ support for or opposition to President Trump.
Among health care issues, those that the largest share of voters say they are hearing a lot about are the prescription painkiller epidemic (38%), the 2010 Affordable Care Act (35%) and continuing protections for people with pre-existing conditions (23%). Fewer voters say they are hearing a lot about a national health plan or Medicare-for-all (17%).
In states that have not expanded their Medicaid programs under the Affordable Care Act, including four with related ballot initiatives, few voters (15%) say they’ve heard a lot about the issue.
Florida and Nevada: A Look at Health Care Issues in Two Bellwether States
In addition to the national tracking poll, KFF also conducted separate surveys in Florida and Nevada, two bellwether states with competitive gubernatorial and Senate races, looking at how candidate positions on health care may impact voters. In both Florida and Nevada, one specific health care position stands above all others in terms of its importance to voters: protecting people with pre-existing conditions from insurance discrimination.
Nearly seven in 10 voters in both Florida (69%) and Nevada (68%) say that they would be more likely to vote for a candidate who wants to maintain the Affordable Care Act’s protections for people with pre-existing conditions even if it results in higher costs for healthy people, while small shares (9% in Florida, 8% in Nevada) say they’d favor a candidate who wants to eliminate those protections. This includes majorities of Democrats and independents in both states, as well as a majority of Nevada Republicans (60%) and nearly half of Florida Republicans (46%).
On the issue of pre-existing conditions in the gubernatorial race, more Florida voters say they have more trust in Democratic candidate Andrew Gillum (43%) than Republican candidate Ron DeSantis (29%). In Nevada’s gubernatorial election, voters are split evenly on who they trust more on this issue between Republican Adam Laxalt and Democrat Steve Sisolak (33% and 30%, respectively).
The Florida poll also finds that most residents (59%) favor expanding the state’s Medicaid program to cover low-income childless adults largely with federal funds, almost double the share (34%) who say they prefer to keep the state’s Medicaid program as it is. The results are similar across all 17 states that have not expanded their Medicaid programs in KFF’s national poll.
Among Florida voters, almost half (49%) say they would be more likely to vote for a candidate who supports Medicaid expansion, while nearly three in 10 (28%) say they would be more likely to vote for a candidate who wants to keep Medicaid as it is.
Methodology
Designed and analyzed by public opinion researchers at the Kaiser Family Foundation, the poll was conducted from September 19-October 2 among a nationally representative random digit dial telephone sample of 1,201 adults as well as a representative sample of Florida residents (599) and Nevada residents (599). Interviews were conducted in English and Spanish by landline and cell phone. The margin of sampling error is plus or minus 3 percentage points for the full national sample, 5 percentage points for Florida sample, and 5 percentage points for Nevada sample. For results based on subgroups, the margin of sampling error may be higher.