Health and Health Care for American Indians and Alaska Natives (AIANs) in the United States
Source Slides:
DOWNLOAD
The independent source for health policy research, polling, and news.
DOWNLOAD
DOWNLOAD
Individual market insurers are expecting to return to consumers a record total of about $800 million in excess premiums for 2018, a year in which the insurance companies posted their best annual financial performance under the Affordable Care Act to date, finds a new KFF analysis.
The rebates to more than 3 million eligible individual market consumers, based on preliminary estimates by insurers, must be issued by September 30. They are the result of the insurance companies not meeting the ACA’s medical loss ratio threshold, which requires insurers to spend at least 80 percent of premium revenues on health care claims or quality improvement activities.
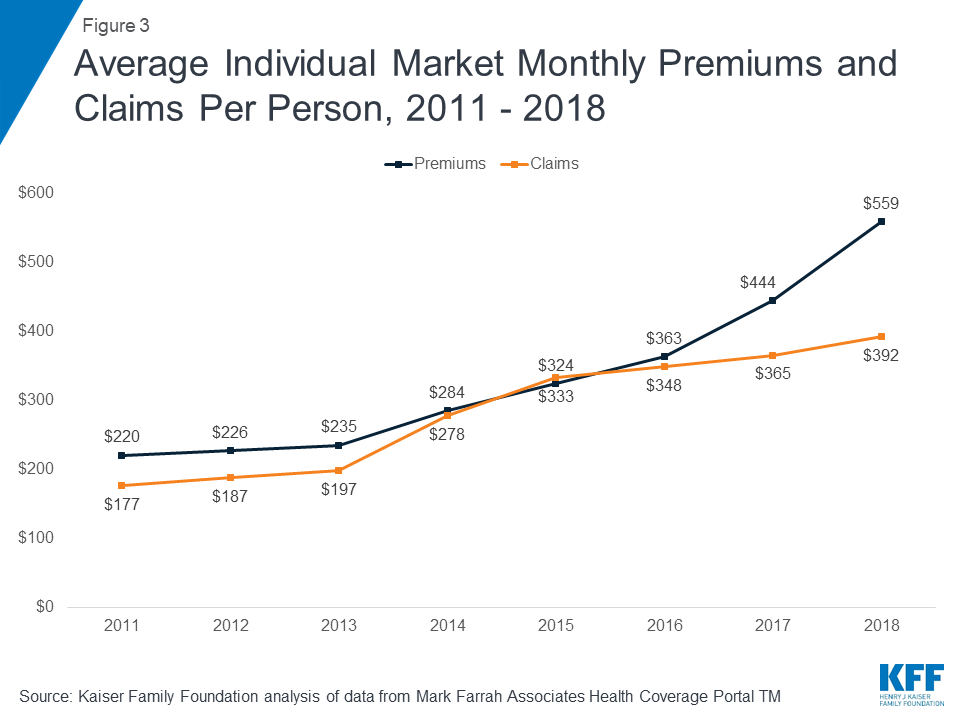
On average, premiums per enrollee in the individual market grew 26 percent from 2017 to 2018, to $559, while per person claims grew only 7 percent, to $392. The analysis finds insurance companies posted their strongest performance in the individual market under the ACA to date, using two different financial indicators:
Financial results for 2018 suggest that insurers in the individual market are generally returning to or exceeding profitability levels seen before 2014, when ACA insurance market rules took effect, including the requirement to cover people with pre-existing conditions.
Premium and claims data from 2018 support the notion that premium increases in 2018 were in large part compensating for uncertainty and policy changes such as the cessation of cost sharing subsidy payments, with some insurers over-correcting and raising premiums more than necessary to cover claims and administrative costs and earn a reasonable profit, the analysis finds. Even though repeal of the individual mandate penalty and the Trump administration’s push to expand loosely regulated insurance options had an upward effect on 2019 premiums, increases were mitigated by the prior year’s over-correction. On average, premiums went down a bit in 2019.
The analysis is based on insurer-reported financial data, including information from the National Association of Insurance Commissioners, compiled and maintained by Mark Farrah Associates.
Note: An analysis of first quarter 2019 data for the individual insurance market is available here.
The early years of the Affordable Care Act (ACA) exchanges and broader ACA-compliant individual market were marked by volatility. Markets in some parts of the country have remained fragile, with little competition, an insufficient number of healthy enrollees to balance those who are sick, and high premiums as a result. By 2017, however, the individual market generally had begun to stabilize. Absent any policy changes, it is likely insurers would have required only modest premium increases to regain or maintain profitability in 2018.
However, by mid-2017 when insurers were considering 2018 premiums and participation, it was unclear whether the individual mandate would be enforced, cost-sharing subsidies would be paid, or the ACA as a whole would remain law. In October 2017, the Trump Administration ceased payments for cost-sharing subsidies, which led some insurers to exit the market or request larger premium increases than they would have otherwise. The Administration also reduced funding for advertising and outreach. And, Congress ultimately repealed the individual mandate penalty, effective for 2019. Amid these policy changes and legislative uncertainty, insurers raised benchmark premiums by an average of 34% going into 2018.
In this analysis, we find individual market insurers saw better financial performance in 2018 than in all the earlier years of the ACA and returned to, or even exceeded, pre-ACA levels of profitability. Premiums fell slightly on average for 2019, as it became clear that some insurers had raised 2018 rates more than was necessary. It is likely premiums would have fallen even more if the individual mandate penalty were still in effect.
In this brief, we use financial data reported by insurance companies to the National Association of Insurance Commissioners and compiled by Mark Farrah Associates to look at the average premiums, claims, medical loss ratios, gross margins, and enrollee utilization from 2011 through 2018 in the individual insurance market, as well as the amount of medical loss ratio rebates insurers expect to issue to 2018 enrollees. These figures include coverage purchased through the ACA’s exchange marketplaces and ACA-compliant plans purchased directly from insurers outside the marketplaces (which are part of the same risk pool), as well as individual plans originally purchased before the ACA went into effect.
Our analysis also finds that insurers are expecting to pay a record total of about $800 million in rebates to individual market consumers for not meeting the ACA medical loss ratio threshold, which requires them to spend at least 80% of premium revenues on health care claims or quality improvement activities. This comes from initial estimates reported by insurers; actual rebates could end up being either higher or lower. In total, across the individual, small group, and large group markets, insurers expect to issue about $1.4 billion in rebates this year based on their 2018 performance. If insurer expectations hold true, these will be the largest consumer rebates issued since the MLR program began.
These new data from 2018 offer further evidence that insurers in the individual market are regaining profitability, though more recent policy and legislative changes taking effect in 2019 – the repeal of the individual mandate penalty as part of tax reform legislation and the proliferation of loosely-regulated short-term insurance plans – continue to cloud expectations somewhat for the future.
As we found in our previous analysis, insurer financial performance as measured by loss ratios (the share of health premiums paid out as claims) worsened in the earliest years of the ACA Marketplaces, but began to improve more recently. This is to be expected, as the market had just undergone significant regulatory changes in 2014 and insurers had very little information to work with in setting their premiums.
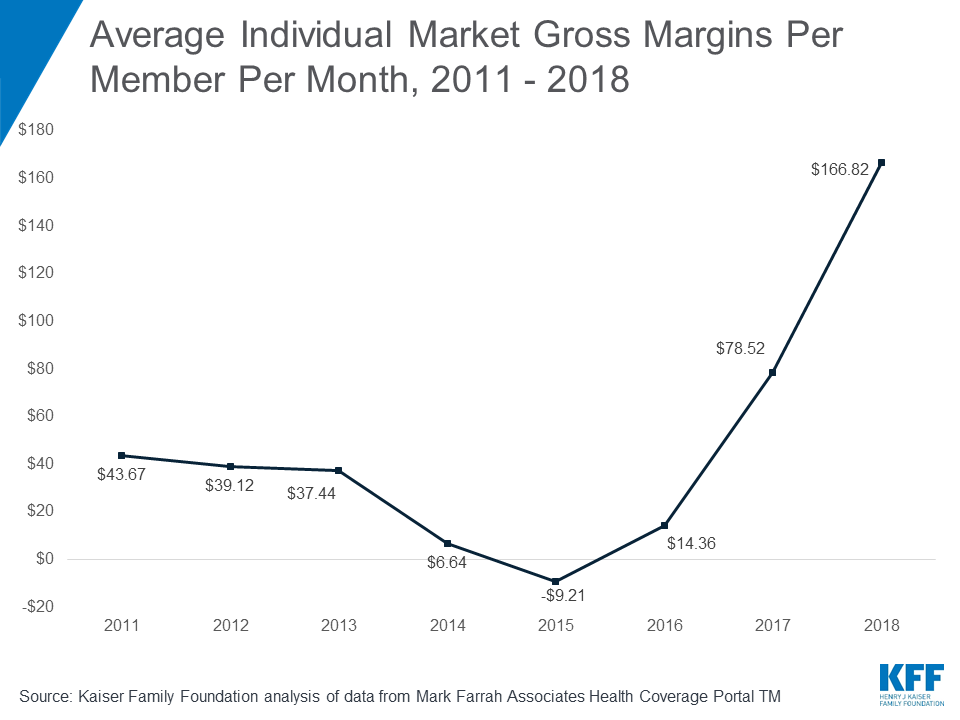
The chart below shows simple loss ratios, which differ from the formula used in the ACA’s MLR provision.1 Loss ratios began to decline in 2016, suggesting improved financial performance. In 2017, following relatively large premium increases, individual market insurers saw significant improvement in loss ratios, a sign that individual market insurers on average were beginning to better match premium revenues to claims costs. Loss ratios have continued to decline, averaging 70% in 2018. This suggests insurers were able to build in the loss of cost-sharing subsidy payments when setting premiums and some insurers likely over-corrected.
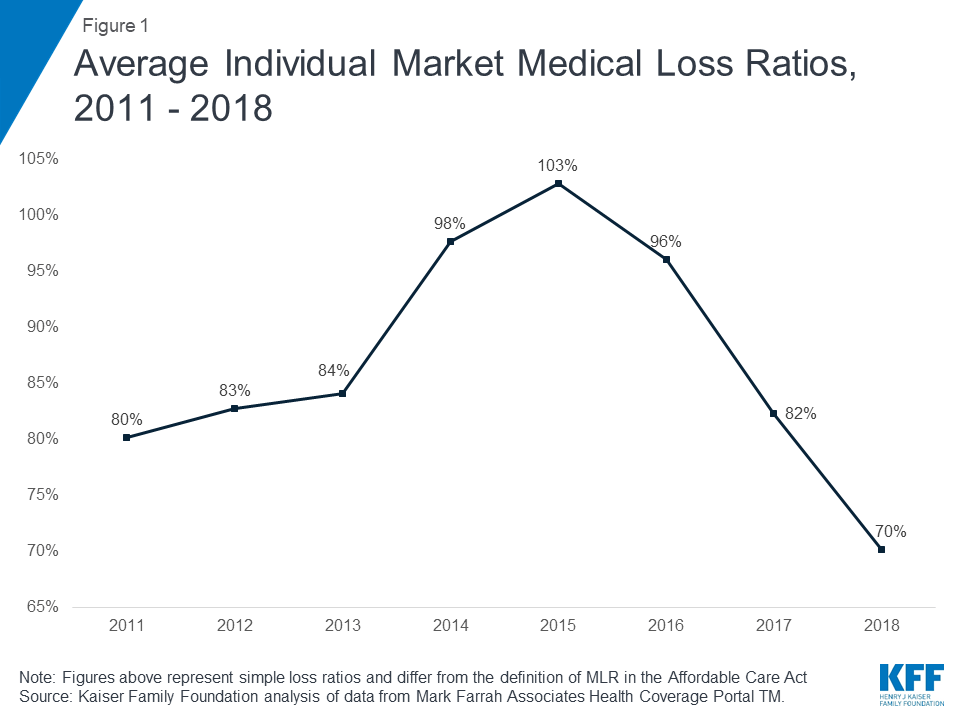
Another way to look at individual market financial performance is to examine average gross margins per member per month, or the average amount by which premium income exceeds claims costs per enrollee in a given month. Gross margins are an indicator of performance, but positive margins do not necessarily translate into profitability since they do not account for administrative expenses.
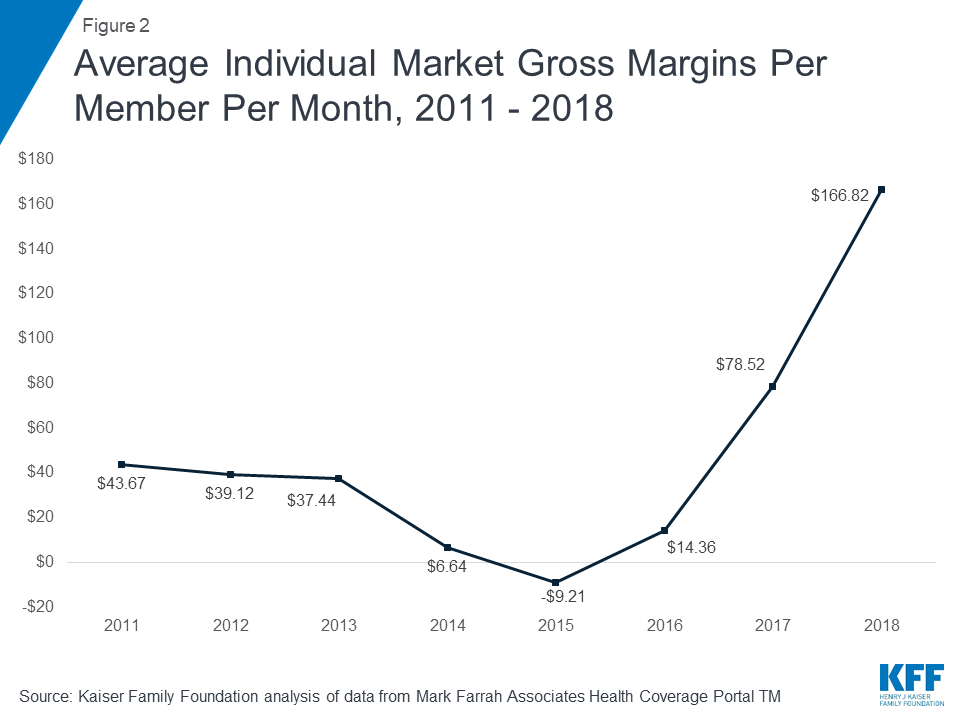
Gross margins show a similar pattern to loss ratios. Insurer financial performance improved dramatically through 2018 (increasing to $167 per enrollee, from a recent annual low of -$9 in 2015). These data suggest that insurers in this market are now financially healthy, on average.
Driving recent improvements in individual market insurer financial performance are the premium increases in 2018 combined with more modest growth in claims for medical expenses. On average, premiums per enrollee grew 26% from 2017 to 2018, while per person claims grew only 7%. This growth in premiums is in part due to the loss of cost-sharing subsidy payments; insurers are required by law to provide cost-sharing subsidies to eligible enrollees, but are no longer being reimbursed by the federal government. Rate hikes to offset the termination of federal cost-sharing subsidy payments were a major factor in 2018 premium increases.
One concern about rising premiums in the individual market was whether healthy enrollees would drop out of the market in large numbers rather than pay higher rates. While the vast majority of exchange enrollees are subsidized and sheltered from paying premium increases, those enrolling off-exchange would have to pay the full increase. Despite this dynamic, the average number of days individual market enrollees spent in a hospital in 2018 was slightly lower than inpatient days in the previous three years.2
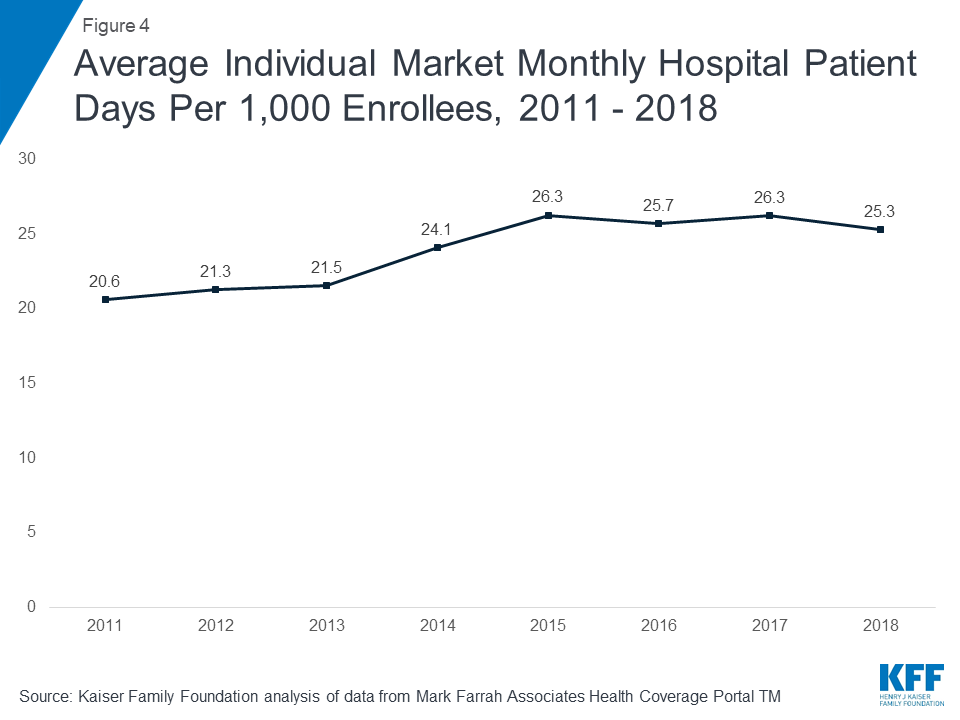
Taken together, these data on claims and utilization suggest that the individual market risk pool is relatively stable, though sicker on average than the pre-ACA market, which is to be expected since people with pre-existing conditions have guaranteed access to coverage under the ACA. Despite concerns that healthier enrollees may be dropping out of the market in recent years, somewhat lower average inpatient days indicate that the individual market did not get sicker, on average, during 2018.
The medical loss ratio (“MLR”) provision of the ACA requires most insurance companies that cover individuals to spend at least 80% of their premium income on health care claims and quality improvement, leaving the remaining 20% for administration, marketing, and profit. Beginning in 2012, insurers failing to meet the applicable MLR standard for the prior year (2011) were required to issue rebates to consumers and employers. Thus far, the 2011 rebates had remained the largest ever issued – totaling $399 million in the individual market alone (and $1.071 billion across the individual, small group, and large group markets).
Insurers’ preliminary estimates indicate they expect to issue about $800 million in rebates to 2018 individual market enrollees, which would be the highest total for the individual market by far since the program began. While this represents initial insurer estimates, and the actual rebate amount issued could be lower or higher3 , these high expected rebates provide further evidence that some insurers over-corrected in raising individual market premiums for 2018.
Insurers estimate more than 3 million 2018 individual market enrollees, or 26%, are eligible to receive rebates. Insurers owing rebates expect to issue about $260 per member, on average. All rebates must be issued by September 30 of the year following the applicable MLR reporting period (i.e., September 2019 for the 2018 reporting period).
Across all commercial markets – individual, small group, and large group – rebates are expected to total approximately $1.4 billion. If insurer estimates hold true, these will be the largest rebates issued since the MLR program began. These higher rebates are mostly driven by the individual market. Rebates in the small and large group markets are expected to be larger than average, but not significantly so.
Annual results from 2018 suggest that despite significant challenges and recent enrollment declines, insurers in the individual insurance market are now generally profitable. Insurer financial results from 2018 – after the Administration’s decision to cease cost-sharing subsidy payments, but before the repeal of the individual mandate penalty in the tax overhaul went into effect – reveal the most favorable year in the ACA-compliant market’s history.
Premium and claims data support the notion that 2017 premium increases were necessary as a one-time market correction to adjust for a sicker-than-expected risk pool, and premium increases in 2018 were in large part compensating for policy uncertainty and the termination of cost-sharing subsidy payments, though some insurers appear to have over-compensated. Without these policy changes, it is likely that insurers would generally have required only modest premium increases in 2018. Low loss ratios and higher margins indicate that some insurers raised premiums more than was necessary to cover claims and administrative costs and earn a reasonable profit in 2018.
Across the individual market, insurers expect to pay record-high rebates to consumers for failing to meet the medical loss ratio requirement, providing further evidence that insurers over-corrected when setting 2018 premiums. Before the ACA’s MLR provision went into effect, insurers in such a situation would have experienced windfall profits. The MLR rule requires insurers to repay consumers in the form of a cash rebate or premium credit when the prior year’s premiums are determined to have been too high relative to claims costs.
While markets in some parts of the country remain more fragile, the individual market on average is becoming more profitable. Some insurers have exited the market in recent years, but others have been successful and expanded their footprints, as would be expected in a competitive marketplace. Even though repeal of the individual mandate penalty and expansion of loosely-regulated insurance options had an upward effect on 2019 premiums, premiums actually decreased slightly because 2018 premiums were higher than necessary to cover claims costs. In 2019, new insurers have entered and some insurers are reentering markets they had previously exited. While signups through the marketplace during the 2019 open enrollment period declined somewhat compared to 2018, financial results suggest the market is still stable and sustainable.
We analyzed insurer-reported financial data from Health Coverage Portal TM, a market database maintained by Mark Farrah Associates, which includes information from the National Association of Insurance Commissioners. The dataset analyzed in this report does not include NAIC plans licensed as life insurance or California HMOs regulated by California’s Department of Managed Health Care; in total, the plans in this dataset represent at least 80% of the individual market. All figures in this issue brief are for the individual health insurance market as a whole, which includes major medical insurance plans and mini-med plans sold both on and off exchange. We excluded some plans that filed negative enrollment, premiums, or claims and corrected for plans that did not file “member months” in the annual statement but did file current year membership.
To calculate the weighted average loss ratio across the individual market, we divided the market-wide sum of total incurred claims by the sum of all unadjusted health premiums earned. Medical loss ratios in this analysis are simple loss ratios and do not adjust for quality improvement expenses, taxes, or risk program payments. Gross margins were calculated by subtracting the sum of total incurred claims from the sum of unadjusted health premiums earned and dividing by the total number of member months (average monthly enrollment) in the individual insurance market. Using earned premiums adjusted for taxes and fees to calculate loss ratios and gross margins increases the MLR by 6 percentage points and decreases the gross margin per member by $42 in 2018. On average across all years, using earned premiums adjusted for taxes and fees increases the MLR by 3 percentage points and decreases the gross margin per member by $14.
Total rebates are based on preliminary estimates from insurers. Since 2014, the total rebate amount issued across the individual, small group and large group markets has varied by 3 to 5% from insurer estimates. At the market level, the difference between estimates and actual rebate totals have been more volatile. Since 2014, individual market estimates have varied by as much as $34 million, or over 20%, as compared to the final actual rebates reported in December of the year following the applicable MLR reporting period. In some years, final rebates are higher than expected and in other years, final rebates are lower.
Medicare Advantage plans gain beneficiaries from traditional Medicare who have lower average spending and use fewer health services than similar beneficiaries who choose to remain in traditional Medicare, according to a new KFF analysis.
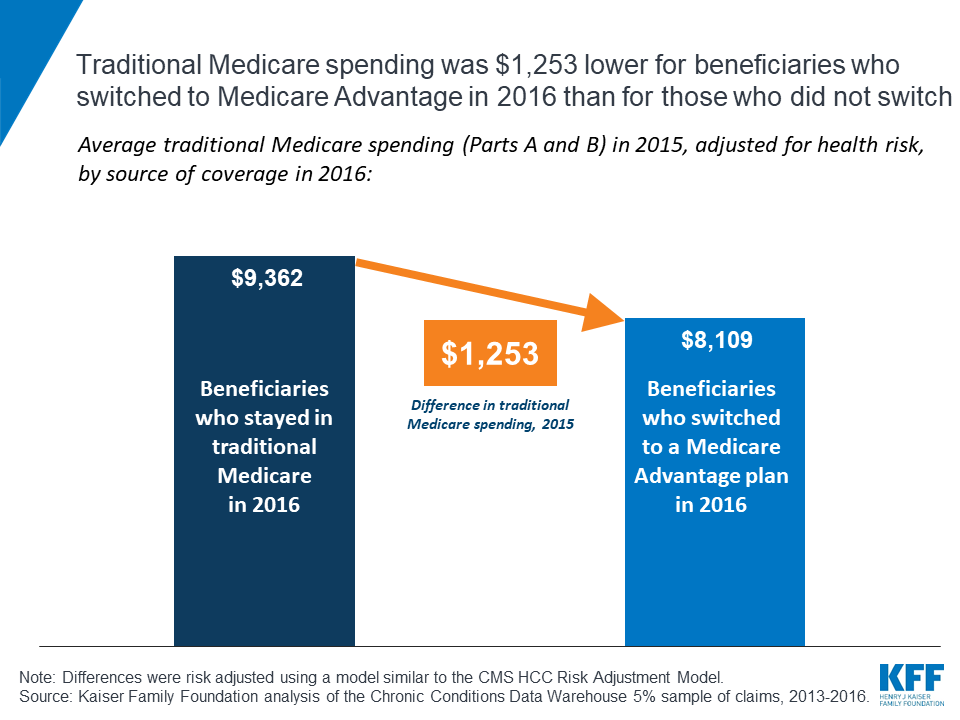
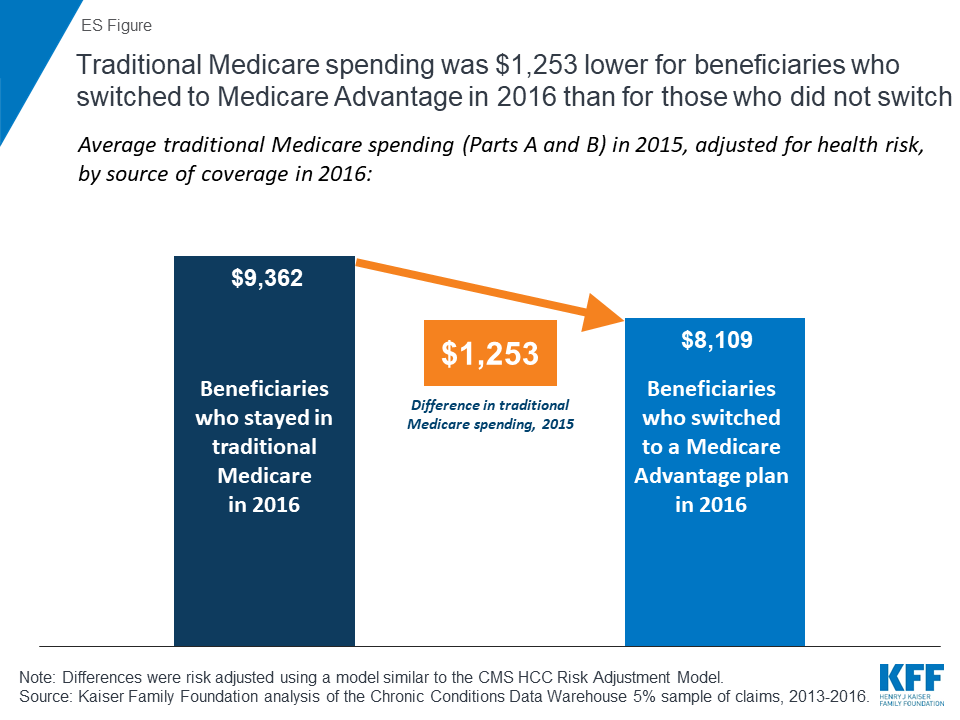
The analysis finds that people who switched from traditional Medicare to Medicare Advantage in 2016 had health spending in 2015 that was $1,253 less, on average, than the average spending for beneficiaries who remained in traditional Medicare (after adjusting for health risk).
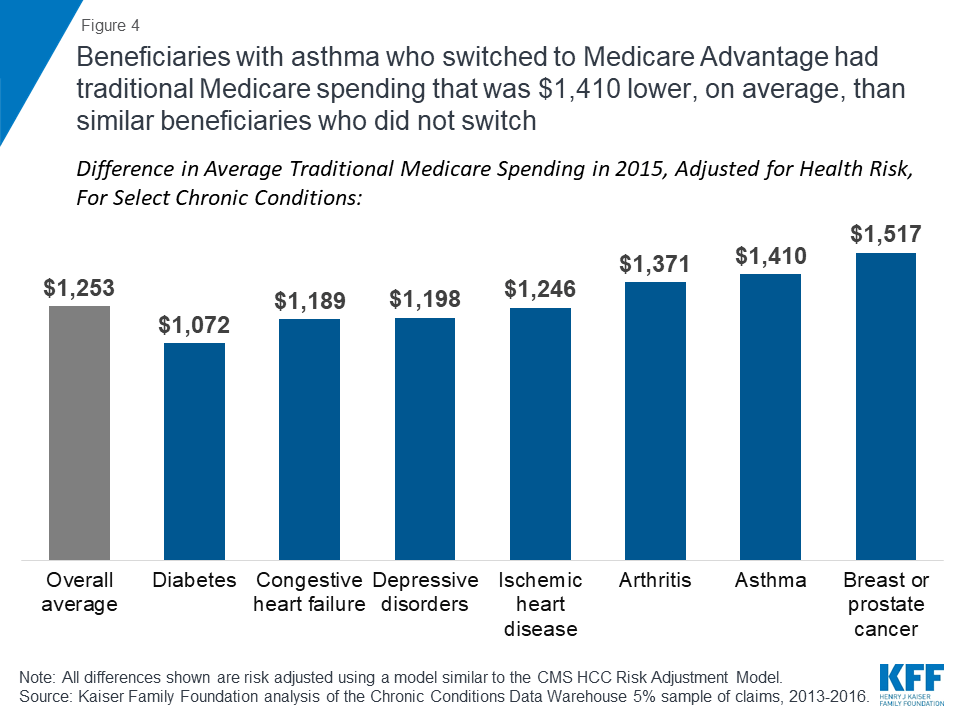
The pattern held true even among beneficiaries with specific health conditions, including asthma, breast or prostate cancer and diabetes. For instance, among beneficiaries with diabetes who were in traditional Medicare in 2015, those who switched to Medicare Advantage in 2016 had Medicare spending in 2015 that was $1,072 lower, on average, than similar beneficiaries with diabetes who stayed in traditional Medicare (after adjusting for health risk).
The findings raise questions about whether Medicare Advantage plans tend to attract healthier and lower-cost beneficiaries and whether lower rates of service use among Medicare Advantage enrollees is attributable to care management or self-selection. Most notably, the study findings suggest that the current method of setting payments to Medicare Advantage plans based on spending for people in traditional Medicare may systematically overestimate expected costs of Medicare Advantage enrollees. Adjusting payments to reflect Medicare Advantage enrollees’ prior use of health services could potentially lower total Medicare spending by billions of dollars annually.
Setting payments to more accurately reflect expected costs would have major implications for Medicare spending, as Medicare Advantage plans cover 20 million people, about a third of all Medicare beneficiaries, and enrollment is expected to climb to over 30 million people within the next decade.
People on Medicare can choose coverage from either traditional Medicare or Medicare Advantage plans, typically trading off broad access to providers for potentially lower premiums and out-of-pocket costs. Beneficiaries who choose Medicare Advantage may differ from those in traditional Medicare in both measurable and unmeasurable ways, which may influence their use of services and spending. Yet, Medicare payments to Medicare Advantage plans per enrollee are based on average spending among beneficiaries in traditional Medicare.
This analysis looks at whether beneficiaries who choose to enroll in Medicare Advantage plans have lower spending, on average – before they enroll in Medicare Advantage plans – than similar people who remain in traditional Medicare. We compare average traditional Medicare spending and use of services in 2015 among beneficiaries who switched to Medicare Advantage plans in 2016 with those who remained in traditional Medicare that year, after adjusting for health risk. We adjust Medicare spending values for health conditions and other factors, with a model similar to the CMS HCC Risk Adjustment Model that is used to adjust payments to Medicare Advantage plans (see Methods).
Even after risk adjustment, the results indicate that beneficiaries who choose Medicare Advantage have lower Medicare spending – before they enroll in Medicare Advantage plans – than similar beneficiaries who remain in traditional Medicare, suggesting that basing payments to plans on the spending of those in traditional Medicare may systematically overestimate expected costs of Medicare Advantage enrollees.
Medicare payments to Medicare HMOs and PPOs, known as Medicare Advantage plans, have always been based on Medicare spending by similar people in traditional Medicare, partly because Medicare has never had accurate, complete data on the use of services or health care spending for beneficiaries in Medicare Advantage plans.1 The assumption has been that adjusting payments to plans for health status and other factors accounts for differences between beneficiaries in traditional Medicare and those in Medicare Advantage plans. Profits are assumed to be due to plans reducing spending by either managing fees (e.g., by having lower-cost hospitals in their network) or changing patterns of care (e.g., reducing hospital readmissions), rather than to favorable selection. Nonetheless, selection bias has been an ongoing concern and the subject of many studies over the years, with mixed evidence of favorable selection.2 ,3 ,4 ,5 ,6 This question is important because it affects the accuracy of Medicare payments to plans on behalf of 20 million Medicare beneficiaries, and rising.
This is the first known analysis to examine whether beneficiaries who choose to enroll in Medicare Advantage plans have lower spending and use fewer services – before enrolling in Medicare Advantage – than similar people in traditional Medicare. If Medicare Advantage enrollees use fewer services and have lower Medicare spending before they enroll in Medicare Advantage plans, compared to similar beneficiaries in traditional Medicare, then basing payments to Medicare Advantage plans on the Medicare spending for similar beneficiaries in traditional Medicare would overestimate the expected costs of Medicare Advantage enrollees and overpay plans by billions of dollars over the next decade. Studies that have looked at differences in the use of services and Medicare spending for Medicare Advantage enrollees compared to beneficiaries in traditional Medicare that did not account for actual prior differences may have overestimated the extent to which plans are reducing enrollees’ spending or use of services.
To address this question, we examine Medicare Part A and B spending and service use for traditional Medicare beneficiaries in 2015. We compare average Medicare spending and use of services for traditional Medicare beneficiaries who enrolled in Medicare Advantage plans versus those who remained in traditional Medicare in 2016, after adjusting spending values for health conditions and other relevant factors (Figure 1). We examine how the results differ across demographics, chronic conditions, and counties, and also examine how the results change when Part D spending is included. The analysis is based on a five percent sample of Medicare claims data and excludes beneficiaries who may not have been active choosers in 2016; more details about the analysis are included in the Methods.

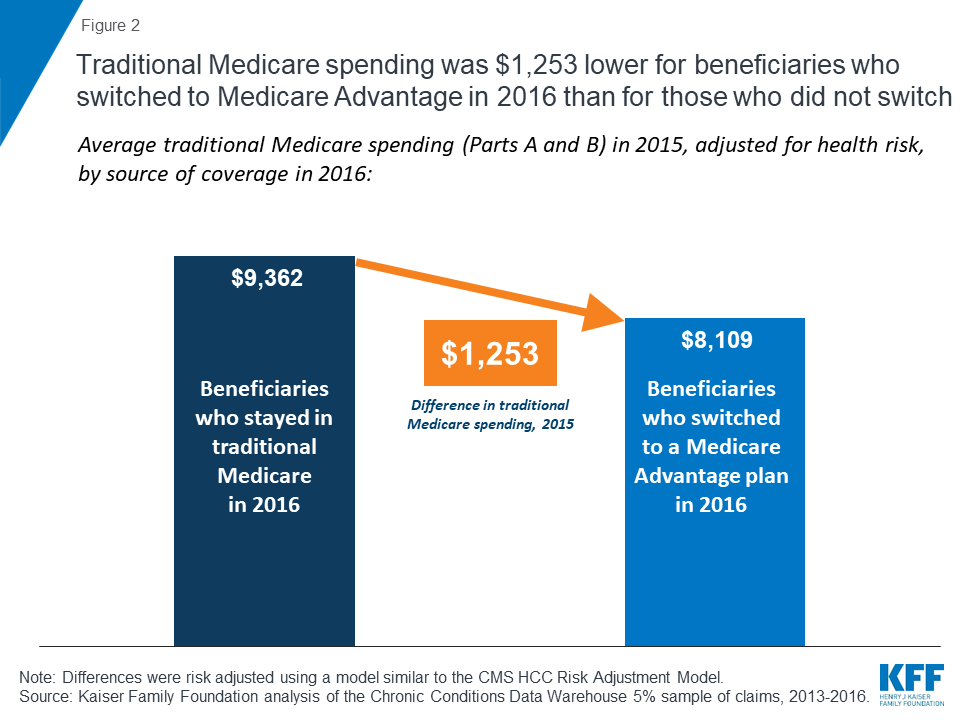
Among beneficiaries in traditional Medicare in 2015, those who enrolled in Medicare Advantage in 2016 had spending (for Part A and Part B) that was $1,253 lower (13% difference), on average, than beneficiaries who remained in traditional Medicare in 2016, after adjusting for health risk factors (Figure 2; Tables 1 and 2).7
When Part D spending is included, the results changed only slightly. Traditional Medicare beneficiaries in 2015 who switched to Medicare Advantage in 2016 had total Medicare spending (including Part D) that was 15 percent lower than spending for beneficiaries who remained in traditional Medicare in 2016.
Comparison to Other Payments Received by Medicare Advantage Plans. To put the difference in Medicare spending in context, the $1,253 average difference in spending is nearly four-times larger than the average per capita quality-based bonus payment ($336) paid to Medicare Advantage prescription drugs plans that qualified for bonuses in 2015 (Figure 3). The average difference in spending is also more than twice as large as the average annual premium paid by Medicare Advantage enrollees in 2015, including enrollees in plans with no premium.

Traditional Medicare spending in 2015 was lower for beneficiaries who enrolled in Medicare Advantage plans in 2016 than for similar beneficiaries who remained in traditional Medicare that year, by age and gender, and among beneficiaries dually eligible for Medicare and Medicaid, after adjusting for health risk and other factors (Table 1).
Even among beneficiaries with the same chronic conditions, those who enrolled in Medicare Advantage plans in 2016 consistently had lower Medicare spending in 2015 than similar beneficiaries who remained in traditional Medicare in 2016 (Table 1).
For example, among traditional Medicare beneficiaries with diabetes in 2015, those who enrolled in Medicare Advantage plans in 2016 had Medicare spending that was $1,072 lower in 2015, on average, than similar beneficiaries with diabetes who stayed in traditional Medicare in 2016, after adjusting for differences in health status (Figure 4). In other words, it would appear that lower-cost beneficiaries with diabetes are more inclined to enroll in Medicare Advantage than higher-cost diabetics. Likewise, traditional Medicare beneficiaries with asthma who enrolled in Medicare Advantage plans in 2016 had Medicare spending that was $1,410 lower in 2015, on average, than similar beneficiaries with asthma who remained in traditional Medicare in 2016, even after adjusting for health risk factors.
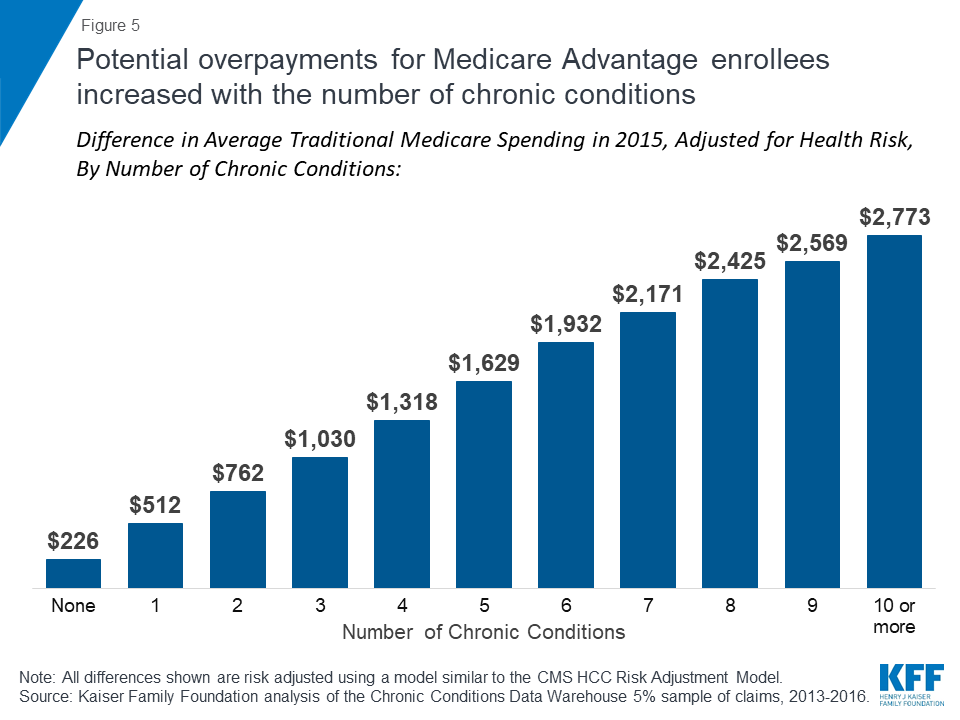
The difference in average, adjusted 2015 traditional Medicare spending between beneficiaries who subsequently enrolled in Medicare Advantage versus those who remained in traditional Medicare increases with the number of chronic conditions, rising from $226 among those with no chronic conditions to $1,629 or more among beneficiaries with 5 or more chronic conditions (Figure 5). This finding suggests that potential overpayments may be largest for the Medicare Advantage plans that are serving the sickest beneficiaries.
In this section, we looked at whether the observed differences in spending and service use persist across markets, and the extent to which differences may vary from one market to another. We compared average spending in 2015 among beneficiaries who switched to Medicare Advantage in 2016 versus those who remained in traditional Medicare, without adjusting for other factors. We were not able to replicate the analysis by county with the adjustment for risk factors, such as health conditions and demographics, due to sample size constraints. For this analysis, we looked at 20 relatively large markets that vary geographically, and vary by Medicare Advantage penetration and payment quartiles.
Among large, urban counties, the differences in spending between Medicare Advantage enrollees and beneficiaries in traditional Medicare varied greatly across the country (Figure 6; Table 3). In some counties, such as Los Angeles, CA, San Bernardino, CA, Wayne, MI (Detroit), and Cuyahoga, OH (Cleveland), beneficiaries who enrolled in Medicare Advantage plans in 2016 had significantly lower traditional Medicare spending in 2015 ( ≥$3,000 lower) than beneficiaries in the county who remained in traditional Medicare in 2016.
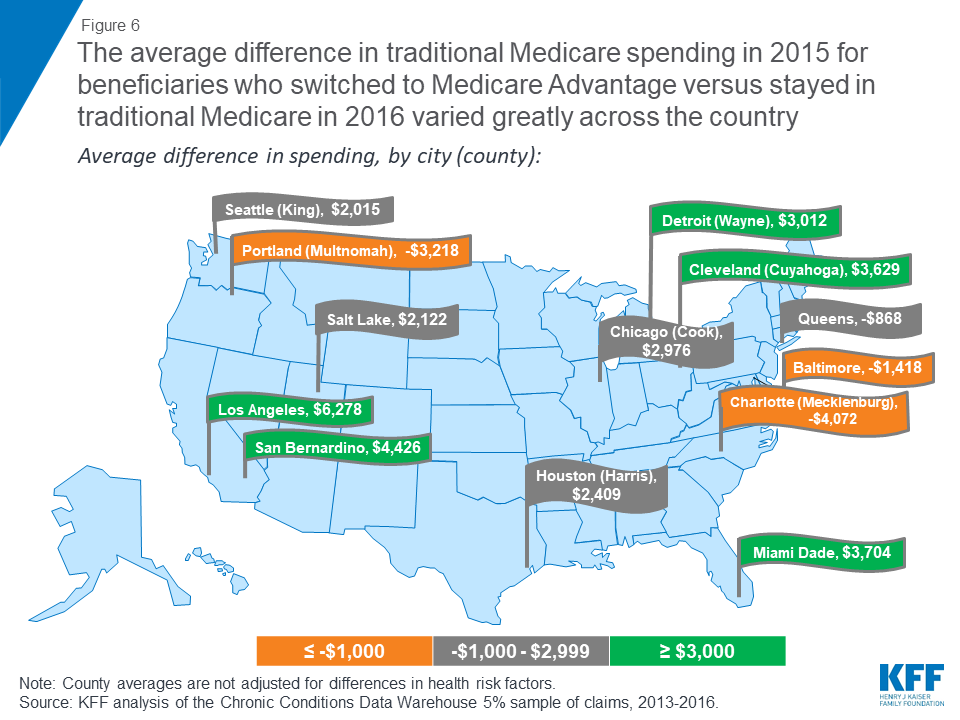
In other counties, such as Allegheny, PA (Pittsburgh), Baltimore City, MD, Mecklenburg, NC (Charlotte), Erie, NY (Buffalo), and Multnomah, OR (Portland) beneficiaries who enrolled in Medicare Advantage plans in 2016 had higher prior year traditional Medicare spending ( ≤-$1,000) than beneficiaries in the county who remained in traditional Medicare in 2016. These differences across counties suggest that the selection bias into Medicare Advantage may vary across markets.
This analysis examines whether beneficiaries who choose to enroll in Medicare Advantage plans have lower spending and use fewer services – before enrolling in Medicare Advantage – than similar people in traditional Medicare. The study found that beneficiaries who chose to enroll in a Medicare Advantage plan in 2016 had average expenditures in traditional Medicare (in 2015) that were $1,253 less, on average, than similar beneficiaries who remained in traditional Medicare. Similar differences in spending were found across all demographics and chronic conditions, even after adjusting for health risk factors. The results suggest that favorable self-selection into Medicare Advantage plans is occurring, even among traditional Medicare beneficiaries with similar health conditions. The findings raise questions as to why beneficiaries who are higher utilizers are less likely to go into Medicare Advantage and instead remain in traditional Medicare.
Other studies have examined services used by people while they were enrolled in Medicare Advantage plans, based on limited data, and have generally found that beneficiaries in Medicare Advantage plans use fewer services than those in traditional Medicare.9 ,10 ,11 Notably, the authors of these studies almost universally attribute differences in service utilization to care management by the plans – rather than to pre-existing differences in care seeking behavior and use of health services. This study suggests that differences in health care use, and spending, are evident before beneficiaries decided to enroll in Medicare Advantage plans or remain in traditional Medicare, raising questions about the extent to which plans are actually lowering spending or managing care.
It is not clear whether the differences in spending observed in this study increase, decrease, or persist over time as beneficiaries age, which has implications for whether a similar difference in spending could be assumed for all Medicare Advantage enrollees.12 Likewise, it is not clear how this difference in spending will change as the share of counties with the majority of beneficiaries in Medicare Advantage plans grows. This missing information could have important implications for Medicare spending. Potential overpayments could amount to billions in excess Medicare spending over a ten-year period if the observed differences in spending hold up as beneficiaries age and Medicare Advantage enrollment continues to rise. To illustrate, if the difference in average Medicare spending ($1,253) applied to just 10 percent of all Medicare Advantage enrollees in 2016, or 1.8 million enrollees, it would amount to more than $2 billion in excess spending in one year alone.
Policymakers could consider adjusting payments to reflect Medicare Advantage enrollees’ prior use of health care services, which could lower total Medicare spending and in turn reduce Medicare Part B premiums and deductibles for all beneficiaries. With more than 20 million enrollees in Medicare Advantage plans and Medicare payments to plans projected to reach $250 billion in 2019, the stakes are high for making payments to plans as accurate as possible.13 ,14
Gretchen Jacobson and Tricia Neuman are with the Kaiser Family Foundation. Anthony Damico is an independent consultant.
This paper benefitted from the methodological expertise of Bianca Frogner at the University of Washington.
This analysis focuses on beneficiaries in traditional Medicare who were enrolled in both Medicare Part A and Medicare Part B in 2015, examining average adjusted 2015 Medicare Part A and B spending for these beneficiaries, based on their 2016 enrollment in Medicare Advantage plans or traditional Medicare. Beneficiaries who enrolled in Medicare Advantage plans at any point during the 2016 calendar year were categorized as Medicare Advantage enrollees.
To conduct this analysis, we excluded beneficiaries who: (1) became Medicare beneficiaries after 2013 or were not in traditional Medicare with both Part A and Part B in 2013, 2014, and 2015 (5.8 million people) because three years of claims data were required for each person to collect sufficient information about chronic conditions; (2) died prior to January 2016 (1.5 million people) because they would not have had the same opportunity to enroll in Medicare Advantage as other beneficiaries; (3) had end-stage renal disease in 2015 or 2016 (290 thousand people) because the vast majority were not eligible to enroll in a Medicare Advantage plan in 2016; (4) were unlikely to have actively selected (and instead may have been passively enrolled in) a Medicare Advantage plan, including beneficiaries who enrolled in Medicare-Medicaid Plans (MMPs) and employer group health plans (183 thousand people); (5) lived in Puerto Rico and other territories because some elements in the Medicare claims data are not as reliable or accurate for these beneficiaries; (6) enrolled in cost, Medical Savings Account (MSA), or PACE plans in 2016 (21 thousand people) because these plans are paid differently than Medicare Advantage plans; and (7) enrolled in a Special Needs Plan for people with specified chronic conditions (C-SNP; 13 thousand people) because the design of these plans may disproportionately attract healthier people with chronic conditions. When we relaxed the first inclusion requirement, for beneficiaries to be in traditional Medicare with both Part A and Part B in 2013, 2014, and 2015, and instead only required included beneficiaries to be in traditional Medicare with Part A and B in 2014 and 2015, the findings did not materially change, with the adjusted percent difference in spending remaining 13%. Similarly, when we included people in C-SNPs, the adjusted percent difference in spending did not change. In total, the primary analysis included 24 million beneficiaries who were in traditional Medicare in 2015.
The brief uses claims data from a five percent sample of Medicare beneficiaries from the Master Beneficiary Summary Files of CMS’s Chronic Conditions Data Warehouse for 2013 through 2016. The analysis first examined the bivariate differences in spending and use of services by demographics, chronic conditions, and other factors. To control for differences in health status and other factors that could account for the difference in Medicare spending, a multivariate generalized linear log link model with a gamma distribution was developed that mimics as closely as possible the CMS-HCC Risk Adjustment Model, which is used to risk-adjust payments to Medicare Advantage plans. The model for this study includes the same structure of the demographic variables and interaction terms as the HCC Risk Adjustment Model. This study’s model also includes the only available (although imperfect) variable to indicate whether someone who used a Part D covered drug was residing in a long-term care facility at any point during the year; this approach misses information about institutional residency status for the people who do not take drugs covered under Part D.
This study examined bivariate differences in traditional Medicare spending across counties, for those county residents who enrolled in Medicare Advantage compared to those who did not. The data used in the study did not include a sufficient number of people to adjust these county-level values for health risk factors. Future studies could examine whether the observed bivariate differences across counties hold, after adjusting for health risk factors.
The model used in this analysis does not include the HCCs in the Risk Adjustment Model that are not recorded as chronic conditions in the Chronic Conditions Data Warehouse, the majority of which are HCCs for acute or relatively rare conditions. The margins command, with values as observed, was used to generate the adjusted spending values. Alternative models for this analysis also included as covariates the per capita traditional Medicare spending for each county, beneficiaries’ race/ethnicity as defined by the RTI race variable, and additional chronic conditions, with no meaningful change in the results. We also looked at the sensitivity of the findings to the inclusion criteria; when we included beneficiaries who were in traditional Medicare with Part A and B in 2014 and 2015 but either were not in traditional Medicare or did not have both Part A and Part B in 2013, the findings did not materially change, with the risk adjusted difference in spending rising from $1,253 to $1,298.
| Table 1. Average Traditional Medicare Spending in 2015 for Beneficiaries who Switched to Medicare Advantage Or Stayed in Traditional Medicare in 2016, After Adjusting for Health Risk Factors | |||||
| Characteristics in 2015 | People who stayed in TM in 2016 | People who switched to MA in 2016 | Difference in spending, 2015 | ||
| Number of people | Average Part A & B spending, 2015 | Number of people | Average Part A & B spending, 2015 | ||
| Overall | 23,714,780 | $9,362 | 443,240 | $8,109 | $1,253 |
| Age | |||||
| Under 35 | 314,880 | $8,631 | 8,220 | $7,476 | $1,155 |
| 35-44 | 527,740 | $8,778 | 15,020 | $7,603 | $1,175 |
| 45-54 | 1,030,820 | $8,549 | 36,140 | $7,405 | $1,144 |
| 55-59 | 801,600 | $8,362 | 31,180 | $7,243 | $1,119 |
| 60-64 | 904,460 | $8,108 | 41,120 | $7,023 | $1,085 |
| 65-69 | 3,360,240 | $8,365 | 79,480 | $7,246 | $1,119 |
| 70-74 | 5,598,560 | $9,229 | 96,280 | $7,994 | $1,235 |
| 75-79 | 4,341,380 | $9,592 | 63,060 | $8,309 | $1,284 |
| 80-84 | 3,175,960 | $9,687 | 37,900 | $8,391 | $1,296 |
| 85-89 | 2,218,880 | $9,819 | 21,260 | $8,505 | $1,314 |
| 90-94 | 1,089,460 | $10,235 | 10,340 | $8,865 | $1,370 |
| 95 and older | 350,800 | $11,409 | 3,240 | $9,883 | $1,527 |
| Dual eligibility | |||||
| Non-dual eligible | 19,132,740 | $9,779 | 281,300 | $8,471 | $1,309 |
| Partial dual eligible | 1,257,160 | $8,536 | 61,580 | $7,394 | $1,142 |
| Full dual eligible | 3,324,880 | $8,681 | 100,360 | $7,520 | $1,162 |
| Original reason for eligibility | |||||
| Disabled | 5,757,400 | $9,234 | 190,840 | $7,999 | $1,236 |
| Aged | 17,957,380 | $9,471 | 252,400 | $8,204 | $1,267 |
| Gender | |||||
| Female | 13,211,740 | $9,320 | 240,420 | $8,073 | $1,247 |
| Male | 10,503,040 | $9,500 | 202,820 | $8,229 | $1,271 |
| Institutional status | |||||
| Community resident | 13,363,540 | $9,684 | 267,420 | $8,388 | $1,296 |
| Institutional resident | 1,205,040 | $13,638 | 21,880 | $11,813 | $1,825 |
| Unknown | 9,146,200 | $7,559 | 153,940 | $6,548 | $1,011 |
| Chronic conditions | |||||
| Anemia | 5,212,220 | $11,148 | 86,360 | $9,657 | $1,492 |
| Rheumatoid arthritis | 7,987,660 | $10,244 | 136,800 | $8,873 | $1,371 |
| Asthma | 2,077,200 | $10,534 | 42,740 | $9,125 | $1,410 |
| Atrial fibrillation | 2,160,960 | $10,096 | 24,240 | $8,745 | $1,351 |
| Breast or prostate cancer | 1,581,540 | $12,274 | 18,920 | $10,757 | $1,517 |
| COPD | 2,767,340 | $10,103 | 54,960 | $8,751 | $1,352 |
| Congestive heart failure | 3,199,460 | $8,884 | 51,220 | $7,695 | $1,189 |
| Depressive disorders | 6,273,440 | $9,985 | 139,940 | $8,787 | $1,198 |
| Diabetes | 6,592,380 | $8,013 | 136,920 | $6,941 | $1,072 |
| Epilepsy | 594,560 | $9,403 | 13,180 | $8,145 | $1,258 |
| Hypothyroidism | 3,865,660 | $8,540 | 57,540 | $7,398 | $1,143 |
| Ischemic heart disease | 6,792,700 | $9,314 | 107,780 | $8,068 | $1,246 |
| Kidney disease | 4,279,460 | $9,414 | 73,760 | $8,154 | $1,260 |
| Liver disease | 790,800 | $11,631 | 17,040 | $10,074 | $1,556 |
| Mobility impairments | 577,820 | $12,766 | 11,120 | $11,058 | $1,708 |
| Obesity | 2,942,860 | $9,687 | 69,620 | $8,503 | $1,184 |
| Peripheral vascular disease | 2,888,480 | $9,219 | 47,420 | $7,985 | $1,234 |
| Pressure ulcers | 993,360 | $12,827 | 16,060 | $11,110 | $1,716 |
| Schizophrenia | 452,120 | $10,686 | 13,840 | $9,256 | $1,430 |
| Stroke/TIA | 907,500 | $11,935 | 15,180 | $10,338 | $1,597 |
| No. of chronic conditions | |||||
| 0 | 4,513,760 | $1,687 | 93,200 | $1,461 | $226 |
| 1 | 4,483,440 | $3,823 | 82,120 | $3,311 | $512 |
| 2 | 4,105,140 | $5,694 | 74,140 | $4,932 | $762 |
| 3 | 3,225,380 | $7,701 | 59,420 | $6,670 | $1,030 |
| 4 | 2,357,580 | $9,846 | 44,160 | $8,529 | $1,318 |
| 5 | 1,666,820 | $12,173 | 29,760 | $10,544 | $1,629 |
| 6 | 1,164,460 | $14,436 | 20,940 | $12,504 | $1,932 |
| 7 | 801,800 | $16,222 | 14,660 | $14,052 | $2,171 |
| 8 | 544,880 | $18,120 | 10,040 | $15,696 | $2,425 |
| 9 | 357,240 | $19,197 | 6,080 | $16,628 | $2,569 |
| 10 or more | 494,280 | $20,725 | 8,720 | $17,952 | $2,773 |
| NOTE: All values shown were risk adjusted using a model similar to the CMS HCC Risk Adjustment Model. Excludes beneficiaries in Puerto Rico and those who enrolled in cost, Medicare Medical Savings Account (MSA), PACE plans, Medicare-Medicaid Plans (MMPs) and employer group health plans. Excludes beneficiaries with end-stage renal disease. Excludes people who died before the end of 2015. Excludes people not enrolled in Medicare prior to 2013. TM is traditional Medicare. MA is Medicare Advantage. Only chronic conditions with at least 10,000 people switching to Medicare Advantage are shown in table.SOURCE: Kaiser Family Foundation analysis of the Chronic Conditions Data Warehouse 5% sample of claims, 2013-2016. | |||||
| Table 2. Results from Multivariate Regression of Traditional Medicare Spending in 2015 for Beneficiaries who Switched to Medicare Advantage Or Stayed in Traditional Medicare in 2016, Adjusting for Risk Factors Included in the CMS HCC-Risk Adjustment Model | ||
| Coefficients | Estimate | Std. Error |
| Intercept | 7.109633 | 0.009402 |
| Switching | -0.143651 | 0.0142682 |
| Gender: Male | referent category | |
| Female | -0.0110686 | 0.0117174 |
| Age 0-34 | -0.0712961 | 0.025248 |
| 35-44 | -0.0163406 | 0.021451 |
| 45-54 | -0.0408814 | 0.0170427 |
| 55-59 | -0.06427 | 0.0179617 |
| 60-64 | -0.0190008 | 0.017056 |
| 65-69 | referent category | |
| 70-74 | 0.0873604 | 0.0095115 |
| 75-79 | 0.1411297 | 0.0101946 |
| 80-84 | 0.1577402 | 0.0112485 |
| 85-89 | 0.1494632 | 0.0130799 |
| 90-94 | 0.1666209 | 0.018159 |
| 95+ | 0.3183193 | 0.0344025 |
| Dual eligibility: Non-duals | referent category | |
| Partial duals | -0.1038725 | 0.0282699 |
| Full duals | -0.1306216 | 0.0198355 |
| Community residents | referent category | |
| Institutional residents | 0.4165534 | 0.0333449 |
| Missing residency status | -0.2392473 | 0.0071132 |
| Original reason for entitlement: Aged | referent category | |
| Disabled | -0.0033169 | 0.0138178 |
| Chronic conditions/HCC codes | ||
| Acute MI | 0.810567 | 0.0252134 |
| Anemia | 0.3412536 | 0.0120288 |
| Asthma | 0.1515625 | 0.0151335 |
| Atrial fibrillation | 0.1202888 | 0.0153342 |
| Blindness | 0.1981732 | 0.0244406 |
| Brain injury | 0.2645299 | 0.0313467 |
| Breast or Prostate cancer | 0.2771732 | 0.0132984 |
| Cerebral palsy | -0.0489468 | 0.033602 |
| Chronic kidney disease | 0.154923 | 0.0152935 |
| Colorectal cancer | 0.4436472 | 0.0204056 |
| Congestive heart failure | -0.0452462 | 0.05673 |
| COPD | 0.2339984 | 0.0398189 |
| Cystic fibrosis | 0.034797 | 0.0282677 |
| Depressive disorders | 0.0929828 | 0.0119425 |
| Diabetes | -0.1646257 | 0.0151394 |
| Endometrial cancer | 0.4495853 | 0.0356021 |
| Epilepsy | 0.2226373 | 0.0456154 |
| Hepatitis | 0.1817627 | 0.0225243 |
| Hip/Pelvic fracture | 0.9409028 | 0.0247483 |
| HIV/AIDS | 0.0927405 | 0.0346999 |
| Hypothyroidism | -0.1240166 | 0.0120557 |
| Ischemic heart disease | -0.0107028 | 0.0119693 |
| Leukemia | 0.5217791 | 0.0189631 |
| Liver disease | 0.2347011 | 0.0150768 |
| Lung cancer | 0.6364471 | 0.0232583 |
| Mobility impairments | 0.3394306 | 0.0170233 |
| Multiple sclerosis | 0.4343622 | 0.0308529 |
| Muscular dystrophy | 0.7138206 | 0.0798967 |
| Obesity | 0.0173455 | 0.0123963 |
| Peripheral vascular disease | -0.0216004 | 0.0124903 |
| Personality disorders | 0.1777524 | 0.02434 |
| Pressure ulcers | 0.485386 | 0.0206655 |
| PTSD | 0.0428833 | 0.0225038 |
| Rheumatoid arthritis | 0.1957197 | 0.0116852 |
| Schizophrenia | 0.1277205 | 0.0207238 |
| Spina bifida | 0.2069589 | 0.0493435 |
| Spinal cord injuries | 0.4995232 | 0.0333971 |
| Stroke/TIA | 0.2737327 | 0.0149603 |
| No. of chronic conditions – 0 | referent category | |
| 1 | 0.8182002 | 0.0126207 |
| 2 | 1.21658 | 0.0228322 |
| 3 | 1.518567 | 0.0335242 |
| 4 | 1.764325 | 0.0443301 |
| 5 | 1.976463 | 0.0551261 |
| 6 | 2.146921 | 0.0659209 |
| 7 | 2.263623 | 0.0766949 |
| 8 | 2.374266 | 0.0874716 |
| 9 | 2.431992 | 0.0983541 |
| 10 or more | 2.508572 | 0.1192487 |
| Interaction terms | ||
| Gender and age: 0-34 x female | 0.1451276 | 0.0377312 |
| 35-44 x female | 0.0114095 | 0.0303987 |
| 45-54 x female | 0.0155029 | 0.0239679 |
| 55-59 x female | 0.0030464 | 0.0253859 |
| 60-64 x female | -0.0209732 | 0.0240343 |
| 70-74 x female | -0.0346688 | 0.0130251 |
| 75-79 x female | -0.0609598 | 0.0138234 |
| 80-84 x female | -0.0728437 | 0.0150058 |
| 85-89 x female | -0.034932 | 0.0169001 |
| 90-94 x female | 0.0064602 | 0.0223403 |
| 95+ x female | -0.0674294 | 0.0395159 |
| Dual eligibility and institutional status: Full duals x institutional resident | -0.1198834 | 0.0491795 |
| Full duals x missing residency | -0.0315702 | 0.0433176 |
| Partial duals x institutional resident | 0.5107559 | 0.2224101 |
| Partial duals x missing residency | -0.5571722 | 0.0537358 |
| Dual eligibility, institutional status, and original reason for entitlement: | -0.1183059 | 0.0765971 |
| Non-duals x institutional resident x disabled | ||
| Non-duals x missing residency x disabled | -0.2336562 | 0.0162378 |
| Full duals x community resident x disabled | 0.1227525 | 0.0263483 |
| Full duals x institutional resident x disabled | -0.1656144 | 0.0392149 |
| Full duals x missing residency x disabled | -0.3121091 | 0.0477308 |
| Partial duals x community resident x disabled | 0.059407 | 0.0349008 |
| Partial duals x institutional resident x disabled | -0.522261 | 0.2330442 |
| Partial duals x missing residency x disabled | 0.1359108 | 0.0591859 |
| Dual eligibility, institutional status, original reason for entitlement, and gender: | ||
| Non-duals x institutional resident x aged x female | -0.0360198 | 0.0387172 |
| Non-duals x institutional resident x disabled x female | 0.0632813 | 0.0972535 |
| Non-duals x missing residency x aged x female | 0.1022933 | 0.009524 |
| Non-duals x missing residency x disabled x female | 0.2030838 | 0.0219463 |
| Full duals x community resident x aged x female | 0.0253688 | 0.0238392 |
| Full duals x community resident x disabled x female | -0.0109653 | 0.0235554 |
| Full duals x institutional resident x aged x female | -0.0780793 | 0.036145 |
| Full duals x institutional resident x disabled x female | -0.0157271 | 0.0325536 |
| Full duals x missing residency x aged x female | 0.291827 | 0.0494258 |
| Full duals x missing residency x disabled x female | 0.1634248 | 0.0433238 |
| Partial duals x community resident x aged x female | -0.0641133 | 0.0335277 |
| Partial duals x community resident x disabled x female | -0.0105862 | 0.028095 |
| Partial duals x institutional resident x aged x female | -0.37536 | 0.2447585 |
| Partial duals x institutional resident x disabled x female | -0.0201749 | 0.123955 |
| Partial duals x missing residency x aged x female | 0.4419479 | 0.0623898 |
| Partial duals x missing residency x disabled x female | 0.3076511 | 0.0604882 |
| Original reason for entitlement, CHF: | -0.1078823 | 0.0139239 |
| Aged x CHF | ||
| Original reason for entitlement, Disabled x pressure ulcers: | 0.321468 | 0.0158037 |
| Original reason for entitlement, Aged x pressure ulcers | 0.485386 | 0.0206655 |
| Original reason for entitlement, Aged x multiple sclerosis: | -0.235861 | 0.0597826 |
| Aged x multiple sclerosis | ||
| No Congestive heart failure x diabetes | -0.3146191 | 0.0121283 |
| Congestive heart failure x No diabetes | 0.1646257 | 0.0151394 |
| No Congestive heart failure x (asthma or COPD or cystic fibrosis) | -0.039098 | 0.0152652 |
| Congestive heart failure x No (asthma or COPD or cystic fibrosis) | -0.0093765 | 0.0194537 |
| No Congestive heart failure x chronic kidney disease | -0.0777502 | 0.0128155 |
| No Congestive heart failure x atrial fibrillation | 0.0852685 | 0.0142362 |
| Congestive heart failure x No atrial fibrillation | -0.1202888 | 0.0153342 |
| Schizophrenia x congestive heart failure | 0.1068341 | 0.0439697 |
| No Schizophrenia x COPD | 0.1029918 | 0.0169278 |
| Schizophrenia x No COPD | 0.1277205 | 0.0207238 |
| Schizophrenia x COPD | 0.3617188 | 0.0429217 |
| Schizophrenia x epilepsy | -0.1311777 | 0.0462925 |
| NOTE: One dollar was added to all spending values to remove zeros. Other regressions included additional chronic conditions, county-level average traditional Medicare spending, and beneficiaries’ race/ethnicity with no meaningful change in results.SOURCE: Kaiser Family Foundation analysis of the Chronic Conditions Data Warehouse 5% sample of claims, 2013-2016. | ||
| Table 3. Average Traditional Medicare Spending in 2015, Unadjusted for Health Risk Factors, for Beneficiaries who Switched to Medicare Advantage Or Stayed in Traditional Medicare in 2016, In Selected Counties | ||||||
| County(Largest city in the county) | People who stayed in TM in 2016 | People who switched to MA in 2016 | Difference in spending (unadjusted) | Percentage difference in spending, 2015 | ||
| Number of people | Average Part A & B spending, 2015 | Number of people | Average Part A & B spending, 2015 | |||
| Allegheny, Pennsylvania (Pittsburgh) | 45,820 | $9,358 | 1,440 | $11,464 | ($2,105) | -22% |
| Baltimore City, Maryland | 51,900 | $13,413 | 1,140 | $14,831 | ($1,418) | -11% |
| Bexar, Texas (San Antonio) | 87,360 | $8,427 | 1,720 | $7,957 | $471 | 6% |
| Clark, Nevada (Las Vegas) | 104,260 | $9,323 | 3,180 | $7,294 | $2,029 | 22% |
| Cook, Illinois (Chicago) | 339,340 | $9,629 | 6,040 | $6,653 | $2,976 | 31% |
| Cuyahoga, Ohio (Cleveland) | 80,740 | $8,941 | 2,160 | $5,312 | $3,629 | 41% |
| Erie, New York (Buffalo) | 43,720 | $7,992 | 1,300 | $9,489 | ($1,498) | -19% |
| Fulton, Georgia (Atlanta) | 39,480 | $7,930 | 1,660 | $6,903 | $1,027 | 13% |
| Harris, Texas (Houston) | 157,860 | $10,134 | 5,040 | $7,725 | $2,409 | 24% |
| King, Washington (Seattle) | 113,020 | $8,044 | 2,820 | $6,029 | $2,015 | 25% |
| Los Angeles, California | 322,160 | $11,719 | 5,300 | $5,440 | $6,278 | 54% |
| Marion, Indiana (Indianapolis) | 65,580 | $9,084 | 2,720 | $9,597 | ($513) | -6% |
| Mecklenburg, North Carolina (Charlotte) | 53,760 | $7,835 | 1,560 | $11,907 | ($4,072) | -52% |
| Miami Dade, Florida (Miami) | 87,920 | $12,523 | 4,940 | $8,819 | $3,704 | 30% |
| Milwaukee, Wisconsin | 51,820 | $9,217 | 2,320 | $9,007 | $210 | 2% |
| Multnomah, Oregon (Portland) | 25,800 | $9,216 | 1,080 | $12,434 | ($3,218) | -35% |
| Queens, New York (New York City) | 102,980 | $11,460 | 3,880 | $12,328 | ($868) | -8% |
| Salt Lake, Utah | 41,720 | $8,418 | 1,220 | $6,296 | $2,122 | 25% |
| San Bernardino, California | 46,720 | $9,576 | 1,440 | $5,150 | $4,426 | 46% |
| Wayne, Michigan (Detroit) | 125,520 | $11,272 | 1,600 | $8,260 | $3,012 | 27% |
| NOTE: Excludes beneficiaries in Puerto Rico and those who enrolled in cost, Medicare Medical Savings Account (MSA), PACE plans, Medicare-Medicaid Plans (MMPs) and employer group health plans. Excludes beneficiaries with end-stage renal disease. Excludes people who died before the end of 2015. Excludes people not enrolled in Medicare prior to 2013. TM is traditional Medicare. MA is Medicare Advantage.SOURCE: Kaiser Family Foundation analysis of the Chronic Conditions Data Warehouse 5% sample of claims, 2013-2016. | ||||||
| Table 4. Average Traditional Medicare Spending in 2015 for Beneficiaries who Switched to Medicare Advantage Or Stayed in Traditional Medicare in 2016, Unadjusted for Health Risk Factors | ||||||
| Characteristics in 2015 | People who stayed in TM in 2016 | People who switched to MA in 2016 | Difference in spending | Percentage difference in spending | ||
| Number of people | Average Part A & B spending, 2015 | Number of people | Average Part A & B spending, 2015 | |||
| Overall | 23,714,780 | $8,859 | 443,240 | $7,628 | $1,231 | 14% |
| Age | ||||||
| Under 65 | 3,579,500 | $8,431 | 131,680 | $8,461 | -$30 | 0% |
| 65-69 | 3,360,240 | $6,900 | 79,480 | $6,084 | $815 | 12% |
| 70-74 | 5,598,560 | $7,341 | 96,280 | $5,915 | $1,426 | 19% |
| 75-79 | 4,341,380 | $8,792 | 63,060 | $7,469 | $1,323 | 15% |
| 80 and older | 6,835,100 | $11,327 | 72,740 | $10,347 | $980 | 9% |
| Dual eligibility | ||||||
| Full dual eligible | 3,324,880 | $12,951 | 100,360 | $12,310 | $641 | 5% |
| Partial dual eligible | 1,257,160 | $9,220 | 61,580 | $8,565 | $654 | 7% |
| Non-dual eligible | 19,132,740 | $8,122 | 281,300 | $5,788 | $2,335 | 29% |
| Gender | ||||||
| Female | 13,211,740 | $9,071 | 240,420 | $8,185 | $887 | 10% |
| Male | 10,503,040 | $8,588 | 202,820 | $7,017 | $1,572 | 18% |
| Chronic conditions | ||||||
| Anemia | 5,212,220 | $20,958 | 86,360 | $20,026 | $932 | 4% |
| Rheumatoid Arthritis | 7,987,660 | $14,133 | 136,800 | $12,960 | $1,173 | 8% |
| Asthma | 2,077,200 | $22,438 | 42,740 | $19,451 | $2,986 | 13% |
| Atrial fibrillation | 1,581,540 | $15,181 | 18,920 | $13,531 | $1,650 | 11% |
| Breast or prostate cancer | 2,160,960 | $20,359 | 24,240 | $20,502 | -$143 | -1% |
| COPD | 3,199,460 | $23,280 | 51,220 | $22,306 | $975 | 4% |
| Congestive heart failure | 2,767,340 | $21,551 | 54,960 | $18,925 | $2,626 | 12% |
| Depressive disorders | 6,273,440 | $15,846 | 139,940 | $13,779 | $2,067 | 13% |
| Diabetes | 6,592,380 | $12,749 | 136,920 | $10,973 | $1,776 | 14% |
| Epilepsy | 4,279,460 | $19,836 | 73,760 | $18,556 | $1,281 | 6% |
| Hypothyroidism | 3,865,660 | $13,668 | 57,540 | $12,931 | $737 | 5% |
| Ischemic heart disease | 6,792,700 | $15,853 | 107,780 | $15,162 | $691 | 4% |
| Kidney Disease | 594,560 | $20,993 | 13,180 | $18,447 | $2,547 | 12% |
| Liver disease | 790,800 | $21,789 | 17,040 | $19,090 | $2,699 | 12% |
| Mobility impairments | 577,820 | $32,279 | 11,120 | $29,137 | $3,142 | 10% |
| Obesity | 2,942,860 | $16,436 | 69,620 | $14,545 | $1,892 | 12% |
| Peripheral vascular disease | 2,888,480 | $19,606 | 47,420 | $18,489 | $1,118 | 6% |
| Pressure ulcers | 452,120 | $15,314 | 13,840 | $15,335 | -$21 | 0% |
| Schizophrenia | 993,360 | $31,390 | 16,060 | $31,312 | $78 | 0% |
| Stroke/TIA | 907,500 | $26,581 | 15,180 | $25,888 | $694 | 3% |
| NOTE: Values have not been adjusted for differences in health status and other risk factors. Excludes beneficiaries in Puerto Rico and those who enrolled in cost, Medicare Medical Savings Account (MSA), PACE plans, Medicare-Medicaid Plans (MMPs) and employer group health plans. Excludes beneficiaries with end-stage renal disease. Excludes people who died before the end of 2015. Excludes people not enrolled in Medicare prior to 2013. TM is traditional Medicare. MA is Medicare Advantage. Only chronic conditions with at least 10,000 people switching to Medicare Advantage are shown in table.SOURCE: Kaiser Family Foundation analysis of the Chronic Conditions Data Warehouse 5% sample of claims, 2013-2016. | ||||||
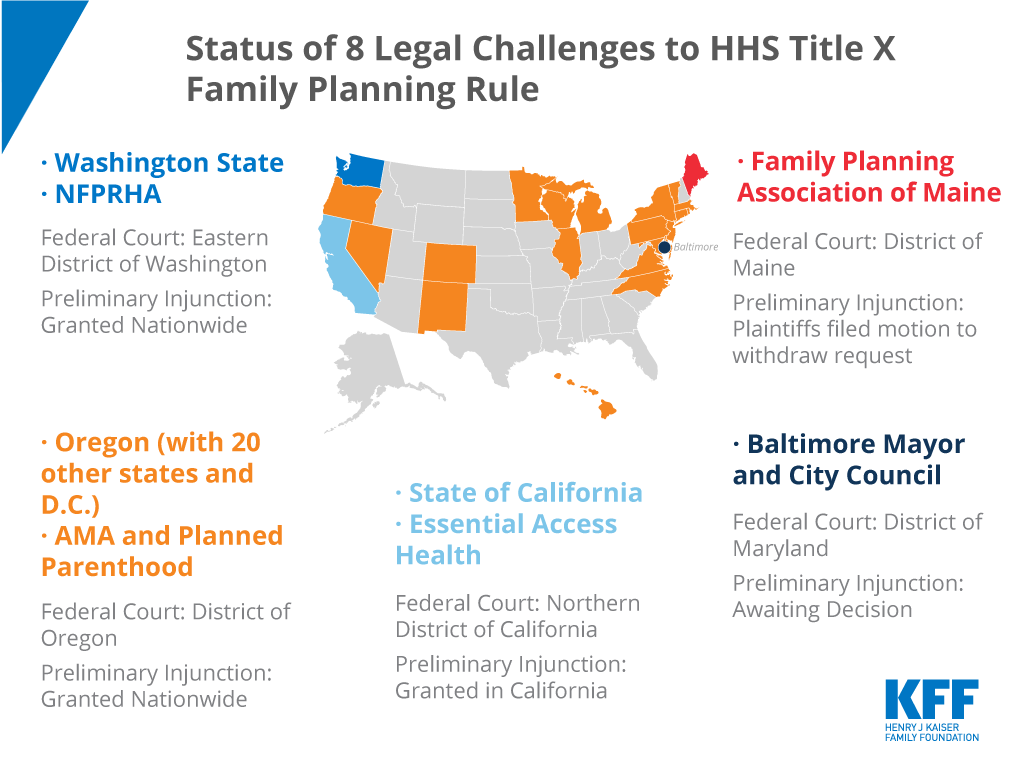
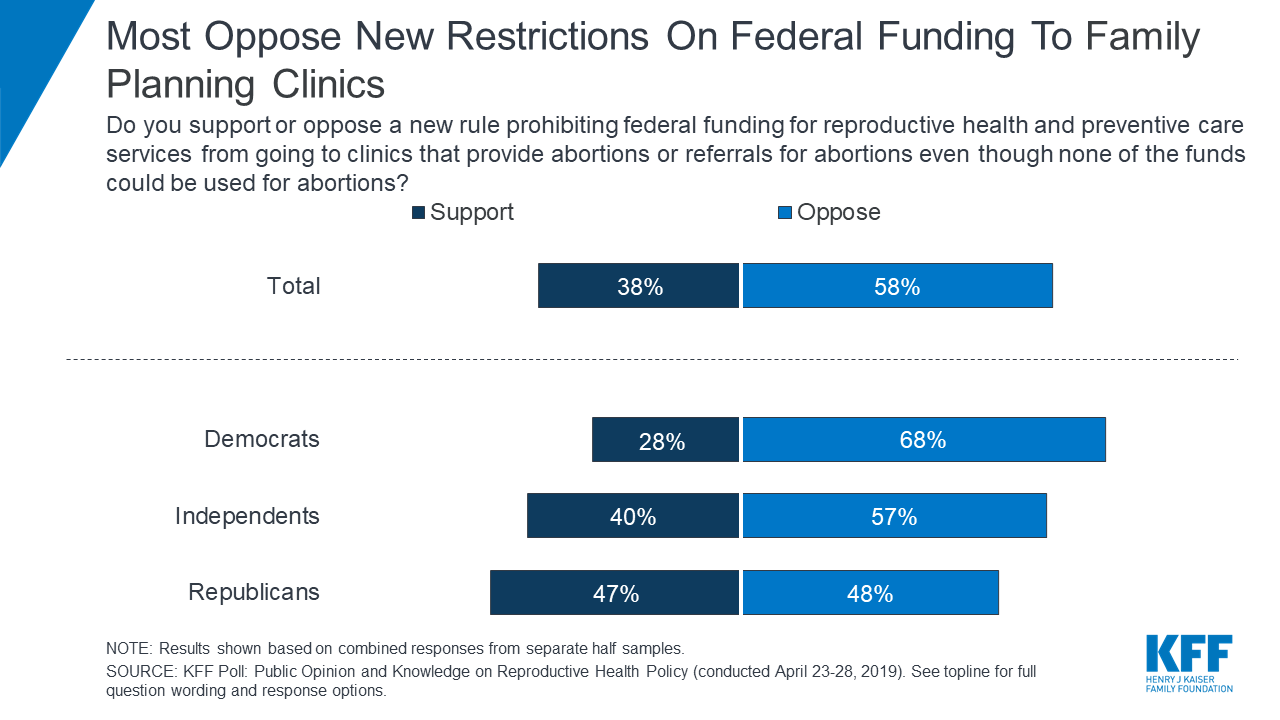
A new KFF poll of the public’s views on reproductive health issues finds most Americans, including majorities of women of reproductive age, are concerned that access to women’s reproductive health and preventive care services may be limited by the Trump administration’s changes to Title X, the nation’s federal family planning program. The poll examines the public’s views of major regulatory changes to the Title X program, which funds nearly 4,000 clinics nationally to pay for family planning and other preventive services to lower-income women. Originally set to take effect today but blocked by national injunctions issued by multiple federal judges, the new regulations would prohibit federal funding to any family planning clinic that also provides abortion services or referrals, even though none of the funds could be used for abortions. Most of the public (58%) oppose changing the program to exclude organizations that provide abortions or referrals for abortions with other resources, while nearly four in 10 (38%) favor such changes. Most Democrats (68%) and independents (57%) oppose such changes, though Republicans are divided (47% favoring, 48% opposing).
The new regulation could also channel federal family planning funds to “non-traditional” organizations that only offer natural family planning methods or promote abstinence and do not provide other contraceptive services. Most of the public – including at least half of Republicans – oppose allowing federal family planning funds to go to organizations that either only counsel about natural family planning methods (68%); don’t counsel pregnant women and girls about all of their options including prenatal care, adoption and abortion (65%); or do not provide contraception or birth control (59%). Most women, including most women of reproductive age, oppose funding such organizations. KFF polling has consistently found strong support for federal funding for reproductive health services for lower-income women with majorities of Democrats, independents, and Republicans saying it is important the government provide this funding. This month’s poll also finds, in light of the Trump administration’s actions, 68% of Americans, including three-fourths (76%) of women of reproductive age and nearly half of Republicans (49%), say they are “very” or “somewhat” concerned that the new regulations would limit access to women’s reproductive health and preventive care services.

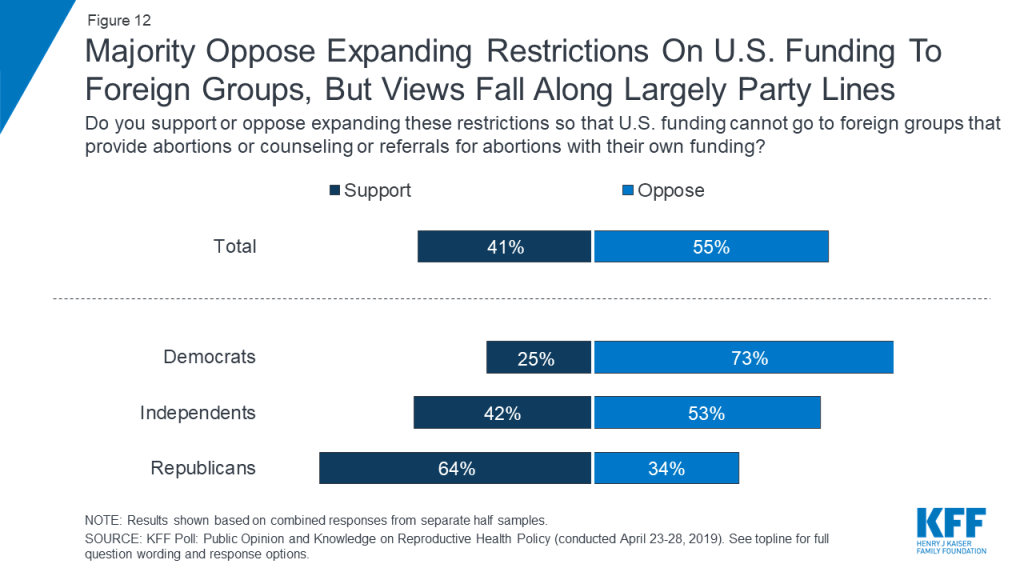
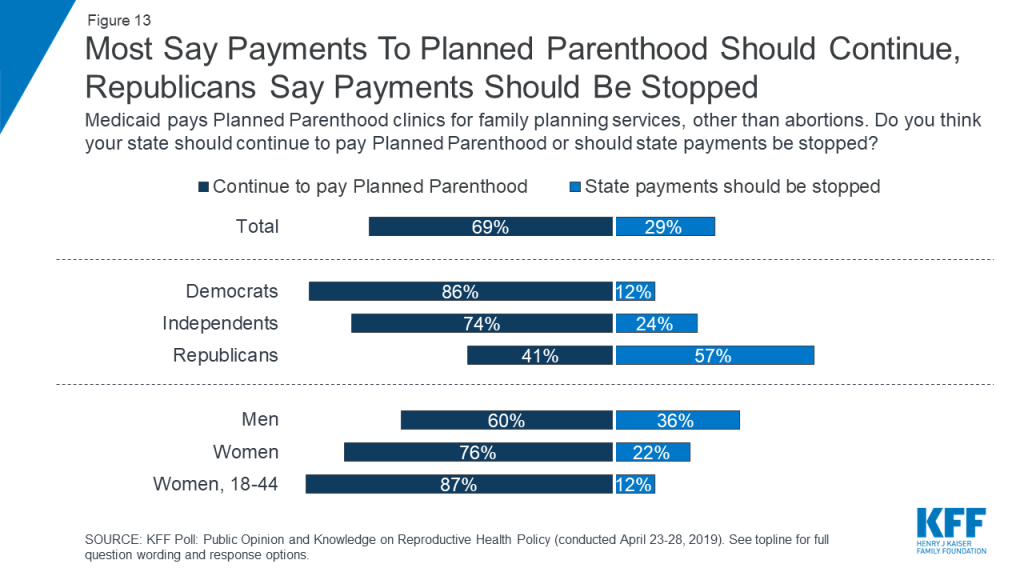
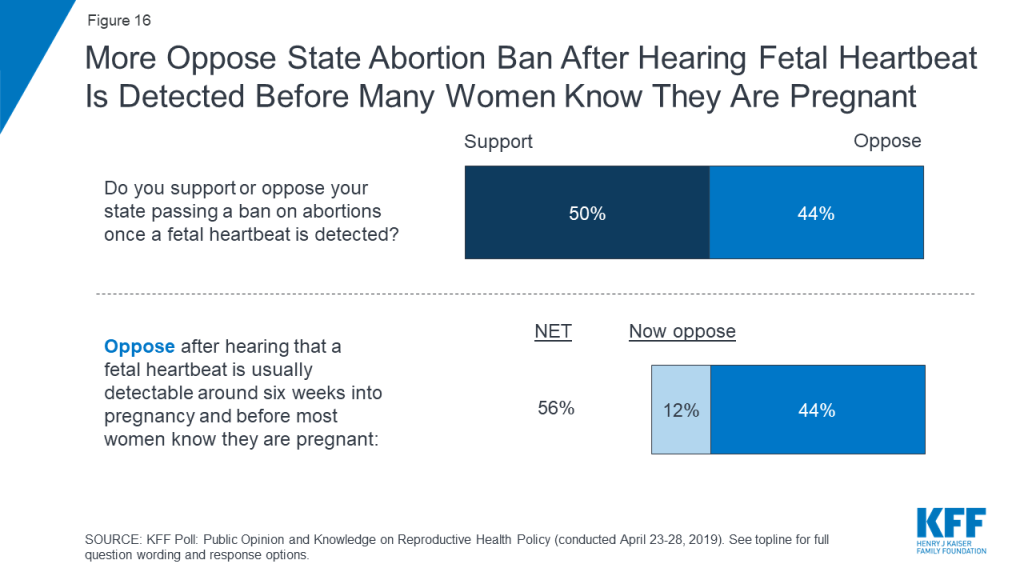
If implemented, the new regulations would prohibit Title X funds from going to Planned Parenthood, the nation’s largest family planning provider and biggest Title X grant recipient. Some states have also proposed cutting off funding to Planned Parenthood for any services. When asked about such changes, about seven in 10 (69%) Americans say their state should continue to make payments to Planned Parenthood, while about three in 10 (29%) say their state should stop payments. Views split along partisan lines, with a large majority of Democrats (86%) wanting Planned Parenthood payments to continue and most Republicans (57%) wanting such payments to stop. Public Split on Fetal Heartbeat Bills that Ban Abortions Early in Pregnancy The poll also assesses the public’s views on other issues related to reproductive health and abortion, including some states’ efforts to enact new abortion restrictions that could lead the Supreme Court to revisit the 1973 Roe v. Wade decision that established a women’s constitutional right to an abortion. These include “fetal heartbeat” bills, enacted in Ohio and under consideration in other states, that prohibit a woman from having an abortion once a fetal heartbeat is detected. The public initially splits on whether their state should enact a fetal heartbeat ban, with half supporting it and nearly as many (44%) opposing it. Republican women are most supportive of such a ban, with about three quarters (77%) favoring it. However, when supporters are informed that a fetal heartbeat can be detected around six weeks into pregnancy, before most women know they are pregnant, enough switch their views to create a more narrow majority (56%) opposing a fetal heartbeat ban. Overall, two-thirds of the public (65%) do not want to see the Supreme Court overturn Roe v. Wade, while about one-third (32%) would like to see the decision overturned. These views split along partisan lines, with most Republicans (56%) wanting to see it overturned and larger majorities of Democrats (80%) and independents (68%) wanting it to stand. If Roe v. Wade were to be overturned, 42% of the public believes that abortion would no longer be legal in their state while half believe it would still be legal in their state. Public Unaware of Some ACA Provisions Affecting Women’s Health Services and Coverage The poll also examines the public’s knowledge about key provisions of the 2010 Affordable Care Act that relate to the availability of reproductive health care services. While most (62%) know that the ACA requires insurance plans to include a minimum package of benefits including maternity care, fewer know that the law eliminates out-of-pocket costs for many preventive services including mammograms (48%); eliminates out-of-pocket costs for birth control (38%), and prohibits insurers from charging women more than men for their health coverage (36%). Partisans Split on Trump Administration Policy that Blocks U.S. Foreign Aid to Foreign Organizations that Perform or Promote Abortion, Even if They Use Their Own Funds to Do So The poll also examines the public’s views of the Mexico City Policy, which every Republican administration since President Reagan has adopted to prevent U.S. global family planning funding from going to foreign organizations that perform or promote abortion as a method of family planning, even using their own funds. The Trump administration has expanded the policy to apply to almost all U.S. global health funding. While the majority of the public does not support this restriction, as with other abortion-related issues, views of the Mexico City Policy diverge along partisan lines. When asked about the expanded policy, most (55%) oppose the restrictions, including a large majority of Democrats (73%) and a smaller majority of independents (53%). In contrast, nearly two-thirds (64%) of Republicans support the expanded restrictions. Designed and analyzed by public opinion researchers at KFF, the poll was conducted April 23-28, 2019 among a nationally representative random digit dial telephone sample of 1,200 adults. Interviews were conducted in English and Spanish by landline (305) and cell phone (895). The margin of sampling error is plus or minus 3 percentage points for the full sample and 9 percentage points for women ages 18-44. For results based on subgroups, the margin of sampling error may be higher.
Kaiser Family Foundation has a long record of measuring the public’s attitudes on reproductive health care issues, including several in-depth surveys of women of reproductive age (between the ages of 18 and 44). In this poll, KFF examines public opinion towards many different facets of reproductive health care, with a focus on recent changes to federal reproductive health policy made by the Trump administration. In particular, the administration recently finalized major changes to the Title X program, which provides federal funding for family planning services for lower-income people. If implemented, these changes would prohibit federal Title X funds from going to any family planning organization that also provides abortion services or referrals. The new regulation could also channel federal family planning funds to “non-traditional” organizations that only offer natural family planning methods or promote abstinence and do not provide other contraceptive services. The implementation of the new rule was recently halted by court order, but litigation continues. The Trump administration also recently expanded the Mexico City Policy, which restricts federal funding to organizations abroad if they provide abortion services or counseling or referrals for abortions.
This poll also examines public attitudes toward laws that have been recently passed by a number of states prohibiting abortions after a fetal heartbeat has been detected and before many women even know they are pregnant. The poll continues KFF’s tracking of the public’s awareness of provisions related to women’s health that are part of the 2010 Affordable Care Act (ACA).
68% of Americans say they are concerned new #TitleX family planning regulations would limit access to women’s reproductive health and preventive care services.
The Trump administration has pursued a far-reaching strategy aimed at changing the federal government’s position on domestic and international reproductive health policy. On February 22, 2019, the Department of Health and Human Services released the final rule regarding use of Title X federal funds for family planning clinics. These regulations affect nearly 4,000 clinics, which provide health care services to lower-income women in all 50 states.
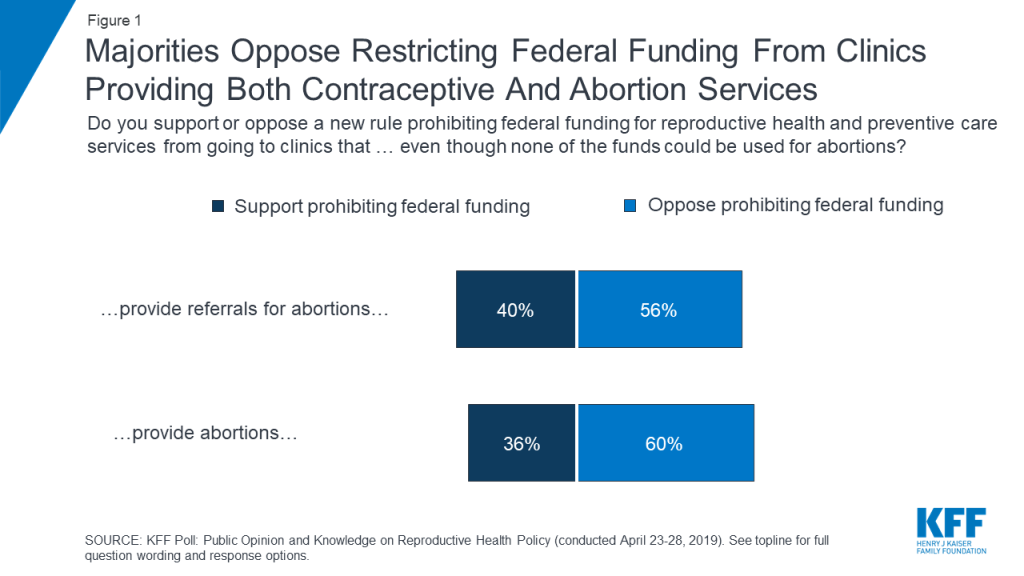
The Title X program funds clinics across the country to provide family planning services to lower-income women. The program has always prohibited federal funding to be used for abortions; but the new regulations expand these restrictions so that funding cannot go to any organizations that provide contraceptive services if they also provide abortions or refer for abortions. Majorities of the public oppose changing the regulations to exclude any organization that provides abortions (60 percent) or referrals for abortions (56 percent).
These attitudes are largely partisan with about seven in ten Democrats (68 percent) opposing the restrictions on federal funding to organizations that either provide abortions or referrals for abortions while Republicans are divided with similar shares saying they support (47 percent) and oppose (48 percent) the new rule. A larger share of independents say they oppose the new rule (57 percent) than say they support it (40 percent).

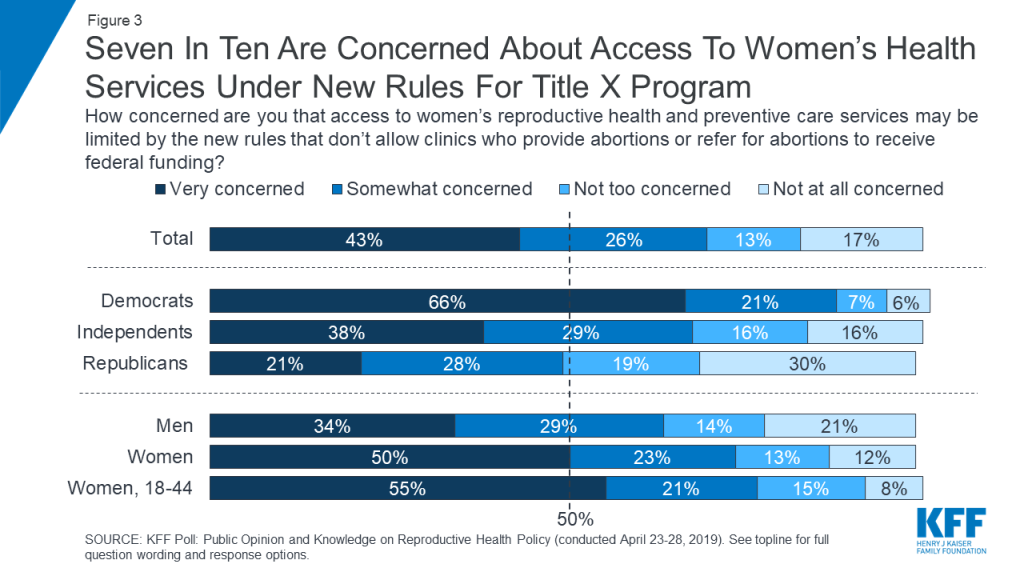
Overall, seven in ten (including 87 percent of Democrats, two-thirds of independents, and nearly half of Republicans) are concerned (either “very” or “somewhat”) that access to women’s reproductive health and preventive care services may be limited by the new rules that don’t allow family planning clinics that also provide abortions or refer for abortions to receive federal funding. In addition, three-fourths of women ages 18-44 (76 percent) say they are concerned that access to reproductive health and preventive care services may be limited by the new rules.
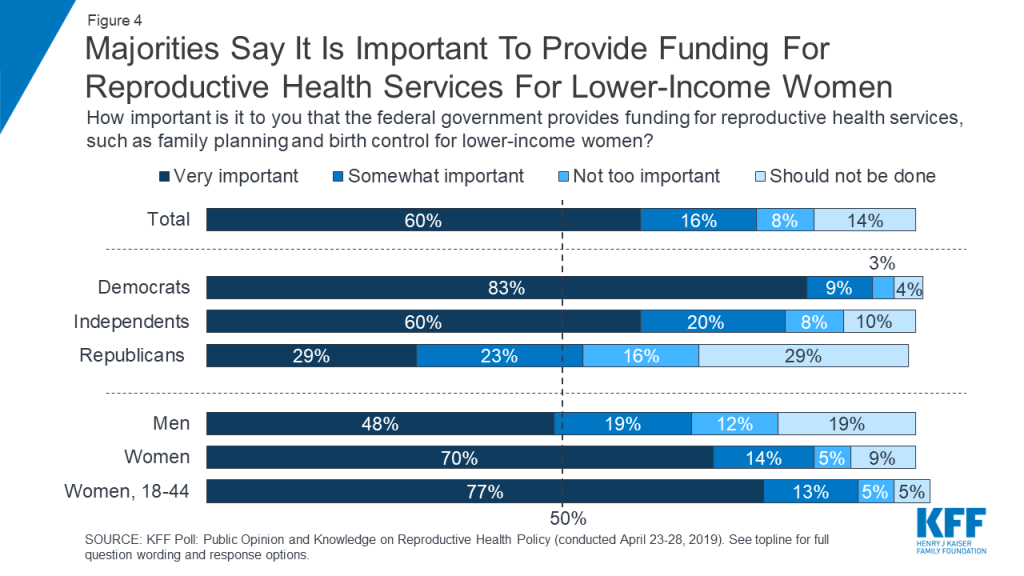
In addition, KFF continues to find strong support for federal government funding for reproductive health services for lower-income women. Three-fourths of the public say it is important (either “very” or “somewhat” that the federal government provides funding for reproductive health services including family planning and birth control for lower-income women. While a large majority of Democrats (83 percent) and six in ten independents say this is “very” important, the share is much smaller among Republicans (29 percent). This is consistent with previous KFF polling which found majorities of both women and men reporting that it is important that this funding continues.
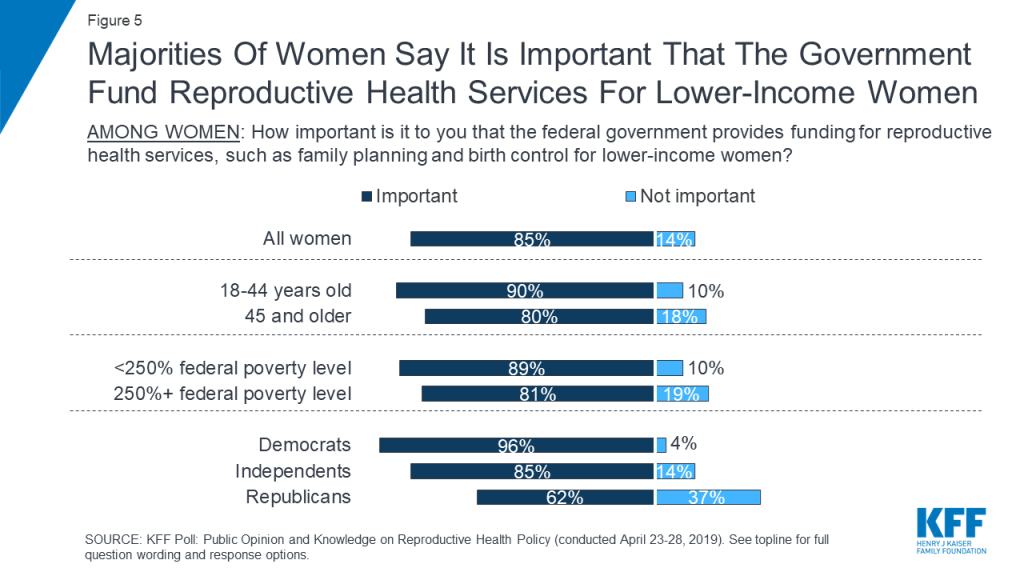
A majority of women (85 percent) say it is important the federal government provides this funding including seven in ten who say it is “very important.” Support is consistent across women with majorities of women, regardless of party identification, age, and income, saying this funding is at least somewhat important.
Republican Women
While Republican women’s support for the Trump administration’s actions limiting federal funding from going to family planning clinics that provide abortions or referrals for abortions is similar to the support of Republican men. Republican women are more likely than their male counterparts to generally support Title X funding for reproductive health care for lower-income women. Six in ten Republican women (62 percent) say it is either “very important” or “somewhat important” the federal government provides funding for reproductive health services for lower-income women (compared to 96 percent of Democratic women, 85 percent of independent women, and 47 percent of Republican men). In addition, they are divided on whether these actions will limit access to women’s reproductive health and preventive care services. Slightly more than half (53 percent) say they are concerned that access will be limited by these new rules compared to 46 percent who say they are not concerned.
While views towards the new rules prohibiting Title X funds from going to organizations that provide both contraceptive and abortion services are largely partisan, there is some consensus across political parties towards other changes to the Title X program.
One of the major changes in the Trump administration’s final Title X rule is removing the requirement that organizations that receive federal Title X funding must provide counseling to pregnant women that “includes abortion, adoption, and prenatal care referrals.” The new Title X regulation permits and encourages the participation of “non-traditional” organizations that only offer natural family planning (NFP) (such as fertility awareness or the rhythm method), or promote abstinence, and do not necessarily provide contraceptive services.
A majority of the public – including a majority of women – oppose these changes to the federal funding structure. About seven in ten (68 percent) oppose allowing federal funding to go to organizations that only provide counseling on NFP methods, such as the rhythm method. Two-thirds oppose (65 percent) allowing federal funding to go to organizations that do not counsel pregnant people about all of their choices, including prenatal care, adoption, and abortion; and about six in ten (59 percent) oppose federal family planning funding to support organizations that do not provide contraception or birth control.

At least half of Democrats, independents, and Republicans say they oppose federal funding to go to organizations that do not provide a full array of reproductive health care services.
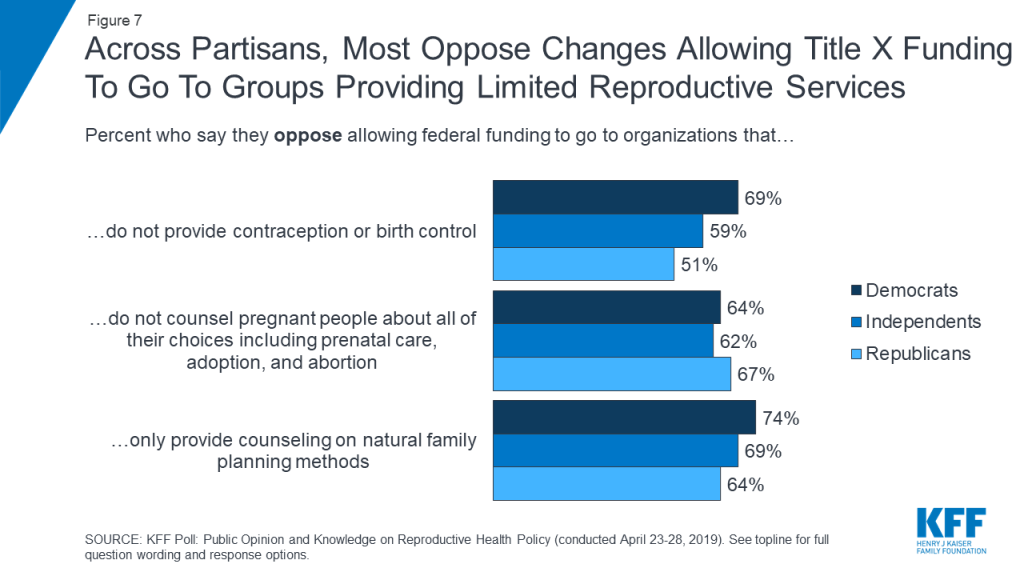
A majority of women ages 18-44 oppose allowing federal funding to go to organizations that only provide counseling on natural family planning methods (73 percent), do not counsel pregnant people about all of their choices including prenatal care, adoption and abortion (66 percent), or do not provide contraception or birth control (64 percent).
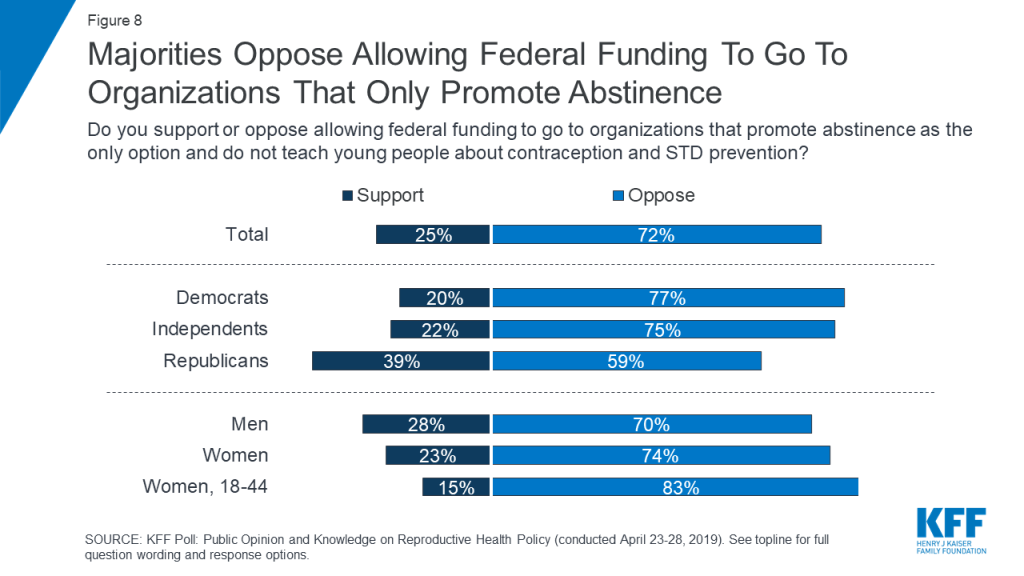
Similarly, the public largely opposes federal funding for abstinence-only education for teenagers. The Trump administration recently announced new guidelines for funding programs to prevent teenage pregnancy. These new guidelines promote organizations that teach abstinence-only or emphasize “sexual risk avoidance.”
About seven in ten adults (72 percent) oppose allowing federal funding to go to organizations that promote abstinence as the only option and do not teach young people about contraception and STD prevention. Majorities of Democrats (77 percent) and independents (75 percent) oppose, as do a majority of Republicans (59 percent).
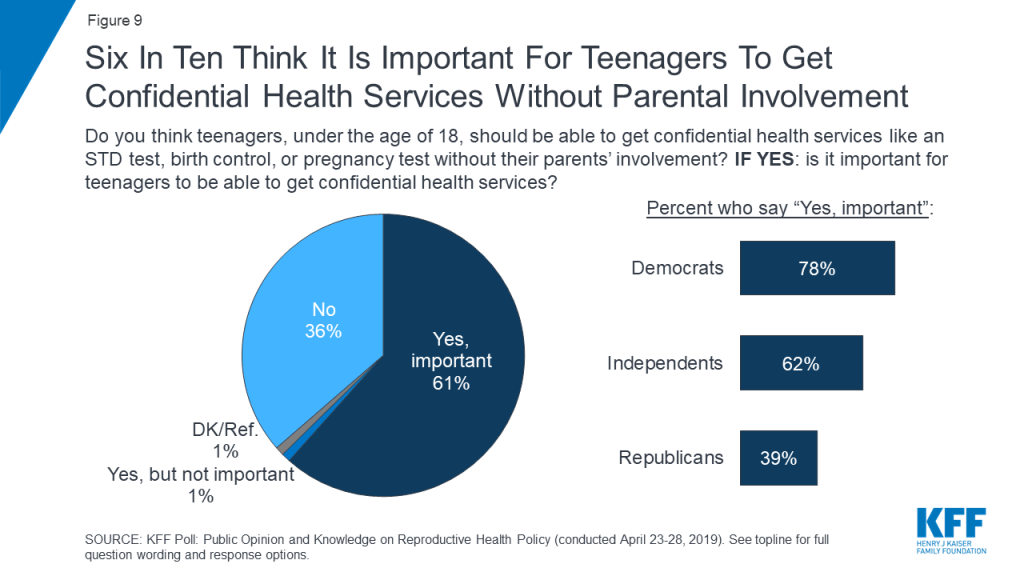
More generally, about six in ten Americans (63 percent) think teenagers should be able to get confidential health services such as STD tests, birth control, or pregnancy tests without their parent’s involvement and 61 percent say this is either “very important” or “somewhat important.” A majority of Democrats (78 percent) and independents (62 percent) and fewer Republicans (39 percent) think it is important for teenagers to be able to access these types of health services without parental involvement.
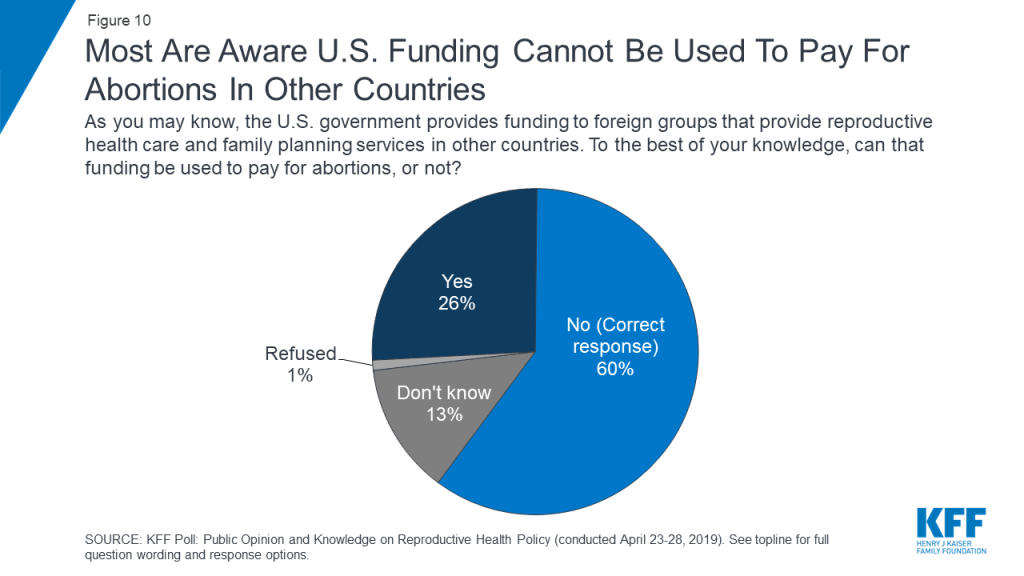
While U.S. law (the Helms Amendment) restricts the use of foreign aid from paying for abortions, in early 2017, the Trump administration reinstated the Mexico City Policy, which further restricts the use of U.S. funding. Specifically, it restricts U.S. funding from going to foreign non-governmental organizations that “perform or actively promote abortion as a method of family planning” using their own money; this includes providing abortions as well as counseling and referrals for abortions. The policy, first announced by President Reagan, has been rescinded and reinstated by subsequent administrations – depending on the President’s political party. Previously, when in place under prior Republican administrations, the Mexico City Policy had only applied to foreign organizations receiving U.S. global family planning funding. The Trump administration expanded it to nearly all U.S. global health funding, greatly increasing its scope.
Overall, most (60 percent) of the public are aware that U.S. government funding to foreign groups that provide reproductive health care and family planning services cannot be used to pay for abortions although about one-fourth (26 percent) incorrectly believe it can be used to pay for abortions.
When asked whether they support or oppose the federal government expanding these restrictions so that no U.S. funding can go to foreign groups that provide abortions or counseling or referrals for abortions, even with their own funding, a larger share of the public oppose this expansion of U.S. policy than support it. More than half oppose expanding these restrictions so that U.S. funding cannot go to foreign groups that provide abortions (56 percent) or referrals for abortions (54 percent) even with their own funds. More than half of women oppose these restrictions while men are more divided.
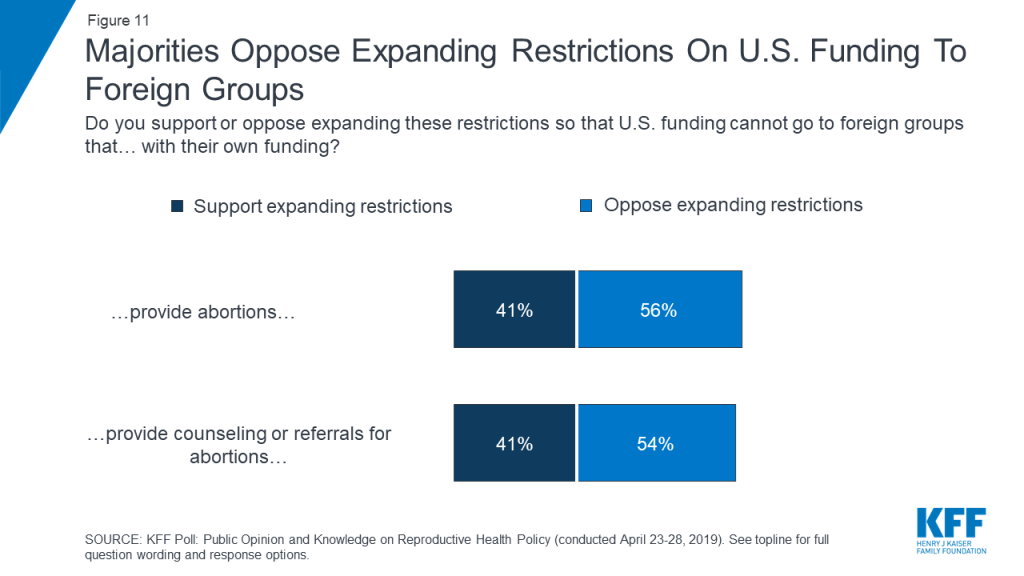
Similar to views of domestic spending, views of international policy in this area fall along largely partisan lines. Majorities of Democrats oppose expanding restrictions on U.S. funding to any foreign group that provides ether abortions or counseling or referrals for abortions (73 percent), while most Republicans support these restrictions (64 percent). Independents are more divided with 53 percent opposing the federal government expanding these restrictions and 42 percent supporting.
The Trump administration’s new final rule would also mean that Title X funding to Planned Parenthood, the nation’s largest family planning providers, would be blocked.2 In addition to Title X funding, Planned Parenthood clinics participate in the Medicaid program, which reimburses them for family planning services they provide to millions of lower-income people across the U.S. Nearly four in ten (38 percent) women report having ever visited a Planned Parenthood clinic.
While no federal funding to Planned Parenthood is used to pay for abortions, some states have proposed stopping all payments to Planned Parenthood for any family planning services, such as contraception or STI testing. Seven in ten (69 percent) would like their state to continue making payments to Planned Parenthood while about three in ten (29 percent) say all state payments to Planned Parenthood should be stopped. Views towards state payments to Planned Parenthood are largely partisan with nearly nine in ten Democrats (86 percent) and three-fourths of independents (74 percent) wanting to see state payments continue, while nearly six in ten Republicans (57 percent) want state payments to stop. Sizable majorities of women, overall (76 percent), and those 18-44 years old (87 percent) also support continuing state payments to Planned Parenthood. Republican women are divided with similar shares saying their state should stop payments (50 percent) as say the payment should continue (48 percent).
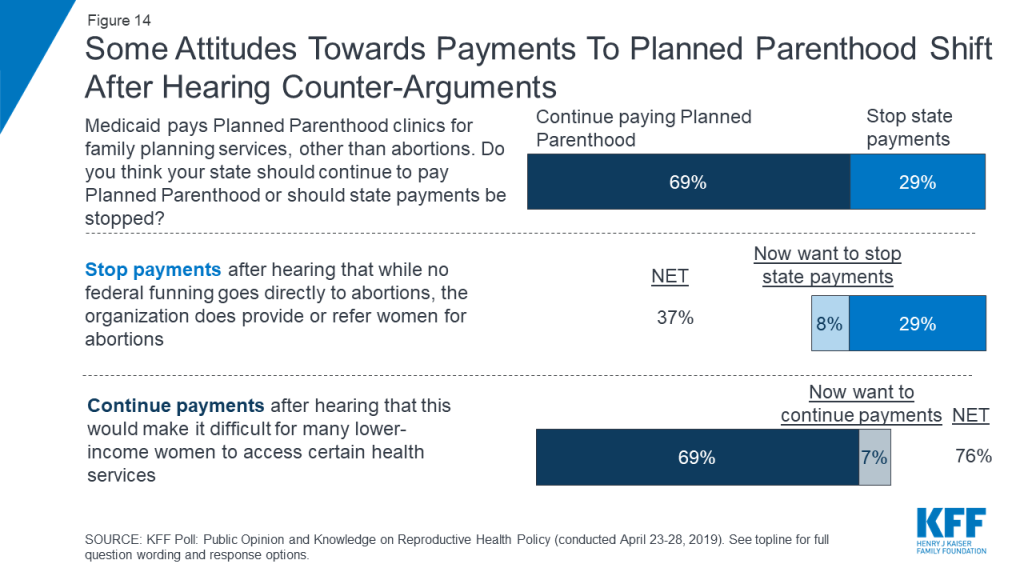
Attitudes towards continued state payments to Planned Parenthood seem somewhat malleable with about one-tenth of the public, on either side of the argument, changing their minds after hearing counter-arguments. For example, one-fourth (7 percent overall) change their minds and now want to see the state payments to Planned Parenthood continue after hearing that this change would make it difficult for many lower-income women to access certain health services. This brings the total share who want to see their state payments to Planned Parenthood continue up to three-fourths of the public (76 percent). On the other side of the argument, 12 percent (8 percent of overall) change their minds after hearing that while the funding does not go directly to abortions, the organization does provide or refer for abortion (bringing the share who want to see state payments stop up to 37 percent).
In addition to the Trump administration’s actions, there have been other state-level challenges to reproductive health care access.3 For example, Ohio lawmakers recently banned abortions after a fetal heartbeat can be detected. There are similar laws in 14 other states.4
When asked about their own state passing a similar “heartbeat” ban, the public is divided with a slightly larger share supporting such a law (50 percent) while 44 percent are opposed. There are stark partisan differences with seven in ten Republicans saying they support their state passing a ban on abortions once a fetal heartbeat is detected while nearly two-thirds of Democrats (65 percent) are opposed. Independents are more divided with similar shares supporting (53 percent) and opposing (44 percent) a ban. Among women ages 18-44, about half (52 percent) oppose their state passing a law restricting abortions once a fetal heartbeat is detected while 42 percent support passing this type of law.
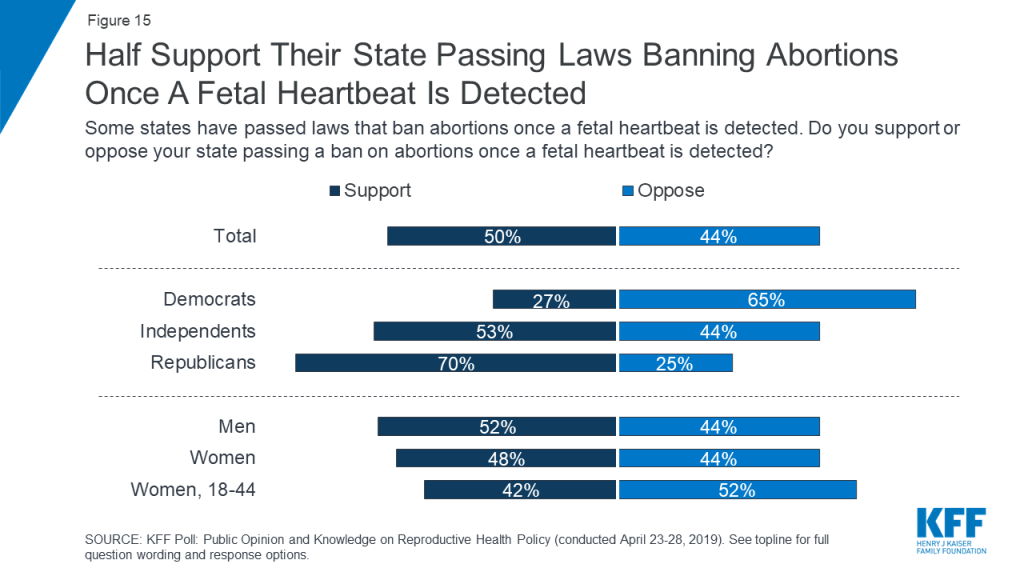
While generally Republicans are more supportive of their state passing similar legislation, Republican women are more supportive than any other group. Three-fourths (77 percent) of Republican women support their state passing a ban on abortions once a fetal heartbeat is detected, compared to 64 percent of Republican men.
| Table 1: Republican Women Are The Group Most Supportive Of Fetal Heartbeat Bills | ||||
| Some states have passed laws that ban abortions once a fetal heartbeat is detected. Do you support or oppose your state passing a ban on abortions once a fetal heartbeat is detected? | Support | Oppose | Don’t know/ Refused | |
| Democrats | Women | 25% | 65% | 10% |
| Men | 31 | 65 | 4 | |
| Independents | Women | 53 | 44 | 3 |
| Men | 52 | 45 | 3 | |
| Republicans | Women | 77 | 16 | 7 |
| Men | 64 | 31 | 5 | |
Opponents argue that restricting abortions once a fetal heartbeat is detectable may effectively ban abortions six weeks into pregnancy and before many women know they are pregnant. About one-fourth of those who support a ban (12 percent of total) change their minds after hearing that this ban would restrict abortions before many women know they are pregnant – bringing total opposition up to 56 percent overall.
With multiple states passing bills aimed at restricting access to abortions, many legal scholars believe that the U.S. Supreme Court will be forced to take up one of these cases, thereby forcing the Court to revisit Roe v. Wade, the 1973 U.S. Supreme Court case which established a woman’s constitutional right to have an abortion. Overall, two-thirds of the public (65 percent) do not want to see the Supreme Court overturn Roe v. Wade, while about one-third (32 percent) would like to see the decision overturned.
Unsurprisingly, attitudes are largely partisan with a majority (56 percent) of Republicans wanting to see Roe v. Wade overturned, while eight in ten Democrats and about seven in ten independents (68 percent) do not want the decision overturned. Two-thirds of women overall and seven in ten women ages 18-44 say they would like to see Roe v. Wade stay in place.
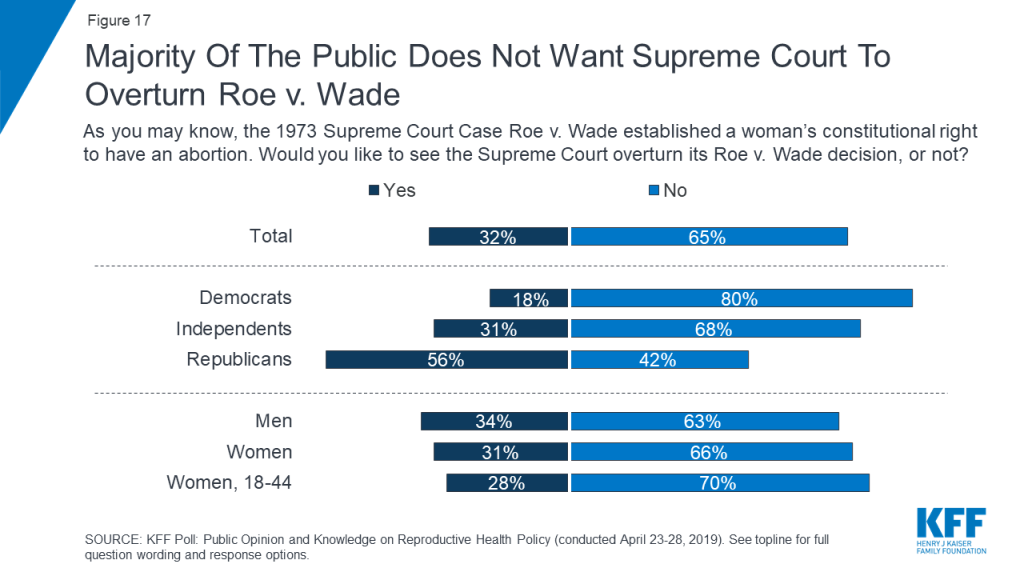
If the U.S. Supreme Court overturns Roe v. Wade, it would leave the legality of abortion up to individual states5 . In recent years, a number of states including Arkansas, Louisiana, North Dakota, South Dakota, and Mississippi have passed “trigger laws” which would make abortion illegal in the state if the Roe v. Wade decision is overturned. Overall, half of adults (50 percent) think abortion would continue to be legal in their state, while 42 percent think it would no longer be legal. And notably, 63 percent of those who live in states that have passed or have introduced legislation that would enact a “trigger law” think abortion would not be legal in their state if the Supreme Court overturned Roe v. Wade. Conversely, 59 percent of Americans in states which have no proposed “trigger laws” think abortion would remain legal in their states should the Supreme Court overturn the decision.6
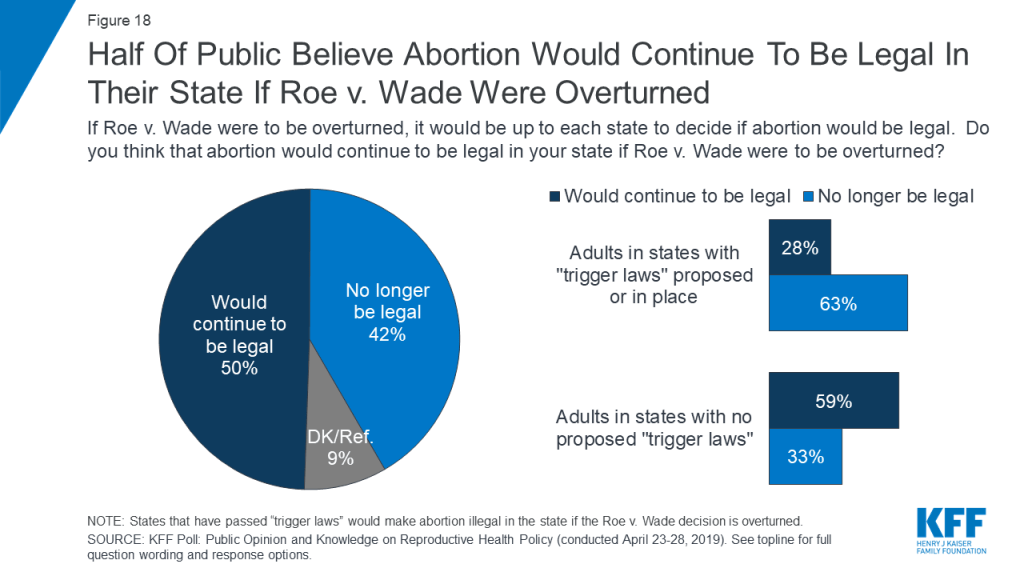
The implementation of the Affordable Care Act (ACA) had major implications for women’s health and access to care with requirements such as mandatory maternity care, coverage without cost-sharing for preventive services such as contraception, and a prohibition on gender rating – charging women more than men for the same coverage.7 While some changes took several years to implement, many of these requirements were implemented more than nine years ago. The poll finds there is still some confusion of what the 2010 health care law actually does. Six in ten (62 percent) are aware the law requires insurance plans purchased by individuals to include a minimum package of benefits including maternity care while about half (48 percent) are aware the law prohibits insurance companies from denying coverage based on a person’s medical history or that the law eliminates out-of-pocket costs for preventive health care services (48 percent). Less than half are aware the ACA eliminates out-of-pocket costs for birth control (38 percent) and prohibits insurance companies from charging women higher premiums than men (36 percent).
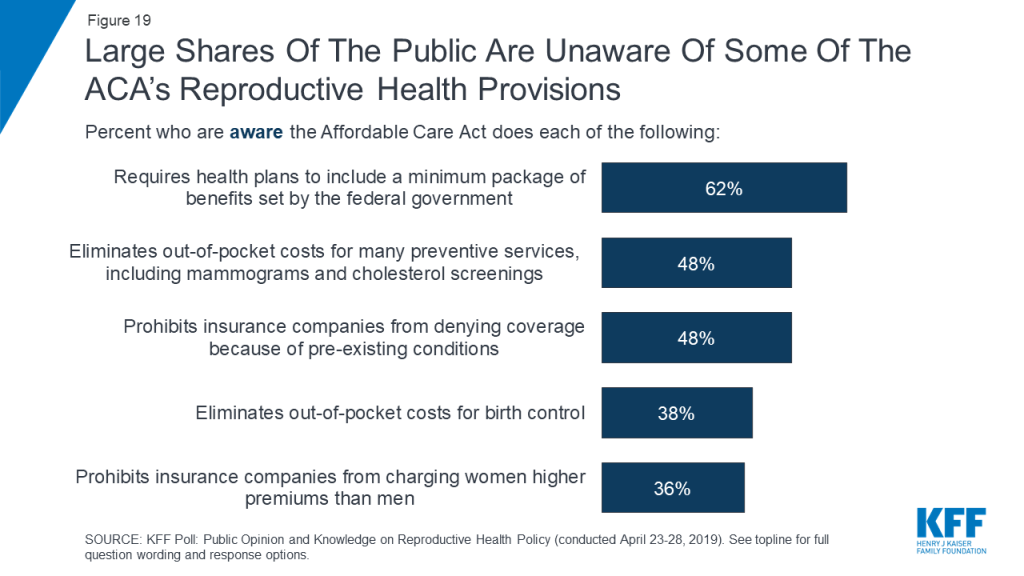
Overall, a larger share of women than men are aware of most of these provisions. For example, 45 percent of women overall are aware the ACA eliminated out-of-pockets for birth control (including 54 percent of women 18-44 years old) compared to three in ten men.
| Table 2: Women Are More Knowledgeable Than Men About ACA Provisions Affecting Reproductive Health Care | |||
| Percent who are aware the ACA does each of the following: | Men | Women | Women, 18-44 |
| Requires health plans to include a minimum package of benefits set by the federal government | 59% | 66% | 65% |
| Prohibits insurance companies from denying coverage because of pre-existing conditions | 43 | 53 | 48 |
| Eliminates out-of-pocket costs for many preventive services, including mammograms and cholesterol screenings | 40 | 55 | 62 |
| Prohibits insurance companies from charging women higher premiums than men | 31 | 41 | 36 |
| Eliminates out-of-pocket costs for birth control | 30 | 45 | 54 |
At the same time, misconceptions about the law remain. About one-third (33 percent) of the public incorrectly believe the ACA requires health insurance plans to cover abortions including 36 percent of men and about three in ten women overall and between the ages of 18 and 44 (29 percent). The misconception is more common among Republicans (41 percent). The ACA actually allows states to ban the sale of plans that offer abortion coverage through their ACA marketplaces and has special rules to separate the costs of abortion coverage for plans in states that still permit abortion coverage.
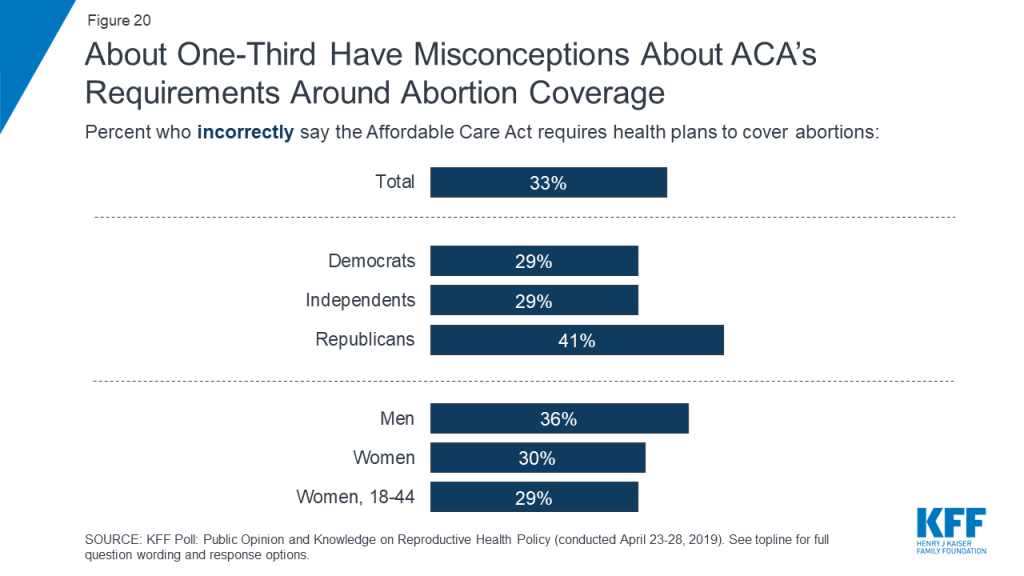
This KFF Poll: Public Opinion and Knowledge on Reproductive Health Policy was designed and analyzed by public opinion researchers at the Kaiser Family Foundation (KFF). The survey was conducted April 23rd -28th 2019, among a nationally representative random digit dial telephone sample of 1,200 adults ages 18 and older, living in the United States, including Alaska and Hawaii (note: persons without a telephone could not be included in the random selection process). The sample included 253 respondents reached by calling back respondents that had previously completed an interview on the KFF Tracking poll more than nine months ago. Computer-assisted telephone interviews conducted by landline (305) and cell phone (895, including 643 who had no landline telephone) were carried out in English and Spanish by SSRS of Glen Mills, PA. To efficiently obtain a sample of lower-income and non-White respondents, the sample also included an oversample of prepaid (pay-as-you-go) telephone numbers (25% of the cell phone sample consisted of prepaid numbers) as well as a subsample of respondents who had previously completed Spanish language interviews on the SSRS Omnibus poll (n=10). Both the random digit dial landline and cell phone samples were provided by Marketing Systems Group (MSG). For the landline sample, respondents were selected by asking for the youngest adult male or female currently at home based on a random rotation. If no one of that gender was available, interviewers asked to speak with the youngest adult of the opposite gender. For the cell phone sample, interviews were conducted with the adult who answered the phone. KFF paid for all costs associated with the survey.
The combined landline and cell phone sample was weighted to balance the sample demographics to match estimates for the national population using data from the Census Bureau’s 2017 American Community Survey (ACS) on sex, age, education, race, Hispanic origin, and region along with data from the 2010 Census on population density. The sample was also weighted to match current patterns of telephone use using data from the January-June 2018 National Health Interview Survey. The weight takes into account the fact that respondents with both a landline and cell phone have a higher probability of selection in the combined sample and also adjusts for the household size for the landline sample, and design modifications, namely, the oversampling of prepaid cell phones and likelihood of non-response for the re-contacted sample. All statistical tests of significance account for the effect of weighting.
The margin of sampling error including the design effect for the full sample is plus or minus 3 percentage points. Numbers of respondents and margins of sampling error for key subgroups are shown in the table below. For results based on other subgroups, the margin of sampling error may be higher. Sample sizes and margins of sampling error for other subgroups are available by request. Note that sampling error is only one of many potential sources of error in this or any other public opinion poll. Kaiser Family Foundation public opinion and survey research is a charter member of the Transparency Initiative of the American Association for Public Opinion Research.
| Group | N (unweighted) | M.O.S.E. |
| Total | 1,200 | ±3 percentage points |
| Women | 526 | ±5 percentage points |
| Women, 18-44 | 141 | ±9 percentage points |
| Men | 671 | ±4 percentage points |
| Party Identification | ||
| Democrats | 365 | ±6 percentage points |
| Republicans | 345 | ±6 percentage points |
| Independents | 357 | ±6 percentage points |
| Half-sample A | 634 | ±5 percentage points |
| Half-sample B | 566 | ±5 percentage points |
| Survey subgroup C | 632 | ±5 percentage points |
| Survey subgroup D | 595 | ±5 percentage points |
A new KFF/Los Angeles Times survey of Americans with employer health benefits finds that although most are largely satisfied with their employer plan, many report financial challenges related to their health care costs, particularly among those facing high deductibles or suffering from chronic health conditions.
The survey captures the experiences of the roughly 156 million Americans who get their health coverage through their employers, rather than through the individual market or government programs such as Medicare and Medicaid.
Overall 40% of those with employer coverage report problems paying medical bills or difficulty affording their premiums, deductibles, cost sharing or an unexpected bill in the past year. Half (51%) say they or someone in their family have skipped or postponed needed care or medication or relied on home remedies instead of seeking care because of the cost.
These problems occur more frequently as a plan’s annual deductible rises, with the greatest challenges occurring among the one in five (21%) Americans with employer coverage who face the highest deductibles – at least $3,000 for an individual or at least $5,000 for a family.
Similar challenges face the roughly half (54%) of people with employer coverage who say someone in their family is being treated for a chronic condition such as diabetes, heart disease, cancer, high blood pressure, asthma or a serious mental illness. For example:
The survey also probes the experiences of people with plans tied to tax-preferred Health Savings Accounts (HSAs), how people with employer coverage make health insurance decisions, and their perceptions about the health care system. The Los Angeles Times is featuring findings in a series of articles on high deductible plans. A KFF report provides the full detailed findings.
Overall most people are happy with their employer coverage, with nearly seven in 10 (68%) giving their plan an “A” or “B” grade. Similar shares say they are grateful (72%) and content (69%) with their plan, while far fewer say they feel frustrated (26%), confused (23%) or angry (14%). Views are more negative among those with the highest deductibles.
The survey finds a big shift since 2003 in the importance of low costs for people with employer coverage. When asked about the most important feature in a health plan, six in 10 (59%) cite cost-related features such as low premiums, deductibles or cost sharing, while a quarter (26%) cite coverage concerns such as a wide range of benefits or a wide choice of doctors or hospitals. Those priorities are roughly the mirror image of the results of 2003 KFF survey, in which 60% cited coverage issues and 33% citing cost-related features.
Other findings include:
The survey was conducted from Sept. 25 through Oct. 9, 2018 among a probability-based sample of 1,407 adults ages 18-64 who reported having health insurance from their own or a spouse’s employer or union. Interviews were administered online and by telephone in English and Spanish using NORC’s AmeriSpeak panel. The margin of sampling error is plus or minus 3 percentage points for the full sample. Teams from the Kaiser Family Foundation and The Los Angeles Times worked together to develop the questionnaire and analyze the data. Each organization is solely responsible for its content.