Management and Delivery of the Medicaid Pharmacy Benefit

Authors: Rachel Dolan and Marina Tian
Published: Dec 6, 2019

Issue Brief

Managing the Medicaid prescription drug benefit and pharmacy expenditures is a perennial policy priority for state Medicaid programs. Though Medicaid prescription drug spending growth has slowed in recent years, similar to the overall US trend, state policymakers remain concerned about Medicaid prescription drug spending growth. Since the structure of the Medicaid Drug Rebate Program means that state Medicaid programs essentially must cover all drugs, states cannot limit the scope of drugs covered in an effort to control drug costs. Instead, states have typically used an array of utilization controls to manage utilization of prescription drugs. The administration of the pharmacy benefit has evolved over time to include delivery through managed care and more reliance on pharmacy benefit managers (PBMs). However, as costs continue to grow, the use of managed care and PBMs has expanded, and new “blockbuster” drugs come to market, states face new challenges in managing pharmacy benefits. This brief explores key questions about state management and delivery of Medicaid pharmacy benefits, including:

  • What tools have states traditionally used to manage drug utilization in Medicaid?
  • How has the administration of the pharmacy benefit evolved over time?
  • What are current policy debates and proposals about Medicaid pharmacy management?

What tools have states traditionally used to manage drug utilization in Medicaid?

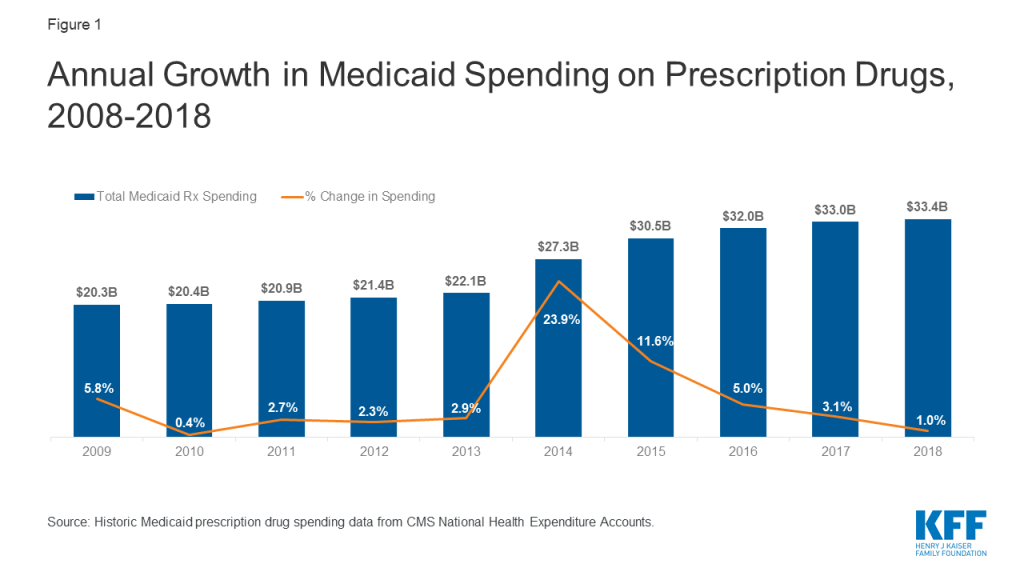
Most states use an array of measures to control utilization of prescription drugs in Medicaid.  Under federal rules regarding the federal rebate agreement and medical necessity requirements, states have flexibility in administering their Medicaid prescription drug programs. As pharmacy expenditure growth became a greater Medicaid budget concern in the late 1990’s and early 2000’s, most states implemented pharmacy cost containment strategies, including preferred drug lists (PDLs), supplemental rebate programs, state maximum allowable cost programs, multi-state purchasing pools, and prior authorization policies linked to clinical criteria. Prescription drug costs continue to be an area of concern for states, though growth has slowed from a peak in 2014 (Figure 1). States continue to routinely update and refine their drug utilization controls to respond to changes, especially new product offerings, in the pharmaceutical marketplace. In addition, states may implement prescription limits or impose beneficiary cost-sharing for certain groups to control prescription drug utilization.1 ,2 

Figure 1: Annual Growth in Medicaid Spending on Prescription Drugs, 2008-2018

Preferred Drug Lists

Most state Medicaid programs maintain a preferred drug list (PDL) of outpatient prescription drugs, which is a list of outpatient drugs states encourage providers to prescribe over others. At least 45 states use PDLs in their fee-for-service (FFS) drug programs.3 ,4  A state may require prior authorization for a drug not on a preferred drug list or attach a higher co-pay, creating incentives for a provider to prescribe a drug on the PDL when possible. Since states are required to make available nearly all prescribed drugs from manufacturers with a national rebate agreement in both managed care and fee-for-service settings, PDLs allow states to manage utilization. In addition, PDLs often include drugs which are lower-cost or for which a manufacturer has provided supplemental rebates, as PDL placement is a primary lever that states use to negotiate supplemental rebate agreements.

Prior Authorization

One of the primary tools state have long used to manage the utilization of drugs is prior authorization. Prior authorization requires prescribers to obtain approval from the state Medicaid agency (or its contractor) before a particular drug can be dispensed.5  Goals of prior authorization include encouraging patient adherence, ensuring appropriate utilization, and discouraging waste.6  Prior authorization processes for covered outpatient drugs must meet two federal requirements: 1) they must respond to requests for authorization within 24 hours; and, 2) they must make available a 72-hour supply of medications in an emergency situation. Medicaid managed care plans’ prior authorization procedures must meet the same criteria.7  All states use prior authorization in FFS drug programs and at least 30 states apply the same prescription criteria to FFS and managed care for one or more drugs.8 ,9 

States may require prior authorization for any drug covered by Medicaid but often do so for high-cost specialty drugs or non-preferred drugs. Prescriptions for non-preferred drugs (i.e., those not on the PDL) often require prior authorization. States may also require prior authorization for newly approved therapies while they examine the drug’s effectiveness and safety.

Drug Utilization Review (DUR)

States are required by federal law to have a drug utilization review (DUR) program in place to help ensure appropriate drug use.10  Drug utilization review programs must establish standards to ensure prescriptions are appropriate, medically necessary, and unlikely to lead to adverse medical results. DUR programs must also include evaluation for problems like duplicate prescriptions, incorrect dosage, and clinical misuse.11 

DUR is a two-step process conducted by state Medicaid agencies, consisting of both prospective and retrospective drug utilization review. In prospective DUR, state Medicaid agencies employ electronic monitoring systems to screen prescription drug claims for concerns like duplicate prescriptions, incorrect dosage or duration of treatment, contraindications, and clinical misuse or abuse. Retrospective DUR is ongoing and involves periodic examination of claims data to identify patterns of fraud, abuse, underutilization, and medically unnecessary care.12  States are required to establish a DUR board to create the standards for appropriate drug use and to conduct retrospective drug utilization review. The board membership must consist of at least two-thirds physicians and pharmacists.13 

Federal law requires states to make an annual DUR report on their Medicaid prescribing patterns, cost-savings associated with DUR, board activities and program operations. According to CMS, states saved an average of $57 million in 2017 through prospective DUR, and $1.46 million through retrospective review.14  However, due to heterogeneity in the methodologies used by states to calculate savings, comparisons of program cost-savings between states are unreliable.15 

Pharmacy & Therapeutics (P&T) Committees

To establish a PDL, federal law requires a state Medicaid agency to establish a committee of physicians and pharmacists to inform the development of the PDL, review drugs, and develop coverage decisions. 16  In many, but not all, states, these activities are performed by a pharmacy and therapeutics (P&T) committee. In general, P&T committees are responsible for reviewing information on drug effectiveness and issuing evidence-based recommendations on coverage criteria, such as placement of drugs on the PDL and utilization controls. In addition to effectiveness and safety, the committee may also factor in price considerations to their decisions. P&T committees also may utilize contractors to assist in reviewing evidence, usually the state’s PBM or an academic institution in the state. States also have the option under federal law to use their drug utilization review board to fill this role.17 

Since there are few federal requirements for P&T committees, the composition, structure, and operations of P&T committees may vary from state to state. Federal requirements for committee composition specify pharmacists, physicians and other “appropriate” individuals, but otherwise leave states with flexibility for determining committee operations.18  Meeting frequency and procedures can vary between P&T committees. Under federal Medicaid rebate rules, states are required to cover all drugs from a manufacturer that has a rebate agreement in place once they are approved by the FDA and enter the market. This requirement means states must quickly decide how to categorize the drug and if it will be on the PDL.19  States often require prior authorization of a new drug before it is reviewed by the P&T committee and clinical guidelines are developed. The length for the evaluation of a drug and development of coverage criteria is typically one to three months but can be as long as one year.20  It often takes longer for committees to review breakthrough or first-in-class drugs and therapies than for a new formulation of a drug or a new drug in an existing class.

Cost-sharing and Prescription Limits

States have the authority to implement cost-sharing to control utilization and costs of prescription drugs. For example, states may implement different co-payments for drugs on a preferred drug list or generic drugs, compared to non-preferred or brand drugs. Most states now utilize some measure of cost-sharing in their Medicaid pharmacy benefit. In fiscal year (FY) 2018, 35 states and DC reported having co-payments for prescription drugs in place for Medicaid non-exempt beneficiaries.21  Co-payments are statutorily capped at $4 for preferred drugs. For non-preferred drugs, states may require co-pays up to $8 for most beneficiaries with income at or below 150% of the federal poverty level (FPL).22 

In addition to implementing cost-sharing, states may limit the number of prescriptions a beneficiary may access without prior authorization. These restrictions may include a limit on the total number of prescriptions per month or a limit on the number of brand drugs. Medicaid programs allow prescribers and pharmacists to submit prior authorization requests to override these limits when medically necessary or under other specific circumstances, subject to federal requirements for prior authorization processes. In addition, states are authorized under federal law to set minimum or maximum numbers of pills or doses per prescription as well as the number of refills.23   In order to implement prescription coverage restrictions that are not expressly permitted by federal statute,24  states need waiver authority from CMS. For example, Tennessee implemented a prescription coverage limit of five prescriptions per month for adult beneficiaries not in long-term care in its TennCare demonstration.25  However, the state exempts many medications from the prescription limit and allows prescribers to submit exception requests for beneficiaries.26 

How has the administration of the pharmacy benefit evolved over time?

States continue to use pharmacy utilization management strategies in Medicaid, but because most states have adopted most of these strategies, activity is generally around refining them. However, such actions have slowed in recent years as states reach the limits of utilization controls allowed under federal law. The rise in prevalence of managed care in Medicaid and in pharmacy benefits has also led to changes in how states manage their benefits.

Capitated managed care is now the dominant way in which states deliver services, including prescription drugs, to Medicaid beneficiaries. States pay managed care organizations (MCOs) a monthly fee (capitation rate) to cover the cost of services provided to beneficiaries and any administrative expenses. Thirty-three of the 40 states with comprehensive risk-based managed care enroll at least 75% of their Medicaid beneficiaries in MCOs.27  As more states have enrolled additional Medicaid populations into managed care arrangements over time and included pharmacy benefits in managed care contracts, MCOs have played an increasingly significant role in administering the Medicaid pharmacy benefit. Although MCOs provide comprehensive services to beneficiaries, states may carve specific benefits, including the pharmacy benefit, out of MCO contracts to FFS systems.

The Affordable Care Act (ACA) extended federal statutory rebates to prescription drugs provided under Medicaid managed care arrangements, and most states now “carve in” prescription drugs. Prior to the ACA, manufacturers only had to pay rebates for outpatient drugs purchased on a fee-for-service basis, not those purchased through managed care. This practice encouraged states to “carve out” prescription drugs to obtain rebates. In FY 2011, 21 states reported having full or partial carve-outs of prescription drugs.28  Extending rebates to drugs purchased through managed care has resulted in more states carving drug coverage back into managed care. Of the 40 states contracting with comprehensive risk-based MCOs in 2018, 35 states reported that the pharmacy benefit was carved in, with some states reporting exceptions such as high-cost or specialty drugs.29 

States are increasingly implementing uniform requirements30  across their pharmacy programs, including uniform PDLs and uniform clinical protocols, which are state-prescribed requirements for drug utilization that apply across FFS and MCOs.31  These uniform requirements can give the state more leverage in negotiations with manufacturers for supplemental rebates. Uniform requirements can also ensure that MCOs follow state rules and comply with how states want the program administered even when prescription drugs are carved in. Nearly all states use prior authorization and PDLs in FFS programs. In 2018, 14 states reported having in place a uniform PDL for at least one drug class, with three states indicating plans to implement a uniform PDL in FY 201932  and four states indicating plans to implement in FY 2020.33  Uniform clinical protocols are more common, with 30 states reporting them in place in FY 2018.34 

In conjunction, states are also increasingly utilizing PBMs in their Medicaid prescription drug programs to help administer the pharmacy benefit. While the relationship between state Medicaid programs and PBMs is not new, the extent to which states rely on PBMs has grown significantly in the past ten years. While states once primarily contracted with PBMs for administrative support, like claims processing, states are now also using PBMs to negotiate supplemental rebates and conduct clinical drug class reviews that inform PDL decision-making, largely due to resource limitations.35 

PBMs perform a variety of financial and clinical services for Medicaid programs, including adjudicating claims, administering rebates, monitoring utilization, supporting DUR processes, and overseeing and formulating preferred drug lists.36  States may utilize PBMs in both managed care and fee-for-service settings but payment rules differ for prescription drugs purchased through FFS and MCOs. Those purchased through MCOs have fewer restrictions and regulations on the prices paid to pharmacies. Federal rules state that MCOs must set payment rates sufficient to guarantee beneficiary access, but are not bound by rules regarding ingredient costs like drugs purchased through FFS.37  PBMs acting on behalf of managed care companies negotiate individual prices with pharmacies and can set PDLs and proprietary maximum allowable costs (MACs).38 

What are key policy issues in management of the Medicaid pharmacy benefit?

PBM Regulation, Transparency, and Spread Pricing

The financial responsibilities PBMs take on, including negotiating prescription drug rebates with manufacturers and dispensing fees with pharmacies, have generated considerable policy debate about price transparency and spread pricing. Spread pricing refers to the difference between the payment the PBM receives from the MCO and the reimbursement amount it pays to the pharmacy.39  Lack of transparency and regulations have allowed PBMs to keep this “spread” as profit.

States are beginning to question whether use of PBMs produces savings or generates additional costs. While states turned to these arrangements to limit their financial exposure, recent evidence indicates that they may increase costs overall. In 2018, a report by Ohio’s state auditor found that PBMs cost the state program nearly $225 million through spread pricing in managed care.40  Similar analysis by the Massachusetts Health Policy Commission found that PBMs charged MassHealth MCOs more than the acquisition price for generic drugs in 95% of the analyzed pharmaceuticals in the last quarter of 2018.41  Michigan found that PBMs had collected spread of more than 30% on generic drugs and a report found that the state had been overcharged $64 million.42  Other states have released similar reports finding high amounts of spread on generic prescriptions.43  Concerns about Medicaid spread pricing led CMS to issue guidance in May 2019 on how managed care plans should report spread pricing in order to more accurately calculate plans’ medical loss ratios (MLRs).44 

Some states are reassessing their use of PBMs and turning to a variety of policies to limit spread pricing, like licensure requirements, reporting requirements, and increased oversight. For example, after the 2018 report, Ohio prohibited its managed care plans from contracting with PBMs that use spread pricing.45  Since then, the state has announced it will move to contract with a single PBM for its entire managed care program starting July 2020, with enhanced transparency reporting requirements.46  Michigan is planning to no longer use PBMs and to use FFS to pay for its prescription drugs.47  Other states like Nevada have implemented policies establishing PBMs as fiduciaries with a duty to act in the best interest of pharmacies and beneficiaries.48  A similar proposal that passed both chambers of government in New York requires PBMs to act primarily in the interest of covered individuals and health plans, in addition to transparency reporting requirements.49  Federal legislative proposals would prohibit spread pricing by PBMs in Medicaid managed care.50 

P&T and DUR Variation and Conflict of Interest

Variation in P&T committees and DUR procedures across the states has led to recent policy proposals for federal standards in these procedures.51  Advocates of federal standards argue that establishing a period for public comment on decisions, setting a minimum meeting frequency, and other such measures relating to P&T committee operations can ensure transparency for all Medicaid beneficiaries and aid comparison between states. Similarly, proposals have also suggested standardizing the methodology for calculating cost-savings in the DUR program.52  Some have raised concerns about discrepancies between DUR requirements for Medicaid managed care plans and fee-for-service. Though managed care plans that perform their own prospective and retrospective DUR activities must meet the same federal requirements as fee-for-service programs, only four states required plans to use the same criteria as fee-for-service in 2017.53 

Conflict-of-interest policies for members of the P&T board are also not standardized by statute, leading to recent state and federal proposals requiring conflict-of-interest policies for P&T committees and DUR boards.54  Recent investigations into the influence of pharmaceutical companies on the Medicaid drug review process have called more attention to the limits of conflict-of-interest policies for P&T committees.55  After a 2018 investigation by NPR and the Center for Public Integrity revealed that some P&T committee members were receiving inappropriate financial remuneration from drug manufacturers, ostensibly in exchange for coverage decisions,56  some states introduced bills to address industry influence and financial disclosures in state P&T committees.57 ,58  Legislation recently introduced in the Senate would also place conflict-of-interest requirements on P&T committees & DUR Boards.59 

Access to New, Breakthrough Drugs

The cost burden of high-cost and specialty drugs makes new and first-in-class drugs a pressing policy area for Medicaid agencies. Since Medicaid must cover nearly all drugs, the introduction of new drugs can be particularly challenging for programs in the initial phases of coverage. This challenge was particularly acute with the introduction of costly direct acting antivirals (DAAs) to treat hepatitis C in 2013. In order to manage their Medicaid budgets, states created narrow coverage criteria and implemented prior authorization restrictions.60  In addition to restrictions based on clinical need, some states also required that a patient meet with a specialist, as well as drug counseling, drug testing, and periods of abstinence from drugs and alcohol. However, these restrictions were inconsistent with treatment recommendations and with federal law,61  and federal class action suits led states to loosen restrictions on DAAs. 62  In addition, although states have placed particular focus on DAAs, they remain vigilant about other high cost drugs as well, such as hemophilia, oncology, and diabetes classes of drugs.

States are taking a variety of approaches to balancing beneficiary access to pharmacy benefits and spending for “blockbuster” drugs. Notably, Louisiana’s recently implemented modified subscription model, or “Netflix” model, allows the state to increase beneficiary access to hepatitis C drugs while capping gross spending.63  The five-year supplemental rebate agreement between the state and manufacturer sets a capped expenditure amount, beyond which the state will continue to receive drugs at no additional cost.64  Idaho actively manages specialty drugs following the introductory phase by conducting manual prior authorization of all claims for the first six months a new drug is available.65  Other states limit the ability of Medicaid agencies to place utilization controls on certain classes of drugs, like hepatitis C drugs, hemophilia factor, and HIV antiretrovirals. Federal proposals include having CMS work more closely with states to proactively monitor state compliance with drug coverage requirements for new specialty drugs66  or creating a drug coverage grace period after the introduction of new drugs that would provide states with more time to review scientific literature and establish appropriate coverage criteria.67 

Closed Formularies

There is some limited federal and state interest in moving Medicaid benefits management beyond PDLs and PA to having a closed formulary, but such efforts face legal and administrative challenges. The structure of the federal Medicaid Drug Rebate Program essentially creates an open formulary in Medicaid. This approach stands in contrast to a closed formulary, under which only specific drugs in each therapeutic class are covered. A small number of states have sought waiver authority for a closed formulary in Medicaid. In 2017, Massachusetts submitted an application to CMS that included a provision to amend its Section 1115 Medicaid demonstration waiver to create a closed formulary.68  Their proposal was rejected by CMS because the state proposed to continue collecting rebates through the MDRP while excluding drugs from coverage.69  In November 2019, Tennessee submitted to CMS a Section 1115 waiver request that includes a proposal similar to that of Massachusetts. The waiver proposes a “commercial-style closed formulary” but does not specify whether the state is proposing to opt out of the statutory rebate program. The proposal is pending a decision from CMS at the time of this writing.70  The Trump administration has also expressed interest in closed formularies in Medicaid through a proposed new Medicaid demonstration authority to enable up to five state Medicaid programs to create their own formularies and negotiate directly with manufacturers instead of participating in the Medicaid Drug Rebate Program. Currently no states are participating in the demonstration.

Summary

Budget and fiscal challenges are a top priority of Medicaid programs, including managing and responding to high cost prescription drugs and managing pharmacy expenditures. States are limited in their leverage when it comes to controlling drug spending and use a variety of strategies to manage utilization. States continue to update their management tools over time, including an increased reliance on managed care and PBMs. As policymakers debate proposals that include provisions related to Medicaid pharmacy benefits, it is important to understand the challenges state Medicaid programs face and how policy proposals may impact Medicaid beneficiaries and costs.

This work was supported in part by Arnold Ventures. We value our funders. KFF maintains full editorial control over all of its policy analysis, polling, and journalism activities.

Endnotes

  1. For individuals with incomes above 150% of the FPL, rules allow states to establish higher cost-sharing, including coinsurance of up to 20% of the cost of the drug, for non-preferred drugs. See 78 Federal Register 42159-42322 (July 15, 2013), and Laura Snyder and Robin Rudowitz, Premiums and Cost-sharing in Medicaid (Kaiser Family Foundation, February 2013), https://modern.kff.org/medicaid/issue-brief/premiums-and-cost-sharing-in-medicaid-a-review-of-research-findings/. ↩︎
  2. State Health Facts, “Medicaid Benefits: Prescription Drugs, 2018,” KFF, https://modern.kff.org/medicaid/state-indicator/prescription-drugs. ↩︎
  3. Kathleen Gifford, Eileen Ellis, Barbara Coulter Edwards, Aimee Lashbrook, Elizabeth Hinton, Larisa Antonisse, and Robin Rudowitz, States Focus on Quality and Outcomes Amid Waiver Changes: Results from a 50-State Medicaid Budget Survey for State Fiscal Years 2018 and 2019 (KFF, October 2018), https://modern.kff.org/medicaid/report/states-focus-on-quality-and-outcomes-amid-waiver-changes-results-from-a-50-state-medicaid-budget-survey-for-state-fiscal-years-2018-and-2019/. ↩︎
  4. As of 2015, 45 states reported using a PDL, and none have reported removing it in subsequent years. See Vernon Smith, Kathleen Gifford, Eileen Ellis, Robin Rudowitz, Laura Snyder, and Elizabeth Hinton, Medicaid Reforms to Expand Coverage, Control Costs and Improve Care: Results from a 50-State Medicaid Budget Survey for State Fiscal Years 2015 and 2016 (KFF, October 2015), http://files.kff.org/attachment/report-medicaid-reforms-to-expand-coverage-control-costs-and-improve-care-results-from-a-50-state-medicaid-budget-survey-for-state-fiscal-years-2015-and-2016. ↩︎
  5. Jane Tilly and Linda Elam, Prior Authorization for Medicaid Prescription Drugs in Five States: Lessons for Policy Makers (KFF, April 2003), http://files.kff.org/attachment/report-prior-authorization-for-medicaid-prescription-drugs-in. ↩︎
  6. N. Pinson, A. Thielke, V. King, J. Beyer, and R. Driver, Medicaid and Specialty Drugs: Current Policy Options (Center for Evidence-based Policy, Oregon Health & Science University), http://centerforevidencebasedpolicy.org/wp-content/uploads/2018/12/MED_Medicaid_and_Specialty_Drugs_Current_Policy_Options_Final_Sept-9-2016.pdf ↩︎
  7. 42 U.S.C. § 1396r-8 (d) (5) ↩︎
  8. Gifford, Ellis, Edwards, Lashbrook, Hinton, Antonisse, and Rudowitz, States Focus on Quality and Outcomes Amid Waiver Changes: Results from a 50-State Medicaid Budget Survey for State Fiscal Years 2018 and 2019 (KFF, October 2018), https://modern.kff.org/medicaid/report/states-focus-on-quality-and-outcomes-amid-waiver-changes-results-from-a-50-state-medicaid-budget-survey-for-state-fiscal-years-2018-and-2019/. ↩︎
  9. Kathleen Gifford, Eileen Ellis, Aimee Lashbrook, Mike Nardone, Elizabeth Hinton, Robin Rudowitz, Maria Diaz, and Marina Tian, A View from the States: Key Medicaid Policy Changes: Results from a 50-State Medicaid Budget Survey for State Fiscal Years 2019 and 2020 (KFF, October 2019), https://modern.kff.org/medicaid/report/a-view-from-the-states-key-medicaid-policy-changes-results-from-a-50-state-medicaid-budget-survey-for-state-fiscal-years-2019-and-2020/. ↩︎
  10. 42 U.S.C. §1396r-8 (g) ↩︎
  11. 42 U.S.C. §1396r-8 (g) ↩︎
  12. Centers for Medicare and Medicaid Services, “Drug Utilization Review,” https://www.medicaid.gov/medicaid/prescription-drugs/drug-utilization-review/index.html. ↩︎
  13. 42 U.S.C. §1396r-8 (g) (3) ↩︎
  14. CMS, “Drug Utilization Review,” https://www.medicaid.gov/medicaid/prescription-drugs/drug-utilization-review/index.html. ↩︎
  15. Sergio Prada and Johan Loaiza, “Comparing the Medicaid Prospective Drug Utilization Review Program Cost-Savings Methods Used by State Agencies in 2015 and 2016,” American Health & Drug Benefits 12, no. 1 (February 2019): 7-12, https://www.ncbi.nlm.nih.gov/pmc/articles/PMC6404806/. ↩︎
  16. 42 U.S.C. §1396r-8 (d) (4) ↩︎
  17. 42 U.S.C. §1396r-8 (d) (4) (A) ↩︎
  18. 42 U.S.C. §1396r-8 (d) (4) ↩︎
  19. Medicaid and CHIP Payment and Access Commission, Next Steps in Improving Medicaid Prescription Drug Policy (MACPAC, June 2019), https://www.macpac.gov/wp-content/uploads/2019/06/Next-Steps-in-Improving-Medicaid-Prescription-Drug-Policy.pdf. ↩︎
  20. MACPAC, Next Steps in Improving Medicaid Prescription Drug Policy (MACPAC, June 2019), https://www.macpac.gov/wp-content/uploads/2019/06/Next-Steps-in-Improving-Medicaid-Prescription-Drug-Policy.pdf. ↩︎
  21. State Health Facts, “Medicaid Benefits: Prescription Drugs, 2018,” KFF, https://modern.kff.org/medicaid/state-indicator/prescription-drugs. ↩︎
  22. States may also charge up to 20% of the amount Medicaid pays for people with income above 150% FPL. See MACPAC, “Cost sharing and premiums,” https://www.macpac.gov/subtopic/cost-sharing-and-premiums/. ↩︎
  23. 42 U.S.C. §1396r-8 (d) (6) ↩︎
  24. 42 U.S.C. §1396r-8 (d) (1) ↩︎
  25. CMS, TennCare II Section 1115 Demonstration Fact Sheet (CMS, February 2016), https://www.medicaid.gov/Medicaid-CHIP-Program-Information/By-Topics/Waivers/1115/downloads/tn/tn-tenncare-ii-fs.pdf. ↩︎
  26. Division of TennCare, “Pharmacy,” https://www.tn.gov/tenncare/members-applicants/pharmacy.html. ↩︎
  27. Gifford, Ellis, Lashbrook, Nardone, Hinton, Rudowitz, Diaz, and Tian, A View from the States: Key Medicaid Policy Changes: Results from a 50-State Medicaid Budget Survey for State Fiscal Years 2019 and 2020 (KFF, October 2019), https://modern.kff.org/medicaid/report/a-view-from-the-states-key-medicaid-policy-changes-results-from-a-50-state-medicaid-budget-survey-for-state-fiscal-years-2019-and-2020/. ↩︎
  28. Vernon Smith, Kathleen Gifford, Eileen Ellis, Robin Rudowitz, and Laura Snyder, Moving Ahead Amid Fiscal Challenges: A Look at Medicaid Spending, Coverage and Policy Trends: Results from a 50-State Medicaid Budget Survey for State Fiscal Years 2011 and 2012 (KFF, October 2011), https://modern.kff.org/wp-content/uploads/2013/01/8248.pdf. ↩︎
  29. Gifford, Ellis, Edwards, Lashbrook, Hinton, Antonisse, and Rudowitz, States Focus on Quality and Outcomes Amid Waiver Changes: Results from a 50-State Medicaid Budget Survey for State Fiscal Years 2018 and 2019 (KFF, October 2018), https://modern.kff.org/medicaid/report/states-focus-on-quality-and-outcomes-amid-waiver-changes-results-from-a-50-state-medicaid-budget-survey-for-state-fiscal-years-2018-and-2019/. ↩︎
  30. Gifford, Ellis, Edwards, Lashbrook, Hinton, Antonisse, and Rudowitz, States Focus on Quality and Outcomes Amid Waiver Changes: Results from a 50-State Medicaid Budget Survey for State Fiscal Years 2018 and 2019 (KFF, October 2018), https://modern.kff.org/medicaid/report/states-focus-on-quality-and-outcomes-amid-waiver-changes-results-from-a-50-state-medicaid-budget-survey-for-state-fiscal-years-2018-and-2019/. ↩︎
  31. Uniform PDL requirements are state-prescribed requirements for designating a specific drug product as preferred or non-preferred. Uniform clinical protocols are state-prescribed medical necessity criteria for a specific drug product. ↩︎
  32. Gifford, Ellis, Edwards, Lashbrook, Hinton, Antonisse, and Rudowitz, States Focus on Quality and Outcomes Amid Waiver Changes: Results from a 50-State Medicaid Budget Survey for State Fiscal Years 2018 and 2019 (KFF, October 2018), https://modern.kff.org/medicaid/report/states-focus-on-quality-and-outcomes-amid-waiver-changes-results-from-a-50-state-medicaid-budget-survey-for-state-fiscal-years-2018-and-2019/. ↩︎
  33. Gifford, Ellis, Lashbrook, Nardone, Hinton, Rudowitz, Diaz, and Tian, A View from the States: Key Medicaid Policy Changes: Results from a 50-State Medicaid Budget Survey for State Fiscal Years 2019 and 2020 (KFF, October 2019), https://modern.kff.org/medicaid/report/a-view-from-the-states-key-medicaid-policy-changes-results-from-a-50-state-medicaid-budget-survey-for-state-fiscal-years-2019-and-2020/. ↩︎
  34. Gifford, Ellis, Edwards, Lashbrook, Hinton, Antonisse, and Rudowitz, States Focus on Quality and Outcomes Amid Waiver Changes: Results from a 50-State Medicaid Budget Survey for State Fiscal Years 2018 and 2019 (KFF, October 2018), https://modern.kff.org/medicaid/report/states-focus-on-quality-and-outcomes-amid-waiver-changes-results-from-a-50-state-medicaid-budget-survey-for-state-fiscal-years-2018-and-2019/. ↩︎
  35. Jenny Gaffney, Marielle Kress, Caroline Pearson, Tanisha Carino, John Connolly, and Robin Rudowitz, The Role of Clinical and Cost Information in Medicaid Pharmacy Benefit Decisions: Experience in Seven States (KFF, September 2011), https://modern.kff.org/wp-content/uploads/2013/01/8233.pdf. ↩︎
  36. States that use PBMs in administering the prescription drug benefit in a fee-for-service setting pay the PBM administrative fees for these services. See Magellan Health, Medicaid Pharmacy Trend Report, Second Edition (Magellan Rx Management, 2017), https://www1.magellanrx.com/media/671872/2017-mrx-medicaid-pharmacy-trend-report.pdf. See also https://nashp.org/wp-content/uploads/2016/04/Drug-Brief1.pdf. ↩︎
  37. 81 Federal Register 5169-5357, (February 1, 2016). ↩︎
  38. MACPAC, Medicaid Payment for Outpatient Prescription Drugs (MACPAC, May 2018), https://www.macpac.gov/wp-content/uploads/2015/09/Medicaid-Payment-for-Outpatient-Prescription-Drugs.pdf. ↩︎
  39. Sarah Lanford and Maureen Hensley-Quinn, New PBM Laws Reflect States’ Targeted Approaches to Curb Prescription Drug Costs (National Academy for State Health Policy, August 2019), https://nashp.org/new-pbm-laws-reflect-states-targeted-approaches-to-curb-prescription-drug-costs/. ↩︎
  40. Ohio Auditor of State, Ohio’s Medicaid Managed Care Pharmacy Services (Ohio Auditor of State, August 2018), https://audits.ohioauditor.gov/Reports/AuditReports/2018/Medicaid_Pharmacy_Services_2018_Franklin.pdf. ↩︎
  41. Massachusetts Health Policy Commission, “Cracking Open the Black Box of Pharmacy Benefit Managers: PBM Pricing for Generic Drugs in Massachusetts Medicaid Programs and the Commercial Market,” HPC Datapoints 12 (June 2019): 1-8, https://www.mass.gov/doc/datapoints-issue-12-printable-version/download. ↩︎
  42. Michigan similarly found that PBMs had collected spread of more than 30% on generic drugs and a report found that the state had been overcharged $64 million. The state has since decided to no longer use PBMs and to use FFS to pay for its prescription drugs. See 3 Axis Advisors, Analysis of PBM Spread Pricing in Michigan Medicaid Managed Care (Michigan Pharmacists Association, April 2019), https://www.michiganpharmacists.org/Portals/0/resources/3AA%20MI%20Medicaid%20managed%20care%20analysis %20-%20Final%2004.10.19.pdf?ver=2019-04-30-064856-343&ver=2019-04-30-064856-343. ↩︎
  43. A report sponsored by Pharmacists Society of the State of New York found that in Q4 of 2017, the managed care PBM spread was 39% of the state’s overall generic spend, and that between 4/1/17 and 3/30/18, the spread was 24% of the overall generic spend. The report suggested that “managed care PBMs are pricing most generic drugs below a pharmacy’s cost to dispense and potentially using these savings to subsidize spread pricing on the remaining generic drugs.” A report prepared in response to Kentucky Senate Bill 5 found that PBMs in the state reported a spread of 12.9% ($123.5 million not paid to pharmacies and kept by the PBMs. See 3 Axis Advisors, Analysis of PBM Spread Pricing in New York Medicaid Managed Care (Pharmacists Society of the State of New York, January 2019), https://files.constantcontact.com/599cc597301/971bd1aa-2a80-464b-a85c-e3afaa8a577a.pdf; Office of Health Data Analytics, Medicaid Pharmacy Pricing: Opening the Black Box (Kentucky Cabinet for Health and Family Services, February 2019), https://chfs.ky.gov/agencies/ohda/Documents1/CHFSMedicaidPharmacyPricing.pdf. ↩︎
  44. CMS, “CMS Issues New Guidance Addressing Spread Pricing in Medicaid, Ensures Pharmacy Benefit Managers are not Up-Charging Taxpayers,” CMS Newsroom (May 15, 2019), https://www.cms.gov/newsroom/press-releases/cms-issues-new-guidance-addressing-spread-pricing-medicaid-ensures-pharmacy-benefit-managers-are-not ↩︎
  45. Ohio Department of Medicaid, “Guidance for Managed Care Plans, August 14, 2018,” https://issuu.com/thecolumbusdispatch/docs/mco_pass_through_ltr_8.14.18. ↩︎
  46. Ohio H.B. 166, “Creates FY 2020-2021 operating budget,” 133rd General Assembly (2019), https://www.legislature.ohio.gov/legislation/legislation-summary?id=GA133-HB-166. ↩︎
  47. Michigan Department of Health and Human Services, “Proposed Policy Draft: Medicaid Health Plan Pharmacy Drug Coverage Transition,” https://www.michigan.gov/documents/mdhhs/1936-Pharmacy-P_673863_7.pdf ↩︎
  48. Nevada S.B. 539, “Revises provisions relating to prescription drugs,” 79th Session (2017), https://www.leg.state.nv.us/App/NELIS/REL/79th2017/Bill/5822/Overview. ↩︎
  49. New York A. 2836 / S. 6531, “An act to amend the public health law,” 2019-2020 Legislative Session (2019), https://www.nysenate.gov/legislation/bills/2019/a2836/amendment/a. ↩︎
  50. U.S. Senate Committee on Finance, Description of the Chairman’s Mark: The Prescription Drug Pricing Reduction Act (PDPRA) of 2019 (Senate Finance, July 2019), https://www.finance.senate.gov/imo/media/doc/FINAL%20Description%20of%20the%20Chairman’s%20Mark %20for%20the%20Prescription%20Drug%20Pricing%20Reduction%20Act%20of%202019.pdf. ↩︎
  51. MACPAC, Next Steps in Improving Medicaid Prescription Drug Policy (MACPAC, June 2019), https://www.macpac.gov/wp-content/uploads/2019/06/Next-Steps-in-Improving-Medicaid-Prescription-Drug-Policy.pdf. ↩︎
  52. Prada and Loaiza, “Comparing the Medicaid Prospective Drug Utilization Review Program Cost-Savings Methods Used by State Agencies in 2015 and 2016,” American Health & Drug Benefits 12, no. 1 (February 2019): 7-12, https://www.ncbi.nlm.nih.gov/pmc/articles/PMC6404806/. ↩︎
  53. Edwin Park, How to Strengthen the Medicaid Drug Rebate Program to Address Rising Medicaid Prescription Costs (Georgetown University Center for Children and Families, January 2019), https://ccf.georgetown.edu/wp-content/uploads/2019/01/Medicaid-Rx-Policy-Options-v4.pdf. ↩︎
  54. Nicole Yvonne Nguyen and Lisa Bero, “Medicaid Drug Selection Committees and Inadequate Management of Conflicts of Interest,” JAMA Internal Medicine 173, no. 5 (March 2013): 338-343, https://jamanetwork.com/journals/jamainternalmedicine/fullarticle/1570087; and Nirav Shah, “Managing Potential Conflicts of Interest in State Medicaid Pharmacy and Therapeutics Committees: Seeking Harmony,” JAMA Internal Medicine 173, no. 5 (March 2013): 344, https://jamanetwork.com/journals/jamainternalmedicine/article-abstract/1570097. ↩︎
  55. Liz Essley Whyte, Alison Fitzgerald Kodjak, and Joe Yerardi, “How Drugmakers Sway States to Profit Off of Medicaid,” Center for Public Integrity (July 18, 2018), https://publicintegrity.org/state-politics/how-drugmakers-sway-states-to-profit-off-of-medicaid; and Brenna Goth, “Arizona Medicaid Committee Must Disclose Drug-Company Ties,” Bloomberg Law (July 30, 2018), https://news.bloomberglaw.com/health-law-and-business/arizona-medicaid-committee-must-disclose-drug-company-ties. ↩︎
  56. Whyte, Kodjak, and Yerardi, “How Drugmakers Sway States to Profit Off of Medicaid,” Center for Public Integrity (July 18, 2018), https://publicintegrity.org/state-politics/how-drugmakers-sway-states-to-profit-off-of-medicaid. ↩︎
  57. Edwin Park, “Senate Finance Committee Considers Bipartisan Bill to Lower Federal and State Medicaid Drug Costs,” Say Ahhh! Georgetown CCF (July 23, 2019), https://ccf.georgetown.edu/2019/07/23/senate-finance-committee-considers-bipartisan-bill-to-lower-federal-and-state-medicaid-drug-costs/; and Whyte, Kodjak, and Yerardi, “How Drugmakers Sway States to Profit Off of Medicaid,” Center for Public Integrity (July 18, 2018), https://publicintegrity.org/state-politics/how-drugmakers-sway-states-to-profit-off-of-medicaid. ↩︎
  58. Goth, “Arizona Medicaid Committee Must Disclose Drug-Company Ties,” Bloomberg Law (July 30, 2018), https://news.bloomberglaw.com/health-law-and-business/arizona-medicaid-committee-must-disclose-drug-company-ties; and Arizona E.O 2018-06, “Increasing Transparency and Eliminating Undue Influence by Pharmaceutical and Medical Device Companies,” (2018), https://azgovernor.gov/sites/default/files/executive_order_2018-06_0_0.pdf. ↩︎
  59. U.S. Senate Committee on Finance, Description of the Chairman’s Mark: The Prescription Drug Pricing Reduction Act (PDPRA) of 2019 (Senate Finance, July 2019), https://www.finance.senate.gov/imo/media/doc/FINAL%20Description%20of%20the%20Chairman’s%20Mark %20for%20the%20Prescription%20Drug%20Pricing%20Reduction%20Act%20of%202019.pdf. ↩︎
  60. Soumitri Barua, Robert Greenwald, Jason Grebely, Gregory J. Dore, Tracy Swan, and Lynn E. Taylor, “Restrictions for Medicaid Reimbursement of Sofosbuvir for the Treatment of Hepatitis C Virus Infection in the United States,” Annals of Internal Medicine 163, no. 3 (August 2015): 215-223, https://annals.org/aim/fullarticle/2362306/restrictions-medicaid-reimbursement-sofosbuvir-treatment-hepatitis-c-virus-infection-united. ↩︎
  61. CMS, “For State Technical Contacts: Assuring Medicaid Beneficiaries Access to Hepatitis C (HCV) Drugs,” (CMS, November 2015), https://www.medicaid.gov/medicaid-chip-program-information/by-topics/prescription-drugs/downloads/rx-releases/state-releases/state-rel-172.pdf. ↩︎
  62. A settlement in April 2017 made this provision permanent. See N.C. and L.J. v. Washington State Health Care Authority, Public Employees Benefits Board, and Dorothy Teeter in her official capacity, N.A., Case No. 16-2-08002-2 SEA (King County Superior Court, 2016), https://www.hca.wa.gov/assets/ump/Hep-C-settlement-agreement.pdf. ↩︎
  63. Division of Pharmacy, “Louisiana SPA #19-0018,” CMS, https://www.medicaid.gov/State-resource-center/Medicaid-State-Plan-Amendments/Downloads/LA/LA-19-0018.pdf. ↩︎
  64. For more on VBPs in supplemental rebates, see Rachel Dolan, Understanding the Medicaid Prescription Drug Rebate Program (KFF, November 2019), https://modern.kff.org/medicaid/issue-brief/understanding-the-medicaid-prescription-drug-rebate-program/ ↩︎
  65. Pinson, Thielke, King, Beyer, and Driver, Medicaid and Specialty Drugs: Current Policy Options (Center for Evidence-based Policy, Oregon Health & Science University), http://centerforevidencebasedpolicy.org/wp-content/uploads/2018/12/MED_Medicaid_and_Specialty_Drugs_Current_Policy_Options_Final_Sept-9-2016.pdf ↩︎
  66. MACPAC, Next Steps in Improving Medicaid Prescription Drug Policy (MACPAC, June 2019), https://www.macpac.gov/wp-content/uploads/2019/06/Next-Steps-in-Improving-Medicaid-Prescription-Drug-Policy.pdf. ↩︎
  67. MACPAC, Next Steps in Improving Medicaid Prescription Drug Policy (MACPAC, June 2019), https://www.macpac.gov/wp-content/uploads/2019/06/Next-Steps-in-Improving-Medicaid-Prescription-Drug-Policy.pdf. ↩︎
  68. Commonwealth of Massachusetts, “MassHealth Section 1115 Demonstration Amendment Request Submitted to CMS,” (September 8, 2017), https://www.mass.gov/doc/section-1115-demonstration-amendment-request-submitted-to-cms-1/download. ↩︎
  69. Virgil Dickson, “CMS denies Massachusetts’ request to choose which drugs Medicaid covers,” Modern Healthcare (June 27, 2018), https://www.modernhealthcare.com/article/20180627/NEWS/180629925/cms-denies-massachusetts-request-to-choose-which-drugs-medicaid-covers ↩︎
  70. Division of TennCare, “TennCare II Demonstration: Amendment 42 Modified Block Grant and Accountability,” (November 20, 2019), https://www.medicaid.gov/Medicaid-CHIP-Program-Information/By-Topics/Waivers/1115/downloads/tn/tn-tenncare-ii-pa10.pdf ↩︎
News Release

Fact Sheet Provides an Overview of Abortion Later in Pregnancy and Policies to Regulate It

Published: Dec 5, 2019

Abortions occurring at or after 21 weeks gestational age are rare (1.4%) and difficult to obtain, yet these abortions are subject to intense public debate in the news, policy and the law.  A new KFF fact sheet provides basic information about abortion later in pregnancy in the US, including what it is, why patients may have an abortion later in pregnancy, and the laws that regulate it. The fact sheet addresses many misconceptions about abortion later in pregnancy by defining key terms, outlining standard clinical practice, and explaining state abortion regulations that place gestational limits on abortion or ban clinicians from using certain medically-approved methods.

News Release

Policies Aimed at Limiting Access to Abortion May Negatively Impact Pregnancy Loss Care

Published: Dec 4, 2019

A new KFF analysis provides an overview of pregnancy loss, how it is sometimes conflated with abortion, and how abortion restrictions may negatively impact care for those experiencing pregnancy loss. Pregnancy loss – which is extremely common — is an umbrella term that describes both miscarriages and stillbirths.

At a time when abortion restrictions around the country are increasing, these laws have the potential to limit clinicians’ ability to manage pregnancy loss and promote investigations and criminal charges against women experiencing pregnancy loss. The brief also examines how “fetal protection” legislation has been used to criminalize pregnancy loss, particularly in the context of substance use in pregnancy.

News Release

New Resource Outlines Efforts to Expand Screening and Counseling for Intimate Partner Violence

Published: Dec 2, 2019

A new resource gives an overview of intimate partner violence (IPV) in the US, discusses the populations most impacted, and insurance coverage of IPV screening, counseling, and referral services.

The Affordable Care Act (ACA) changed access to coverage and services for people who have experienced IPV. The ACA requires private plans and Medicaid expansion programs to cover preventative screening for IPV. Many providers have started to incorporate IPV screening and intervention into their practice, but few women are screened for IPV in health care settings.

Despite improved coverage for IPV screening, there are several challenges to implementing IPV screenings in health care settings, including ensuring patient privacy, mandatory reporting laws, and time constraints during appointments. The brief also provides case studies of providers who are trying to better implement IPV care into their practice in response to these barriers.

The brief calls attention to populations at higher risk for IPV, including women living with HIV. In addition to this new brief, KFF also has updated a brief that highlights the link between HIV and IPV for women, and reviews key policy changes that attempt to address the intersection of these issues. Greater Than AIDS, KFF’s national public information campaign, also has a series of informational videos of women telling their stories about living with HIV and overcoming IPV.

Intimate Partner Violence (IPV) Screening and Counseling Services in Clinical Settings

Authors: Amrutha Ramaswamy, Usha Ranji, and Alina Salganicoff
Published: Dec 2, 2019

Issue Brief

Introduction

Intimate partner violence (IPV), defined as sexual violence, stalking, physical violence, and psychological aggression perpetrated by an intimate partner, affects nearly a third of all Americans at some point in their lives. Although IPV affects men and women of all ages, women, particularly young women and women of color experience IPV at higher rates. An estimated 6.5 million women in the U.S. experience contact sexual violence, physical violence, or stalking by an intimate partner in a single year. People who are victimized by their partners are more likely to experience health problems and both the Centers for Disease Control (CDC) and U.S. Preventive Services Task Force (USPSTF) have identified IPV has a significant public health issue in the US. Evidence supports the role that clinicians have in assisting women who have experienced IPV and reducing adverse outcomes. The USPSTF and the Women Preventive Services Initiative (WPSI) sponsored by Health Resources and Services Administration (HRSA) both recommend that clinicians screen women for violence. As a result, the Affordable Care Act (ACA) required private plans and Medicaid expansion programs to reimburse clinicians when they provide IPV screening and brief intervention services to women as part of their preventive care, at no additional cost to women. This factsheet reviews the prevalence and consequences of IPV and discusses insurance coverage of and access to IPV screening, counseling, and referral services for women in the US.

Table 1: Key Terms and Definitions
TermDefinition
Intimate PartnerA romantic or sexual partner and includes spouses, boyfriends, girlfriends, people with whom they dated, were seeing, or “hooked up.”
Contact Sexual ViolenceA combined measure that includes rape, being made to penetrate someone else, sexual coercion, and unwanted sexual contact.
StalkingInvolves a pattern of harassing or threatening tactics used by a perpetrator that is both unwanted and causes fear or safety concerns in the victim.
Physical ViolenceIncludes a range of behaviors from slapping, pushing or shoving to severe acts that include hit with a fist or something hard, kicked, hurt by pulling hair, slammed against something, tried to hurt by choking or suffocating, beaten, burned on purpose, used a knife or gun.
Psychological AggressionIncludes expressive aggression (such as name calling, insulting or humiliating an intimate partner) and coercive control, which includes behaviors that are intended to monitor and control or threaten an intimate partner.
Reproductive CoercionIncludes forced or coerced sex, sabotage of contraception, or the forcible control of reproductive health by an abusive partner. Reproductive coercion can take the form of hiding, withholding, or destroying a partner’s contraceptives, breaking, poking holes in, or removing a condom in an attempt to promote pregnancy, and threats or acts of violence forcing a victim to have an abortion or carry a pregnancy to term.
SOURCE: CDC. National Intimate Partner and Sexual Violence Survey: 2015 Data Brief, November 2018; Deshpande N, Lewis-O’Connor A, Screening for Intimate Partner Violence During Pregnancy, 2013; The American College of Obstetricians and Gynecologists (ACOG), Committee on Health Care and Underserved Opinion: Reproductive and Sexual Coercion, February 2013.

Who is affected by IPV?

The term “intimate partner violence” is often used interchangeably with the term “domestic violence” (DV). IPV occurs across all demographics, but some groups experience higher rates. Most statistics on IPV incidence and prevalence are based on self-report. Many women are hesitant to report IPV for a variety of reasons, including financial dependence on a partner or fear of further abuse. Victims’ characteristics, such as cultural background, socio-economic status, or age, can also shape how they are affected by or speak about IPV. For example, IPV is especially stigmatized in Asian-Pacific Islander communities, so cultural and linguistic differences with providers can lead to lower reported numbers of violence. Therefore, published data may undercount actual incidence, but the National Intimate Partner and Sexual Violence Survey (NISVS) is a population-based, anonymous, random digital dial phone survey and has been ongoing since 2010.

Young Women: IPV affects millions of women in the US of all ages, but nearly three quarters of all victims first experience IPV before the age of 25, with an estimated 11.6 million women experiencing their first victimization between the ages and 11 and 17 (Figure 1).

Figure 1: Most women affected by IPV first experience it before the age of 25

Women of color: Around half of all Non-Hispanic Black, American Indian/Alaska Native women, and Multi-Racial women have experienced IPV at some point in their lives (Figure 2). While women of all economic backgrounds can and do experience IPV, some studies show that as social class increases, risk of victimization decreases.

Figure 2: Multi-Racial Non-Hispanic and Black Non-Hispanic Women report the highest lifetime and 12-month prevalence of IPV

Women with disabilities: Women with disabilities, like women without disabilities, experience physical, sexual, and emotional violence; however, they also experience disability-specific forms (such as interference in taking medications or accessing care) of violence by an intimate partner or caretaker. In one study, women with physical health impairments were 22% more likely than women without disabilities to experience IPV; in the same study, women with mental health impairments were 67% more likely to experience IPV than their nondisabled counterparts. Overall, an estimated 26% of HIV-positive people experience IPV, but this share more than doubles to 55% amongst HIV-positive women.

LGBTQ Individuals: Four in ten (40%) of Gay/Lesbian women and six in ten (60%) Bisexual women report victimization, compared to 35% among heterosexual women.1  Studies of lifetime prevalence of IPV among transgender people range from 31% to 50%, showing similar, if not higher rates of occurrence than other sexual minorities.

Women in the military: A 2013 Department of Veteran Affairs (VA) study found a high prevalence of 12-month IPV perpetration and victimization among active duty service members, at 22% and 30% respectively. Among women Veterans, the prevalence of lifetime IPV victimization is 35%.

Women with substance Abuse Disorder: Studies have found that anywhere from 31% to 67% of women entering substance abuse treatment or methadone clinics have experienced IPV within the last year, and nearly 90% had experienced IPV within their lifetimes. Other studies have found that women who have been abused by an intimate partner are more likely to use or become dependent on substances: one study found a quarter (26%) among those experiencing IPV, compared to 5% in those who had not experienced IPV.

Pregnancy: Research has found that between 3%-9% of pregnant women are estimated to have experienced IPV during pregnancy, which can have a multitude of negative consequences for both women and babies. Pregnant women that have experienced IPV are likely to experience peri-partum depression, obstetric complications, preterm birth, low-birth weight infants, and perinatal death.2  Furthermore, research suggests that many women experience violence in the year leading up to pregnancy.3  Pregnancy offers multiple opportunities for screening and identification of IPV. Research has found that screening multiple times during the course of pregnancy results in higher identification rates than a single screen at the initial prenatal visit. A study of women who have had multiple abortions found that a history of physical or sexual abuse was associated with repeat abortion: this is also an opportunity for screening.

Reproductive coercion is a form of IPV that can include forcible control of reproductive health by an abusive partner. For example, approximately 10.3 million women have reported that an intimate partner has refused to use a condom, or tried to get them pregnant when they did not want to be pregnant.

Estimates of lifetime and 12-month exposure to IPV vary across the states, although the reasons for this variation are not well understood. Rhode Island sees the lowest percent of women experiencing contact sexual violence, physical violence, or stalking victimization by intimate partner at an estimated 4.2%, while South Carolina sees the highest, at 10.6% (Appendix Table 1). A CDC study showed that a higher prevalence of IPV was shown for women who were young, not White, unmarried, had less than 12 years of education, received Medicaid, or had unintended or stressful pregnancies. States that have a larger population of women with these characteristics are likely to see higher rates of IPV prevalence.

What are the Consequences of IPV?

Several major medical and public health organizations, along with the CDC and USPSTF identify IPV as a significant public health issue. Four in ten (41%) of all female survivors experience physical injury related to IPV. Approximately 55% of all female homicide victims in the US are killed by an intimate partner. 31 states report their violent deaths in the Non-National Violent Death Reporting System (NVDRS); of those, 8 states have a rate higher than 1 death by a spouse or partner per 100,000 women: Arizona, New Mexico, Colorado, Oklahoma, Wisconsin, Virginia, North Carolina, and South Carolina (Figure 3).

Figure 3: Among states reporting female death by spouse/intimate partner, 24 states reported 10 or more deaths in 2016

Among women who have experienced IPV in their lifetimes, 69% reported at least one IPV-related impact including safety concerns, PTSD symptoms, injury, missing work or school, needing medical care, becoming pregnant, or contracting a sexually transmitted infection. Many also reported needing assistance with housing, legal advice, and victim advocacy. Among women who experienced IPV in the past 12 months, 55% reported to have experienced one of these IPV-related impacts.4 

People who have experienced IPV are more likely to report experiencing negative health outcomes, such as chronic pain, asthma, difficulty sleeping, frequent headaches, gastrointestinal disorders and increased risk of chronic conditions such as arthritis, stroke and cardiovascular disease.5  A study of Adverse Childhood Experiences found that there is a strong relationship between exposure to child maltreatment and household dysfunction (such as witnessing IPV) and many of the leading causes of death in adults: IPV not only raises health risks for the survivor, but children, who are secondary survivors.

It is estimated that the lifetime economic cost of IPV to the US population is $3.6 trillion, with a lifetime per-victim cost of $103,767 for women and $23,414 for men. This number is estimated to include medical costs, lost productivity, criminal justice costs, and other costs, such as victim property loss. Beyond the cost to the overall population, there are costs directly to the victim of IPV, such as medical care or mental health services.

Coverage for IPV Screening and Intervention

The Affordable Care Act (ACA) changed access to coverage and services to people who have experienced IPV, by both providing new protections and in requiring coverage of specific support services. Prior to the ACA, non-group health insurers could deny coverage based on pre-existing conditions, which could include conditions arising out of acts of domestic violence, such as post-traumatic stress disorder and sexually transmitted infections.6  In the years leading up to the passage of the ACA, some states did not prohibit insurance companies from considering IPV as an underwriting criterion.

Additionally, victims of IPV may also be eligible for a Special Enrollment Period (SEP) in the federal marketplace (and in state marketplaces at the state’s discretion), permitting them to enroll for coverage outside of the specified open enrollment window. The ACA requires all private plans and Medicaid expansion programs to reimburse providers when they provide the preventive services recommended by USPSTF and the WPSI, without cost-sharing for the patient.7 

Research shows that the implementation of routine inquiry or screening for IPV in healthcare settings can identify those experiencing IPV and survivors of past IPV, increase access to resources, reduce abuse, and improve clinical and social outcomes.8  Both USPSTF and WPSI recommend screening women for intimate partner violence. The WPSI recommendation is broader and states that clinicians should screen adolescents and adult women of all ages for intimate partner violence annually, while the USPSTF recommendation is limited to women of reproductive age. In addition, other professional organizations, including the American College of Obstetricians and Gynecologists (ACOG) and the American Academy of Pediatrics (AAP),9  also recommend that providers conduct intimate partner violence screenings.

Table 2: Recommendations for Screening of Interpersonal Violence Covered by Private Plans and Medicaid Expansion Programs
OrganizationRecommendation
U.S. Preventive Services Task Force (USPSTF)The USPSTF recommends that clinicians screen for intimate partner violence (IPV) in women of reproductive age and provide or refer women who screen positive to ongoing support services.
Health Resources and Services Administration (HRSA) The Women’s Preventive Services Initiative recommends screening adolescents and women for interpersonal and domestic violence at least annually and, when needed, providing or referring for initial intervention services. Interpersonal and domestic violence includes physical violence, sexual violence, stalking and psychological aggression (including coercion), reproductive coercion, neglect, and the threat of violence, abuse, or both. Intervention services include, but are not limited to, counseling, education, harm reduction strategies, and referral to appropriate supportive services.
SOURCES: USPSTF and HRSA.

Screening

Clinicians can choose from several instruments to screen for whether a woman has experienced IPV within the last year within a primary care setting (Appendix Table 2). Most screening tools include questions about current physical violence, psychological aggression, and feeling threatened or afraid. Some cover sexual violence and stalking (Figure 4).

Figure 4: More than 3 in 10 women experience contact sexual violence, physical violence, and/or stalking by an intimate partner in their lifetime

Another approach recommended by Futures Without Violence is Universal Education and Empowerment, in which clinicians talk with all patients about healthy and unhealthy relationships and the health effects of violence, and offer the opportunity for disclosure.

The ACOG recommendation outlines that IPV be screened for privately during new patient visits, annual examinations, initial prenatal visits, each trimester of pregnancy, and the postpartum checkup, while AAP (Bright Futures) recommends that IPV is discussed with mothers at prenatal, newborn, 1-month, 9-month, and 4-year visits.

Interventions and Counseling

The WPSI and USPSTF recommendations state that women who screen positive for IPV be provided or referred to ongoing support services. Most interventions include referral to mental health, social services, local and national IPV advocacy organizations, which can provide safety planning, counseling, cognitive behavioral therapy, and other ongoing support. Other intervention resources include the brief Danger Assessment Tool (Appendix Table 3) to assess the risk for severe violence and an interactive decision aid to facilitate safety planning, myPlan, which is available as a mobile app and website.

Some of these patient resources are hotlines that the patient can call or text (Appendix Table 4). Another option is for clinicians to refer patients to their local DV advocates or mental health services.10  A systematic review of IPV interventions in primary care settings found that 76% of all interventions resulted in at least one statistically significant benefit, whether it be use of IPV resources, safety planning, improvement of health, or reductions in violence. Women receiving an intervention were found to be 60% more likely to end a relationship because it felt unhealthy or unsafe.11 

What are the Challenges to Screening?

Although several years have passed since the initial recommendation for provider screening of IPV, adoption has been slow. In 2017 only 27% of women reported having discussed IPV with their provider recently (Figure 5). Low-income women, women on Medicaid, and Black or Latina women were most likely to have discussed DV than their counterparts.

Figure 5: Approximately one quarter of women have discussed domestic violence with their provider recently, but rates are higher among Black and Latina women and those with Medicaid

Ensuring privacy is one of the challenges to providers having these conversations with patients, who may not feel safe discussing IPV because their partner or someone else has accompanied them to their visit. Women who experience IPV are unlikely to disclose to a provider in front of their partner, friends, or family. To address this, clinics and providers can have a policy that patients will have at least some private time with their provider during the visit.12  The studies cited in the USPSTF recommendations only included women who could be separated from their partners at the screening phase, intervention phase, or both.

Mandatory reporting laws for IPV differs between states, but most have laws which require the reporting of specified injuries, or use of weapons. However, some clinicians feel that these reporting requirements impinge provider-patient confidentiality and may actually make patients less likely to disclose information. If a disclosure falls under a state’s reporting laws, the provider must submit an injury report to law enforcement or that state’s specified entity.13  Suspected abuse of a minor is required for reporting in all states. Futures Without Violence recommends a provider disclose their limits of confidentiality before beginning an IPV screening.

Other frequently reported barriers include personal discomfort with the issue or lack of knowledge about IPV or institutional policies. 14  Studies show that implementing a universal workflow, training, and screening protocols in an existing program might alleviate some of these barriers. 15 ,16 ,17  Some providers have reported that time constraints keep them from building patient rapport, which could lead to a positive IPV disclosure. Including nurses, nursing assistants, and other non-physician staff in screening protocols could help relieve some of the issues with time constraints.18 ,19 

Other challenges include a fear that patients will be offended by being screened, misconception regarding a patient’s risk of IPV, or not realizing that domestic violence is a significant problem for their patient populations. 20 ,21  Studies have found that interdisciplinary methods of formal education, in-service training, and continuing education can assuage personal perceptions and feelings about domestic violence.22 

Examples of Implementation

Despite the challenges, there are several examples of successful implementation in different settings. A systematic review of 17 programs that evaluated IPV screening found that programs that included a comprehensive approach and institutional support were effective in increasing IPV screening and disclosure rates. Effective screening protocols, initial and ongoing training, and immediate access/referrals to onsite or offsite support services helped to improve provider screening.23  Establishing provider relationships with community agencies in training sessions was found to raise the comfort level of staff, in both screening and in referring to services. Of note, HRSA is implementing a multi-year strategic framework to improve the response of health care systems to IPV.

There are multiple examples of health systems that have implemented both routine screening as well as intervention mechanisms to support, including at the Veterans Health Administration (Case Study 1: Veterans Affairs), and the not-for-profit integrated health system Kaiser Permanente (KP) (Case Study 2: Kaiser Permanente).

Case Study 1: Veterans Affairs
In May 2012, the U.S. Department of Veterans Affairs (VA) chartered an IPV task force, which would develop a national plan for the VA to implement a trauma informed care approach. In its Plan for Implementation of the DV/IPV Assistance Program, the Veterans Health Administration (VHA). These recommendations included expanding screening, prevention, and intervention services for men and women veterans, introducing an employee assistance program for those experiencing IPV, changing the language clinicians use to speak about IPV, and interventions for individuals who commit IPV. After pilot testing the plan in select sites, as of January 2019, the VHA requires all VA medical centers (VAMCs) to implement and maintain the program.

A 2019 study of 11 VAMCs found several successful clinical practices that were implemented through the program. These included the use of screening tools for primary IPV screening and secondary risk assessment, resource provision, community partnerships, and co-location of mental health resources. While VAMCs faced some of the same challenges as other providers discussed above, the study was able to identify facilitators to combat these challenges, such as engaging IPV champions. The VA Office of Research and Development is currently conducting longer studies to understand how intervention can help improve health outcomes.

SOURCES: Veterans Health Administration, Directive 1198: Intimate Partner Violence Assistance Program, January 2019.
Case Study 2: Kaiser Permanente
Since 2001, Kaiser Permanente Northern California,(KP) a large integrated health care organization that is not associated with KFF, has been implementing a “systems model” approach to improving screening and response to IPV and IPV identification has significantly increased. This comprehensive approach leverages the entire healthcare environment, and is comprised of five:

1) visible messaging for patients throughout the healthcare setting;2) private, routine clinician inquiry (with intervention and referral for positive screens);3) services by behavioral health clinicians for mental health needs and safety planning;4) partnerships with IPV advocacy organizations for crisis response and ongoing support and legal services; and5) oversight by local medical center leadership.

As part of integrating IPV screening and intervention into clinical care settings, KP uses health information technology, including tools in the electronic health record, to support clinician inquiry, intervention, documentation, and referral as well as patient privacy. Diagnostic information does not appear on visit summaries, bills, or patient portals. Performance improvement methods using de-identified databases help sustain and guide progress across clinical departments and medical centers.

SOURCES: Young-Wolff KC, Kotz K, McCaw B, Transforming the Health Care Response to Intimate Partner Violence: Addressing “Wicked Problems,” June 2016.

While earlier studies of the effectiveness of the IPV screening and intervention tended to focus on outcomes such as increased screening provided by clinicians, increased awareness of the medical facility as a resource for IPV related issues, and increased member satisfaction, there has been a recent push on studying the effects of intervention. One study interviewing women with a past or current history of IPV found that survivors placed emphasis on interventions that protected safety, privacy, and autonomy, such as interventions that did not require IPV disclosure. Another analysis of women’s perceptions of appropriate interventions also found that women were looking for nonjudgmental, nondirective, and individually tailored interventions. In both the cases of the VA and KP, there is emphasis placed on the success of interventions implemented after screening is complete.

Looking Forward

With nearly 8 million women in the US experiencing IPV annually, and nearly 45 million over the course of their lifetimes, IPV poses a significant, multi-faceted public health problem. One important component of both reducing violence and the health burdens of that violence is the role of health care providers in early detection and treatment of IPV. USPSTF and WPSI highlight studies that found lower rates of IPV in women who underwent screening and intervention.24  Furthermore, given the complex nature of IPV and the wide range of its health consequences, more providers are striving to develop IPV screening and intervention services that align with related efforts in the health care system, including providing trauma-informed care, addressing the role of social determinants of health, and improving access to mental health and addiction services.

As a result of the ACA’s preventive services coverage requirement, IPV screening is covered under most private health plans and Medicaid expansion groups. The ACA also made policy changes related to IPV, including protecting coverage access for people with pre-existing conditions and offering them special enrollment periods.

In addition to coverage, the USPSTF and WPSI recommendations imply that screening and counseling should be standard practice. As states expand Medicaid or more people become privately insured, more become eligible for coverage of these screening and counseling services, which could play an important role in reducing IPV victimization. In addition to coverage for screening, more providers are implementing interventions to connect patients to services. These efforts, along with continued education and awareness about IPV and expanded resources could improve outcomes and reduce the burden of violence experienced by millions of women in the US.

The authors thank Brigid McCaw MD, MPH, MS, FACP for her helpful review and input on this brief.

Appendices

Appendix Table 1: 12 Month and Lifetime Prevalence of Contact Sexual Violence, Physical Violence, and/or Stalking Victimization by Intimate Partner, U.S. Women 2010-2012 Estimates
StateLifetime %Experienced IPVLifetime NumberExperienced IPV12 Month %Experienced IPV12 Month NumberExperienced IPV
United States37%44,981,0007%7,919,000
Alabama38%713,0009%166,000
Alaska43%109,0007%18,000
Arizona43%1,040,0008%187,000
Arkansas41%464,0009%97,000
California35%4,939,0005%725,000
Colorado37%706,0007%139,000
Connecticut38%539,000NRNR
Delaware38%136,0008%27,000
District of Columbia39%104,000NRNR
Florida38%2,891,0006%474,000
Georgia37%1,405,000NRNR
Hawaii35%181,000NRNR
Idaho33%189,0005%27,000
Illinois42%208,0009%443,000
Indiana43%1,066,0005%123,000
Iowa35%417,000NRNR
Kansas34%367,000NRNR
Kentucky45%775,00010%168,000
Louisiana36%636,0009%158,000
Maine39%214,000NRNR
Maryland34%796,0005%109,000
Massachusetts34%913,0007%188,000
Michigan36%1,412,0008%301,000
Minnesota34%694,0008%171,000
Mississippi40%458,000NRNR
Missouri42%990,0007%160,000
Montana37%143,000NRNR
Nebraska34%234,0008%58,000
Nevada44%438,0009%88,000
New Hampshire44%184,000NRNR
New Jersey36%1,248,0008%273,000
New Mexico38%295,000NRNR
New York32%2,507,0007%508,000
North Carolina35%1,325,0005%182,000
North Dakota30%77,000NRNR
Ohio38%1,739,0006%262,000
Oklahoma40%577,0007%99,000
Oregon40%603,0006%97,000
Pennsylvania37%1,907,0006%325,000
Rhode Island33%141,0004%18,000
South Carolina42%780,00011%195,000
South Dakota28%86,000NRNR
Tennessee40%999,0007%171,000
Texas40%3,726,0008%709,000
Utah34%323,000NRNR
Vermont39%100,000NRNR
Virginia34%1,063,0006%176,000
Washington41%1,079,0009%235,000
West Virginia39%295,0008%60,000
Wisconsin36%805,000NRNR
Wyoming34%71,000NRNR
NOTES: NR = No response recorded; only states with statistically reliable estimates are shown. Number of victims rounded to the nearest thousand.SOURCE: CDC. National Intimate Partner and Sexual Violence Survey: 2010-2012 State Report, April 2017.
Appendix Table 2: Screening Tests
MeasureComponentsScoringSensitivity; Specificity
Hurt, Insult, Threaten, Scream (HITS)H: Hurt: Has your partner ever physically hurt you in the past 12 months?5-point Likert scale, self-report or clinician administered survey; score ranges from 4-20 points, ≥11 indicates abuse.86%; 99%
I: Insult: Has your partner ever insulted you in the past 12 months?
T: Threaten: Has your partner ever threatened to harm you in the past 12 months?
S: Has your partner ever screamed or cursed at you in the past 12 months?
E: Extended: Has your partner ever forced you to have sexual activities in the past 12 months?
Parent Screening Questionnaire (PSQ)1. Have you ever been in a relationship in which you were physically hurt or threatened by a partner?Dichotomous scale; score ranges from 0-3.19%; 93%
2. In the past year, have you been afraid of a partner?
3. In the past year, have you thought of getting a court order for protection?
Ongoing Violence Assessment Tool (OVAT)1. At the present time, does your partner threaten you with a weapon?Dichotomous scale; score ranges from 0-4.86-93%; 83-86%
2. At the present time, does your partner beat you so badly that you must seek medical help?
3. At the present time, does your partner act like he/she would like to kill you?
4. My partner has no respect for my feelings.
Secure, Acceptance, Family, Even, Talk Measure (SAFE-T)1. I feel comfortable/Secure in my home/apartment.Dichotomous scale; score ranges from 0-5.54%; 81%
2. My husband/partner Accepts who me just the way I am.
3. My Family likes my husband/partner.
4. My husband/partner has an Even/calm disposition.
5. If my husband/partner and I disagree, we resolve our differences by Talking it out.
Partner Violence Screen (PVS)1. Have you ever been hit, kicked, punched, or otherwise hurt by someone in the past year? If so, by whom?Dichotomous scale, clinician administered; score ranges from 0-3, with ≥1 indicates IPV.49%; 94%
2. Do you feel safe in your current relationship?
3. Is there a partner from a previous relationship who is making you feel unsafe now?
Woman Abuse Screening Tool (WAST)1. In general, how would you describe your relationship—a lot of tension, some tension, no tension?3-point response (0=never, 1=sometimes, 2=often) scale; scores range from 0-16; ≥4 indicates exposure to IPV.47-88%; 89-96%
2. Do you and your partner work out arguments with great difficulty, some difficulty, or no difficulty?
(#3–#7 response options: often, sometimes, never)
3. Do arguments ever result in you feeling down or bad about yourself?
4. Do arguments ever result in hitting, kicking, or pushing?
5. Do you ever feel frightened by what your partner says or does?
6. Has your partner ever abused you physically?
7. Has your partner ever abused you emotionally?
8. Has your partner ever abused you sexually?
Slapped, Threatened, Throw (STaT)S: Have you ever been in a relationship where your partner has pushed or Slapped you?Dichotomous, self-report scale; score ranges from 0-3.96%; 75%
T: Have you ever been in a relationship where your partner Threatened you with violence?
aT: Have you ever been in a relationship where your partner has Thrown, broken or punched things?
Abuse Assessment Screen (AAS)1. Have you ever been emotionally or physically abused by your partner or someone important to you?Dichotomous scale, clinician administered survey; scores range from 0-5, with any positive response considered a positive screen.32-93%; 55-99%
2. Within the last year, have you been hit, slapped, kicked or otherwise physically hurt by someone?
3. (If applicable): Since you’ve been pregnant, have you been slapped, kicked or otherwise physically hurt by someone?
4. Within the last year, has anyone forced you to have sexual activities? (circle all that apply): husband, ex-husband, boyfriend, stranger, other, multiple.
5. Are you afraid of your partner or anyone you listed above?
Humiliation, Afraid, Rape, Kick (HARK)H: Humiliation: Within the last year, have you been humiliated or emotionally abused in other ways by your partner or ex-partner?Dichotomous scale, self-report survey, adapted from AAS; scoring ranges from 0-4.81%; 95%
A: Afraid: Within the last year, have you been afraid of your partner or ex-partner?
R: Rape: Within the last year, have you been raped or forced to have any kind of sexual activity by your partner ex-partner?
K: Kick: Within the last year, have you been kicked, hit, slapped, or otherwise physically hurt by your partner or ex-partner?
Modified Conflict Tactics Scale-Revised Short Form (CTQ-SF)1. I didn’t have enough to eat8-point Likert scale, self-report survey; positive response (anything other than never) indicates exposure to IPV.85%; 88%
2. I knew that there was someone to take care of me and protect me
3. People in my family called me things (“stupid”, “lazy”, or “ugly”)
4. My parents were too drunk or high to take care of the family
5. Someone in my family helped me feel important or special
6. I had to wear dirty clothes
7. I felt loved
8. I thought that my parents wished I had never been born
9. I got hit so hard by someone in my family that I had to see a doctor
10. There was nothing I wanted to change about my family
11. People in my family hit me so had it left marks or bruises
12. People in my family looked out for each other
13. People in my family looked out for each other
14. People in my family said hurtful or insulting things to me
15. I believe that I was physically abused
16. I had the perfect childhood
17. I got hit or beaten so badly that it was noticed by someone
18. Someone in my family hated me
19. People in my family felt close to each other
20. Someone tried to touch me or make me touch them in a sexual way
21. Someone threatened to hurt/lie about me unless I did sexual things with them
22. I had the best family in the world
23. Someone tried to make me do sexual things or watch sexual things
24. Someone molested me (took advantage of me sexually)
25. I believe that I was emotionally abused
26. There was someone to take me to the doctor if I needed one
27. I believe that I was sexually abused
28. My family was a source of strength and support
Ongoing Abuse Screen (OAS)1. At the present time, does your partner threaten you with a weapon?Dichotomous scale; scores range from 0-5.60%; 90%
2. Are you presently being hit, slapped, kicked, or otherwise physically hurt by your partner or someone important to you?
3. Are you presently forced to have sexual activities?
4. Are you afraid of your partner or anyone of the following (circle if appropriate): husband/

wife, ex-husband/ex-wife, boyfriend/girlfriend, stranger

5. (If pregnant) Have you ever been hit, slapped, kicked, or otherwise physically hurt by your partner or someone important to you during pregnancy?
Source: WPSI, Clinical Screening Instruments for IPV Evaluated in Studies, December 2016.
Appendix Table 3: Danger Assessment-5 tool
1.     Has the physical violence increased in frequency or severity over the past year?
2.     Has your partner (or ex) ever used a weapon against you or threatened you with a weapon?
3.     Do you believe your partner (or ex) is capable of killing you?
4.     Has your partner (or ex) ever tried to choke (strangle) you?
·       If yes, did he ever choke you?
·       About how long ago?
·       Did it happen more than once?
·       Did you ever lose consciousness or think you may have?
5.     Is your partner (or ex) violently and constantly jealous of you?
SOURCE: Campbell, JC, Danger Assessment, 2004.
Appendix Table 4: Resources for Addressing Intimate Partner Violence
NameContact
National Domestic Violence Hotline800-799-7233 or 800-799-SAFETTY: 800-787-3224www.thehotline.org
National Dating Abuse Helpline866-331-9474Text “loveis” to 22522www.loveisrespect.org
National Sexual Assault Hotline800-656-4673 or 800-656-HOPEhttps://rainn.org
The Northwest Network (LGBT Resources)206-568-7777www.nwnetwork.org
National Child Abuse Hotline800-422-4453 or 800-4-A-CHILDwww.childhelp.org
National Suicide Prevention Lifeline800-273-8255https://suicidepreventionlifeline.org
SOURCE: Miller E, McCaw B, Intimate Partner Violence, February 2019.

Endnotes

  1. Centers for Disease Control and Prevention (CDC), National Intimate Partner and Sexual Violence Survey: 2010 Findings on Victimization by Sexual Orientation, January 2013. ↩︎
  2. U.S. Preventive Services Task Force, Final Recommendation Statement: Intimate Partner Violence, Elder Abuse, and Abuse of Vulnerable Adults: Screening, October 2018. ↩︎
  3. Cheng, D. Intimate Partner Violence and Pregnancy, January 2017. ↩︎
  4. CDC, The Impact of Intimate Partner Violence: A 2015 NISVS Research In-Brief, August 2019. ↩︎
  5. Miller E, McCaw B, Intimate Partner Violence, February 2019. ↩︎
  6. U.S. Congress. United States Code, Title XXVII, The Public Health Service Act. Enacted October 2009. ↩︎
  7. Affordable Care Act (ACA) requires coverage of services recommended by USPSTF as well as women’s preventive services recommended by HRSA, which currently contracts with WPSI to make recommendations. ↩︎
  8. Miller E, McCaw B, Humphreys B, Mitchell C, Integrating Intimate Partner Violence Assessment and Intervention into Healthcare in the United States: A Systems Approach, January 2015 ↩︎
  9. American Academy of Pediatrics (AAP), Preforming Preventive Services: a Bright Futures handbook, 2010. ↩︎
  10. Futures Without Violence, IPV Health, 2018. ↩︎
  11. Miller E, McCaw B, Humphreys B, Mitchell C, Integrating Intimate Partner Violence Assessment and Intervention into Healthcare in the United States: A Systems Approach, January 2015 ↩︎
  12. Paterno M, Draughon J, Screening for Intimate Partner Violence, May 2016. ↩︎
  13. Futures Without Violence, Compendium of State and U.S. Territory Statutes and Policies on Domestic Violence and Health Care: Fourth Edition, 2019. ↩︎
  14. Jaffee KD, Epling JW, Grant W, Ghandour RM, Callendar E, Physician-Identified Barriers to Intimate Partner Violence Screening, October 2005. ↩︎
  15. A sample provider carepath is included in the Supplementary Appendix of the article: Miller E, McCaw B, Intimate Partner Violence, February 2019. ↩︎
  16. Gotlib Conn L, Young A, Rotstein O, Schemitsch E, “I’ve Never Asked One Question.” Understanding the Barriers Among Orthopedic Surgery Residents to Screening Female Patients for Intimate Partner Violence, December 2014. ↩︎
  17. Sharples L, Nguyen C, Singh B, Lin S, Identifying Opportunities to Improve Intimate Partner Violence Screening in a Primary Care System, May 2018. ↩︎
  18. Gotlib Conn L, Young A, Rotstein O, Schemitsch E, “I’ve Never Asked One Question.” Understanding the Barriers Among Orthopedic Surgery Residents to Screening Female Patients for Intimate Partner Violence, December 2014. ↩︎
  19. Sharples L, Nguyen C, Singh B, Lin S, Identifying Opportunities to Improve Intimate Partner Violence Screening in a Primary Care System, May 2018. ↩︎
  20. Agency for Healthcare Research and Quality (AHRQ), Healthier Pregnancy: Tools and Techniques to Best Provide ACA-Covered Preventive Services Provider Fact Sheet, May 2015. ↩︎
  21. Reid SA, Glasser M, Primary Care Physicians’ Recognition of and Attitudes Toward Domestic Violence, January 1997. ↩︎
  22. Davis RE, Harsh KE, Confronting Barriers to Universal Screening for Domestic Violence, November 2001. ↩︎
  23. O’Campo P, Kirst M, Tsamis C, Chambers C, Ahmad F, Implementing Successful Intimate Partner Violence Screening Programs in Health Care Settings: Evidence Generated from a Realist-informed Systematic Review, March 2011. ↩︎
  24. Miller E, McCaw B, Humphreys B, Mitchell C, Integrating Intimate Partner Violence Assessment and Intervention into Healthcare in the United States: A Systems Approach, January 2015 ↩︎
News Release

A Small Share of People with Medicare Advantage or Stand-alone Medicare Part D Coverage Voluntarily Switch Plans During Open Enrollment 

Published: Dec 2, 2019

A new KFF analysis finds that a relatively small share of people with Medicare Advantage or stand-alone Medicare Part D prescription drug coverage voluntarily switch plans during Medicare’s open enrollment period, which runs annually from Oct. 15 to Dec. 7.

With less than a week remaining for beneficiaries to make their selections, shopping around among plans is important, since plans can vary significantly and change from year to year, which can have a large impact on enrollees’ coverage and costs.

The analysis finds that, among beneficiaries without low-income subsidies, 8 percent of those in Medicare Advantage plans with prescription drug coverage voluntarily switched to another plan during the 2016 open enrollment period for the 2017 plan year. Similarly, only 10 percent of beneficiaries without low-income subsidies in Part D stand-alone drug plans voluntarily switched to another plan during the 2016 open enrollment period.

The data reflect a longstanding pattern where a substantial majority of Medicare’s private plan enrollees don’t choose to switch plans in any given year. During each of the open enrollment periods between 2007 and 2016, the share of enrollees without low-income subsidies voluntarily switching plans for the coming year ranged between 6 and 11 percent for people in Medicare Advantage drug plans, and between 10 and 13 percent among those in stand-alone drug plans.

According to an analysis of data from the Centers for Medicare & Medicaid Services (CMS), one-third of Medicare beneficiaries living in the community said it was very difficult or somewhat difficult to compare Medicare options in 2017, while nearly half said they rarely or never review or compare their Medicare options.

Low rates of plan switching could indicate that many beneficiaries are generally satisfied with their current plan. Another explanation could be that many beneficiaries may find the process of comparing plans too challenging, are unaware of open enrollment, or have limited confidence in their ability to choose a better plan.

CMS encourages beneficiaries to shop around for plans each year to potentially save money or get new benefits. This is valuable advice, because private plans can vary significantly in premiums, deductibles and other cost sharing, provider and pharmacy networks, and drugs covered, among other features.

HIV, Intimate Partner Violence (IPV), and Women: An Emerging Policy Landscape

Authors: Lindsey Dawson, Jennifer Kates, and Amrutha Ramaswamy
Published: Dec 2, 2019

Issue Brief

Introduction

Women in the United States experience high rates of violence and trauma, including physical, sexual, and emotional abuse. Women with HIV, who represent about a quarter of all people living with HIV in the U.S., are disproportionally affected.1 ,2 ,3  Intimate partner violence (IPV), a term often used interchangeably with  domestic violence (DV), in particular, has been shown to be associated with increased risk for HIV among women, as well as poorer treatment outcomes for those already diagnosed.4 ,5  In addition, it has been suggested that women are at greater risk of experiencing violence upon disclosure of their HIV status to partners.6 

Given the role that IPV plays in HIV risk, transmission, and care and treatment, decreasing the prevalence of IPV and mitigating its effects is an important part of addressing the HIV epidemic among women in the United States. Policy changes, including those related to health care and coverage, represent one mechanism for addressing the intersection of HIV and IPV. After highlighting key statistics about IPV generally as well as the link between HIV and IPV, this brief will review key policy changes and initiatives that attempt to address these challenges.

Table 1: Key Terms and Definitions
TermDefinition
Intimate PartnerA romantic or sexual partner, including spouses, boyfriends, girlfriends, people with whom an individual dated, were seeing, or “hooked up.”
Contact Sexual ViolenceA combined measure that includes rape, being made to penetrate someone else, sexual coercion, and unwanted sexual contact.
StalkingInvolves a pattern of harassing or threatening tactics used by a perpetrator that is both unwanted and causes fear or safety concerns in the victim.
Physical ViolenceIncludes a range of behaviors from slapping, pushing or shoving to severe acts that include being hit with a fist or something hard, kicked, hurt by pulling hair, slammed against something, hurt by choking or suffocating, beaten, burned on purpose, or assaulted with a weapon.
Psychological AggressionIncludes expressive aggression (such as name calling, insulting or humiliating an intimate partner) and coercive control, which includes behaviors that are intended to monitor and control or threaten an intimate partner, including through digital technologies.
Reproductive CoercionIncludes forced or coerced sex, sabotage of contraception, or the forcible control of reproductive health by an abusive partner. Reproductive coercion can take the form of hiding, withholding, or destroying a partner’s contraceptives, and threats or acts of violence forcing a victim to have an abortion or carry a pregnancy to term.
SOURCES: CDC. National Intimate Partner and Sexual Violence Survey: 2015 Data Brief, November 2018;  Deshpande N, Lewis-O’Connor A, Screening for Intimate Partner Violence During Pregnancy, 2013; The American College of Obstetricians and Gynecologists (ACOG), Committee on Health Care and Underserved Opinion: Reproductive and Sexual Coercion, February 2013.

Key Statistics

Women in the United States experience high levels of violence, including sexual violence, across their lifetimes, with the most recent data indicating that approximately 44% of US women report ever having experienced unwanted sexual contact.7  Moreover, an estimated 36% of US women report ever having experienced contact sexual violence, physical violence, or stalking by an intimate partner in their lifetime.8 

Figure 1: Experience of Intimate Partner Violence and Women, Overall and with HIV

While IPV can and does occur among all groups, some groups face higher rates of violence. 57% of Multi-Racial Non-Hispanic women, 48% of American Indian/Alaska Native Non-Hispanic Women, and 45% of Black Non-Hispanic Women report facing IPV in their lifetimes (and those shares are likely to be under reported due to a variety of factors).9  Social class, LGBTQ identification, and disability status are also associated with higher rates of IPV. 10 ,11 ,12 

Overall, an estimated 26% of HIV-positive people are estimated to have experienced physically violence by a romantic or sexual partner and 17% are estimated to have been “threatened with harm or physically forced to have unwanted vaginal, anal, or oral sex”13 ; Among HIV positive women, IPV is even more prevalent, reported by 55% of women living with HIV.14  In addition to the traumatic impact IPV has on all women, the experience of trauma and violence is also associated with poor treatment outcomes and higher transmission risk among HIV positive women.15 ,16 

In many cases, the factors that put women at risk for contracting HIV are similar to those that make them vulnerable to experiencing trauma and IPV.  Women in violent relationships are at a four times greater risk for contracting STIs, including HIV, than women in non-violent relationships and women who experience IPV are more likely to report risk factors for HIV.17  A nationally representative study found 20% of HIV positive women had experienced violence by a partner or someone important to them since their diagnosis and of these, with half perceiving that violence to be directly related to their HIV serostatus.18  Indeed, these experiences are interrelated and can become a cycle of violence, HIV risk, and HIV infection (see Figure 2). In this cycle, women who experience IPV are at increased susceptibility for contracting HIV and HIV positive women are at greater risk of experiencing IPV.19 ,20 

Figure 2: Cycle of Violence, HIV Risk, and HIV Infection/Transmission

Key Policies Addressing Intimate Partner Violence: The ACA and Beyond

Several key policy changes have occurred in recent years that either directly or indirectly address IPV among women with HIV, particularly changes ushered in by the Affordable Care Act (ACA).

Policy Changes Under the ACA

The ACA, signed into law in 2010, expanded access to affordable health coverage and reduced the number of uninsured Americans through the creation of federal and state health insurance marketplaces and by expanding the Medicaid program, as well as through other reforms. In addition, there are several provisions that are specifically designed to protect individuals who have experienced IPV, including those with HIV. These include explicit protections in the law, as well as policy enacted through regulatory interpretation and guidance.

  • The elimination of pre-existing condition exclusions and premium rate setting based on health status, such as HIV, and other factors, including whether someone is a survivor of IPV. Prior to the ACA, non-group private health insurers could deny coverage based on pre-existing conditions, which could include conditions arising out of acts of domestic violence, such as post-traumatic stress disorder and sexually transmitted infections.21 ,22  While some states enacted comprehensive IPV related anti-discrimination insurance protections, not all did so. Under the ACA, pre-existing condition exclusions are prohibited and rates are permitted to vary only by age, geographic location, and smoking status. This provision is important for HIV positive domestic violence survivors who in the past could have faced denials or higher rates based on experience of IPV (or use of related health services), their gender, or their HIV status. However, individuals with non-ACA compliant plans, such as short-term limited duration (STLD) plans may be turned down for coverage or charged more if they have a health condition such as HIV or have a history of experiencing IPV (or using health services related to IPV experience).23 
  • Coverage of a range of no-cost preventive services for women including screening and counseling for IPV. Under the ACA, screening and counseling for IPV is a preventive service that must be covered without cost-sharing by most insurers, including most private health plans and all Medicaid expansion programs, in states that have expanded. While, there is no requirement that traditional state Medicaid programs provide no-cost IPV screenings as part of the state benefit package, they are encouraged to do so – if states choose to cover a suite of preventive services, they can seek a 1% increase in their federal matching rate for those services. As of June 2019, 15 states have elected this opportunity.24  Screening might occur during a routine office visit or well-woman exam and might entail a provider asking a patient about their current and past relationships. The Women’s Preventive Services Initiative (WPSI) recommends counseling if IPV/DV is disclosed, which can consist of assessing the patient’s safety, referring to mental health services, and providing linkage to support services and resources (Appendix Table 1).25  HIV screening and pre-exposure prophylaxis (PrEP), an HIV prevention medication (starting 2021), are also covered preventive services.
  • Allowance for married survivors of IPV to file taxes separately from their spouse and claim a premium tax credit. To help make insurance coverage more affordable, the ACA provides advanced premium tax credits to individuals between 100% and 400% of the federal poverty level who purchase private insurance through state and federal exchanges. Per the ACA, a married individual needs to file taxes jointly with their spouse to be eligible for premium tax credits which can help make health insurance coverage purchased through a marketplace more affordable. The Department of Treasury and Internal Revenue Service (IRS) issued guidance and subsequent regulations in April and July of 2014 that permit a survivor of IPV living apart from their spouse at the time of tax filing and unable to file a joint return, to claim a premium tax credit while using a married filing separately tax status for up to three consecutive years.26  Allowing survivors to file using this tax status and still obtain premium tax credits is designed to protect them from having to interact with an abuser at tax time while still being able to access insurance subsidies.
  • Special Enrollment Period for survivors of IPV. While enrollment in private health plans through the insurance marketplaces must typically occur during a specific open enrollment period in most cases, there are exceptions. Individuals experiencing certain qualifying events, such as a marriage, divorce, or birth of a child, may be granted a Special Enrollment Period (SEP) and permitted to enroll outside of the specified open enrollment window. In 2014, a limited 2-month SEP was created for spousal victims of IPV and their dependents and in 2015 the SEP was extended to include any member of a household who is a victim of intimate partner violence.27  The SEP applies to federally facilitated marketplaces; state-run marketplaces may optionally provide SEPs related to experience of IPV.
  • Non-grandfathered plans in the individual and small group markets and Medicaid expansion programs now cover mental health and substance use disorder services as one of ten “essential health benefit” categories. The ACA requires that individual and small group plans, sold both inside and outside the health insurance marketplaces, as well as Medicaid expansion plans, provide ten categories of essential health benefits including among others: ambulatory services; hospitalization; prescription drugs; and of note in this instance, mental health and substance use disorder services. Prior to this requirement, it was estimated that about one-third of those enrolled in individual market products lacked coverage for substance use services and about one in five were without coverage for mental health services.28  In addition, the ACA applies Mental Health Parity and Addiction Equity Act of 2008 standards to the individual and small group insurance markets which means that these services must now be covered at parity with medical and surgical benefits. Numerous studies have observed an association between IPV and an array of mental health conditions, including Post Traumatic Stress Disorder (PTSD), depression, and anxiety, among others.29 ,30  People with HIV experience mental health and substance misuse comorbidities at higher rates than the population overall.31 ,32 ,33  Similarly, the rate of substance misuse among women experiencing IPV is 26%, compared to 5% among those not experiencing.34  Access to mental health and substance use services, therefore, is an important component of comprehensive health coverage for many people living with HIV and particularly for those dealing with current or past IPV and trauma.
  • Maternal and child home visitation program includes focus on domestic violence. A 2013 study of 260 HIV positive women with a mean age of 46, found that 86% of those surveyed were mothers and 31% had children living at home.35  Given that a large share of women with HIV are likely to be parents and that women with HIV are disproportionately affected by IPV, home visits that include opportunities to address domestic violence could be particularly important for this population. The ACA established the Maternal, Infant, and Early Childhood Home Visiting (MIECHV) program, a grant program that provides states with resources to respond to the needs of children and families in at risk communities and includes specific opportunities to address domestic violence. The ACA provided the first five years of funding for the program. Participating states are required to demonstrate an improvement in 4 of 6 benchmarks, one of which is a reduction in crime or domestic violence with its performance measure being screening for IPV. In 2018, 82% of MIECHV caregivers were screened for IPV, up from 74% in 2017.36  In February 2018, the Program was allocated $400 million per year through fiscal year 2022 and in September 2018, 56 states, territories, and nonprofit organizations were awarded grants totaling approximately $361 million through the program.37 
  • Federal grant program to support pregnant teens and women, including those experiencing domestic and sexual violence, established under the Pregnancy Assistance Fund. The ACA also established a competitive grant program for states and tribes to support pregnant and parenting teens and women, allowing states to use funds to provide intervention and support services to pregnant women who are victims of domestic, sexual violence or stalking. The fund is also available to support the provision of assistance and training related to these issues for federal, state, local and other partners. In FY18, 25 grantees were awarded a total of $25 million. Of these, addressing domestic or interpersonal violence is specifically included in the project description provided on HHS.gov for six grantees.38 

Other Policy Initiatives

In addition to ACA-related changes, several other policy initiatives could also help address the intersection of HIV and IPV, including:

  • Reauthorization of The Violence Against Women Act.39  The Violence Against Women Act, first signed in 1994, dedicated over $1.5 billion in funding towards the investigation and prosecution of violent crimes against women and towards “victim’s services,” including, rape crisis centers, battered women’s shelters, and other sexual assault or domestic violence programs. These services are often the resources recommended by providers to those who screen positively for IPV (Appendix Table 1) VAWA has been reauthorized several times, most recently in 2013. The last authorization lapsed and expired in December of 2018. As of August 2019, the Violence Against Women Reauthorization Act of 2019 had been passed by the House, and is awaiting vote by the Senate.
  • The National HIV/AIDS Strategy. The National HIV/AIDS Strategy (NHAS), unveiled in 2010 under President Obama and updated in 2015 through 2020, has goals of reducing new HIV infections, increasing access to care and improving health outcomes for those living with HIV, reducing HIV-related disparities and health inequities, and achieving a more coordinated national response to the HIV epidemic. In order to reduce new HIV infections, NHAS recommends a combination of evidence-based approaches, including supporting and strengthening patient-centered IPV screening and linkage to services (housing, education, employment) for those who screen positively. To address the challenge posed by IPV for accessing and adhering to stable care, the NHAS suggests that a trauma-informed approach to care, which seeks to minimize the chances of re-traumatizing those who are trying to heal, may be applicable in an HIV care setting. The Trump administration is currently working on an updated version of the NHAS but it is not yet known whether addressing IPV will feature in the strategy.
  • “Ending the HIV Epidemic” Initiative In February of 2019, President Trump announced a new initiative with the goal of ending the HIV epidemic in the United States within 10 years.40  The Ending the HIV Epidemic proposal requests $291 million in the FY 2020 budget to begin the multiyear initiative. Although the plan does not specifically outline funding for those experiencing IPV or those with HIV at risk for IPV, the plan does aim to reduce new infections by 90% by 2030. Substantial localized planning will occur within the 48 counties, 7 states, Washington, D.C., and San Juan, Puerto Rico targeted in year one of the initiative. It is possible that addressing IPV as part of “ending HIV” strategy will feature to varying degrees across jurisdictions which will be charged with developing their own plans to reach the initiative’s goals.
  • Funding to address the intersection of IPV & HIV among women.41  In December 2019, the Health and Human Services’ (HHS) Office on Women’s Health (OWH) awarded new funding to community based organizations to “provide a community-level focus on the prevention of, screening for, and response to IPV and its intersection with HIV infection.” Awards totaling $3.1 million were provided to four organizations, each located in one of the jurisdictions prioritized in the Ending the HIV Epidemic initiative: University of Texas Southwestern Medical Center in Dallas, TX, University of North Texas Health Science Center in Fort Worth, TX, The Center for Women and Families, , in Louisville, KY, and the Institute of Women and Ethnic Studies, in New Orleans, LA.
  • Funding to provide HIV positive domestic violence survivors with housing. As part of a demonstration project, in 2016 the Departments of Justice and Housing and Urban Development awarded $9.2 million to eight local programs to provide stable housing to HIV positive survivors of domestic violence in an effort to prevent homelessness.42 

Looking Ahead

Addressing trauma and violence experienced by women with and at risk for HIV aims to provide care and support in the immediate term, but in the longer term, may also be an important contribution in combating the HIV epidemic. Key policy changes, including those ushered in by the ACA and other opportunities outlined above, provide important vehicles for targeted interventions to address IPV in HIV positive and at risk women.

Despite these policy changes, several challenges remain. With respect to screening and counseling for IPV, as with all preventive services, coverage does not necessarily equate with uptake by consumers or with the service being offered by providers. Inclusion of IPV/DV screening as a reimbursable service and the associated federal and advisory body recommendations may drive up some provision of the intervention but additional efforts may be necessary to generate more widespread provider led screenings. A 2017 study found that just 27% of reproductive age women have discussed IPV with a provider recently, demonstrating that these screenings are still relatively rare.43  (See Women’s Preventive Services Initiative (WPSI) for a compilation of IPV screening tools.)  In addition, maintaining confidentiality for women seeking violence-related care can sometime be a challenge and create barriers to access. Private insurance plans typically send an Explanation of Benefits (EOB) that documents provided services to the principal policy holder which may deter women from accessing services. In addition, mandated reporting of IPV in many states, including requirements for providers to file police reports or reports with a public health department or other state entity, may also deter women from seeking services.44   Beyond these challenges related to IPV more generally, there is also a need to raise awareness among providers and women at risk for and living with HIV about the interrelatedness between HIV and intimate partner violence.

Finally, as states make different policy decisions, particularly around the ACA, opportunities for enrollees vary across the nation. For example, whether states with state based marketplaces decided to implement the SEP for victims of IPV discussed above is one such policy decision. Additionally, states are still making decisions about whether to expand their Medicaid program to all those below 138% of the Federal Poverty Level (currently 37 states (including DC) have expanded), and this has significant implications for access to coverage for low-income individuals. Given that multiple studies have demonstrated that HIV and IPV both trend with poverty, access to Medicaid expansion, including the associated IPV screening, could play a particularly important role for these populations.45  In addition, access to services, varies by coverage and as noted, IPV screening is not a required covered service for those in traditional Medicaid.

Key provisions under the ACA as well as other policy developments discussed above could present significant opportunities to address IPV, for both women living with HIV as well as those at risk. At the same time, efforts to eliminate all or parts of the ACA could remove many of these protections.

Appendix

Appendix Table 1: Resources for Addressing Intimate Partner Violence
NameContact
National Domestic Violence Hotline800-799-7233 or 800-799-SAFETTY: 800-787-3224www.thehotline.org
National Dating Abuse Helpline866-331-9474Text “loveis” to 22522www.loveisrespect.org
National Sexual Assault Hotline800-656-4673 or 800-656-HOPEhttps://rainn.org
The Northwest Network (LGBT Resources)206-568-7777www.nwnetwork.org
National Child Abuse Hotline800-422-4453 or 800-4-A-CHILDwww.childhelp.org
National Suicide Prevention Lifeline800-273-8255https://suicidepreventionlifeline.org
SOURCE: Miller E, McCaw B, Intimate Partner Violence, February 2019.

Endnotes

  1.   Centers for Disease Control and Prevention (CDC), National Intimate Partner and Sexual Violence Survey: 2015 Data Brief, November 2018. ↩︎
  2. CDC, Intersection of Intimate Partner Violence and HIV in Women, February 2014. ↩︎
  3. CDC, Behavioral and Clinical Characteristics of Persons Living with Diagnosed HIV Infection – Medical Monitoring Project, United States, 2016 Cycle, February 2019. ↩︎
  4. CDC, Intersection of Intimate Partner Violence and HIV in Women, February 2014. ↩︎
  5. E. L. Machtinger, J. E. Haberer, T. C. Wilson, and D. S. Weiss. Recent Trauma is Associated with Antiretroviral Failure and HIV Transmission Risk Behavior Among HIV-Positive Women and Female-Identified Transgenders, AIDS and Behavior. 16:8(2012): 2160–2170. ↩︎
  6. A.C. Gielen, K.A. McDonnell, J. G. Burke, and P. O’Campo. Women’s Lives After an HIV-Positive Diagnosis: Disclosure and Violence. Maternal and Child Health Journal. 4:2(2000):111-119. ↩︎
  7. CDC, National Intimate Partner and Sexual Violence Survey: 2015 Data Brief, November 2018. ↩︎
  8. CDC, National Intimate Partner and Sexual Violence Survey: 2015 Data Brief, November 2018. ↩︎
  9. CDC, National Intimate Partner and Sexual Violence Survey: 2010-2012 State Report, April 2017. ↩︎
  10. C. Renzgetti, Economic Stress and Domestic Violence, September 2009. ↩︎
  11. The Williams Institute, Intimate Partner Violence and Sexual Abuse Among LGBT People: A Review of Existing Research, November 2015. ↩︎
  12. J.W. Hahn, M.C. McCormick, J.G. Silverman, E.B. Robinson, K.C. Koenen, Examining the impact of disability status on intimate partner violence victimization in a population sample, November 2014. ↩︎
  13. CDC, Behavioral and Clinical Characteristics of Persons Living with Diagnosed HIV Infection – Medical Monitoring Project, United States, 2016 Cycle, February 2019. ↩︎
  14. E. L. Machtinger, T. C. Wilson, J. E. Haberer, and D. S. Weiss, Psychological Trauma and PTSD in HIV-Positive Women: A Meta-Analysis, AIDS and Behavior. 16:8(2012): 2091-2100. ↩︎
  15. R. A. C. Siemieniuk, et al. The Clinical Implications of High Rates of Intimate Partner Violence Against HIV-Positive Women. JAIDS: Journal of Acquired Immune Deficiency Syndromes. 64:1(2013): 32-38. ↩︎
  16. E. L. Machtinger, J. E. Haberer, T. C. Wilson, and D. S. Weiss. Recent Trauma is Associated with Antiretroviral Failure and HIV Transmission Risk Behavior Among HIV-Positive Women and Female-Identified Transgenders, AIDS and Behavior. 16:8(2012): 2160–2170. ↩︎
  17. CDC, Intersection of Intimate Partner Violence and HIV in Women, February 2014. ↩︎
  18. S. Zierler, et al. “Violence Victimization After HIV Infection in a U.S. Probability Sample of Adult Patients in Primary Care.” American Journal of Public Health. 90:2(2000): 208-215. ↩︎
  19. E. L. Machtinger, T. C. Wilson, J. E. Haberer, and D. S. Weiss. “Psychological Trauma and PTSD in HIV-Positive Women: A Meta-Analysis.” AIDS and Behavior. 16:8(2012): 2091-2100. ↩︎
  20. CDC, Intersection of Intimate Partner Violence and HIV in Women, February 2014. ↩︎
  21. U.S. Congress. United States Code, Title XXVII, The Public Health Service Act. Enacted October 2009. ↩︎
  22. T. Kertscher. Politifact: Wisconsin. Sexual assault, domestic violence themselves are not pre-existing conditions under GOP health bill. May 9, 2017.  https://www.politifact.com/wisconsin/statements/2017/may/09/gwen-moore/sexual-assault-domestic-violence-themselves-are-no/ ↩︎
  23. L. Dawson and J. Kates, Kaiser Family Foundation (KFF), Short-Term Limited Duration Plans and HIV, June 2018. ↩︎
  24. Kaiser Family Foundation communication with CMS. ↩︎
  25. Women’s Preventive Services Initiative (WPSI), Recommendations for Preventive Services for Women: Final Report to the U.S. Department of Health and Human Services, Health Resources & Services Administration, December 2016. ↩︎
  26. Internal Revenue Service (IRS), Final and Temporary Regulations, Rules Regarding the Health Insurance Premium Tax Credit, 79 FR 43622. July 2014. IRS, Notice 2014–23: Eligibility for Premium Tax Credit for Victims of Domestic Abuse, April 2014. ↩︎
  27. CMS, Updated Guidance on Victims of Domestic Abuse and Spousal Abandonment, July 2015. ↩︎
  28. K. Beronio, R. Po, L. Skopec, and S. Glied. Office of the Assistant Secretary for Planning and Evaluation (ASPE), U.S. Department of Health and Human Services, Affordable Care Act Expands Mental Health and Substance Use Disorder Benefits and Federal Parity Protections for 62 Million Americans, February 2013. ↩︎
  29. M. Okuda, et al, Mental Health of Victims of Intimate Partner Violence: Results From a National Epidemiologic Survey, Psychiatric Services. 62:8 (2011),959-62. ↩︎
  30. G. Dillon, R. Hussain, D. Loxton, and S. Rahman, Mental and Physical Health and Intimate Partner Violence Against Women: A Review of the Literature, International Journal of Family Medicine, vol.2013. ↩︎
  31. E. L. Machtinger, T. C. Wilson, J. E. Haberer, and D. S. Weiss, Psychological Trauma and PTSD in HIV-Positive Women: A Meta-Analysis, AIDS and Behavior. 16:8(2012): 2091-2100. ↩︎
  32. J. Kates, Kaiser Family Foundation, Medicaid and HIV: A National Analysis, October 2011. ↩︎
  33. E.G. Bing, et al, Psychiatric Disorders and Drug Use Among Human Immunodeficiency Virus-Infected Adults in the United States, Archives of General Psychiatry. 58:8(2001),721-8. ↩︎
  34. E.A. Rivera, et al, An Applied Research Paper on the Relationship Between Intimate Partner Violence and Substance Abuse, February 2016. ↩︎
  35. A. R. Webel, et al, The Impact of Social Context on Self-Management in Women Living with HIV, Social Science & Medicine. 87 (2013): 147–154. ↩︎
  36. Health Resources Service Administration, Maternal, Infant, and Early Childhood Home Visiting Program, September 2019. ↩︎
  37. HRSA, Maternal and Child Health, Home Visiting, July 2019. ↩︎
  38. Office of Population Affairs (OPA), HHS, Current Pregnancy Assistance Fund Grantees, 2019. ↩︎
  39. H.R.1585, Violence Against Women Reauthorization Act of 2019, 116th Congress, March 2019. ↩︎
  40. Minority HIV/AIDS Fund, HHS, What is ‘Ending the HIV Epidemic: A Plan for America’?, September 2019. ↩︎
  41. Minority HIV/AIDS Fund, HHS, Office on Women’s Health Awards $3M to Support Prevention and Screening of Intimate Partner Violence and HIV in Women, December 2019. ↩︎
  42. U.S. Department of Justice (DoJ), Departments of Justice and Housing and Urban Development Award $9.2 Million to Provide Stable Housing to Victims of Domestic Violence Living with HIV/AIDS, June 2016. ↩︎
  43. U. Ranji, C. Rosenzweig, I. Gomez, and A. Salganicoff, Kaiser Family Foundation, Overview: 2017 Kaiser Women’s Health Survey, March 2018. ↩︎
  44. Futures Without Violence, Compendium of State and U.S. Territory Statutes and Policies on Domestic Violence and Health Care, 2013. ↩︎
  45. See for example: J. Kates, et al. Kaiser Family Foundation, Assessing the Impact of The Affordable Care Act on Health Insurance Coverage of People With HIV January 2014; M. L. Benson and G. Litton Fox. National Institute of Justice DoJ, When Violence Hits Home: How Economics and Neighborhood Play a Role, September 2004; B.E. Carlson, A. Pollitz Worden, M. van Ryn, and R. Bachman, Report for the U.S. Department of Justice, Violence Against Women: Synthesis of Research for Practioners, September 2003.     ↩︎

The Kaiser Family Foundation/Washington Post Climate Change Survey

Authors: Liz Hamel, Lunna Lopes, Cailey Muñana, and Mollyann Brodie
Published: Nov 27, 2019

Overview

The latest partnership survey from the Kaiser Family Foundation and The Washington Post examines the public’s views, awareness, and preferences related to climate change. The poll assesses the public’s belief in whether human activity is causing the climate to change, as well as levels of concern and support for policy solutions to address climate change. It also probes the public’s willingness to accept the types of trade-offs that are associated with policy solutions, and finds that there are limits to public support and engagement on this issue. A companion survey of U.S. teens explores how this age group views the issue of climate change and its potential impact on their generation.

This survey is the 34th in a series of surveys dating back to 1995 that have been conducted as a part of The Washington Post/Kaiser Family Foundation Survey Project.

Read The Washington Post’s reporting:

Americans increasingly see climate change as a crisis, poll shows

Most American teens are frightened by climate change, poll finds, and about 1 in 4 are taking action

Americans would rather reduce oil and gas exploration than ‘drill, baby, drill’

Regional weather patterns are viewed through partisan lenses, poll finds

Americans like Green New Deal’s goals, but they reject paying trillions to reach them

Americans broadly accept climate science, but many are fuzzy on the details

Main Findings

Executive Summary

The latest partnership survey from the Kaiser Family Foundation and The Washington Post examines the public’s views, awareness, and preferences related to climate change. Like surveys conducted by other organizations, our poll finds high levels of concern and support for policy solutions to address climate change. In this poll, we also probed the public’s willingness to accept the types of trade-offs that are inevitably associated with policy solutions, and find that there are limits to public support and engagement on this issue. The poll finds that eight in ten U.S. adults believe that human activity is causing changes to the world’s climate, and two-thirds think the U.S. government is doing too little to reduce greenhouse gas emissions. Yet while many see climate change as an urgent issue, most are not discussing it often with their family and friends, and most are not willing to make personal sacrifices such as paying higher taxes at the gas pump or on their electric bills. While majorities of Democrats, Republicans, and independents agree that human-caused climate change is happening, there are large divisions in how partisans view the urgency of the issue and potential solutions.

1 in 4 Americans donated money to charity or otherwise acted to express their climate change views. 1 in 4 teens took part in a climate-change protest, rally or school walkout, or otherwise engaged on the issue. More in new @KFF/@WashingtonPost poll

The survey also included a sample of U.S. teens ages 13-17, and finds that most teens view climate change as an important issue. However, rather than standing out as a singularly important issue for teens, it is one of many issues they view as important. About one quarter of teens report engaging politically on the issue of climate change (by participating in a protest or school walk-out, or contacting a government official), but teens are less likely than adults to say they regularly discuss the topic with friends.

This survey is the 34th in a series of surveys dating back to 1995 that have been conducted as a part of The Washington Post/Kaiser Family Foundation Survey Project.

Key Findings

Majorities of U.S. adults across parties believe human-caused climate change is happening, but Republicans are much more doubtful about the seriousness of the problem. Large majorities of Democrats (90%) and independents (82%) and a solid majority of Republicans (60%) agree that human activity is causing changes to the world’s climate, including an increase in average temperature. However, Democrats and independents are much more likely to be firm in their beliefs: 59% of Democrats and 43% of independents say they are very certain that human activity is causing climate change, compared to one in five Republicans. Moreover, a majority (56%) of Republicans say that when it comes to what is said in the news, the seriousness of global warming and climate change is generally exaggerated, while most Democrats say the seriousness of the problem is generally correct (48%) or generally underestimated (46%).

Figure 1: Majority Of Adults Believe In Human-Caused Climate Change, But Certainty Varies Across Partisanship

There are signs of increasing urgency around climate change, but also skepticism of government intervention. Thirty-eight percent of the public now calls climate change a “crisis,” up from 23% in a PRRI poll from 2014, driven by an increase among Democrats and independents. About half (52%) think that people need to act within the next 10 years to prevent the worst effects of climate change, or that it is already too late. Seven in ten are worried that climate change will cause harm to the health of people living in the U.S., and majorities say that businesses and corporations (72%), the U.S. government (67%), energy companies (65%), and their state government (60%) are doing too little to reduce greenhouse gas emissions. Despite this apparent sense of urgency and desire for action, people are skeptical of government intervention. Six in ten are worried that government regulations and taxes aimed at addressing climate change will cause financial stress for ordinary Americans, and about half (51%) are worried such government intervention will hurt the U.S. economy.

Figure 2: Share Who See Climate Change As A Crisis Has Increased Since 2014, Driven By Democrats And Independents
Figure 3: Public Worries About Health Effects Of Climate Change, But Also About Economic Consequences Of Government Action

Climate change is not a frequent subject of dinner table conversations for most Americans, and few adults report any political engagement on the issue. About half of adults say they rarely or never discuss climate change with their family members (53%) or friends (54%), and just about one in ten say they often discuss the topic with either group (12% and 10%, respectively). Small shares say they have donated money to a charity working to address climate change (17%), contacted a government official (12%), or participated in a protest, rally, or other event (9%) to express their views on climate change.

Figure 4: Most Say They Rarely Or Never Discuss Climate Change With Family And Friends

Few U.S. adults are willing to make personal sacrifices in the form of higher gas or electricity taxes in order to address climate change. Fewer than four in ten adults (37%) think that reducing the negative effects of global warming and climate change will require major sacrifices from ordinary Americans, while a plurality (48%) think it will require minor sacrifices and 14% say it won’t require much sacrifice at all. Majorities are willing to support raising taxes on wealthy households (68%) and on companies that burn fossil fuels, even if it may lead to increased electricity and transportation prices (60%), as ways to pay for policies aimed at reducing U.S. greenhouse gas emissions. But when it comes to taxes that are likely to hit consumers’ pocketbooks, support is much lower. About half (51%) oppose a $2 monthly tax on U.S. residential electric bills, and seven in ten (71%) are opposed to such a tax at the $10 a month level. Similarly, majorities oppose increasing the federal gasoline tax by 10 cents or 25 cents per gallon (64% and 74%, respectively). There are partisan divisions, but even majorities of Democrats oppose a $10 monthly electricity tax (60%) and a 25-cent per gallon gasoline tax (63%).

Figure 5: Most Support Taxing Wealthy Households, But Oppose Increasing Taxes On Gas, Electricity To Support Climate Policies

Democrats have an edge over Republicans when it comes to the issue of climate change, though majorities say both parties are doing too little. Democrats have a 21-percentage point advantage over Republicans in trust to handle climate change (38% vs. 17%), though a substantial 35% of the public say they trust neither party. Notably, majorities say that President Trump (66%), the Republican Party (69%), and the Democratic Party (56%) are doing too little to reduce greenhouse gas emissions. Two-thirds (67%) disapprove of President Trump’s handling of climate change (his lowest rating out of six issues tested), and a similar share (66%) disapprove of his plan to roll back fuel efficiency standards put in place by the Obama administration.

Figure 6: Democrats Have Advantage On Trust To Handle Climate Change, But One-Third Trust Neither Party

While most U.S. teens see climate change as an important issue, it does not stand out as a singular defining issue for their generation. Like adults, a large majority of teens (86%) believe that human-caused climate change is happening, though just under half (46%) are very certain. Six in ten teenagers (61%) say the issue of climate change is very or extremely important to them personally, making it one of many issues that teens view as important. Notably, about a third of teens (34%) say climate change is an extremely important issue, but rather than standing out as the top issue for teens, climate change ranks similarly to health care (38%), gun policy (35%), and the economy (32%). Teens (39%) and young adults ages 18-29 (43%) are about 10 percentage points more likely than adults ages 30 and older to say climate change will cause a great deal of harm to people in their generation. But like adults, teens are more likely to see climate change as a problem affecting future generations rather than their own (63% of teens and 60% of adults say future generations will be harmed a great deal).

Figure 7: Climate Change One Of Many Important Issues For Both Teens And Adults

The issue of climate change evokes a variety of emotions for teens, though young adults are even more likely than teens to say they feel afraid, motivated, helpless, and guilty. Majorities of teens say the issue of climate change makes them feel “afraid” (57%), “motivated” (54%), and “angry” (52%). About four in ten (43%) say they feel “helpless” (vs. 53% of adults), while a smaller share (29%) say they feel “optimistic.” Young adults ages 18-29 are the age group most likely to express a variety of emotions when it comes to climate change, including “afraid” (68%), “motivated” (66%), “helpless” (66%), and “guilty” (54%). Like adults, most teens say they rarely or never discuss climate change with their family. Moreover, teens are 8 percentage points less likely than adults to say they at least occasionally discuss the issue with friends (38% vs. 46%).

Figure 8: Most Teens, Young Adults Say Climate Change Makes Them Feel Afraid, Motivated, Angry; Young Adults Most Likely To Feel Helpless

Most teens feel they can make a difference when it comes to climate change, and about a quarter report engaging politically on the issue. Almost two-thirds of teens who believe in human-caused climate change (55% of all teens) say they feel that there are things they can do personally to make a difference when it comes to reducing the effects of climate change. About four in ten teens (41%) say they have taken action to reduce their own carbon footprint. In addition, about one-quarter report engaging in some type of political action in the past 3 years to express their views on climate change; this includes 15% who say they’ve participated in a school walk-out, 13% who have participated in a protest or rally, and 12% who have contacted a government official. Some groups of teens are more likely than others to report engaging in political action around climate change, including those who are Black (33%) or Hispanic (30%), older teens ages 16-17 (31%), and those who identify as Democrats or lean Democratic (30%).

Figure 9: About One In Four Teens Say They Have Taken Some Action To Express Their Views On Climate Change In Past Three Years

Hispanic teens (and to a lesser extent, Black teens) stand out as particularly concerned and particularly active on the issue of climate change. In addition to being more likely to engage in political action, Black (37%) and Hispanic (41%) teens are more likely than White teens (24%) to think people need to act within the next year or two in order to prevent the worst effects of climate change. Hispanic teens (44%) are also more likely than White (32%) or Black (25%) teens to say climate change is an extremely important issue to them personally. Furthermore, Hispanic teens are more likely than White teens to say the issue makes them feel afraid (65% vs. 53%), angry (61% vs. 48%), guilty (51% vs. 38%), and helpless (50% vs. 39%).

Figure 10: Older, Black And Hispanic, And Democratic Leaning Teens Most Likely To Engage Politically On Climate Change

About half of teens say they have learned about the causes of climate change in school, yet some misconceptions about major contributors to climate change remain. Fifty-four percent of teens say they have learned at least a moderate amount about the causes of climate change in school, while 46% say they have learned about ways to reduce the effects of climate change. The share saying they have learned “a lot” about ways to reduce the effects of climate change has decreased somewhat since a similar survey of teens conducted in 2010 (from 25% to 14%). Six in ten teens recognize deforestation (62%), cars and trucks (62%), and burning fossil fuels for heat and electricity (61%) as major contributors to climate change, while fewer recognize airplane travel (30%) and cattle farming (18%) as major contributors. At the same time, about four in ten teens (39%) mistakenly believe that “the sun getting hotter” is a major contributor to climate change, and one in five think volcanic eruptions are a major contributor.

Figure 11: Share Of Teens Saying They Have Learned A Lot In School About Ways To Reduce Climate Change Has Declined Since 2010

Views On The Green New Deal

In February 2019, Representative Alexandria Ocasio-Cortez of New York and Senator Edward J. Markey of Massachusetts introduced the Green New Deal resolution calling on the federal government to dramatically reduce fossil fuel use and guarantee clean energy jobs. The survey finds that few Americans are familiar with the Green New Deal, though Republicans are more likely to have heard about it than Democrats. While the public likes many of the proposal’s goals, they oppose the increase in federal spending that would likely be needed to support them.

The Green New Deal is largely unknown to the public, with just about one in five saying they have heard a great deal (7%) or a good amount (15%) about the proposal. Republicans (33%) are twice as likely as Democrats (16%) to say they’ve heard at least a good amount, suggesting that anti-Green New Deal messaging has gotten more exposure than supportive messaging at this point.

Figure 1: Most Have Heard Little To Nothing About The Green New Deal

Six in ten adults (59%) say they haven’t heard enough to have an opinion of the Green New Deal, but among those who’ve heard at least a good amount, nearly six in ten are opposed.

Figure 2: Most Haven’t Heard Enough About GND To Have An Opinion, 6/10 Of Those Who’ve Heard More Are Opposed

Among those who’ve heard at least a little about the Green New Deal proposal, four in ten say it’s realistic and just over half (53%) say it’s not realistic, including 26% of Democrats, 59% of independents, and 84% of Republicans.

Figure 3: Partisans Divide On Whether Green New Deal Is Realistic

Substantial majorities of the public say they would support the Green New Deal if they heard it would guarantee jobs with good wages for all U.S. workers (78%), upgrade all buildings in the U.S. to increase energy efficiency (70%), set a goal for 100% of U.S. power coming from zero-emission energy sources within ten years (69%), provide all people in the U.S. with health care through a new government program (68%), and increase federal spending on infrastructure to help communities prepare for climate change-related disasters (67%). Yet support drops to just 30% if the proposal would increase federal spending by trillions of dollars.

Figure 4: Many Aspects Of Green New Deal Are Popular, But Not Large Increase In Federal Spending

There does not appear to be an appetite among the public for increasing the national debt in order to pay for climate-related policies such as the Green New Deal. Nearly six in ten (57%) say they oppose adding to the national debt in order to pay for policies aimed at reducing greenhouse gas emissions in the U.S., rising to 66% when initial supporters are told that the debt currently stands at around $22 trillion.

Figure 5: Two-Thirds Oppose Adding To National Debt To Pay For Policies Aimed At Reducing Emissions After Hearing Debt Is $22 Trillion

Politics And Regional Differences

Many previous surveys have found that Americans’ views on climate change divide along partisan lines. In this survey, we explore how those divisions relate to political preferences, and also how partisanship interacts with people’s views of the role of climate change in extreme weather events. This section takes advantage of a unique element of this survey: the oversample of people living in several regions of the U.S. that have experienced extreme weather events like hurricanes, flooding, drought, and wildfires over the past several years.

Majorities across parties say they want the next president to support government action on climate change, but it’s a much lower priority for Republicans than for Democrats. Large majorities of Democrats (91%) and independents (79%), and even a slim majority of Republicans (53%), say that they would like the next president to be someone who favors government action on climate change, suggesting that President Trump’s position on the issue is out of step with the mainstream. However, while 42% of Democrats see this as an extremely important issue to their vote – putting it on par with issues like abortion access (39%) and preserving the ACA (38%) – just 12% of Republicans say the same, ranking it far behind issues like support for a border wall (48%) and restricting abortion access (34%).

Figure 1: In Electing Next President, Climate Change Ranks As High Priority For Democrats, Low Priority For Republicans

Nationally and across regions, Democrats and Republicans have very different views of severe weather events in their area and the role climate change plays. Nationwide, about two-thirds (65%) of adults think extreme weather events are becoming more severe, but this masks a massive partisan difference, with Democrats almost twice as likely as Republicans to believe this is the case (81% vs. 43%).

Figure 2: Most Democrats And Independents Say Extreme Weather Events Becoming More Severe, Republicans Say Staying The Same

The partisan divide on views of extreme weather is even starker when looking at the share who believe weather is becoming more severe and that climate change is mostly to blame: 43% of Democrats versus 9% of Republicans think this is true.

Figure 3: Public, Partisans Divided On Cause Of Extreme Weather Events

Partisan gaps also exist in perceptions of extreme weather in one’s own local area. When drilling down into regions that have been hard hit by extreme weather events, there are huge partisan gaps in attitudes about climate change’s role in these events. For example, in the Southwest, 58% of Democrats and Democrat-leaning independents versus just 17% of Republicans and Republican-leaning independents say that the area where they live has experienced wildfires in the past 5 years and that climate change is a major factor causing these fires. Similarly, in the Southeast/Gulf Coast region, those who identify as or lean Democrat are about three times as likely as Republican-leaners to say climate change is a major factor contributing to severe storms such as hurricanes in their area in the past 5 years (61% vs. 21%)1 .

Figure 4: Large Partisan Divides In Perceptions Of Role Of Climate Change In Local Weather Events Within Regions

Knowledge And Actions

What does the public understand about the major contributors to climate change, and what actions do they report taking to reduce their own carbon footprints?

Most adults have a pretty good gauge on the major contributors to climate change, but some misperceptions exist. Majorities of the public recognize deforestation (63%), automobiles (58%), and burning fossil fuels for heat and electricity (56%) as major causes of climate change. Fewer recognize the major contribution of airplane travel (24%), cattle farming (21%), and cement manufacturing (15%). On the other hand, 43% think that plastic bottles and bags are a major contributor to climate change, when in fact they play more of a minor role compared to other factors. Substantial shares think other non-related factors such as “the sun getting hotter” (37%), volcanic eruptions (19%), and water usage (18%) are major contributors.

Figure 1: Knowledge Among U.S. Adults Mixed When It Comes To Major Contributors To Climate Change And Global Warming

About half of adults say they have taken action to reduce their own carbon footprint, with a range of actions reported. About half (53%) of U.S. adults say they have taken actions to reduce their own carbon footprint in the past 2 years. Some of the actions people report taking target the major contributors of climate change: 20% report driving less, 14% use less electricity at home, 9% use a more fuel-efficient car, and 3% purchase electricity from a renewable source. However, some report actions that, while good for the environment, are less likely to make a major dent in climate change: 20% say they recycle, 7% reduce plastic use, 6% mention conserving water, and 4% mention using reusable items like bags, containers, and straws.

Figure 2: About Half Report Taking Actions To Reduce Carbon Footprint

Methodology

The Washington Post-Kaiser Family Foundation Survey Project is a partnership combining survey research and reporting to better inform the public. The Post-KFF Climate Change Survey, the 34th in the series, was conducted with a probability-based sample of 2,293 adults ages 18 and over and 629 teens between the ages of 13 and 17. Interviews were administered online and by telephone from July 9 through August 5, 2019 in English and Spanish.

NORC at the University of Chicago conducted sampling, interviewing, and tabulation for the survey using the AmeriSpeak Panel, a representative panel of adults age 18 and over living in the United States. AmeriSpeak Panel members are recruited through probability sampling methods using the NORC National Sample Frame, an address-based sampling frame. Panel members who do not have internet access complete surveys via telephone, and internet users complete surveys via the web (for the current study, 303 adults and 8 teens completed via phone; 1,990 adults and 621 teens via web). In order to allow for separate regional analysis, adult panelists living in the following regions were selected at disproportionately higher rates: Southwest (Arizona, New Mexico, Nevada, Utah, Colorado); Upper Mountain West/Midwest (Minnesota, North Dakota, South Dakota, Montana, Idaho); New England (Maine, New Hampshire, Vermont, Massachusetts, Connecticut, Rhode Island); and Southeast (Florida, Georgia, South Carolina, North Carolina, Alabama, Mississippi, Louisiana, Texas gulf coast counties: Orange, Jefferson, Chambers, Galveston, Harris, Brazoria, Matagorda, Jackson, Calhoun, Victoria, Refugio, Aransas, San Patricio, Nueces, Kleberg, Kenedy, Willacy, Cameron).

Fully enrolled teens (i.e., those for whom NORC has obtained parent consent, teen assent, and a complete teen profile) were eligible for sampling and recruitment from NORC’s AmeriSpeak Teen Panel, a probability-based panel of teens recruited via parents in the AmeriSpeak adult panel.

The combined results for teens and adults have been adjusted to weight oversampled geographic areas back to their accurate share of the adult population and to account for systematic nonresponse along known population parameters.

For adults, the first weighting stage made adjustments to account for the regional oversampling and for differential nonresponse to the survey screening interview. In the second weighting stage, the sample was adjusted to match known demographic distributions of the U.S. population using the following parameters: age, sex, education, race/ethnicity, and Census Division. Interviews in the oversampled regions were also weighted to match demographics within those regions. Region-level population benchmarks were obtained from the U.S. Census Bureau’s American Fact Finder for race/ethnicity and from the U.S. Census Bureau’s 2017 American Community Survey (ACS) for all other benchmarks.

The teen sample was weighted using a similar procedure, except that there was no regional oversampling for the teen sample so no oversample adjustment was needed. Demographic benchmarks for teens were obtained from the 2017 ACS for age, sex, parents’ highest education, race/ethnicity, and Census Division.

The margin of sampling error including the design effect for the full sample is plus or minus 3 percentage points for adults and 5 percentage points for teens. All statistical tests of significance account for the effect of weighting. For results based on other subgroups, the margin of sampling error may be higher. Sample sizes and margins of sampling error for other subgroups are available by request. Note that sampling error is only one of many potential sources of error in this or any other public opinion poll.

This questionnaire was administered with the exact questions in the exact order as appears in this document; question numbering may not be sequential. If a question was asked of a reduced base of the sample, a parenthetical preceding the question identifies the group asked.

The Kaiser Family Foundation and The Washington Post paid for the survey and representatives of The Washington Post and the Kaiser Family Foundation worked together to develop the survey questionnaire and analyze the results. Each organization bears the sole responsibility for the work that appears under its name. The project team from the Kaiser Family Foundation included: Mollyann Brodie, Ph.D., Liz Hamel, Lunna Lopes, and Cailey Muñana. The project team from The Washington Post included: Scott Clement and Emily Guskin. Both The Washington Post and the Kaiser Family Foundation Public Opinion and Survey Research team are charter members of the Transparency Initiative of the American Association for Public Opinion Research.

Endnotes

  1. Southwest includes California, Arizona, New Mexico, Nevada, Utah, and Colorado. Upper Mountain West/Midwest includes Minnesota, North Dakota, South Dakota, Montana, Idaho. Upper Northeast includes Maine, New Hampshire, Vermont, Massachusetts, Connecticut, Rhode Island, New York, and New Jersey. Southeast includes Florida, Georgia, South Carolina, North Carolina, Alabama, Mississippi, Louisiana, and the gulf coast counties of Texas (Orange, Jefferson, Chambers, Galveston, Harris, Brazoria, Matagorda, Jackson, Calhoun, Victoria, Refugio, Aransas, San Patricio, Nueces, Kleberg, Kenedy, Willacy, and Cameron counties). ↩︎