Key Findings
- The latest KFF Health Tracking Poll finds majorities of the public saying many current health care proposals being discussed by lawmakers are important priorities for Congress to focus on in the coming months, and few (less than one five) saying each of the health priorities “should not be done.” While majorities of the public say each of the health care priorities asked about is important for Congress to work on, proposals aimed at lowering prescription drug prices are a top priority for Democrats, independents, and Republicans.
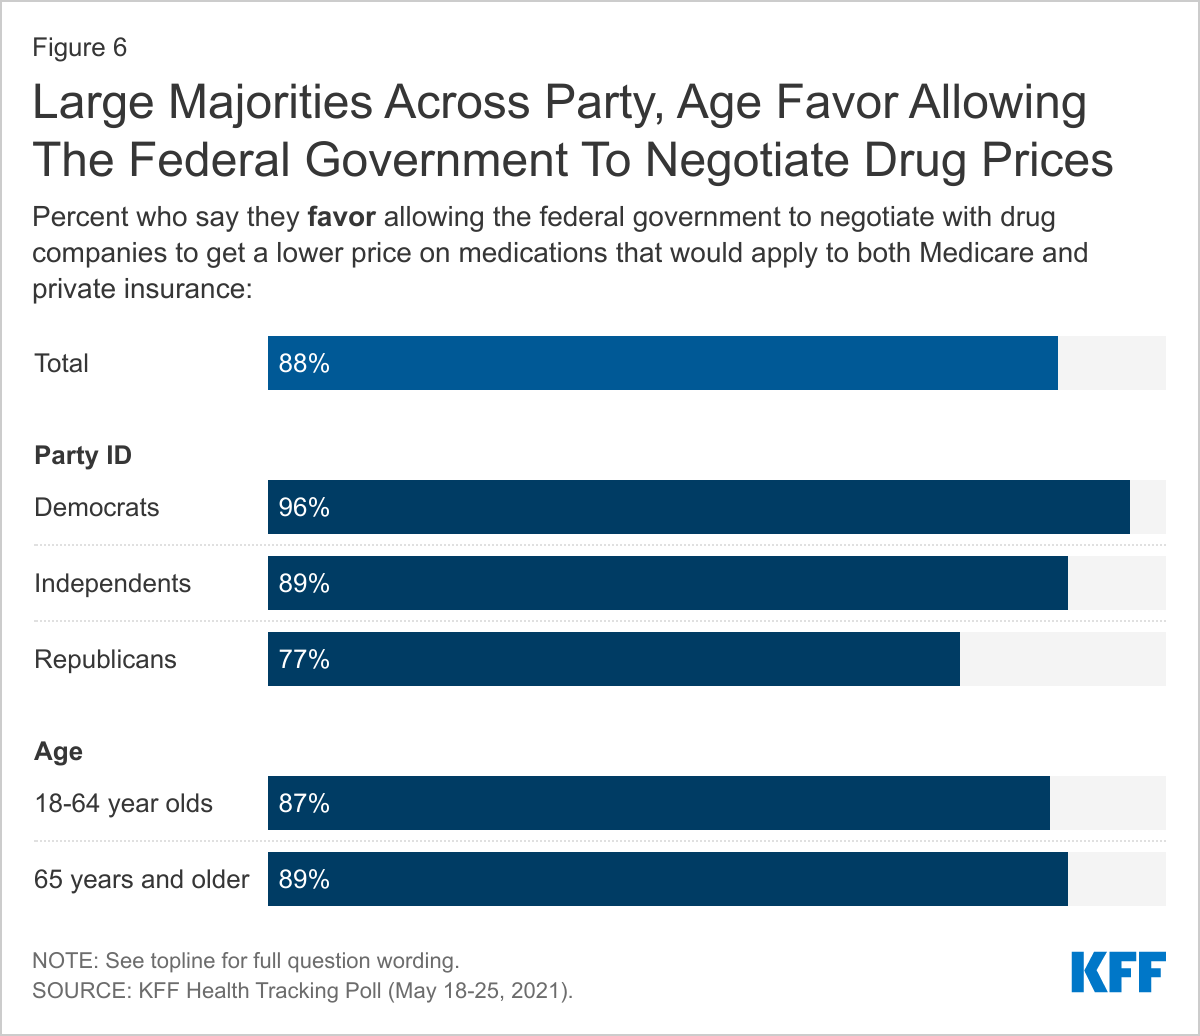
- Overall, nearly nine in ten (88%) favor allowing the federal government to negotiate for lower prices on medications, including three-fourths (77%) of Republicans, nine in ten independents (89%) and 96% of Democrats. And while majorities of the public continue favoring this proposal after hearing that people and the federal government could save money on their prescription drugs if this policy were implemented, majorities oppose this policy proposal when the public hears argument made by pharmaceutical companies that it could lead to less research and development for new drugs, or that access to newer prescriptions could be limited.
- The COVID relief bill passed in early March 2021 provided additional financial assistance to people who buy their own health insurance. The vast majority of those who are eligible for this financial assistance are either unsure whether the COVID-19 relief package included this financial assistance (82%) or say it did not happen (9%), while about one in ten (9%) are aware of this increased financial assistance. Additionally, only a small minority of those potentially eligible for additional financial help or coverage report going online to see if they qualify for a different or cheaper health insurance plan.
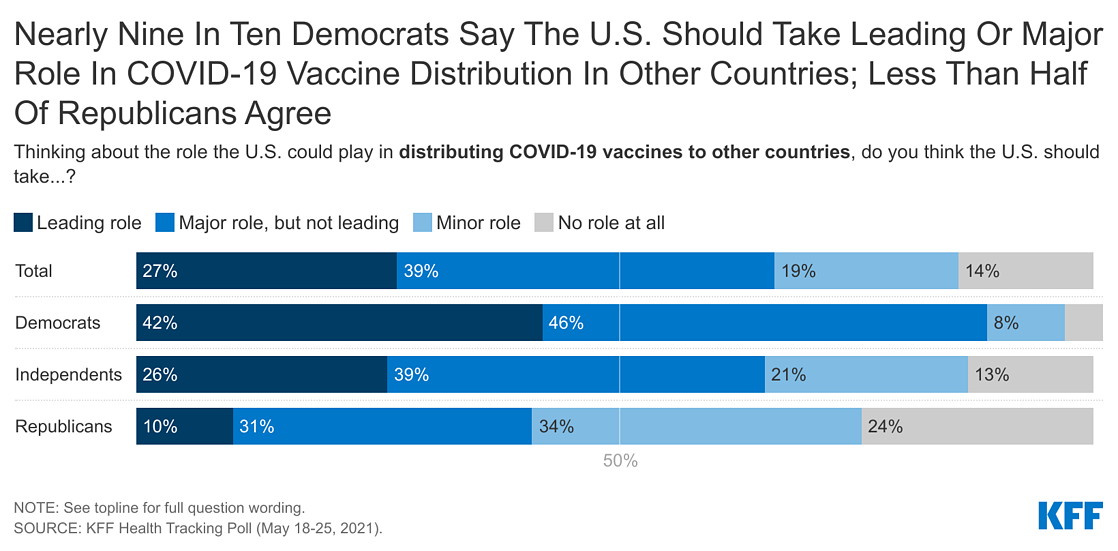
- With COVID-19 vaccine distribution still a domestic priority (especially among Democrats), majorities of the public also say the U.S. should take at least a “major role” when it comes to distributing COVID-19 vaccines internationally. Views of the U.S.’s role in distributing vaccines differs by party, with nearly nine in ten Democrats in support of the U.S. taking at least a major role while more than half of Republicans say the U.S. should take a “minor role” or “no role at all.” Attitudes shift in favor of U.S. involvement when the public is told that distributing COVID-19 vaccines can help other countries without hurting the U.S.’s own supply, that the coronavirus outbreak is worse in other countries and they need access to the vaccines in order to stop the spread of the virus, or that providing vaccines to other countries could help the U.S. achieve immunity necessary to curb the pandemic.
Health Care Priorities For Congress
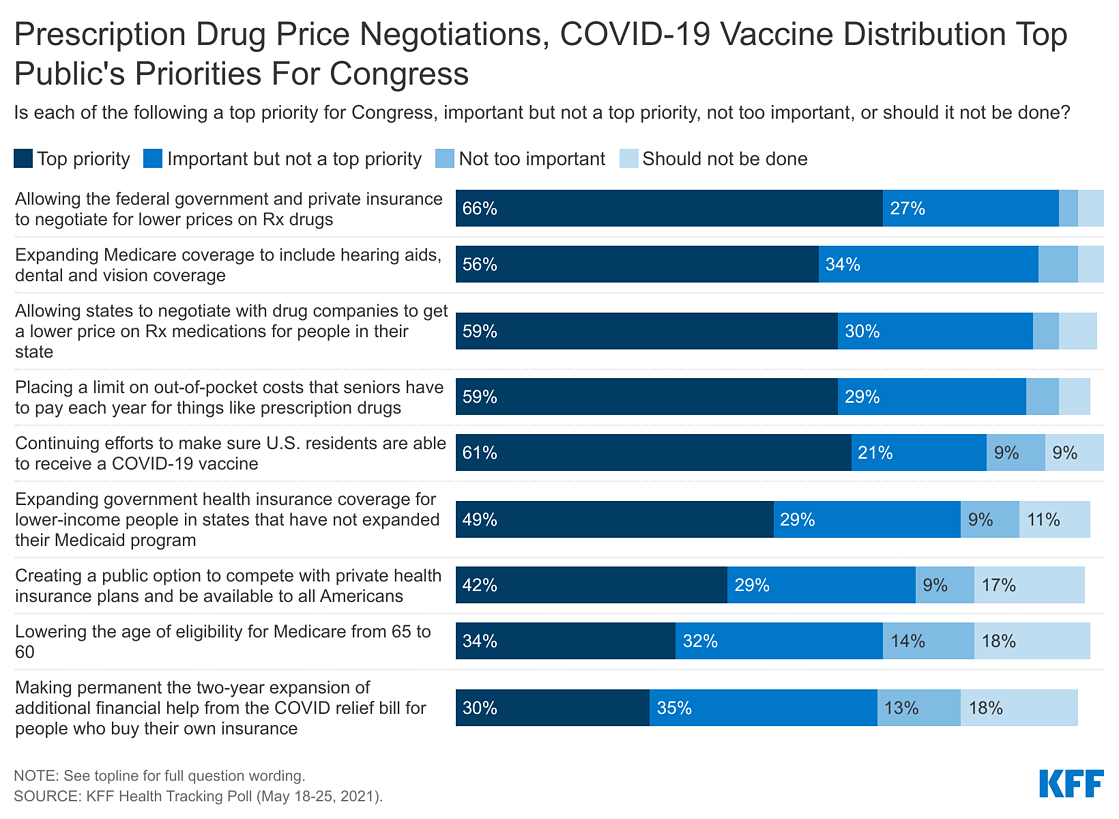
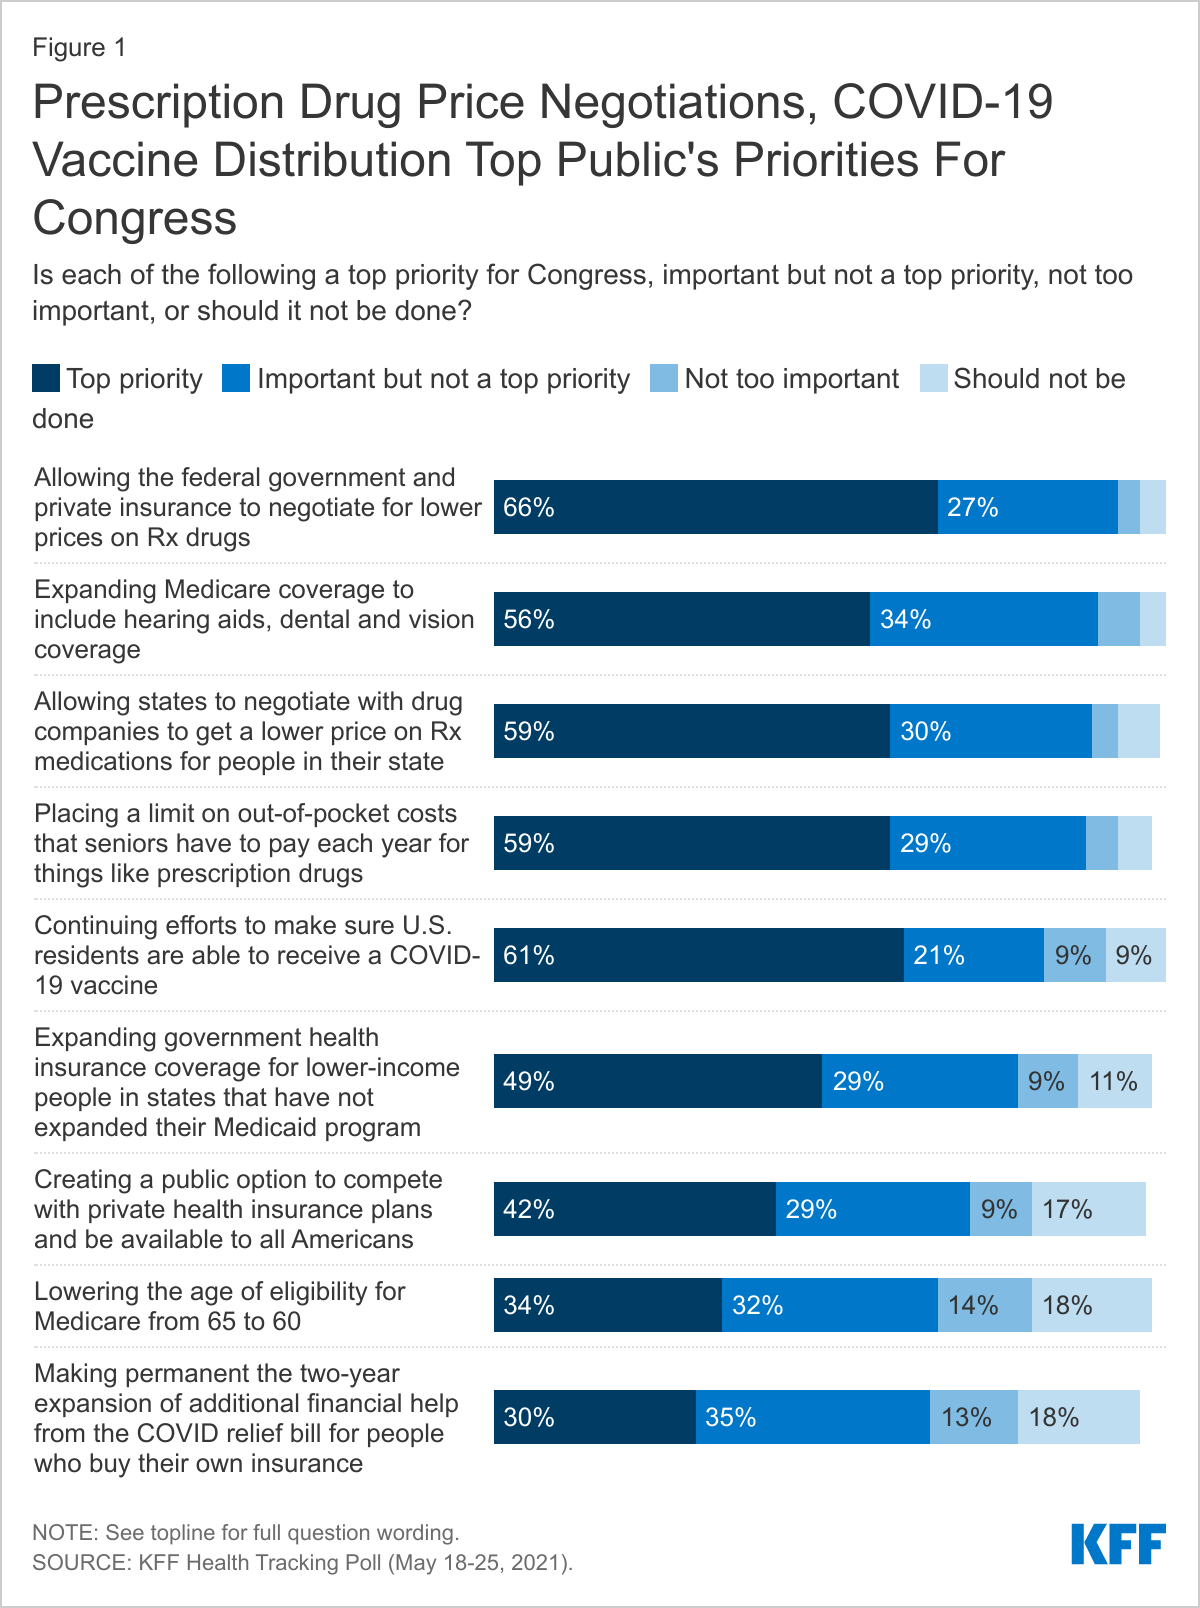
On May 28th President Biden unveiled his $6 trillion budget for the following fiscal year, with broad calls on Congress to create a public option, lower the Medicare eligibility age to 60, lower prescription drug costs for people with Medicare and job-based coverage, and lower ACA deductibles. The plan also includes making permanent the 2-year financial assistance offered to people who buy their plans on the marketplace that was part of the COVID relief bill. The latest KFF Health Tracking Poll asks the public how much of a priority these, along with other health care priorities, are for Congress to focus on in the coming months and finds majorities saying each is at least an important priority and few (less than one five) saying each of the health priorities “should not be done.”
About nine in ten U.S. adults say allowing federal government negotiations with drug companies to get a lower price on prescription drugs (92%), allowing state governments to negotiate lower drug prices (89%), expanding Medicare coverage to include hearing aids, dental and vision coverage (90%), and placing a limit on out-of-pocket costs that seniors have to pay each year for things like prescription drugs (88%) are “top priorities” or an “important, but not top priorities.” At least seven in ten say continuing efforts to make sure U.S. residents are able to receive a COVID-19 vaccine (81%), expanding government health insurance coverage for lower-income people in non-expansion states (78%), and creating a government-administered public option that would be available to all Americans (71%) are at least important for Congress to work on. A slightly smaller share, but still a majority, say lowering the age of Medicare eligibility from 65 to 60 (66%) and making permanent the two-year expansion of additional financial help for people who buy their own insurance from the COVID relief bill (64%) are important priorities.
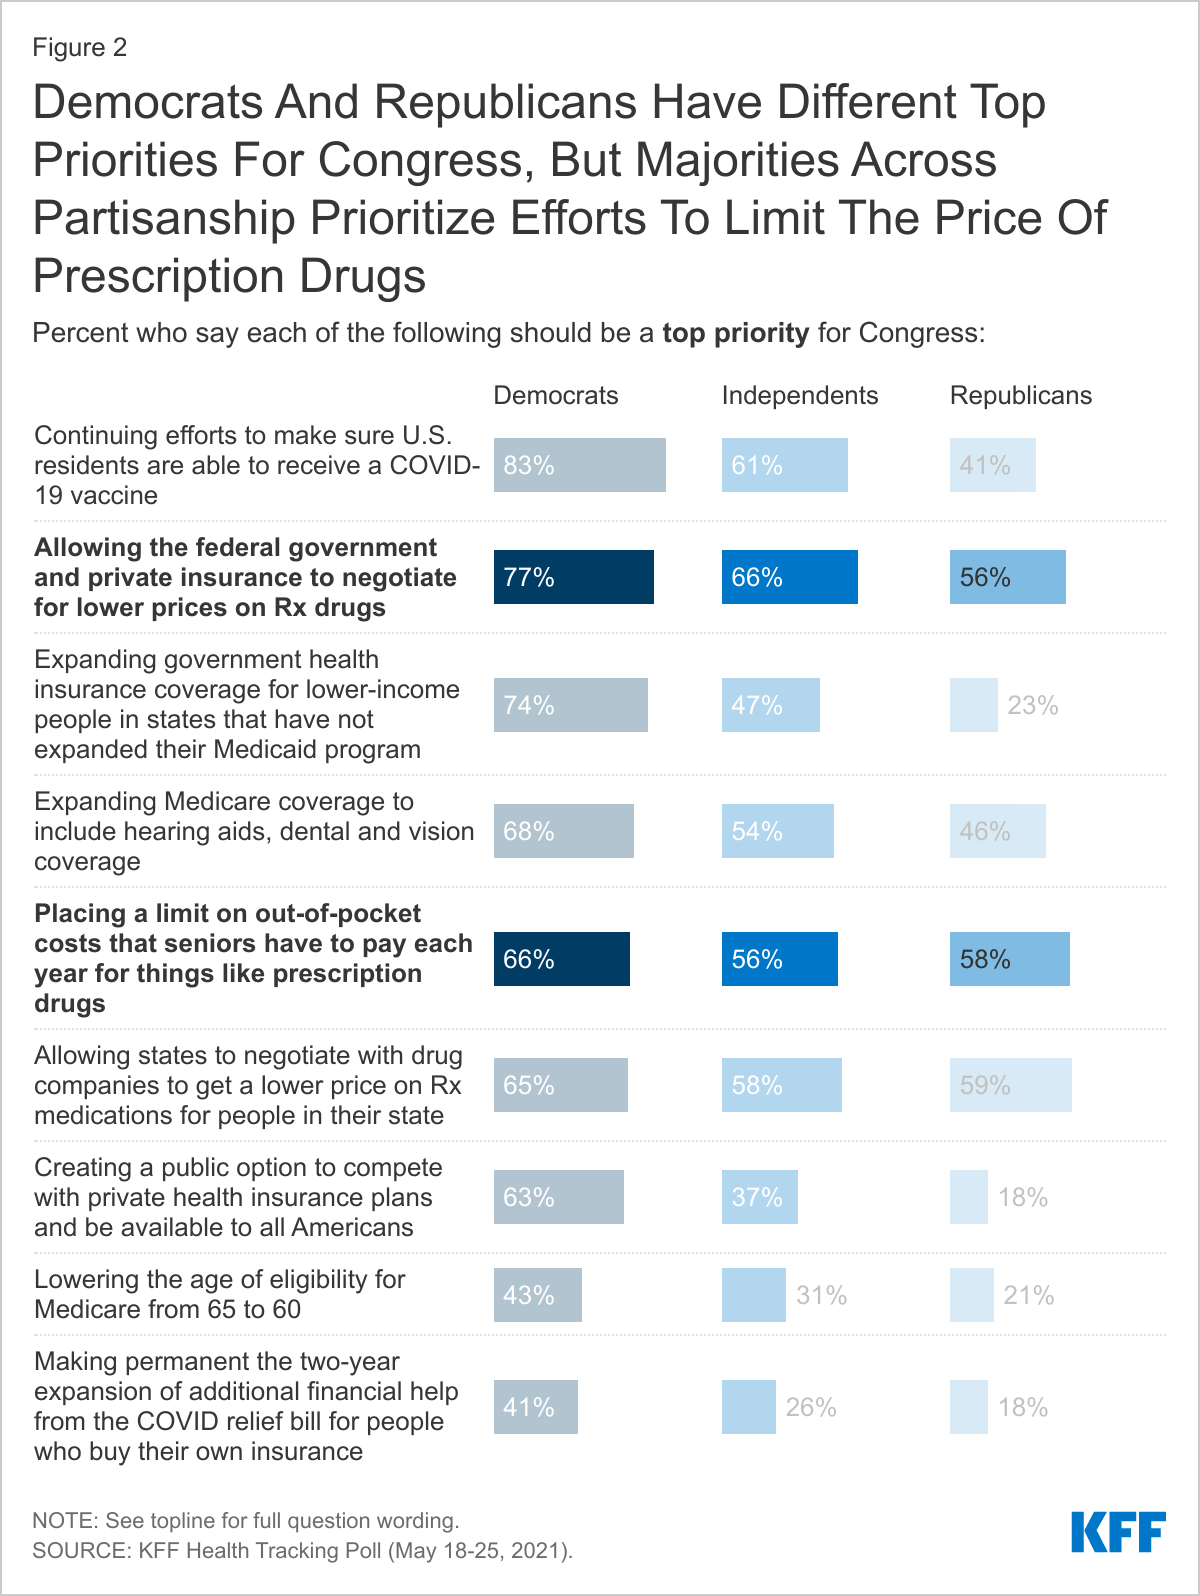
While majorities of the public say each of the health care priorities asked about are at least an important one for Congress to work on, proposals aimed at lowering prescription drug prices are a top priority for Democrats, independents, and Republicans. Majorities, across partisans, say both allowing the federal government and private insurance to negotiate for lower prices on prescription drugs and allowing states to negotiate with drug companies should be a “top priority for Congress.” Majorities of Democrats (66%), independents (56%), and Republicans (58%) also say placing a limiting on out-of-pocket costs like prescription drug costs for seniors is a “top priority.”
Other health proposals asked about in the survey, including continuing efforts to make sure U.S. residents are able to receive a COVID-19 vaccine, expanding government health insurance coverage for lower-income people in non-expansion states, and expanding Medicare coverage to include hearing aids, dental and vision coverage, are viewed as top priorities by majorities of Democrats, but by smaller shares of Republicans.
Expanding Government’s Role In Providing Health Insurance
While President Biden campaigned on creating a government public option that would compete with private insurance and be available to all Americans, more recently he has expressed support for expanding government insurance by lowering the age of eligibility for Medicare. Both of these proposals are more incremental efforts to expand the government’s role in health coverage than the hotly contested Medicare-for-all proposal that dominated much of the 2020 Democratic presidential primary. Previous KFF polling has found that while Medicare-for-all is favored by a majority of Democrats and independents, a public option garners support among four in ten Republicans (in addition to large majorities of Democrats and independents) and lowering the age of eligibility for Medicare garners bipartisan support (85% of Democrats, 75% of independents, and 69% of Republicans).
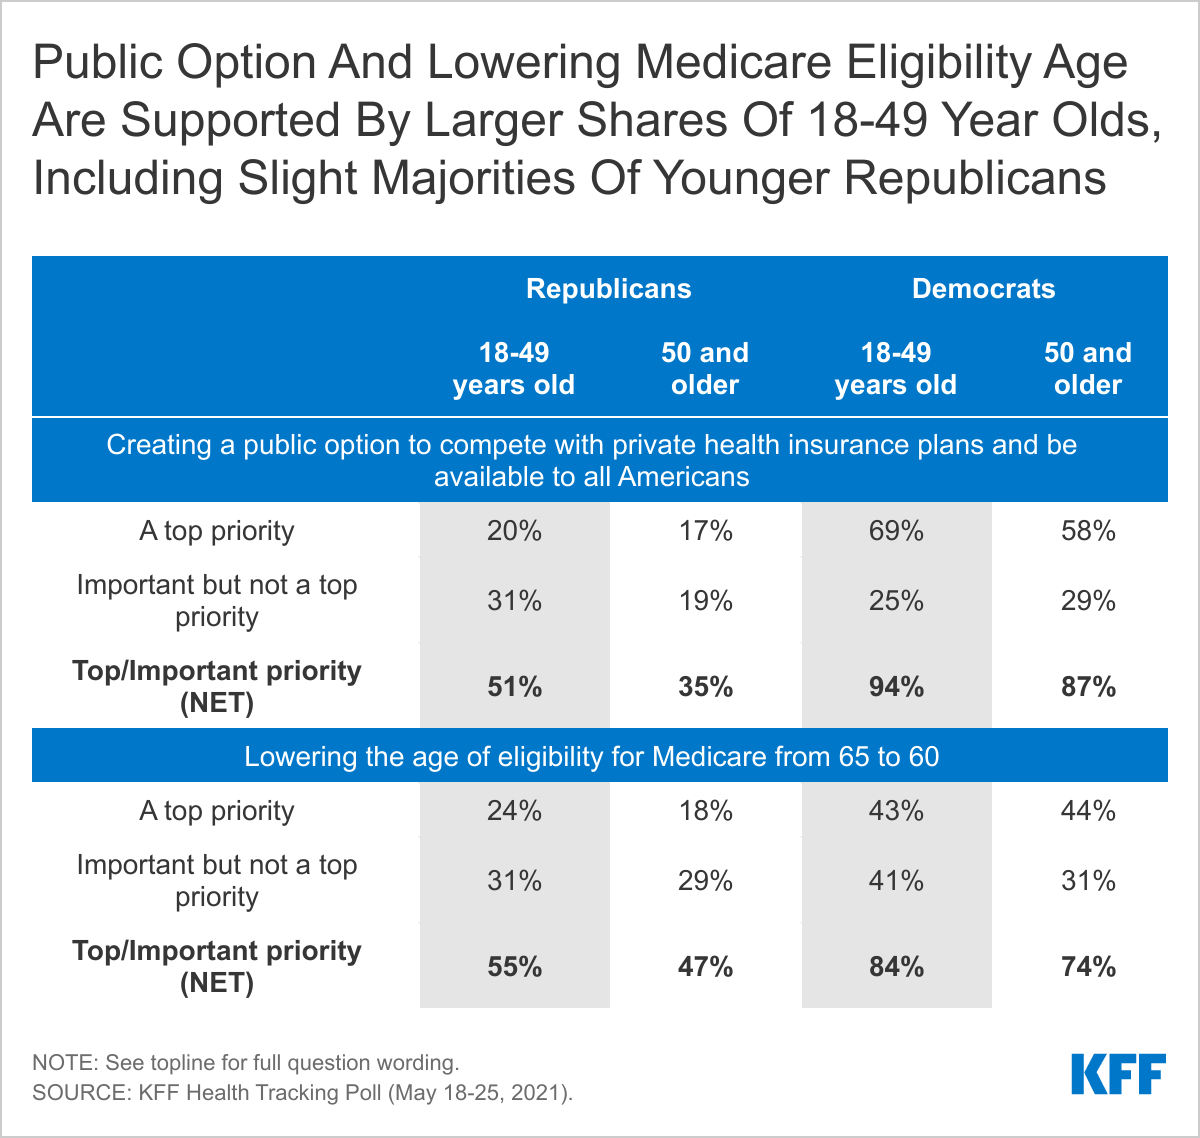
The latest KFF polling finds that while older adults, especially Republicans, are less likely to prioritize these policy proposals, both of these proposals aimed at expanding the government’s role in health insurance are important priorities among younger populations. About seven in ten Democrats 18-49 years old saying creating a public option is a top priority, compared to 58% of Democrats 50 and older. Lowering the age for Medicare eligibility is also an important priority for Democrats but with lower shares saying it is a top priority (eight in ten 18-49 year olds say it is at least an important priority as do about three-fourths of Democrats 50 and older). Both of these proposals also have support among younger Republicans (18-49 years old) with at least half saying each is at least an important priority.
Views of The Aca Remain Partisan
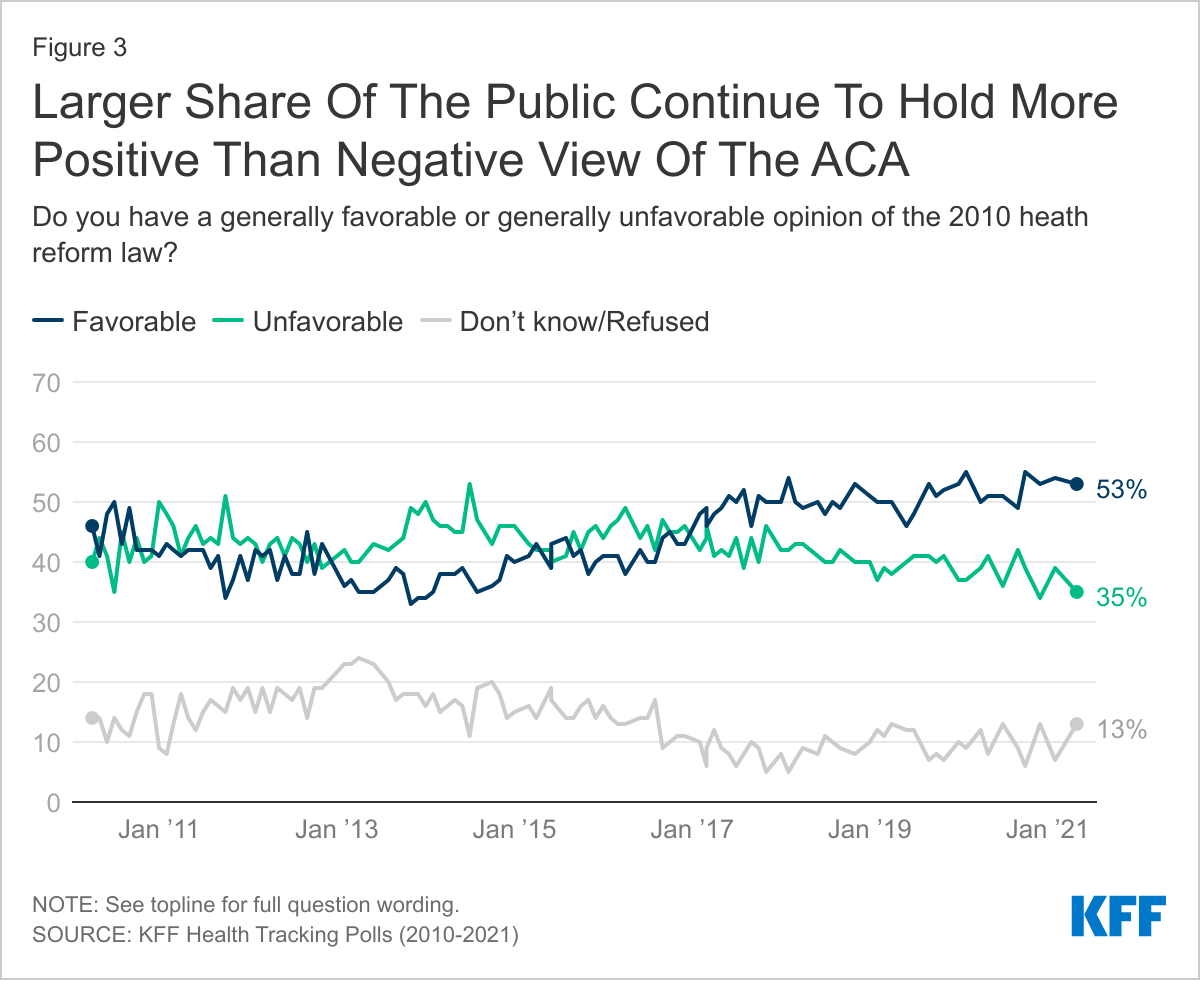
More than 11 years after the ACA was signed into effect, views of the 2010 health care law remain politically partisan. The latest KFF Health Tracking poll finds a larger share of the public hold favorable views of the law than unfavorable ones (53% vs. 35%), but still only a slight majority of the public view the law favorably.
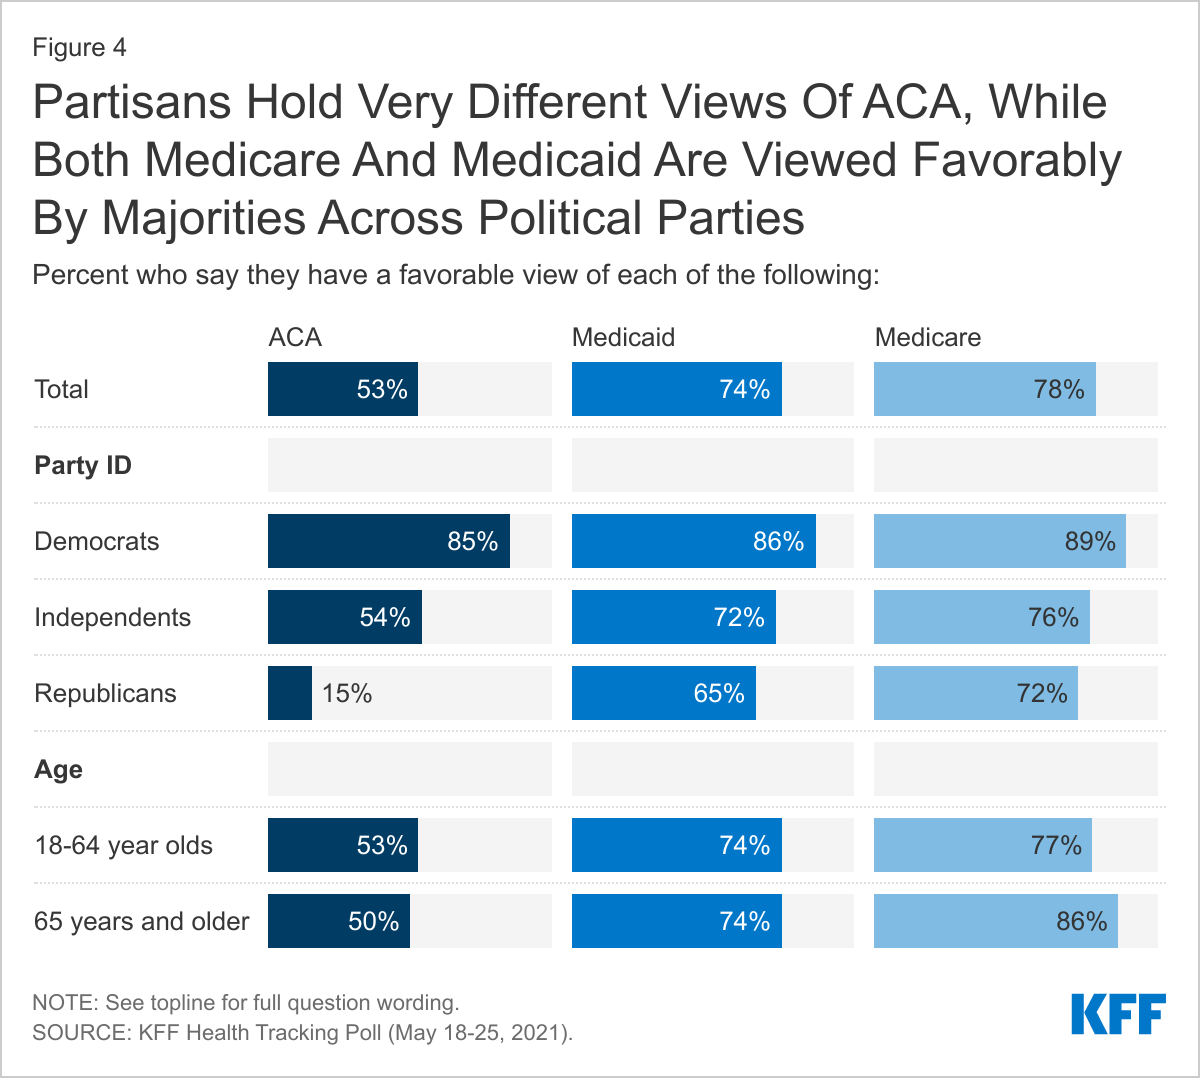
Views of the ACA are still largely driven by party identification with vast majorities of Democrats (85%) expressing support for the legislation while 77% of Republicans view the law unfavorably. A larger share of independents view the law favorably (54%) than unfavorably (32%). This has remained largely unchanged over the past 5 years with more than seven in ten Republicans expressing unfavorable views of the ACA since the 2015 King v. Burwell challenge to the law. In comparison, majorities of Democrats, independents, and Republicans view both Medicare and Medicaid favorably.
Financial Assistance for People Who Purchase Their own health Insurance
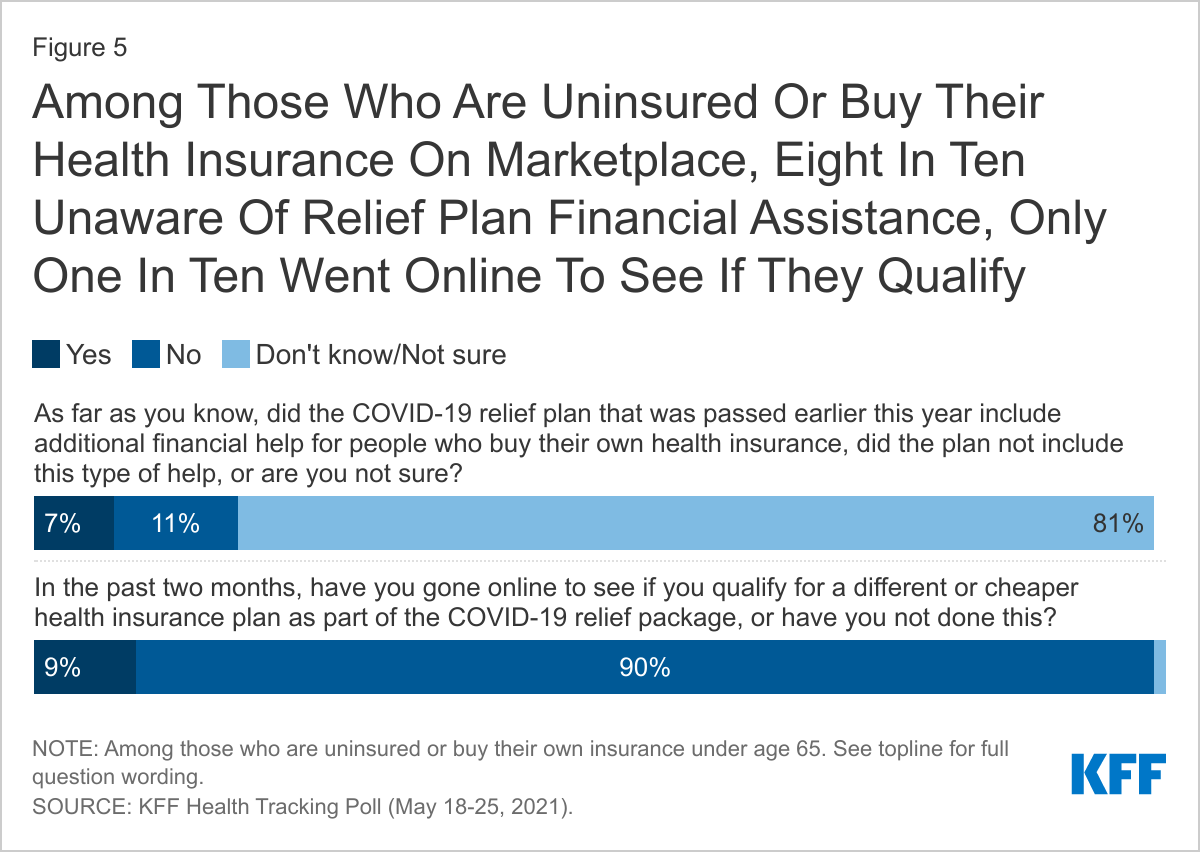
The COVID relief bill passed in early March 2021 provided additional financial help for people who buy their own health insurance coverage. The vast majority of those likely eligible for this financial assistance are either unsure whether the COVID-19 relief package included this financial assistance (81%) or say that it did not happen (11%). Less than one in ten (7%) are aware of this increased financial assistance. Additionally, only a small minority of those potentially eligible for additional financial help or coverage have reported going online to see if they qualify for a different or cheaper health insurance plan. Among those under 65 years old, nine percent of those who are either uninsured or buy their own coverage report going online in the past two months to see if they qualify for a different or cheaper health insurance plan or Medicaid as part of the COVID relief package.
Prescription Drug Costs and Regulation
Throughout this spring, Democratic lawmakers have discussed allowing the Department of Health and Human Services to negotiate the prices of brand-name drugs. While this proposal is opposed by most Republican lawmakers, the latest KFF Health Tracking Poll finds it supported by a majority of the public, regardless of party identification.
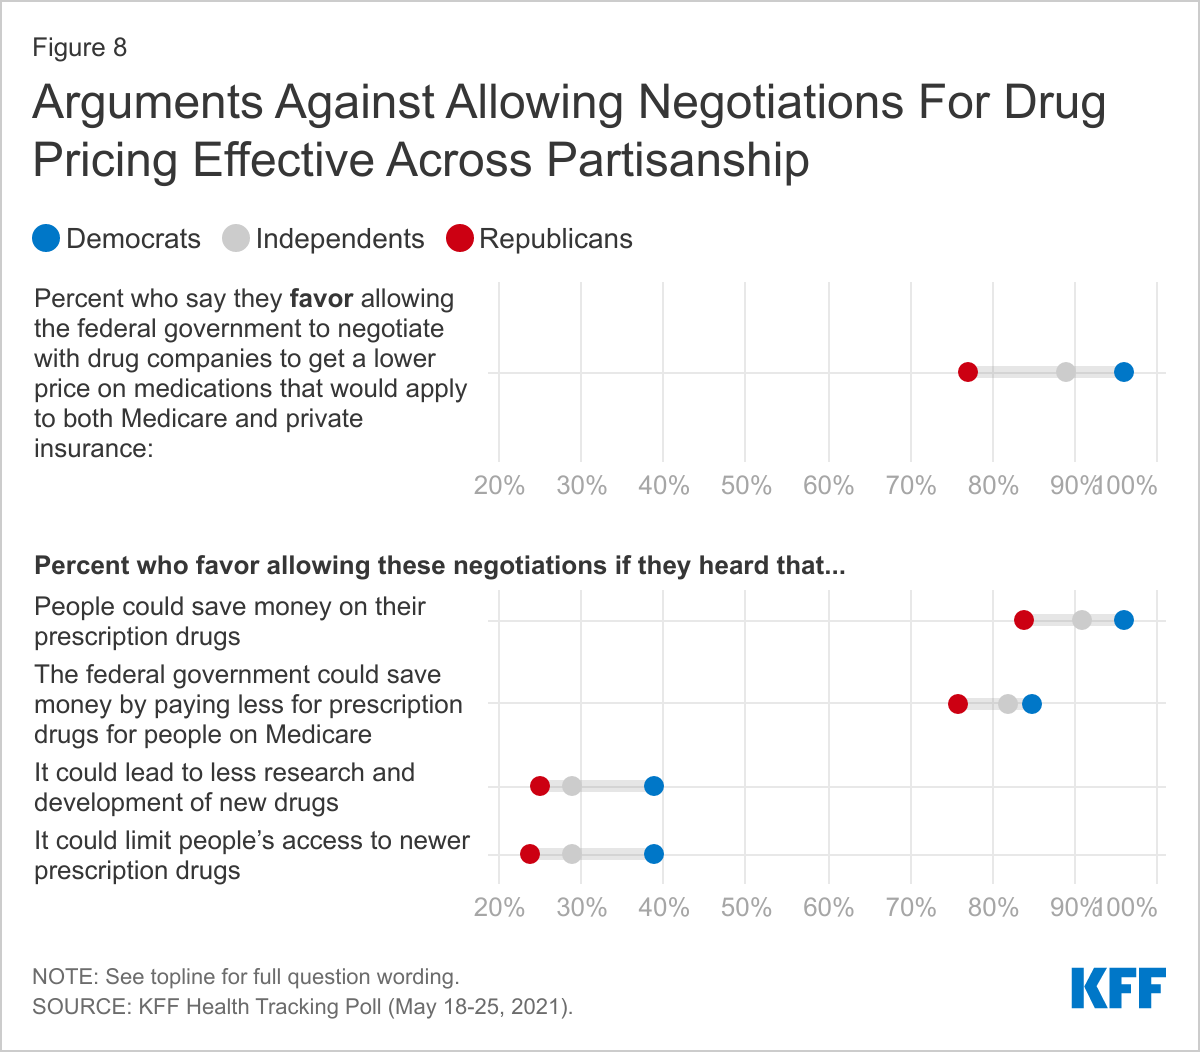
Overall, nearly nine in ten (88%) favor allowing the federal government to negotiate for lower prices on medications, including three-fourths (77%) of Republicans, nine in ten Independents (89%) and 96% of Democrats. Nearly nine in ten across age groups favor the proposal. This pattern is consistent with previous KFF polling conducted prior to the pandemic in which 90% of Democrats, 87% of independents, and 80% of Republicans favored this proposal.
Despite widespread support for allowing the federal government to negotiate drug prices, public opinion can change in the course of a national debate and certain messages can dampen support for this proposal. Support starts high and remains high (90%) when people hear that people could save money on their prescription drugs if this policy were implemented. Eight in ten (81%) say that they favor this proposal after hearing that the federal government could save money if they were allowed to negotiate for lower drug prices for people on Medicare. However, opposition to this policy proposal rises to about two-thirds when the public hears assertions that this proposal could lead to less research and development for new drugs, or that access to newer prescriptions could be limited.
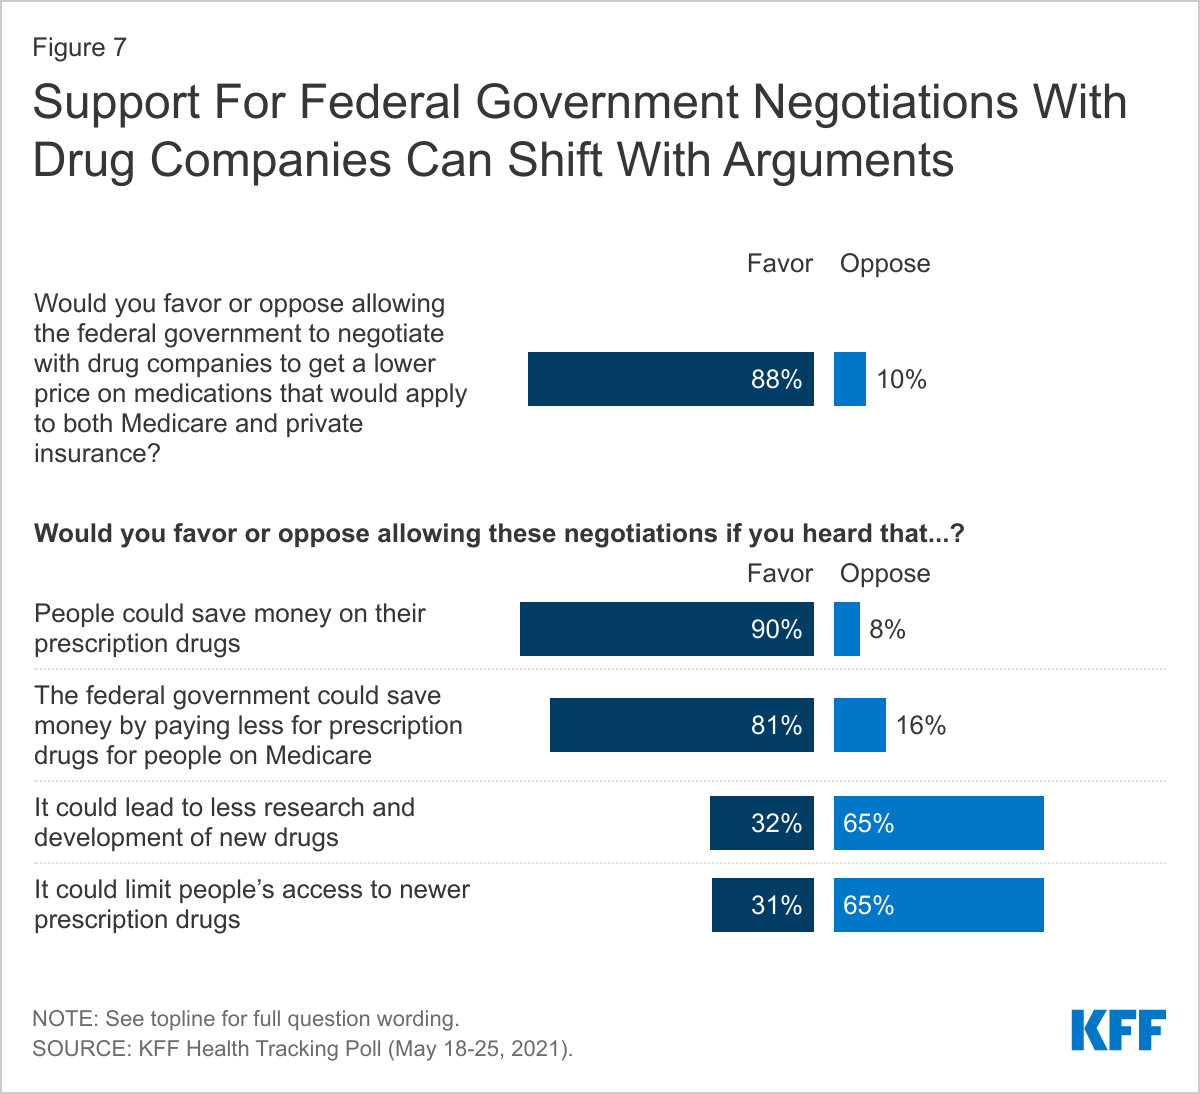
Both of the arguments against allowing the federal government to negotiate with drug companies are effective across partisanship, with support for the proposal dropping among Democrats to as low as 39% and among Republicans to 24% (both down more than fifty percentage points) after these arguments are read.
What Does The Public Think Drives Prescription Drug Costs?
The public sees profits made by pharmaceutical companies as the largest factor contributing to the price of prescription drugs. About eight in ten across partisans say profits made by pharmaceutical companies are a “major factor” in the price of prescription drugs. This is followed by about seven in ten (68%) who say the cost of research and development is a “major factor” contributing to the price, and about half (52%) saying that the cost of marketing and advertising is a major contributing factor to the cost of prescription drugs.
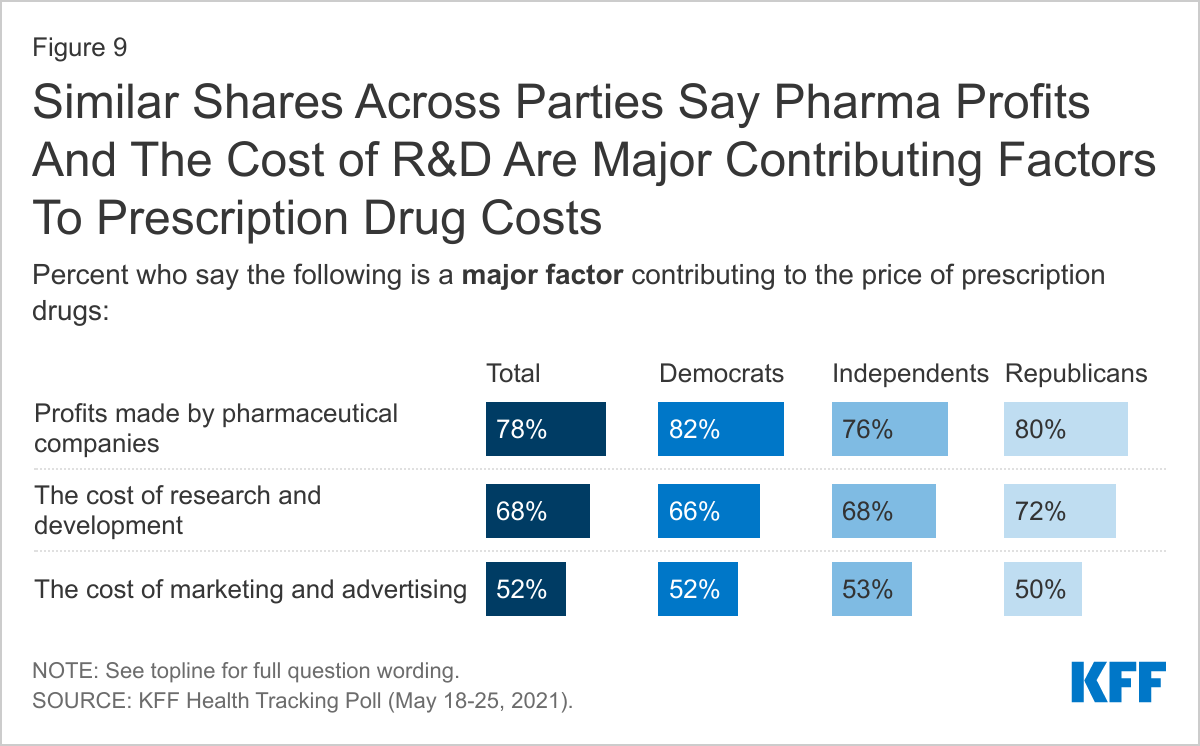
Despite the introduction of the three FDA authorized vaccinations for emergency use for COVID-19 and increased attention on the research and development component of pharmaceutical companies, the share of the public who say the cost of research and development is a “major factor” contributing to the price of prescription drugs has remained relatively unchanged since 2019, when eight in ten said “profits made by pharmaceutical companies”, seven in ten (69%) said “the cost of research and development” and half (52%) said the “cost of marketing and advertising” were major factor in the price of prescription drugs. The latest KFF Health Tracking Poll finds that patterns across partisans have remained stable from 2019.
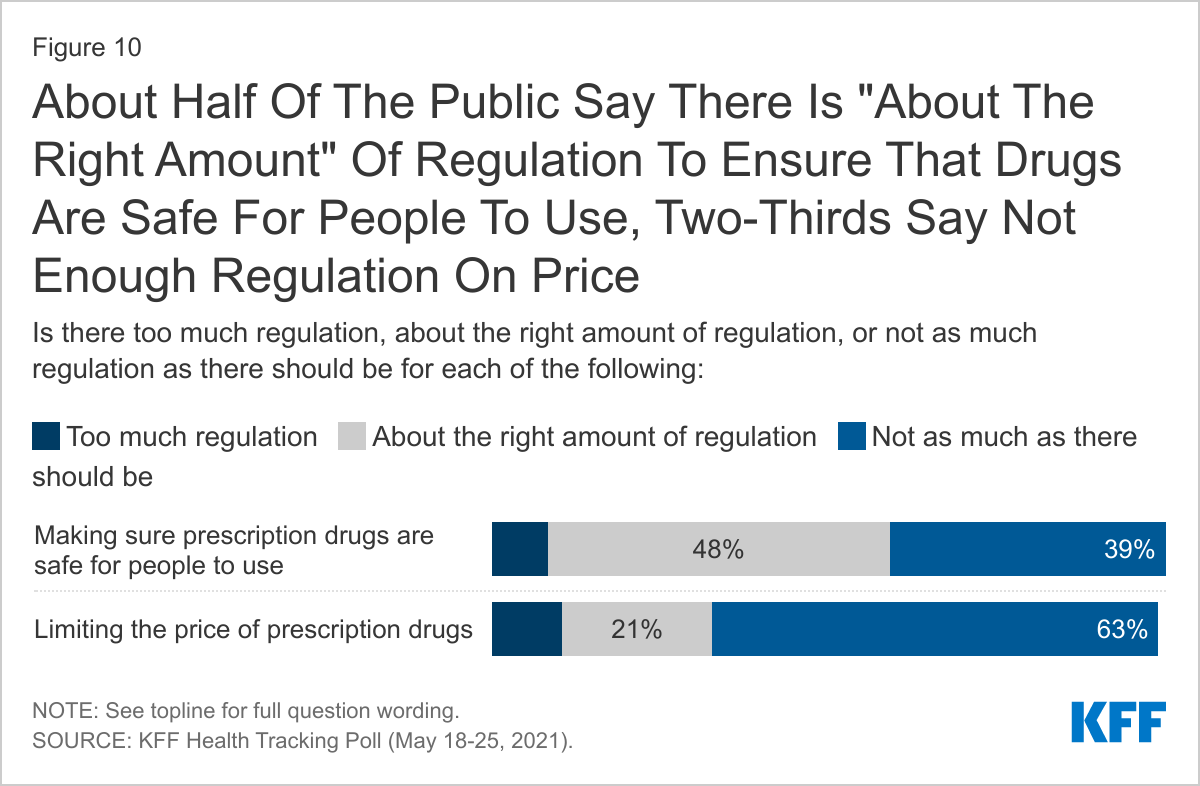
The latest KFF Health Tracking Poll finds about two-thirds (63%) say there is “not as much regulation as there should be” for limiting the price of prescription drugs, while about half (48%) say there is “about the right amount” of regulation of pharmaceutical companies for making sure prescription drugs are safe for people to use. Few say there is “too much regulation” on either limiting the price (10%) or making sure they are safe for people to use (8%).
Majorities across partisans, including seven in ten Democrats, 65% of independents and nearly six in ten Republicans (57%), say there is “not as much regulation as there should be” when it comes to limiting the price of prescription drugs. Partisans are also similar in their views on regulation to make sure prescription drugs are safe for people to use. A slight majority Democrats (56%) say there is “about the right amount of regulation” on safety of prescription drugs as do nearly half (47%) of Republicans who say the same. Few across partisans say there is “too much” of either type of regulation.
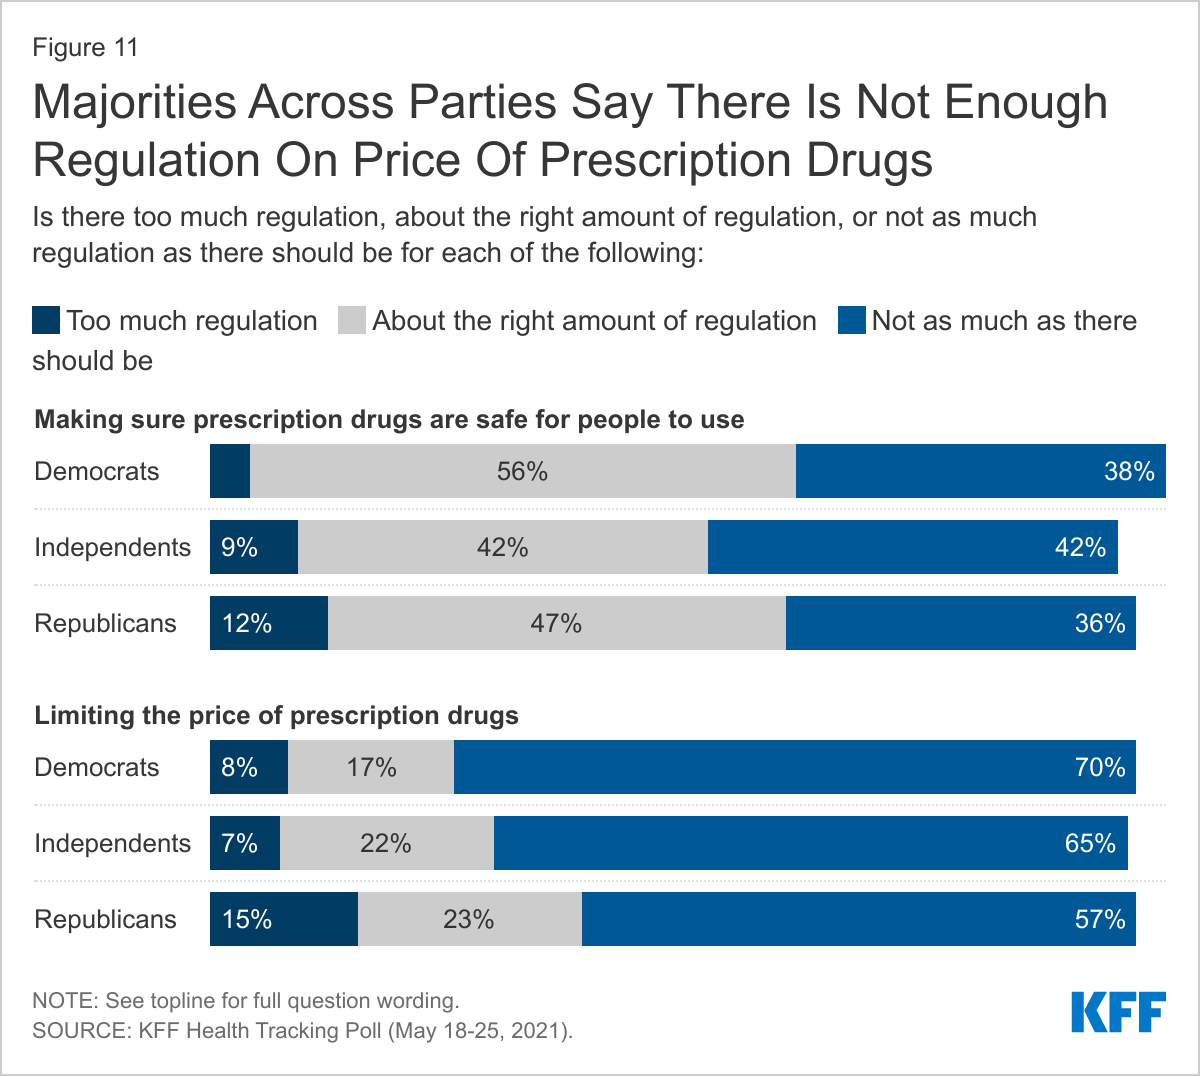
This is only a slight shift from previous KFF polling before the coronavirus pandemic, when the share of the public who say there is “not as much regulation as there should be” on safety was 44% (down to 39% in the most recent poll). The main shift has occurred among Democrats with a majority now saying there is “about the right amount of regulation” while back in 2019, about half had said there is “not as much as there should be.”
U.S. Role In Distributing COVID-19 Vaccines To Foreign Countries
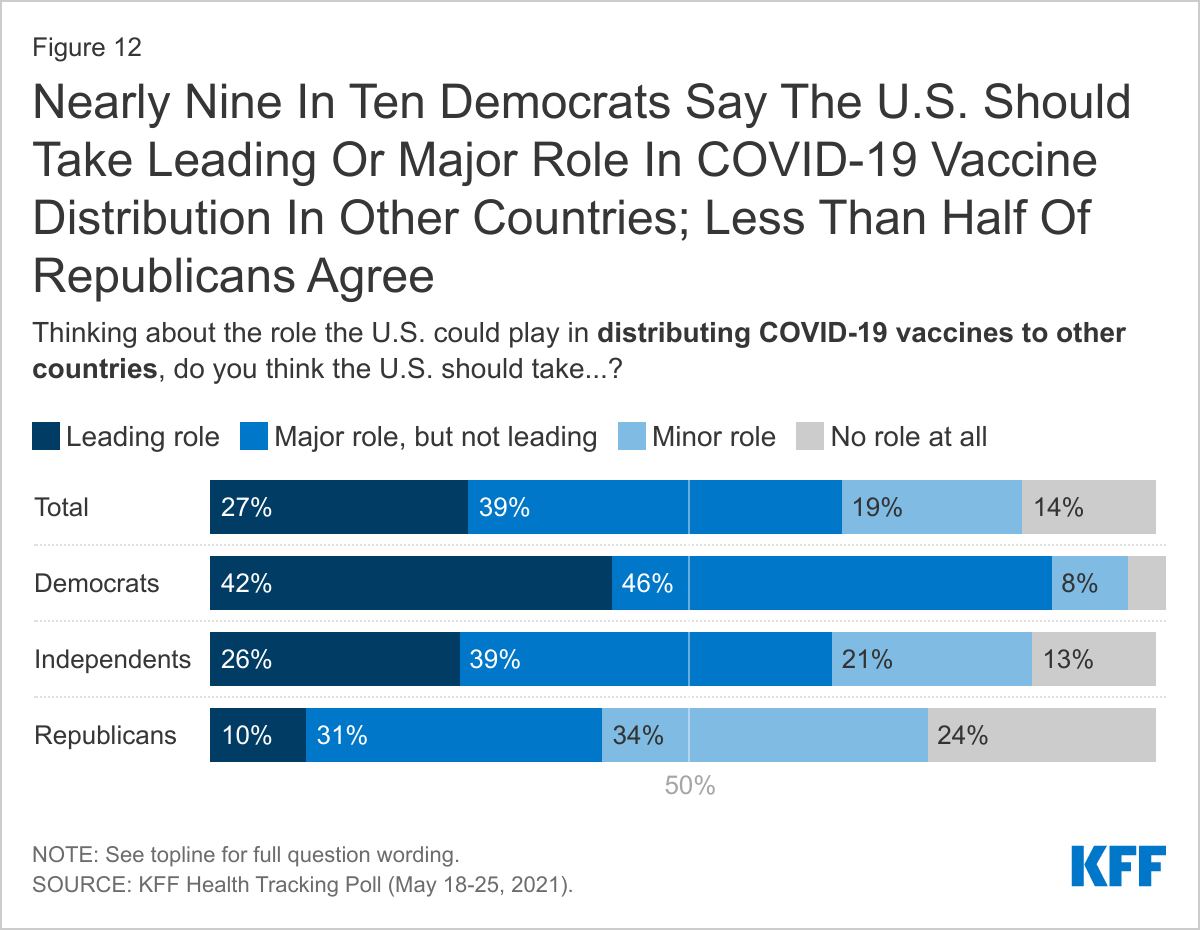
The Biden administration recently announced that by the end of June it would share 80 million COVID-19 vaccine doses with other countries, making it the largest single government donor of vaccines globally so far. The U.S. is also the largest donor to COVAX, the internationally coordinated effort to purchase and distribute vaccines worldwide. A majority of the public (66%) says that when it comes to distributing COVID-19 vaccines to other countries, the U.S. should take a “leading role” (27%) or a “major role” (39%). Views of the U.S.’s role in distributing vaccines differs by party, with nearly nine in ten Democrats in support of the U.S. taking a at least a major role (87%), while Republicans are more split, with more than half saying the U.S. should take a “minor role” (34%), or take “no role at all” (24%).
After hearing more information about the U.S. distribution of COVID-19 vaccines to other countries, larger shares of the public say that the U.S. should take at least a major role. At least three in four U.S. adults say they think the U.S. should play at least a major role after hearing that the U.S. has enough supply of the COVID-19 vaccines to help other countries without hurting its own supply (78%), the coronavirus outbreak is worse in other countries and they need access to the vaccines in order to stop the spread of the virus (77%), or that providing vaccines to other countries could help the U.S. achieve immunity necessary to curb the pandemic (76%).
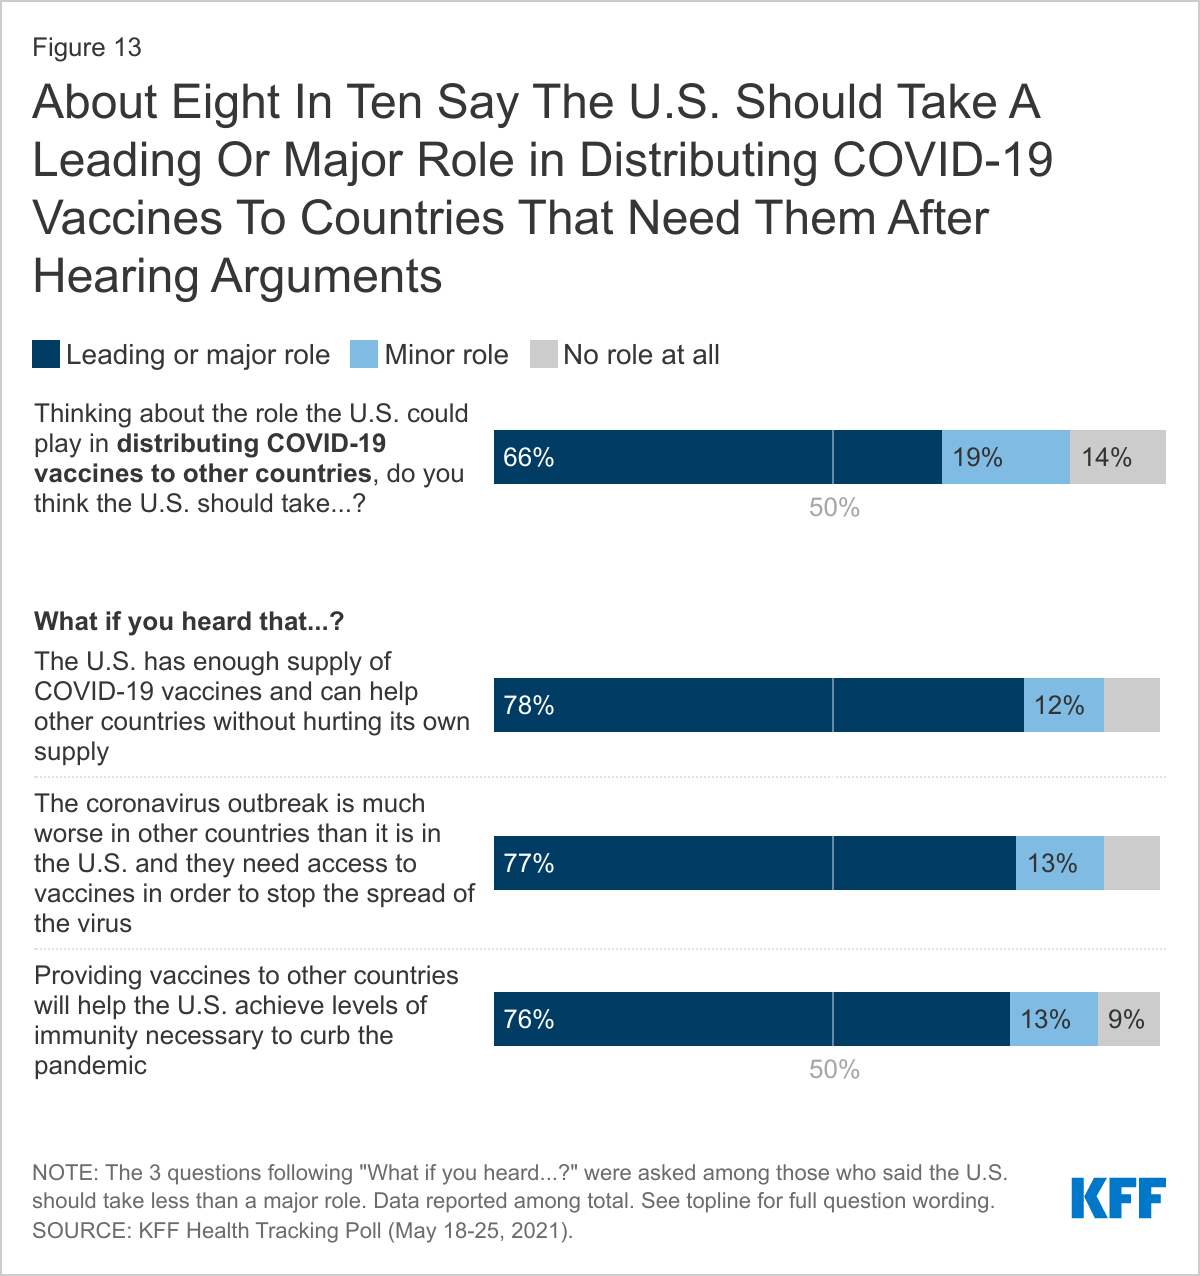
Each of these messages shift attitudes across partisans, including among Republicans. After hearing each of these messages, at least half of Republicans say the U.S. should take a leading or major role in vaccine distribution. Most notably, six in ten Republicans say the U.S. should take a leading or major role after hearing that the U.S. has enough supply to help other countries without hurting itself.