News Release

Key Facts on Health and Health Care by Race and Ethnicity

Published: Jan 26, 2022

With the COVID-19 pandemic impacting communities of color disproportionately in their health and economic well-being, long-term racial and ethnic disparities have received growing attention. But these inequities in our health system are not new and are a part of larger issues of systemic racism.

An updated KFF chart pack analyzes a wide array of measures of racial and ethnic disparities in health and health care and other factors which can contribute to these disparities. The broad sections of the chart pack include:

  • Health Coverage and Access to and Use of Care
  • Health Status, Outcomes, and Behaviors
  • Social Determinants of Health

The chart pack presents data on six racial/ethnic groups where available: White, Asian, Hispanic, Black, American Indian and Alaska Native (AIAN), and Native Hawaiian and Other Pacific Islander (NHOPI). Black, Hispanic and AIAN people fare worse than White people across the majority of measures. While, overall, Asian people do not fare worse than White people across most measures, the data may mask disparities among subgroups within the Asian population. Ongoing data gaps and limits hinder the ability to have a comprehensive understanding of the experiences of AIAN and NHOPI people.

For further research and analysis on these issues, visit the Racial Equity and Health Policy topic page.

The Intersection of Medicaid, Special Education Service Delivery, and the COVID-19 Pandemic

Authors: Elizabeth Williams and MaryBeth Musumeci
Published: Jan 21, 2022

Issue Brief

Key Takeaways

The COVID-19 pandemic created unprecedented health and education challenges for children with disabilities, many of whom receive special education services. Recently, the Omicron variant, slowing vaccination rates among children, and state bans on school mask mandates have impacted school operations during the new year as well as the health, safety, and educational progress of children with special education plans. Many children receiving special education services have substantial health care needs, and services available through a child’s health insurance plan, such as Medicaid, can complement special education services. This brief describes how Medicaid and special education services work in meeting children’s needs, explores how the pandemic has affected children who receive special education services, and identifies key issues to watch moving forward. Key findings include the following:

  • If a child is eligible for both special education services and Medicaid, federal law requires state Medicaid programs to pay for services that are both educationally and medically necessary.
  • Medicaid/CHIP covers half of all children with special education plans. Children with special education plans covered by Medicaid/CHIP are more likely to have greater health needs compared to those with private insurance only.
  • The onset of the pandemic and ensuing school closures created disruptions and challenges in how children received special education services. Many children with special education plans experienced missed or delayed services and loss of instructional time during the pandemic.

Students with special education plans may be entitled to compensatory services to make up for lost skills due to pandemic related service disruptions, and some children, such as those with disabilities related to long COVID, may be newly eligible for special education services. Medicaid can play an important role in ensuring that children receive preventive services that may have been delayed during the pandemic and access services to address needs that may have arisen due to the pandemic.

Introduction

The COVID-19 pandemic has had a disproportionate impact on people with disabilities, including children, whose health and functional needs place them at increased risk of severe illness or death from COVID-19 and who may require special education services that may not be adequately provided in education settings modified by the pandemic. There are an estimated 6.7 million children1 , or 9% of all children in the U.S., who currently have special education plans2 , and over two-thirds of these children have special health care needs.3  Throughout the pandemic, these children have experienced delayed or missed services and losses in instructional time, which can have implications for their ability to continue to progress in their education. As a major health insurance provider for children with special education plans, Medicaid can provide important services to these children as well as ensure that children receive other preventive services that may have been delayed during the pandemic and access services to address needs that may have arisen due to the pandemic, such as mental health treatment.

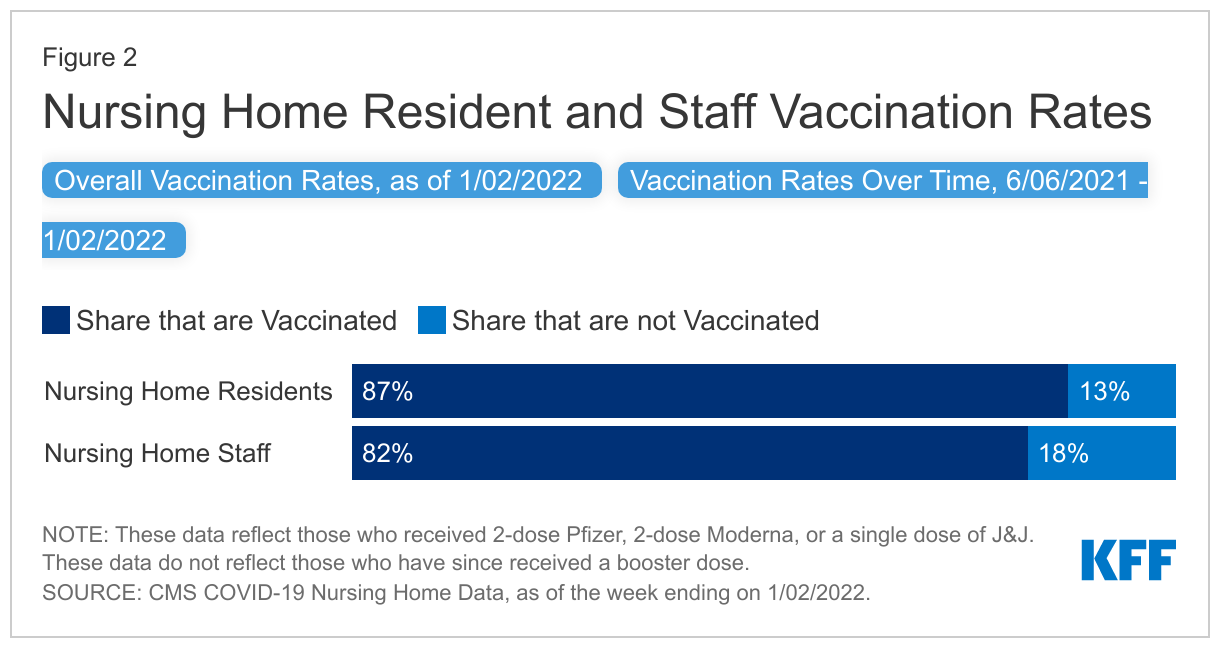
While students have largely returned to in-person learning this school year, challenges for children receiving special education services remain. A number of lawsuits are challenging state bans on school mask mandates, arguing that these bans violate the right of children with disabilities to safely attend school. Further, the recent, rapid spread of the Omicron variant has created additional instability for students and some schools have temporarily switched to remote learning, a move that may make it difficult to provide all needed services to children with special education plans. While the Pfizer-BioNTech COVID-19 vaccine is now authorized for school-aged children, vaccination among young children is not yet widespread. This brief explains how Medicaid and special education services intersect, explores the pandemic’s implications for children receiving special education services, and identifies key issues to watch moving forward. For additional context, the appendices provide information on what is required under federal special education law and includes supporting data tables.

What is the intersection between Medicaid and special education services?

If a child is eligible for both special education services and Medicaid, federal law requires state Medicaid programs to pay for services that are both educationally and medically necessary. This is an exception to the general rule that usually makes Medicaid the payer of last resort when other sources of coverage are available. If a device or service included in a child’s special education plan under the Individuals with Disabilities Education Act (IDEA) is also medically necessary, then Medicaid is obliged to pay before the school district.4  For more on what is required under the federal IDEA, see Appendix A. Children also may qualify for additional services covered by Medicaid, beyond what is required by the IDEA. For example, a child with cerebral palsy may need physical therapy to improve mobility and manage muscle contractures. The IDEA might require the school district to provide physical therapy so that the child can access and progress in their education, such as therapy targeted to moving around the school or developing skills related to their educational goals. If the child requires additional physical therapy for other purposes, such as to facilitate their ability to transfer in and out of a wheelchair at home or skills needed to access the community outside of school, such services could be “medically” but not “educationally” necessary and therefore available under Medicaid.

The scope of services that must be provided to children under federal Medicaid law is broader than what is required under the IDEA’s definition of “related services.” The Early Periodic Screening Diagnostic and Treatment (EPSDT) provision requires state Medicaid programs to cover all services that are “necessary. . . to correct or ameliorate. . .  physical and mental illnesses and conditions. . . .”5  Like the IDEA, EPSDT applies to Medicaid enrollees from birth through age 21. To receive federal matching funds, state Medicaid programs must cover a minimum set of services for adults (such as inpatient hospitalization and physician services) and can choose to cover additional services (such as private duty nursing and rehabilitative services). However, EPSDT means that there are no “optional” services for children; instead, if medically necessary, all services must be covered for children, regardless of whether the state chooses to cover them for adults.

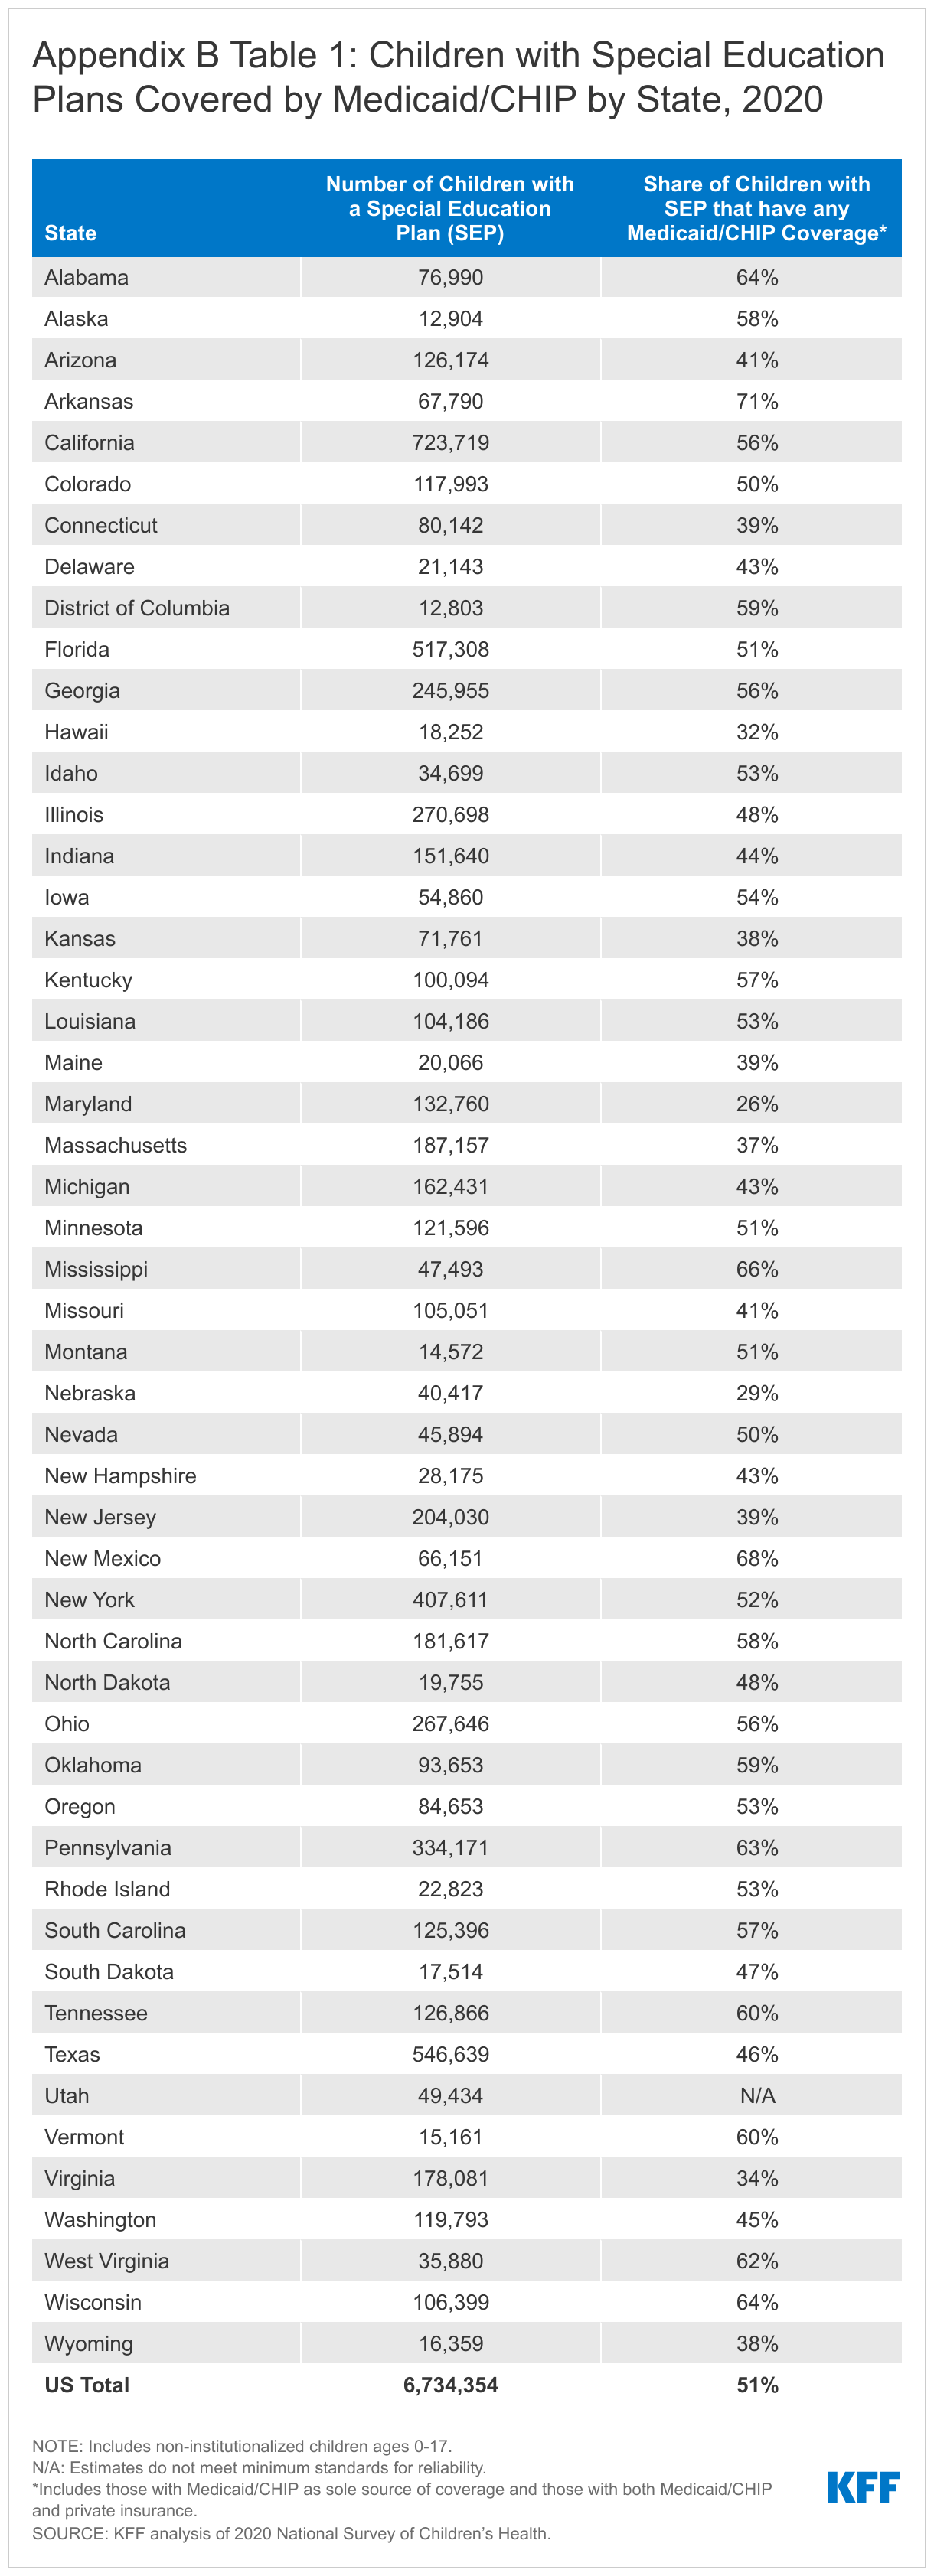
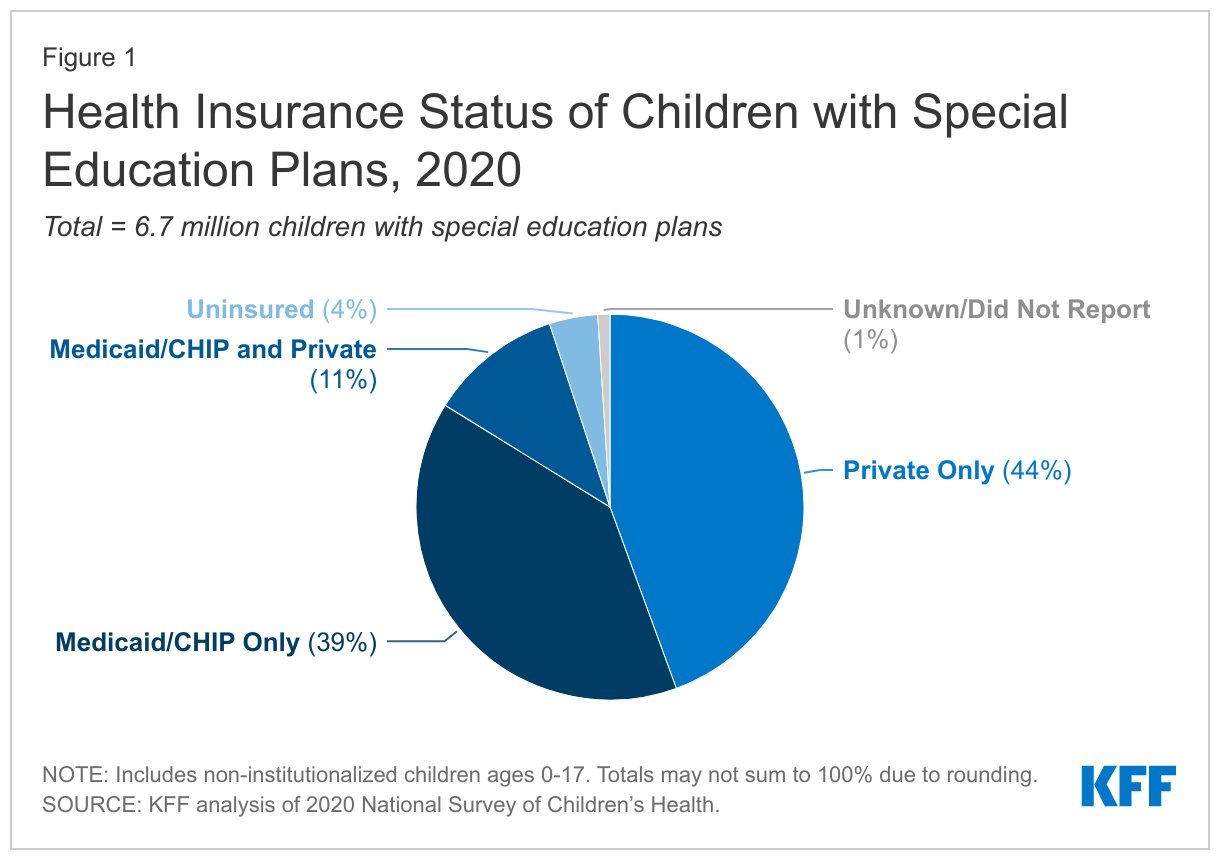
Medicaid, together with the Children’s Health Insurance Program (CHIP), covers half of all children with current special education plans (Figure 1). Medicaid/CHIP is the only source of coverage for nearly four in 10 children nationwide receiving special education services, while over one in 10 have Medicaid/CHIP to supplement private insurance. Medicaid covers services that private insurance typically does not, including long-term services and supports (LTSS) and home and community-based services (HCBS), and has cost-sharing protections that help keep health care affordable for families. The share of children with special education plans covered by Medicaid/CHIP varies by state, ranging from 26% to 71%, reflecting variation in state choices about optional Medicaid eligibility pathways for children with disabilities (Appendix B Table 1).

Health Insurance Status of Children with Special Education Plans, 2020

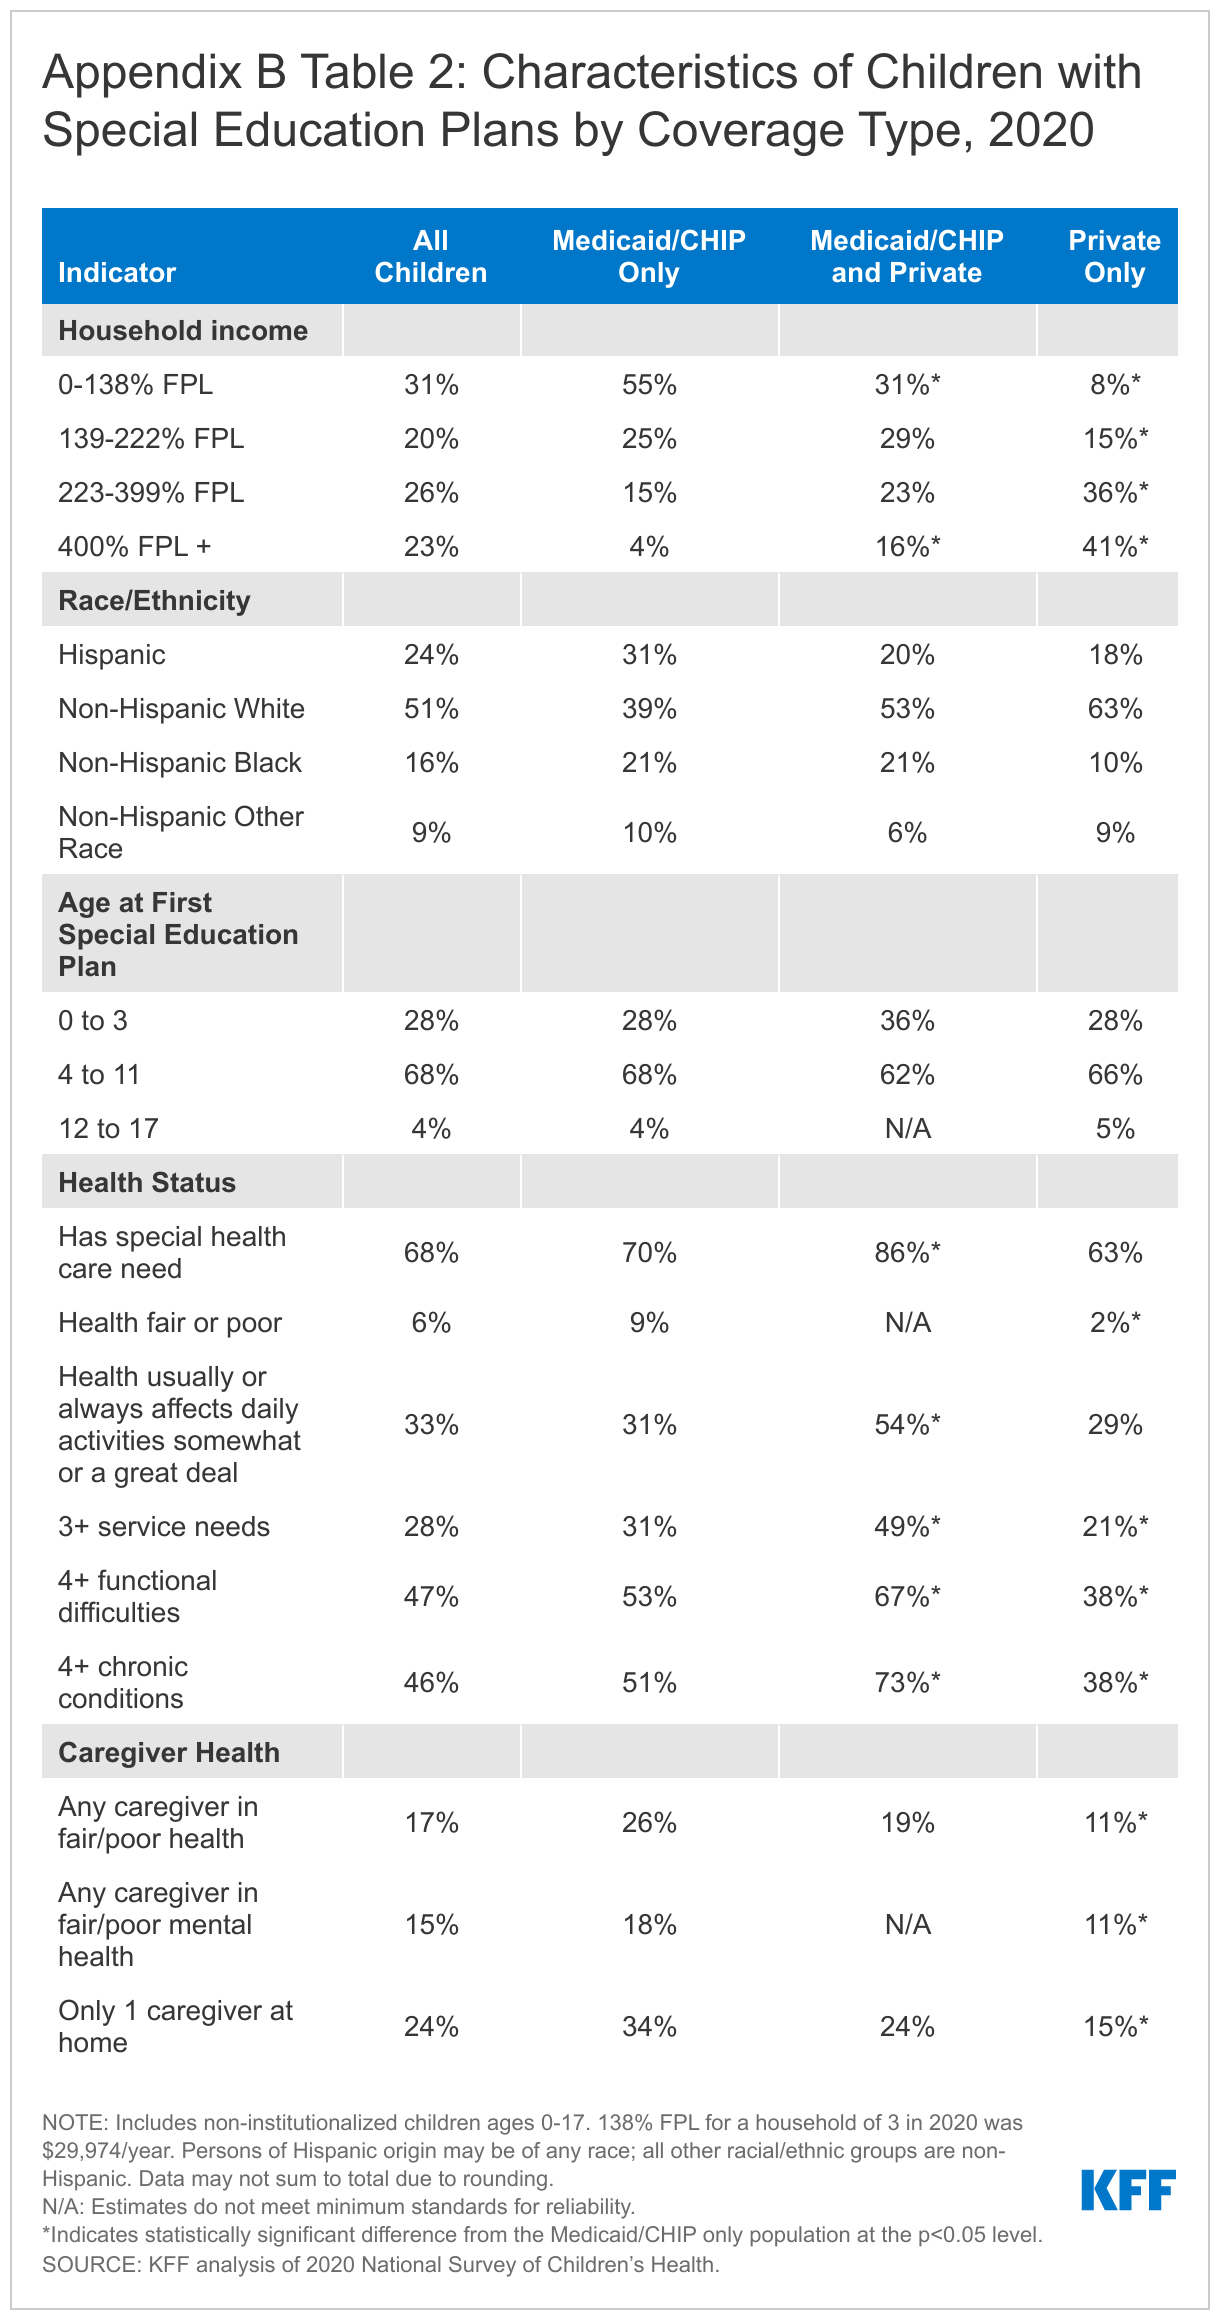
A majority of children with special education plans covered by Medicaid/CHIP alone are children of color and live in low-income households (Appendix B Table 2). Medicaid/CHIP-only children with special education plans are more likely to be non-Hispanic Black or Hispanic compared to children with private coverage only. Medicaid/CHIP-only children with special education plans also are more likely to live in a household with an income at or below 138% of the federal poverty level (FPL, less than $29,974/year for a family of three in 2020) when compared to those with private insurance only. Additionally, most children (68%) receive their first special education plan between the ages of 4 and 11 regardless of health coverage type.

Children with special education plans covered by Medicaid/CHIP are more likely to have greater health needs compared to those with private insurance only. Medicaid/CHIP-only children with special education plans are more likely to have multiple chronic conditions and multiple functional difficulties, with over half of the Medicaid/CHIP-only group reporting four or more functional difficulties or four or more chronic conditions, compared to 38% of those with private insurance only (Appendix B Table 2). Further, children with special education plans covered by both Medicaid/CHIP and private insurance are more likely than children covered by Medicaid/CHIP alone to have four or more functional difficulties, four or more chronic conditions, or three or more service needs. These children are also more likely than children with Medicaid/CHIP alone to have special health care needs and health that usually or always affects daily activities somewhat or a great deal. Medicaid coverage can address gaps in private coverage, and children covered by both Medicaid/CHIP and private insurance often have complex health needs and are more likely to be eligible for Medicaid through a disability-related pathway. Further, parent/caretakers of Medicaid/CHIP-only children with special education plans are also more likely to parent alone and face challenges with their own physical and mental health compared to those with private insurance only.

How has COVID-19 affected children’s access to special education services?

Many children with special education plans experienced missed or delayed services and loss of instructional time during the pandemic. One report estimates that school attendance and engagement has declined since the start of the pandemic, with early data suggesting larger declines for children with disabilities. A survey released early in the pandemic (May 2020) found 40% of parents of students with special education plans reported their child was not receiving any support, and only 20% reported their child was receiving all the services they required. School districts reported it was more or substantially more difficult to provide hands-on instruction accommodations and services such as speech, physical, or occupational therapy during pandemic school closures. Students with disabilities experienced a loss of instructional time, and may have started the 2021 school year up to one year behind. Remote learning may have also been hindered by a lack of access to the internet and assistive technology to which students with disabilities have access when attending school in-person. Low-income children and children of color faced increased health and economic challenges during the pandemic, and children with special education plans within these groups, many of whom are covered by Medicaid/CHIP, likely faced additional barriers to learning and accessing services during the pandemic.

Students with special education plans may be entitled to compensatory services to make up for lost skills due to school closures or other pandemic related service disruptions. The Department of Education (DOE) guidance advises special education teams to make individualized decisions about the needs for additional services as schools return to normal operations. The American Academy of Pediatrics noted the “critical” role of school-based services such as physical, occupational, and speech-language therapies and mental health services which often were disrupted during the pandemic. Other researchers have found service disruptions in these areas during the pandemic, noting that some services “may be challenging or even impossible to deliver virtually,” leaving children with special health care needs who could not receive in-person services with unmet needs. Further, according to DOE guidance, some children may be newly eligible for special education services, as those with disabilities related to long COVID can qualify for services under the IDEA or Section 504. For more information about eligibility under both laws, see Appendix A.

What are key issues to watch going forward?

As most schools returned to in-person learning in the fall of 2021, lawsuits have been filed in a number of states challenging government bans on school mask mandates as violating the rights of children whose health conditions put them at increased risk of severe illness or death from COVID-19. Although the CDC recommends distancing and masks for all staff and students regardless of vaccination status for in-person learning, some state and local governments have prohibited school districts from adopting school mask mandates. Multiple lawsuits have been filed arguing that these bans prevent children with disabilities from attending school safely in person, in violation of the Americans with Disabilities Act and Section 504. Federal district courts in Iowa, South Carolina, and Tennessee have granted preliminary injunctions blocking governors’ bans on school mask mandates. On the other hand, the 5th Circuit Court of Appeals has put on hold a Texas federal district court’s permanent injunction that blocked a governor’s ban on school mask mandates, which means that the ban will go into effect while the appeal is pending. Additionally, a Florida federal district court denied a motion for a preliminary injunction in a case seeking to block a similar governor’s ban. All of these cases are currently on appeal.

Some school districts are struggling to stay open amid the rapid spread of the Omicron variant. Despite calls from the Biden Administration, governors, and mayors for schools to remain open, many school districts have decided to temporarily return to remote learning following the recent spike in COVID-19 cases. School districts are facing high case rates among students and staff, making it difficult to re-open and maintain student safety. At the same time, returning to virtual learning makes it more difficult for school districts to provide all needed services to students with special education plans and may put these children at further risk for falling behind.

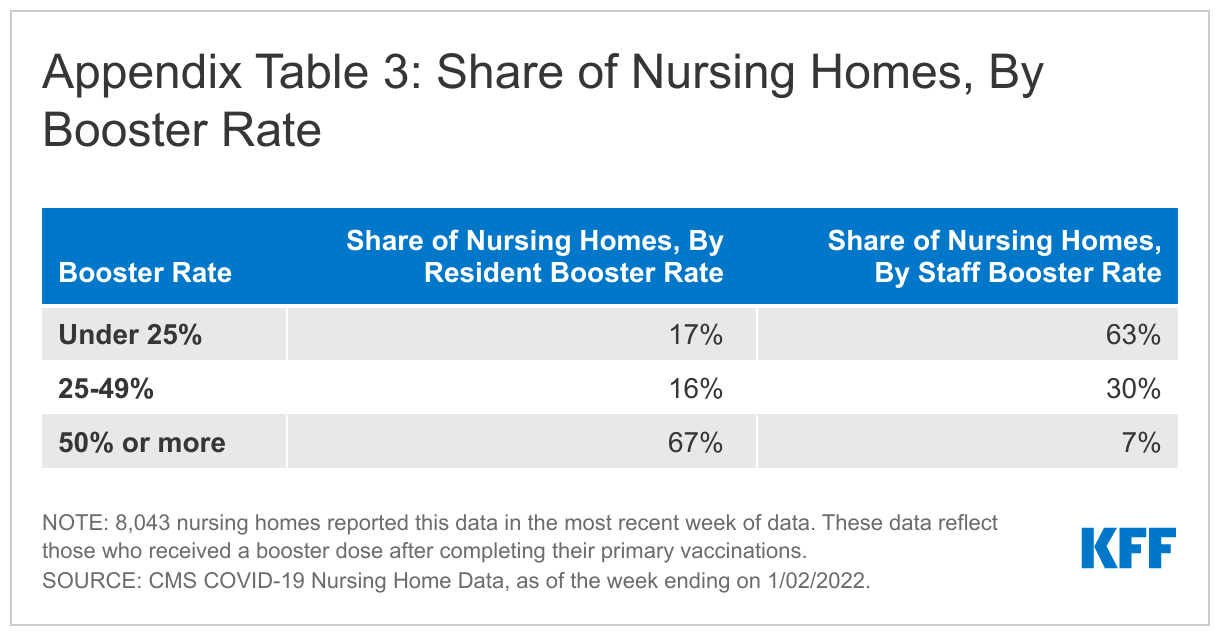
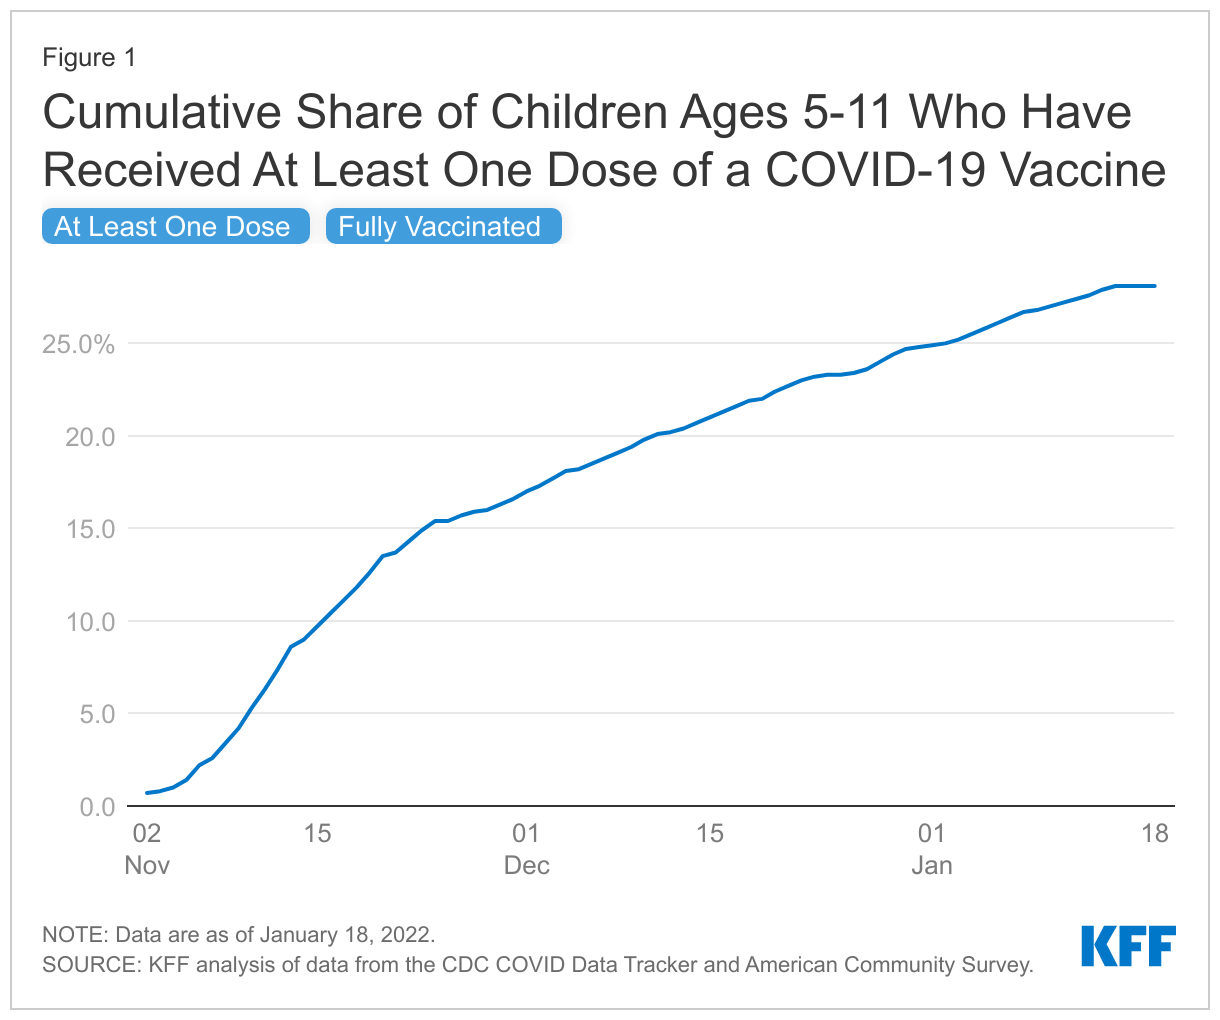
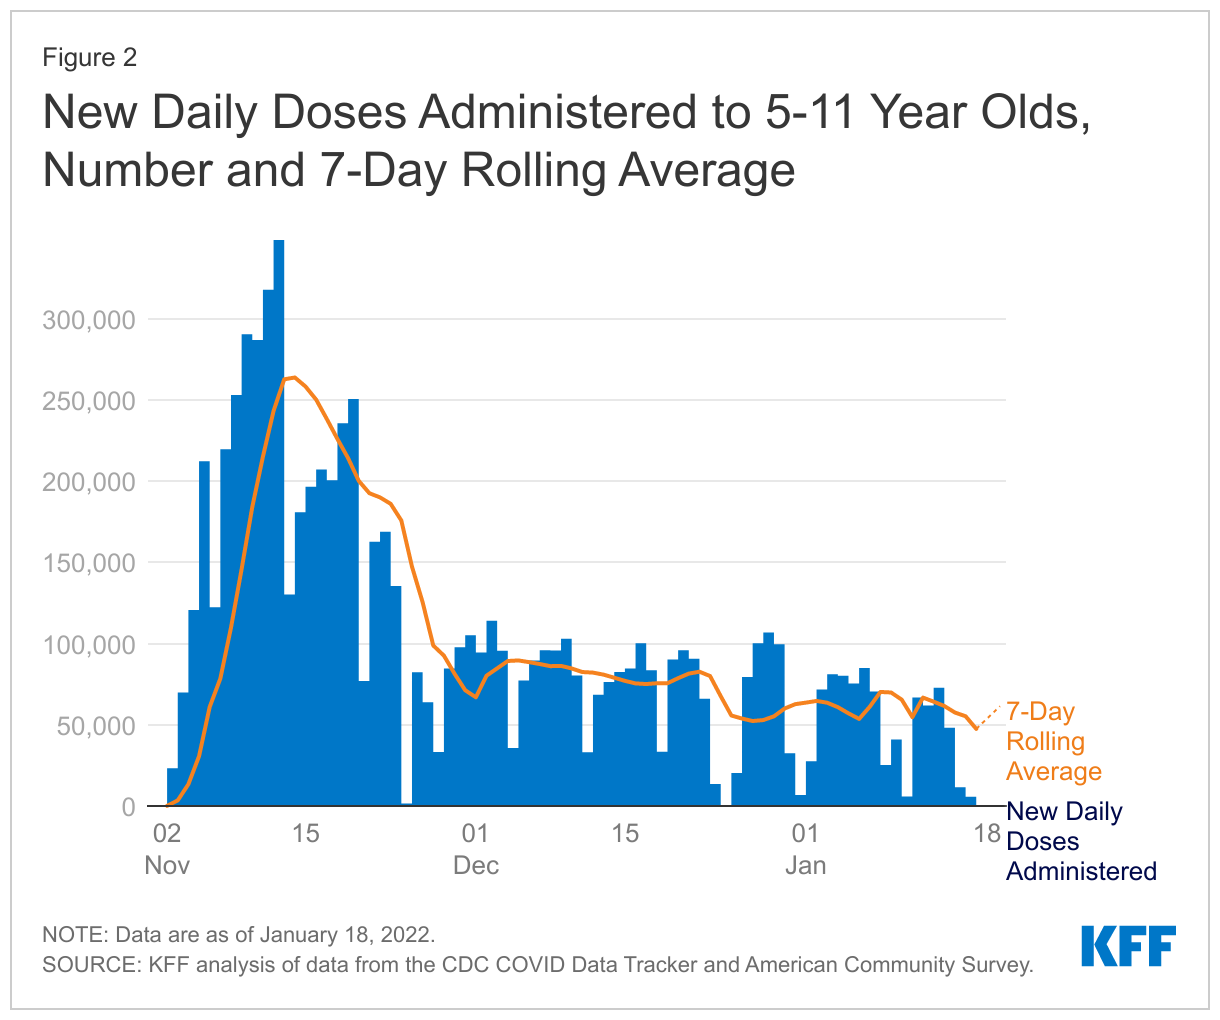
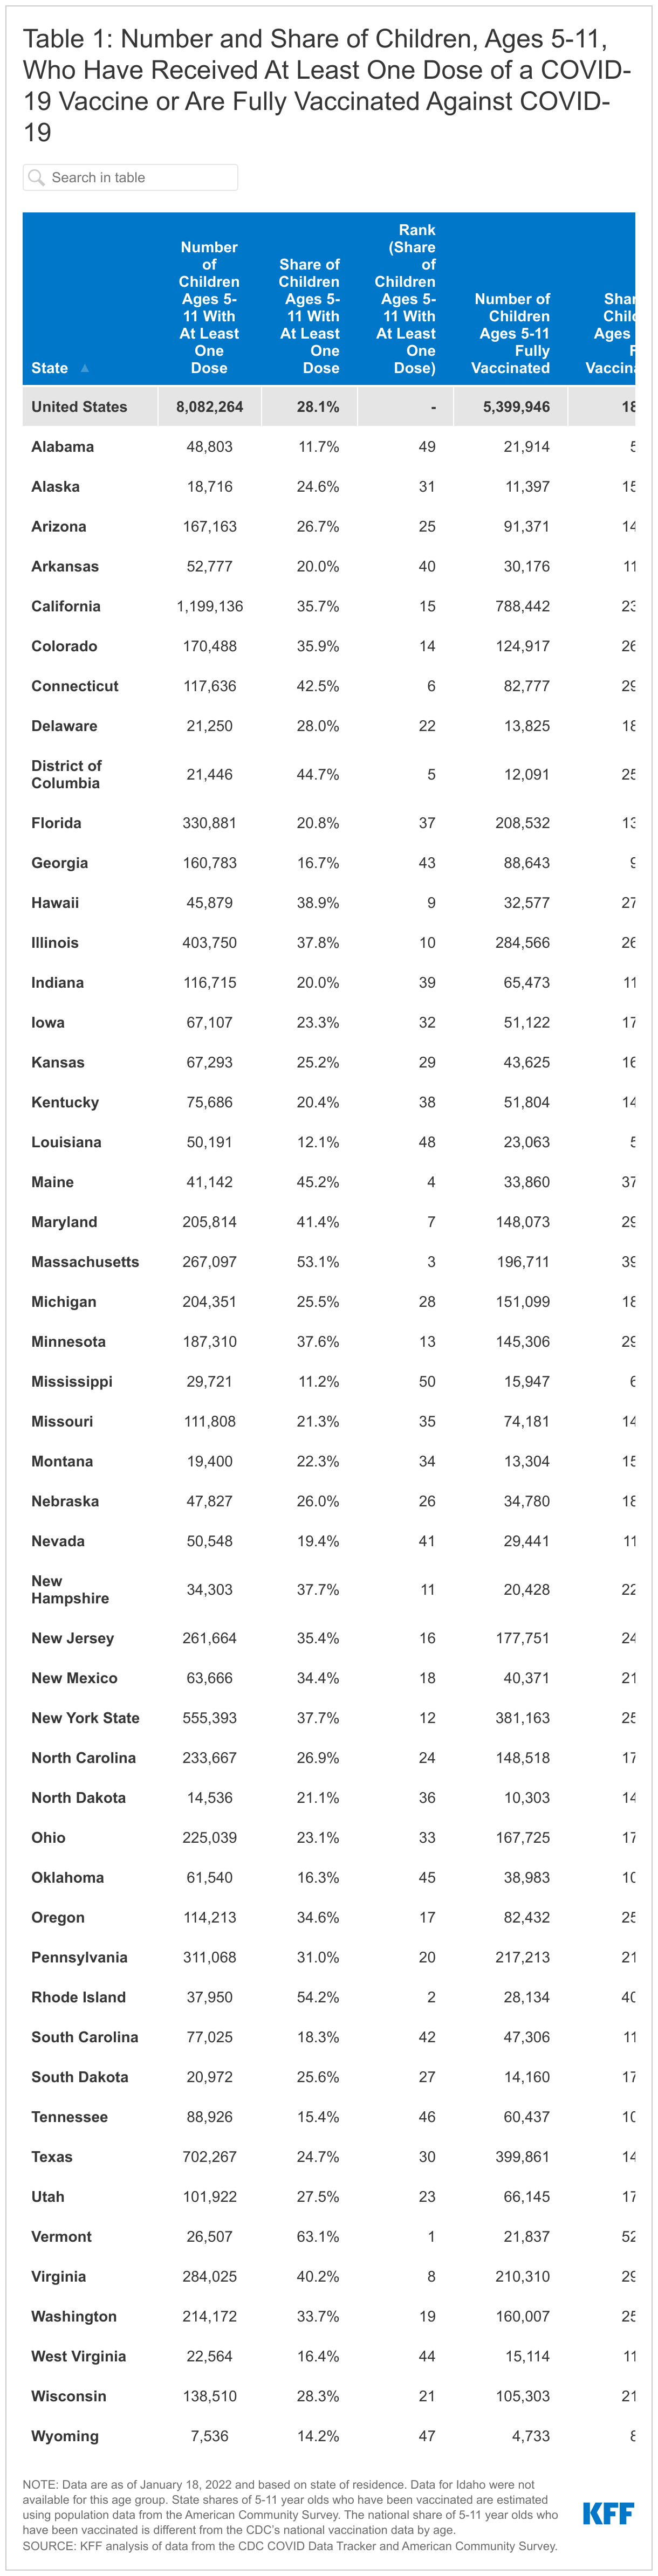
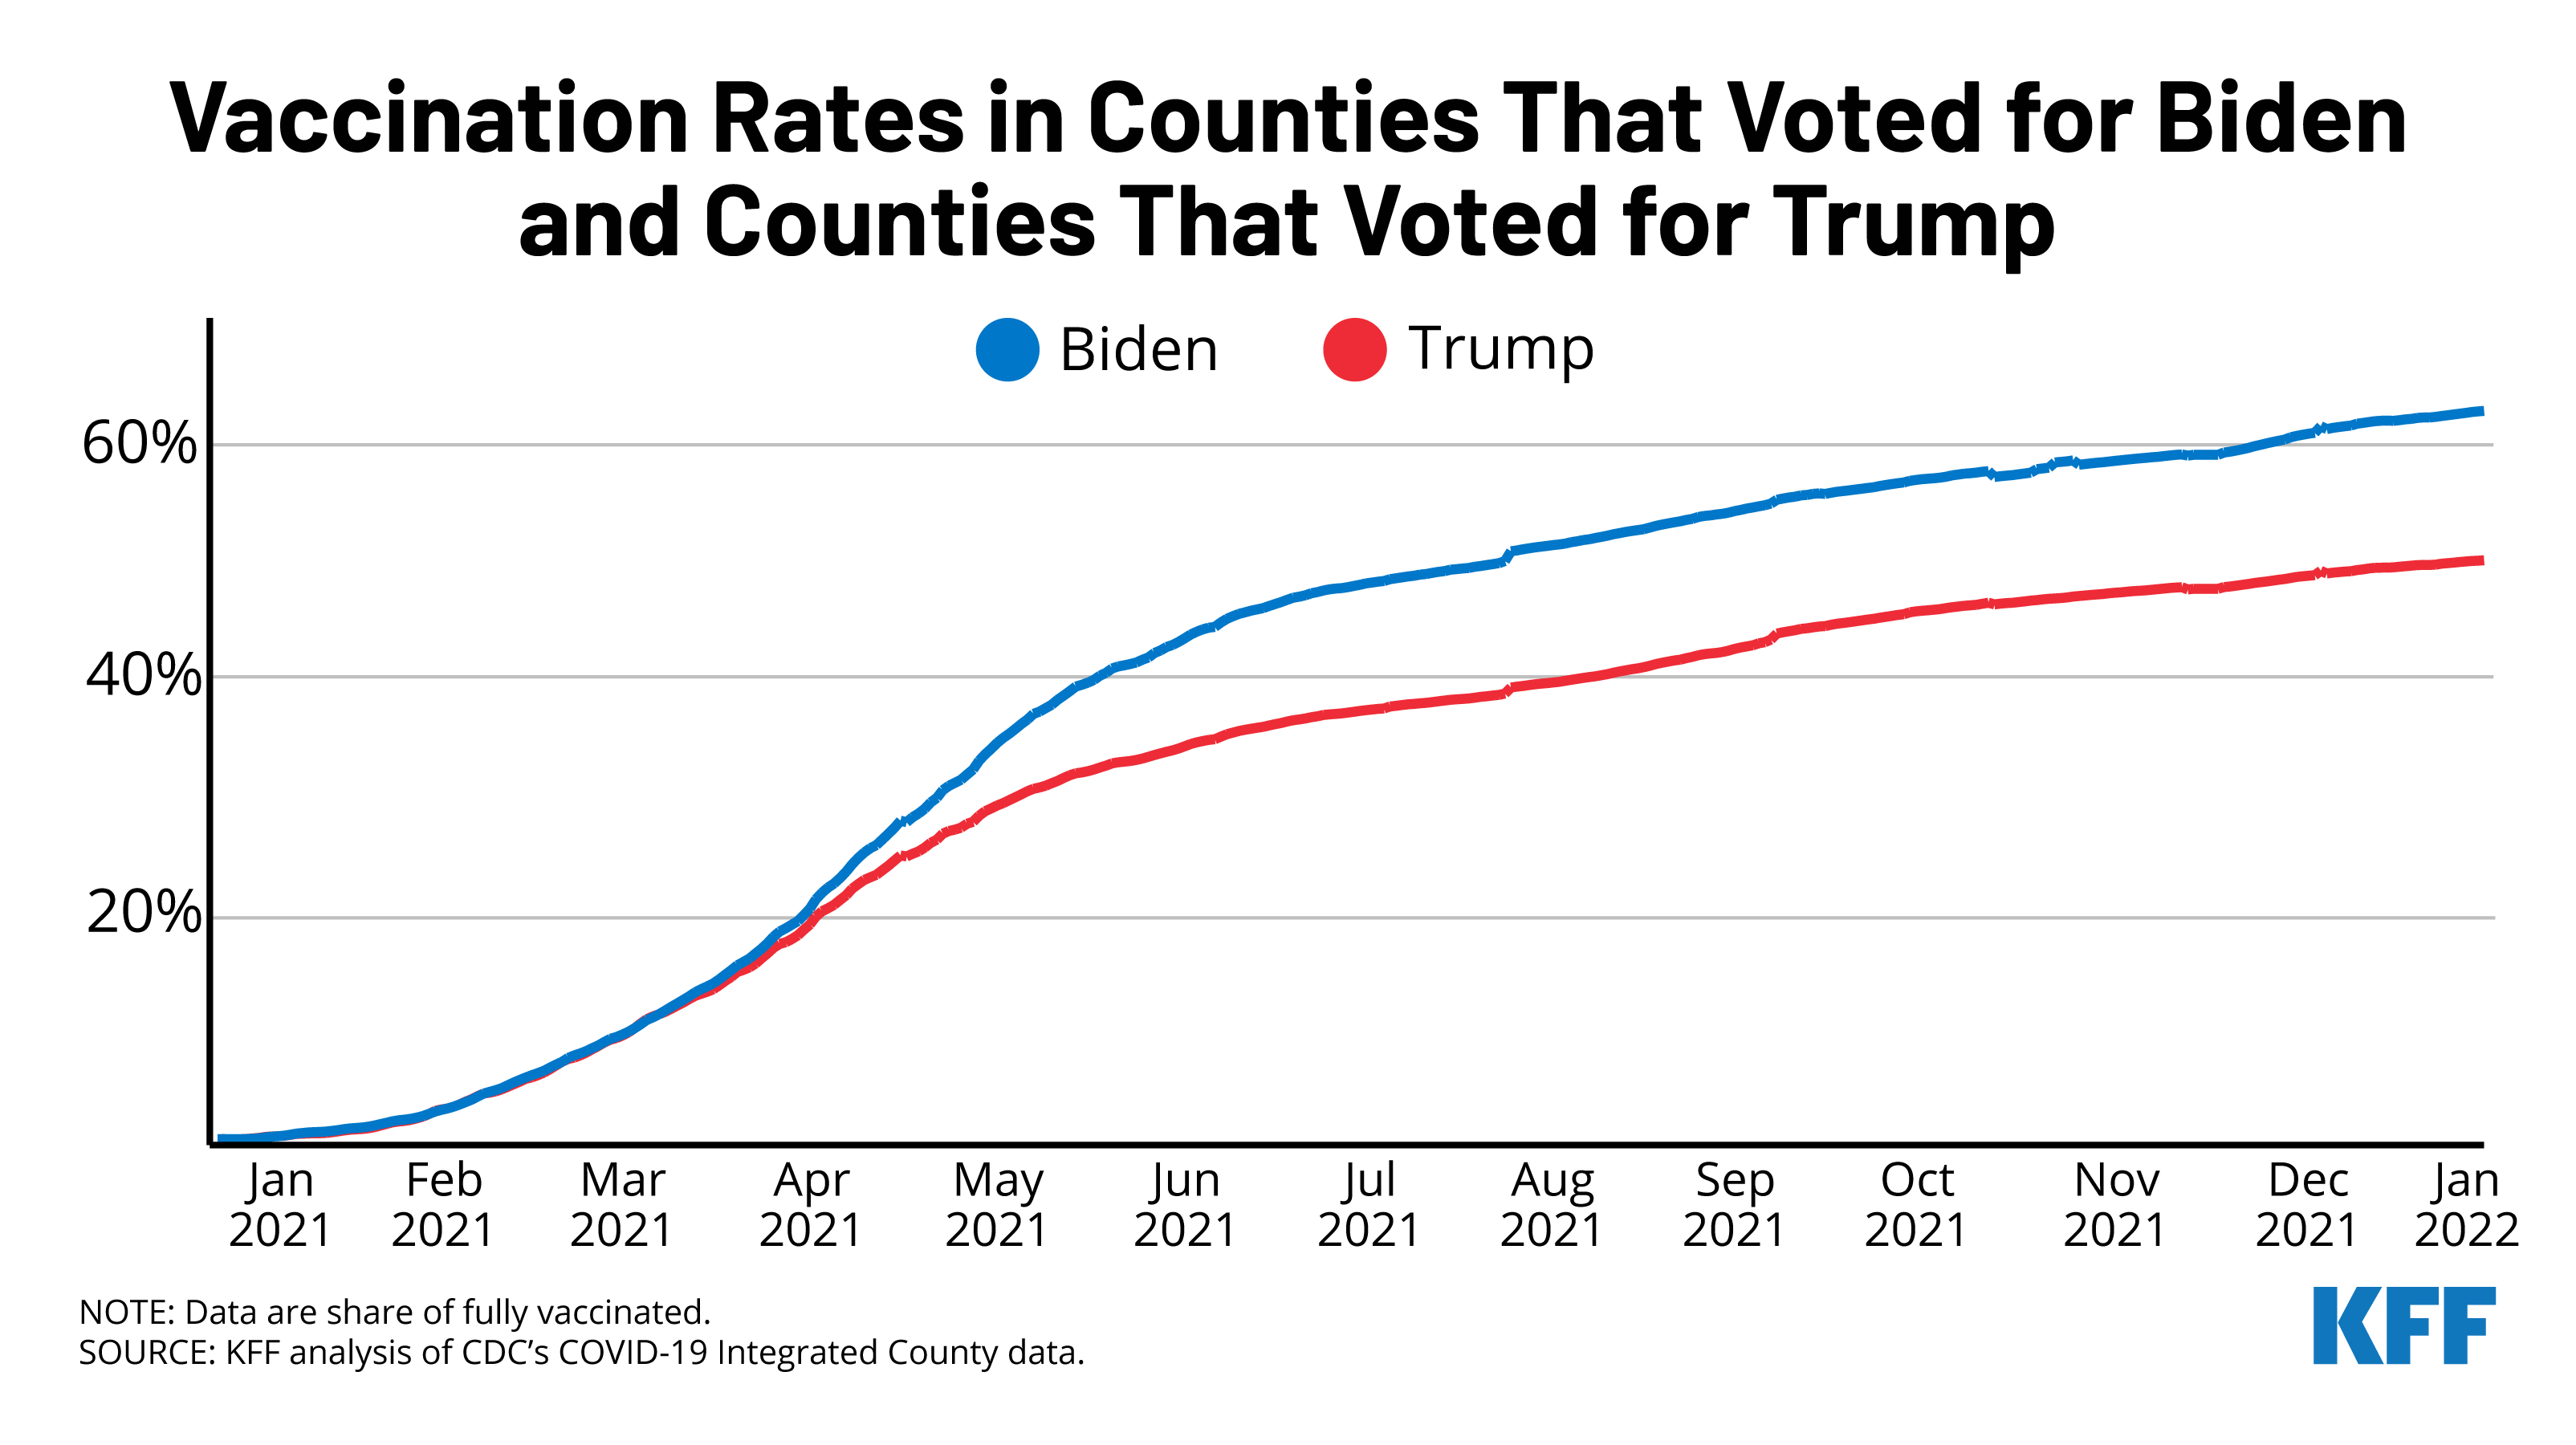
COVID-19 vaccine uptake among young children has slowed. Children ages 5 and older are now eligible to be vaccinated against COVID-19. Following an initial wave of enthusiasm and a slight uptick for a period in December, vaccine uptake among 5-11 year-olds, who recently became eligible, has declined. As of January 12, 2022, 27% of 5-11 year-olds and 64% of 12-17 year-olds have received at least one dose of the COVID-19 vaccine. There may be unique challenges to vaccinating young children, particularly those from low-income families who may face additional barriers to access, and Medicaid can play a role in facilitating access to vaccines for these children. Further, the US Food & Drug Administration’s (FDA) recently authorized booster shots of Pfizer-BioNTech’s COVID-19 vaccine for children ages 12 to 15.

Children who receive special education services already faced disparities compared to their non-disabled peers and lost instructional time and disruptions in access to related services during the pandemic have exacerbated those differences. Medicaid, together with CHIP, covers half of children with special education plans, and these children have greater health needs compared to children with special education plans covered by private insurance. This means Medicaid supports children with special education plans by providing both educationally and medically necessary services as well as ensuring that children receive the other medical and preventive services they need.

Methods

The data in this analysis draw from the 2020 National Survey of Children’s Health (NSCH), the most current data available. Parent responses to the questions “Has this child EVER had a special education or early intervention plan?...Children receiving these services often have an Individualized Family Service Plan or Individualized Education Plan” and “Is this child CURRENTLY receiving services under one of these plans?” were used to identify children who have a current special education plan. Children were determined to have a current special education plan if they have ever had a special education or early intervention plan and indicate they are currently receiving services under one of these plans. The NSCH and this analysis use the CSHCN Screener to identify children with special health care needs. To meet the criteria for having a special health care need, a child must experience a health consequence that is due to a medical or other health condition that has lasted or is expected to last for 12 months or longer. This analysis breaks down indicators by health insurance coverage status for children with special health care needs but does not include estimates for uninsured children or children who did not report coverage status. This is due to many of the estimates for these children not meeting the minimum standards for reliability.

Appendices

Appendix A

What does federal special education law require?

Under the federal Individuals with Disabilities Education Act (IDEA), school districts must provide children with disabilities with the services necessary to receive a “free appropriate public education.” 6  The IDEA applies to children from birth through age 217  and also provides federal funds to assist states with meeting these obligations. Under the IDEA’s “child find” requirement, states must identify and evaluate all children with disabilities, including those who are homeless and those who attend private schools.8  A parent also may request an evaluation for their child. A team of “qualified professionals” and the child’s parent then reviews the evaluation findings to determine whether the child meets the IDEA’s definition of a “child with a disability.”9  Children qualify if they are in need of special education and related services due to an intellectual disability, hearing impairment, speech language impairment, visual impairment, emotional disturbance, orthopedic impairment, autism, traumatic brain injury, another health impairment, specific learning disability, deaf-blindness, or multiple disabilities.10 

In addition to special education services, children with disabilities may be entitled to “related services” such as therapies or other supportive services. “Related services” include transportation as well as “developmental, corrective, and other supportive services as are required to assist a child with a disability to benefit from special education.”11  Types of related services include speech-language pathology and audiology, interpreting, psychological, physical and occupational therapy, recreation, counseling, orientation and mobility, school health and school nurse, social work in schools, and parent counseling and training. Related services do not include medical services, unless used for diagnostic or evaluation purposes.

Children who qualify for special education must be served in the “least restrictive environment.” This means that children with disabilities must be educated with their nondisabled peers “to the maximum extent appropriate.” Children with disabilities may be placed in separate classes or separate schools or otherwise removed from the regular education environment “only if the nature or severity of the disability is such that education in regular classes with the use of supplementary aids and services cannot be achieved satisfactorily.”12 

A team determines the services that a child receives and the child’s educational placement. The team includes the child’s parent, a regular education teacher, a special education teacher, a school district representative, and someone who can interpret the instructional implications of evaluations. The team also may include other individuals with knowledge or special expertise, such as related services personnel, and should include the child “whenever appropriate.”13  Notably, a child with a disability under the IDEA does not have to receive all of the special education and related services that would enable them to achieve their maximum potential. Instead, according to the U.S. Supreme Court, school districts only must provide services that are “reasonably calculated to enable a child to make progress appropriate in light of the child’s circumstances.”14 

Children who do not qualify for special education services under the IDEA may be eligible for reasonable accommodations under Section 504 of the Rehabilitation Act. This federal law prohibits disability-based discrimination in programs or activities that receive federal financial assistance, including public schools. Students qualify under Section 504 if they have a physical or mental impairment that substantially limits one or more major life activities. Examples of major life activities include caring for one's self, performing manual tasks, walking, seeing, hearing, speaking, breathing, learning, and working.15  Children with disabilities who are eligible under Section 504 may receive “regular or special education and related aids and services designed to meet the[ir] individual educational needs. . . as adequately as the needs of students without disabilities are met.”16  Examples of reasonable accommodations that may be in a Section 504 plan, depending on a child’s needs, include extra time to take tests or materials in alternative formats.

Appendix B

Appendix B Table 1: Children with Special Education Plans Covered by Medicaid/CHIP by State, 2020
Appendix B Table 2: Characteristics of Children with Special Education Plans by Coverage Type, 2020

Endnotes

  1. KFF analysis of 2020 National Survey of Children’s Health. ↩︎
  2. Defined as children receiving special education services under special education or early intervention plan (often an Individualized Education Plan or Individualized Family Service Plan) as identified by a parent. ↩︎
  3. As defined by the U.S. Department of Health and Social Services, these children “have or are at increased risk for chronic physical, developmental, behavioral or emotional conditions and also require health and related services of a type or amount beyond that required by children generally.” U.S. Department of Health & Human Services, Health Resources & Services Administration, Maternal & Child Health, Children with Special Health Care Needs (Date Last Reviewed: March 2019), https://mchb.hrsa.gov/maternal-child-health-topics/children-and-youth-special-health-needs#ref1. ↩︎
  4. 20 U.S.C. § 1412 (a)(12)(A); 42 U.S.C. § 1396b (c); 34 C.F.R. § 300.142 (a)(1). ↩︎
  5. 42 U.S.C. §§ 1396a (a)(43); 1396d (r)(5). ↩︎
  6. 20 U.S.C. § 1401 et seq. ↩︎
  7. Children from birth until age 3 may receive early intervention services through an “individualized family service plan,” while those ages 3 through 21 may receive special education and related services through an “individualized education program.” 20 U.S.C. § 1414 (d); 34 C.F.R. § 300.320. ↩︎
  8. 34 C.F.R. § 300.111. ↩︎
  9. 34 C.F.R. § § 300.301-300.306. ↩︎
  10. 34 C.F.R. § 300.8 (a). ↩︎
  11. 34 C.F.R. § 300.34 (a). ↩︎
  12. 34 C.F.R. § 300.114. ↩︎
  13. 34 C.F.R. § 300.321. ↩︎
  14. Endrew F. v. Douglas Cty. Sch. Dist., 137 S. Ct. 988, 999 (2017). ↩︎
  15. 34 C.F.R. § 104.3(j)(2)(ii). ↩︎
  16. U.S. Dep’t of Education, Office for Civil Rights, Protecting Students with Disabilities, Frequently Asked Questions About Section 504 and the Education of Children with Disabilities (last accessed Nov. 18, 2021), https://www2.ed.gov/about/offices/list/ocr/504faq.html. ↩︎

Providing an Equal Number of Free COVID-19 Tests to U.S. Households Results in Inequitable Access

Published: Jan 20, 2022

The Biden Administration this week launched a website and toll-free phone line allowing people to request four COVID-19 tests per household. These tests would be provided by the federal government as part of an effort to expand access to at-home tests, which have been in limited supply.

Directly mailing an equal number of free tests to households through the U.S. Postal Service (USPS) will increase availability and allow for faster implementation. Moreover, mailing free tests may increase access for people who are not able to pay upfront costs to purchase tests from retailers and/or who do not have health insurance to reimburse test costs. The White House also has indicated that the first 20% of each day’s orders will go to areas that experienced high rates of cases and deaths, which will help ensure that disproportionately affected areas are among those first to receive them.

However, providing an equal number of tests to every household without accounting for size of the household or the risk of household members will result in inequitable access to the tests. Other countries are distributing free tests at the individual level—the United Kingdom, for example, allows individuals to order up to seven tests per day through a website or phone line, which are mailed to their home or available for pick up from a local pharmacy or checkpoint.

Hispanic, Asian, and Black people are more likely than White people to live in households with more than four people, where not everyone will receive a free COVID-19 test from the federal government. Hispanic, Asian, and Black people also are more likely than White people to live in multi-unit structures, like apartments. Early reports suggested that some people living in multi-unit buildings were not able to order COVID-19 tests because an order was already marked to their address. However, the USPS told news outlets that the problem affected a “small percentage of orders,” and White House officials said the government is working to address website bugs. Analysis further shows that Hispanic and Black people are less likely to have internet access at home, making it more challenging for them to order tests without a phone option. At the same time, people of color likely have increased need for tests because they often are employed in jobs that cannot be done remotely.

This inequity in access to free tests is yet another example of the consistent theme of inequities over the course of the pandemic. Compared to their White counterparts, people of color have faced increased risk of exposure to the virus, suffered more illness and death, and faced more barriers to accessing protective equipment, testing, care, and treatment, as well as vaccines. These disparities in COVID-19 mirror and are driven by underlying inequities in health and health care that are rooted in racism and discrimination. Policies that do not recognize or account for underlying differences and inequities will perpetuate and further widen disparities going forward.

News Release

How are Large Private Insurers Covering At-Home Rapid Tests?

Published: Jan 20, 2022

Less than a week after a new federal mandate to cover such products took effect, about half of the nation’s largest private insurers allow enrollees to directly obtain rapid at-home COVID-19 tests from specific sources without having to pay anything upfront, a new KFF analysis finds.

The new coverage requirement took effect Jan. 15, just five days after the Biden administration released detailed guidance about implementing the new requirements originally announced on Dec. 2..

The analysis examines how the 13 private insurers with at least a million enrollees are currently implementing the requirement, including how enrollees can obtain tests, submit claims and get reimbursed. These insurers collectively cover more than half of all people covered in the fully insured commercial market.

Key findings include:

  • Seven of the insurers – Anthem, Blue Cross Blue Shield of Michigan, Blue Shield of California, Care First, Cigna, CVS Group/Aetna, and Kaiser Permanente – currently require enrollees to pay for their tests upfront and seek reimbursement. Their reimbursement policies vary, with some requiring mail-in forms, some allowing online submissions. Three require claims to include the product’s barcode.
  • Six of the insurers- Blue Cross Blue Shield of North Carolina, Centene/Ambetter, Guidewell (Florida Blue), Health Care Service Corporation, Humana, and United Health Group– allow enrollees to obtain rapid tests directly from an in-network or preferred pharmacy without having to pay anything up front. A seventh – Kaiser Permanente – indicates that they plan to offer such an option in the future. These insurers generally limit reimbursements for tests purchased elsewhere to $12 per test.

A separate brief examines how states are implementing Medicaid’s requirements to cover rapid at-home tests at no cost to enrollees, as required by the American Rescue Plan of 2021.

Under the Families First Coronavirus Response Act (FFCRA) and the Coronavirus Aid, Relief, and Economic Security (CARES) Act, two COVID-19 emergency measures passed by Congress, private insurance companies generally have been required to cover COVID-19 tests ordered by providers, typically those conducted on site, such as in clinical or pop-up environments (providers can also seek federal reimbursement for testing uninsured patients). This broad coverage requirement has been in place since the early days of the pandemic, and the only exceptions are that private insurers do not have to reimburse for tests conducted for public health surveillance or workplace requirements. (more…)

How Are Private Insurers Covering At-Home Rapid COVID Tests?

Authors: Lindsey Dawson, Krutika Amin, Jennifer Kates, and Cynthia Cox
Published: Jan 20, 2022

Under the Families First Coronavirus Response Act (FFCRA) and the Coronavirus Aid, Relief, and Economic Security (CARES) Act, two COVID-19 emergency measures passed by Congress, private insurance companies generally have been required to cover COVID-19 tests ordered by providers, typically those conducted on site, such as in clinical or pop-up environments (providers can also seek federal reimbursement for testing uninsured patients). This broad coverage requirement has been in place since the early days of the pandemic, and the only exceptions are that private insurers do not have to reimburse for tests conducted for public health surveillance or workplace requirements. (more…)

Under the Families First Coronavirus Response Act (FFCRA) and the Coronavirus Aid, Relief, and Economic Security (CARES) Act, two COVID-19 emergency measures passed by Congress, private insurance companies generally have been required to cover COVID-19 tests ordered by providers, typically those conducted on site, such as in clinical or pop-up environments (providers can also seek federal reimbursement for testing uninsured patients). This broad coverage requirement has been in place since the early days of the pandemic, and the only exceptions are that private insurers do not have to reimburse for tests conducted for public health surveillance or workplace requirements. (more…)

Medicaid and At-Home COVID-19 Tests

Author: Robin Rudowitz
Published: Jan 20, 2022

As COVID cases have surged across the United States due to the new Omicron variant, the Biden Administration has stepped up efforts to expand testing capacity including by making at-home COVID tests more available.  Recent efforts include a new program that started January 18th to allow every household to order 4 free at-⁠home COVID-⁠19 tests from COVIDtests.gov; increasing the number of COVID tests available to schools and community health centers; standing up new federal free-testing centers; and requiring private health insurers to cover the costs of at-home COVID tests.  While there has been a lot of attention paid to coverage and reimbursement requirements for at-home tests for people with private insurance, there seems to be confusion about how Medicaid enrollees can access at-home COVID tests.

What are the rules for Medicaid coverage of at-home tests?

Recent press releases and FAQs note that in accordance with the American Rescue Plan Act (ARPA), State Medicaid and Children’s Health Insurance Program (CHIP) programs are currently required to cover FDA-authorized at-home COVID-19 tests without cost-sharing. In August 2021, the Centers for Medicare and Medicaid Services (CMS) issued guidance about coverage and reimbursement of COVID-19 testing under the ARPA for Medicaid and CHIP.  The guidance says that “all types of FDA-authorized COVID-19 tests must be covered under CMS’s interpretation of the ARP COVID-19 testing coverage requirements, including, for example, “point of care” or “home” tests that have been provided to a Medicaid or CHIP beneficiary by a qualified Medicaid or CHIP provider of COVID-19 tests.”  It further indicates states have discretion to condition coverage of a home test on a prescription as part of their utilization management or apply medical necessity criteria. The guidance also says that “as states establish utilization management techniques, including possible prescription conditions, they are encouraged to do so in ways that do not establish arbitrary barriers to accessing COVID-19 testing coverage, but that do facilitate linking the reimbursement of a covered test to an eligible Medicaid or CHIP beneficiary.”

Given that Medicaid covers low-income individuals, Medicaid rules would allow individuals to access at-home COVID-19 tests without having to pay out of pocket and then seek reimbursement.  Under the new federal rules, private insurance must reimburse for up to 8 tests per member per month, however, in many cases this may require individuals paying out of pocket and then filing for reimbursement from insurance.  There is no mechanism in Medicaid to provide similar direct reimbursement to enrollees, so even if enrollees could afford to pay out of pocket, they could not recoup costs in the same way.

How are states implementing these rules?

As with most rules for Medicaid, states have some discretion and flexibility in how they provide coverage and reimbursement for at-home tests so there may be variation across states in how easily enrollees can access at home tests.  While state policy and bulletins are evolving, a number of states are using a standing order to allow Medicaid enrollees to obtain at-home tests from a retail pharmacy with no cost sharing.  For example:

  • A bulletin in North Carolina says that “effective Jan. 10, 2022, NC Medicaid-enrolled pharmacies may bill for FDA approved over-the-counter (OTC) COVID-19 tests dispensed for use by NC Medicaid beneficiaries in a home setting, with or without a prescription issued by a NC Medicaid-enrolled provider…NC Medicaid will cover one kit per claim per date of service, with a maximum of four test kits every 30 days.” The bulletin specifies which tests will be covered, how the pharmacy can claim Medicaid reimbursement and that there is no copayment.
  • A Massachusetts bulletin states that effective January 14, 2022, at-home antigen self-test kits are covered through the MassHealth pharmacy benefit without prior authorization with a limit of eight test kits per member per month (additional tests can be covered with prior authorization on a case-by-case basis). The Department of Public Health issued a statewide standing order that allows licensed pharmacists to dispense self-test kits to any individual, and to treat that standing order as a prescription for any such test kit. Accordingly, an individual prescription is not required for any such test kit. Additional guidance directs Medicaid Managed Care Organizations (MCOs) and the Program of All-inclusive Care for the Elderly (PACE) to provide coverage for at-home tests as well.
  • In December, Maine and Vermont also issued guidance that pharmacies may now bill for select at-home tests for Medicaid and specified that the a pharmacists can be the prescribing provider through the use of a standing order.

Under the rules, states can require a prescription for the at-home tests.  For example, New York issued guidance in December 2021 confirming Medicaid coverage of FDA-approved at-home tests ordered by a Medicaid-enrolled practitioner.  The bulletin requires a fiscal order (similar to a prescription) for each at-home test kit and limits coverage to one test kit per week.  The bulletin specifies that while the coverage policy applies to all types of plans, the COVID-19 testing billing and reimbursement may vary across MCOs.  It is not clear how many states are imposing prescriptions or other utilization management techniques.

What are key issues to watch for Medicaid enrollees?

As states continue to update and adopt policies about coverage for at-home tests, it will be important to provide outreach and education to facilitate access.  If enrollees are not aware of a policy that may enable them to access at-home tests from a pharmacy without cost-sharing, they may not seek out at-home tests at all due to the cost.  State Medicaid agencies, pharmacies, and managed care plans could help inform enrollees about coverage policies.

Variation in Medicaid policies about coverage and access to at-home tests will make national education efforts challenging.  It will be important to see how quickly and effectively new efforts to increase general supply of at-home tests work to address current shortages.  Many Medicaid enrollees work in jobs where they are at risk of contracting COVID-19 (such as health care, retail or food service) with top occupations among Medicaid workers include cashiers, drivers, janitors, and cooks.  Given these types of jobs, Medicaid enrollees may require even greater access to at-home testing to ensure they can follow isolation protocols if they test positive.

Key Questions About Nursing Home Cases, Deaths, and Vaccinations as Omicron Spreads in the United States

Published: Jan 20, 2022

Staff and residents at long-term care facilities were hit hard by the pandemic, reporting over 195,000 deaths as of the end of 20211 , or about 23% of all COVID-19 deaths in the U.S. After a dramatic surge, cases and deaths in long-term care facilities (including nursing homes, assisted living facilities, ICF/IIDs, and other settings) dropped following the vaccine rollout in the Winter of 2020-2021, according to a KFF analysis. Since then, nursing home cases and deaths have mostly risen and fallen in tandem with national cases and deaths, although they are once again on the rise as Omicron has taken hold in the U.S.

This data note analyzes federal nursing home data as of January 2nd, 2022 to determine the impact of the pandemic on COVID-19 cases and deaths among staff and residents, amid the recent surge of national cases due to the Omicron variant. The data on overall U.S. and nursing home cases and deaths in this analysis reflects data reported over the holiday season, which may include delayed, disrupted, or otherwise anomalous reporting. Additionally, since increases in deaths lag increases in cases, it is not yet clear the extent to which the surge in Omicron will affect mortality. See methods box for more details.

Cases and deaths in nursing homes are rising, generally mirroring current trends in the overall U.S., though rates have recently started to rise faster in nursing homes (Figure 1 and Appendix Table 1). In the week ending January 2nd, 2022, nursing homes reported 18.75 resident cases per 1,000 residents, a 225% increase from the week prior, and 0.54 resident deaths per 1,000 residents, a 48% increase from the week prior.

Cases among nursing home staff have increased at an even steeper rate, with staff cases per 1,000 staff increasing by 277%. These patterns look mostly similar to the current rise in cases and deaths across the U.S., aligning with the general pattern observed over the course of the pandemic.

In the week ending January 2nd, nursing home residents and staff reported higher case rates (per 1,000) than the overall U.S. population, and higher death rates (per 1,000) among nursing home residents (Figure 1 and Appendix Table 1). According to the most recent data available, the case rate was higher for nursing home staff (28.43 per 1,000) than for nursing residents (18.75 per 1,000), both of which were higher than the overall U.S. average (9.03 cases per 1,000). Nursing homes reported 0.54 resident deaths per 1,000 residents, which is over 25 times the death rate reported in the general population (0.02 deaths per 1,000). Higher case rates may be attributed to the highly transmissible nature of Omicron and the nature of congregate care settings. Higher death rates may be attributed to the high-risk status of those who reside in nursing homes.

Weekly COVID-19 Cases and Deaths Per 1,000, 8/29/2021-1/2/2022

How have vaccination rates changed over time for nursing home residents and staff?

Staff vaccination rates remained five percentage points lower than resident vaccination rates as of the week ending January 2nd (87% vs. 82%), though staff vaccination rates increased by nearly 26 percentage points between June and early January 2022 (Figure 2). Residents and staff started receiving vaccinations in December 2020 through the Pharmacy Partnership for Long-Term Care. Resident uptake was initially higher than that of staff, leading to higher early vaccination rates. When nursing home vaccination data first became available in June 2021, a much larger share of residents (79%) than staff (56%) were vaccinated. A key reason staff vaccination may have increased since June 2021 is that the Biden administration announced a nursing home staff vaccine mandate in August 2021 as a condition for facilities to continue receiving Medicare and Medicaid funding2 . Lawsuits have been filed challenging the mandate, but Supreme Court has ruled that the mandate can take effect while the cases play out in the lower courts.  The increase in staff vaccination rates may also be partially attributed to unvaccinated staff leaving their positions. For the most recent period, a larger share of facilities reports very high (85%+) vaccination rates among residents (in 71% of facilities) than among staff (in 44% of facilities) (Appendix Table 2).

Nursing Home Resident and Staff Vaccination Rates

What do we know about the boosters for nursing home residents and staff?

In the week ending January 2nd, about 54% of nursing homes (8,043) reported data on cases, deaths, and boosters. In this sample of nursing homes, about 55% of residents had received a booster compared to just 22% of staff (Figure 3). These values represent the share of all residents and staff who have received their booster, although some may not have been eligible for their booster by January 2nd. Individuals who received the Pfizer-BioNTech or Moderna vaccines become eligible for boosters five months after completing their primary vaccination series. Individuals who received Johnson & Johnson’s Janssen vaccine are eligible for boosters two months after receiving their shot. Since many residents received their vaccinations earlier than the staff, residents were likely eligible and received their booster earlier than staff. The share of residents and staff who are boosted will continue to increase as more residents and staff become eligible, though data on vaccinations suggests that staff booster rates may not reach levels of resident boosters regardless of eventual eligibility.

Among the nursing homes in the sample reporting data for the week ending January 2nd, a small share (7%) reported staff booster rates of 50% or higher, while over two thirds (67%) of these nursing homes reported resident booster rates of 50% or higher (Appendix Table 2). Previous research suggests a myriad of factors impact cases and deaths in nursing homes including, but not limited to, resident acuity, surrounding community spread, and facility size. Recent hospital data showing higher levels of severe illness and death among those who are unvaccinated suggests that vaccination and booster rates may be a key consideration as well. Our analysis found that nursing homes with low resident booster rates reported higher average resident cases and higher average resident deaths in the week of data analyzed. Similarly, facilities with low staff booster rates reported higher average staff cases (Figure 3). While vaccination and booster rates should be considered alongside other factors, they likely play a key role in protecting those who live and work in these congregate care settings.

Nursing Homes Boosters Among Residents and Staff

Looking Ahead

This data notes suggests that the Omicron variant has made its way into nursing homes, once again raising concerns about the impact on residents and staff. While there is growing evidence that Omicron is less likely to cause severe illness than previous variants, older adults and those with other health conditions are still at greater risk. Given the particularly high-risk nature of residents in these settings and the experience of residents and staff earlier in the pandemic, nursing homes may see a significant increase in deaths following this increase in cases. Numerous studies have shown that those that are fully vaccinated and boosted are highly protected against the new variant, a finding which increases the urgency to increase vaccination and booster rates among unvaccinated and unboosted residents and staff in nursing homes. Lawsuits have been filed challenging the vaccine mandate for health care staff, a key policy lever that policymakers and other stakeholders can use to increase vaccination rates among unvaccinated staff. However, the Supreme Court has ruled that the mandate can take effect while the cases play out in lower courts. As Omicron continues to break case and hospitalization records, increasing vaccination and booster rates will be an important protection against illness and death for nursing home residents and staff.

Appendix Tables

Appendix Table 1: COVID-19 Cases and Deaths
Appendix Table 2: Share of Nursing Homes, By Vaccination Rates
Appendix Table 3: Share of Nursing Homes, By Booster Rate

Methods

This analysis uses federal data on coronavirus cases and deaths in nursing homes, which includes weekly data as of mid-May 2020 through January 2nd, 2022. These data are updated regularly to reflect revised data from previous weeks, so future versions of this dataset reflecting the same time period may output different values. This analysis excludes suspected cases from the definition of nursing home cases among residents and staff. Data on U.S. cases and deaths are calculated based on the number of nationwide cases and deaths from the CDC minus nursing home cases and deaths; we make this adjustment to account for possible endogeneity (that is, cases or deaths in nursing homes contributing to the patterns in COVID-19 cases and deaths nationwide). Given the current underreporting of at-home rapid antigen and PCR tests, it is likely that cases in this analysis are undercounted. The federal data includes only data on federally certified nursing homes. This analysis therefore does not include data on other long-term care settings, such as assisted living facilities, residential care facilities, group homes, or intermediate care facilities.

Previous analysis used state-reported data on long-term care facility cases and deaths, which represented a more comprehensive set of facilities. Due to a drop-off in reporting regularity and lack of consistency in states overtime, this analysis uses federal data to be able to trend cases and deaths in nursing homes since June 2020.

  1. This statistic was calculated by adding the nearly 187,000 long-term care COVID-19 deaths identified from KFF data collection efforts that ended June 30th, 2021 with the approximately 8,700 COVID-19 deaths nursing homes have reported to CMS since June 30th, 2021. This death count is an undercount since CMS data does not account for deaths in non-nursing home settings and not all nursing homes report complete data. ↩︎
  2. The new rule applies to Medicare and Medicaid providers that are directly regulated by CMS and therefore does not reach all Medicaid providers, such as certain home and community-based services (HCBS) providers. The rule applies to nursing homes, hospitals, outpatient rehab facilities, federally qualified health centers, rural health centers, and home health agencies, among other provider types. ↩︎

Update on COVID-19 Vaccination of 5-11 Year Olds in the U.S.

Published: Jan 20, 2022

It’s been more than two months since the Centers for Disease Control and Prevention (CDC) recommended Pfizer’s COVID-19 vaccine for children, ages 5-11, in the United States. We previously assessed pediatric vaccination uptake, finding that, after initial high demand, it had already slowed significantly. We also found a wide range in vaccination rates by state. Since that time, Omicron has become the dominant variant in the U.S. and COVID-19 cases, hospitalizations, and deaths are rising again.

Here, we provide an update on the vaccination status of 5-11 year-olds, through January 18, 2022. It is based on analysis of national and state-level vaccination data obtained from the CDC’s Data Tracker (see methods below). Overall, we find that the number of first doses newly administered to 5-11 year-olds remains far below its early peak and although there was a slight uptick for a period in December, it has again declined. There also remains a large gap – of 52 percentage points – between the most vaccinated and least vaccinated states. Specific findings include:

  • Nationally, more than a quarter (28.1%) of 5-11 year-olds had received at least one COVID-19 vaccine dose as of January 18, 2022. This represents just over 8 million of the approximately 28 million children in this age group in the United States. Given the two dose Pfizer regimen, administered three weeks apart, and the need for a two-week period afterward to be considered to have completed the vaccine series, just 18.8% of children have reached this point.
  • The rate of vaccination among 5-11 year-olds reached its peak before Thanksgiving and then dropped steeply. Vaccination rates among 5-11 year-olds, as measured by first doses administered daily, rose sharply for the two-week period after the recommendation was first made on November 2, hitting its high point on November 14, at 264,000 (based on the 7-day rolling average). It then dropped steeply through the beginning of December. After a slight uptick over the next two weeks, it dropped again and has hovered between 50,000 and 75,000 new doses administered per day, based on the 7-day rolling average, since the holiday period (Figures 1 and 2).
  • Significant variation remains at the state level with a 52 percentage point difference between the top and bottom ranking states in the share of children with at least one dose. This difference is much larger than the span for adults (27 percentage points). The share of children having received at least one COVID-19 vaccine dose ranged from 63.1% in Vermont to just 11.2% in Mississippi (Table 1). The top ten states have vaccinated more than a third of 5-11 year-olds, with three states at more than 50%; the bottom ten states have vaccinated fewer than 20%. The spread between top and bottom ranking states for those fully vaccinated is 47 percentage points, and ranges from 52% in Vermont to 5.3% in Alabama.
  • Some regional differences persist. Five of the top ten states, by share of 5-11 year-olds with at least one vaccine dose, are in New England (Vermont, Rhode Island, Massachusetts, Maine, and Connecticut). Eight of the ten states with the lowest vaccine coverage among 5-11 year-olds are in the South (South Carolina, Georgia, West Virginia, Oklahoma, Tennessee, Louisiana, Alabama, and Mississippi). Similar patterns are also seen among the share fully vaccinated.
Cumulative Share of Children Ages 5-11 Who Have Received At Least One Dose of a COVID-19 Vaccine
New Daily Doses Administered to 5-11 Year Olds, Number and 7-Day Rolling Average

More than two months following authorization of the COVID-19 vaccine for children ages 5-11, the vaccination rate for this group is quite low, and there is significant variation across the country, with a more than 50 percentage point gap between the highest and lowest ranking states among those having received at least one dose. This likely reflects a complicated interplay between the efforts made by state and county governments, schools, and pediatricians to vaccinate children, and the makeup of the citizenry itself and its interest in vaccination. With the highly transmissible Omicron variant surging across the U.S., the vaccine, which has proven very safe for children, offers the most effective protection against severe disease and hospitalization. In addition, while vaccination during the Omicron surge may not prevent all school disruptions, it does help to mitigate them. Identifying opportunities to reach parents and caregivers, many of whom have been reluctant to get their younger children vaccinated, with information about vaccination and providing multiple, accessible, avenues for pediatric vaccination, will continue to be important.

Table 1: Number and Share of Children, Ages 5-11, Who Have Received At Least One Dose of a COVID-19 Vaccine or Are Fully Vaccinated Against COVID-19

Methods

National data were used to calculate daily changes in the number of 5-11 year-olds vaccinated as well as the seven-day rolling average. To calculate the number of 5-11 year-olds who had received at least one COVID-19 vaccine dose or who were fully vaccinated by state, we calculated the difference between the number of those aged 5+ with at least one dose (or fully vaccinated) and the number of those aged 12+ with one dose (or fully vaccinated). Population estimates for 5-11 year-olds by state were obtained from the American Community Survey. We included data from federal entities, territories and associated jurisdictions in our national totals, but only the 50 states and DC in our state analysis. Data from Idaho were not available for this age group.

Surprise Medical Bills are Ending, But Controversy Continues

Author: Larry Levitt
Published: Jan 20, 2022

In this column for the JAMA Health Forum, Larry Levitt examines how the No Surprises Act that prohibits unexpected out-of-network charges for patients could lead to lower payment rates and revenues for some doctors and other care providers.

News Release

Biden Counties Continue to Have Higher Vaccination Rates Compared to Trump Counties, As the Omicron Variant Surges Across the U.S.

Published: Jan 19, 2022

An updated KFF analysis finds that counties that voted for Biden continue to have higher COVID-19 vaccination rates compared to counties that voted for Trump. As of January 11, 65% of those in Biden counties were fully vaccinated versus 52% of those in Trump counties. Even with the Omicron variant spreading across the country, the gap between Biden and Trump counties has widened from 9 percentage points in June to 13.2 percentage points currently.

There is currently no gap between Biden and Trump counties in the share of those who are fully vaccinated and who have gotten booster doses. However, because of the underlying gap in vaccination rates, there is also a gap in the share who are boosted across the two groups, and that gap has been widening over time.

Vaccines and boosters have shown to be effective against COVID-19, including against the Delta and Omicron variants. With rising hospitalization rates, those unvaccinated remain at greater risk for more severe COVID-19.