KFF Quick Take: Marking Three Years of COVID-19
Jen Kates, Senior Vice President and Director of Global Health and HIV Policy at KFF, describes the state of global health three years into the COVID-19 pandemic.
The independent source for health policy research, polling, and news.
Jen Kates, Senior Vice President and Director of Global Health and HIV Policy at KFF, describes the state of global health three years into the COVID-19 pandemic.
In a months-long project, KFF’s Kaiser Health News correspondent Brett Kelman joined forces with CBS News National Consumer Investigative Correspondent Anna Werner to investigate an unregulated dental device that is at the heart of numerous accounts of pain and disfigurement.
At least 10,000 dental patients have been fitted with the fixed Anterior Growth Guidance Appliance (“AGGA”), which costs about $7,000. The device resembles a retainer, is typically worn for several months, and uses springs to apply pressure to the front teeth and upper palate, according to the patent application filed by the inventor of the device.
In videos of the inventor training dentists, he says the pressure can expand a patient’s jaw, which he cites as the key to making people more beautiful and curing common ailments like sleep apnea and TMJ. But dental specialists interviewed by KHN and CBS News said that based on their experiences with former AGGA patients the device pushed teeth out of position and sometimes left them loose and weak.
At least 20 patients have filed lawsuits in the past three years claiming the device — which has not been reviewed by the Food and Drug Administration — left them with flared teeth, damaged gums, exposed roots, or erosion of the bone that holds teeth in place. The inventor and other defendants have denied liability in all the lawsuits.
The joint KHN-CBS News investigation aired on “CBS Mornings” in two installments, on March 1 and March 2. A digital version of the story, which includes embedded video of the TV segments, appears on kffhealthnews.org and cbsnews.com. This is the first investigative project stemming from a broader editorial partnership between CBS News and KFF.
“A hallmark of KHN’s investigative journalism is that we illuminate systemic flaws in American health care,” said KHN Publisher David Rousseau, the executive director of journalism and technology at KFF. “This investigation shows no one was watching.”
“This is a great example of reporters teaming up to expose a problem that can impact the health and finances of everyday Americans,” said Shawna Thomas, Executive Producer of CBS Mornings. “By partnering with Kaiser Health News, we’re able to expand the depth of our health care and consumer coverage.”
The editorial partnership also features regular appearances by Dr. Céline Gounder, KHN’s senior fellow and editor-at-large for public health, on all of CBS News’ platforms, as well as stories, segments, and specials drawing upon reporting from across KHN’s newsroom and bureaus. It includes the popular “Bill of the Month” series, in which KHN Editor-in-Chief Elisabeth Rosenthal appears regularly on “CBS Mornings” to discuss surprising medical bills and what they tell us about the health care system. (“Bill of the Month” is a collaborative investigative project of KHN and NPR.) And it now includes the KHN Health Minute, a weekly feature for CBS News Radio stations that will help millions of listeners understand how developments in health care delivery and policy affect them.
For the dental device story, KHN and CBS News journalists interviewed 11 dental patients who said they were harmed by the AGGA device — eight of whom have active lawsuits concerning the device — plus attorneys who represent or have represented at least 23 others.
In every case, the patients said they mistakenly assumed the device would not be for sale unless it was proven safe and effective. Dental experts said, based on their experience with former AGGA patients, that patients can suffer tens of thousands of dollars in damage to their mouths.
According to a KHN and CBS News review of the FDA’s device database, the AGGA does not appear to be on the radar of the agency, which is responsible for regulating medical and dental devices in the United States. A manufacturer is supposed to register devices with the FDA, and those that pose even a moderate risk to a patient can be required to go through a pre-market review to check if they are safe and effective. The manufacturer of the AGGA said in a court document it has no record of communicating with the FDA about the device before beginning to make or sell it, and claimed that the device is exempt from premarket review under an exemption for dental labs.
About KFF and KHN
KHN (Kaiser Health News) is a national newsroom that produces in-depth journalism about health issues. Together with Policy Analysis, Polling and Survey Research and Social Impact Media, KHN is one of the four major operating programs at KFF. KFF is an endowed nonprofit organization providing information on health issues to the nation.
About CBS News and Stations
CBS News and Stations brings together the power of CBS News, 28 owned television stations in 17 major U.S. markets, the CBS News Streaming Network, CBS News Streaming local platforms, local websites and cbsnews.com, under one umbrella. CBS News and Stations is home to the nation’s #1 news program 60 MINUTES, the CBS News Streaming Network, the first 24/7 digital streaming news network, the award-winning broadcasts CBS MORNINGS, CBS SATURDAY MORNING, the CBS EVENING NEWS WITH NORAH O’DONNELL, CBS SUNDAY MORNING, CBS WEEKEND NEWS, 48 HOURS and FACE THE NATION WITH MARGARET BRENNAN. CBS News and Stations provides news and information for the CBS Television Network, CBSNews.com, CBS News Radio and podcasts, Paramount+, all digital platforms, and the CBS News Streaming Network, the premier 24/7 anchored streaming news service that is available free to everyone with access to the internet. The CBS News Streaming Network is the destination for breaking news, live events, original reporting and storytelling, and programs from CBS News and Stations’ top anchors and correspondents working locally, nationally, and around the globe. CBS News’ streaming services, across national and local, amassed nearly 1 billion streams in 2022. Launched in November 2014 as CBSN, the CBS News Streaming Network is available on 30 digital platforms and apps, as well as CBSNews.com and Paramount+. The service is available live in 91 countries. CBS News and Stations is dedicated to providing the highest-quality journalism under standards it pioneered and continues to set in today’s digital age. CBS News earns more prestigious journalism awards than any other broadcast news division.

A new KFF analysis estimates that enrollment in Medicaid and the Children’s Health Insurance Program (CHIP) will have grown by 23.3 million enrollees, to nearly 95 million, by the end of March. That is when the federal continuous enrollment provision expires, and states can resume disenrollments, which have been paused since February 2020. Millions of beneficiaries are expected to be disenrolled over the next year, and the new estimates illustrate the extent to which enrollment could decline and who will be most affected.
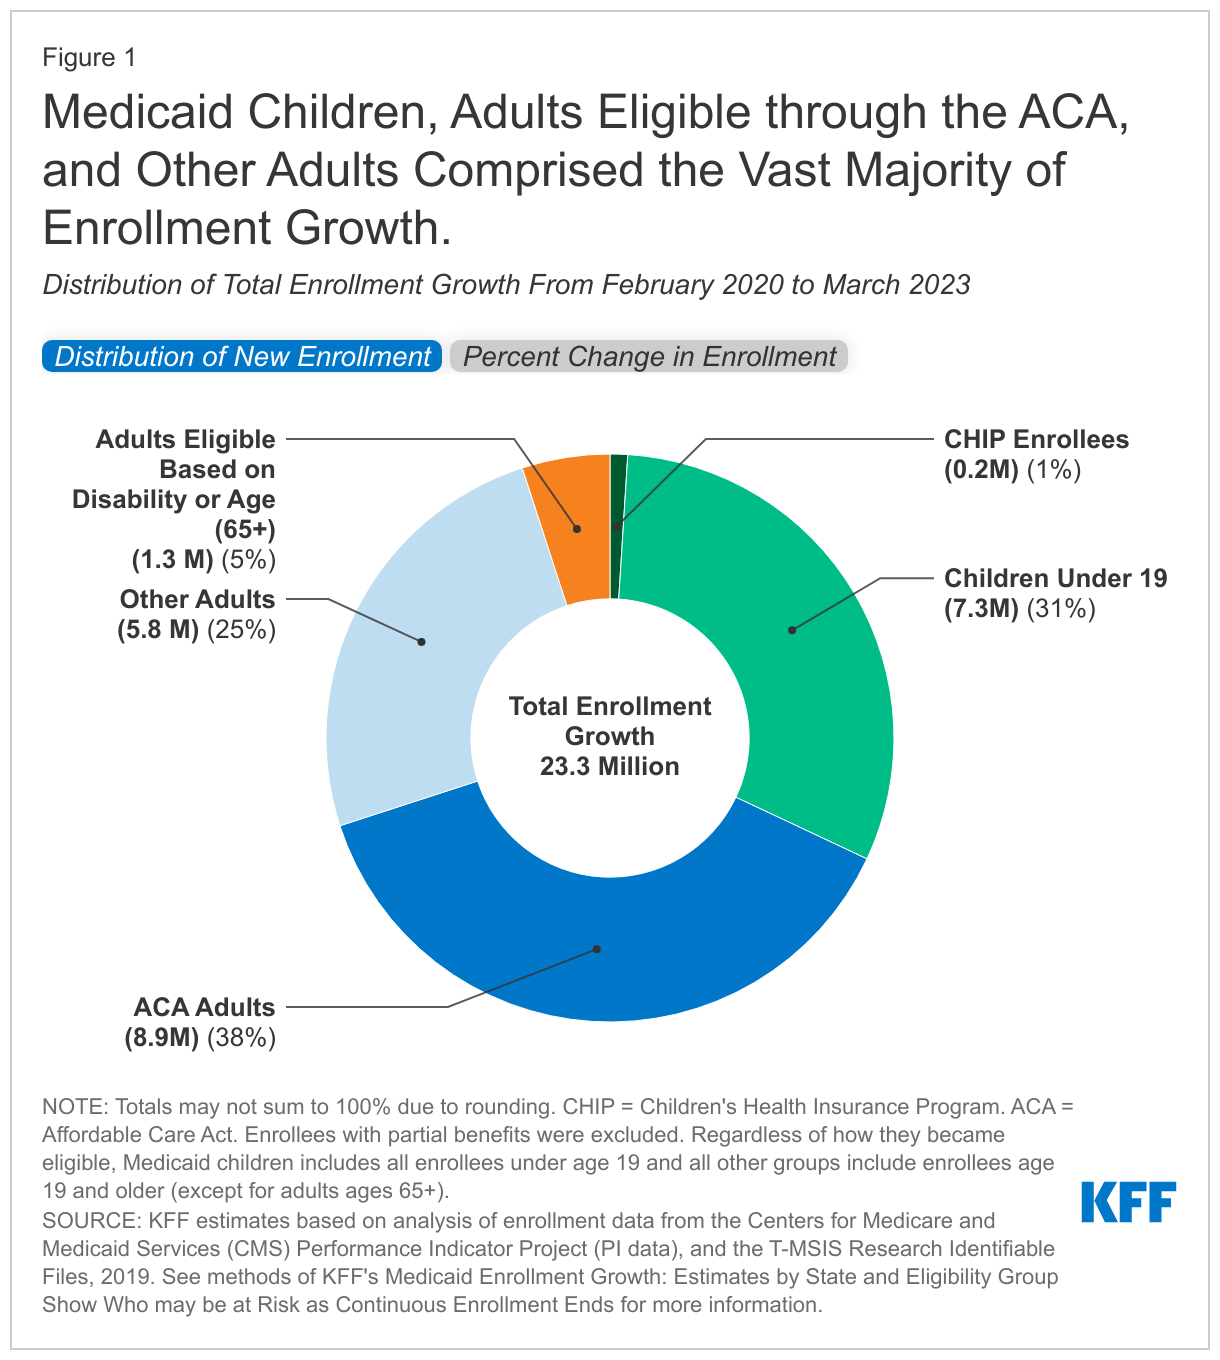
Over half of the 23.3 million enrollment increase is among low-income adults under age 65 (56%), and nearly one-third is among children. According to the KFF estimates, the increase in low-income adults includes 8.9 million (38%) in the Affordable Care Act (ACA) Medicaid expansion group and 5.8 million (25%) other adults (mostly low-income parents) who do not qualify for Medicaid based on disability. Estimated enrollment increases have been smaller for adults eligible based on disability or age (1.3 million) and for CHIP enrollees (0.2 million).
It is expected that the groups that experienced the most growth due to the continuous enrollment provision—ACA expansion adults, other adults, and children—will see the largest enrollment declines.

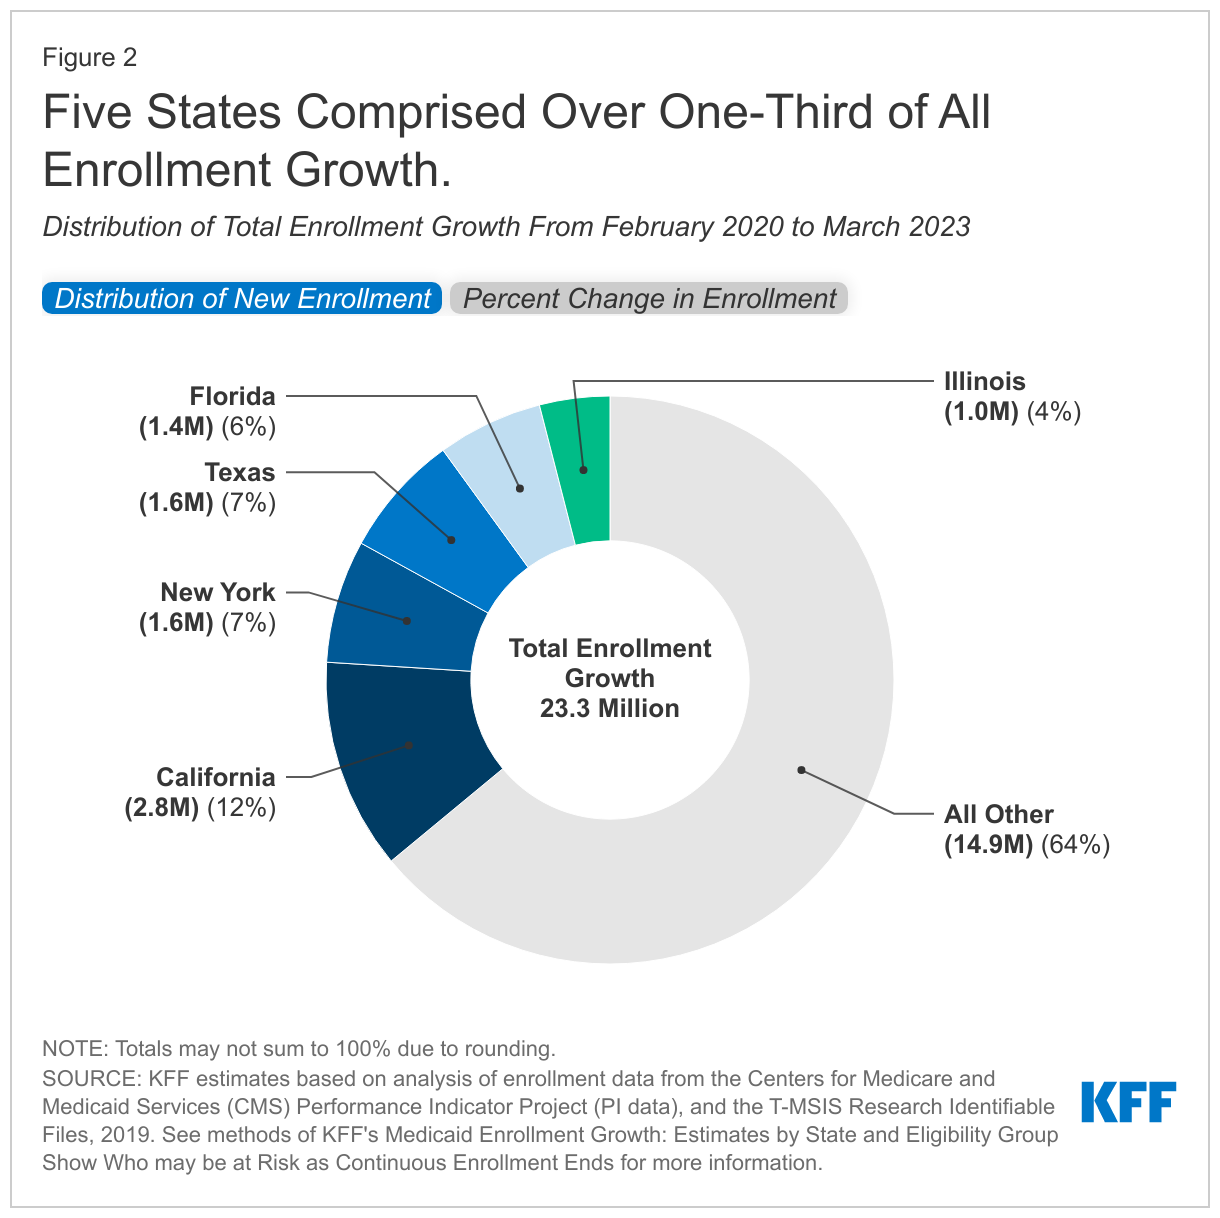
The increase in enrollment is concentrated in a small number of states with large populations and, consequently, large Medicaid programs. Our analysis shows that California, New York, Texas, Florida, and Illinois account for over one-third of the increase in Medicaid/CHIP enrollment. Because Texas and Florida have not adopted the ACA Medicaid expansion, children and other adults account for higher percentages of enrollment gains in those states.
Growth rates in Medicaid/CHIP enrollment vary considerably by state, ranging from 22 percent in Connecticut to 81 percent in Oklahoma. States that implemented Medicaid expansion after 2020 (Oklahoma, Missouri, Nebraska, Utah, and Idaho) have particularly high enrollment growth.
The number and share of individuals who will be disenrolled across states is expected to vary, but studies estimate that between 5 percent and 17 percent of current enrollees might lose Medicaid coverage. (A previous KFF analysis estimates that between 5.3 million and 14.2 million people will lose Medicaid coverage during the unwinding of the continuous enrollment provision.)
As states start to resume renewal procedures for all current Medicaid enrollees, there is substantial uncertainty as to how much of the Medicaid enrollment growth during the pandemic will be sustained, how many people will transition to other coverage, and how many people could end up uninsured. Our recent analysis of coverage outcomes after disenrolling from Medicaid or CHIP found that nearly two-thirds of people experienced a period of uninsurance. Policies to smooth the transition from Medicaid to other coverage sources could reduce that rate as the Medicaid continuous enrollment period unwinds.
The analysis uses a combination of enrollment data from the Centers for Medicare and Medicaid Services (CMS) Performance Indicator Project (PI data), Medicaid claims data (T-MSIS data), and some state-specific data. (A detailed explanation of the methods is available in the paper.) While our estimates are based on the best available public data on states’ Medicaid and CHIP enrollment, they will likely differ somewhat from data maintained by individual states because we use modeling and assumptions to project enrollment through March 2023 and to allocate states’ adult enrollment across eligibility groups.
In the Consolidated Appropriations Act, 2023, signed into law at the end of 2022, Congress set an end to the Medicaid continuous enrollment provision on March 31, 2023 and phased down the enhanced federal Medicaid matching funds through December 2023. At the start of the pandemic, Congress enacted the Families First Coronavirus Response Act, which included a requirement that Medicaid programs keep people continuously enrolled during the COVID-19 public health emergency in exchange for enhanced federal funding. As a result, enrollment in Medicaid and the Children’s Health Insurance Program (CHIP) has grown substantially compared to before the pandemic, contributing to declines in the uninsured rate which dropped to the lowest level on record in early 2022. But, millions of people could lose coverage when the continuous enrollment provision ends, reversing recent gains in coverage.
This analysis estimates Medicaid enrollment growth by state and eligibility group between February 2020, before the pandemic, and March 31, 2023, at the end of the continuous eligibility period. These estimates can help paint a picture of the overall number and composition of enrollees who may risk coverage loss after the continuous enrollment provision ends. Prior to the continuous enrollment period, typical patterns of enrollment included disenrollments throughout the year. Some enrollees disenroll and then re-enroll within a short period of time (or “churn” in and out of Medicaid). The continuous enrollment provision halted disenrollment and churn, resulting in overall program growth. While states will need to conduct renewals for all enrollees, understanding the overall growth in enrollment and the composition of that growth can help inform understanding the range of potential outcomes as the continuous enrollment unwinds. How individual states implement the unwinding will affect the ultimate loss of coverage.
We use a combination of enrollment data from the Centers for Medicare and Medicaid Services (CMS) Performance Indicator Project (PI data), Medicaid claims data (T-MSIS data), and some state-specific data to inform the analysis (see Methods for a detailed explanation of the methods used in this analysis). While our estimates are based on the best available public data on states’ Medicaid and CHIP enrollment, they will likely differ somewhat from data maintained by individual states because we use modeling and assumptions to project enrollment through March 2023 and to allocate states’ adult enrollment across eligibility groups.
By the time the continuous enrollment period ends, we estimate that enrollment in Medicaid and CHIP will have grown by 23.3 million enrollees; nearly two-thirds of the enrollment increase is among low-income adults under age 65 (63%) and nearly one-third is among children (Figure 1, tab 1). The increase in low-income adults includes 8.9 million (38%) adults in the Affordable Care Act (ACA) Medicaid expansion group and 5.8 million (25%) other adults (mostly low-income parents) who do not qualify based on disability. Estimated enrollment increases have been smaller for adults eligible based on disability or age (1.3 million) and for CHIP enrollees (0.2 million).
Adults are experiencing the highest rates of enrollment growth during the continuous enrollment period (Figure 1, tab 2). There are very low rates of growth in CHIP, likely because the continuous enrollment provision does not apply to separate CHIP programs and some children may be moving from CHIP into Medicaid. Several factors contribute to the variation in growth rates among Medicaid eligibility groups. First, several states newly expanded Medicaid under the ACA during the continuous enrollment period resulting in high enrollment growth in those states. Adult groups and children typically experience higher rates of churn, which is when enrollees disenroll and then re-enroll within a short period of time and may occur due to temporary changes in income or administrative barriers during renewal that may result in a lapse in coverage even if an individual remains eligible for Medicaid. A recent KFF analysis found that churn rates for children more than doubled following annual renewal, signaling that many eligible children lose coverage at renewal. By halting disenrollment, the continuous enrollment provision has also halted this churning among Medicaid enrollees. People who qualify based on age or disability are historically less likely to churn on and off Medicaid as they are more likely to live on fixed income and therefore, less likely to experience changes in eligibility.
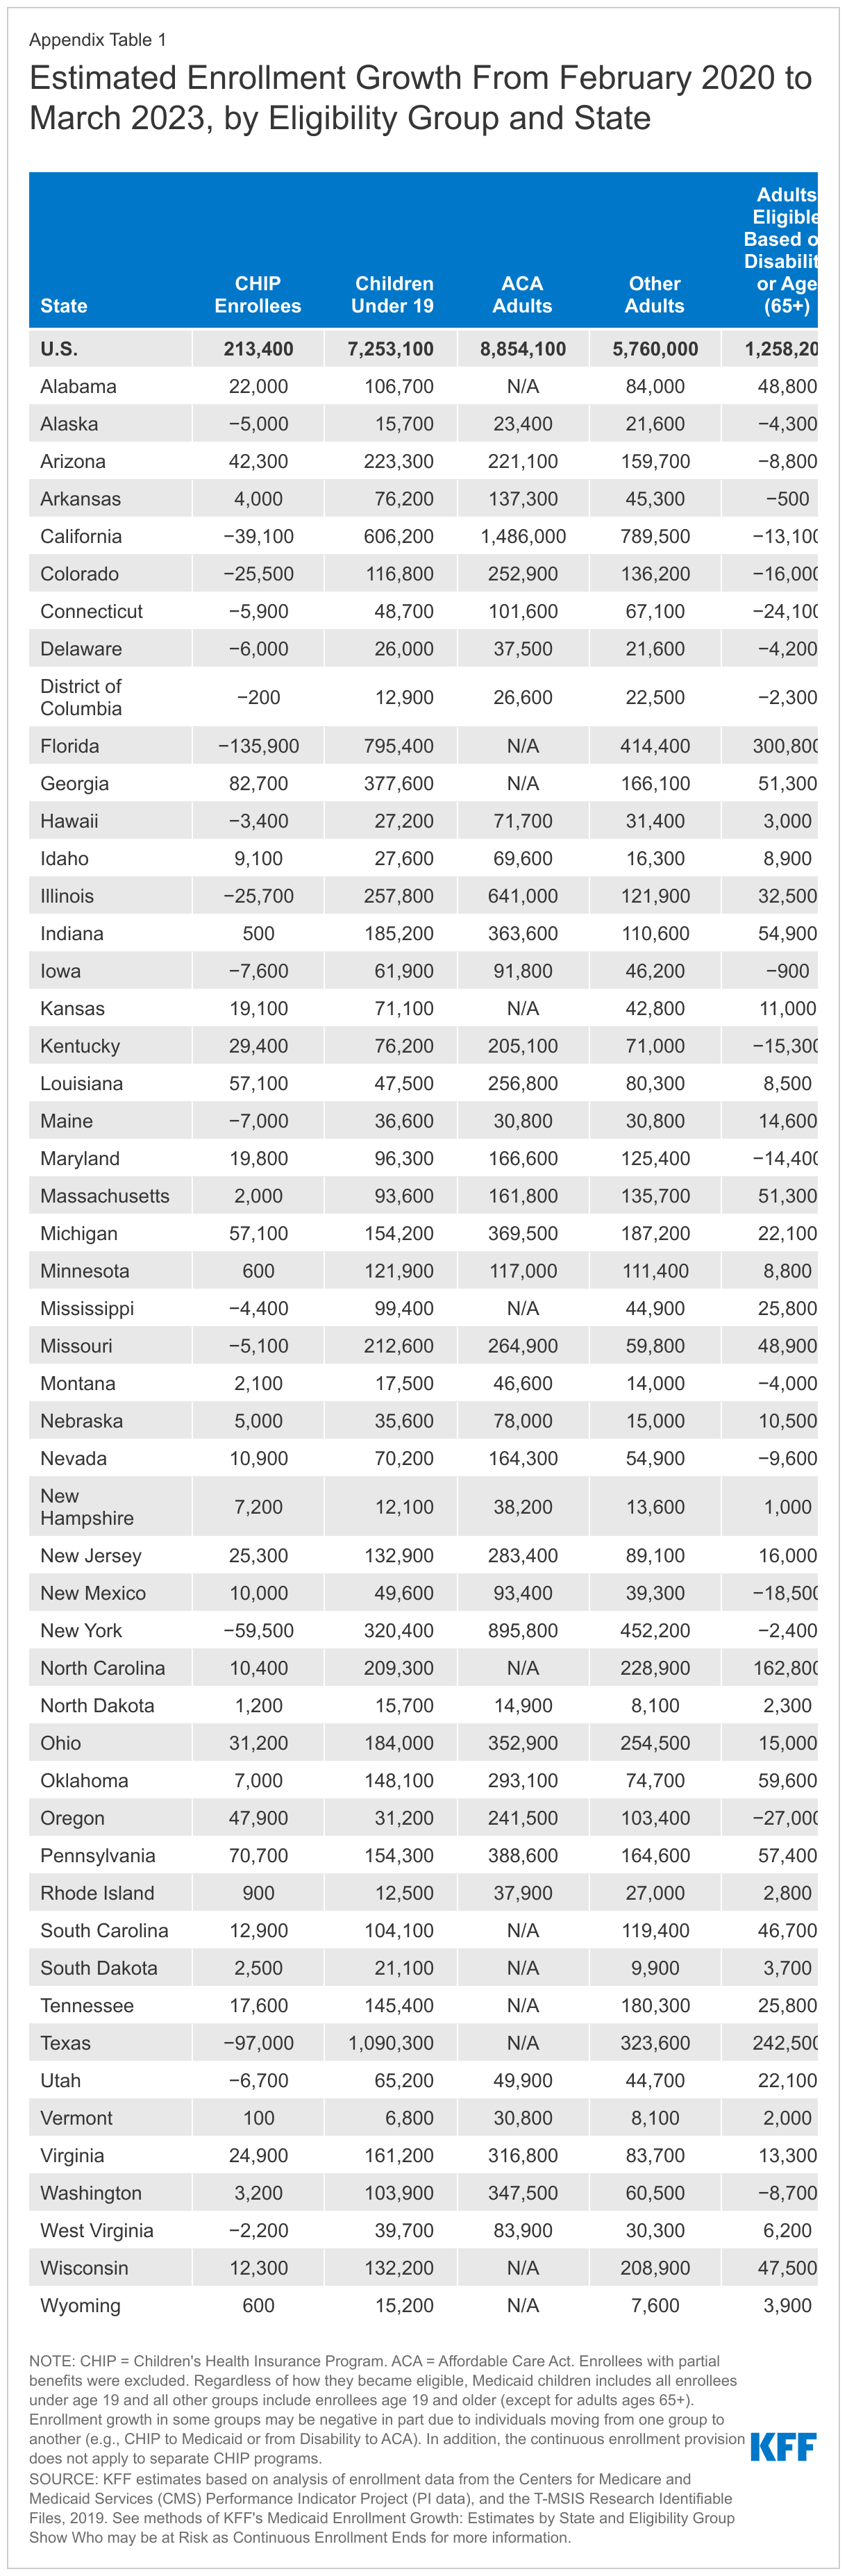
The increase in enrollment is concentrated in a small number of states with large populations and consequently large Medicaid programs. Our analysis shows that California, New York, Texas, Florida, and Illinois account for over one-third of the increase in Medicaid/CHIP enrollment (Figure 2, tab 1). Because Texas and Florida have not adopted the ACA Medicaid expansion, children and other adults account for higher percentages of enrollment gains in those states (Appendix Table 1).
Growth rates in Medicaid/CHIP enrollment vary considerably by state (Figure 2, tab 2). Rates range from 22% in Connecticut to 81% in Oklahoma. States that implemented Medicaid expansion after 2020 (Oklahoma, Missouri, Nebraska, Utah, and Idaho) have particularly high enrollment growth. Beyond Medicaid expansion, several factors may contribute to variation including:
We estimate Medicaid/CHIP enrollment will reach nearly 95 million in March 2023, with enrollment growth since February 2020 accounting for one in four enrollees (Appendix Table 1). While the number of Medicaid enrollees who may be disenrolled during the unwinding period is highly uncertain, studies estimate that between 5% and 17% of current enrollees might be disenrolled. Earlier KFF analysis estimates that between 5.3 million and 14.2 million people will lose Medicaid coverage during the unwinding of the continuous enrollment provision. These projected coverage losses are consistent with, though a bit lower than, estimates from the Department of Health and Human Services (HHS) suggesting that as many as 15 million people will be disenrolled.
It is expected that the groups that experienced the most growth due to the continuous enrollment provision—ACA expansion adults, other adults, and children—will experience the largest enrollment declines. In states that haven't expanded Medicaid, many low-income parents and new mothers will be most at risk of losing coverage. HHS estimates that of those disenrolled, 6.8 million will likely still be eligible. Many children may remain eligible even if their parents are no longer eligible because most states’ income limits for children are considerably higher than for adults, and many adults eligible based on disability or age (65+) may remain eligible if they are living on fixed incomes.
Actual enrollment outcomes will vary across states depending on an array of state policy decisions including how states prioritize renewals and efforts to conduct outreach and enrollment assistance. These policies can help ensure that those who remain eligible for Medicaid are able to retain coverage, and that those who are no longer eligible can transition to other sources of coverage, particularly the ACA marketplace. Our state-by-state estimates of enrollment gains by eligibility group can help illustrate how many people are at risk of coverage loss (for enrollment increases by state and eligibility group see Appendix Table 1). As states start to resume renewal procedures for all current Medicaid enrollees, there is substantial uncertainty as to how much of the Medicaid enrollment growth during the pandemic will be sustained, how many people will transition to other coverage, and how many people could end up uninsured. Because a large share of people are covered by Medicaid, including an analysis that shows that over half of all children are covered by Medicaid and CHIP, declines in Medicaid coverage could directly impact the number of uninsured. Our recent analysis of coverage outcomes after disenrolling from Medicaid or CHIP found that nearly two-thirds of people experienced a period of uninsurance. Policies to smooth the transition from Medicaid to other coverage sources could reduce that rate as the Medicaid continuous enrollment period unwinds.
Methods
Data: This analysis uses date from the Centers for Medicare and Medicaid Services (CMS) Performance Indicator Project Data (PI data) and the T-MSIS Research Identifiable Demographic-Eligibility (T-MSIS data). We used PI data from February 2020 through August 2022 and TMSIS data from 2019, Release 1.
Overview of Approach: To estimate enrollment by state and eligibility through the end of the continuous eligibility period (March 2023), we:
Definitions and Limitations: Our estimates are likely to be very similar to states’ PI-reported enrollment for Medicaid children, Medicaid adults, and CHP enrollees, but will differ from estimates of enrollment maintained by individual states. There are three primary reasons for these differences: the exclusion of some enrollees, the use of age-based eligibility for children, and our estimates of adult enrollment by eligibility group use a national model and our own assumptions. Specifically:
We provide more detail about each step in the details below.
1. Enrollment Among Groups: The PI data provide state enrollment for all Medicaid and CHIP adults, all children (defined as anyone under the age of 19), and everyone in CHIP.
2. Estimated Growth Through March 2023. From step 1, we had monthly enrollment by state for Medicaid adults, Medicaid children, and all CHIP enrollees.
3. Apportion Adult Enrollment to Eligibility Categories. We divided Medicaid adult enrollment into eligibility groups using the T-MSIS data. We analyzed these eligibility groups separately because enrollment patterns of adults eligible based on age or disability are different from those of other adults.
As some policymakers in Washington are pushing to reduce the federal deficit and debt, a new KFF resource provides a concise explanation of federal spending for domestic and global health programs and services, which could be part of any conversation about curbing federal spending.
Federal spending on health programs and services accounted for 30 percent of net federal spending in fiscal year 2022 — or $1.7 trillion out of a total of $5.9 trillion. Specifically, Medicare accounted for 13 percent of the total, Medicaid and CHIP accounted for 10 percent, other domestic health spending accounted for 5 percent, hospital and medical care for veterans was 2 percent, and global health was 0.1 percent. (By comparison, Social Security accounted for 21 percent of net federal spending that year, while defense accounted for 13 percent.)
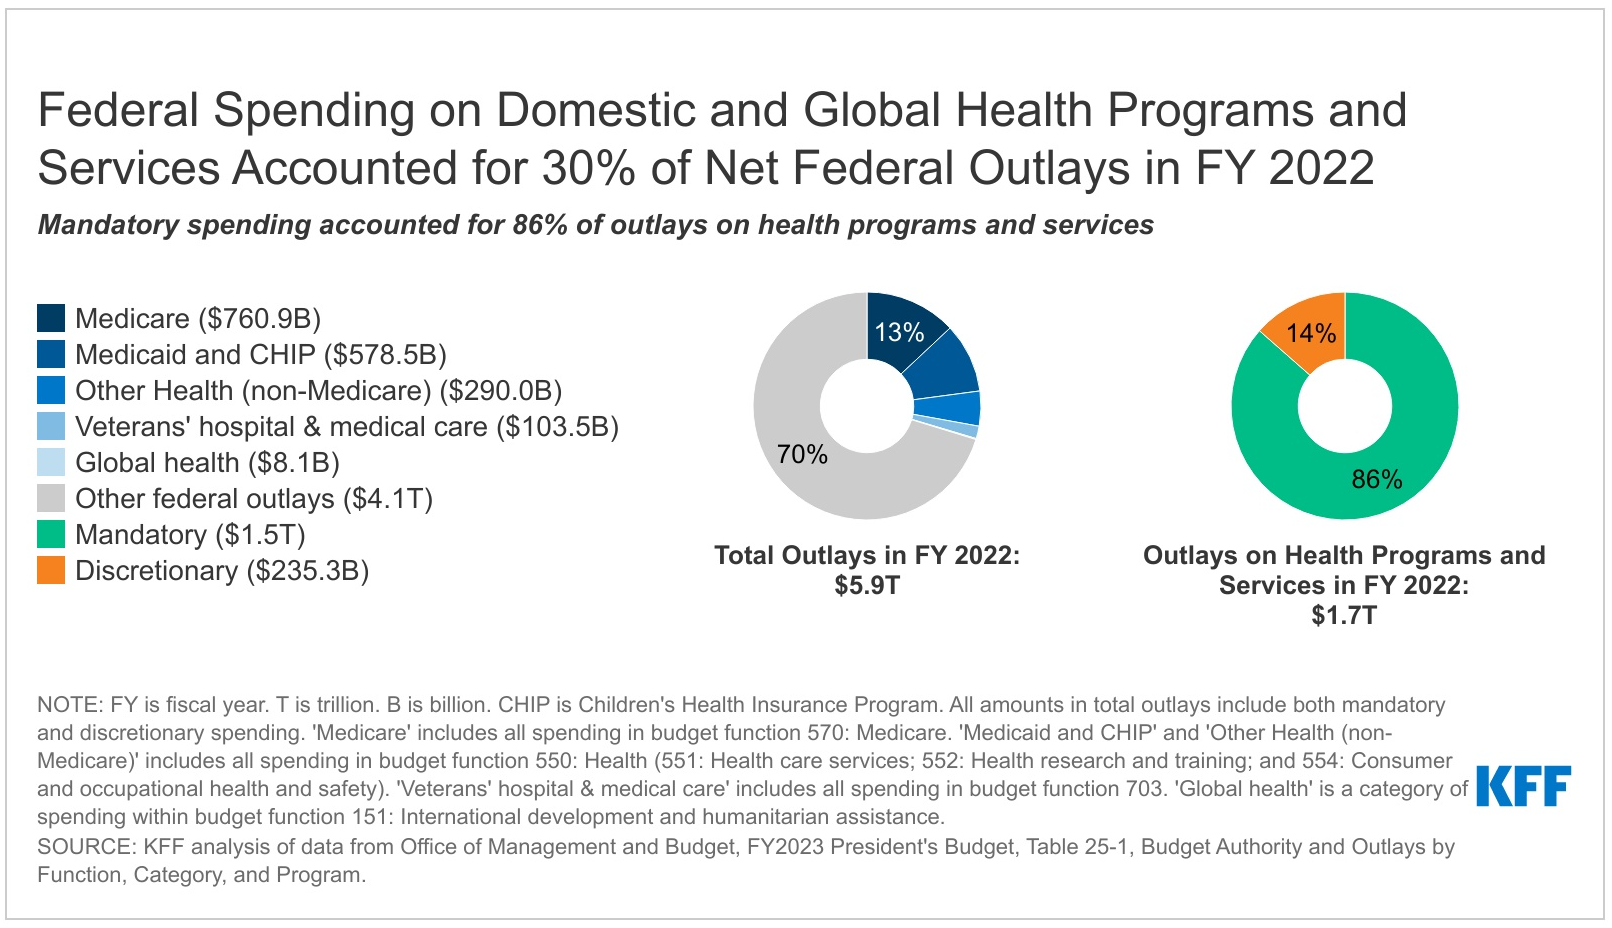
The large majority of federal health spending (86%, or $1.5 trillion) is mandatory spending that is not subject to annual appropriations votes by Congress. This includes nearly all Medicare spending, federal spending on Medicaid and CHIP (which are jointly funded by states and the federal government), and part of the money devoted to premium tax credits for coverage through the ACA Marketplaces, among other categories of spending. Medicare accounts for half of mandatory spending on federal health programs and services, while Medicaid accounts for another 37 percent.
The federal government also provides several tax benefits that support health-related activities, known as tax expenditures because they result in lower federal tax revenues.
Some Republican lawmakers have pushed for reductions in future federal spending as part of a deal to raise the debt limit. The Biden Administration has said it will not negotiate spending reductions as part of debt limit talks but is open to separate discussions about approaches to debt and deficit reduction.
Members of both major political parties have indicated that cuts to Social Security and Medicare are “off the table” in these discussions, leaving open the question of whether Medicaid, the ACA’s premium tax credits, and possibly other health programs and services could be targeted for spending reductions.
Our FAQs answer basic questions about health spending and the federal budget and budget enforcement tools, including the debt limit and sequestration. We include detailed explanations and charts about what counts as mandatory spending and what falls into the category of discretionary spending. The debt limit itself does not directly affect levels of spending by the federal government, including mandatory and discretionary health spending.
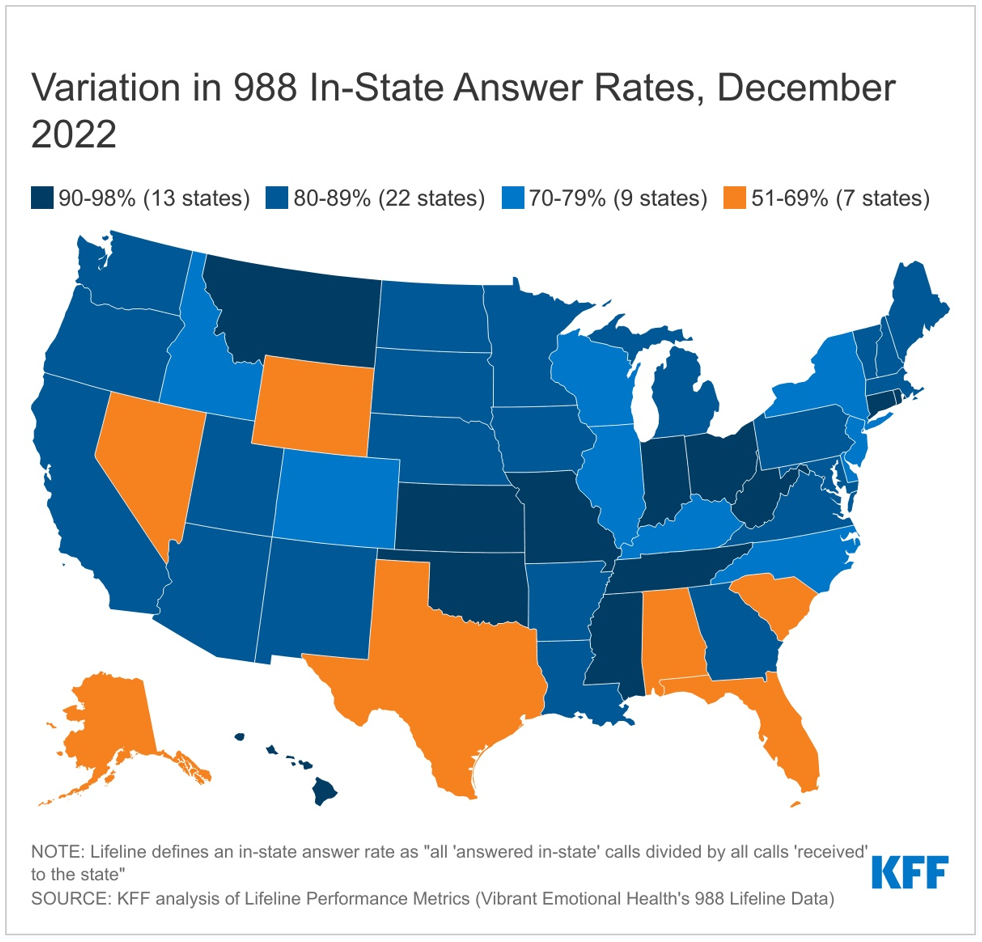
A KFF analysis finds that outreach to the new 988 number for the national suicide prevention and crisis hotline increased after its implementation in mid-July, then steadied until December 2022, when it rose again. Text volume increased more than 700 percent compared to the year prior but remains a smaller share of overall outreach.
Since the launch of 988, Lifeline has received over 2.1 million contacts—consisting of over 1.43 million calls, over 416,000 chats, and more than 281,000 texts.
The easy-to-remember three-digit number steers callers who are suicidal or experiencing a behavioral health crisis to the renamed 988 Suicide & Crisis Lifeline, where they can be connected to a local Lifeline counselor and may receive crisis counseling, resources, and referrals. Before 988, the Lifeline crisis hotline–established in 2005–was typically accessed through a 10-digit number, which was difficult for callers experiencing a mental health crisis to recall.
The analysis shows that nationally, about 10 percent of calls are transferred to out-of-state overflow facilities and 11 percent are abandoned by the caller. However, the 988 in-state answer rate varies widely across states. In December 2022, in-state answer rates ranged from a low of 51 percent to 69 percent in seven states to a high of 90 percent to 98 percent in 13 states.
As states debate their FY 2024 budgets, long-term funding of local 988 crisis call centers may become an issue. Although the federal government spent money to assist with the implementation of 988, ongoing funding relies heavily on local and state funds. To date, five states have chosen to enact legislation for 988 telecommunication fees that could provide ongoing funding for local crisis call centers. Longer term, additional state and national crisis center metrics related to the referral source, reason, outcome and user experience of using 988 may help inform the 988 implementation and future program improvements.
A new analysis of health insurers’ 2021 financial data shows that insurers continue to report much higher gross margins per enrollee in the Medicare Advantage market than in other health insurance markets.
The analysis examines insurers’ financial data in the Medicare Advantage, Medicaid managed care, individual (non-group), and fully insured group (employer) markets.
In 2021, Medicare Advantage insurers reported gross margins averaging $1,730 per enrollee, at least double the margins reported by insurers in the individual/non-group market ($745), the fully insured group/employer market ($689), and the Medicaid managed care market ($768).
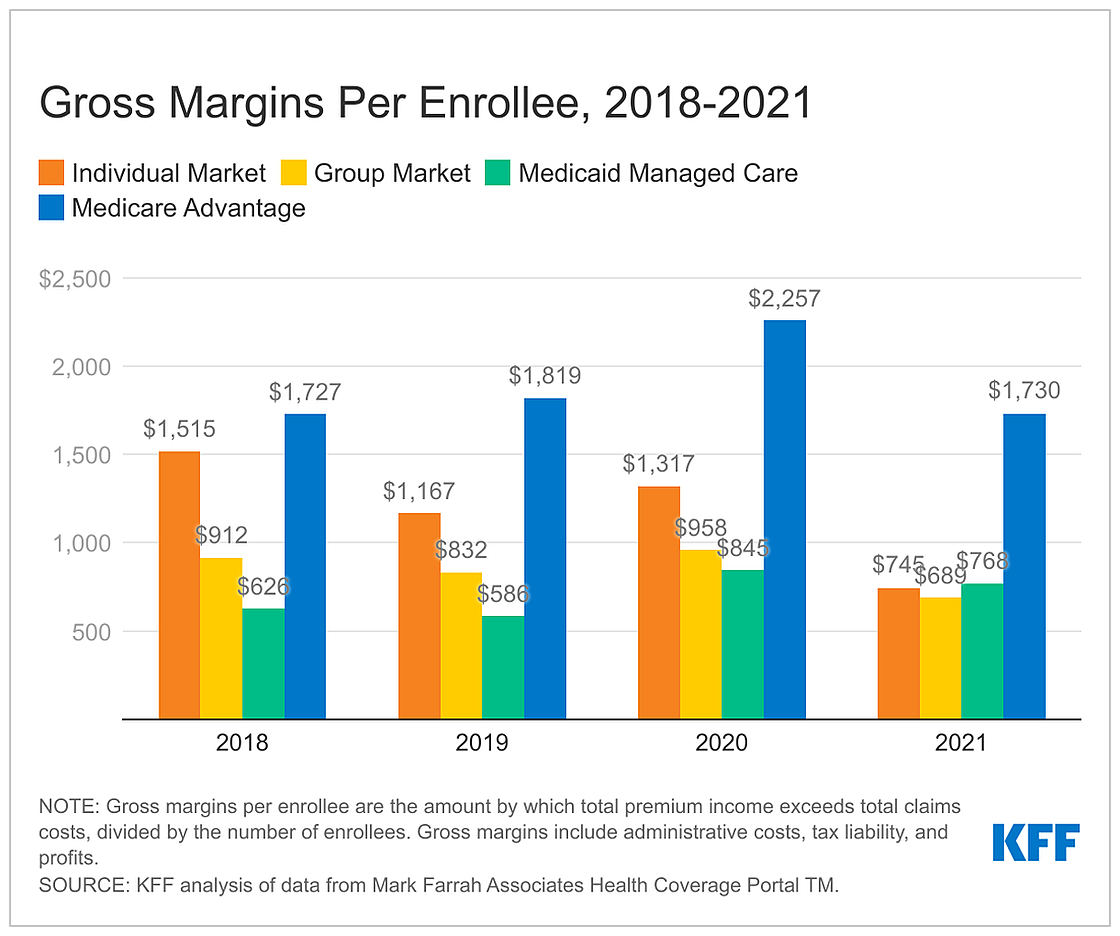
For Medicare Advantage insurers, the gross margins per enrollee in 2021 were similar to the period before the COVID-19 pandemic. Margins per enrollee for the individual and group markets in 2021 were below pre-pandemic levels, while the margins per enrollee for Medicaid managed care insurers are higher.
The high margins per member for Medicare Advantage insurers occur following years of rapid growth in the market, with more than half of eligible beneficiaries expected to enroll in Medicare Advantage plans this year.
The analysis also examines the percentage of premium income that insurers pay out in claims, also called the medical-loss ratio, and finds insurers across the four markets reported similar medical-loss ratios in 2021.
“Health Insurer Financial Performance in 2021” is available online.
The cost of an outpatient visit to a physician’s office, urgent care, or emergency department, depends in part on the level of service provided. This analysis uses claims data from private, large employer-based plan to examine trends in complexity coding across outpatient practice settings from 2004 to 2021.
Over the 18-year period, claims for evaluation and management services trended towards higher complexity codes, even among specific, common diagnoses like urinary tract infections and headaches. These changes are contributing to higher outpatient health spending. In 2021, outpatient evaluation and management spending would be 4% lower in both physician offices and emergency departments than actual 2021 spending, if visits were coded at the same levels as is 2011.
The analysis is available through the Peterson-KFF Health System Tracker, an online information hub that monitors and assesses the performance of the U.S. health system.

This report provides a close examination of reproductive age (18-49) females’ (including those who identify as women and other genders) experiences with contraception, insurance coverage, contraceptive preferences, and interactions with the health care system based on an analysis of the 2022 KFF Women’s Health Survey, a nationally representative survey of females ages 18-64 in the United States.
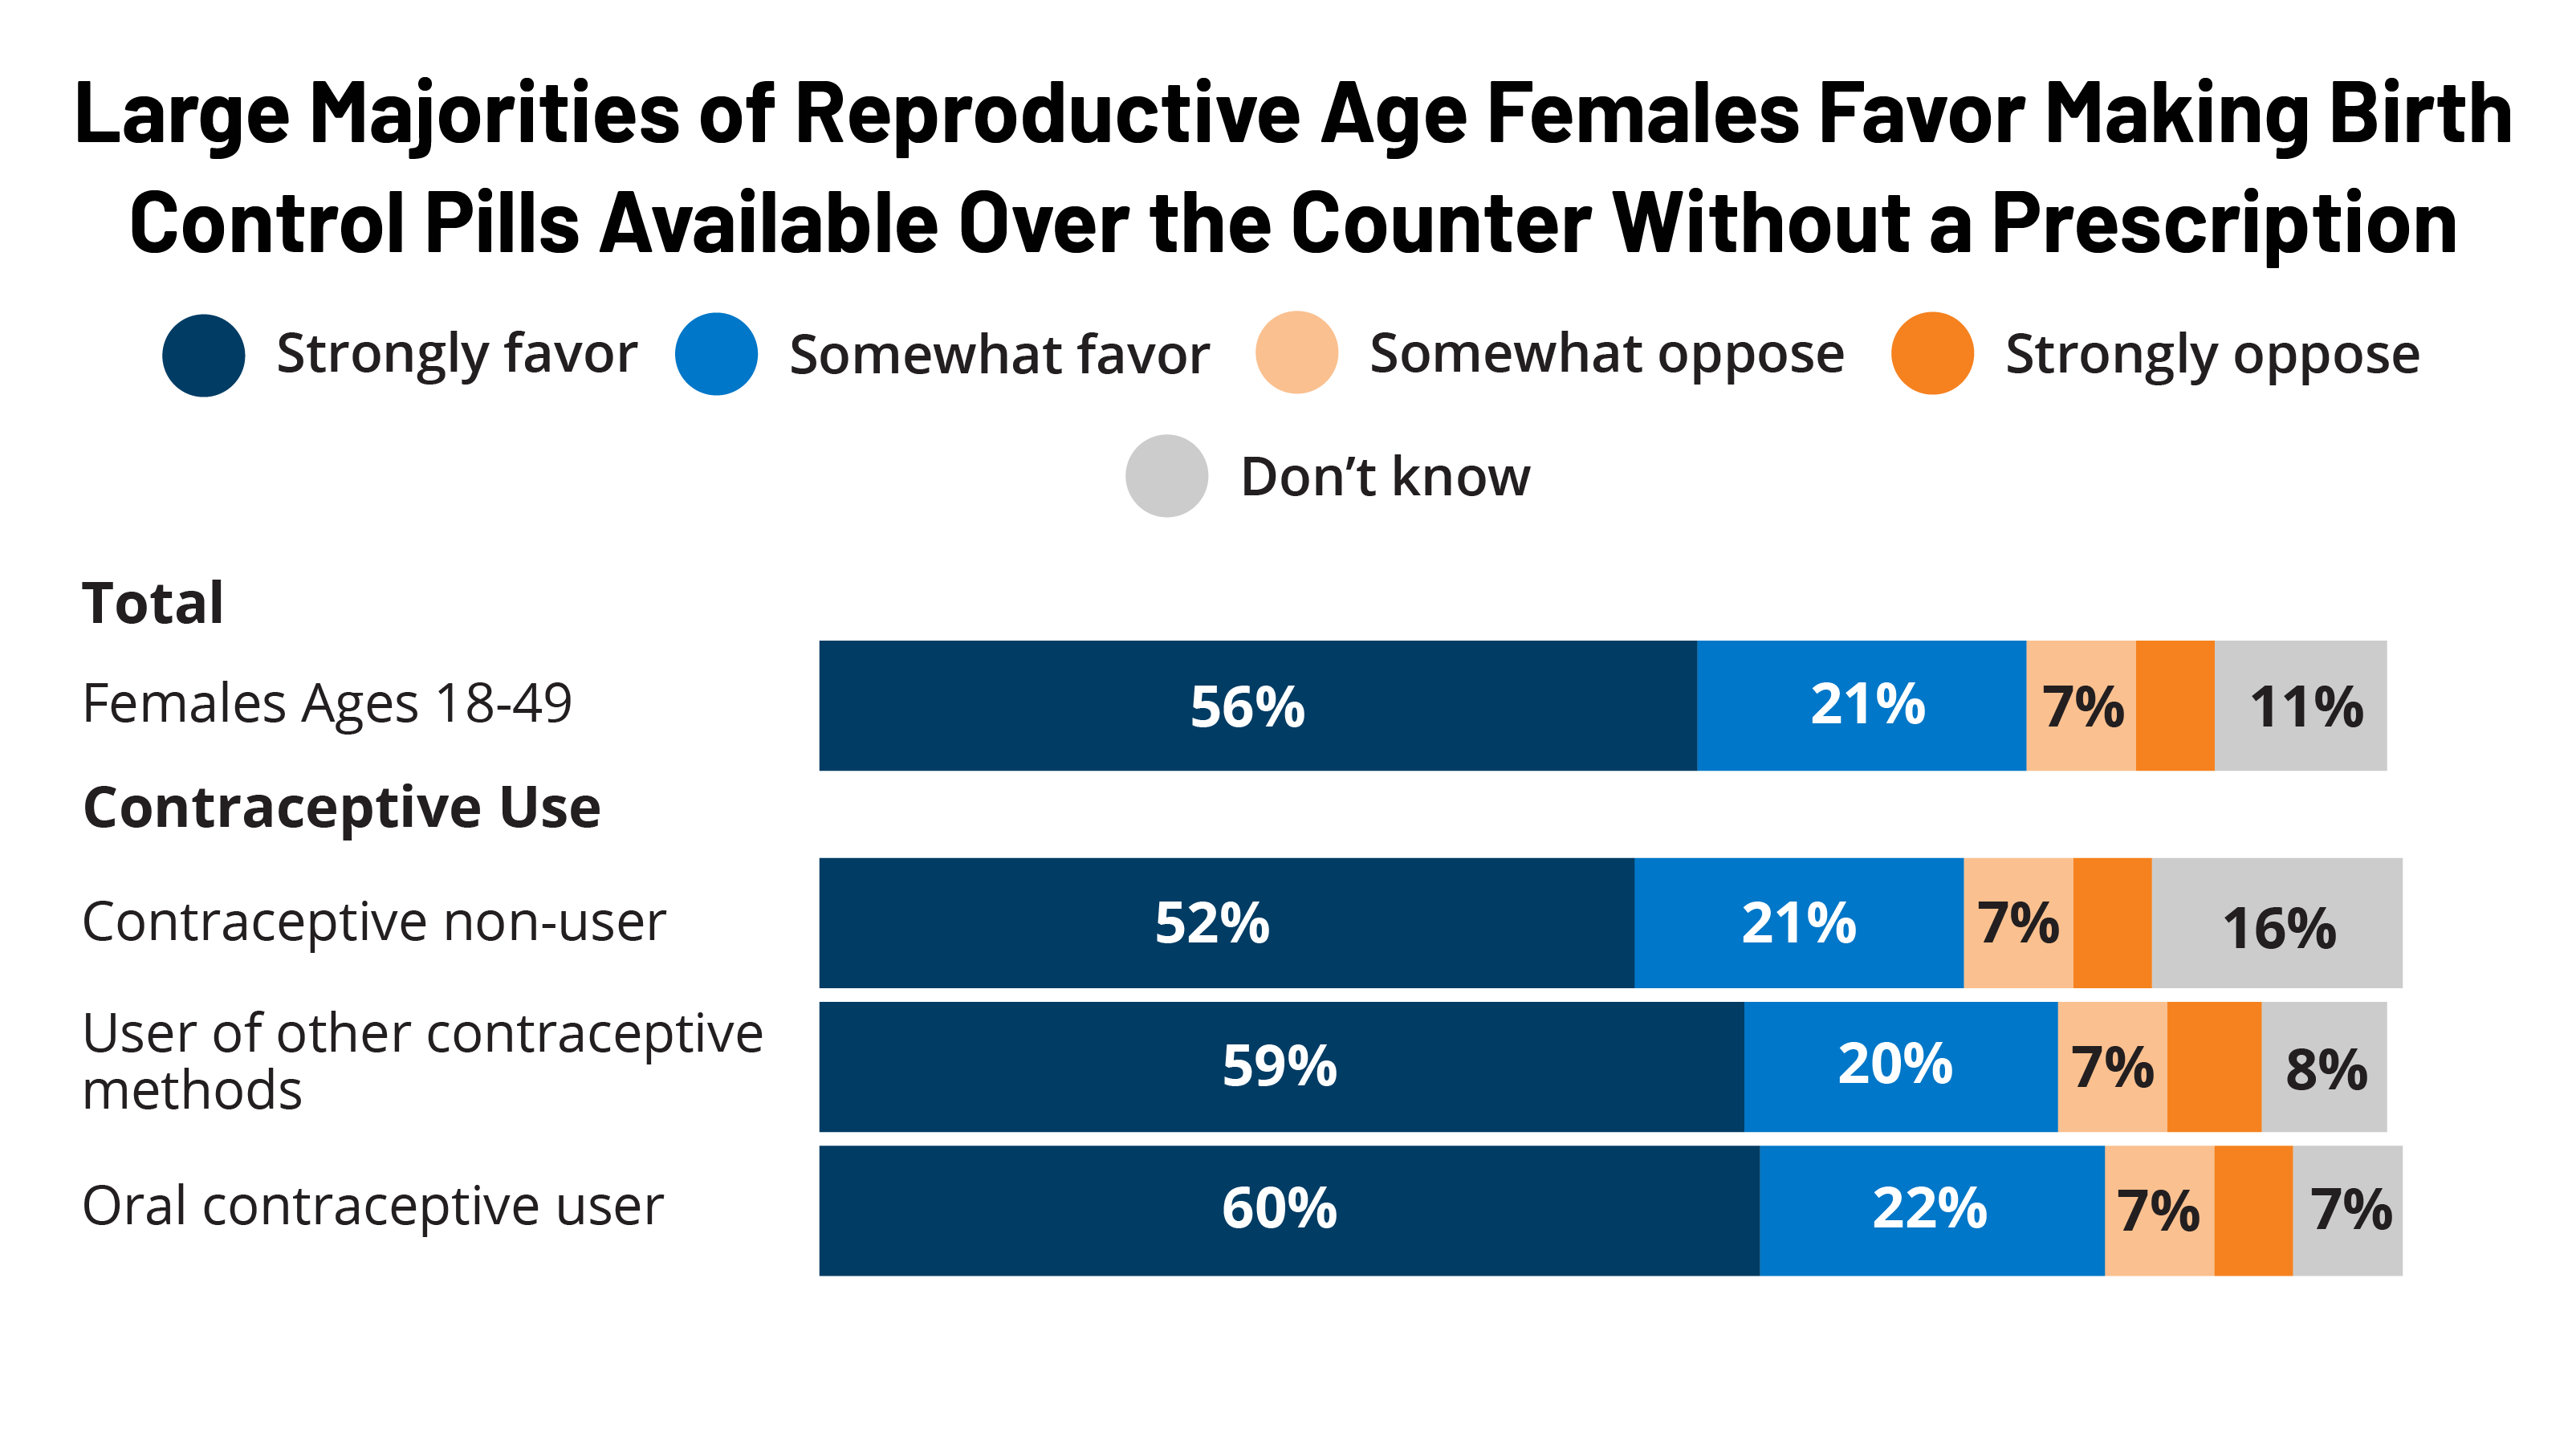
This brief presents data from the 2022 KFF Women’s Health Survey about reproductive age (18-49) females’ preferences for an over-the-counter contraceptive pill (N = 4,088).
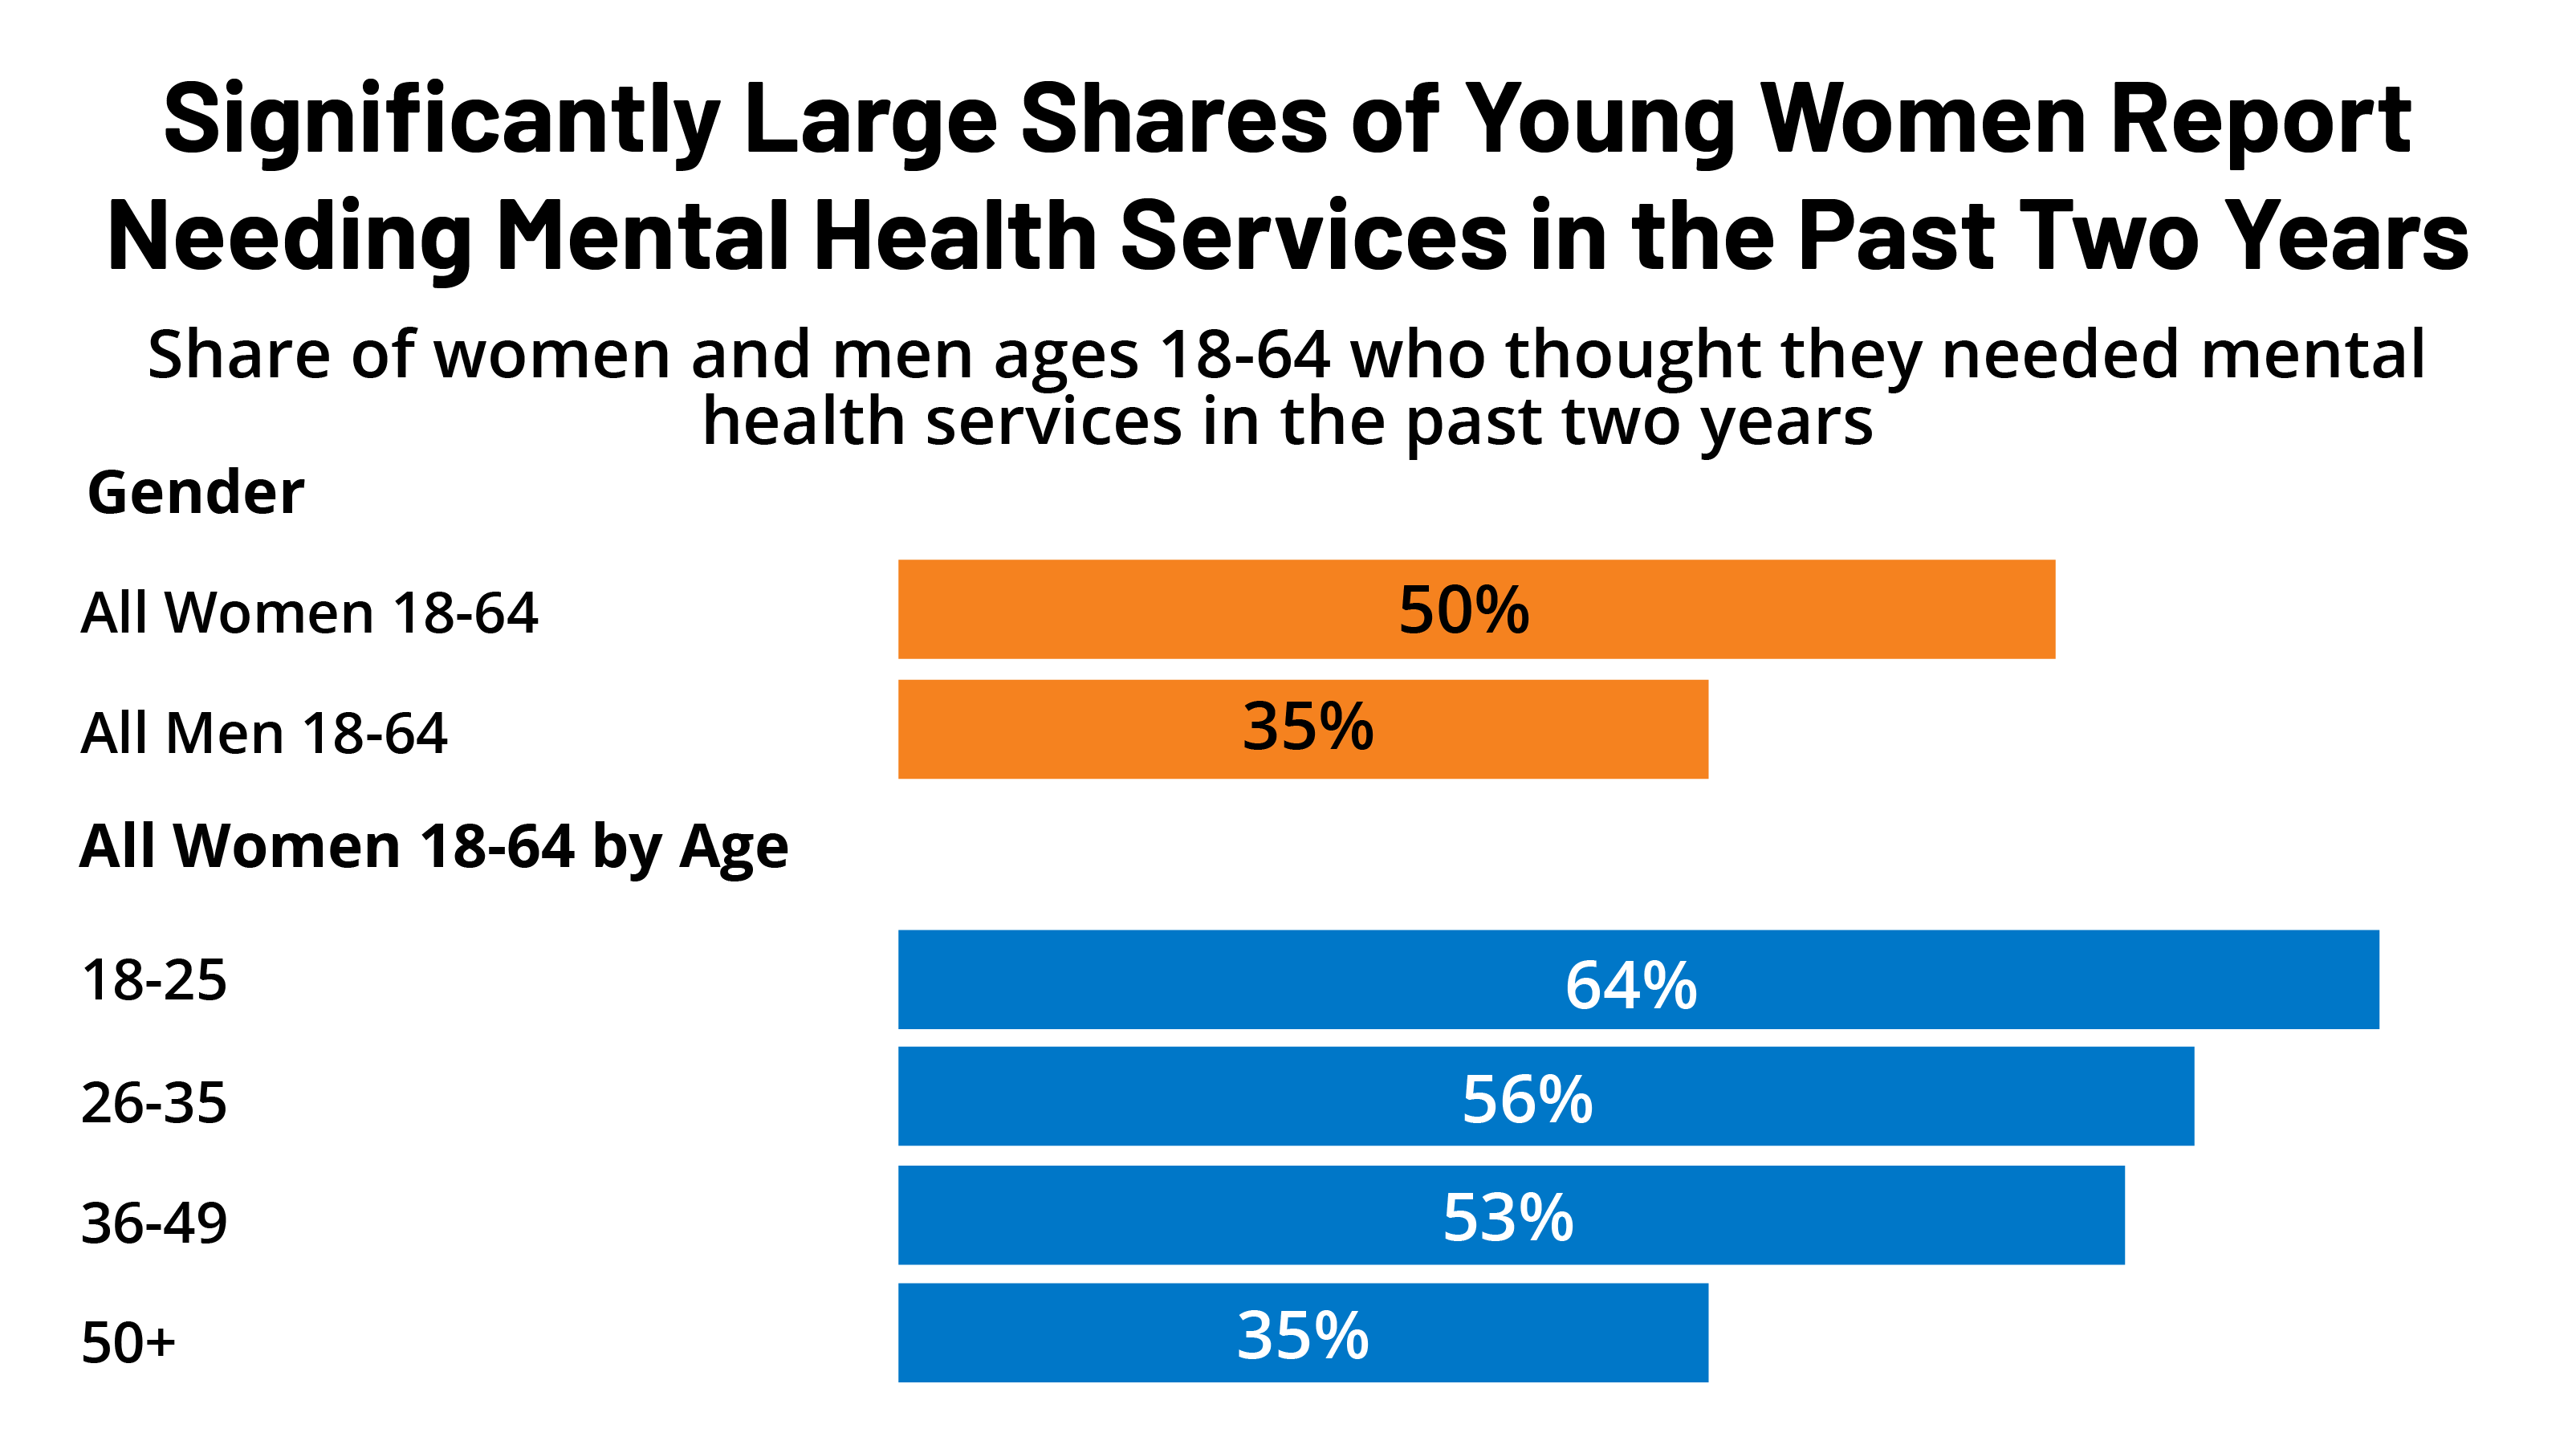
This issue brief focuses on the access and coverage of mental health services using data from the 2022 KFF Women’s Health Survey.
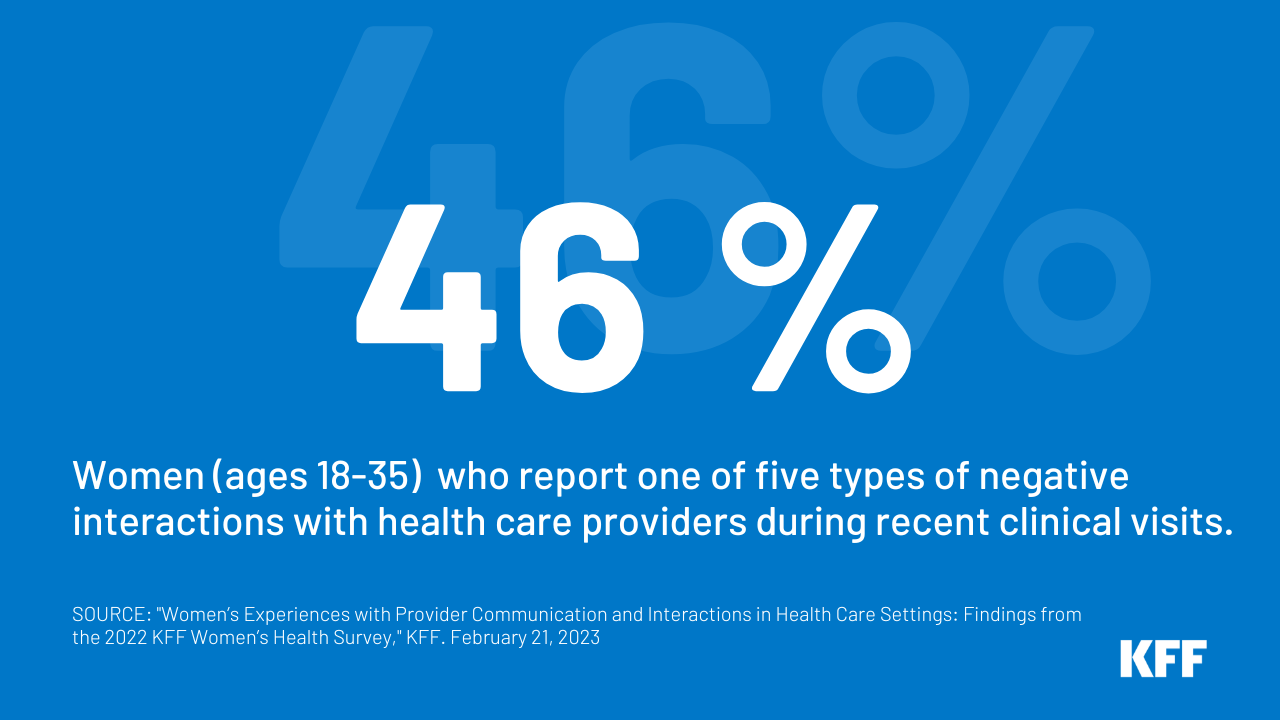
This brief presents findings from the 2022 KFF Women’s Health Survey (WHS) on women’s experiences with the health care system including screening for social determinants of health, provider communication and interactions, and discrimination.

This brief presents findings from the 2022 KFF Women’s Health Survey on women’s receipt of cancer screenings and other preventive services and differences between subgroups of women. We also present data on women’s and men’s awareness of federal requirements for private insurance coverage of preventive services.
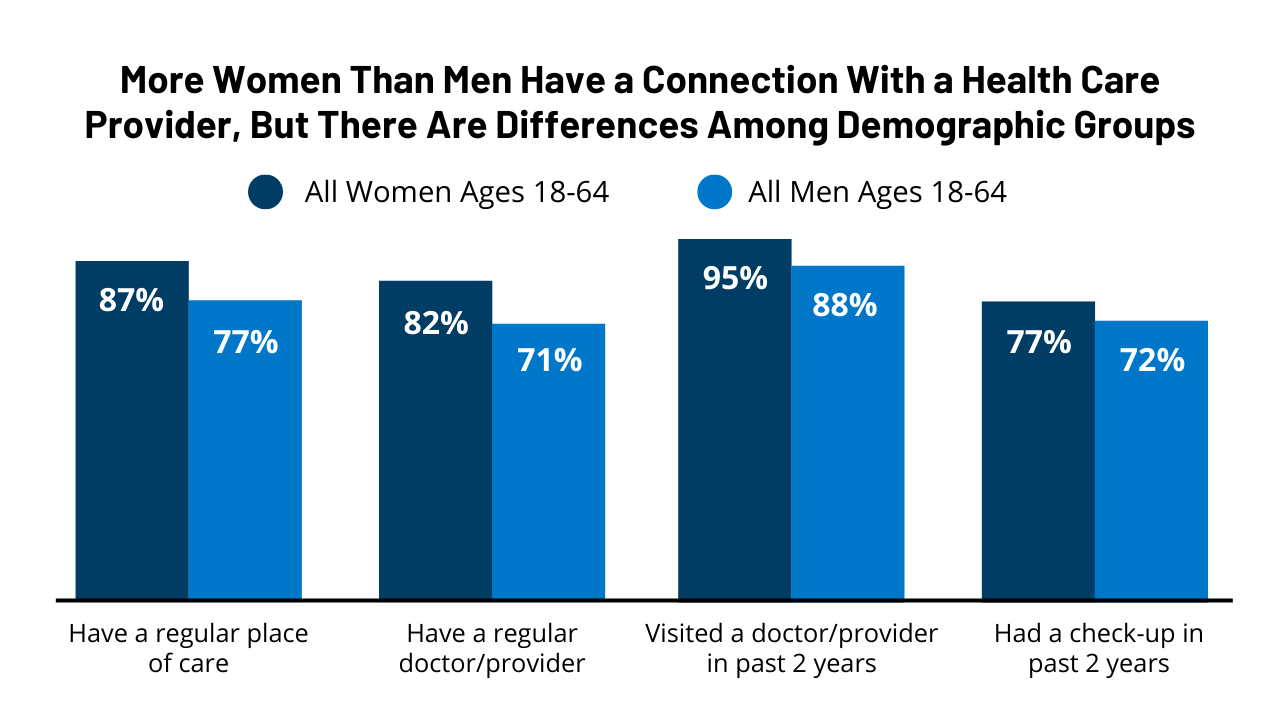
This report presents findings from the 2022 KFF Women’s Health Survey (WHS) on women’s health status, use of health care services, and costs. The WHS is a nationally representative survey of 5,145 self-identified women ages 18 to 64, conducted May 10 – June 7, 2022.
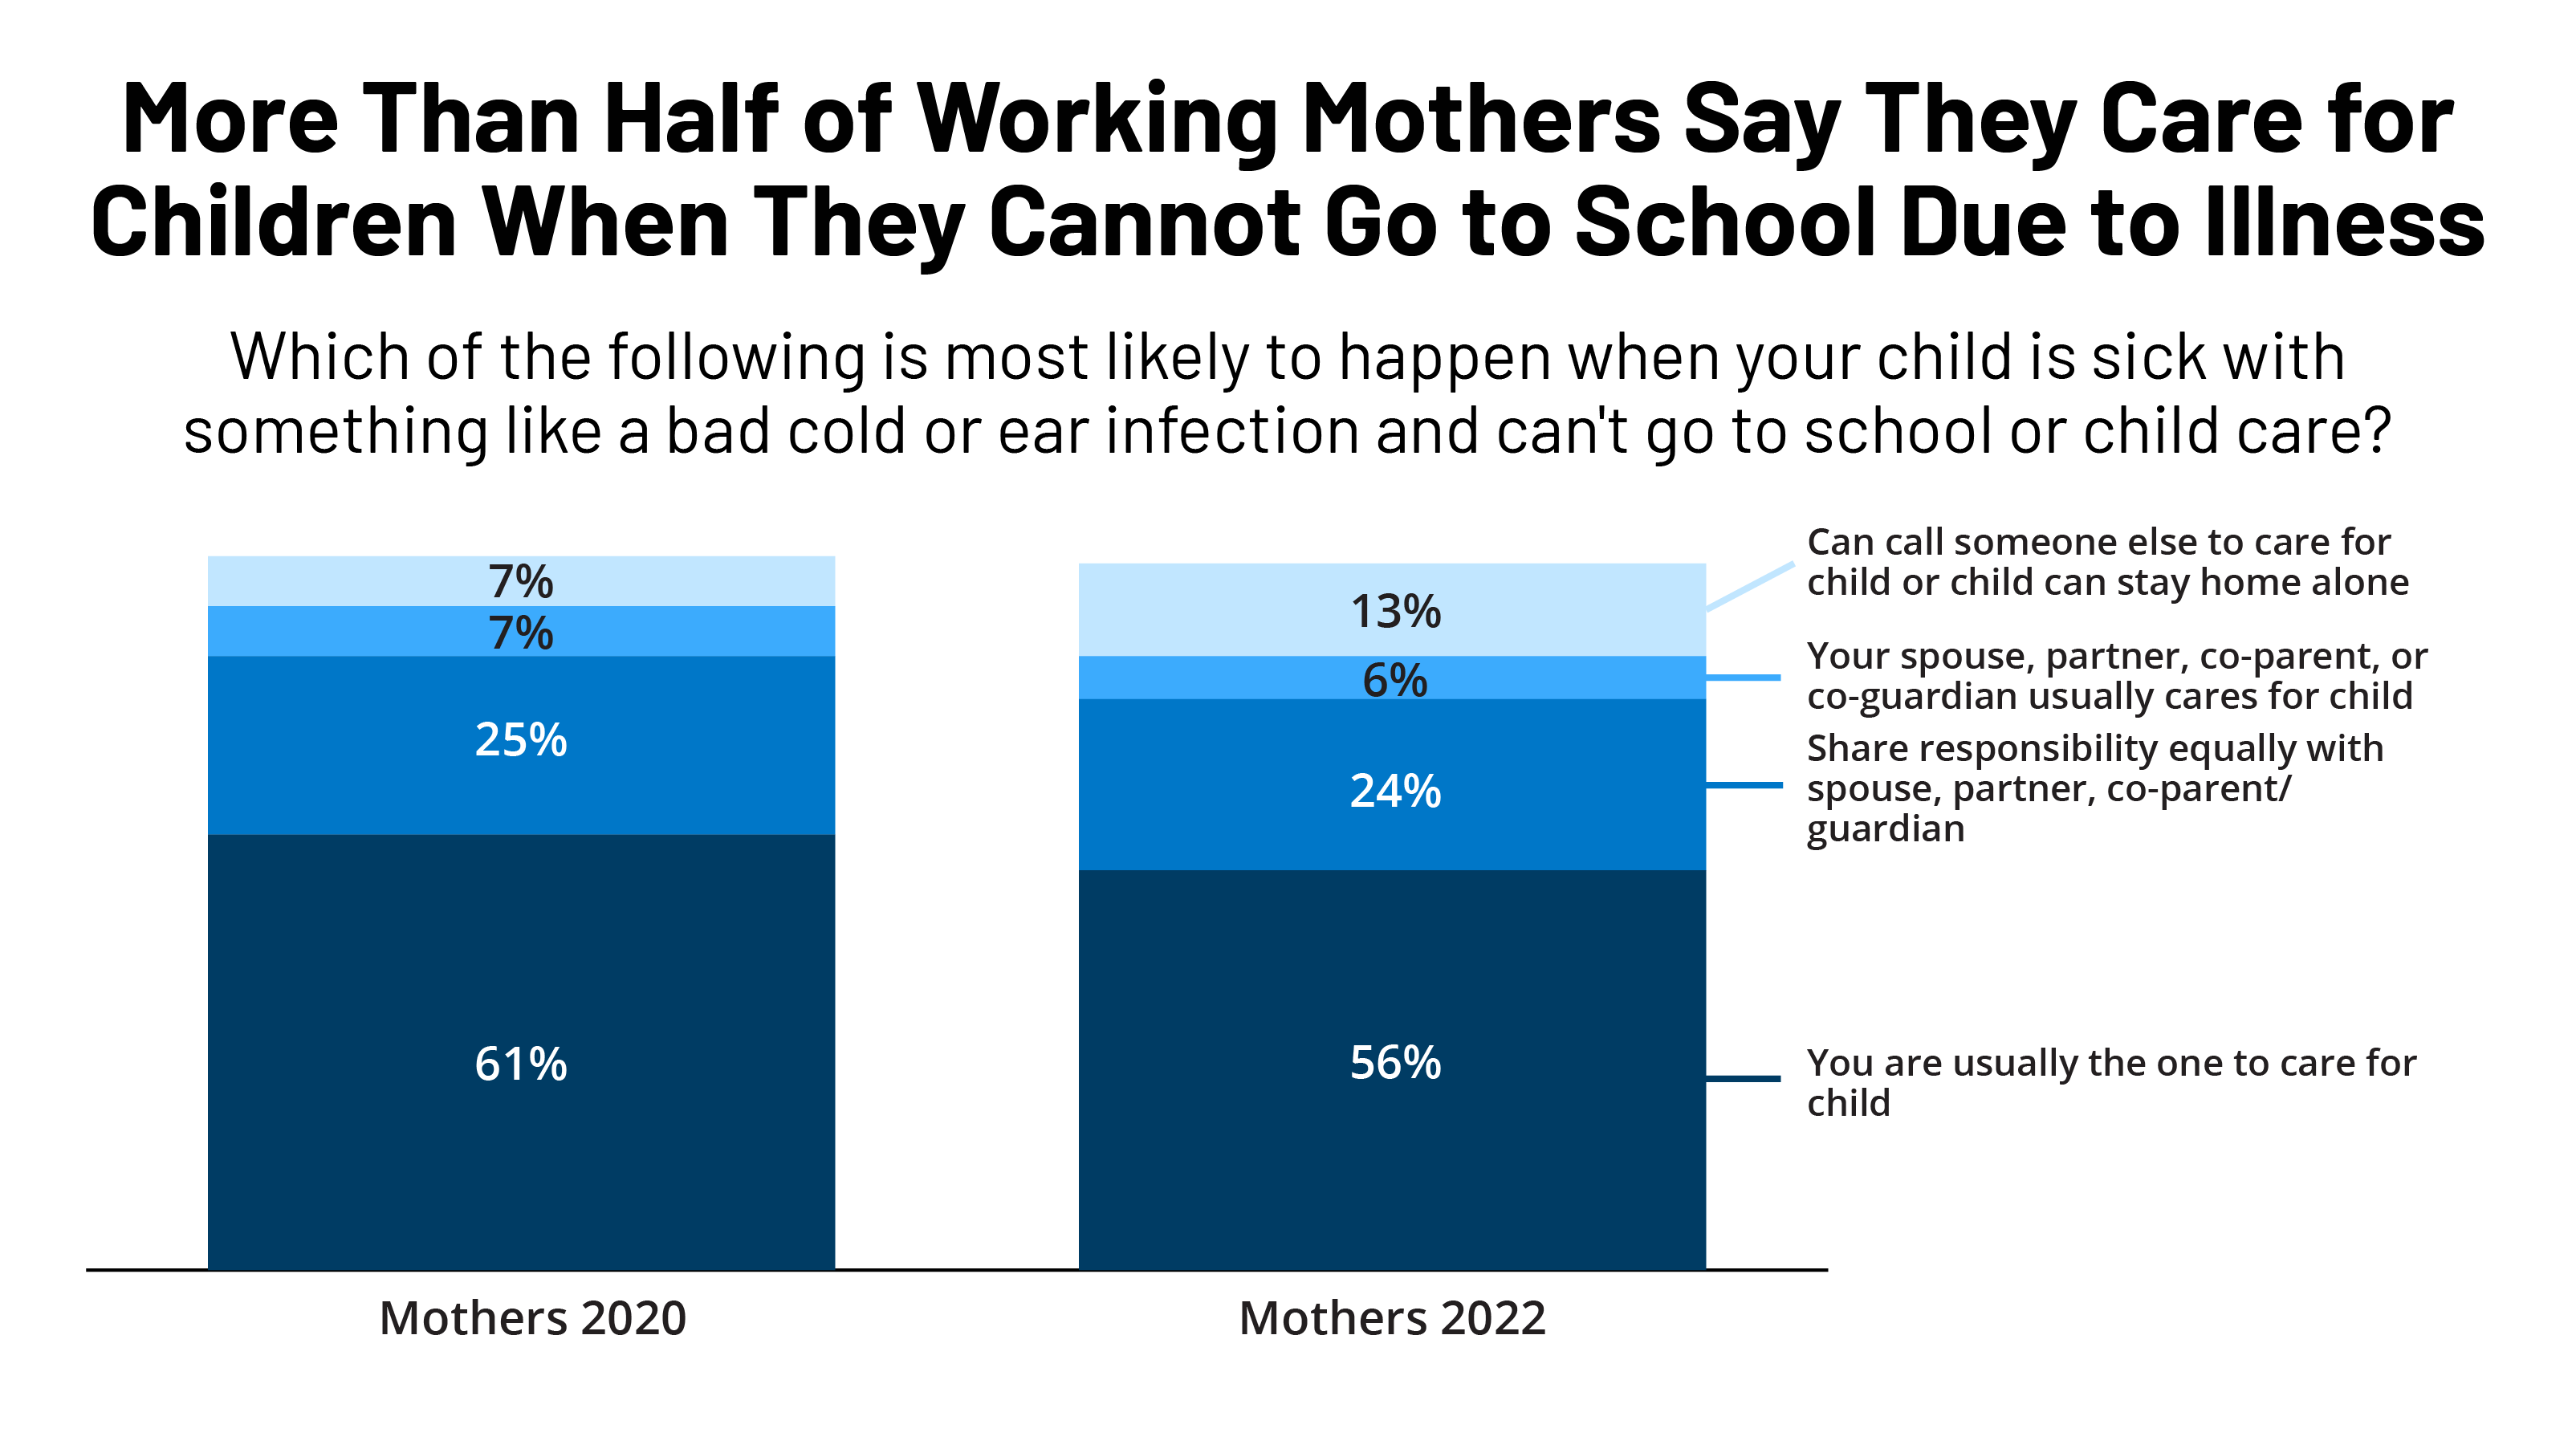
This brief, based on the 2022 KFF Women’s Health Survey highlights how workplace benefits and caring for children’s health care differ by gender and among different subpopulations of women.

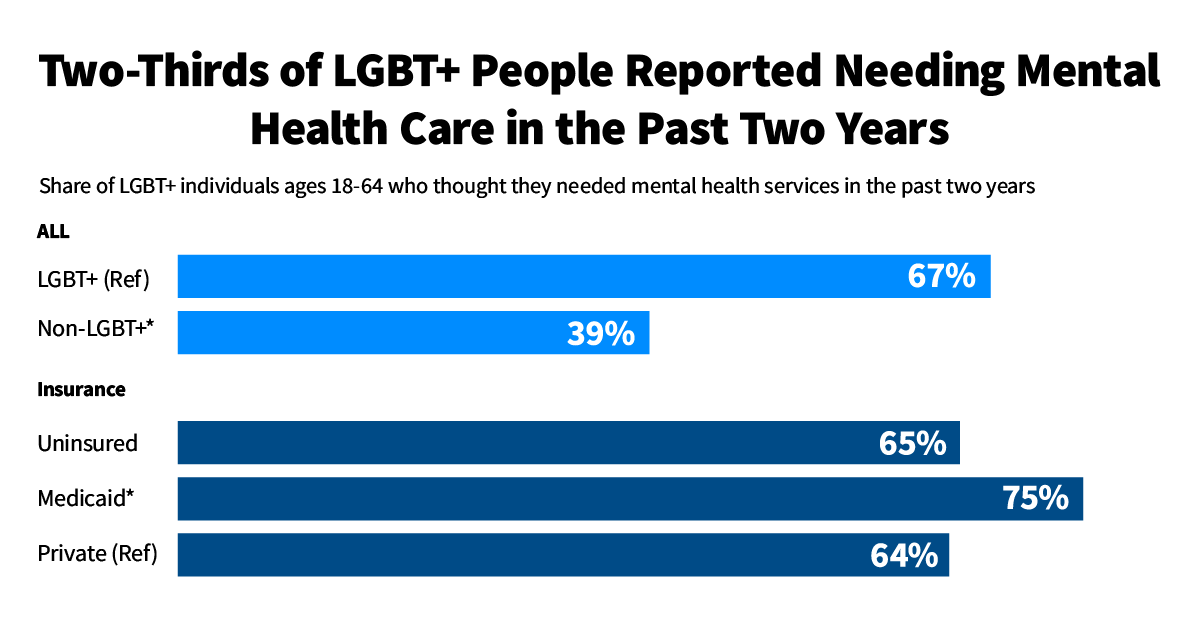
In this report, we examine LGBT+ people’s needs for and experiences accessing mental health care by analyzing data from a nationally representative 2022 KFF Women’s Health Survey with a large sample of LGBT+ adults.
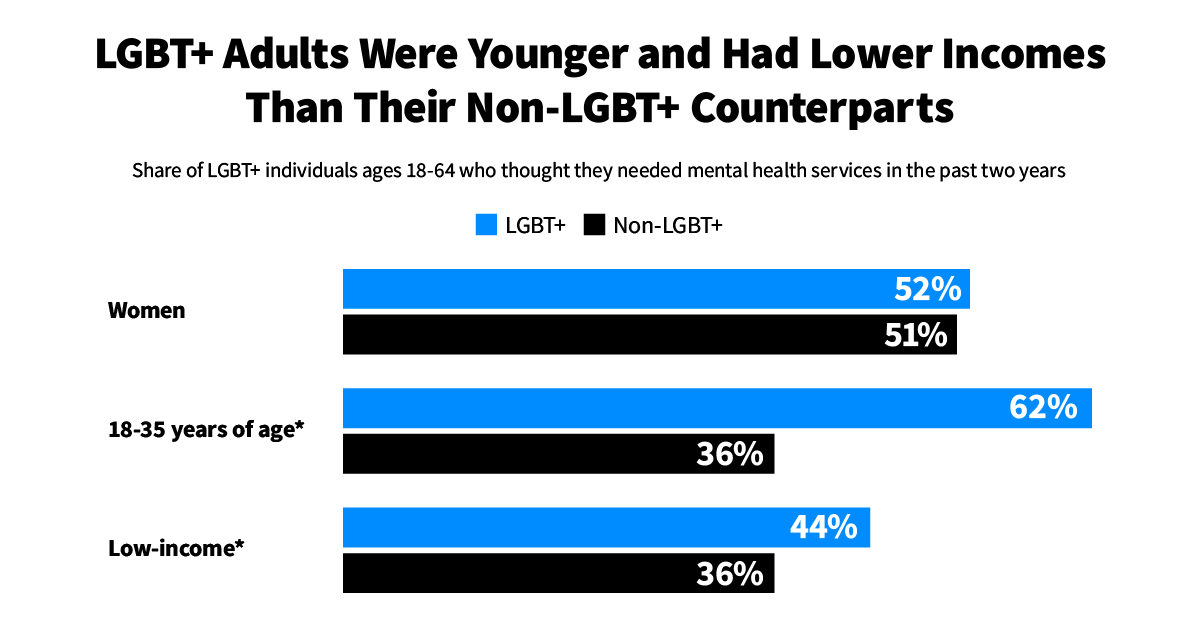
This report, based on a nationally representative 2022 KFF Women’s Health Survey, provides an analysis of the health experiences of self-identified LGBT+ adults in the U.S. compared to their non-LGBT+ counterparts.
Rural hospitals fared worse financially in states that have not expanded their Medicaid programs under the Affordable Care Act than in states that expanded Medicaid, a new KFF analysis finds.
Nearly one third of all rural hospitals nationally are in the 11 states that have not approved the expansion of their Medicaid programs to cover low-income childless adults, and concerns about their ongoing viability has been an issue in legislative debates about whether to do so.
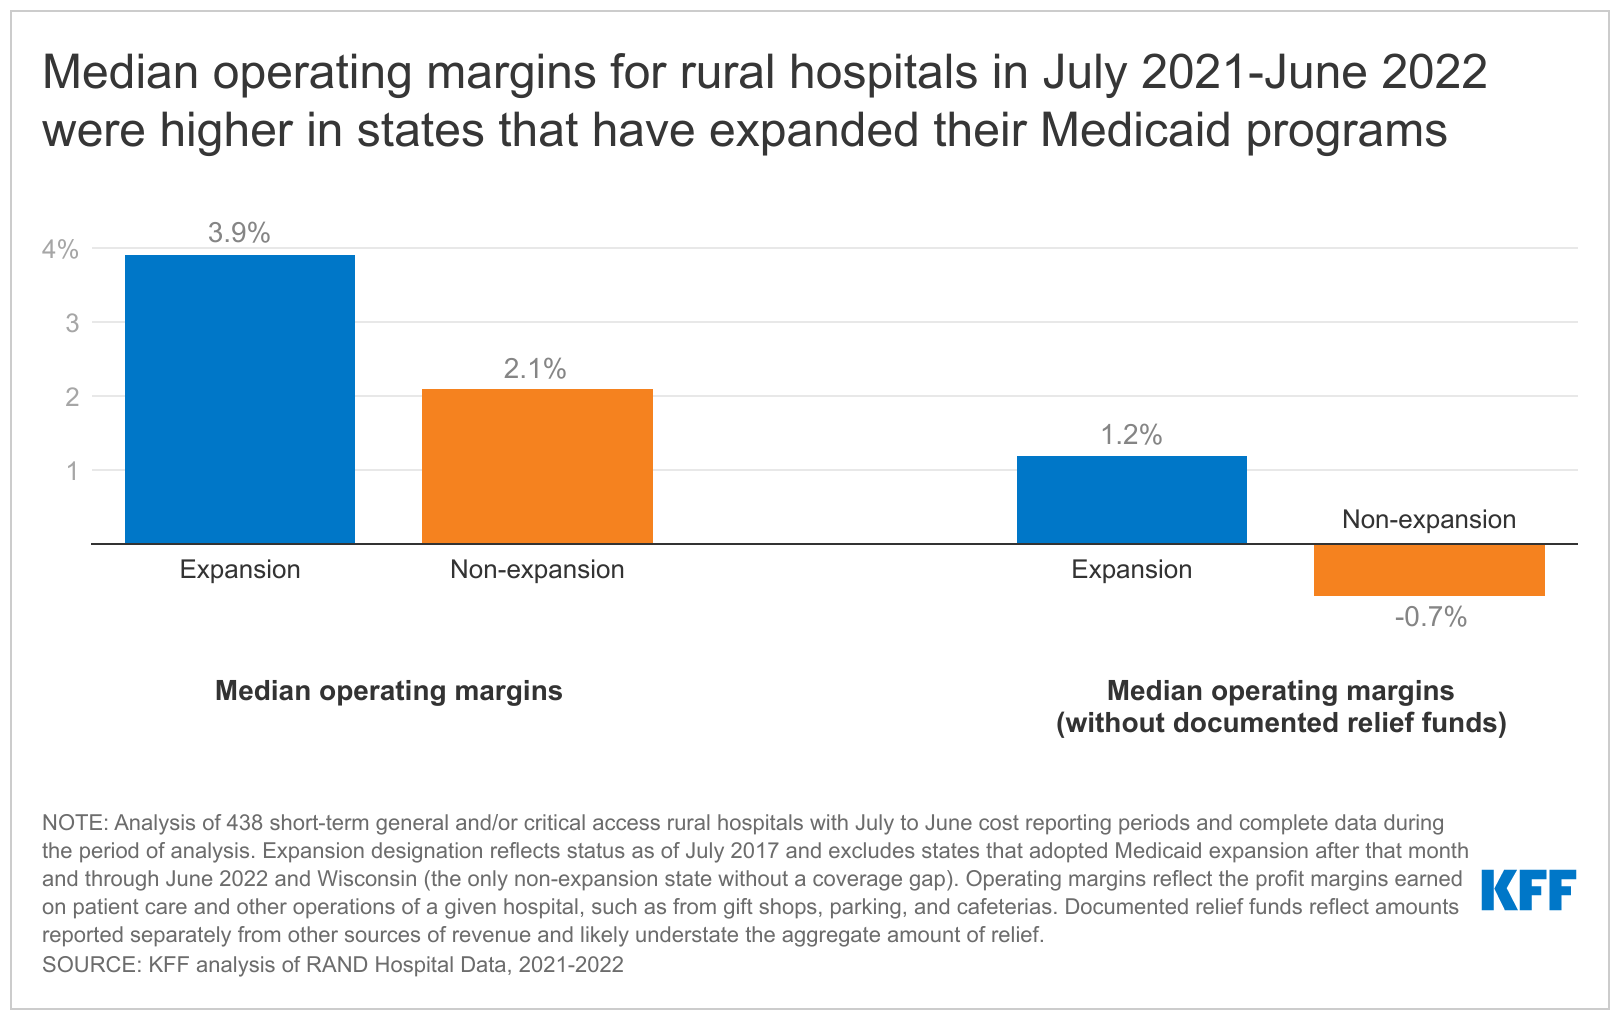
The analysis reveals that the median operating margin for rural hospitals has been consistently higher in states that have expanded their Medicaid programs than in non-expansion states from July 2017 through June 2022, although the financial stability of individual rural hospitals varies widely.
For the most recent period, from July 2021 through June 2022, the median operating margins for rural hospitals in states that have not expanded their Medicaid programs was 2.2%, compared to 3.9% in expansion states, based on the 438 hospitals analyzed.
If not for federal COVID-19 relief funds, rural hospitals would be facing even more challenging times as their finances have worsened, with median operating margins dipping to 1.2% in expansion states and -0.7% in non-expansion states when subtracting out documented relief funds.
Based on an analysis of hospital cost reports, Rural Hospitals Face Renewed Financial Challenges, Especially in States That Have Not Expanded Medicaid is part of KFF’s expanding work examining the business practices of hospitals and other providers and their impact on costs and affordability.