Affordability in the ACA Marketplace Under a Proposal Like Joe Biden’s Health Plan
Issue Brief
The Affordable Care Act (ACA) has led to historic decreases in the uninsured rate, but about 11% of non-elderly Americans remain uninsured and the ACA Marketplaces can have high premiums and deductibles. Left out of the ACA’s affordable coverage expansion are those who buy their own insurance on the individual market but are ineligible for financial assistance. The ACA’s premium tax credits hold down premium payments for Marketplace shoppers whose incomes are between one and four times the federal poverty level ($12,490 – $49,960 for an individual in 2020). This subsidy structure has led to a lack of affordable individual market coverage options for people below poverty who live in states that do not expand Medicaid, and people shopping for their own coverage with incomes just above 400% of poverty across all states. In addition, people who are eligible for ‘affordable’ employer-sponsored insurance are ineligible for marketplace subsidies under current law. However, workers can be required to contribute as much as 9.78% of their household income for self-only coverage under an ‘affordable’ job-based plan, an amount much greater than some low-wage workers would have to pay for a subsidized marketplace plan were they eligible, and there is no limit on what workers with families might have to pay in premiums for employer coverage.
In years when there have been steep increases in exchange premiums, those receiving a subsidy have been protected from premium hikes, while those ineligible for subsidies face the full increase and may be priced out of coverage. Enrollment in the individual market increased from about 11 million before the ACA to a peak of 17 million in 2015 and 2016. Steep premium increases for the 2017 and 2018 plan years coincided with sharp reductions in signups, particularly among people not receiving subsidies. Currently, more than 13 million people are enrolled in individual market coverage.
Additionally, high deductibles have created affordability challenges even for those with premium subsidies. The ACA includes an additional type of financial assistance, called a cost-sharing subsidy, which brings down deductibles and copayments, but only Marketplace purchasers whose incomes are between 1 and 2.5 times the poverty level are eligible for this help. People outside of this income range typically face deductibles of several thousand dollars or more, with silver (mid-level plan) deductibles reaching an average of about $4,450 for a single person in 2020. High deductibles can also discourage people from enrolling in coverage in the first place.
While there is general agreement that high premiums and deductibles for those without a subsidy are critical problems facing the ACA Marketplace, the 2020 presidential candidates differ in their proposed solutions. President Trump has advocated repeal of the ACA and his administration currently supports a lawsuit that would overturn the law. If successful, the lawsuit could lead to significant coverage losses. President Trump has also expanded the availability of short-term plans, which have lower premiums than ACA-compliant plans because they do not have to follow the ACA’s rules, particularly coverage of pre-existing conditions. Short-term plans do not qualify for ACA premium subsidies, but the Trump administration has issued guidance allowing state waivers that would redirect premium subsidies to short-term plans under certain circumstances.
Former Vice President Joe Biden, on the other hand, has supported building on the ACA framework by expanding subsidies and creating a new public option. While Biden’s public option proposal has received significant attention, his proposal to expand ACA premium subsidies has not been the subject of much public discussion or analysis, especially his plan to extend eligibility for subsidies to people with employer coverage. In this analysis, we examine current insurance affordability challenges under the ACA, and the effects of a proposal like Biden’s to expand subsidies for people currently purchasing Marketplace or employer coverage. We find that:
- The cost of ACA Marketplace coverage would be lower for nearly all current Marketplace enrollees, as well those who are currently priced out of the market.
- A 40-year-old making $50,000 would go from paying $522 per month for the second-lowest cost gold plan to paying $354 per month under a Biden-like proposal, a savings of $168 (or 32%) per month.
- More than 12 million people with employer-based insurance would pay a smaller share of their income towards premiums by switching into a Marketplace plan under premium caps similar to those Biden has proposed.
While a proposal like Biden’s would make coverage more affordable for a significant number of people, they would also increase federal spending, which we do not attempt to estimate here. The Biden campaign has estimated that Biden’s health plan would more than double federal Marketplace spending over 10 years.
How Affordable are Marketplace Plans under Current Law?
The map below shows premium affordability for people with various incomes and ages under current law. The ACA provides sliding scale subsidies that cap an individual’s required premium contribution toward a benchmark plan (the second-lowest-cost silver plan) at a certain percent of one’s income. The amount of premium tax credit equals the actual cost of the benchmark plan minus the individual’s required contribution. Premium tax credits are available to Marketplace purchasers whose incomes are between 100% and 400% of the federal poverty level. Cost-sharing reductions are available to Marketplace shoppers who have incomes between 100% and 250% of poverty. Those whose income is below 150% of poverty receive the most generous cost-sharing assistance, though in states that have expanded Medicaid most of this group are enrolled in Medicaid rather than the Marketplace.
Marketplace participants can apply their premium tax credits to other plans that are more or less expensive than the benchmark plan. For example, someone may decide to enroll in the cheapest bronze plan offered on the marketplace and, if the premium tax credit amount equals or exceeds the cost of that plan, she can enroll for free. Approximately 4.7 million uninsured individuals were eligible for zero premium bronze plans at the start of 2020. The tradeoff, however, is that bronze plans typically have much higher deductibles ($6,500 on average). Cost-sharing subsidies are only offered through silver-tier marketplace plans. A consumer might also decide to enroll in a plan that costs more than the benchmark plan – for example, she might prefer a more expensive gold plan with a lower deductible; on average, gold plan deductibles are about $1,500 per year for an individual. If so, the net premium payment after applying the tax credit will be more than the benchmark plan would have cost.
For people receiving both premium and cost-sharing assistance, ACA Marketplace plan subsidies are more comprehensive. For example, the average 60-year-old making $20,000 (160% of poverty) pays $77 per month (less than 5% of their income) on a silver plan, and has a deductible of less than $800.
Those with higher incomes who are still within the subsidy range face higher costs. For example, at a $49,000 income (392% of poverty), the typical 60-year-old would pay $399 per month (just under 10% of their income) with a typical deductible approaching $4,450 for the same silver plan. This person is still receiving a monthly subsidy of $579 for help paying the premium, but they are not eligible for a reduced deductible.
Marketplace shoppers who are not eligible for any assistance face high and rising costs. If a 60-year-old’s income is $50,000 (just over 400% of poverty), she is no longer eligible for subsidies and would have to pay full price for a silver plan – $979 per month, or 23% of her income, with a deductible of about $4,450. This is an example of the so-called “subsidy cliff,” described more below and shown in Figure 3. The subsidy cliff is less pronounced for younger enrollees. People ineligible for subsidies can reduce premium costs by choosing a less expensive bronze plan, though this would not necessarily eliminate the subsidy cliff. The national average premium for the lowest cost bronze plan in 2020 for a 60-year old costs $622 per month, or nearly 15% of gross income for someone earning $50,000 (Figure 3). In addition, deductibles under bronze plans are even higher, averaging $6,506 in 2020.
Figure 1
What Changes would Biden Make to ACA Marketplace Subsidies?
In this portion of the analysis, we focus on the effects of Joe Biden’s health plan on people who are currently purchasing their own coverage, or who would be purchasing this coverage but have been priced out. Biden has proposed building on the ACA by increasing the amount of financial assistance and expanding subsidy eligibility beyond the current range of 100-400% of poverty for Marketplace purchasers. In his plan, Biden would peg the benchmark for premium tax credits to the second-lowest cost gold plan instead of the current silver benchmark, meaning premium subsidies would be higher and Marketplace purchasers could more easily afford a lower-deductible plan.
Biden would reduce the maximum premium contribution cap to 8.5% of an enrollee’s income for a benchmark gold plan (currently the cap on enrollees’ contributions toward the benchmark silver plan is just under 10% of income). He would also remove the upper income limit on premium subsidies, extending the new 8.5% premium cap to higher-income enrollees, and so eliminating the “subsidy cliff.”
The Biden plan presumably would lower the required contribution for subsidy-eligible individuals at all income levels. Though his plan does not specify amounts, this analysis assumes required contribution amounts described in H.R. 1884, a measure passed in the House of Representatives in 2020 that also caps required individual premium contribution amounts at 8.5% of income and eliminates the subsidy cliff. In this bill, for example, people with income of 160% FPL, who must contribute 4.59% of their income toward the cost of the benchmark plan under current law, would only have to contribute 2.4% of their income toward the cost of the benchmark plan.
In addition, Biden would allow workers with an offer of job-based coverage to enroll in Marketplace plans with subsidies if that would be a better deal. Under current law, employees qualify for Marketplace subsidies only if their employer’s plan is deemed unaffordable or does not satisfy minimum coverage requirements. Employer coverage is considered unaffordable if the worker’s premium contribution for self-only amounts to more than 9.78% of household income. The affordability test for employer-sponsored coverage offered to family members also is based on the cost of self-only coverage. As a result, if an employer pays the full premium for its workers but contributes nothing toward the cost of family coverage, family members are still considered to have an offer of “affordable” employer-sponsored coverage and so are ineligible for Marketplace subsidies; this is sometimes referred to as “the family glitch.” (See below for analysis of how many people with employer coverage could benefit from this change.)
Biden would also create a public option that would be open to all Marketplace participants. People who live in states that have not adopted the ACA Medicaid expansion and who make less than 138% of the poverty line would be automatically enrolled in the public option with no premium. The public plan would also negotiate payment rates with doctors and hospitals with a goal of reducing overall health plan costs.
Biden’s campaign estimates that his plan would bring the uninsured rate down to 3%. In addition to the subsidy expansion and public option components of his plan, Biden has said that he would reinstate the individual mandate penalty, pass legislation to protect patients from surprise bills, block mergers that threaten competition in the health care industry, and allow the federal government to negotiate pharmaceutical prices.
How would a proposal like Biden’s affect premiums for people buying their own coverage?
We find that, by implementing a proposal like Biden’s to benchmark premium tax credits to the cost of more generous gold plans and capping premium payments at 8.5% of income, many individuals currently purchasing their own insurance could pay lower premiums for more generous coverage.
Average premium changes: On average across the U.S., a 40-year-old person making $20,000 (160% of poverty) would go from paying $139 to $39 per month for the second-lowest cost gold plan. A 40-year-old making $45,000 (360% of poverty) would go from paying $429 per month for the second-lowest cost gold plan under current law to $296 per month under a Biden-like proposal, a savings of 31% or $133 per month. A 40-year-old who makes $50,000, and thus is currently unsubsidized, would go from paying $522 per month to paying a subsidized premium of $354 for a gold plan.1
The savings would be largest for older enrollees whose incomes are just above the current subsidy threshold. For example, a 60-year-old making $50,000 (just over 400% of the poverty line) would go from paying an average of $1,029 per month (25% of income) to $354 (8.5% of income) for a gold plan, a savings of 66% (Table 1).
| Table 1: National Average Change in Monthly Premium and Annual Deductible for Enrollee at $50,000 Income(Just over 400% of Poverty) | ||||||
| Bronze Plan (Typical Deductible of $6,500) | Gold Plan (Typical Deductible of $1,500) | |||||
| Current Law | Biden’s Proposal | % Change | Current Law | Biden’s Proposal | % Change | |
| 60 year old | $622 | $30 | -95% | $1,029 | $354 | -66% |
| 40 year old | $324 | $160 | -51% | $522 | $354 | -32% |
| 27 year old | $272 | $186 | -32% | $437 | $349 | -20% |
| Note: This table shows enrollment-weighted average premiums for the lowest-cost bronze plan and the second-lowest cost gold plan in each county, based on premiums in effect in 2020. The payment for the second-lowest cost gold plan under the Biden plan would be set as a certain percent of one’s income. Estimated costs of bronze plans do not take into account any impact of the new public plan option on premiums or subsidy amounts. | ||||||
Importantly, in addition to lowering what people would pay in premiums for marketplace plans, the Biden proposal would mean that many people could more easily afford to purchase more generous Marketplace plans with lower deductibles. For example, using national average Marketplace plan premiums, a 40-year-old making $50,000 (just above the subsidy range under current law) would go from paying $522 per month (nearly 13% of her income) to paying $354 per month (8.5% of her income, a savings of 32%) for a gold plan with a typical deductible of about $1,500.
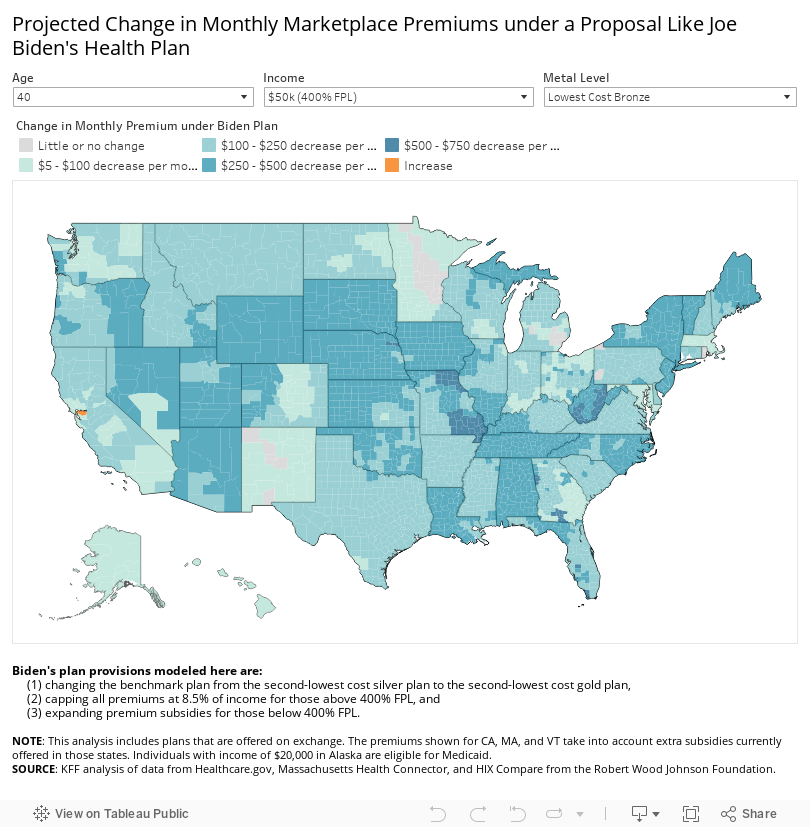
County-by-county premium changes: The cost difference is particularly dramatic for middle-income enrollees who are older and those living in rural areas, where premiums tend to be higher. On average, a 60-year-old making $50,000 would go from paying $888 per month (21.3% of her income) for a silver plan to $354 monthly (8.5% of her income) for a gold plan. A 40-year-old making $50,000 in Floyd County, Georgia, would go from paying $896 monthly (21.5% of her income) for the second-lowest cost gold plan to paying $354 monthly (8.5% of her income), a yearly savings of $6,504. The map below shows the effects on premiums of a plan that benchmarks premium subsidies to the second-lowest cost gold plan in each county, caps premium payments at 8.5% of income, and further enhances premium subsidies for the current subsidy-eligible population (Figure 2).
It is important to note that the premium estimates in this paper do not account for the potential impact of Biden’s proposed public option plan on Marketplace subsidies and the net cost for a non-benchmark plan. It is not yet known how the public option will be factored into the benchmark plan calculations or the extent to which the public option plan will be able to negotiate lower payment rates with doctors or hospitals, both of which could impact pricing across the Marketplace. These limitations are discussed further in the methods section.
Figure 22
Elimination of the “subsidy cliff”: Savings are most pronounced for older, middle- and upper-middle income enrollees because, under Biden’s proposal, there would no longer be a subsidy cliff. Currently, the subsidy cliff is most extreme for older enrollees due to age rating: On average, a 60-year-old making just above the subsidy range pays 15% of their income for a bronze premium, but this payment would drop to around 1% of their income under Biden’s plan as the enrollee would become eligible for financial assistance (Figure 3). Premium subsidies would gradually taper off at higher incomes where they are no longer needed to make plans affordable.
Figure 3
Biden’s proposed changes would have varying impacts in different parts of the country, depending in large part on the prices of gold plans currently, and what those prices are relative to the cost of other metal tiers. In general, the largest gains in affordability would go to middle and upper-middle-income, older enrollees living in rural areas since this group typically pays the highest premiums under current law, and to many people below the poverty line who live in states that have not expanded Medicaid (those in the “Medicaid gap”) since they are currently not eligible for Marketplace subsidies despite their low incomes.
Since Biden’s plan does not place an upper income limit on subsidy eligibility, an older adult in Lowndes County, Georgia, where gold plans are the most expensive in the country, could theoretically receive a subsidy even if their income exceeds $300,000 per year. Currently, under the ACA, a hypothetical 64-year-old with a $300,000 income in Lowndes County, Georgia would pay $2,692 per month for a gold plan, or 11% of their income; this would drop to $2,125 (8.5% of their income) under a plan like Biden’s. This is an extreme hypothetical scenario and it is unlikely a person with this income would be purchasing their own coverage, but it demonstrates how unaffordable premiums can be under current law for people who are not receiving subsidies.
Premium subsidy changes for other groups: Adults who are in the Medicaid coverage gap – whose income is too low to qualify for Marketplace subsidies and who live in states that have not expanded Medicaid – would see the largest gains in affordability under the Biden plan. They would be eligible for, and automatically enrolled in, the new public plan option for zero premium. For example, a 60-year-old making $10,000 per year (80% of poverty) and living in a non-expansion state would go from having to pay $687 per month for the lowest-cost bronze plan currently available (over 80% of their income) to having the option of at least one plan with no premium under Biden’s proposal. Changes in affordability for coverage gap individuals are not reflected in the map in Figure 2.
Other enrollees may see no change to their premium contribution or could theoretically see premium increases in rare cases. People living in certain areas where gold plans already cost less than 8.5% of their income may not see much change in their own premium contributions. Subsidies may actually shrink in counties where, due to a practice called “silver loading,” gold plans are currently cheaper than the benchmark silver plan. For example, a 40-year-old making $40,000 in Fremont County, Wyoming, would go from paying $197 (5.9% of income) to $243 (7.3% of income) per month for the second-lowest cost gold plan. We use current day premiums as the basis of this analysis but, if Biden’s proposal ultimately becomes law, the practice of silver loading might also change or end.
Additionally, some states already have used state-only funds to supplement marketplace subsidies and/or extend them to more people. For example, California uses state dollars to extend Marketplace subsidies to people earning up to 600% of the poverty line. If Biden’s proposal ultimately were enacted, it is unclear whether states like California, Vermont, and Massachusetts would continue offering additional subsidies, so we do not factor in state-sponsored subsidies in Biden’s proposal.
How could a proposal like Biden’s affect premiums for people who enroll in coverage through an employer?
Biden’s proposal would allow those with an offer of employer-sponsored insurance to buy into the Marketplace. While the figures above illustrate how premiums would change only for people currently eligible to buy subsidized marketplace plans, there would also be substantial savings for many who currently have employer plans.
Biden’s health care proposal would eliminate the ACA’s “firewall” and “family glitch,” which make workers and their family members ineligible for premium tax credits if any worker in the family is offered “affordable” health insurance through their employer. Instead, people who are offered insurance through their work would be allowed to enroll in the public option plan and be eligible for Marketplace premium subsidies. Employer-based coverage is the largest source of insurance for non-elderly people in the U.S., and introducing the option to choose subsidized Marketplace coverage over an offer of job-based insurance could improve the affordability of coverage for many individuals and households, particularly those with lower-income workers who would otherwise qualify for substantial marketplace subsidies.
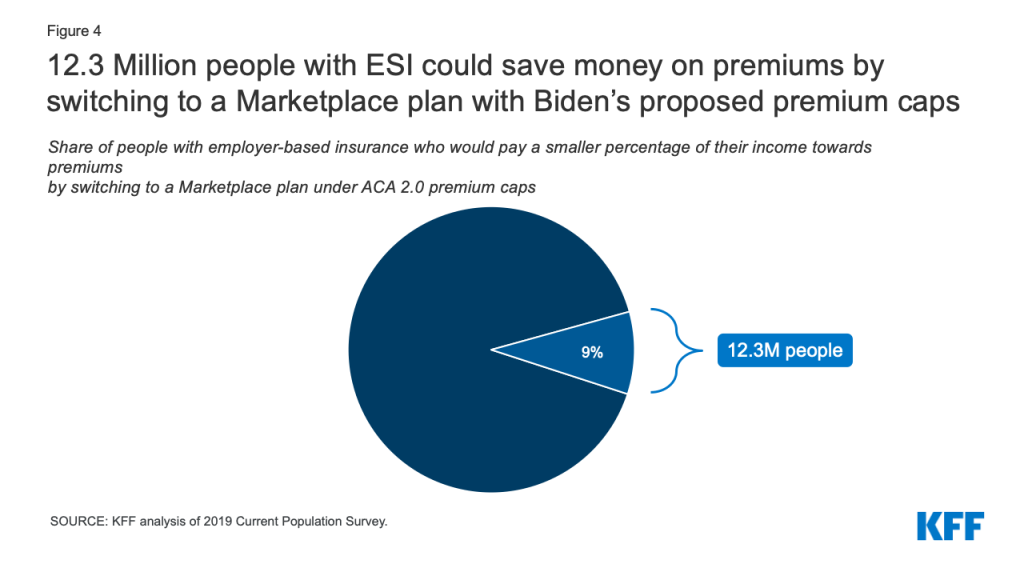
We estimate that 12.3 million people who currently have employer-based insurance are paying a larger portion of their income towards premiums than they would be if they purchased a Marketplace plan under premium caps comparable to what Biden has proposed, which would be no more than 8.5% of household income. While 12.3 million constitutes less than 10% of total enrollment in employer-sponsored coverage today, it exceeds the number of people who were enrolled in marketplace plans at the start of the year (11.4 million).
In addition to comparing premiums, people deciding whether to switch from employer coverage to a marketplace plan might also consider the relative level of cost-sharing. Today, gold Marketplace plans (the new benchmark plan under the Biden proposal) have annual deductibles averaging about $1,500, compared to an average single deductible of $1,655 for people in employer plans that had an annual deductible in 2019. In 2019, 28% of covered workers were enrolled in a job-based plan with a deductible of $2,000 or more. Low-income workers with employer coverage could also qualify for cost-sharing reductions that would lower deductibles for Marketplace plans.
The decision to switch from employer-based coverage to a Marketplace plan might also take into account a comparison of provider networks. The majority of Marketplace plans today are closed network (e.g., HMO) or narrow network plans that limit an enrollee’s choice of doctors and hospitals. Under the Biden proposal, a new public option would be offered through the Marketplace and administered by the traditional Medicare program, whose provider network includes nearly every hospital and physician in the U.S.
Discussion
ACA Marketplace premiums have fallen a bit, on average, over the last two years. However, premiums and cost-sharing for even the least expensive ACA plans remain unaffordable for some middle-income people, particularly older people who face higher premiums, and impoverished people in states without Medicaid expansion. The more than two million people who fall into the Medicaid coverage gap in states that have not expanded Medicaid face the most pressing affordability challenges, since they are not eligible for either Marketplace subsidies or Medicaid despite living below the poverty line. Many enrollees who currently receive premium subsidies are ineligible for much or any cost sharing reductions, and as a result, often face high deductibles that may limit how often they can afford to actually use their insurance. High deductibles could also discourage some people from buying coverage in the first place. Additionally, people with an employer offer that costs nearly 10% of their income for self-only coverage are currently not eligible for Marketplace subsidies, even if that plan cannot affordably cover the worker’s entire household.
Joe Biden proposes to expand ACA subsidies, which would lower the cost of Marketplace coverage for nearly all potential enrollees, including many uninsured people who have been priced out of the Marketplace altogether. Older, middle- and upper-middle-income people would see substantial savings under these proposals: an average 60-year-old making $50,000 (just above the current subsidy threshold) would see their Marketplace premiums decrease by 95% for a bronze plan and by 66% for a lower-deductible gold plan. Premiums would fall dramatically in West Virginia, Georgia, Wyoming, Missouri, South Dakota, and Nebraska, since unsubsidized Marketplace premiums are currently unaffordable in many rural parts of these states. Allowing people with employer-sponsored insurance to buy into the public option and purchase subsidized Marketplace coverage also has the potential to improve the affordability of health insurance for millions of people who are currently tied to their employer’s plan.
With these expanded subsidies and the creation of a public option, Biden’s proposal would increase the cost of operating the Marketplace. In 2019, the federal government spent nearly $55 billion in premium subsidies for Marketplace enrollees, and the Congressional Budget Office projects that the government will spend about $610 billion total on Marketplace subsidies between 2021 and 2030. This figure would likely increase significantly under Biden’s proposed changes, driven in part by those who transition from employer-sponsored insurance to the individual market. Biden’s campaign estimates that his health care plan, including the public option and the subsidy expansion, would cost an additional $750 billion over 10 years. Biden plans to pay for the plan by raising income taxes on high-income people and raising the capital gains tax.
In contrast to Biden’s plan to build on the ACA, President Trump has supported proposals to repeal and replace the ACA. The Trump administration has focused on addressing affordability problems by loosening regulations on short-term, limited duration health plans that generally have lower premiums than ACA-compliant coverage, in large part because these plans can exclude people with pre-existing conditions and may not cover certain services, thus shifting higher out-of-pocket costs to those who are sick. The Trump administration also supports a lawsuit that seeks to overturn nearly all parts of the ACA and, without a replacement plan, would lead to significant coverage losses.
Appendix
| Appendix Table 1: Change in Monthly Bronze Premium under Biden’s Proposal | |||||||
| Lowest Bronze (Current Law) | Lowest Bronze (Proposed Changes) | ||||||
| Income | FPL | 27 year old | 40 year old | 60 year old | 27 year old | 40 year old | 60 year old |
| $20,000 | 160% | $5 | $3 | $1 | $0 | $0 | $0 |
| $25,000 | 200% | $37 | $24 | $3 | $0 | $0 | $0 |
| $30,000 | 240% | $91 | $73 | $14 | $12 | $4 | $0 |
| $35,000 | 280% | $156 | $136 | $41 | $45 | $26 | $0 |
| $40,000 | 320% | $209 | $194 | $82 | $88 | $62 | $2 |
| $45,000 | 360% | $234 | $232 | $116 | $135 | $107 | $10 |
| $50,000 | 400% | $272 | $324 | $622 | $186 | $160 | $30 |
| $60,000 | 480% | $274 | $331 | $666 | $231 | $223 | $71 |
| $70,000 | 560% | $274 | $331 | $680 | $253 | $273 | $122 |
| $80,000 | 641% | $274 | $331 | $687 | $265 | $301 | $182 |
| $90,000 | 721% | $274 | $331 | $687 | $270 | $316 | $245 |
| $100,000 | 801% | $274 | $331 | $687 | $273 | $325 | $308 |
| Note: This table shows enrollment-weighted average premiums for the lowest-cost bronze plan. The payment for the second-lowest cost gold plan is set as a certain percent of one’s income. However, the lowest-cost bronze plan payment could change, depending on how insurers and the public option plan are priced relative to the gold benchmark. | |||||||
| Appendix Table 2: Change in Monthly Gold Premium under Biden’s Proposal | |||||||
| Second-Lowest Gold (Current Law) | Second-Lowest Gold (Proposed Changes) | ||||||
| Income | FPL | 27 year old | 40 year old | 60 year old | 27 year old | 40 year old | 60 year old |
| $20,000 | 160% | $128 | $139 | $213 | $39 | $39 | $39 |
| $25,000 | 200% | $191 | $202 | $275 | $83 | $83 | $83 |
| $30,000 | 240% | $254 | $265 | $339 | $140 | $140 | $140 |
| $35,000 | 280% | $321 | $333 | $405 | $192 | $193 | $193 |
| $40,000 | 320% | $373 | $391 | $464 | $243 | $243 | $243 |
| $45,000 | 360% | $398 | $429 | $505 | $296 | $296 | $296 |
| $50,000 | 400% | $437 | $522 | $1,029 | $349 | $354 | $354 |
| $60,000 | 480% | $439 | $529 | $1,075 | $395 | $419 | $425 |
| $70,000 | 560% | $439 | $529 | $1,089 | $417 | $470 | $496 |
| $80,000 | 641% | $439 | $529 | $1,095 | $428 | $498 | $567 |
| $90,000 | 721% | $439 | $529 | $1,095 | $434 | $513 | $637 |
| $100,000 | 801% | $439 | $529 | $1,095 | $436 | $522 | $707 |
| Note: This table shows enrollment-weighted average premiums for the second-lowest cost gold plan. The payment for the second-lowest cost gold plan is set as a certain percent of one’s income. However, the lowest-cost bronze plan payment could change, depending on how insurers and the public option plan are priced relative to the gold benchmark. | |||||||
Methods
We analyzed data from the 2020 Individual Market Medical files to determine premiums and the benchmark amounts to calculate premium tax credits for the scenarios presented. These files are available at data.healthcare.gov. Premiums for state-based Marketplaces are from KFF analysis of data received from Massachusetts Health Connector, Covered CA, and KFF analysis of data published by HIX Compare from the Robert Wood Johnson Foundation. This analysis only includes on-exchange plans. Off-exchange plans generally have similar premiums to on-exchange plans with the exception of silver plans, which often include an additional premium load on-exchange only to account for cost-sharing reductions insurers must provide to some exchange enrollees.
All averages are weighted by county-level 2019 plan selections. 2019 plan selections come from the 2019 Marketplace Open Enrollment Period County-Level Public Use file provided by CMS, available here. In states running their own exchanges, we gathered county-level plan selection data where possible and otherwise estimated county plan selections based on the county population in the 2010 Census and total state plan selections in the 2019 OEP State-Level Public Use File provided by CMS, available here.
The premium caps used to model Biden’s proposal are shown in Table 3.
| Table 3: Premium Cap, by Income | ||
| Income% Poverty | Premium Cap | |
| Current Law, 2020(% of income for 2nd lowest cost silver plan) | Biden’s Proposal(% of income for 2nd lowest cost gold plan) | |
| Under 100% | No Cap | 0% (in public option) |
| 100% – 138% | 2.06% | 0% (in public option) |
| 138% – 150% | 3.09% – 4.12% | 1% – 2% |
| 150% – 200% | 4.12% – 6.49% | 2% – 4% |
| 200% – 250% | 6.49% – 8.29% | 4% – 6% |
| 250% – 300% | 8.29% – 9.78% | 6% – 7% |
| 300% – 400% | 9.78% | 7% – 8.5% |
| Over 400% | No Cap | 8.5% |
| Note: Note that tax credits for the 2020 benefit year are calculated using 2019 federal poverty guidelines.Source: Kaiser Family Foundation | ||
This analysis has some limitations. While Biden also supports a new public option, the premium payments shown in this paper do not account for the public option. The Biden plan does not specify two details about the public plan that we would need to know to estimate how the public plan could impact Marketplace subsidies and, in particular, an individual’s net cost for a non-benchmark plan. First, the Biden plan, does not specify how much lower public plan provider payments might be compared to those paid by commercial insurers today. To the extent a public option negotiates lower payment rates for doctors and hospitals, the premium for the public option would be lower and might also lead competing private health insurance plans to lower their premiums. In addition, the Biden plan does not explain how the public option would be factored into the benchmark plan calculations. If the public plan is counted in determining the second-lowest-cost gold plan, and if the public plan premium is cheaper than the second-lowest-cost commercial gold plan, then the amount of premium tax credit dollars would be reduced for everyone. This would not affect what people pay for the benchmark plan – that amount is always equal to a sliding-scale percentage of household income. But it could increase what people pay for plans other than the benchmark plan because an individual’s payment for all other plans equals the plan’s actual premium minus the premium tax credit for that individual. Because we did not take into account effects of a new public plan offering, the figures in this analysis could overstate the cost of a bronze plan in some cases.
We used data from the 2019 Current Population Survey to estimate the number of people with employer-based insurance who are paying a higher share of their income on premiums now than they would be if they switched to a Marketplace plan under premium caps comparable to what Biden has proposed. To do so, we aggregated income and premium payments at the tax unit level. To reflect 2020 values, we adjusted tax unit income for inflation and adjusted tax unit premium payments using the average growth in employer sponsored premiums from KFF’s Employer Health Benefits Survey, depending on whether the tax unit had single or family coverage. We then deflated tax unit premiums to reflect the tax unit’s current after-tax premium based on the unit’s marginal tax rate and payroll tax liability. We used this adjusted premium value to calculate the share of the unit’s income that was going towards premiums, and compared that percentage to the premium caps that would apply to the unit as outlined in HR. 1884 (Appendix Table 3).
Endnotes
- A person making $50,000 is currently eligible for subsidies only in California, as the state funds additional subsidies for those who make less than 600% of poverty. Vermont and Massachusetts also provide additional state-funded subsidies to Marketplace enrollees, but these subsidies do not extend above 400% of poverty. ↩︎
- The payment for the second-lowest cost gold plan is set as a certain percent of one’s income. However, the lowest-cost bronze plan payment could change under Biden’s proposal, depending on how the public option plan is priced relative to the gold benchmark. ↩︎