Key Data on Health and Health Care for American Indian or Alaska Native People
Introduction
American Indian and Alaska Native (AIAN) people experience substantial and enduring disparities in health, health care, and health coverage. While the federal government has a trust responsibility to meet the health care needs of AIAN people, the Indian Health Service (IHS), the primary federal agency charged with upholding the trust responsibility has historically been underfunded and unable to meet their health care needs. AIAN people face challenges accessing health care, including geographic isolation, economic challenges, and limited access to culturally appropriate care that reflect a long history of abuse and mistreatment by the federal government. Proposed cuts to Medicaid could widen health and health care disparities for AIAN people given that Medicaid is a major source of health coverage for AIAN people and funding for IHS and Tribal providers.
AIAN people are often excluded from data and analysis due to smaller population sizes, limiting the visibility and understanding of their health outcomes and the challenges they face in accessing health services and impeding efforts to address their health care needs and reduce disparities. Moreover, aggregate data for AIAN people may mask underlying disparities among Tribes and subgroups of the AIAN population. Data availability may become even more limited going forward, due to the Trump administration’s actions to reduce racial and ethnic data collection and reporting.
To help address gaps in data and information, this brief provides an overview of AIAN people’s health and health care, including by subgroup, where data allow, and differences are statistically significant. It is based on KFF analysis of data from multiple datasets, including the 2019-2023 American Community Survey, the 2023 Behavioral Risk Factor Surveillance System, and the Centers for Disease Control and Prevention (CDC) WONDER online database, as well as the 2023 KFF Survey on Racism, Discrimination, and Health. This report also incorporates analysis from Key Data on Health and Health Care by Race and Ethnicity, which examines 64 measures of health, health care, and social and economic factors that drive health outcomes, across six racial and ethnic groups, including AIAN people. The racial and ethnic group definitions for each table may vary depending on the source of the data. Some data are limited to specific age groups as specified in the notes. Key takeaways include:
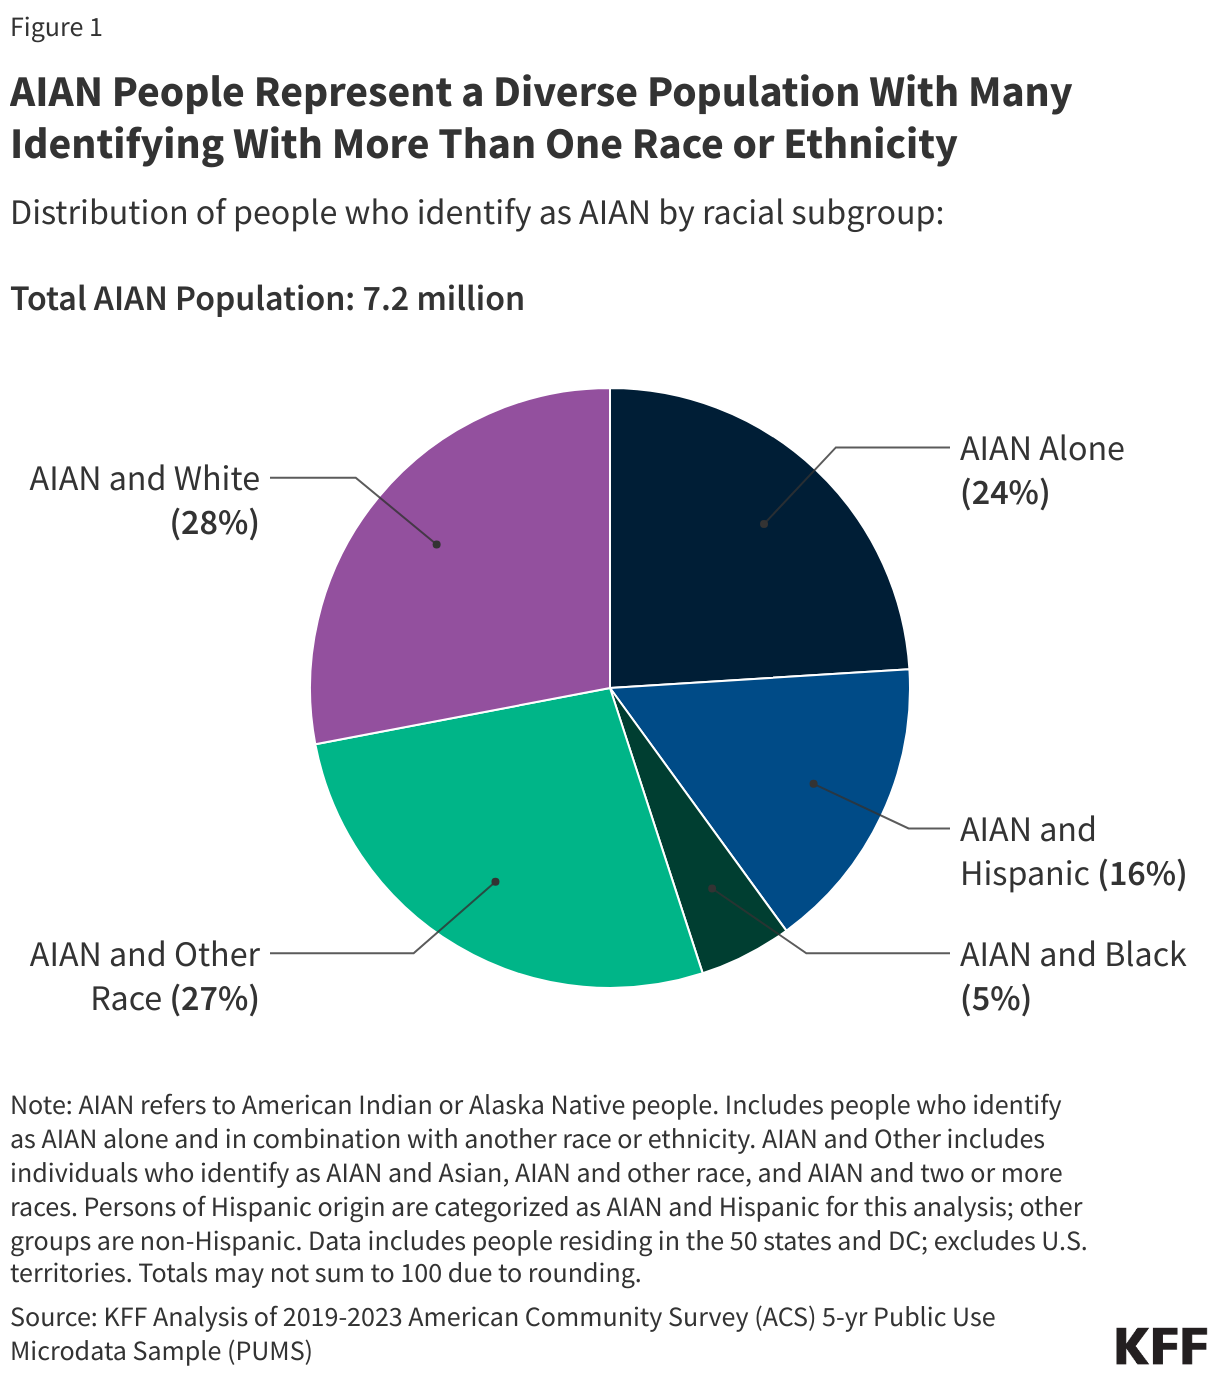
AIAN people represent a diverse population, with many identifying with more than one race or ethnicity. As of 2023, approximately 7.2 million people in the U.S. identify as AIAN alone or in combination with another racial or ethnic group. The majority of AIAN individuals identify as AIAN and at least one other race, while about a quarter (1.7 million) identify as AIAN alone. This analysis identifies people based on self-identified race and ethnicity in federal survey data. However, AIAN is also a political and legal classification. This status recognizes over 570 AIAN Tribes as sovereign nations, establishing a government-to-government relationship that dictates the federal government’s trust responsibility, including the provision of health care to AIAN people in federally recognized Tribes.
AIAN individuals experience significant health disparities compared to their White counterparts. People identified as AIAN alone have shorter life expectancies (70.1 vs 78.4 years at birth), higher rates of chronic diseases such as diabetes and asthma, and higher rates of suicide deaths and substance use disorder. About a quarter (26%) of AIAN adults report having fair or poor health status compared to 17% of White adults. Additionally, AIAN people face higher risks during pregnancy, including higher rates of preterm births and infant mortality, as well as the highest rates of pregnancy related deaths across racial and ethnic groups.
Among those under age 65, people who identify as AIAN alone are three times more likely to be uninsured (21%) compared to White people (7%). This coverage gap contributes to challenges in accessing health care. About 22% of adults under age 65 who identify as AIAN alone report not having a personal health care provider, and 43% did not have a dental visit within the past year. Medicaid provides a key source of coverage for AIAN people, helping to mitigate their coverage gaps and serving as the largest third-party payer for the IHS. Medicaid covers roughly one in three (35%) people under age 65 who identify as AIAN alone compared with 15% of their White counterparts, and over half (52%) of AIAN children versus 23% of White children.
AIAN communities face racism and discrimination and substantial social and economic challenges that impact their health outcomes and reflect historical mistreatment and policies. Across measures of discrimination in daily life and health care settings, AIAN adults report the highest frequency of experiencing certain types of discrimination compared to other racial and ethnic groups, while White adults report the lowest frequency. They have a higher poverty rate compared to White people, with about 25% living below the poverty line, and are more likely to experience food insecurity compared to their White counterparts. They also have lower educational attainment levels. Additionally, AIAN people are less likely to own homes and more likely to live in crowded housing conditions compared to White people. These social and economic challenges reflect an array of historical policies implemented by the U.S. government that disadvantaged AIAN communities.
Aggregate data for AIAN people may mask underlying disparities among subgroups since there is a wide variation in experiences and key factors that influence health among AIAN people. Experiences and outcomes vary based on their racial and ethnic composition, where they live, and their Tribal affiliation or Tribal land residency. For example, among AIAN people, uninsured rates and limited English proficiency (LEP) are highest among those who identify as AIAN and Hispanic, creating additional barriers that may impact access to and quality of care. AIAN adults living on Tribal lands are more likely to report having a usual place of care and receiving a flu vaccine (92% and 50%, respectively) compared to AIAN adults living off Tribal lands (82% and 39%, respectively), which may reflect greater proximity to IHS services.
Box 1: Notes on Data and Methods
Components of this analysis are based on data from the 2019-2023 five-year American Community Survey (ACS) and include people who identify as AIAN as defined by the U.S. Census. Except where otherwise specified, we include people who identify as AIAN alone, who are individuals who identify their race solely as AIAN and report non-Hispanic ethnicity.
As noted above, this analysis identifies people as AIAN based on self-identified race and ethnicity. However, AIAN is also a political and legal classification. This status recognizes over 570 AIAN Tribes as sovereign nations, establishing a government-to-government relationship that dictates the federal government’s trust responsibility, including the provision of health care to AIAN people in federally recognized Tribes.
Among AIAN people, data are reported by racial and ethnic subgroup, self-attested Tribal status, Tribal land residency, geographic region, and IHS region, where available, and when differences are statistically significant.
The AIAN racial and ethnic subgroups include AIAN alone, AIAN and White, AIAN and Black, AIAN and Hispanic, AIAN and Asian, and AIAN and two or more other races.
Tribal affiliation is based on whether respondents write the name of an “enrolled or principal tribe” in set aside boxes in the ACS and is only reported among individuals who identify as AIAN alone due to data limitations. In this brief, individuals who report a specific Tribe are defined as Tribally affiliated, and individuals who do not are classified as not Tribally affiliated. People who do not report a Tribe on the ACS may still be Tribally affiliated and not represented in the data.
Tribal land residential status is defined based on whether respondents’ addresses fell within AIAN legal and statistical entities for which the U.S. Census Bureau publishes data. All estimates for Tribal residential status are sourced from a 2023 National Health Statistics Report.
Geographic region is defined using the 4 regions outlined by the U.S. Census Bureau, including the Northeast, Midwest, South, and West.
IHS region is defined using state level groupings commonly used by some federal agencies and in published research. This definition divides the states into six regions: East, Northern Plains, Southern Plains, Southwest, Pacific Coast, and Alaska. While the IHS divides its services into 12 regions, the six-region definition was selected to align with the available geographies in the ACS data file.
Overview of AIAN People in the U.S.
Most AIAN people identify with more than one race and ethnicity. The number of AIAN people who identify with more than one racial or ethnic group has grown over time, likely reflecting some demographic shifts as well as changes in the design of questions used to identify race and ethnicity. As of 2023, there are roughly 7.2 million people in the U.S. who identify as AIAN alone or in combination with another racial or ethnic group. The majority of AIAN people identify as AIAN and at least one other race, while about a quarter of AIAN people identify as AIAN alone (24% or 1.7 million) (Figure 1).
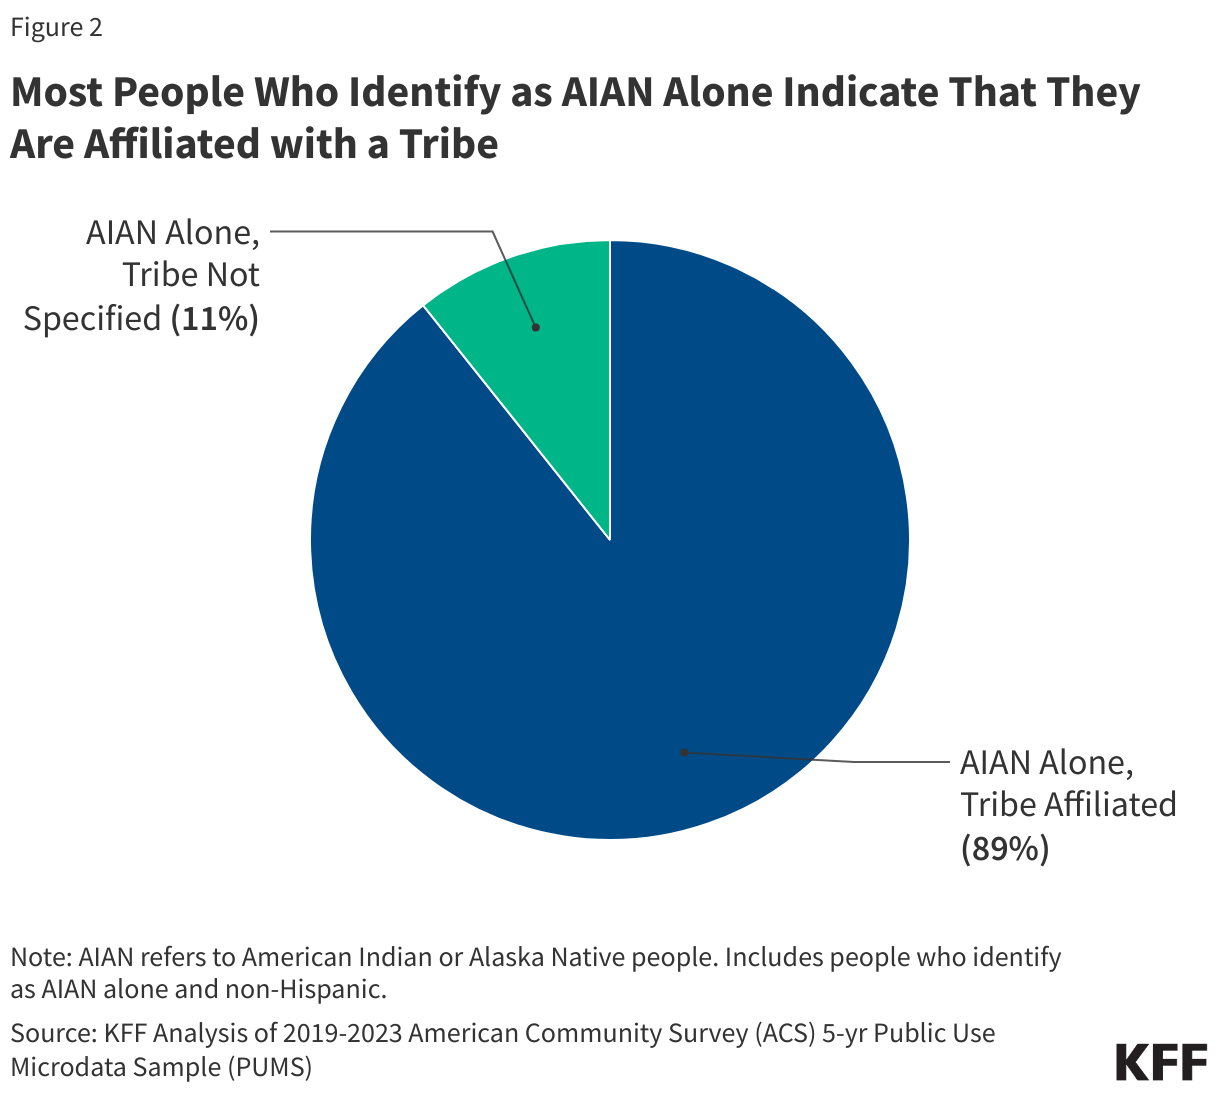
Overall, about nine in ten (89%) people who identify as AIAN alone indicate they are affiliated with a Tribe, while 11% do not identify a Tribal affiliation (Figure 2). There are over 570 federally recognized Tribes. Tribal enrollment has important implications for access to benefits, since members and descendants of members of federally recognized Tribes have broader access to certain federal programs, including the IHS (Box 2).
Box 2: Overview of the Indian Health Service
The IHS provides health care and disease prevention services to AIAN people through a network of hospitals, clinics, and health stations. In addition to medical care, the IHS provides a wide range of other services, including sanitation and public health functions. In exchange for lands and resources, the federal government provides health services through facilities that are managed directly by the IHS, by Tribes or Tribal organizations under contract or compact with the IHS, and Urban Indian Health programs (UIHP). If facilities are unable to provide needed care, the IHS and Tribes may contract for health services from private providers through the IHS Purchased/Referred Care (PRC) program. However, due to limited funding, services through PRC are often rationed based on medical need, such as emergency care for life-threatening illnesses and injuries. Recent updates to the PRC medical priorities aim to expand coverage for more preventive care services, although some recipients continue to face challenges accessing care. Urban Indian Organizations do not participate in the PRC program and do not receive PRC funding for health services beyond the scope of what they can provide.
Direct services provided through IHS and Tribally operated facilities are generally limited to members or descendants of members of federally recognized Tribes who live on or near federal reservations. Qualified AIAN people receiving services through IHS providers are not charged or billed for the cost of their services. UIHPs serve a wider group of AIAN people, including those who are not able to access IHS or Tribally operated facilities because they do not meet eligibility criteria or because they reside outside their service areas. However, funding to UIHPs is limited to 1% of the IHS budget despite the overall demographic shift of AIAN people away from reservations. To address the needs of AIAN people who live in metropolitan areas, there have been recent recommendations to fully fund UIHP services.
The IHS is a discretionary program with limited funding that relies on Congressional appropriations each fiscal year. This funding process contributes to uncertainty, operations challenges, and, in some cases, disruptions in care if Congress is delayed in passing appropriations. Although the IHS discretionary budget has increased over time, funds are not equally distributed across IHS facilities and remain insufficient to meet health care needs. As such, access to IHS services varies significantly across locations, and AIAN people who rely solely on the IHS often lack access to needed care.
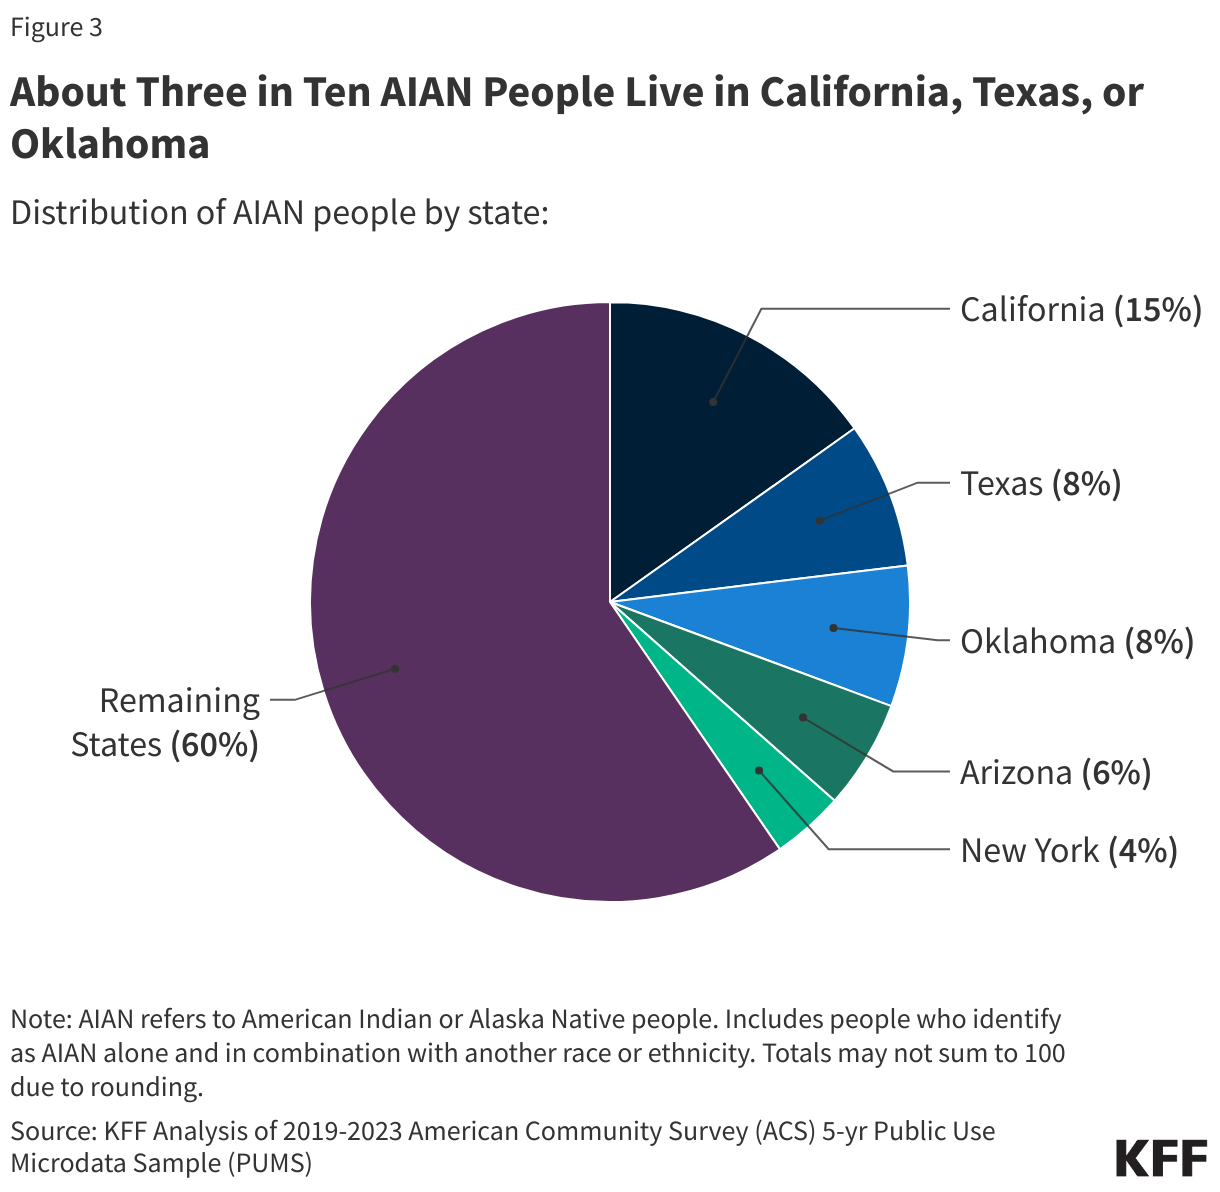
Among people who identify as AIAN alone or in combination, about three in ten (31%) reside in California, Texas, or Oklahoma (Figure 3). The AIAN population is largely concentrated in the Western U.S., at least in part due to forced displacement and relocation (Box 3). The majority of AIAN people (87%) live in metropolitan areas, some live in rural areas, and only 13% reside on reservations or land trusts.
Box 3: Historical Mistreatment of AIAN People in the U.S.
The U.S. government has a long history of systemic abuse against AIAN people, including forced historical displacement, broken political treaties, and cultural erasure. Policies like the Indian Removal Act, the establishment of the Federal Indian Boarding Schools, and the Indian Relocation Act of 1956 were aimed to assimilate AIAN people to majority culture and strip them of their Tribes, lands, languages, and their traditions. Further, a history of forced sterilization and policies that separated infants from their families has also eroded trust in health care providers and government institutions.
Health disparities persist due to a lack of data and underfunded health care systems that are rooted in historical neglect and inequities. The legacy of colonization, historical dispossession, and intergenerational trauma continues to impact AIAN communities, worsening health, economic, environmental, and social challenges that reflect ongoing structural inequities and systemic discrimination. Further, differing cultural beliefs and values about health and limited cultural understanding among non-Native providers present additional barriers to accessing health care.
Health Coverage, Access, and Use
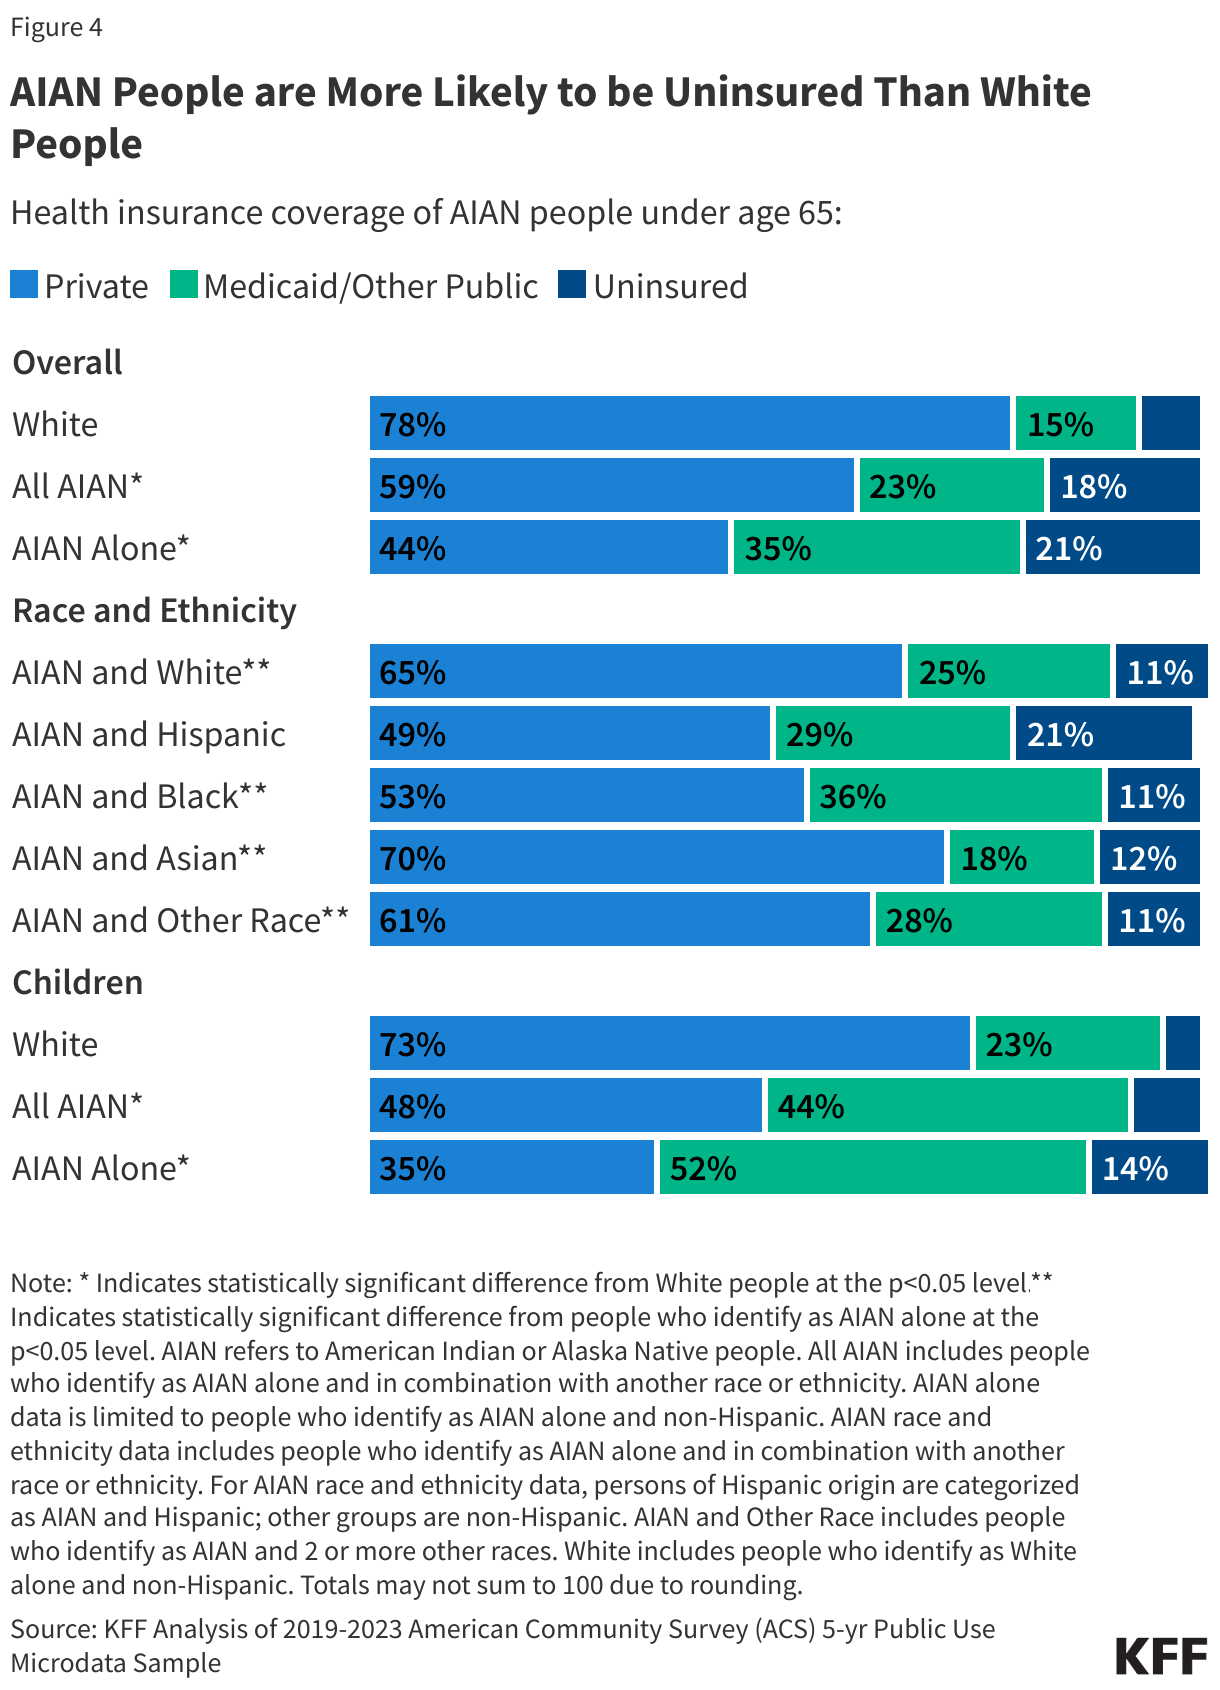
Among people under age 65, people who identify as AIAN alone are three times more likely to be uninsured compared to White people (21% vs. 7%) (Figure 4). Among those who identify as AIAN alone, uninsured rates are higher for those who indicate that they are affiliated with a Tribe (23%) compared to those who do not indicate a Tribal affiliation (17%). This may, in part, reflect greater reliance on the IHS for health care among those affiliated with a Tribe. However, the IHS is not insurance, and people relying solely on the IHS may face gaps in care. Among people who identify as AIAN alone or in combination with another racial or ethnic group, uninsured rates are higher among those who identify as AIAN alone (21%) and AIAN and Hispanic (21%), than among those who identify as AIAN and White (11%) (Figure 5). Higher uninsured rates among AIAN people contribute to barriers to accessing and utilizing health care.
Medicaid is a major source of coverage for AIAN people, particularly AIAN children, it is one of the primary ways the federal government honors its federal trust responsibility. Among those under age 65, Medicaid covers over one in three (35%) of those who identify as AIAN alone and nearly one in four (23%) people who identify as AIAN alone or in combination with another race or ethnicity (Figure 5). Medicaid, in combination with the Children’s Health Insurance Program (CHIP), covers over half (51%) of children who identify as AIAN alone. Medicaid is also the largest third-party payer for the IHS, accounting for $1.3 billion out of the total almost $1.8 billion in third-party collections in fiscal year 2025. In contrast to IHS funds, Medicaid funds are not subject to annual appropriation limits and, since Medicaid claims are processed throughout the year, facilities receive Medicaid funding on an ongoing basis for covered services. As such, Medicaid revenues help facilities cover operational costs, including provider payments and infrastructure developments. Notably, during federal government shutdowns, some parts of the IHS that do not receive advance appropriations rely on third-party reimbursement, including Medicaid, to fund services.
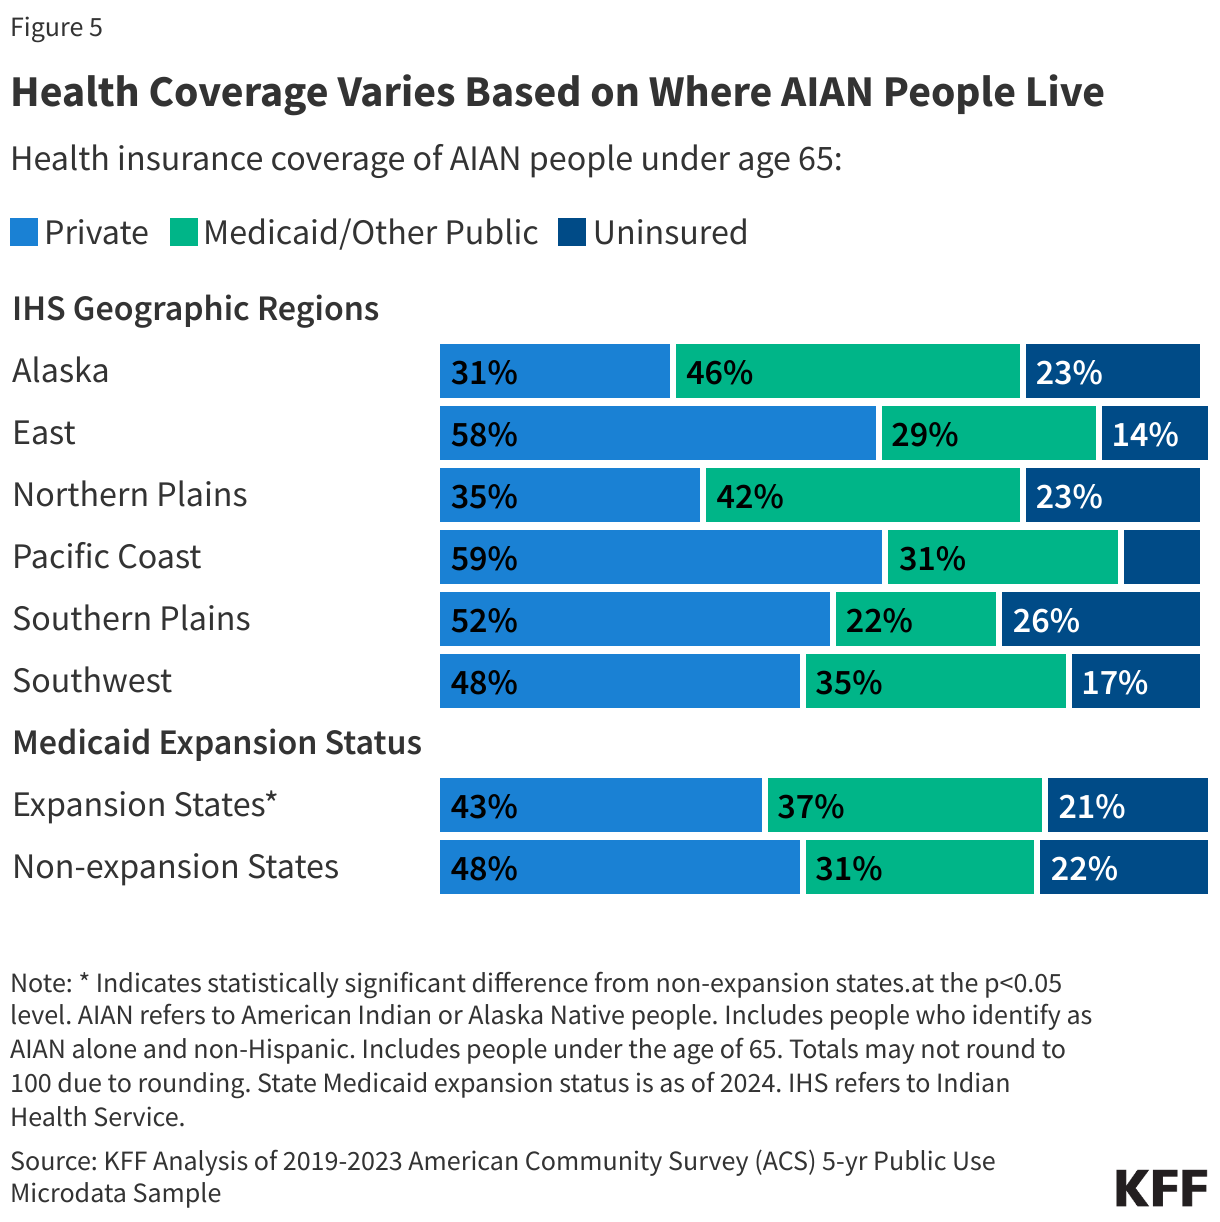
Uninsured rates among AIAN people vary by where they live. About one in four people under age 65 who identify as AIAN alone and live in the IHS regions of the Southern Plains (26%), Alaska (23%), and the Northern Plains (23%) are uninsured, which is higher compared to other IHS regions (Figure 5). The higher uninsured rate in the Southern Plains region reflects a relatively low rate of Medicaid coverage compared to the national rate (22% vs. 35%), which is largely driven by the fact that two (Texas and Kansas) out of three states in the region have not implemented the Affordable Care Act (ACA) Medicaid expansion to low-income adults. In contrast, the higher uninsured rate in Alaska and the Northern Plains largely reflects a lower rate of private coverage compared to the national rate (31% and 35% vs. 44%). Among people under age 65 who identify as AIAN alone, Medicaid coverage rates are lower in states that have not adopted the ACA Medicaid expansion to low-income adults compared to expansion states (31% vs. 37%). Research finds that while health coverage improved among AIAN people post-ACA, there are stark differences in coverage regionally. In the period following the ACA, AIAN people in the Southwest, West Coast, and Alaska regions experienced the greatest increases in Medicaid and other public health coverage.
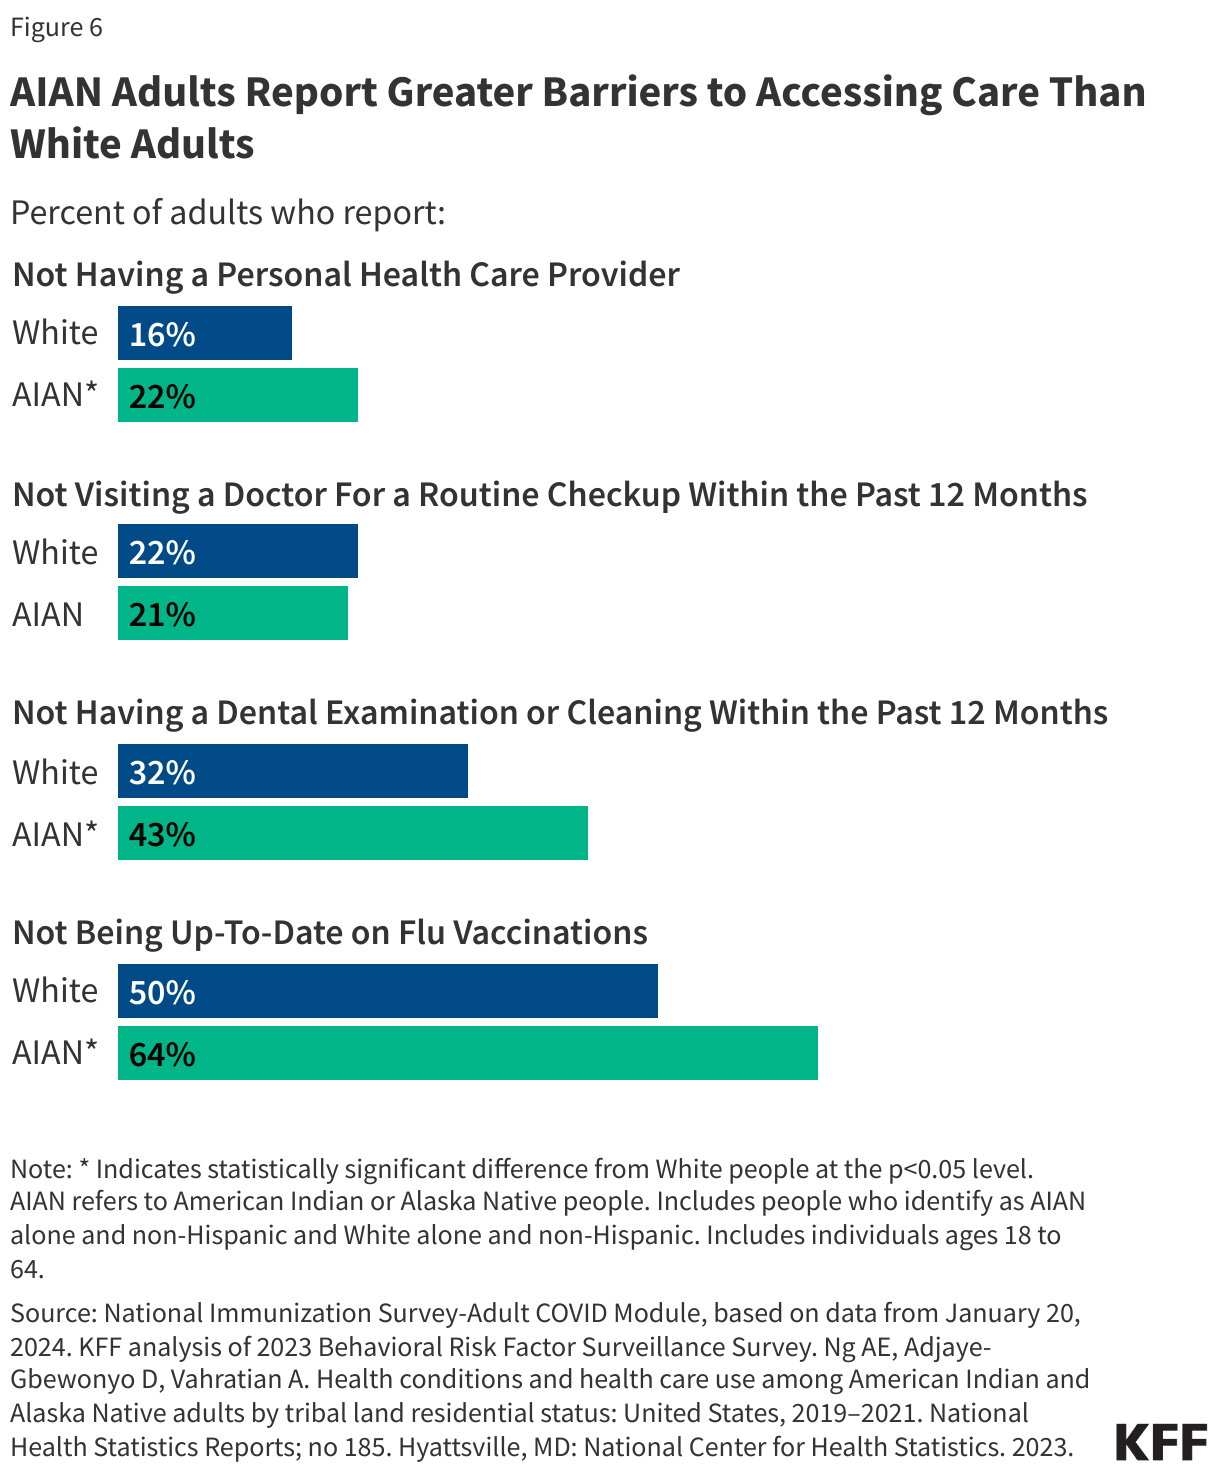
AIAN adults are more likely to report not having a personal provider, not receiving dental care, and not being up to date on their flu vaccine compared to White adults, suggesting barriers to accessing care. About one in five (22%) adults who identify as AIAN alone under the age of 65 report not having a personal provider compared to 16% of White adults (Figure 6). AIAN adults are also more likely to have gone without a dental visit within the past year than White adults (43% vs. 32%) and to not be up to date on their flu vaccine (64% vs. 50%). However, they are not more likely than White adults to report going without a routine check-up in the past 12 months.
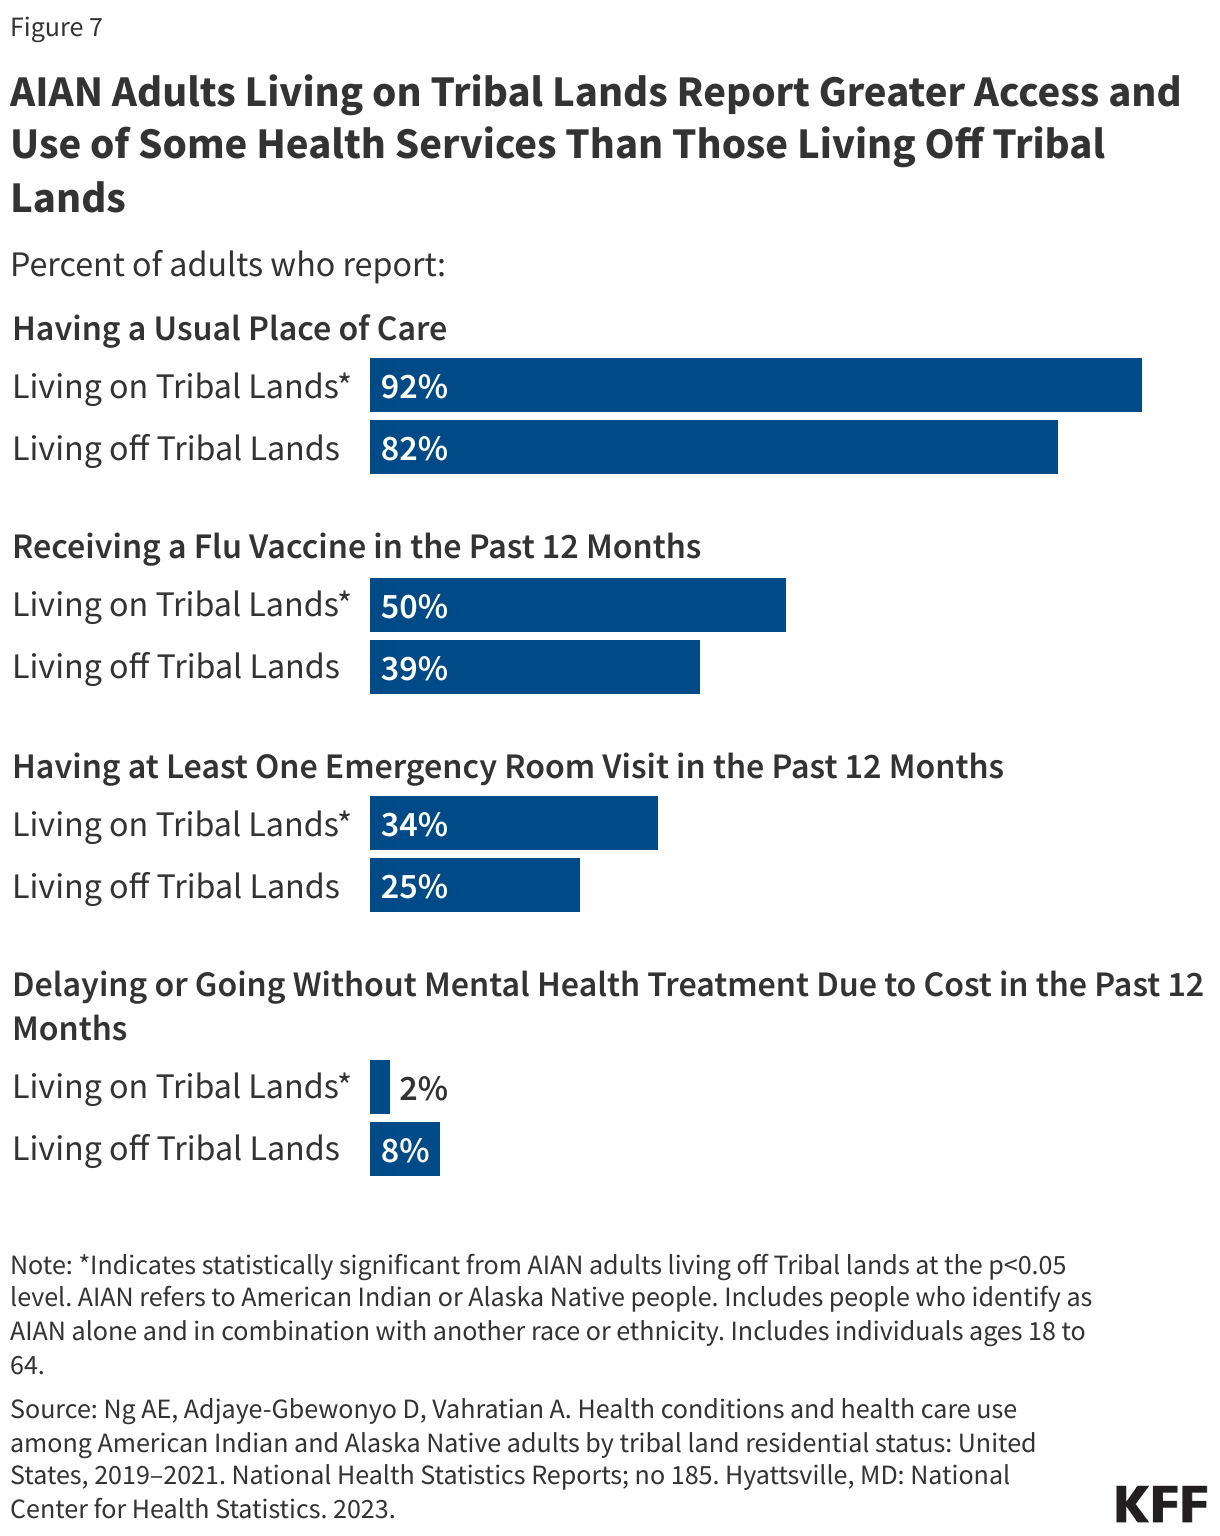
Among those who identify as AIAN alone or in combination, those living off Tribal lands generally report more limited health care access and use compared to those living on Tribal lands. AIAN adults who live on Tribal lands are more likely to report having a usual source of care compared to those who live off Tribal lands (92% vs. 82%). About half (50%) of AIAN adults living on Tribal lands report receiving a flu vaccine in the past 12 months compared to about four in ten (39%) AIAN people who live off Tribal lands. About one-third (34%) of AIAN people who live on Tribal lands report having at least one emergency room visit in the past 12 months compared to about a quarter (25%) of AIAN adults who live off Tribal lands. Among AIAN people who live on Tribal lands, 2% report delaying or not receiving mental health treatment due to cost, while 8% of those who live off Tribal lands report the same (Figure 7). The increased access and use of care among those living on Tribal lands may reflect increased access and proximity to IHS or Tribal Health facilities.
Health Outcomes
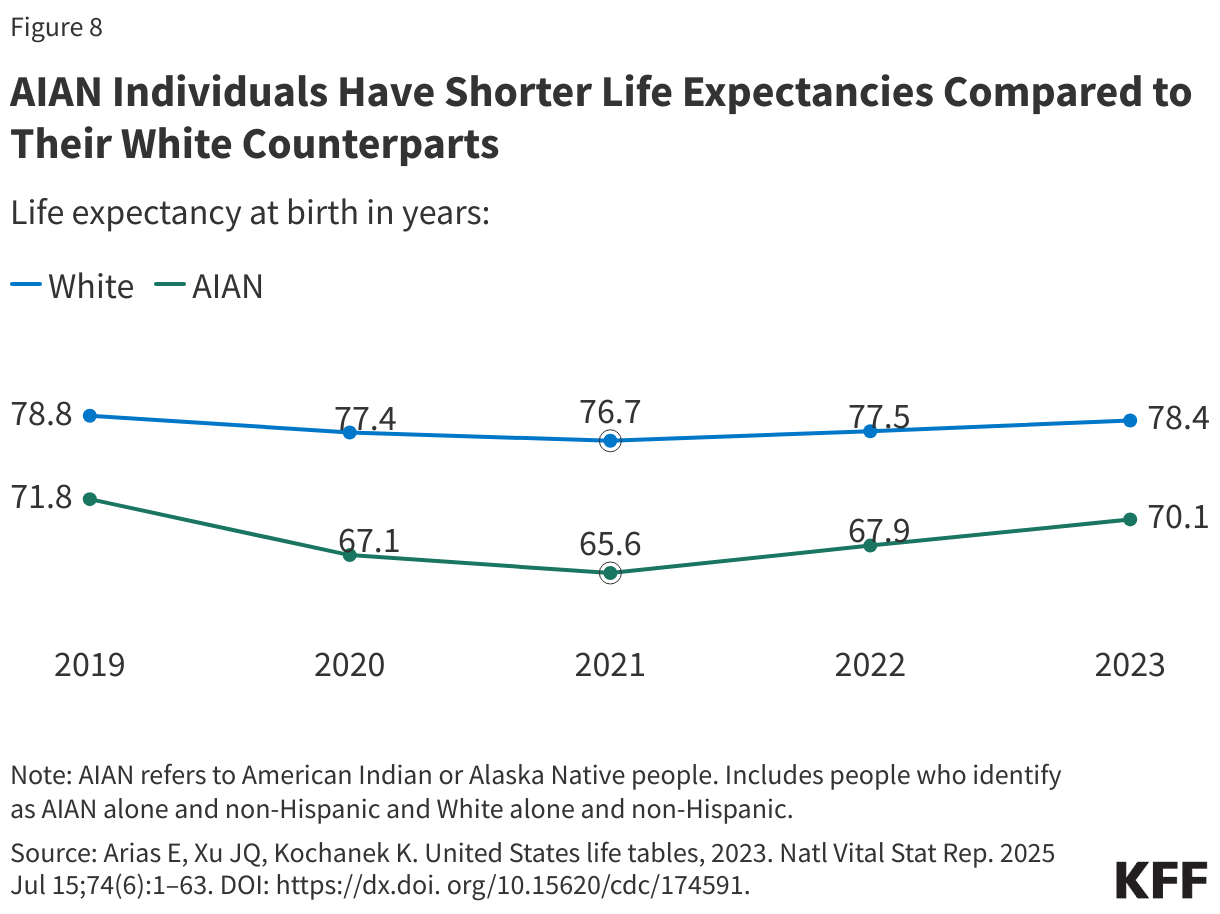
AIAN people have a shorter life expectancy at birth compared to White people (Figure 8). Since 2019, life expectancy has fallen for AIAN people, reflecting the impacts of the COVID-19 pandemic. The existing gap in life expectancy widened between people who identify as AIAN alone and White people from 7 years in 2019 (71.8 vs. 78.8 years) to 8.3 years in 2023 (70.1 years vs 78.4 years).
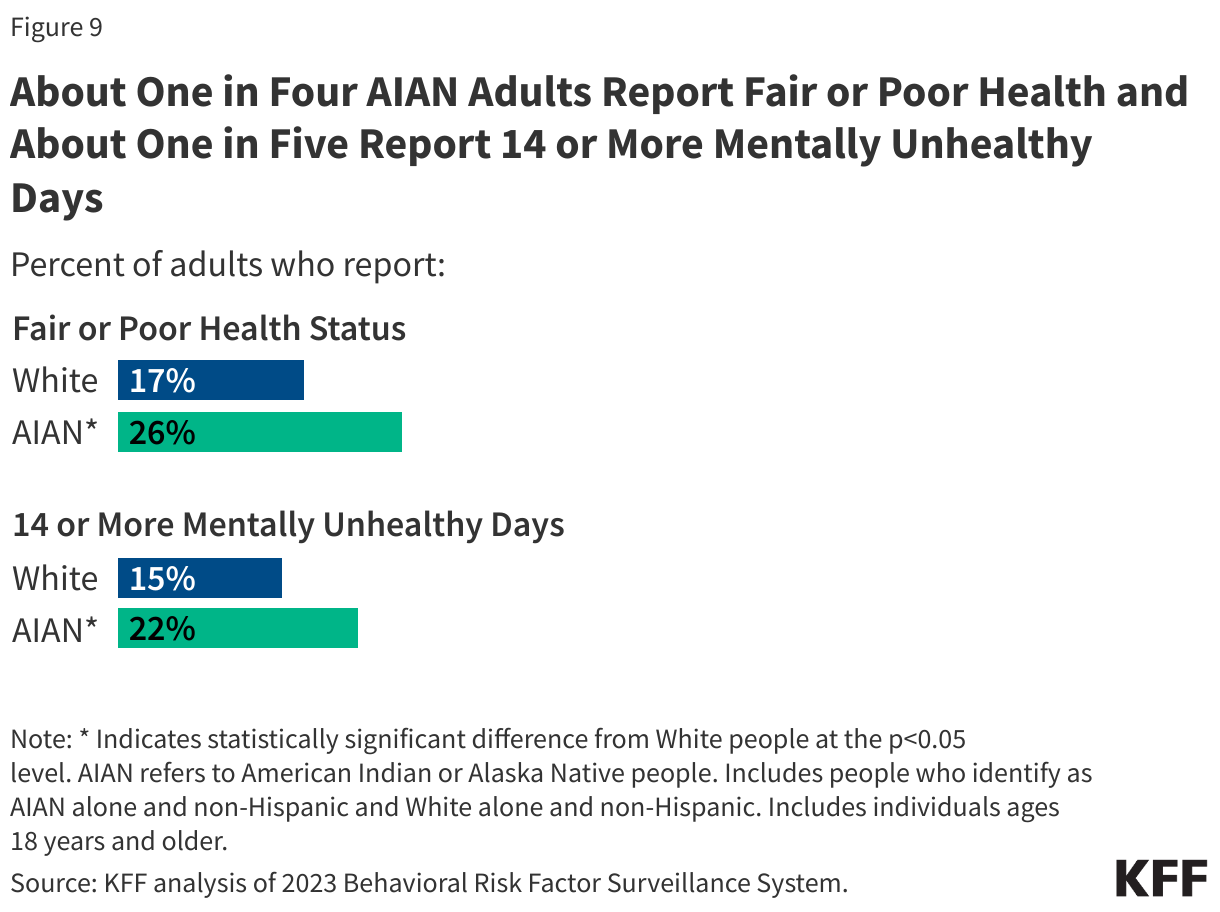
Adults who identify as AIAN alone report poorer health status compared to White adults. About a quarter (26%) of AIAN adults report having fair or poor health status compared to 17% of White people, and roughly one in five (22%) AIAN adults report having 14 or more mentally unhealthy days compared to 15% for White people (Figure 9).
Pregnancy-Related Outcomes and Infant Mortality
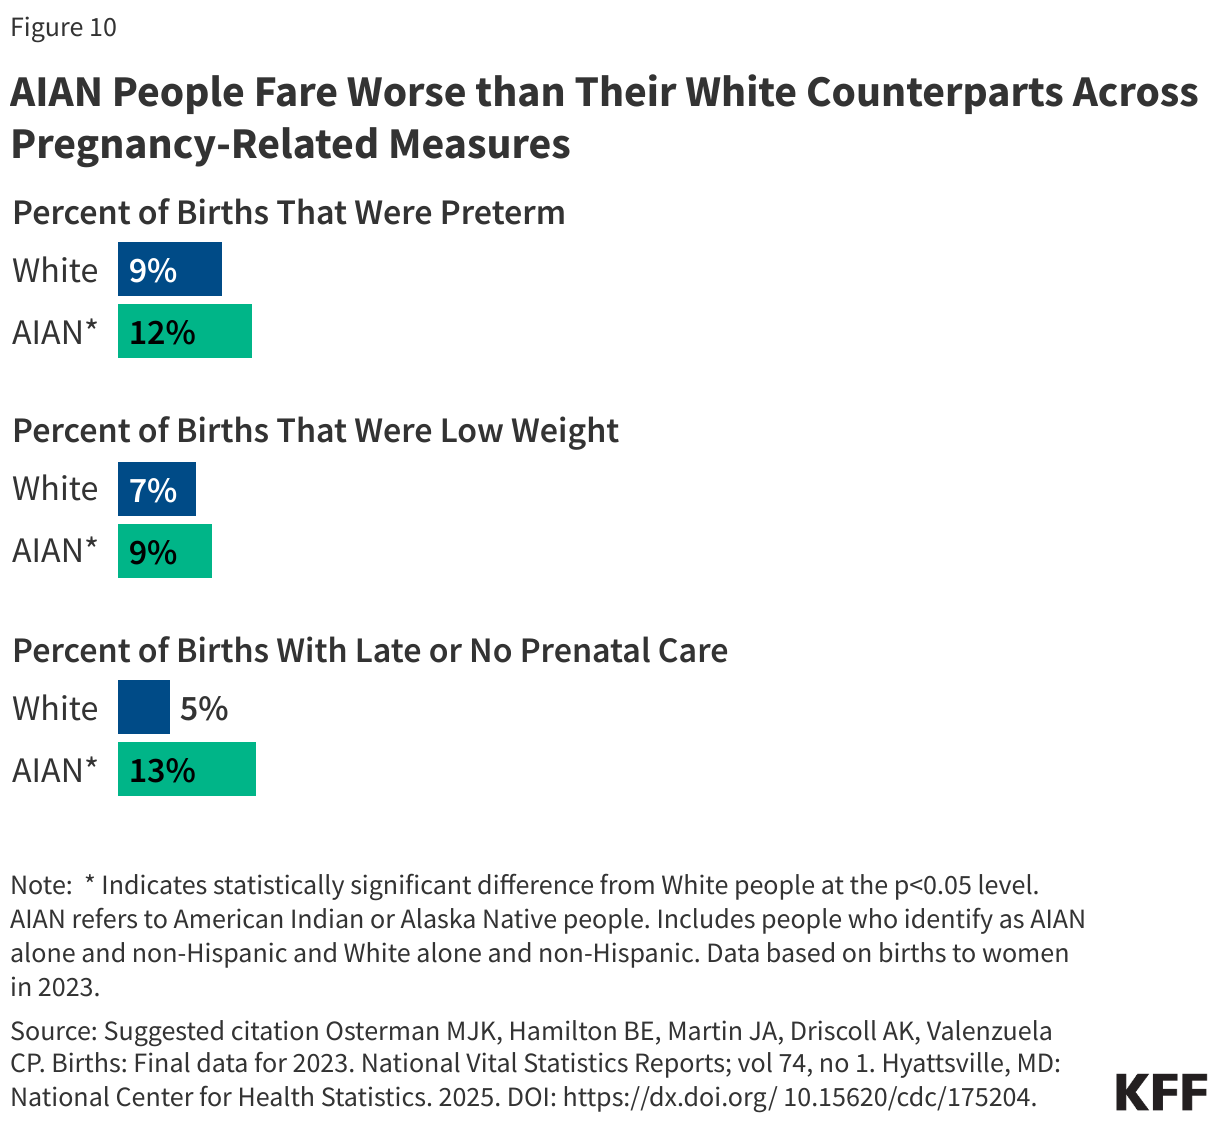
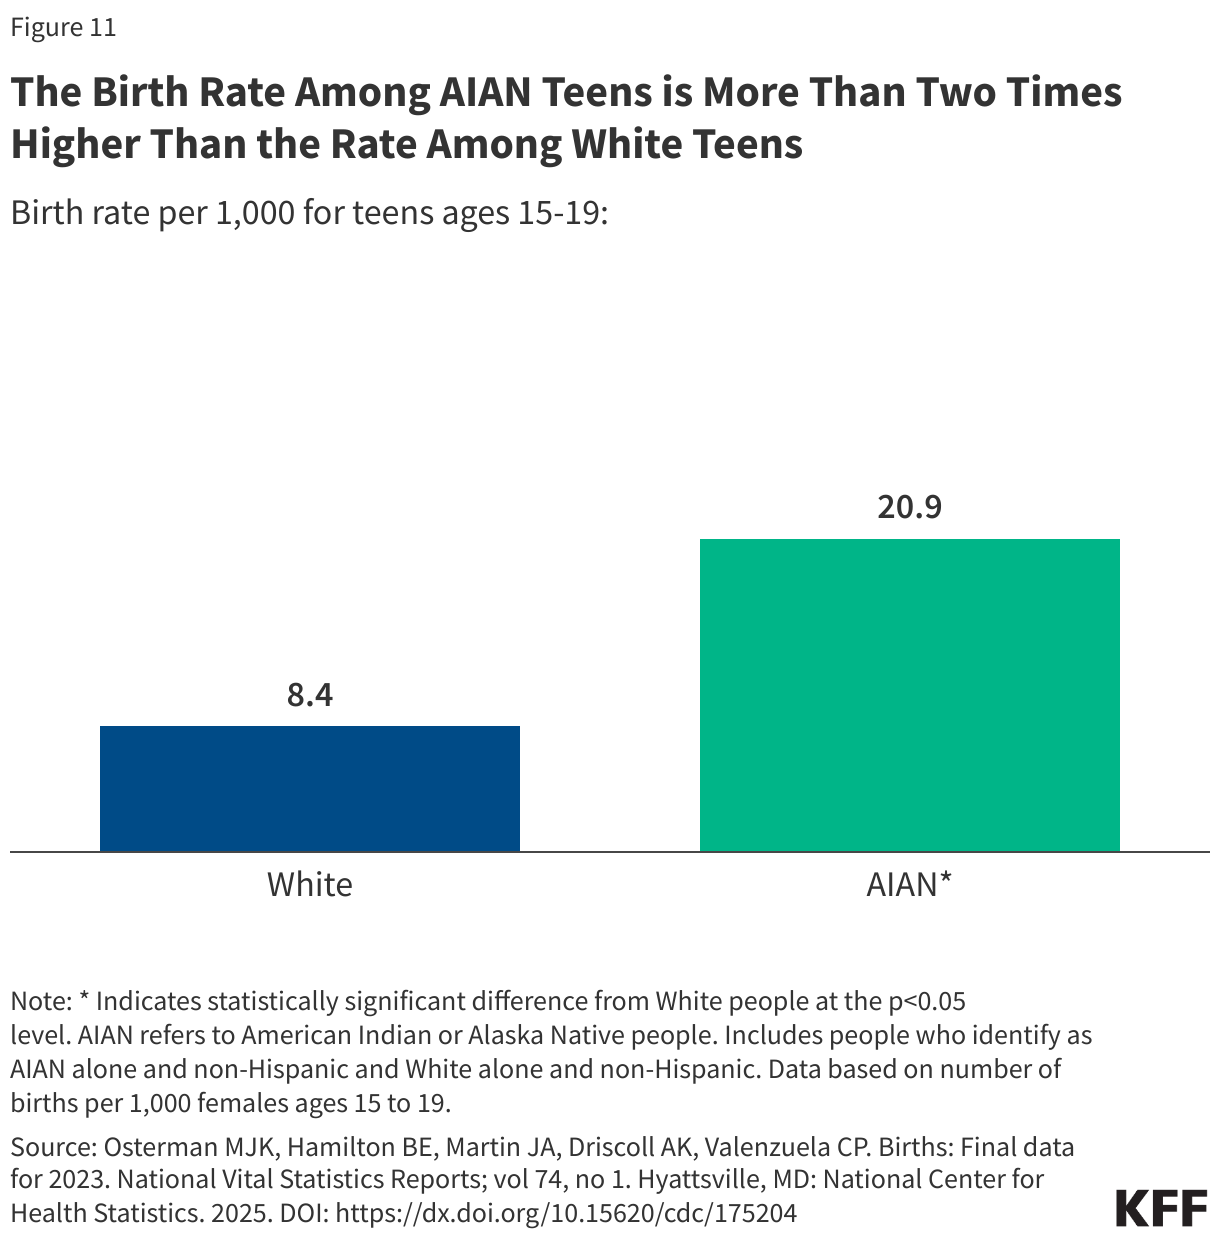
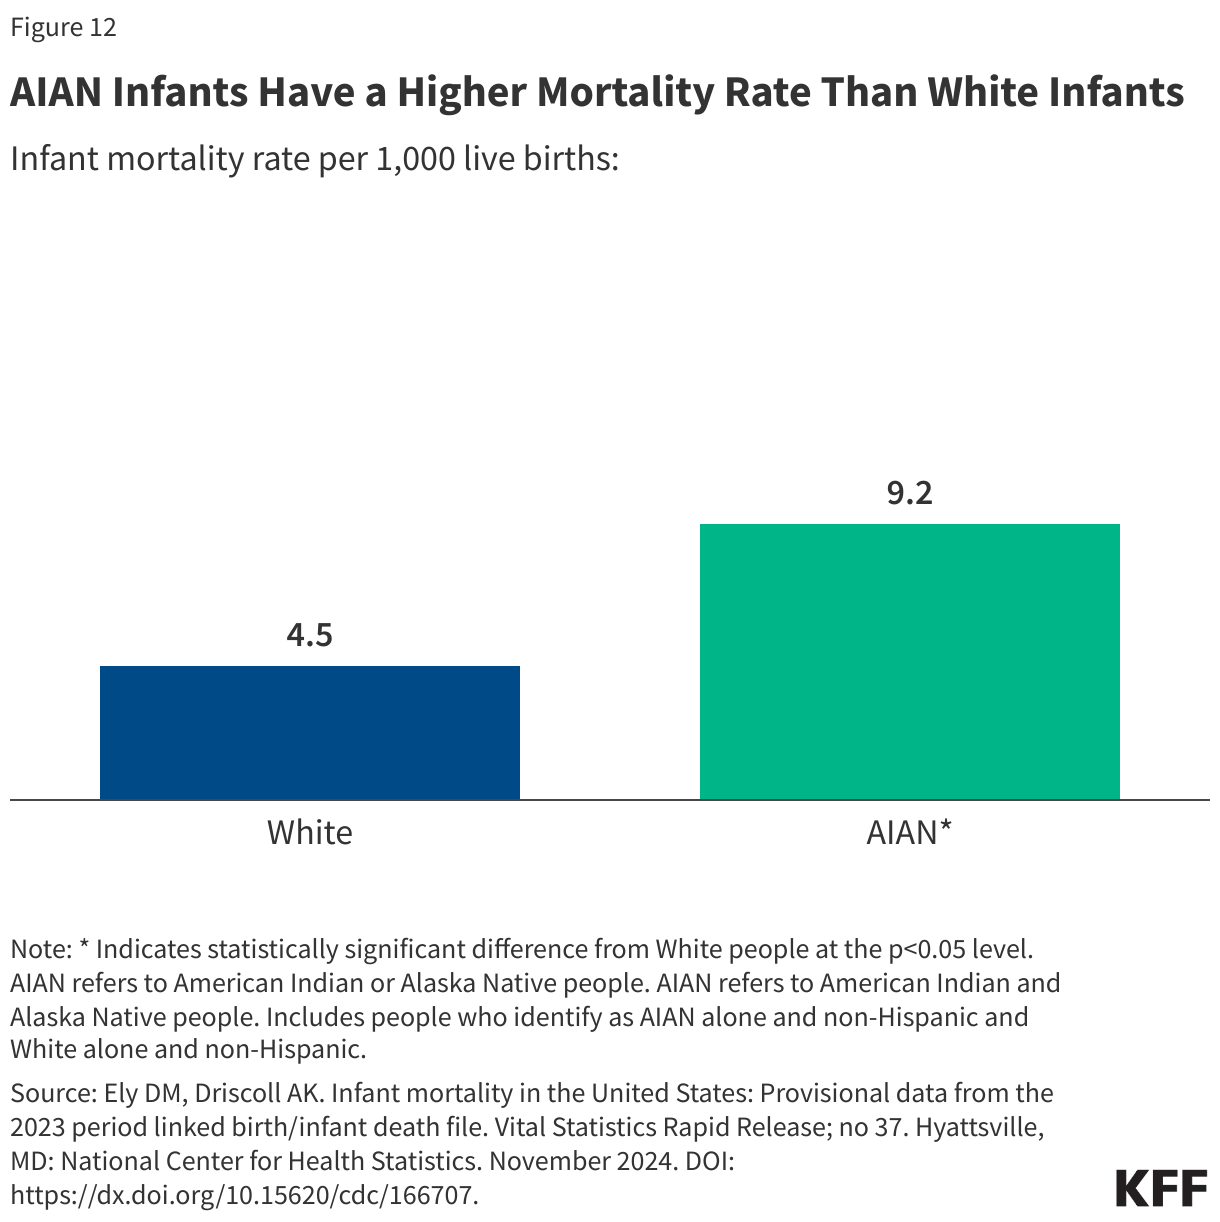
AIAN people fare worse than their White counterparts across multiple measures of birth risks and outcomes. People who identify as AIAN alone have higher shares of preterm births compared to their White counterparts (12% vs. 9%), low birthweight births (9% vs. 7%), and births for which they received late or no prenatal care (13% vs. 5%) (Figure 10). The birth rate among teens who identify as AIAN alone is more than two times higher than the rate for White teens (Figure 11). AIAN infants have a mortality risk that is twice as high as that of White infants (9.2 vs. 4.5 per 1,000 live births) (Figure 12).
Chronic Diseases
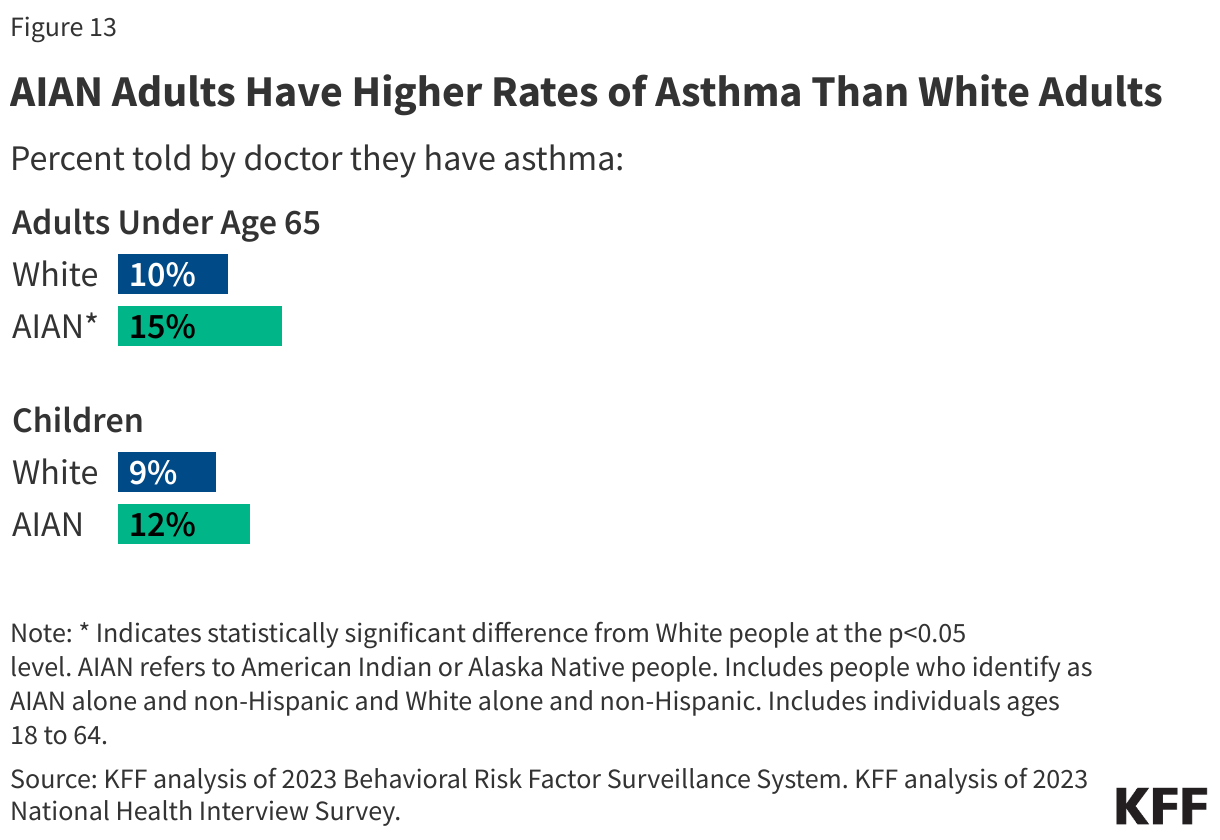
AIAN people have higher rates of certain conditions than their White counterparts. Adults who identify as AIAN alone are more likely to have asthma than White adults (15% vs. 10%) (Figure 13). AIAN adults also have higher rates of obesity than White adults. Among children, the prevalence of asthma was not significantly different between AIAN and White children, with 12% of AIAN children and 9% of White children reporting having asthma.
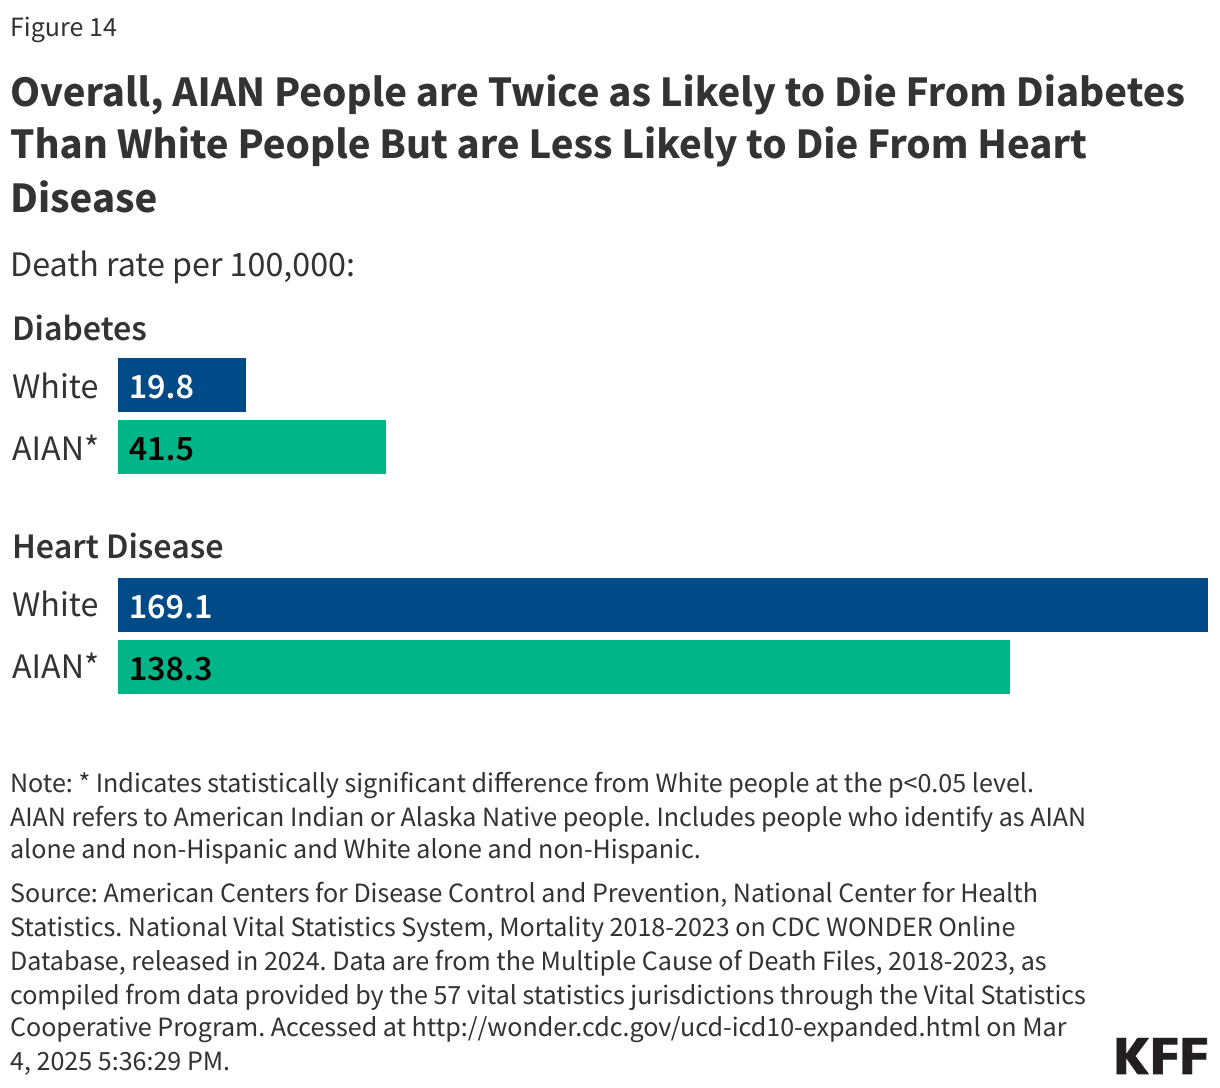
AIAN people have the highest rate of diabetes across racial and ethnic groups, with 18% of adults who identify as AIAN alone reporting being told by a doctor they have diabetes compared to 11% of White adults. Researchers suggest that higher diabetes prevalence among AIAN people may be linked to historical forced relocation, changes to traditional lifestyles, and reliance on government food assistance programs. AIAN people are about two times more likely to die from diabetes compared to White people (41.5 vs. 19.8 per 100,000) (Figure 14). In contrast, AIAN adults have similar rates of heart disease to White adults (8% vs. 7%) and lower heart disease mortality rates than White people (138.3 vs. 169.1 per 100,000). However, it is important to note that race misclassification on death certificates is particularly common for AIAN people and likely leads to underestimates of AIAN mortality rates, with research showing that at least 30% of individuals who identify as AIAN alone are misclassified on their death certificates.
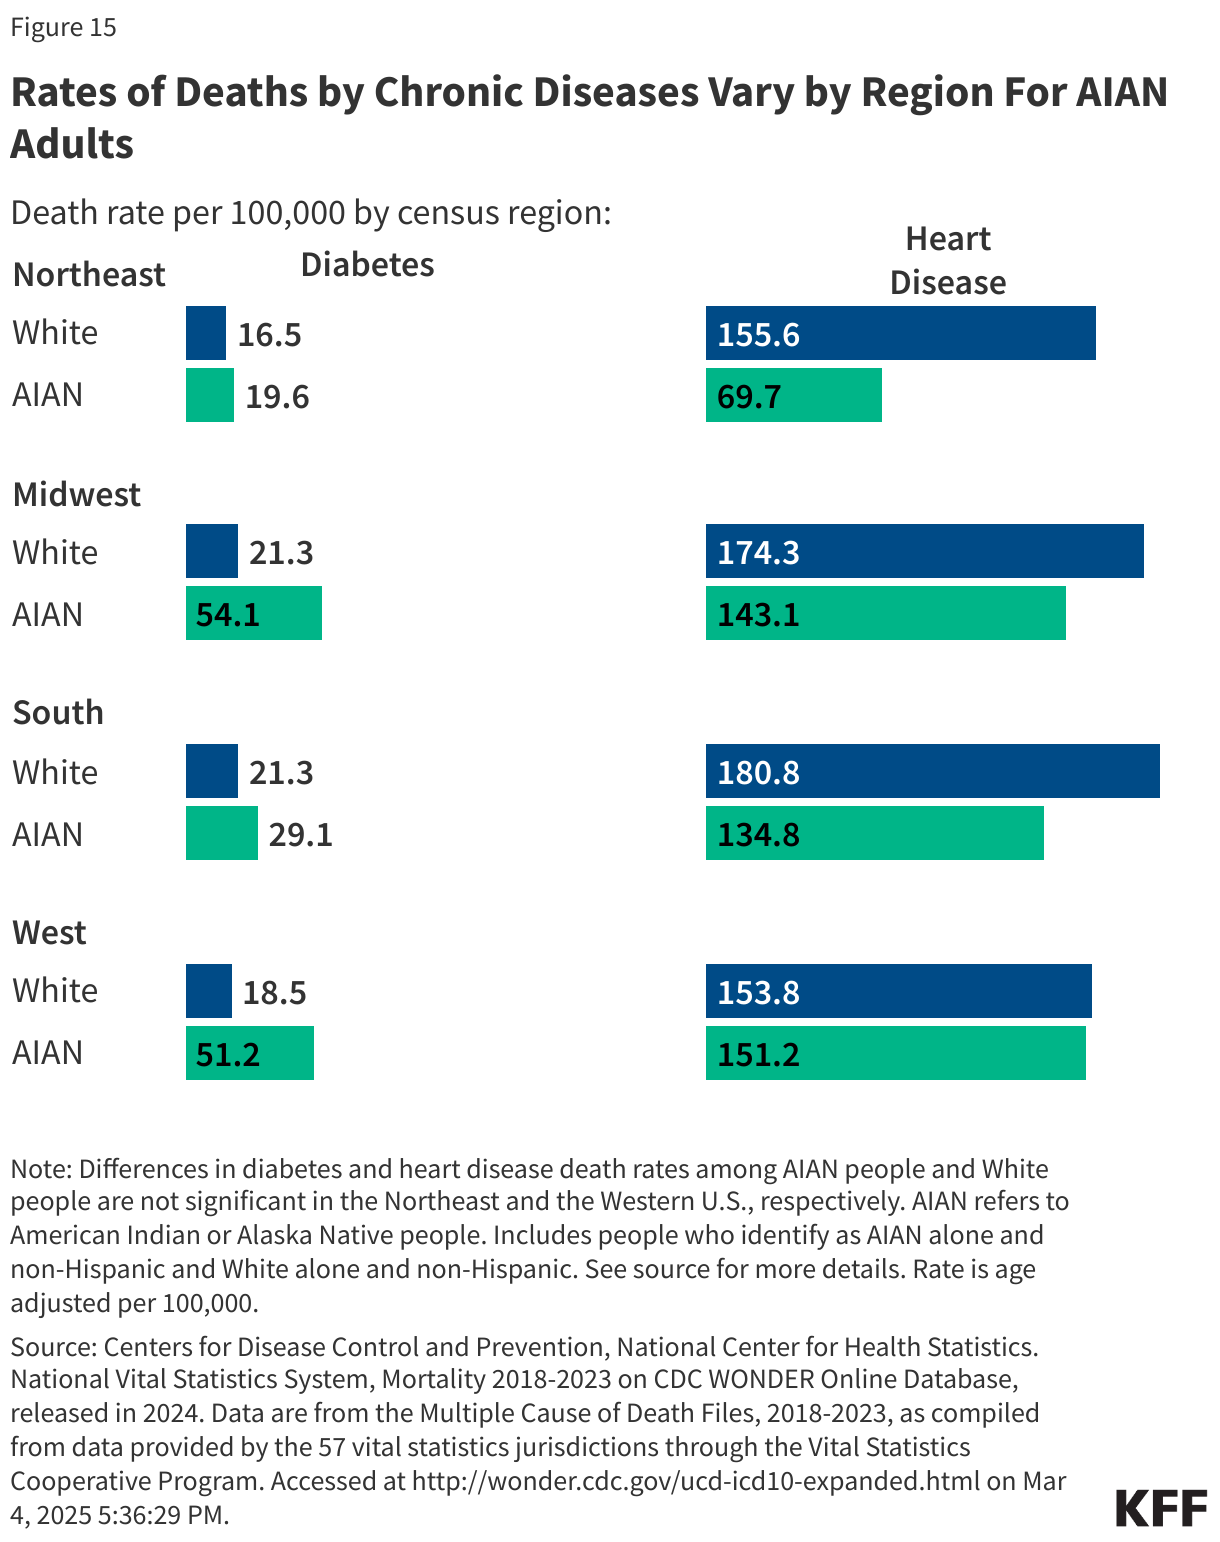
Rates of diabetes and heart disease mortality vary by census region among people who identify as AIAN alone. Geographically, among AIAN people, rates of death due to diabetes range from 19.6 per 100,000 in the Northeast to 54.1 per 100,000 in the Midwest. Heart disease deaths range from 69.7 per 100,000 in the Northeast to 151.2 per 100,000 in the Western U.S. (Figure 15). Regional differences in mortality could in part reflect differences in health coverage and access in each region. However, a range of other factors may contribute to regional differences, including environmental, lifestyle, and socioeconomic factors.
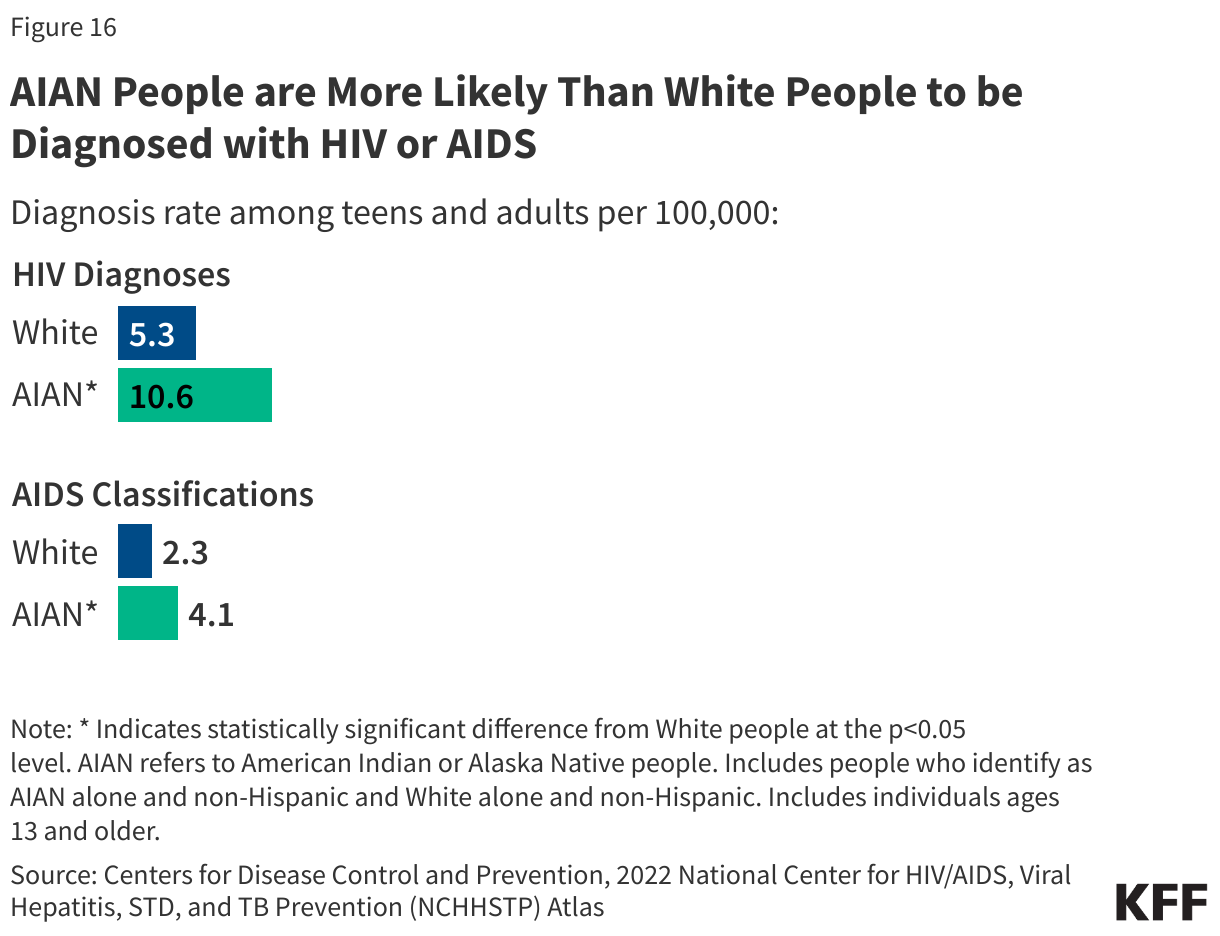
AIAN people are more likely than White people to be diagnosed with HIV or AIDS, the most advanced stage of HIV infection. In 2022, the HIV diagnosis rate for people who identify as AIAN alone was about two times higher than the rate for White people (10.6 vs. 5.3 per 100,000). Similar patterns are observed in AIDS classification rates, the most advanced stage of HIV, reflecting barriers to treatment. People who identify as AIAN alone have higher AIDS classification rates than White people (4.1 vs. 2.3 per 100,000) (Figure 16).
Cancer
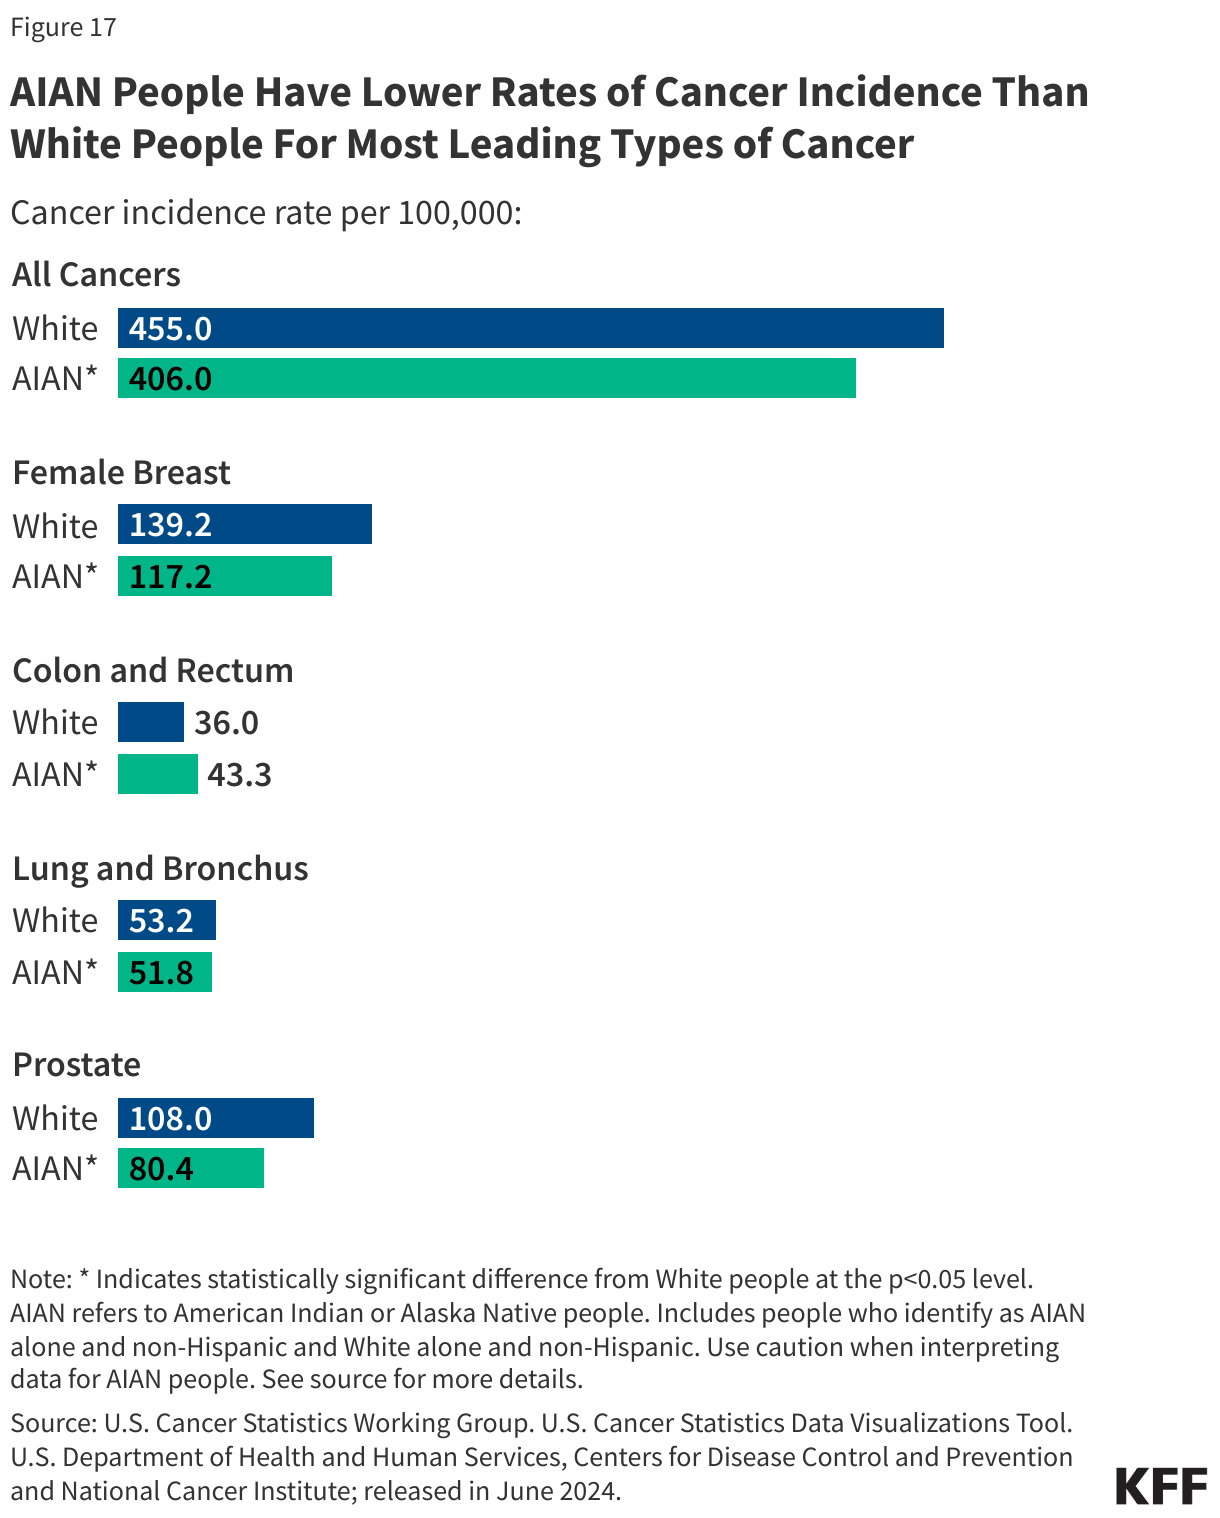
Differences in rates of cancer incidence are mixed between AIAN and White adults. People who identify as AIAN alone have lower rates of cancer incidence than White people overall, and across most leading types of cancer examined. However, AIAN people have higher incidence rates of colon and rectum cancer than White people (43.3 vs. 36.0 per 100,000) (Figure 17). Further, other data show that AIAN people have the highest rates of liver cancer incidence across racial and ethnic groups.
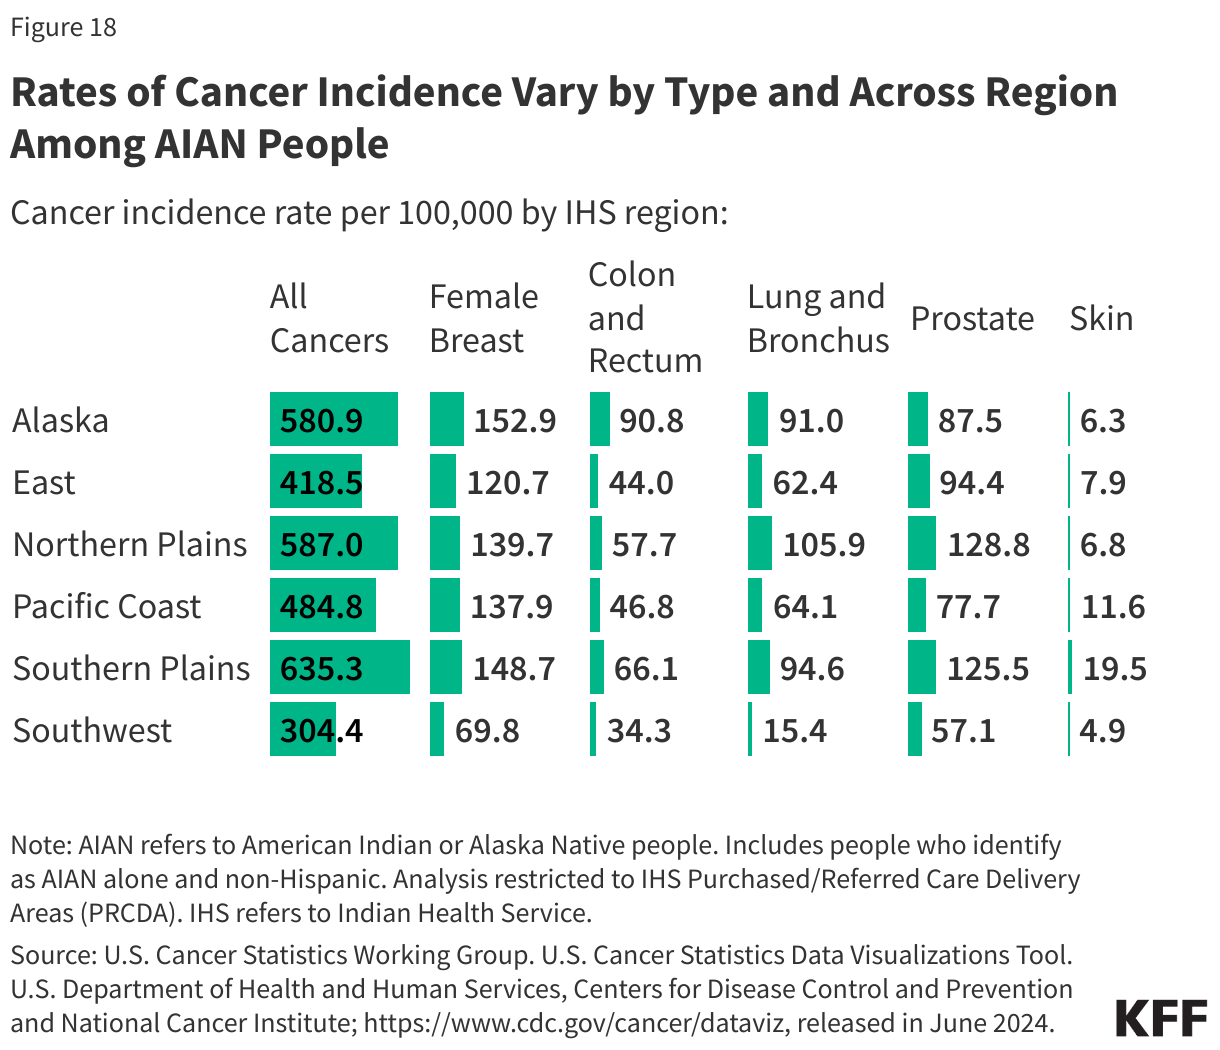
Cancer incidence rates among people who identify as AIAN alone vary across IHS regions. Rates of cancer incidence range from 304.4 per 100,000 in the Southwest to 635.3 per 100,000 in the Southern Plains (Figure 18). Rates of lung and bronchus, and prostate cancer are highest in the Northern Plains (105.9 and 128.8 per 100,000, respectively) and lowest in the Southwest (15.4 and 57.1 per 100,000, respectively). Alaska Native people have the highest colorectal cancer incidence and mortality rates in the world, which may in part be due to lower receipt of screening. This regional variation may reflect a variety of environmental, lifestyle, and socioeconomic factors.
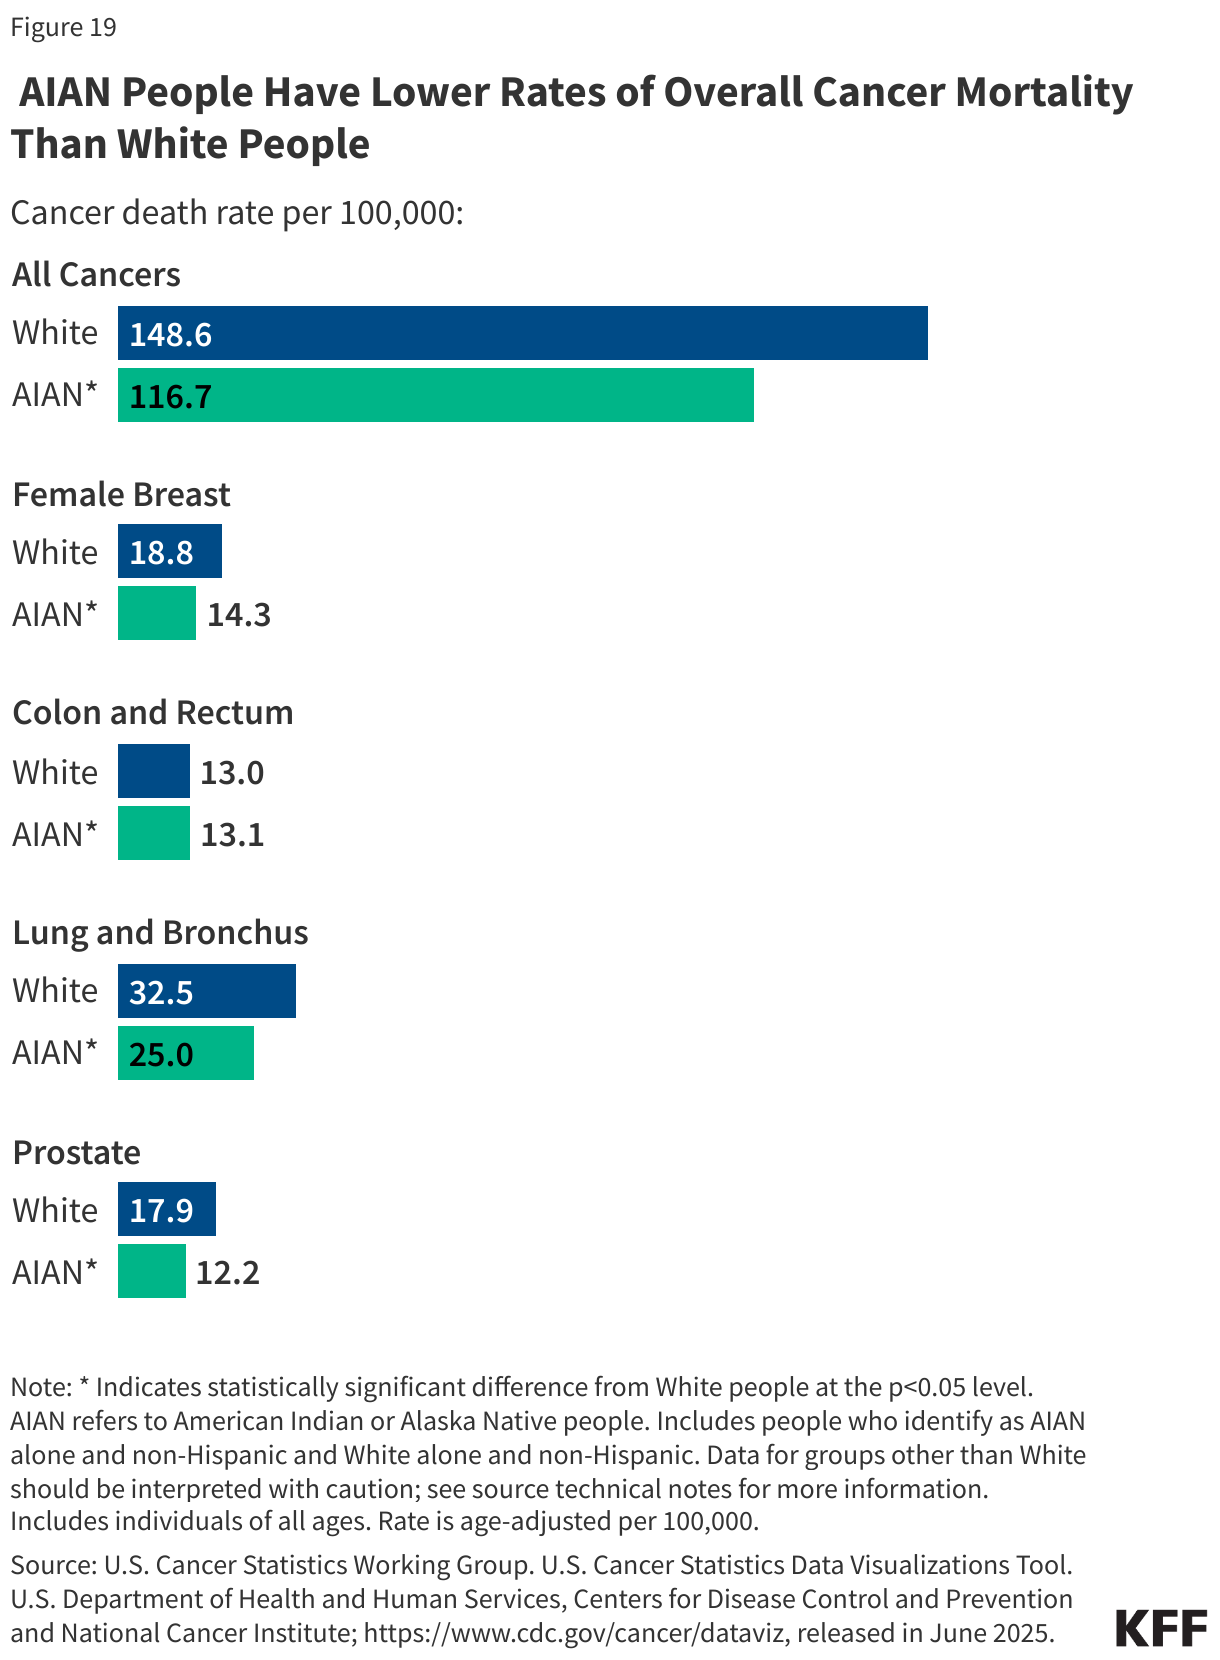
Consistent with their lower incidence rates, AIAN people have lower rates of cancer mortality than White people for all cancers as well as across most leading cancer types (Figure 19). However, as of 2023, people who identify as AIAN alone and White people have similar rates of death due to colon and rectum cancer (13.1 and 13.0 per 100,000, respectively).
Suicide and Substance Use Disorder
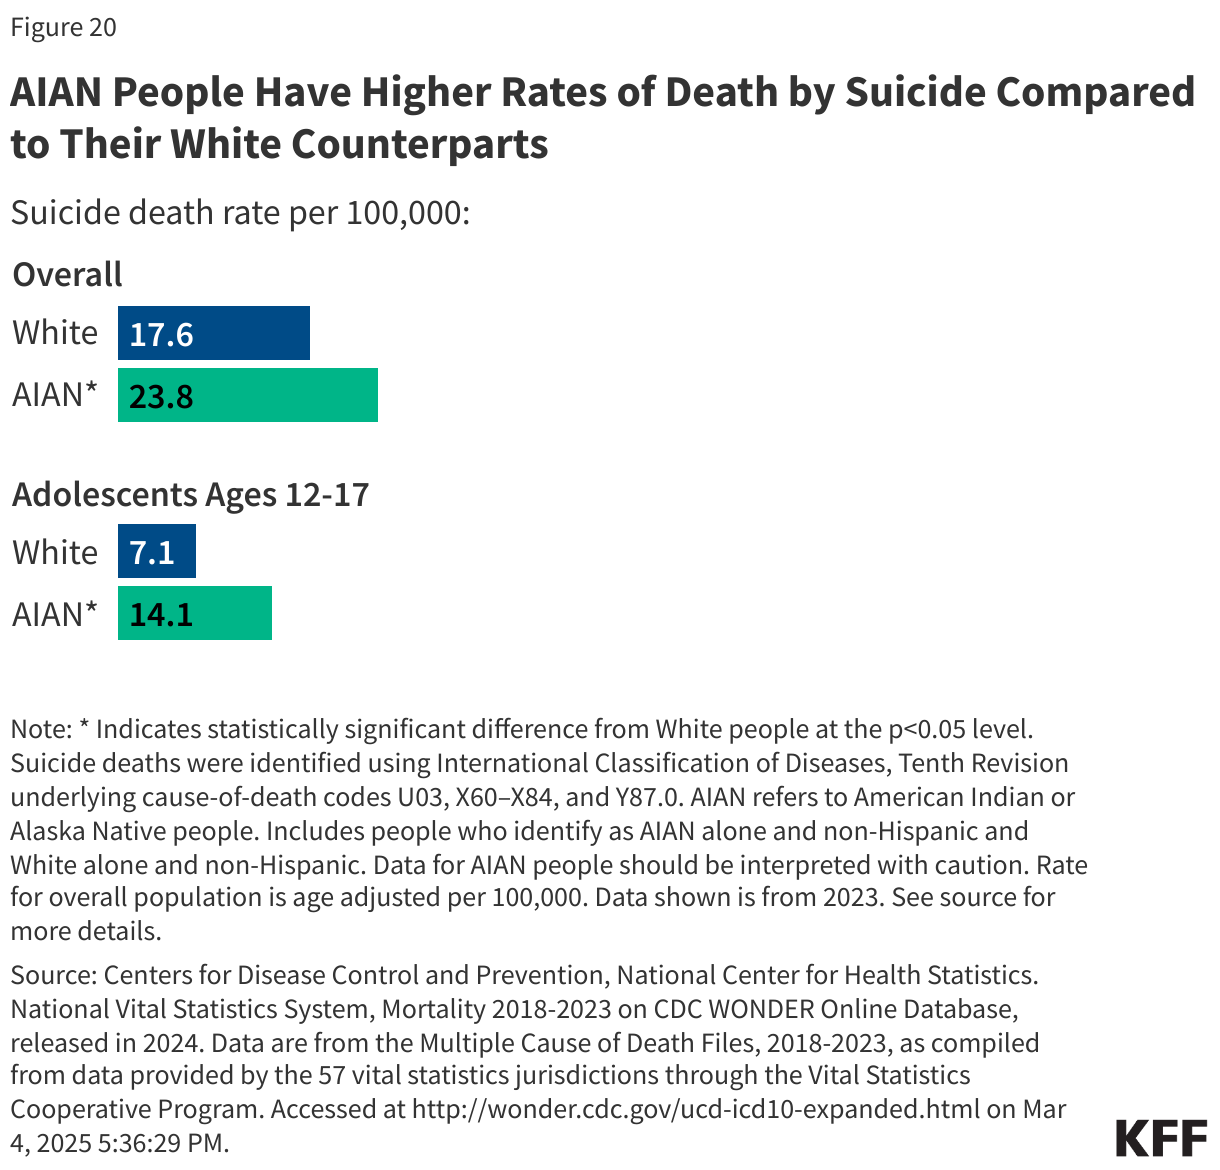
AIAN people have the highest rates of deaths by suicide across all racial and ethnic groups. In 2023, people who identify as AIAN alone have higher rates of deaths by suicide than White people (23.8 vs. 17.6 per 100,000) (Figure 20). Additionally, AIAN adolescents have the highest rates of deaths by suicide across all racial and ethnic groups. Research finds that suicide is the second leading cause of death for high school-aged AIAN adolescents. Rates of deaths by suicide increased by 139% for AIAN adolescent females and 71% for AIAN adolescent males between 1999 and 2017, however, recent data show that these rates declined between 2021 and 2023. Studies have shown that the high rates of suicide are associated with AIAN youths’ high likelihood of having adverse childhood experiences combined with historical intergenerational trauma as a result of colonization and structural discrimination.
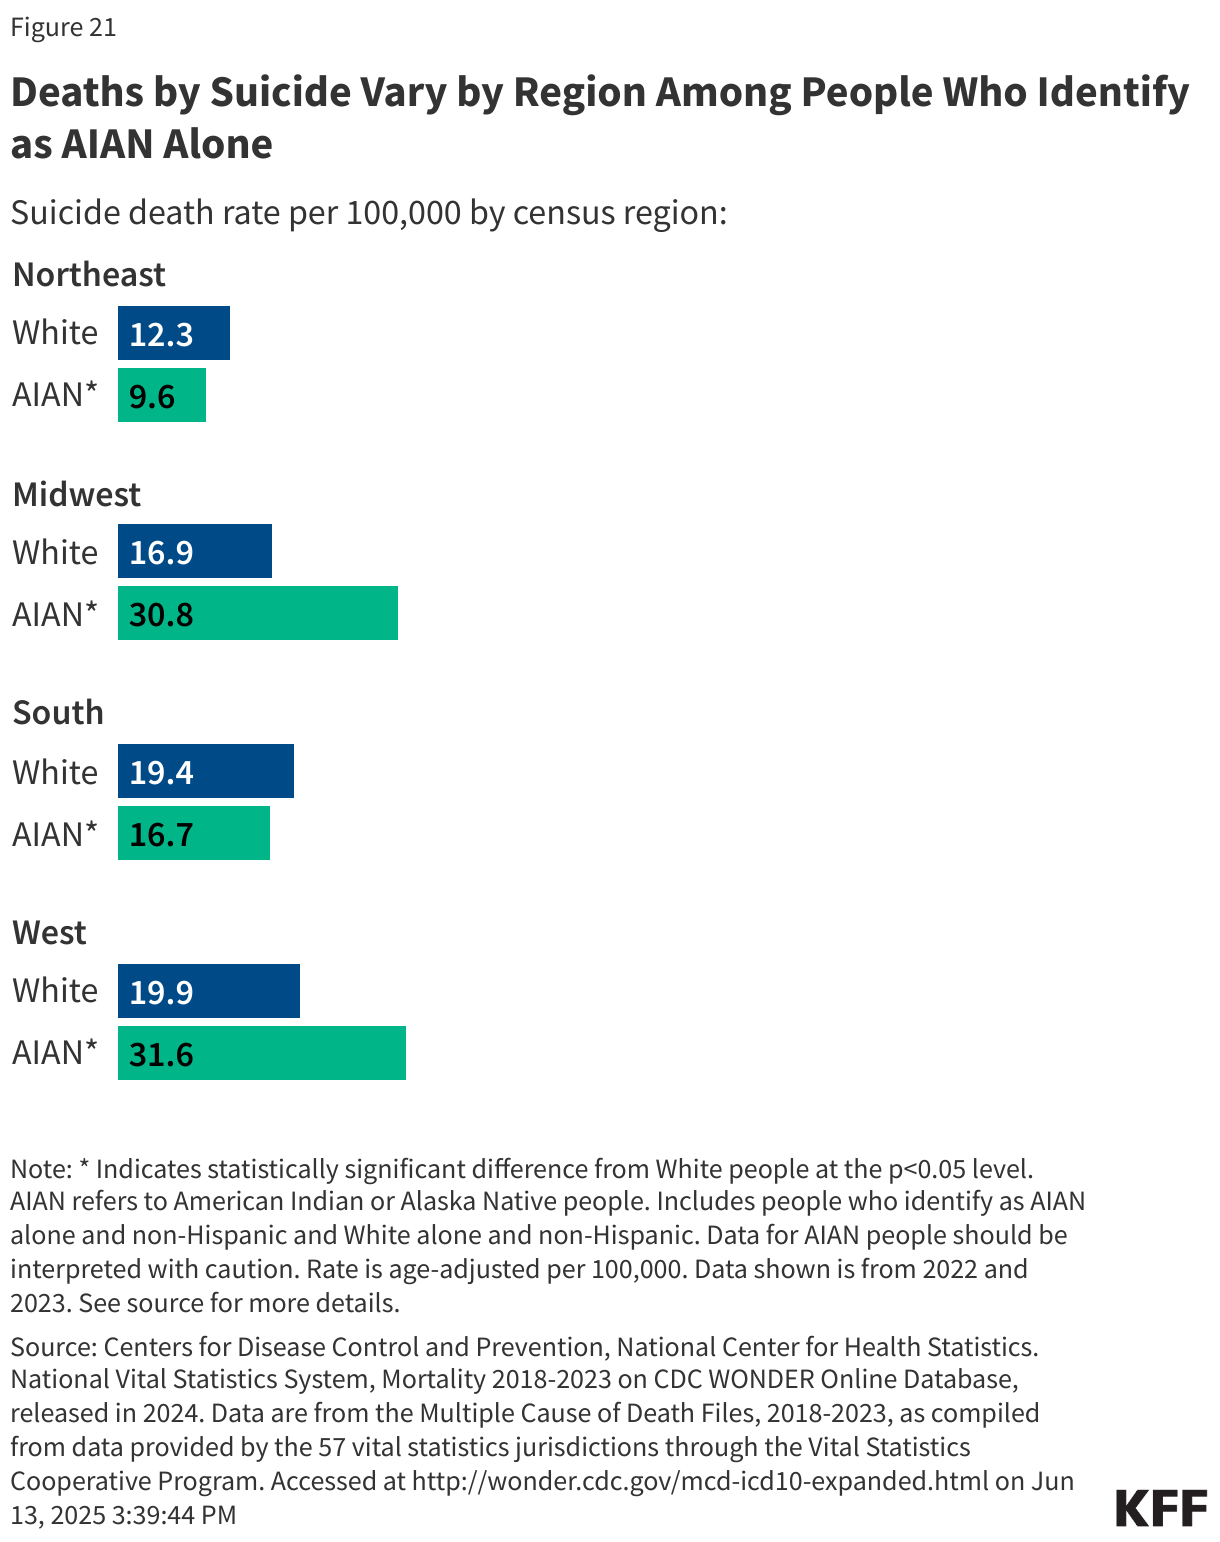
Deaths by suicide vary by region among people who identify as AIAN alone. AIAN people in the Western U.S. experience the highest rate of deaths by suicide (31.6 per 100,000), while AIAN people in the Northeast experience the lowest rate of deaths by suicide (9.6 per 100,000) (Figure 21). Deaths by suicide are higher among AIAN people than White people in all regions except the Southern U.S.
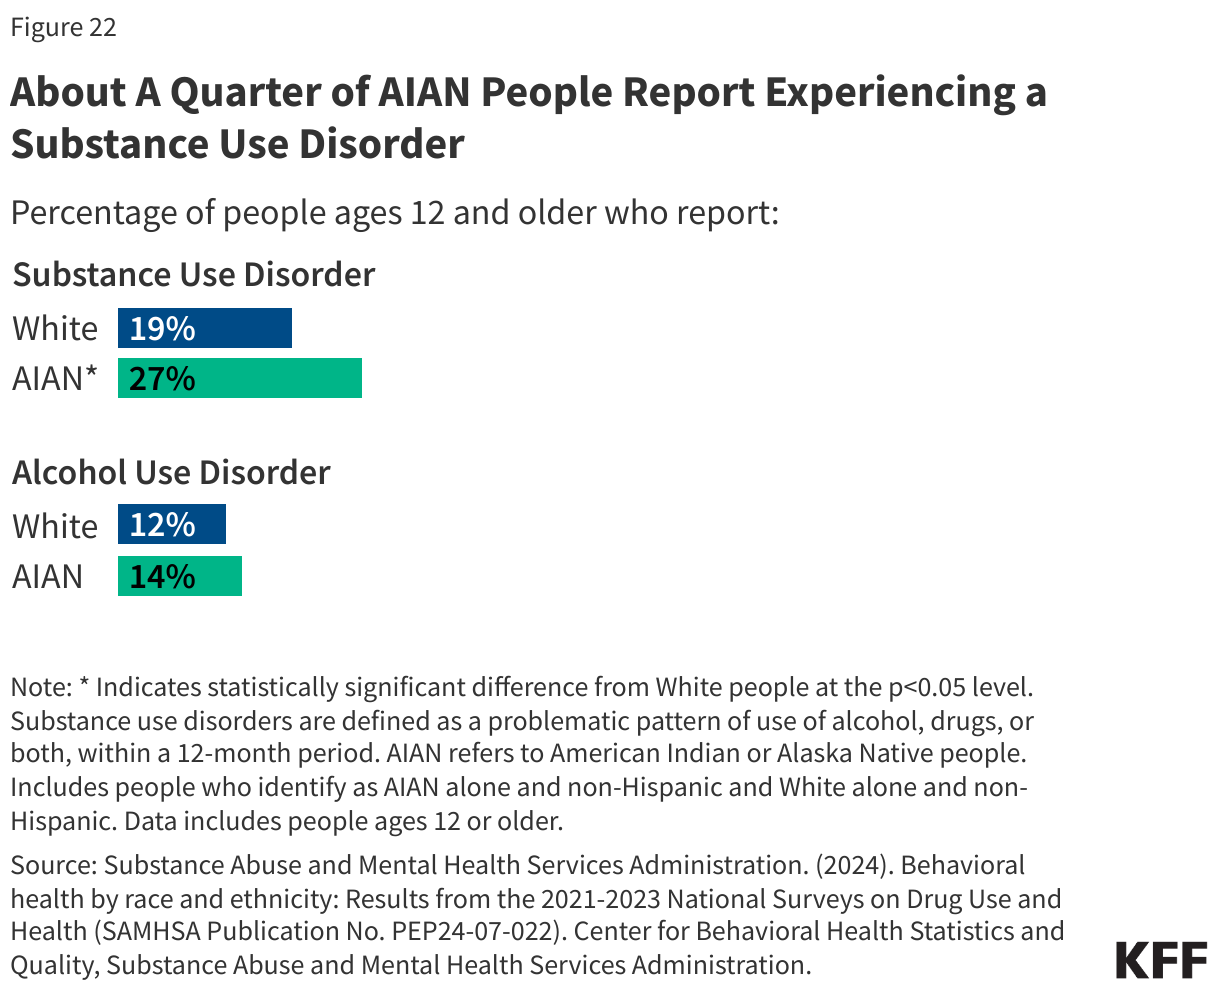
AIAN people report the highest prevalence of substance use disorder (SUD) in the past year compared with other racial and ethnic groups. AIAN people also experience the highest rates of drug overdose death, including the highest rates of opioid-related deaths in 2023. The high rates of opioid-related deaths likely reflect the low uptake of medication treatment services among AIAN people. Among those ages 12 years and older, over a quarter (27%) of people who identify as AIAN alone report experiencing substance use disorder in the past year, compared to 19% of White people (Figure 22). Similar shares of AIAN people (12%) and White people (14%) report experiencing alcohol use disorder.
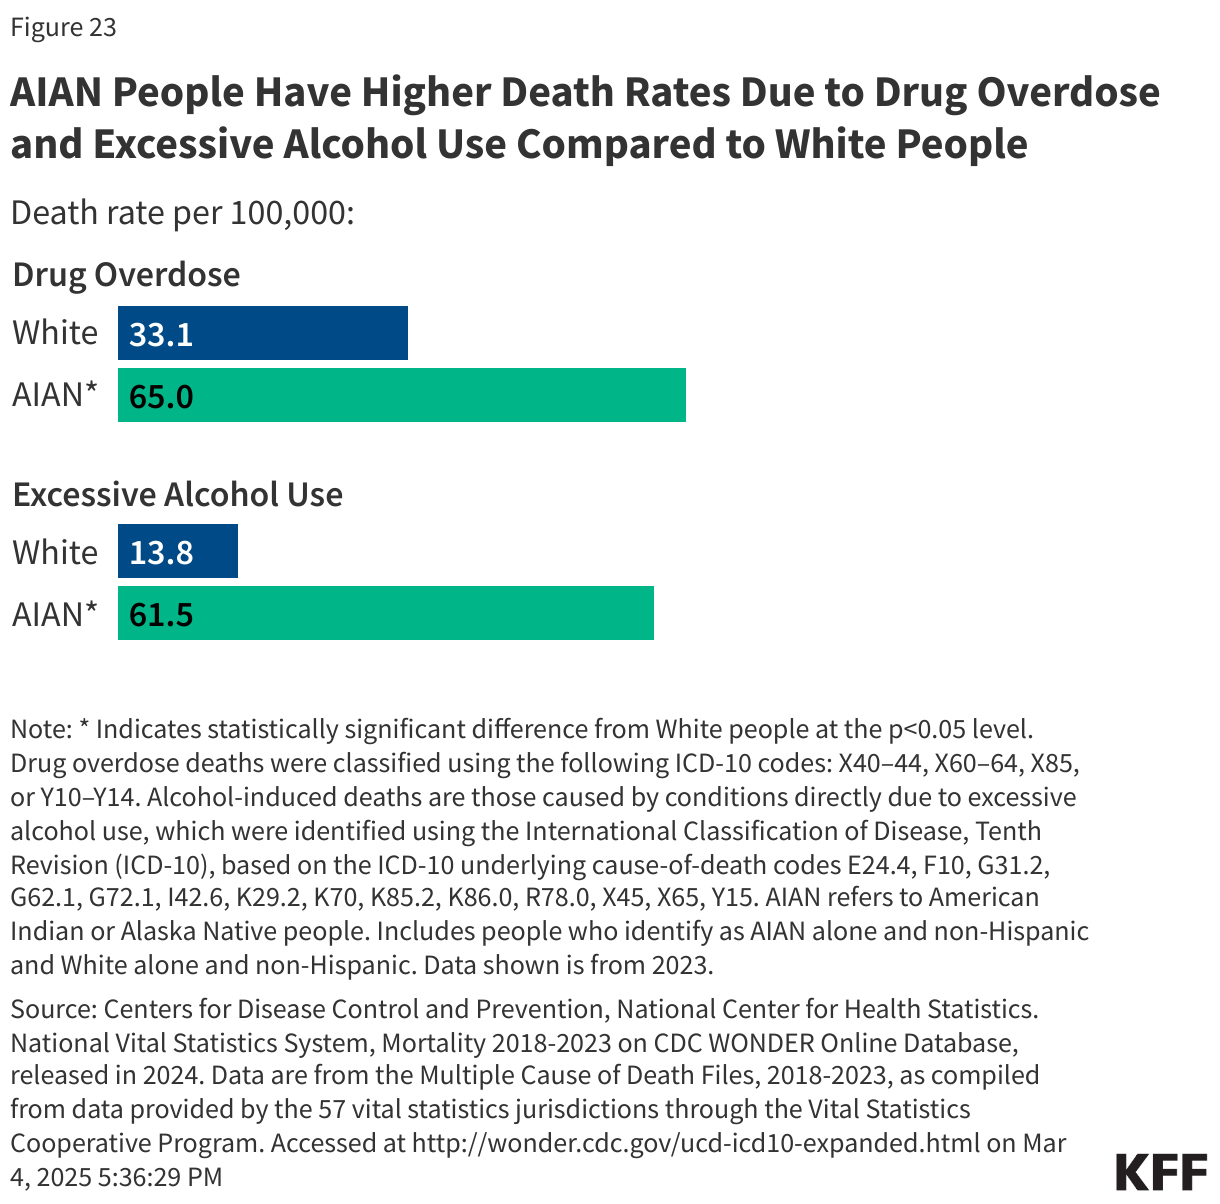
AIAN people are about twice as likely to die from a drug overdose compared to White people (65 vs. 33.1 per 100,000) in 2023 (Figure 23). Alcohol-induced deaths are also higher among people who identify as AIAN alone in 2023 compared to White people. AIAN people have the highest rate of alcohol-induced deaths and the fastest growing rate of alcohol-induced deaths compared to other racial and ethnic groups, nearly doubling in the past 10 years. Increases in alcohol deaths among AIAN people follow worsening trends in other areas related to behavioral health, where AIAN people have both the highest and fastest-growing rates of suicide and overall drug overdose deaths.
Experiences with Racism and Discrimination
Racism is an underlying driver of health disparities. Research has shown that exposure to racism and discrimination can lead to negative mental health outcomes and certain negative impacts on physical health, including depression, anxiety, and hypertension. Across measures of discrimination in daily life and health care settings, AIAN adults report the highest frequency of experiencing certain types of discrimination compared to other racial and ethnic groups, while White adults report the lowest frequency.
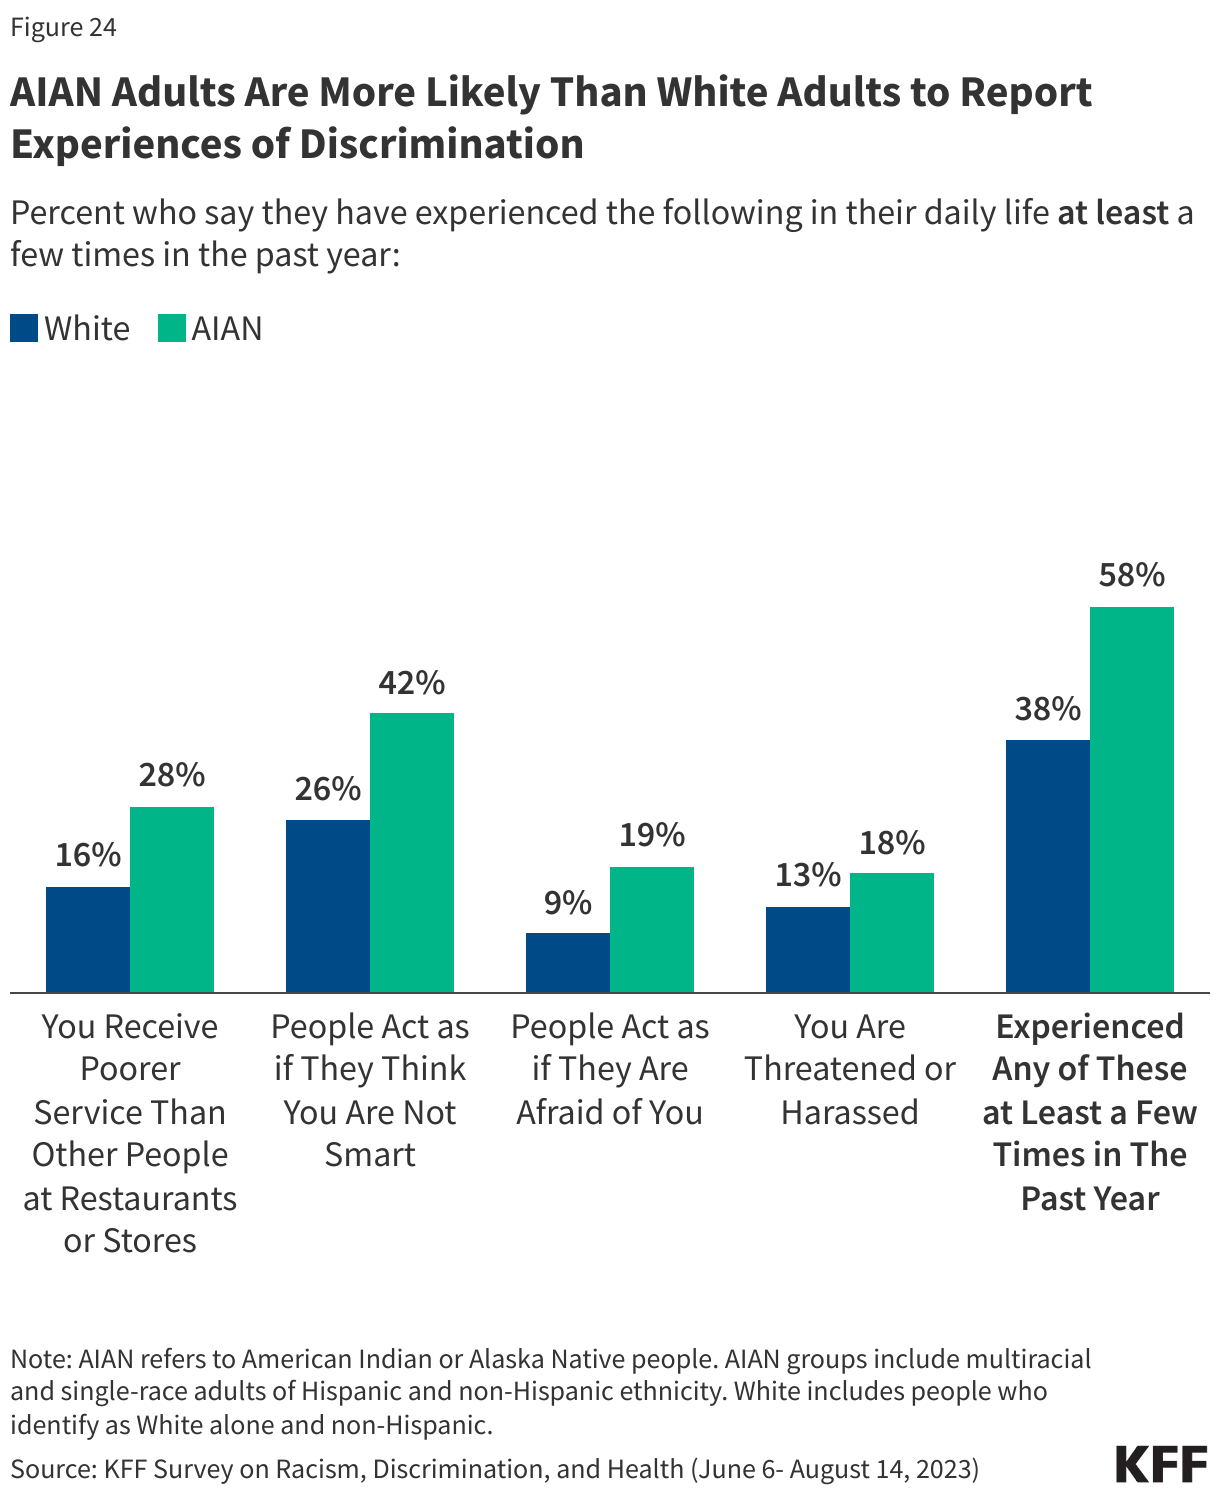
AIAN adults are more likely to report certain experiences with discrimination in daily life compared with their White counterparts. Based on KFF survey data from 2023, more than a quarter of AIAN adults (28%) say that they received poorer service than other people at restaurants or stores at least a few times in the past year, higher than the share of White adults who say the same (16%) (Figure 24). Similarly, about four in ten (42%) AIAN adults say that people have acted as if they think they are not smart at least a few times in the past year, higher than the one-quarter (26%) of White adults who say the same. Further, about one in five (19%) AIAN adults say people acted as if they were afraid of them at least a few times in the past year, compared to 9% of White adults. Cumulatively, at least half of AIAN (58%) adults say they have experienced one of these forms of discrimination at least a few times in the past year compared to about four in ten (38%) White adults (Figure 24).
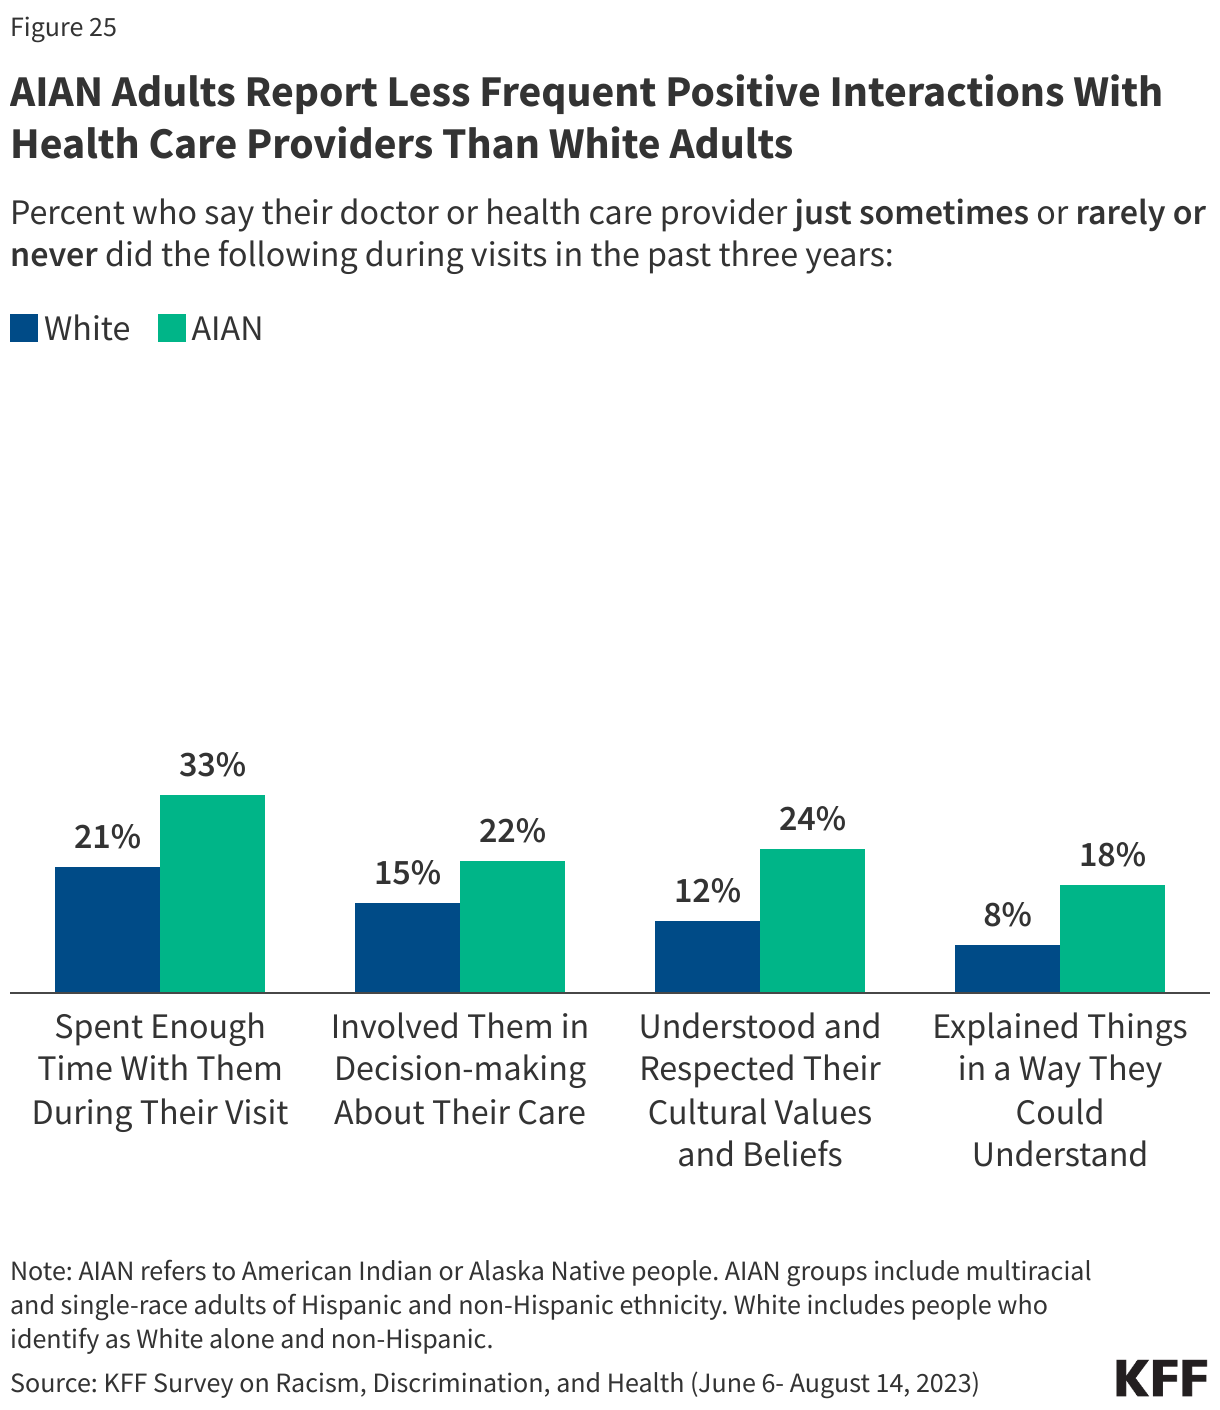
AIAN adults report having less frequent positive and respectful interactions with health care providers than White adults. KFF survey data from 2023 also show that AIAN adults (18%) are about twice as likely as White adults (8%) to say their health care providers explained things in a way they could understand just some of the time, rarely, or never in the past three years. Similarly, about one in four AIAN adults (24%) say their health care providers understood and respected their cultural beliefs just some of the time, rarely, or never, compared with about one in ten White adults (12%). They also are more likely than their White counterparts to say their providers did not frequently involve them in decision-making about their care during their visits in the past three years (Figure 25).
Social and Economic Factors that Influence Health
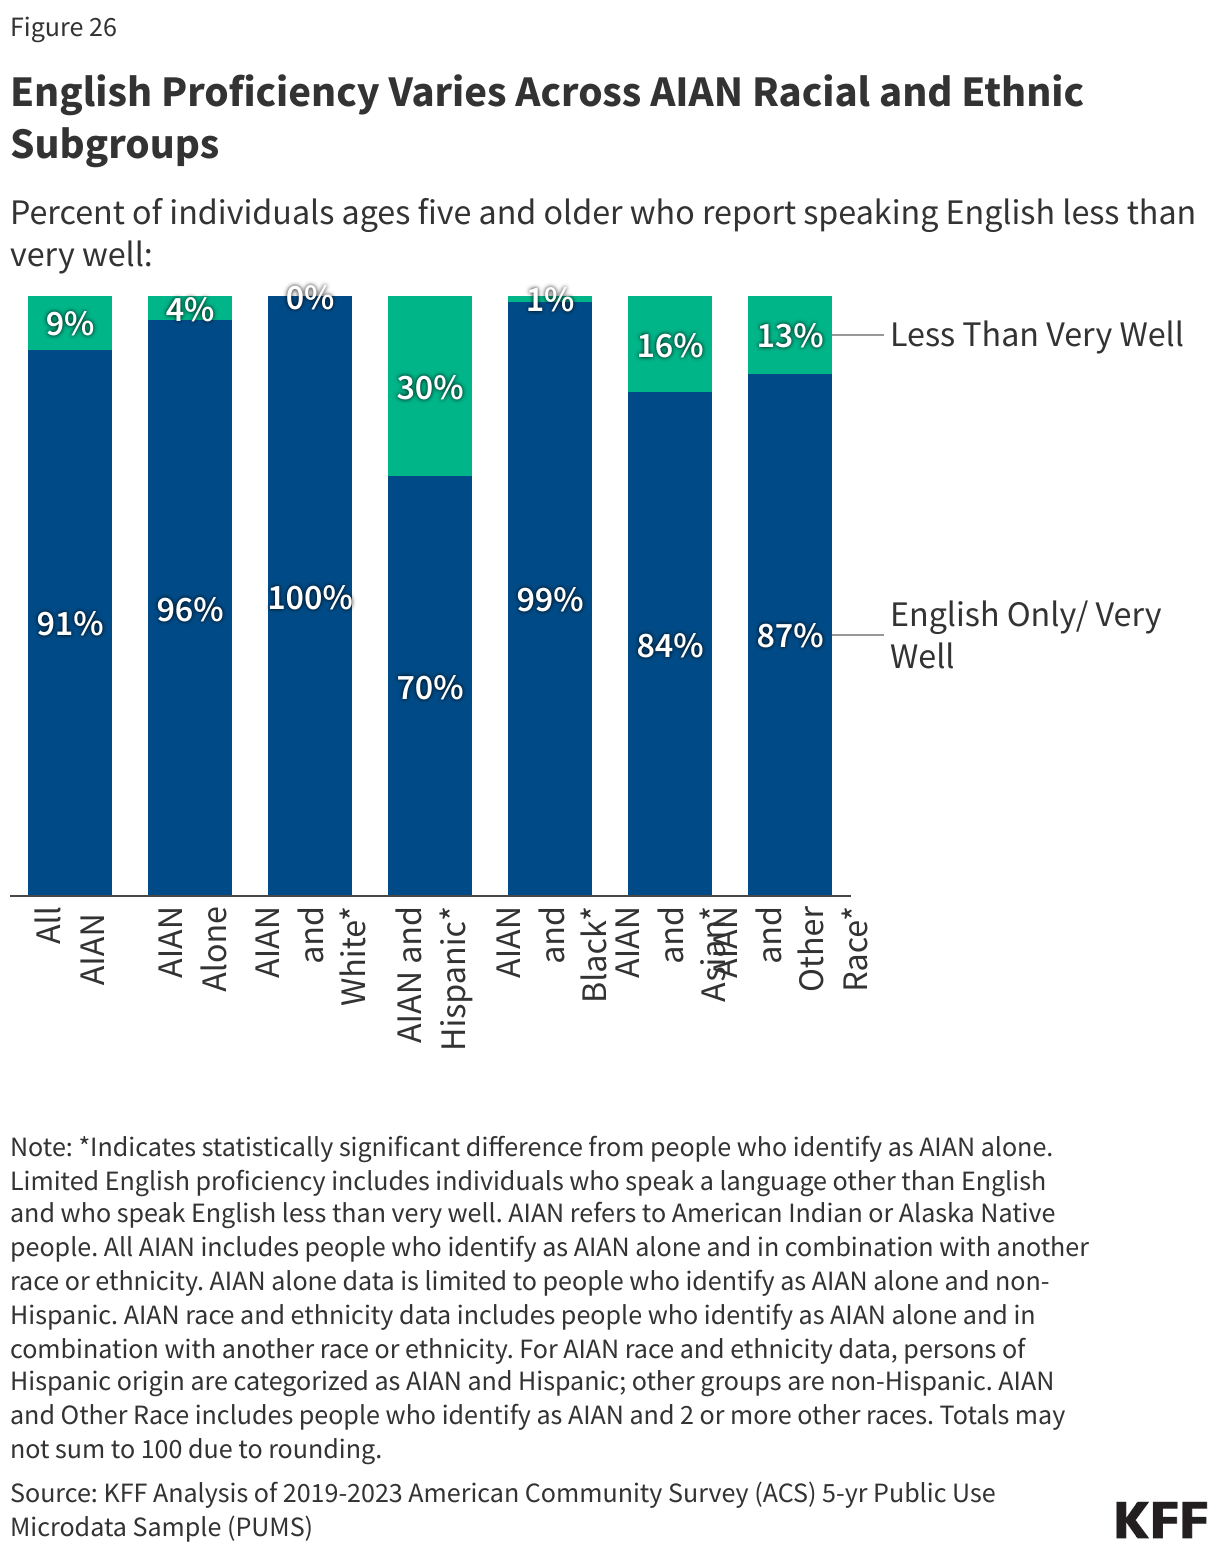
There is wide variation in the share of AIAN people reporting LEP among racial and ethnic subgroups. Among people who identify as AIAN in combination with another race or ethnicity, LEP ranges from 30% of people who identify as AIAN and Hispanic to one percent or less of AIAN and Black, and AIAN and White people (Figure 26). Having LEP can contribute to difficulty accessing health coverage and care and negatively impact quality of care and health outcomes.
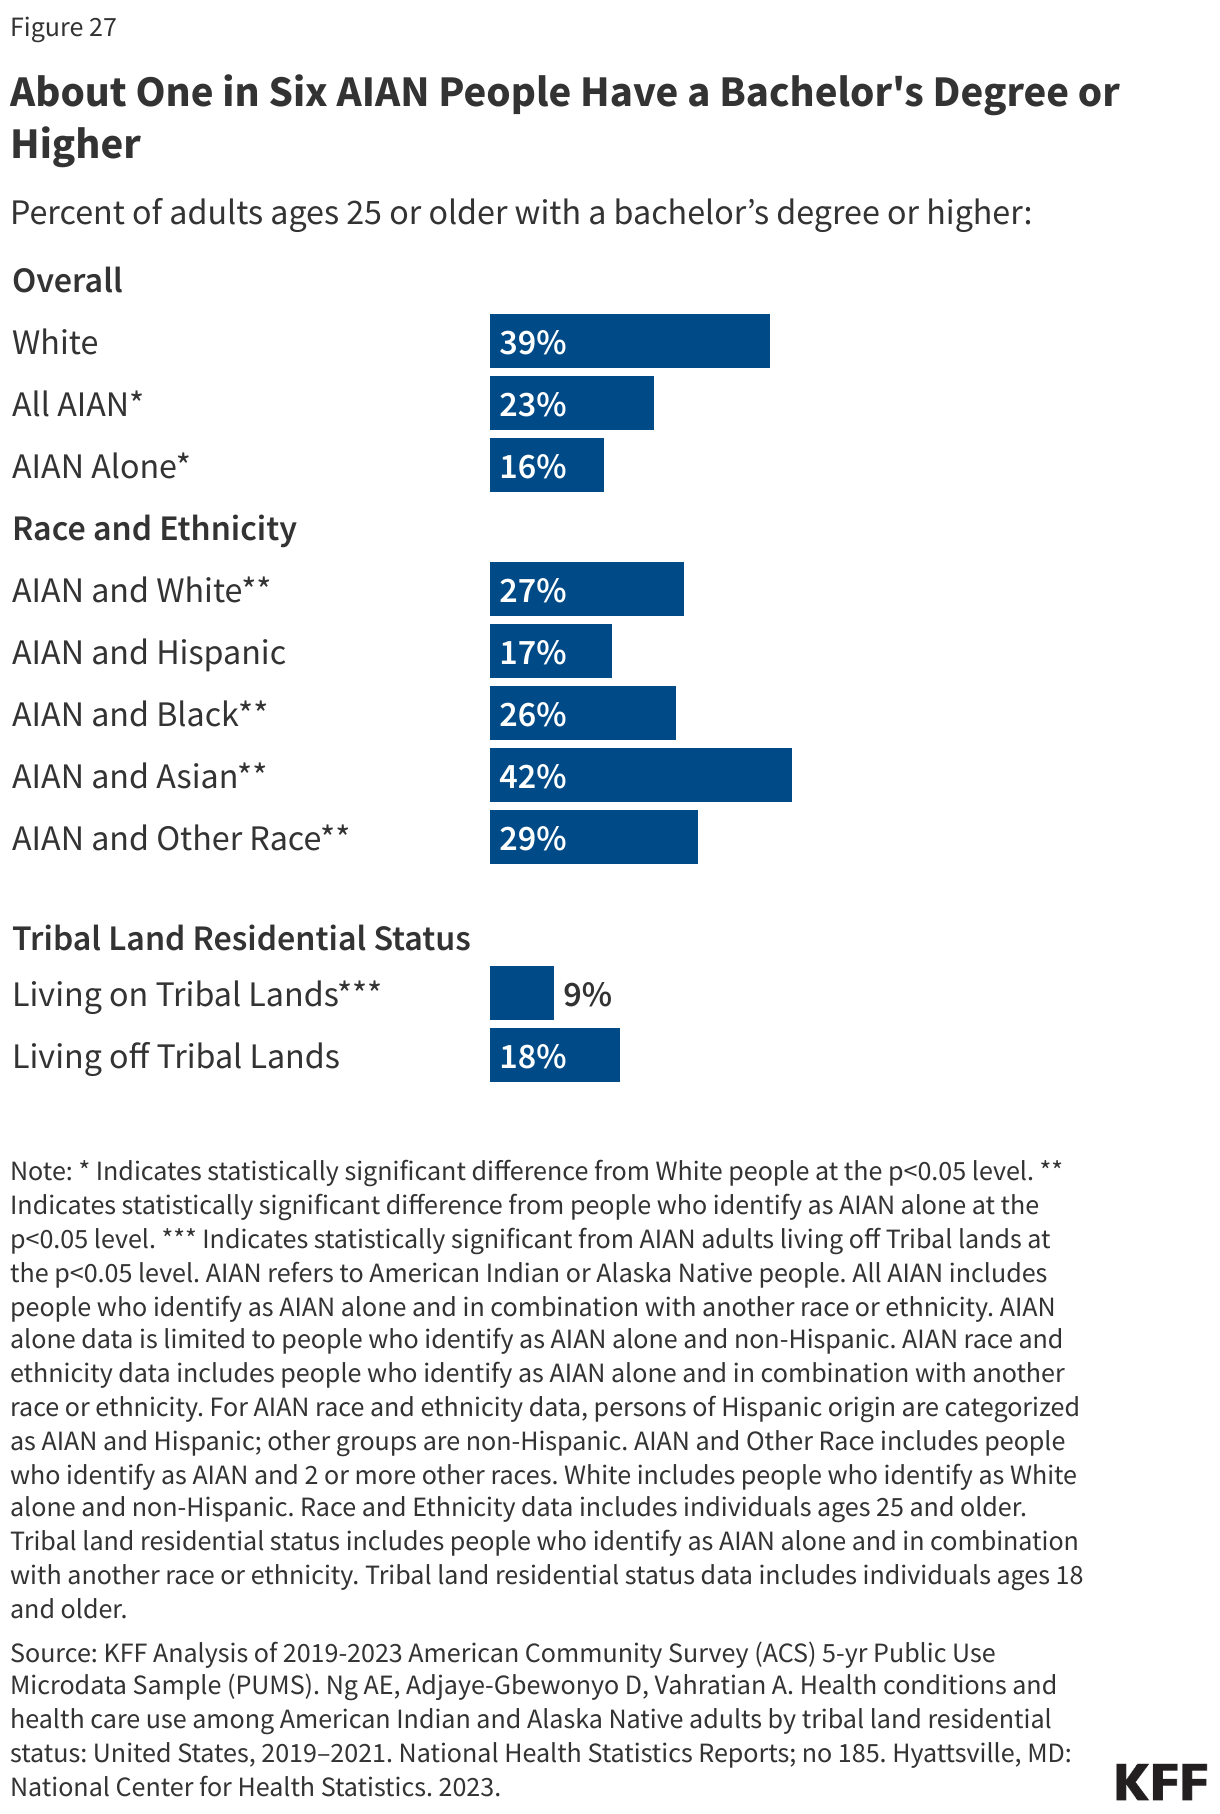
AIAN people have lower educational attainment than their White counterparts, but there is significant variation among AIAN people by racial and ethnic subgroups. Among adults ages 25 and older, 16% of people who identify as AIAN alone have a bachelor’s degree or higher, compared to 39% of White people. The share with a bachelor’s degree or higher is similar among those who identify as AIAN and Hispanic (17%), but it rises to over a quarter among those who are AIAN and Black (26%), and AIAN and White (27%), and to over four in ten (42%) of those who identify as AIAN and Asian. Additionally, AIAN people living off Tribal lands are twice as likely to have a bachelor’s degree or higher compared to AIAN people who live on Tribal lands (18% vs. 9%) (Figure 27). Researchers have found that some of the educational attainment gap can be explained by a lack of culturally relevant coursework in traditional educational settings.
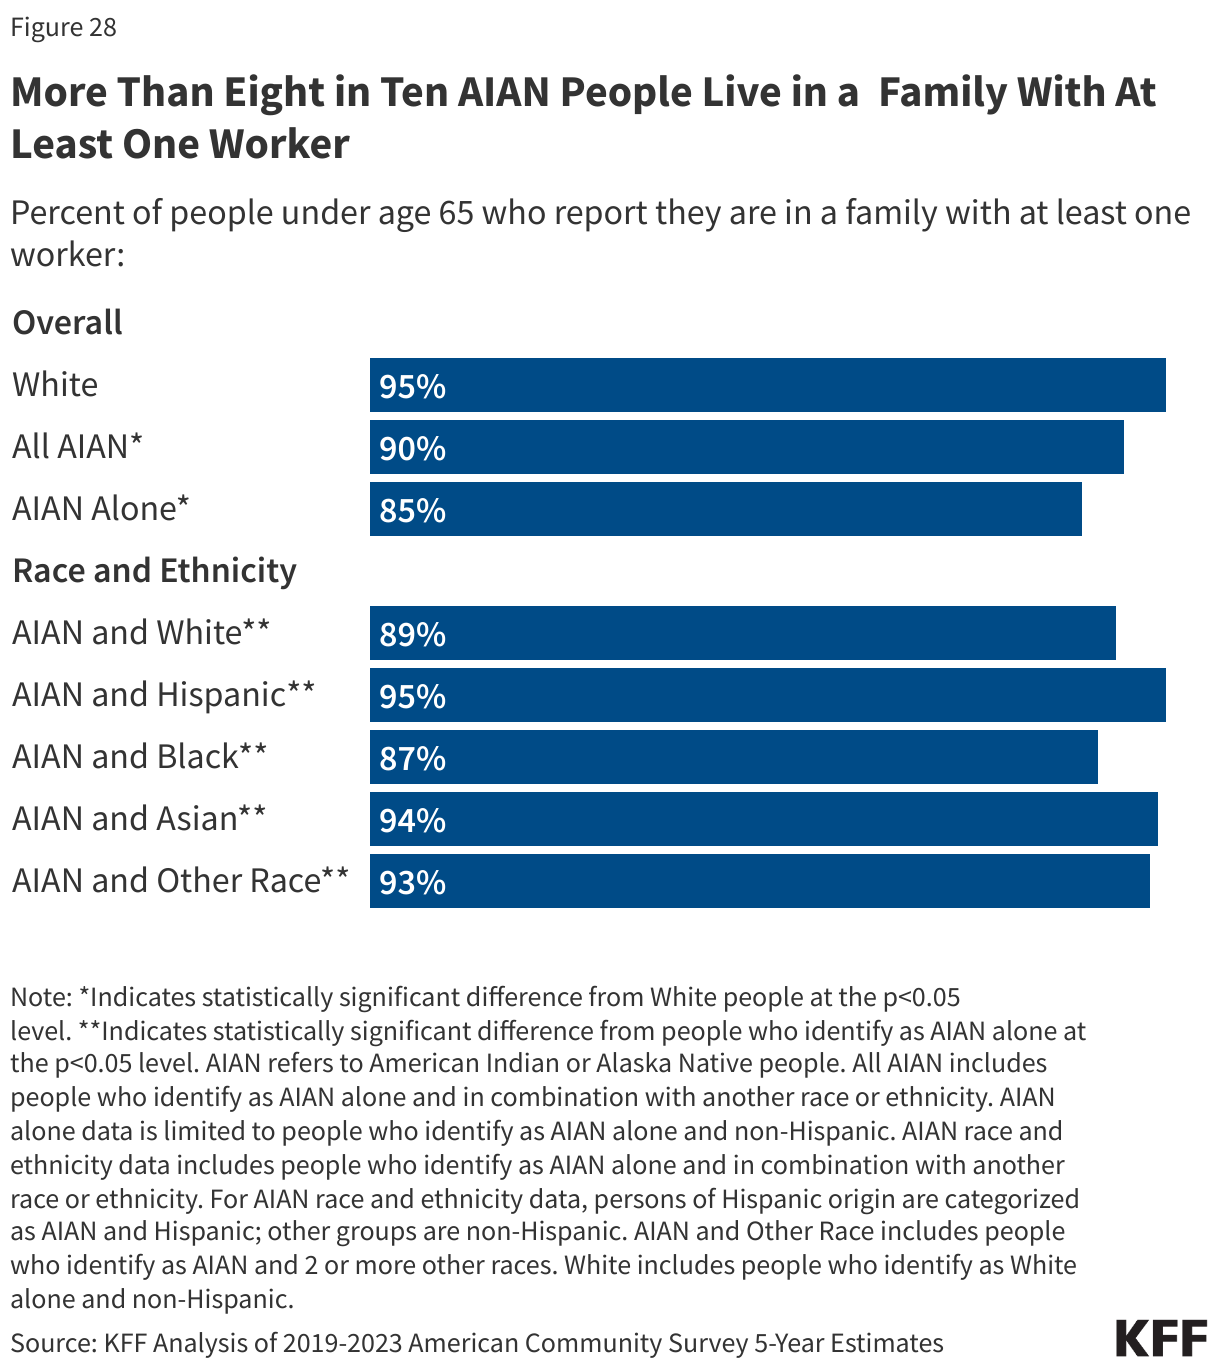
While most people who identify as AIAN alone are in a working family, they are less likely than White people to live in a family with at least one worker (85% vs. 95%). The share living in a working family also varies among AIAN people by racial and ethnic subgroup. More than eight in ten AIAN people who identify as AIAN alone (85%) or AIAN and Black (87%) are part of a working family, while more than nine in ten people who identify as AIAN and Hispanic (95%) and as AIAN and Asian (94%) live in a working family (Figure 28).
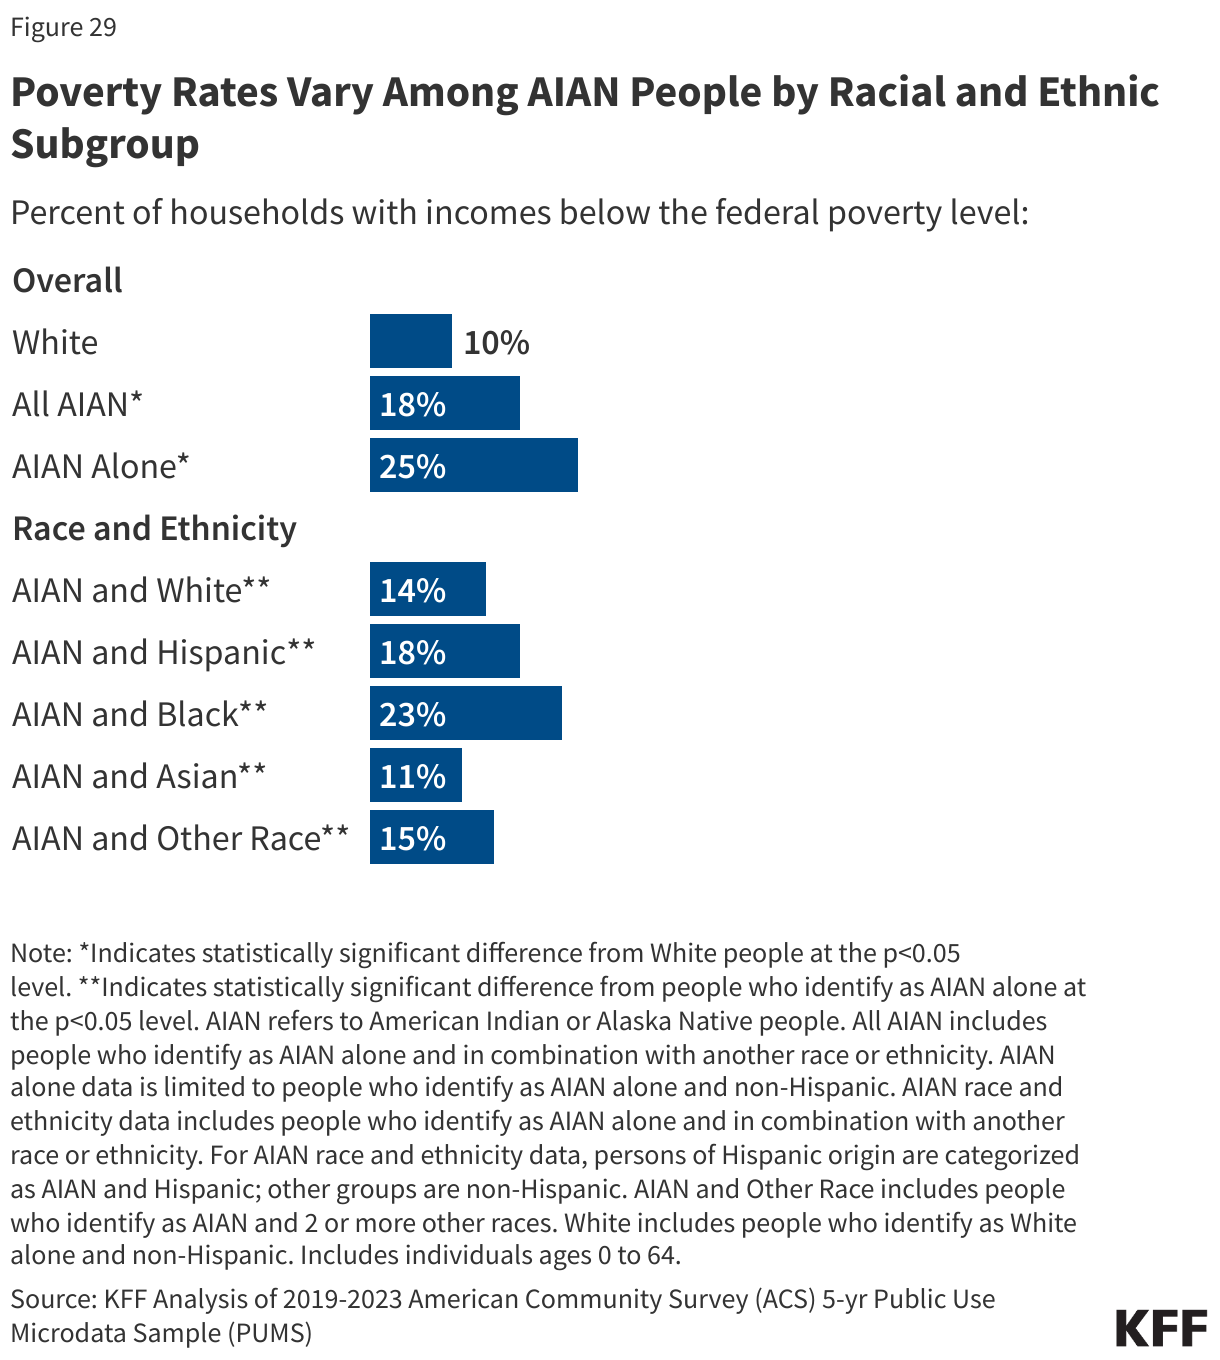
AIAN people are more likely than White people to live in a family with an income below poverty, although there is variation among racial and ethnic subgroups of AIAN people. Among AIAN people, poverty rates are lower among those who identify as AIAN and Asian (11%), and AIAN and White (14%), while they rise to about one in five among AIAN and Hispanic (18%) people and about a quarter among AIAN and Black (23%) people, and people who only identify as AIAN alone (25%) (Figure 29).
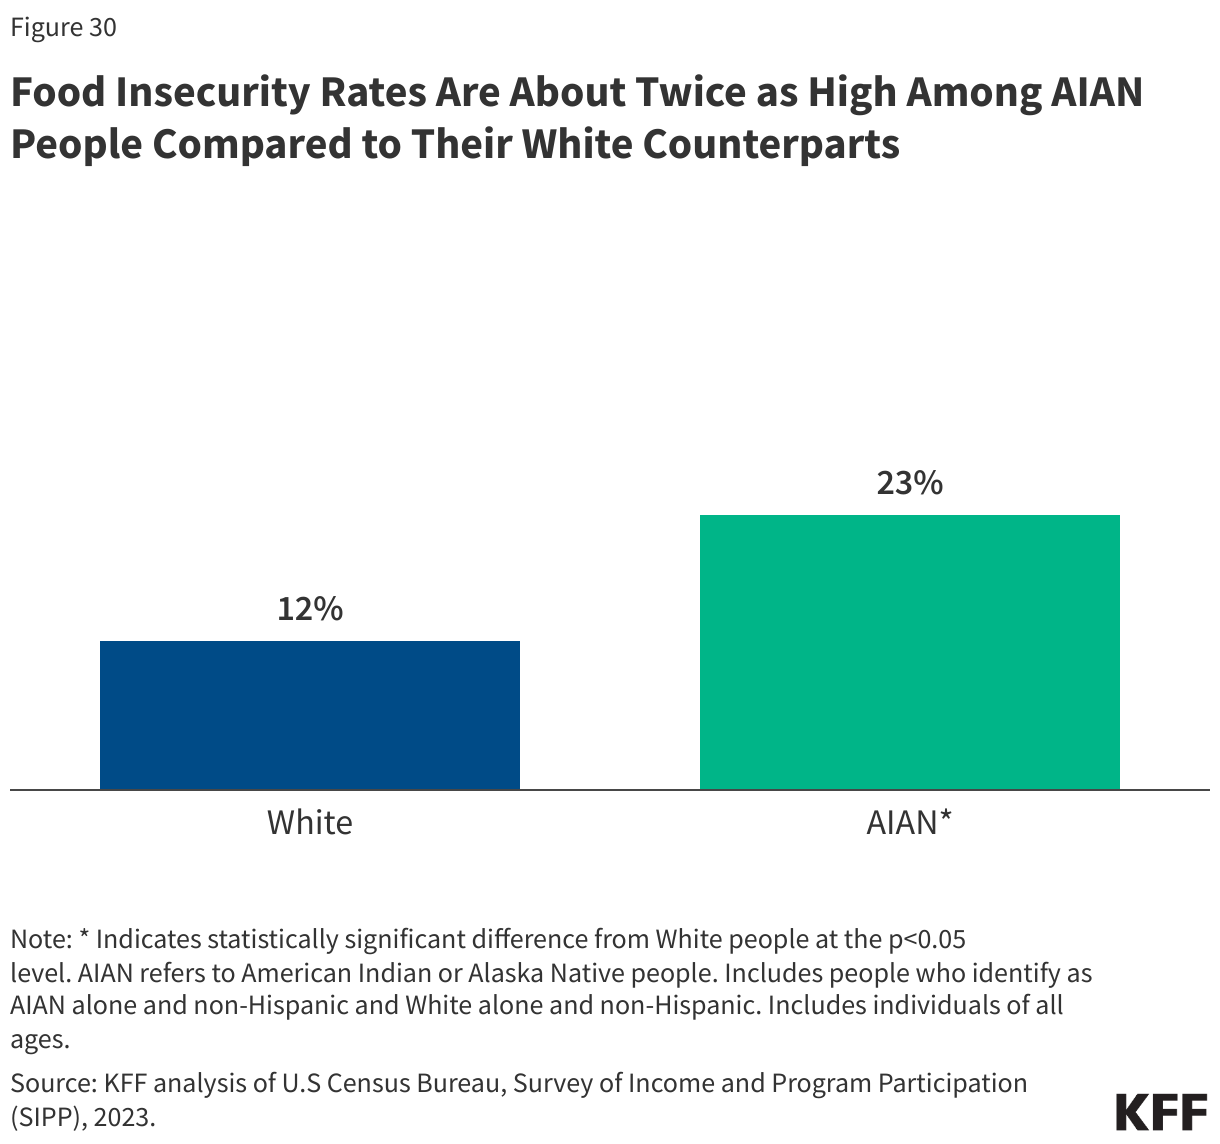
AIAN people are nearly twice as likely to experience food insecurity compared to their White counterparts. People who identify as AIAN alone (23%) are more likely to be in a household that experienced food insecurity compared to White people (12%) (Figure 30). Food insecurity among AIAN people is closely linked to historical federal policies that removed and relocated AIAN people and disrupted their connection to traditional lands, foods, and cultural practices.
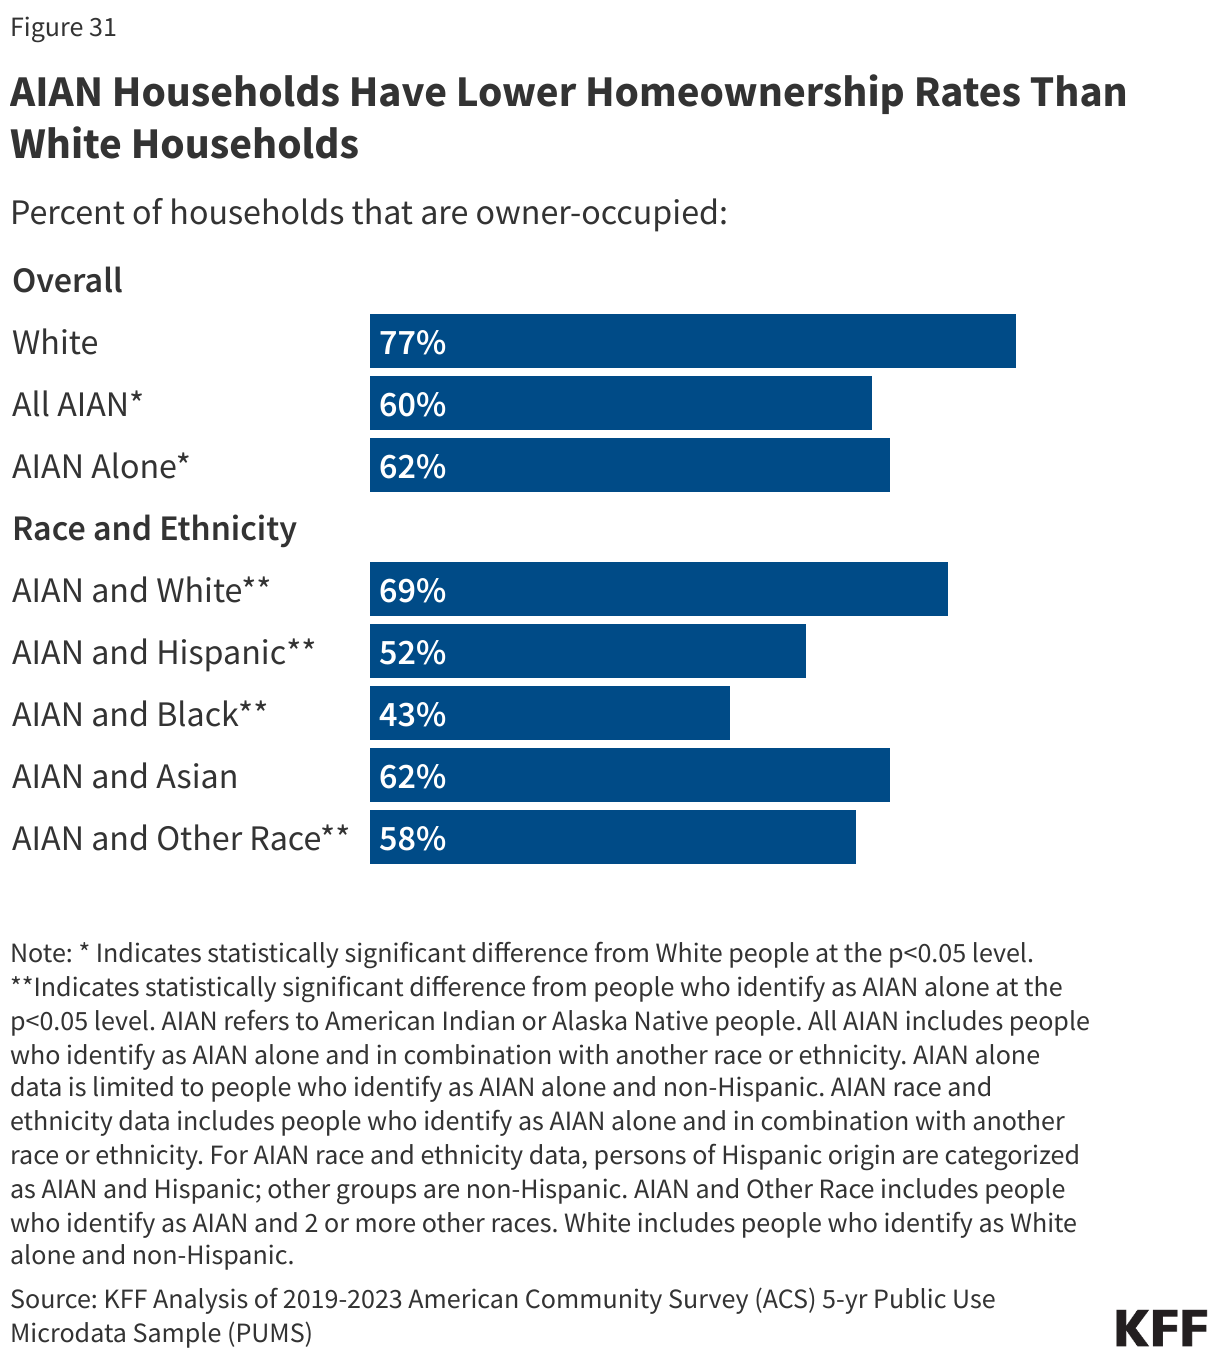
AIAN people are less likely to own a home than White people (62% vs. 77%). Lower rates of homeownership among AIAN people may reflect insufficient housing supply and a lack of access to affordable capital. Rates of home ownership vary among AIAN people by racial and ethnic subgroup. Nearly seven in ten AIAN and White (69%) people own a home, while about six in ten people who identify as AIAN alone (62%), and people who identify as AIAN and Asian (62%) own a home. The home ownership rate drops to about half or lower among people who identify as AIAN and Hispanic (52%) or AIAN and Black (43%) (Figure 31).
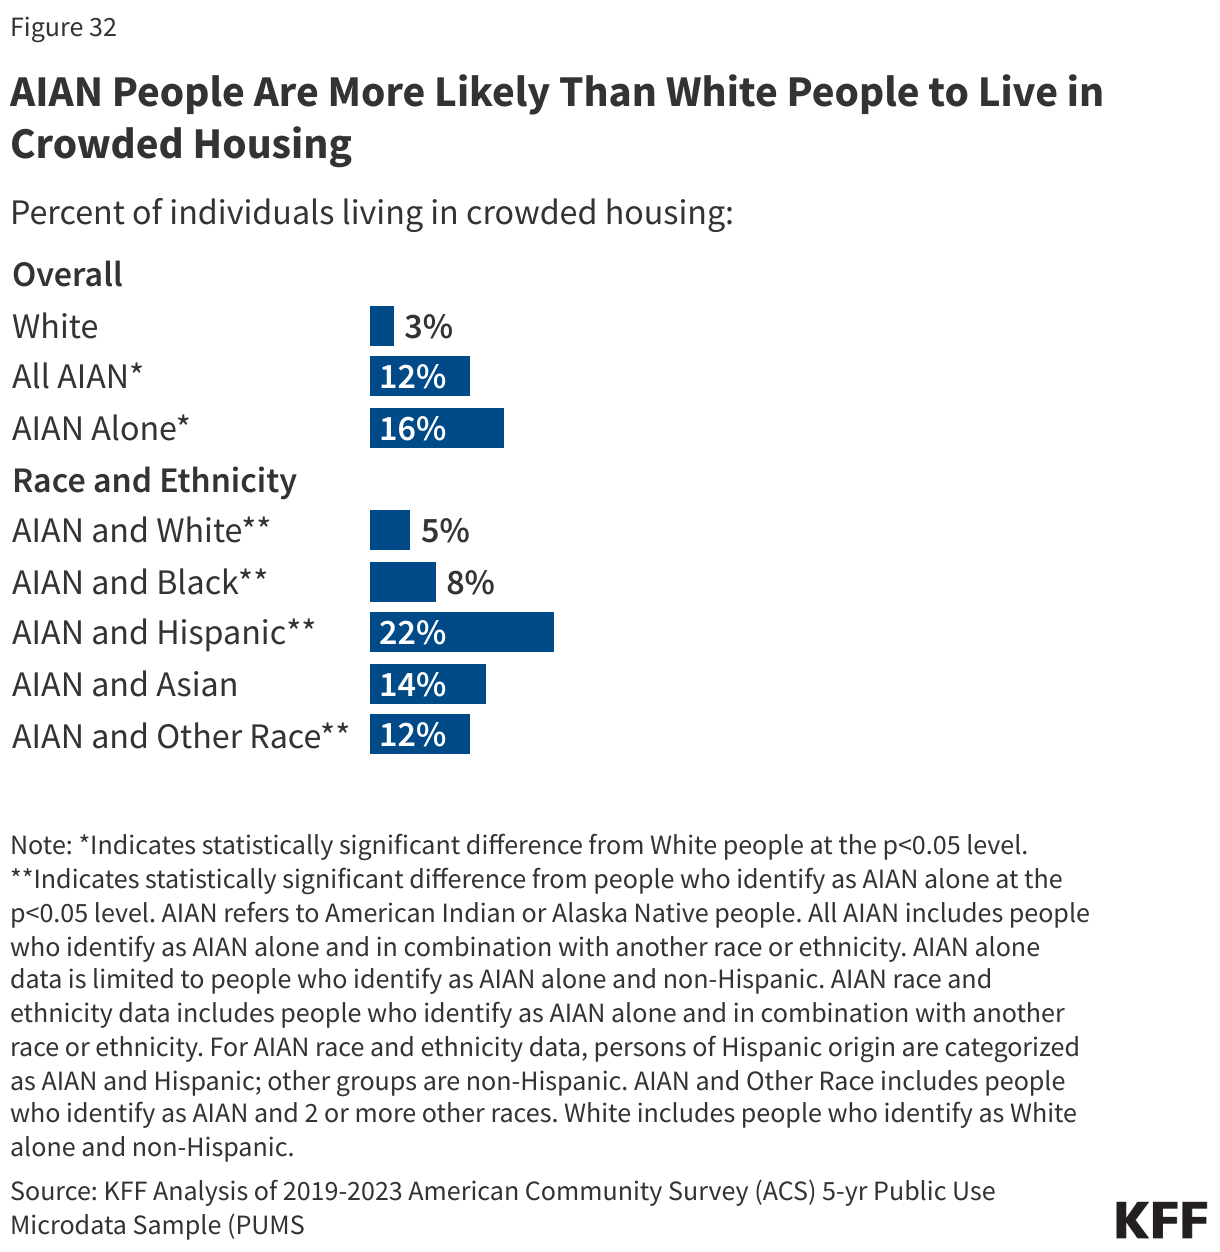
AIAN people are more likely to live in “crowded” housing compared to White people. About 16% of people who identify as AIAN alone and one in ten (12%) people who identify as AIAN alone or in combination with another race or ethnicity report living in crowded housing, compared to 3% of White people. “Crowded housing” is defined as housing with more than one occupant per room (not counting bathrooms, porches, balconies, hallways, or unfinished basements, etc.). Among AIAN people, the share of people living in crowded housing ranges from 5% for people who identify as AIAN and White to about one in five (22%) for people who identify as AIAN and Hispanic (Figure 32). Living in multigenerational households is more common among AIAN people, and family connection is important to health and well-being, which may contribute to higher shares reporting “crowded housing” arrangements and may reflect cultural preferences or choices rather than a housing challenge.
Emerging research also highlights a number of protective social factors that can support better health outcomes in AIAN communities. Strong family and community networks, access to culturally competent care, the prioritization of traditional food systems, and the preservation of language and cultural practices have all been shown to promote resilience and improve well-being. Strengthening these protective factors alongside efforts to address structural barriers can help reduce health disparities for AIAN people.