Snapshots: Health Benefit Offer Rates and Employee Earnings

Authors: and
Published: Nov 15, 2010

Employer-provided health insurance is the primary source of insurance coverage in the United States, covering almost 160 million people.1 About 90 percent of the non-elderly privately-insured population is covered by employer-sponsored plans, meaning that employer decisions about whether to offer health benefits will influence overall rates of insurance coverage in the United States.  Sixty-nine percent of all firms offered health benefits to their employees in 2010.2

It is well-known that highly-paid workers are more likely to receive employer health insurance offers.Many of the studies available on the salaries and fringe benefits of workers do not show how the salaries of a group of co-workers influence an employer’s decision to offer insurance.  For example, even if most employees in a firm earn low wages, employers may still decide to offer health benefits if they also employ a few higher-wage workers in the same establishment who value this coverage.  This paper addresses this question by showing how the offer of employer health insurance differs depending on the distribution of worker earnings within an establishment.

The analysis is based on data from the National Compensation Survey (NCS), which is a nationwide survey of labor costs in private and public establishments conducted quarterly by the Bureau of Labor Statistics (BLS).The figures below show establishment-level offer rates by the number of employees in the establishment and the overall wage level of the jobs that are sampled in the NCS.  The figures include all employees in sampled jobs, including those that are seasonal, part-time, or temporary.5 The data are from 2005 through 2010.  Employee earnings were adjusted for inflation, and are shown in 2010 dollars.Other details about the NCS and our analysis are available below in a methodological appendix.

Offer Rates and Worker Earnings

For each firm size category we studied, establishments with higher-wage workers were more likely to offer health benefits than establishments with lower-wage workers (Figure 1).  For instance, in establishments with less than 10 employees, only 17 percent offered health insurance when the average employee wage was less than $15,000 per year, whereas 31 percent offered when the average was between $15,000 and $20,000, and 47 percent offered between $20,000 and $25,000.  Even at higher average wage levels, establishments with less than 10 employees offered insurance much less often than larger establishments.

Larger establishments with low-wage workers generally offered health benefits more often than smaller establishments with low-wage workers (Figure 1).  Fifty-five percent of establishments with 1,000 or more employees offered insurance when the average wage was less than $15,000, whereas 41 percent of establishments with 25 to 99 employees and 26 percent of establishments with 10 to 24 employees offered health benefits in the lowest-wage category.
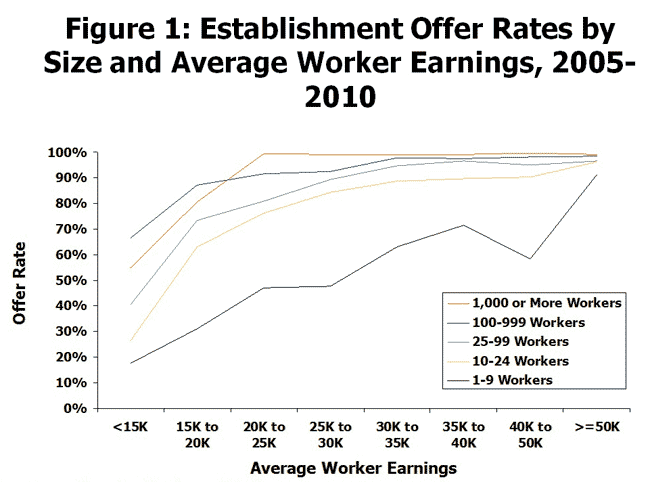
Figure-1_2.gif

Notes: Wages cutoffs are adjusted for inflation to 2010 dollars.Source: Kaiser Family Foundation calculations based on data from the National Compensation Survey, 2005-2010, conducted by the Bureau of Labor Statistics.

Next, we show establishment offer rates by establishment size and the percentage of workers who are in a job where workers make less than $30,000 on average (Figure 2).  Viewing offer rates by an earnings cutoff is useful because it is a more explicit measure of the spread of workers’ salaries within an establishment, and, unlike averages, comparing earnings to wage cutoffs are not sensitive to particular groups of employees with very large or very small salaries.7

Establishments with high percentages of jobs where workers make less than $30,000, on average, were generally less likely to offer than other establishments (Figure 2).  Offer rates were much higher for firms where less than 90 percent of employees made less than $30,000.  In establishments where 90 percent or more of employees made less than $30,000, the offer rate varied between 26 and 78 percent, depending on establishment size.  For most establishment size categories, there was a general progression from lower to higher offer rates, as the percentage making less than $30,000 decreased (moving from right to left in Figure 2).8
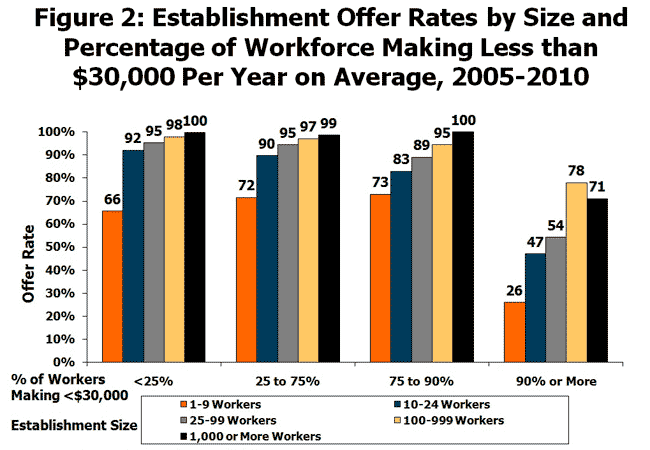
Figure-2.gif

Notes: Wages cutoffs are adjusted for inflation to 2010 dollars.Source: Kaiser Family Foundation calculations based on data from the National Compensation Survey, 2005-2010, conducted by the Bureau of Labor Statistics.

Discussion

This paper shows that, on average, establishments with lower-wage employees offer health benefits less frequently.  For smaller establishments, offer rates are particularly lower when wages are low.

Of course, other factors that were not considered here might explain the patterns we show for offer rates and worker earnings.  For instance, this analysis did not distinguish between full and part-time workers, or between those that are permanent, temporary, or seasonal.

These findings nevertheless suggest that policymakers interested in encouraging employers to offer health benefits may wish to pay particular attention to how the distribution of wages within the establishment are related to whether employees are offered benefits.  Smaller, low-wage establishments may require particular focus to encourage offering at a rate comparable to larger, high-wage businesses.  Special subsidies or insurance products may be needed in order to encourage more offering among these businesses, or to help their workers seek out other means of insurance coverage.

This paper was prepared by Gary Claxton and Anthony Damico of the Kaiser Family Foundation’s Health Care Marketplace Project, and is an update to an analysis originally published in 2008.  Paul Jacobs, who formerly worked in that division, helped to prepare the prior version.

Methodological Appendix

The Employment Cost Index (ECI) is a nationwide survey of labor costs in private and public establishments conducted quarterly by the Bureau of Labor Statistics (BLS).  The ECI was developed in the mid-1970s to track changes in the costs of employment.  Later modifications added data about health and other fringe benefits.  Since about 2003, the ECI sample was merged with a broader group of surveys on employer benefits and payroll costs collectively referred to as the National Compensation Survey (NCS).9

ECI/NCS data are constructed by first choosing establishments in private industry and in state and local governments in the 50 states and the District of Columbia.  Federal government, agriculture, and private household establishments are excluded from the sample.  Then the survey collects information about the costs of employment for up to eight job classifications in each establishment that is surveyed.  The data are aggregated to a job level, rather than collected for individual workers, so that continuity within establishments may be maintained over time as individual workers enter and exit the establishment.  Jobs are sampled proportional to their prevalence at the establishment.  For instance, in a plant which produces coal, separate wage and benefits costs for miners, engineers, and truck drivers may be obtained by the survey, whereas other jobs with fewer employees, such as for accountants and crane operators, may be excluded.  The data we use are nevertheless representative of all workers in the United States as of June of each calendar year.  The exhibits and calculations are presented on an establishment level and include all employees in sampled jobs, including those that are seasonal, part-time, or temporary.  We use data each year from 2005 to 2010.

Because the data are collected from establishments, not firms, firm-level characteristics, e.g. firm size, are not available.  The paper avoids the use of the term firm, although it uses the terms “employer” and “establishment” synonymously although they may not be equal.

The BLS provides survey weights which enable the researcher to calculate statistics which are representative of workers in the United States in a given year.  An adjustment to these weights was made to correct for changes in the composition of industries and occupations in the United States over time.  This adjustment allows for a more accurate comparison of figures over time, but only very marginally affected the results presented in this paper.

BLS researchers impute missing data for hourly values when respondents do not provide sufficient data to calculate them.  5.9 percent of observations were missing a response to the question of whether health insurance was offered to workers holding that particular job.  Rather than impute a value for these observations, for all statistics, these observations were excluded from our sample.  For average hours worked within a particular job, we did impute a value whenever a response was missing.  The method we used was a regression imputation procedure which very closely approximated the mean and variance of the hours worked variable as originally reported by establishments.

The Kaiser Family Foundation obtained access to the ECI/NCS through an agreement with the BLS.  All analyses were performed on site at the BLS headquarters in Washington D.C. from August to October of 2010 by Kaiser Family Foundation staff.

Notes:

1. Kaiser Commission on Medicaid and the Uninsured, “The Uninsured: A Primer,” Kaiser Family Foundation, October 2009. Available online at: http://www.kff.org/uninsured/7451.cfm.

2. Kaiser Family Foundation/Health Research and Educational Trust, “Employer Health Benefits 2010 Annual Survey,” September 2010.  Available online at: http://ehbs.kff.org/.

3. This may be because workers with higher wages can more easily afford to pay more for such benefits, because they have higher marginal tax rates so they benefit more from the tax deduction for employer-paid health insurance premiums, or because they may value health coverage more than lower-wage workers for other reasons.

4. As part of the National Compensation Survey, the Bureau of Labor Statistics collects these data quarterly to develop the Employment Cost Index (ECI) which is designed to measure changes in compensation costs for the civilian workforce.  Other details on how the statistics were derived from the ECI data are reported in the Methodological Appendix at the back of this report.

5. Excluding part-time workers would most likely increase the average wages within an establishment, and the percentage of workers with earnings in excess of $30,000.  Since these establishments are also more likely to be the ones that do not offer benefits, the offer rates for some of the higher wage categories would be more likely to fall.  NCS data did not allow us to exclude seasonal or temporary workers as distinct from part-time workers.

6. Because the annualized Consumer Price Index for 2010 was not available at the date of publication, all dollars are inflated to the CPI-U of August 2010.

7. The NCS initially collects wage data from individual workers, and then aggregates that data into average amounts for particular job classifications.  (See Methodological Appendix for more details).  The numbers shown in Figure 2 are offer rates by the percentage of an establishment’s sampled jobs which have average earnings less than the $30,000 cutoff.  Comparing individual workers’ earnings to such a cutoff was not possible given data availability, but may have changed our results.  The results also depend, obviously, on the choice of cutoff.  The pattern we describe was consistent regardless of whether we used cutoffs of $20,000, $30,000, $40,000, or $50,000.

8. For establishments with less than 10 employees, offer rates were smaller for establishments with less than 75 percent making less than $30,000 (66 and 72 percent) than they were for those where between 75 and less than 90 percent made less than $30,000 (73 percent).

9. More information about the ECI and the NCS is available online at: http://www.bls.gov/ncs/home.htm
Non-Voters and Health Reform: Indifference and Confusion Over the New Law

Published: Nov 10, 2010

The latest Kaiser Health Tracking Poll assessed the role health reform played in voters’1 decisions in the midterm elections and the public’s overall mood towards the health reform law. This blog post focuses on a different group, people who say they are not registered or did not vote in last week’s election, and examines how their views on the health reform law differ from those that said they did vote.

As is usually the case, particularly in midterm elections, the survey found voters are more likely to be older, Republican, college-educated, and white, all of which we’ve found in past surveys to be associated with negative views on health reform. In contrast, non-voters are more likely to be younger, ‘pure independent’, less educated, and non-white.

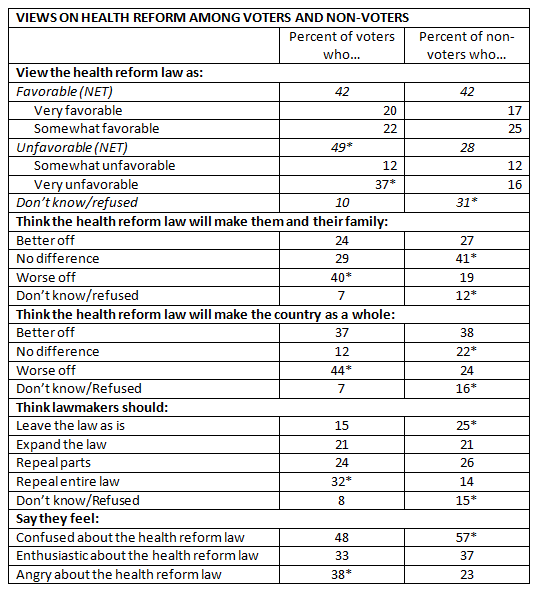
In general, non-voters have less strongly held views, express more confusion about the law, and are more likely to support the status quo than those who say they voted. Almost a third of non-voters declined to offer an opinion of the law (31 percent vs. 10 percent for voters) and a plurality say that it will have no impact on them personally (41 percent), whereas voters tilt more negatively toward the law (42 percent favorable, 49 percent unfavorable), with four in ten saying that they and the country will be worse off under the new law. The differences do not end there – more than half of non-voters feel ‘confused’ about the legislation (57 percent vs. 48 percent for voters) while voters are more likely to feel ‘angry’ (38 percent vs. 23 percent). Non-voters are also more likely to support leaving the law as it is or expanding it (46 percent vs. 36 percent of voters), as opposed to voters who are more likely to favor repealing all or parts of the law (56 percent vs. 40 percent of non-voters).

Policy-insights-healthreform_nonvoters

*indicates statistically significant difference between voters and non-voters

1In this survey, 59 percent of the public overall reported voting in the midterm election, which is much higher than the estimated 41.5 percent of the voting-eligible population that actually turned out to vote. Vote over-reporting is common in public opinion surveys, and is a particular concern for data quality if one party’s supporters over-report at higher rates than the other party’s supporters. The percent who report voting for the Democratic and Republican candidates in this survey (47 percent and 51 percent, respectively) are close to the current estimates of the national vote count of 45 percent Democrat, 52 percent Republican.

Pulling it Together: The People Behind The Entitlement Debate

Published: Nov 9, 2010

Well before we have any clarity on the impact of the election on health reform, the pundits are handicapping the prospects of efforts to make a serious dent in the national debt and deficit.  Three national commissions are hammering out recommendations for reducing the debt and reining in entitlement spending, putting two giant health programs that serve the elderly, disabled and low-income Americans, Medicaid and Medicare, as well as Social Security, in the crosshairs of a new policy debate.

Just yesterday, the Administration’s National Commission on Fiscal Responsibility and Reform, chaired by Erskine Bowles and Alan Simpson, released draft recommendations, with final recommendations due before the end of the year.  Also yesterday, the Peterson-Pew Commission on Budget Reform issued a report recommending changes in budget process rules to help drive down the national debt.  And next week, the Bipartisan Policy Center’s Debt Reduction Task Force, chaired by Pete Domenici and Alice Rivlin, is expected to issue their recommendations.

All three groups are tackling very real challenges.  The national debt has climbed to $13.7 trillion and the federal deficit has reached nearly $1.4 trillion.  Spending on Social Security and mandatory health programs (Medicare, Medicaid and CHIP) account for about 40 percent of the federal budget, and according to CBO, will grow from roughly 10 percent of GDP today to 16 percent in twenty five years, due to the aging of the population and the rising costs of health care. With projections like these few openly support doing nothing, even though how much can actually get through the legislative process remains unclear.

The discussion of these issues is framed almost always in terms of “hard choices” to reduce spending, increase taxes, or both.  On the spending side of the ledger, many say the hard choices won’t be made because of political realities, including strong resistance from seniors to any changes to Medicare or Social Security.  The mid-term election was just the most recent example illustrating the importance of senior voters. In general, Democrats will resist cuts in these programs and Republicans will resist any new taxes.

But these choices are also hard on legitimate policy grounds, especially when it comes to Medicare.  And the most important reason they are hard is that so many seniors and disabled people on Medicare have low incomes and already pay a significant share of those incomes for their health care today.  It will be difficult if not impossible to ask the majority of beneficiaries to pay more or make do with less.  That has been the missing element in the entitlement/deficit reduction debate: Warren Buffet is not the typical Medicare beneficiary.  Instead the prototype is an older woman with multiple chronic illnesses living on an income of less than $25,000 who spends more than 15 percent of her income on health care.  It is the people on these programs and the realities of their lives that have been left out of the discussion.

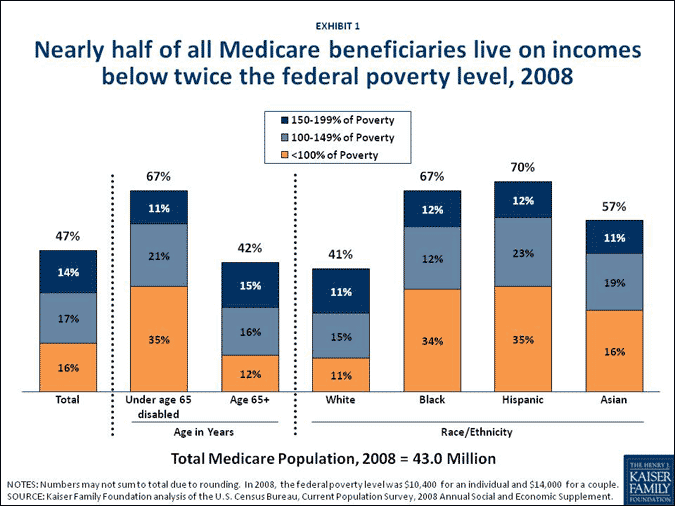
Nearly half (47%) of all elderly and disabled people on Medicare have incomes below twice the federal poverty level (less than $20,800 for an individual and $28,000 for a couple in 2008). Poverty rates are even higher among women, African American and Latino Medicare beneficiaries.  And two-thirds of the 8 million disabled people on Medicare who are under age 65 have incomes below twice the poverty rate; beneficiaries with disabilities face more serious access problems than others on the Medicare program.

PIT-Exhibit1.gif

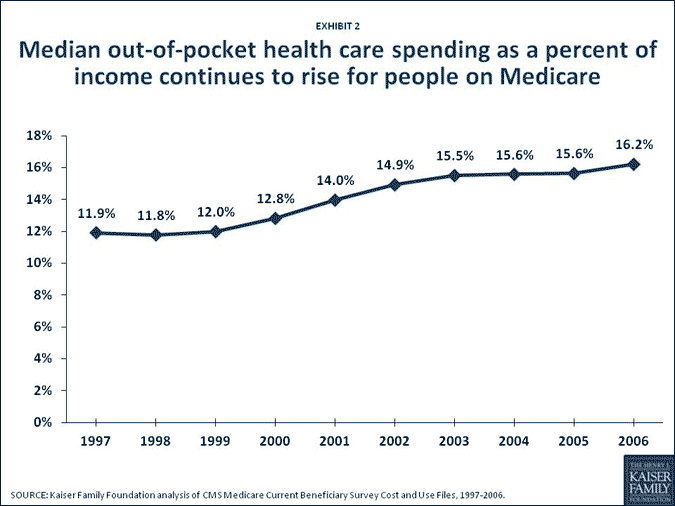
People on Medicare also already spend a much larger share of their household budgets on health care than the non-elderly do: about 14 percent compared to 4 percent in 2006.  And according to our analysis, median out-of-pocket health spending for the elderly and disabled on Medicare as a share of income has been rising, from about 12 percent in 1997 to more than 16 percent in 2006 — with even higher rates for those living below the poverty level (21%) and among those between 100-200 percent of poverty (23%).

Exhibit2_2.gif

Some “hard choices” to be considered may not affect the most vulnerable elderly and disabled, for example proposals that ask higher-income seniors to pay more. The health reform law has already moved further in this direction by increasing the number of higher-income beneficiaries who will pay higher Medicare premiums.  Additional efforts to raise costs for higher-income beneficiaries could stir up strong political opposition.  Some old ideas may need to be re-evaluated in a post health reform world.  For example, proposals to save money by pushing back the retirement age for Medicare to 67 may save money for Medicare, but may not make as significant a dent in federal spending as once envisioned if the 65 and 66 year olds with incomes below 400 percent of poverty become eligible for government tax credits, or for Medicaid, under health reform.One of the biggest issues likely to emerge is where to draw the line in terms of who should be asked to pay more if policies slow the growth in Medicare by shifting costs to beneficiaries, either directly or indirectly.  Who is wealthy enough to pay more?  Are adequate protections in place to shield seniors with modest incomes from financial hardship and cost-related access problems?  Legislators took one cut at this apple in health reform.  The recently enacted health reform law established premium subsidies to limit the financial burden on families with incomes up to 400 percent of the poverty line.  The leaders participating in the different debt and deficitreduction commissions and the experts assisting them are certainly aware ofthese challenges, although they have not really been part of the public discussionto date.If new policies are proposed to rein in entitlement spending and reduce the deficit, it seems only reasonable to include the following criterion among others for evaluating proposals: do no harm to the financial security or access to care for elderly and disabled beneficiaries living on low and modest incomes.  Indeed, given the high out-of-pocket costs these groups have, and the large share of their incomes they already pay for health care, a comprehensive approach might well seek to improve circumstances for these most vulnerable groups, while also advancing “hard choices” for entitlement programs to reduce the deficit.

Kaiser November Tracking Poll Finds Health Care a Factor in Congressional Election, But Not a Dominant One

Published: Nov 9, 2010

This month’s Kaiser Health Tracking Poll, conducted during the four days following the mid-term election, asked voters in an open-ended question to name in their own words the biggest factors influencing their vote for Congress, and found that health care was a factor, but not a dominant one. Among all voters, the factor mentioned most often was the economy/jobs (29%). The next two most mentioned factors were party preference (25%) and views of the candidates themselves (21%). Health care was the fourth most mentioned factor at 17 percent.

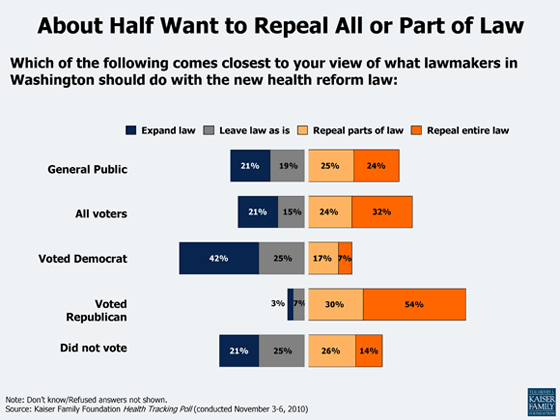
The general public remains split about what lawmakers should do with the health reform law, with 21 percent wanting to see lawmakers expand the law, 19 percent wanting to leave the law as is, a quarter wanting to repeal parts of the law, and nearly a quarter (24%) wanting to see the entire law repealed. However, among those who support repeal of all or parts of the law, a majority want to keep key provisions tested in the poll, except the individual mandate and the Medicare payroll tax increase. Solid majorities of supporters of repeal would like to keep tax credits for small businesses offering coverage (68%), the prohibition on insurance companies from denying coverage based on medical history or health condition (62%), the gradual closing of the Medicare prescription drug “doughnut hole” (60%), and financial subsidies to low and moderate income Americans to help purchase coverage (55%).

Policy-insights-About_Half_Want_to_Repeal_All_or_Part_of_Law
Poll Finding

West vs. South: Regional Differences in Views of the Health Reform Law

Published: Nov 1, 2010

This Data Note examines regional variations in public opinion of the health reform law based on the November 2010 Kaiser Health Tracking Poll. The analysis takes a special look at the Western and Southern regions of the country, where many states are likely to see the biggest increases in coverage under the law, and which stand to be disproportionately eligible for federal Medicaid funds. Despite these similarities in how the two regions might be affected, the Data Note finds broad differences in how residents of these regions are reacting to the law.

Data Note (.pdf)

November 2010 Health Tracking Poll

Poll Finding

Health Reform and the Tea Party Movement

Published: Oct 30, 2010

With much media discussion of the role that the Tea Party will play in the upcoming Congressional midterm elections, this data note takes a closer look at Tea Party supporters using the most recent Health Tracking Poll data from September.

While 57 percent of voters who do not support the Tea Party movement view the health reform law “very” or “somewhat” favorably, 57 percent of Tea Party supporters view the law “very” unfavorably, and another 11 percent “somewhat unfavorably.” At the same time, nearly two-thirds (63 percent) of Tea Party supporters say they feel “angry” about health reform, even though most (82 percent) of these say their anger is more widely targeted at Washington as a whole rather than specific to the reform law.

Data Note (.pdf)

Medicare Chartbook, 2010

Published: Oct 30, 2010

This chartbook provides the most recent and reliable data available about the Medicare program and the 47 million seniors and younger people with disabilities who get health insurance coverage through the program.

Topics covered include: Medicare beneficiaries; the program’s benefits, utilization, and access to care; prescription drugs; the Medicare Advantage program; the role of Medicaid for Medicare beneficiaries; supplemental insurance coverage; out-of-pocket spending; and Medicare spending and financing.

Printable Chartbook (.pdf)

Poll Finding

Kaiser Health Tracking Poll — October 2010

Published: Oct 18, 2010

With the November midterm elections just weeks away, Americans remain chronically divided over the Patient Protection and Affordable Care Act, but most say that their feelings – pro and con – about the health reform law are not a dominant factor in how they will vote for Congress or whether they will go to the polls.

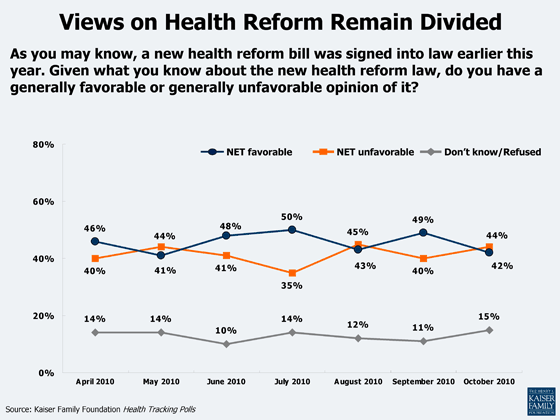
Views on health reform tightened up in October, with 42 percent saying they have favorable views of the new law, 44 percent holding unfavorable views and 15 percent not offering an opinion. This continues a familiar pattern seen over many months in which positive and negative views of the new law move within a relatively narrow band, reflecting a very divided public.

The October poll is the latest in a series designed and analyzed by the Foundation’s public opinion research team.

Findings (.pdf)

Chartpack (.pdf)

Toplines (.pdf)

New Tracking Poll Finds Americans Remain Divided Over Health Law

Published: Oct 18, 2010

With the November midterm elections just weeks away, Americans remain chronically divided over the Patient Protection and Affordable Care Act, but most say that their feelings – pro and con — about the health reform law are not a dominant factor in how they will vote for Congress or whether they will go to the polls, according to the new Kaiser Health Tracking Poll.

Views on health reform tightened up in October, with 42 percent expressing favorable views, 44 percent unfavorable views and 15 percent not offering an opinion. Likely voters are somewhat more negative: 39 percent hold favorable views of the new law, 49 percent hold unfavorable ones. Overall, this continues a now familiar pattern in which positive and negative views of the new law move within a relatively narrow band, reflecting a very divided public. In October, 28 percent said they would support immediate repeal of the law, similar to last month.

No matter what their views on the issue, however, health reform does not appear to be the main issue for most voters as we head into the November elections. Asked to name the most important issue in their vote for Congress, the economy tops voters’ list, named by just over a third (35 percent). Behind that are health reform and dissatisfaction with government, each named by 10 percent. In general, voters are twice as likely to say that the direction of the nation as a whole is more important to their vote than any specific national issue (35 percent vs. 16 percent), with another 21 percent saying their vote will turn on state or local matters and 23 percent saying they will focus more on the specific candidates.

Policy-insights-oct_tracking_poll_560pixels

KFF Explores Health Reform and the Tea Party Movement

Published: Oct 12, 2010

With much media discussion of the role that the Tea Party will play in the upcoming congressional midterm elections, the Kaiser Family Foundation took a closer look at Tea Party supporters using its most recent Health Tracking Poll data from September. While 57 percent of voters who do not support the Tea Party movement view the health reform law favorably, 57 percent of Tea Party supporters view the law “very” unfavorably, and another 11 percent “somewhat unfavorably.” At the same time, nearly two-thirds (63 percent) of Tea Party supporters say they feel “angry” about health reform, even though most (82 percent) of these say their anger is more widely targeted at Washington as a whole rather than specific to the reform law. Republican Tea Party supporters show a more intense opposition to the health reform law than their fellow Republicans who don’t back the Tea Party; in the latter group, 42 percent have intensely negative views of the law, compared to 70 percent of Tea Party Republicans.