KFF designs, conducts and analyzes original public opinion and survey research on Americans’ attitudes, knowledge, and experiences with the health care system to help amplify the public’s voice in major national debates.
This brief profiles several Georgia residents who have participated in the state’s Money Follows the Person demonstration program, which helps transition people from institutional long-term care back into their homes or the community. It is part of a larger package of resources examining the Money Follows the Person program.
The adoption of new eligibility and enrollment requirements under the Affordable Care Act (ACA) provides states and the federal government an important opportunity to implement a meaningful set of performance measures for eligibility and enrollment systems. Performance measures could be used at the federal level to assess state performance in meeting the ACA’s eligibility and enrollment goals, while states could use measures for program management and quality improvement. This brief seeks to inform the development of performance measures for eligibility and enrollment systems under health reform by presenting a list of potential performance measures and identifying key issues and tradeoffs to consider in selecting and developing measures.
This brief reports on a case study of Georgia’s Money Follows the Person (MFP) demonstration program, describing key features of the program and highlighting recent program experiences. The Georgia Department of Community Health (DCH) implemented the program in September 2008.
In 2005, before the demonstration began, Georgia’s long-term care expenditures were $1.5 billion, with 70 percent devoted to institutional long-term care and 30 percent on home and community-based services (HCBS). One goal of the demonstration was to increase the share of dollars going toward HCBS to over 40 percent by the end of December 2011. Through MFP, Georgia has achieved a 2 percent growth in annual spending on home and community-based services as of December 31, 2010. With the extension of MFP under the Affordable Care Act, the state plans to continue the program through 2016. By that time, Georgia hopes to transition more than 2,000 individuals from institutions back to the community with the help of over $93 million in enhanced federal matching funds.
This issue brief examines changes in health insurance coverage over the last decade, with a focus on how changes in the economy, particularly during the “Great Recession” of 2007 to 2009, have affected coverage and the number of uninsured. The paper finds that the number of uninsured grew substantially during the first recession of the decade, increasing by 5 million people from 2000 to 2004; increased more slowly during the brief recovery, growing by 2.1 million people from 2004 to 2007; and then again rose significantly during the Great Recession, rising by 5.7 million people since 2007.
The paper also finds that coverage, especially for children, through the Medicaid and Children’s Health Insurance Programs helped to prevent even more people from being uninsured. While the number of uninsured children declined in recent years, the number of uninsured adults rose. The only notable drop in uninsured adults was for young adults ages 19-25 in 2010, most likely due to the provision of the health reform law that permits young adults to stay on their parents’ insurance. The paper also considers trends in coverage by work status, race and ethnicity, citizenship status and geographical region.
This paper compares the payroll and benefit compensation of workers that had access to employer-sponsored health benefits at work to that of workers who did not have an insurance offer. Surveys of employers indicate that smaller and lower wage firms are less likely to offer health benefits to workers, but do not provide detailed information about wage and benefit differences for workers with and without an offer of health benefits working in different settings.1 In this Snapshot, we use information from a nationally representative survey of workers to provide a fuller picture of the compensation for workers with health coverage access at their job compared to those without such access by firm size and occupation. We also assess trends over time. This study updates our earlier snapshot published in 2008.
Our analysis is based on data from the National Compensation Survey (NCS), which is a nationwide survey of labor costs in private and public establishments conducted quarterly by the Bureau of Labor Statistics (BLS).2 The data offer comparisons between 1999 and 2011. Details about the NCS and our analysis are available in a methodological appendix at the end of this analysis. Worker compensation is divided into three categories: payroll costs, fringe benefit costs excluding employer payments for health insurance, and employer payments for health insurance. Differences in compensation between workers with and without access to health benefits are compared with regard to payroll and non-health fringe benefits.
Definitions of key terms:
Payroll costs include employer payments for wages, salary, overtime, vacation, holiday, sick days, bonus, and other cash compensation to employees, but exclude severance payments and unemployment benefits.
Employer costs for health benefits include all employer payments for health coverage and exclude employee contributions to premiums or out-of-pocket medical cost-sharing.
Non-health fringe benefits include employer payments for life and short-term disability insurance, defined benefit and defined contribution pension plans, worker’s compensation, and Social Security and Medicare payroll taxes.
Total compensation is defined as the sum of payroll and all fringe benefit costs including health.
Establishment size is the number of employees at a selected plant or office. Firms may be made up of one or more establishments.
Compensation Levels
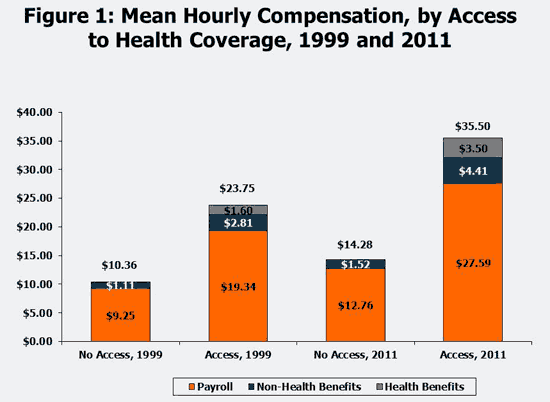
Employees with relatively high wages are more likely to have access to employer-provided health benefits. Employees in establishments with access to health benefits, on average, receive more than twice as much in payroll and non-health benefit compensation as employees who do not have access to health benefits at work (Figure 1). When employer costs for health benefits are added to compensation for workers who have access (i.e., total compensation), the difference between these groups grows. In 2011, employees with access to health benefits had total compensation averaging $35.50 per hour, compared with $14.28 for employees without access. The gap has been widening. From 1999 to 2011, the real percentage change in total compensation for workers with access was about 10.3 percent compared to 1.7 percent for those without access.3
Source: Kaiser Family Foundation calculations based on data from the National Compensation Survey, 1999 and 2011, conducted by the Bureau of Labor Statistics.
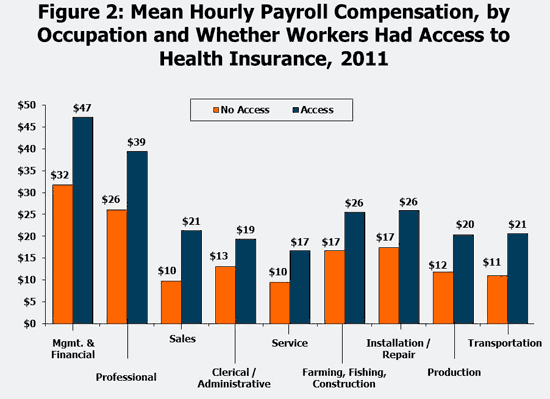
Workers with access to health benefits are disproportionately in higher paid occupations, although we still find significant differences in average payroll compensation within occupation categories for workers with and without access (Figure 2). (We focus on payroll compensation for the remainder of this section because it is by far the largest portion of total compensation). Large differences in average hourly payroll compensation were found for workers with and without access to health benefits in all nine of the selected occupation categories, with a range of average hourly payroll costs, in 2011 (Figure 2). Some of the most notable differences occurred in the more highly paid professional and executive management occupation categories.
Source: Kaiser Family Foundation calculations based on data from the National Compensation Survey, 2011, conducted by the Bureau of Labor Statistics.
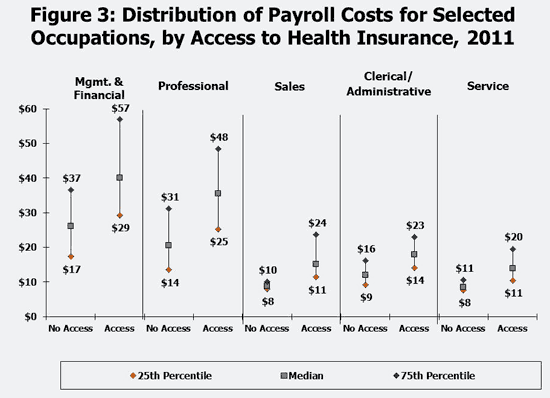
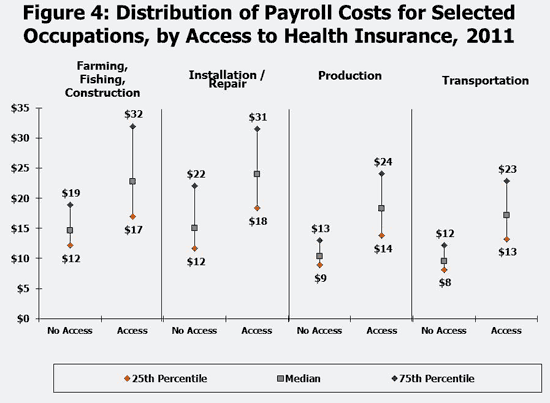
Because a wide variety of jobs can be captured even within a single occupation category, particularly for occupations like the sales, professional, and management categories, we assessed how payroll compensation is distributed within occupation categories. Figures 3 and 4 show the 25th percentile, median (or midpoint), and 75th percentile of payroll for workers with and without access to health benefits within each of the nine occupation categories in 2011. 4 For example, looking at workers with access to health benefits in the service occupation, 25 percent had payroll compensation at or below $11, one half had payroll compensation equal to or less than $14, and 75 percent had payroll compensation at or below $20. In contrast, for service workers without access to health benefits at work, a quarter had hourly payroll compensation at or below $8, one half had hourly payroll compensation at or below $9 and only one quarter had hourly payroll compensation above $11. This is a lower and narrower range than is seen for service workers with access to health benefits. Large shares of workers without access to health benefits have relatively low payroll compensation when compared to workers within the same occupations with access to health benefits. In fact, for several of these occupations, the payroll compensation at the 25th percentile for those with access was near the 75th percentile for those without access.
Source: Kaiser Family Foundation calculations based on data from the National Compensation Survey, 2011, conducted by the Bureau of Labor Statistics.
Source: Kaiser Family Foundation calculations based on data from the National Compensation Survey, 2011, conducted by the Bureau of Labor Statistics.
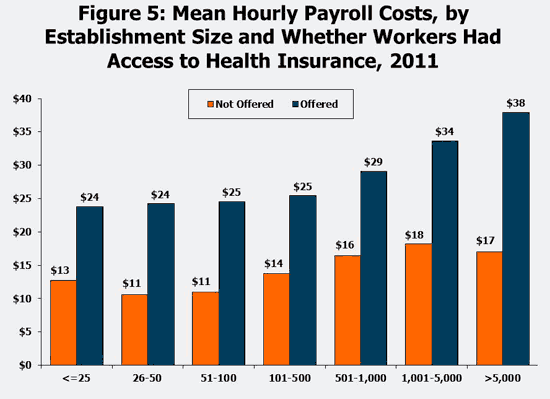
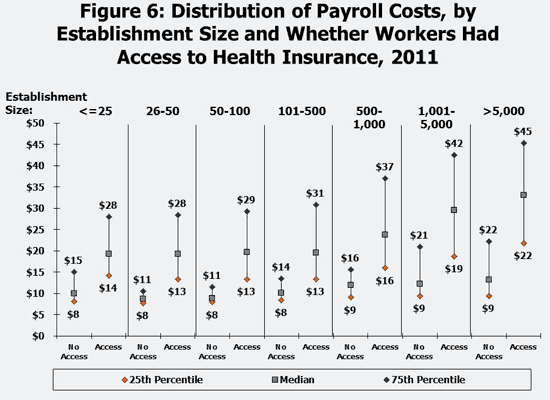
A similar pattern emerges when payroll compensation for workers with and without health benefit access is looked by the size of the establishments where they work. Average payroll compensation is much higher for workers with health insurance access than for workers without offers across all establishment sizes (Figure 5). The distributions for payroll compensation for workers with and without access by establishment size confirms that most workers with access have much higher payroll compensation than the majority of workers without access (Figure 6). For workers without access to employer health insurance, there is a noticeably lower and smaller variation in payroll compensation. In three out of the seven establishment size categories analyzed here, the 25th percentile of payroll for workers with access exceeded the 75th percentile of payroll for workers without access. 5
Source: Kaiser Family Foundation calculations based on data from the National Compensation Survey, 2011, conducted by the Bureau of Labor Statistics.
Source: Kaiser Family Foundation calculations based on data from the National Compensation Survey, 2011, conducted by the Bureau of Labor Statistics.
Changes in Compensation
Health benefit costs grew rapidly from 1999 to 20116, so we might expect, all other things being equal, payroll and non-health benefit compensation to have grown more slowly for those with access to health benefits than for those without access. Since workers with health benefit access saw a greater share of their compensation shifted to health benefits over the period7, in theory, this relative growth in the health benefit costs should be offset by a reduction in the growth of payroll and non-health benefits. At the same time, the compensation of workers without health insurance access is not directly affected by the rapid rise in health benefit costs, so changes in their total compensation should rise with other factors, such as their overall productivity.
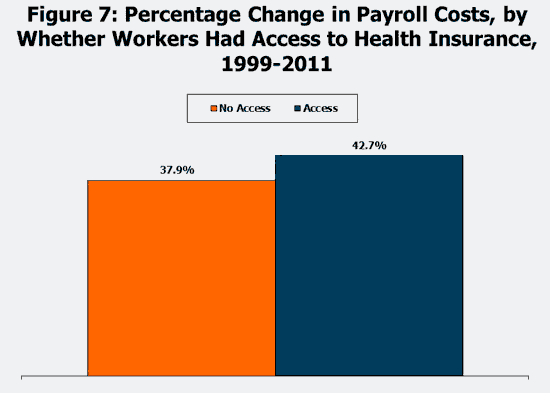
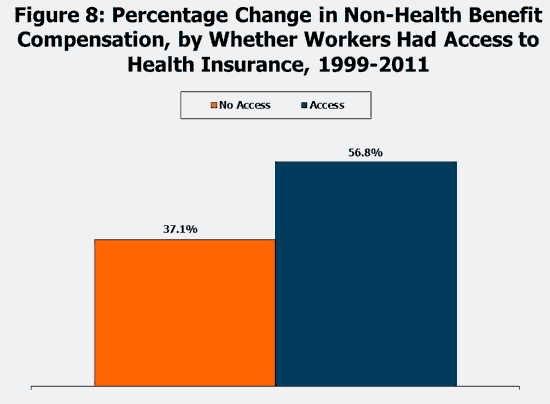
Despite the relatively rapid growth in health benefit costs over the period, we find that workers with access to health benefits appeared to have slightly higher compensation increases over the period (Figures 7 and 8) than workers without access to health benefits. A possible explanation is that average productivity grew faster over the period for workers with health benefit access than for workers without access. If this were the case, then we would not expect that changes in total compensation growth over the period to be the same for workers with and without access (because workers with health benefit access on average would be more valuable over time). 8
Note: Numbers not adjusted for inflation.Source: Kaiser Family Foundation calculations based on data from the National Compensation Survey, 1999-2011, conducted by the Bureau of Labor Statistics.
Note: Numbers not adjusted for inflation.Source: Kaiser Family Foundation calculations based on data from the National Compensation Survey, 1999-2011, conducted by the Bureau of Labor Statistics.
Discussion
We show a substantial gap in compensation between workers with and without health benefit access from the establishments where they work. Workers with access to employer health benefits receive much higher total compensation, payroll compensation, and non-health benefit compensation. The substantial gaps in payroll compensation generally hold up when the data is divided by establishment size and worker occupation.
This paper offers insight into the diversity of the workforce and the compensation differences for workers with and without access to health benefits at work. Understanding these differences should assist policymakers implementing various provisions of the Affordable Care Act that affect employer-based coverage, including decisions about how much coverage employers must offer their workers under the new employer-responsibility requirements and the extent to which employers can offer different benefits to workers in different situations (nondiscrimination rules). The information also provides a useful baseline to help assess the impact of health reform on workers’ compensation across industries and pay levels over time.
This paper was prepared by Gary Claxton and Anthony Damico of the Kaiser Family Foundation’s Health Care Marketplace Project, and is an update to an analysis originally published in 2008. Paul Jacobs, who formerly worked in that division, helped to prepare the prior version.
Methodological Appendix
The Employment Cost Index (ECI) is a nationwide survey of labor costs in private and public establishments conducted quarterly by the Bureau of Labor Statistics (BLS). The ECI was developed in the mid-1970s to track changes in the costs of employment. Later modifications added data about health and other fringe benefits. Since about 2003, the ECI sample was merged with a broader group of surveys on employer benefits and payroll costs collectively referred to as the National Compensation Survey (NCS).7
ECI/NCS data are constructed by first choosing establishments in private industry and in state and local governments in the 50 states and the District of Columbia. Federal government, agriculture, and private household establishments are excluded from the sample. Then the survey collects information about the costs of employment for up to eight job classifications in each establishment that is surveyed. The data are aggregated to a job level, rather than collected for individual workers, so that continuity within establishments may be maintained over time as individual workers enter and exit the establishment. Jobs are sampled proportional to their prevalence at the establishment. For instance, in a plant which produces coal, separate wage and benefits costs for miners, engineers, and truck drivers may be obtained by the survey, whereas other jobs with fewer employees, such as for accountants and crane operators, may be excluded. The data we use are nevertheless representative of all workers in the United States as of June of each calendar year. The exhibits and calculations are presented on a per-worker-hour basis and include all employees in sampled jobs, including those that are seasonal, part-time, or temporary. We use data each year from 1999 to 2011.
Readers also should be aware that employer costs for benefits in a job classification are averaged over all of the workers in that job classification, even if workers do not participate in the benefit. As examples, employees offered health benefits may choose not to take them up and new employees may face an exclusion period before they are eligible for benefits from the employer. Thus, differences in employer costs across job classifications or over time may to some extent reflect different participation rates for workers and their dependents.
Hourly costs for payroll and health insurance are provided by the Bureau of Labor Statistics and we used these estimates because they adjust for differences in the number of hours worked annually among employees. Hourly cost of payroll was calculated by combining hourly costs for wages, overtime, vacation pay, sick pay, as well as bonuses and other paid leave. Because the data are collected from establishments, not firms, firm-level characteristics, e.g. firm size, are not available. The paper avoids the use of the term firm, although it uses the terms “employer” and “establishment” synonymously although they may not be equal.
The BLS provides survey weights which enable the researcher to calculate statistics which are representative of workers in the United States in a given year. An adjustment to these weights was made to correct for changes in the composition of industries and occupations in the United States over time. This adjustment allows for a more accurate comparison of figures over time, but only very marginally affected the results presented in this paper.
BLS researchers impute missing data for hourly values when respondents do not provide sufficient data to calculate them. In 2011, 8.5 percent of observations were missing a response to the question of whether health insurance was offered to workers holding that particular job. Rather than impute a value for these observations, for all statistics, these observations were excluded from our sample.
The Kaiser Family Foundation obtained access to the ECI/NCS through an agreement with the BLS. All analyses were performed on site at the BLS headquarters in Washington D.C. during September 2011 by Kaiser Family Foundation staff.
Appendix
This appendix contains the distribution of payroll cost data for selected occupations or establishment size, including 25th percentile, median, and 75th percentile. The tables below correspond with Figures 3, 4, and 6.
Table 3a: Distribution of Payroll Costs for Selected Occupations, by Access to Health Insurance, 2011
Access to Health Insurance
25th Percentile
Median
75th Percentile
Mgmt. & Financial
No Access
$ 17.34
$ 26.10
$ 36.53
Access
$ 29.32
$ 40.05
$ 57.08
Professional
No Access
$ 13.50
$ 20.53
$ 31.18
Access
$ 25.32
$ 35.56
$ 48.48
Sales
No Access
$ 8.00
$ 8.79
$ 10.06
Access
$ 11.45
$ 15.07
$ 23.69
Clerical/Administrative
No Access
$ 9.27
$ 12.00
$ 16.13
Access
$ 14.14
$ 17.91
$ 23.01
Service
No Access
$ 7.63
$ 8.52
$ 10.52
Access
$ 10.50
$ 13.90
$ 19.57
Source: Kaiser Family Foundation calculations based on data from the National Compensation Survey, 2011, conducted by the Bureau of Labor Statistics.
Table 4a: Distribution of Payroll Costs for Selected Occupations, by Access to Health Insurance, 2011
Access to Health Insurance
25th Percentile
Median
75th Percentile
Farming, Fishing, Construction
No Access
$ 12.17
$ 14.66
$ 18.89
Access
$ 16.96
$ 22.73
$ 31.97
Installation / Repair
No Access
$ 11.65
$ 15.00
$ 22.05
Access
$ 18.39
$ 23.97
$ 31.49
Production
No Access
$ 8.92
$ 10.32
$ 13.00
Access
$ 13.77
$ 18.33
$ 24.10
Transportation
No Access
$ 8.16
$ 9.50
$ 12.14
Access
$ 13.24
$ 17.19
$ 22.90
Source: Kaiser Family Foundation calculations based on data from the National Compensation Survey, 2011, conducted by the Bureau of Labor Statistics.
Table 6a: Distribution of Payroll Costs, by Establishment Size and Whether Workers Had Access to Health Insurance, 2011
Access to Health Insurance
25th Percentile
Median
75th Percentile
<= 25 Employees
No Access
$ 8.12
$ 10.03
$ 15.00
Access
$ 14.25
$ 19.25
$ 27.96
26-50 Employees
No Access
$ 7.77
$ 8.69
$ 10.56
Access
$ 13.41
$ 19.31
$ 28.38
50-100 Employees
No Access
$ 7.97
$ 8.91
$ 11.48
Access
$ 13.41
$ 19.65
$ 29.29
101-500 Employees
No Access
$ 8.47
$ 10.16
$ 13.50
Access
$ 13.37
$ 19.56
$ 30.86
501-1,000 Employees
No Access
$ 9.11
$ 12.02
$ 15.63
Access
$ 16.03
$ 23.78
$ 37.06
1,001-5,000 Employees
No Access
$ 9.44
$ 12.28
$ 20.90
Access
$ 18.73
$ 29.51
$ 42.45
>5,000 Employees
No Access
$ 9.46
$ 13.15
$ 22.18
Access
$ 21.85
$ 33.06
$ 45.29
Source: Kaiser Family Foundation calculations based on data from the National Compensation Survey, 2011, conducted by the Bureau of Labor Statistics.
Notes:
A worker is considered to have access to employer health benefits as long as their employer offers health benefits to at least one worker within the group to which the worker belongs. In this paper, we use the term access rather than offer since the numbers are calculated at the worker level. Also, worker access to health benefits does not necessarily imply they are eligible to receive those benefits. Some employers may offer benefits to a group of workers, but these workers may not be eligible to receive those benefits until certain criteria, such as a waiting period after being hired, are met.
As part of the National Compensation Survey, the Bureau of Labor Statistics collects these data quarterly to develop the Employment Cost Index (ECI) which is designed to measure changes in compensation costs for the civilian workforce. Other details on how the statistics were derived from the ECI data are reported in the Methodological Appendix in this report.
This reflects an adjustment for inflation of 35 percent over the period.
The medians not shown in Figures 3 and 4 can be found in the Appendix in Table 3a and Table 4a, respectively.
The medians not shown in Figure 6 can be found in the Appendix in Table 6a.
The much lower compensation received by workers without offers compared to that received by workers with offers suggests that workers without offers are much less skilled, and that it would not be surprising if their “value” to their employers grew more slowly than higher paid workers. To our knowledge, there have been few studies dealing with how productivity increases may drive differences in total compensation by whether a worker has access to health insurance. This may be because worker productivity is difficult to measure and compare, which often leads researchers to study productivity as a residual, unmeasured, element of changes in total compensation. Several studies which touch upon this issue include: Ezekiel J. Emanuel and Victor R. Fuchs, “Who Really Pays for Health Care? The Myth of ‘Shared Responsibility,’” The Journal of the American Medical Association, vol. 299, no. 9, March 2008, pp.1057-1059; Dana P. Goldman, Neeraj Sood, and Arleen A. Leibowitz, “The Reallocation of Compensation in Response to Health Insurance Premium Increases,” NBER Working Paper 9540, March 2003; Hae-shin Hwang, W. Robert Reed, and Carlton Hubbard, “Compensating Wage Differentials and Unobserved Productivity,” The Journal of Political Economy, vol. 100, no. 4, August 1992, pp. 835-858; and Steven F. Lehrer and Nuno Sousa Pereira, “Worker Sorting, Compensating Differentials and Health Insurance: Evidence From Displaced Workers,” NBER Working Paper 12951, March 2007.
This fact sheet summarizes the Texas health care landscape, including data on demographics, population health, the uninsured and the state Medicaid program.
This fact sheet compares and contrasts key provisions of the California and Texas Section 1115 Medicaid demonstration waivers. The Texas waiver, approved in December 2011, is modeled, in part, on the California waiver, which has been underway in that state since November 2010. Both waivers affect hundreds of thousands of Medicaid beneficiaries, involve billions of federal Medicaid matching funds, and are designed, in part, to promote changes in the health care delivery system that will result in better care for individuals, better population health, and reductions in costs through system improvements. They have a number of key similarities and differences as summarized in the side-by-side table within this fact sheet. These 5-year demonstrations are approved under section 1115 of the Social Security Act, which authorizes the Secretary of Health and Human Services to waive certain federal Medicaid requirements to enable states to conduct demonstrations with federal Medicaid funds.
As the world marks World AIDS Day (December 1) in this 30th year of the epidemic, Greater Than AIDS announces scaled up partnerships and collaborative efforts with leading media and other corporate allies, community organizations, and state and local health departments to increase knowledge and understanding about HIV/AIDS in America, encourage actions to prevent its spread, and reduce the stigma surrounding the disease.
“HIV isn’t what it was 30 years ago. We have the power to end it,” said Tina Hoff, Senior Vice President and Director, Health Communication and Media Partnerships, Kaiser Family Foundation, which provides strategic guidance and day-to-day management for Greater Than AIDS. “Greater Than AIDS leverages the resources of the public and private sector to connect those most in need with information and services.”
Phill Wilson, President and CEO of the Black AIDS Institute, co-founding Greater Than AIDS partner, commented, “30 years of AIDS is enough. We have the tools to end the AIDS epidemic. It only requires each of us doing our part. I am proud that SiriusXM Radio, OUT Magazine, Walgreens and our other partners and collaborating organizations have stepped up to do their part.”
Among the announcements from Greater Than AIDS today:
SiriusXM encourages open discussion on air, offers resources online: SiriusXM is teaming up with Greater Than AIDS to raise awareness and offer resources to millions of people across the country with special programming throughout the year on SiriusXM OutQ, the nation’s first and only 24/7 LGBT radio channel, and African-American issues talk channel The Power. These channels will provide an open forum for medical experts, pioneering activists and listeners to share their stories and perspective on the continued battle against HIV/AIDS, and to debate and discuss the state of the progress in the LGBT and African-American communities and beyond. Information, resources and tips/advice on where people can find help in their community are available online.
OUT Magazine Partners on New HIV/AIDS Guide for Gay Men: Greater Than AIDS and OUT Magazine have teamed up to produce an in-book, 8-page informational guide on HIV/AIDS for gay and bisexual men for distribution in the December 2011 / January 2012 double issue of the magazine. The co-branded guide is part of a broader corporate commitment by OUT Magazine’s parent company, HERE Media, to Greater Than AIDS, which has included more than $500,000 worth of donated media placement since October 2010 across OUT, The Advocate, HIV Plus, and gay.com, as well as a jointly branded online information portal at: www.gay.com/greaterthan“I am pleased that OUT has teamed up with the national Greater Than AIDS movement to reinvigorate our community’s response,” said Aaron Hicklin, editor-in-chief of OUT Magazine. “Together, we aim to get out information, confront stigma, and rally support around this preventable and treatable disease.”
Walgreens Encourages Customers to be Greater Than AIDS: Walgreens, the nation’s largest drug store chain with more than 7.500 stores in all 50 states, Washington, D.C. and Puerto Rico, is teaming with Greater Than AIDS to place new in-store signage, radio and pharmacy receipt messages and other informational resources in more than 550 stores in heavily affected areas throughout December. During the week encompassing World AIDS Day, Walgreens will also showcase Greater Than AIDS messaging on the company’s digital billboard at One Times Square — the nation’s largest — that rises 341 feet above midtown Manhattan. Since launching a collaboration on World AIDS Day 2010, Walgreens and Greater Than AIDS have distributed more than 600,000 co-branded Greater Than AIDS products in over 550 Walgreens stores across 250 cities. Additionally, Walgreens teamed up with Greater Than AIDS and EBONY magazine to distribute more than 2.4 million HIV/AIDS information guides to EBONY readers and community organizations across the country. More information is available at:www.greaterthan.org/walgreensOur pharmacists are listening to concerns, developing important relationships and putting community pharmacy in a great position to be even more effective and relevant to those with chronic conditions, wherever they live,” said Walgreens pharmacy, health and wellness division president Kermit Crawford. “And we are certainly proud to continue our work with Greater Than AIDS in distributing information and providing additional services and resources to the areas that are impacted by HIV and AIDS.”
Medical Students Make HIV/AIDS a Priority: The Student National Medical Association (SNMA), the oldest and largest student-run organization focused on the needs and concerns of medical students of color, has joined the Greater Than AIDS coalition. Together, SNMA and Greater Than AIDS will work to educate the association’s more than 6,000 members (including medical and pre-med students, residents and practicing physicians) on HIV/AIDS , including the importance of discussing and encouraging HIV testing between providers and patients; expose SNMA members to careers in HIV/AIDS primary care and infectious disease; promote cultural competency amongst SNMA members in HIV/AIDS care; and engage SNMA chapters in community service events focused on HIV/AIDS. The partnership builds on the SNMA’s long history of service to underserved communities.“For over 47 years, the Student National Medical Association has worked to address the needs of underserved communities. The HIV/AIDS epidemic is affecting these communities in such a disproportionate way that we cannot be silent in this area,” said SNMA National President Michael G. Knight. “By partnering with the Greater Than AIDS campaign, our members will work to become the leaders and change agents that our patients, neighbors and families can depend on to address this vital issue.”
Special World AIDS Day Messaging: Several Greater Than AIDS partners are planning special promotions to mark World AIDS Day: CBS Outdoor will feature Greater Than AIDS PSAs on its network of 140 digital billboards in 30 markets nationwide on December 1st. American Urban Radio Networks and Radio One local and nationally syndicated programs such as The Russ Parr Morning Show and The Doug Banks Show are dedicating airtime to HIV/AIDS on World AIDS Day as part of the companies’ broader commitment to the campaign. These radio programs will run PSAs, post information on station websites and social media, and conduct interviews with Greater Than AIDS ambassadors. The National Basketball Association’s D-League teams in Eerie, PA, Hidalgo, TX, and Boise, ID are integrating special Greater Than AIDS promotions into their games on December 1, including in-arena signage, giveaways and social media cross promotions.
Hundreds of community organizations from San Francisco to Philadelphia are integrating Greater Than AIDS messages into World AIDS Day events with free informational materials and interactive activities from the campaign.
Since the campaign’s launch in 2009, an unprecedented coalition of media has joined together to support Greater Than AIDS. More than 10,500 national TV PSA airings have been placed by FOX, BET, Logo, and NBA TV, and more than 20,800 local TV PSA airings have been placed by CBS, NBC, and Google TV stations, representing a total of 260 hours of airtime. More than 52,800 radio PSA airings have been placed by American Urban Radio Network, Clear Channel Radio, CBS Radio, Emmis Communications, and Radio One, amounting to approximately 400 hours of airtime. More than 15,000 outdoor postings have been provided by CBS Outdoor, Clear Channel Outdoor, and Blue Line Media in 35 priority markets. Leading monthlies, including The Advocate, EBONY, ESSENCE, Heart & Soul, HIVPlus, OUT, POZ, UPTOWN, and VIBE are provide ongoing visibility to the campaign in the form of PSA placements and editorial coverage, as well as online PSA placements. Greater Than AIDS is also working with state and local departments of health and community foundations in more than 15 states to expand the reach of the campaign in hard hit areas through joint events and special promotions.
AIDS in AmericaAs the AIDS epidemic enters its fourth decade, according to 2011 national survey by the Kaiser Family Foundation, two in five Americans – including three in five Black Americans – now know someone living with HIV or who has died from AIDS. More than 1.1 million people are living with HIV/AIDS in the U.S. today – more than at any time in the history of the epidemic. According to the U.S. Centers for Disease Control and Prevention (CDC), one in five of those who are positive does not know it.
HIV/AIDS is both preventable and treatable — early HIV diagnosis and treatment helps those who are positive live longer and healthier lives, and also reduces the spread of the disease. Yet, one in three Americans with HIV is diagnosed late – within a year of an AIDS diagnosis – making these treatments less effective. The U.S. Centers for Disease Control & Prevention (CDC) identifies stigma as a major contributor to the spread of HIV, keeping people from seeking information, speaking openly, using protection, getting tested and treated and otherwise acting to protect themselves and those they love.
About Greater Than AIDS
Greater Than AIDS is an unprecedented collaboration among a broad coalition of public and private sector partners united in response to the HIV/AIDS crisis in the United States, in particular among Black Americans and other disproportionately affected groups. Through a national media campaign and targeted community outreach, Greater Than AIDS aims to increase knowledge and understanding about HIV/AIDS and confront the stigma surrounding the disease.
The Kaiser Family Foundation — a leader in health policy and communications — provides strategic direction and day-to-day management, as well as oversees the production of the media campaign. The Black AIDS Institute — a think tank exclusively focused on AIDS in Black America — provides leadership and expert guidance and directs community engagement. Greater Than AIDS is developed in support of Act Against AIDS, an effort by the U.S. Centers for Disease Control and Prevention (CDC) to refocus attention on the domestic epidemic. Additional, financial and substantive support is provided by the Elton John AIDS Foundation, Ford Foundation and MAC AIDS Fund, among others.
The Kaiser Family Foundation, a leader in health policy analysis, health journalism and communication, is dedicated to filling the need for trusted, independent information on the major health issues facing our nation and its people. The Foundation is a non-profit private operating foundation, based in Menlo Park, California.
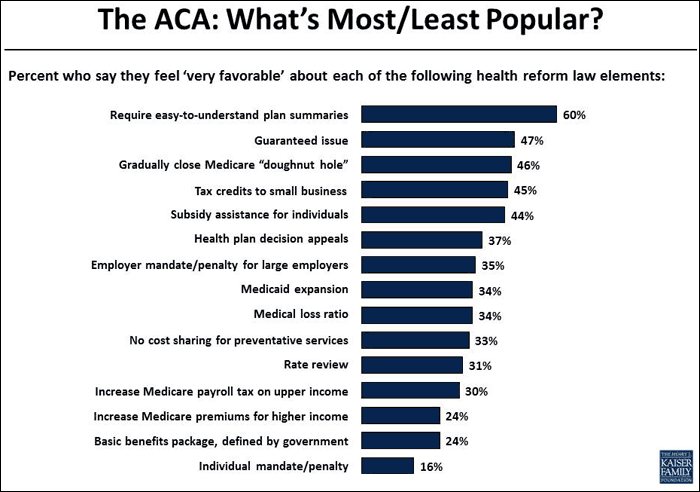
In our most recent monthly tracking poll, we asked the American people what elements of the health reform law they like and dislike. Surprisingly, the runaway favorite was a relatively obscure requirement that health plans provide consumers with a short, easy to understand description of their benefits and coverage. Sixty percent of the American people gave this requirement for greater transparency in health insurance benefits a very favorable rating, the only provision in the law to get such a rating from more than half of the public. The Administration is writing final regulations to implement this provision now.
The summary of benefits provision was followed in popularity by several better known provisions of the law we asked about this time: preventing insurers from denying people coverage if they have preexisting conditions, ranked very favorably by forty-seven percent; closing the Medicare doughnut hole for drug coverage (forty-six percent very favorable rating); and providing tax credits to individuals and small businesses to help pay for coverage (forty-four and forty-five percent very favorable ratings, respectively). The common element in all of the most popular provisions of the law is that you do not have to be a health policy expert to understand them. They provide tangible help to people navigating the health insurance system and paying their health insurance bills. No surprise, the individual mandate, which will be the subject of Supreme Court review, was the least favorable element of the law. Some people don’t want insurance. Others may worry they will not be able to afford it. But mostly, Americans don’t like to be told what to do or that they will be fined for not doing it. Opposition softens somewhat if people think the mandate will help spread insurance risk.
Note: Items asked of separate half samples. Response wording abbreviated. See Topline: http://www.kff.org/kaiserpolls/8259.cfm for complete wording.Source: Kaiser Family Foundation Health Tracking Poll (conducted November 10-15, 2011)
It is no huge surprise that people are confused by their health benefits. And, unlike many elements of the health reform law, there is no apparent downside to the public from requiring health plans to be more up front about what they do and do not cover; although employers and insurers have objected to the rule as a costly and unnecessary new regulatory burden. What is a surprise, though, is that people feel so lost in the health insurance system that they chose a requirement that insurance companies explain their benefits in plain language as the most popular element of the giant health reform law, and by such a wide margin over the many others we asked about.The Affordable Care Act has been largely an ideological battleground fought over hot-button issues like the individual mandate. It will always raise ideological and policy divisions. But, our polling shows people don’t know much about its more consumer friendly provisions which are popular even across partisan lines. As long as that remains the case, people will not perceive the ACA as part of the solution to their everyday problems and public opinion will remain split along the familiar partisan divide. That’s the larger meaning of this finding about a seemingly small provision in the ACA from our monthly tracking poll.