Awareness of ACA’s Status
The independent source for health policy research, polling, and news.
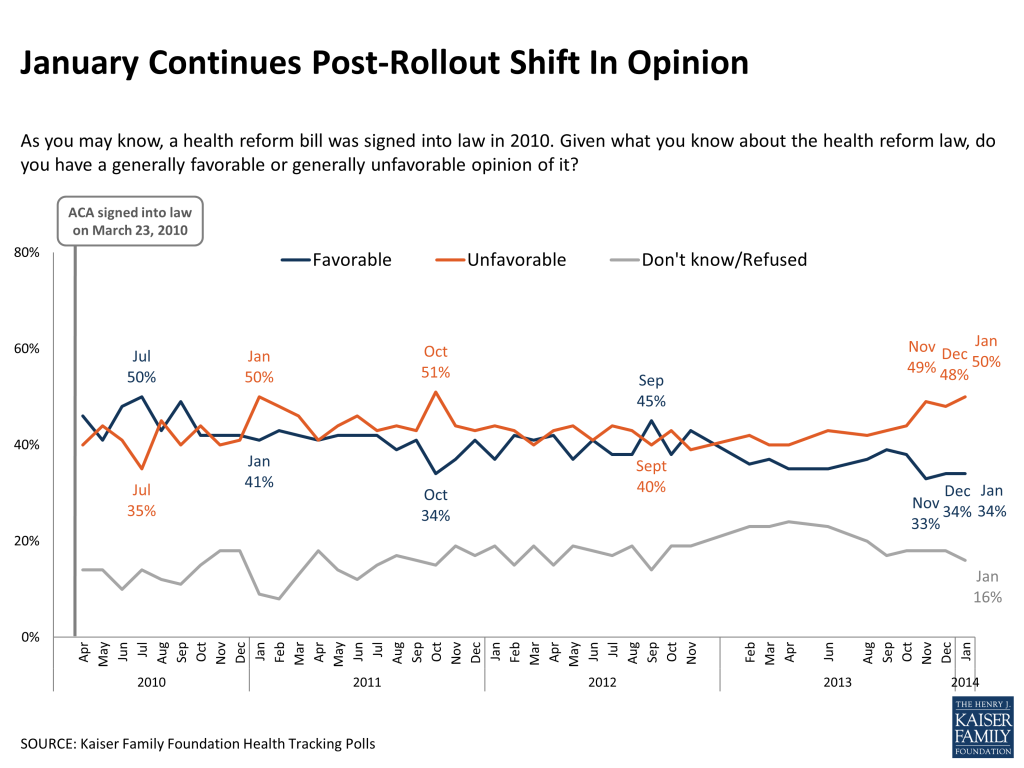
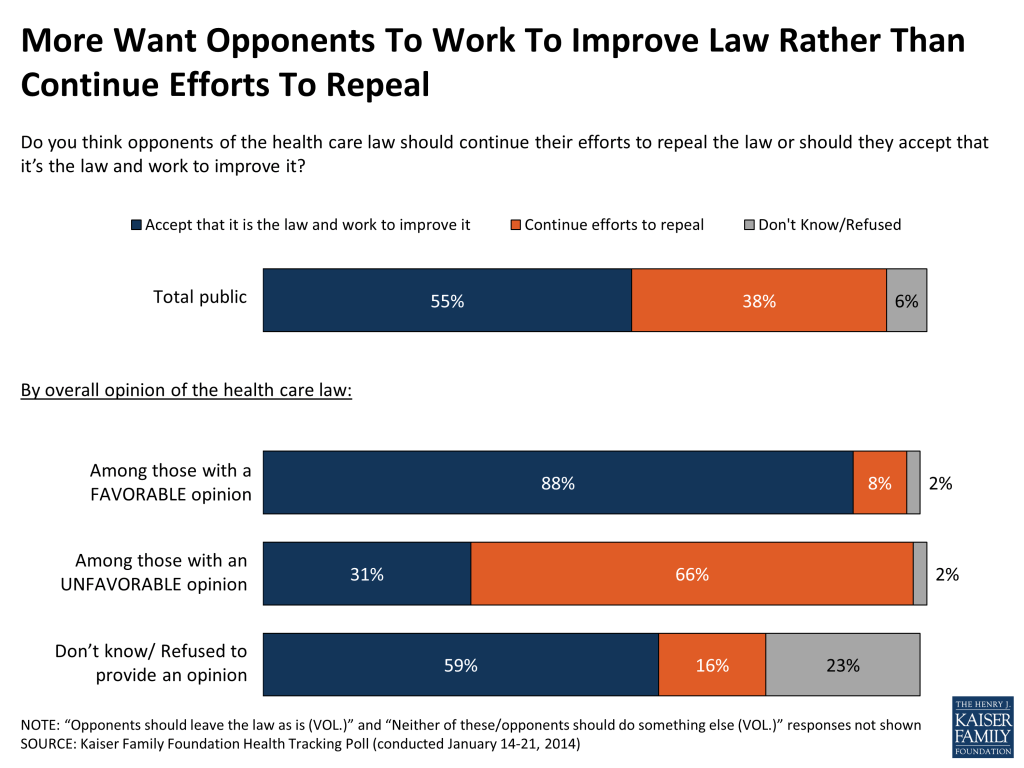
January 1st may have been a monumental date for those working on and closely following the Affordable Care Act (ACA), but the latest Kaiser Health Tracking Poll finds little change in the public’s knowledge and views of the law. With enrollment in new coverage options underway, a majority of the public believes that only “some” of the ACA’s provisions have been put into place, while just about one in five think “most” or “all” of the law has been implemented. Awareness of the law’s individual mandate and health insurance exchanges has increased slightly since last year, but about four in ten of the public overall and half the uninsured remain unaware of other major provisions. For the third month in a row, overall views of the law remain at their post-rollout more negative levels (50 percent unfavorable, 34 percent favorable), though over half the public – including three in ten of those who view the law unfavorably – say opponents should work on improving the law rather than keeping up efforts to repeal it.
Among the uninsured – a key group for outreach under the law – unfavorable views now outnumber favorable views by roughly a 2-to-1 margin (47 percent versus 24 percent). This is a change from last month when 43 percent of the uninsured had an unfavorable view and 36 percent were favorable. More of those without coverage say the law has made the uninsured as a group worse off (39 percent) than better off (26 percent). Despite these views, large shares of the uninsured see health insurance as “very important” and say they need it, while four in ten say they’ve tried to get coverage in the past 6 months, and half expect to get it this year.
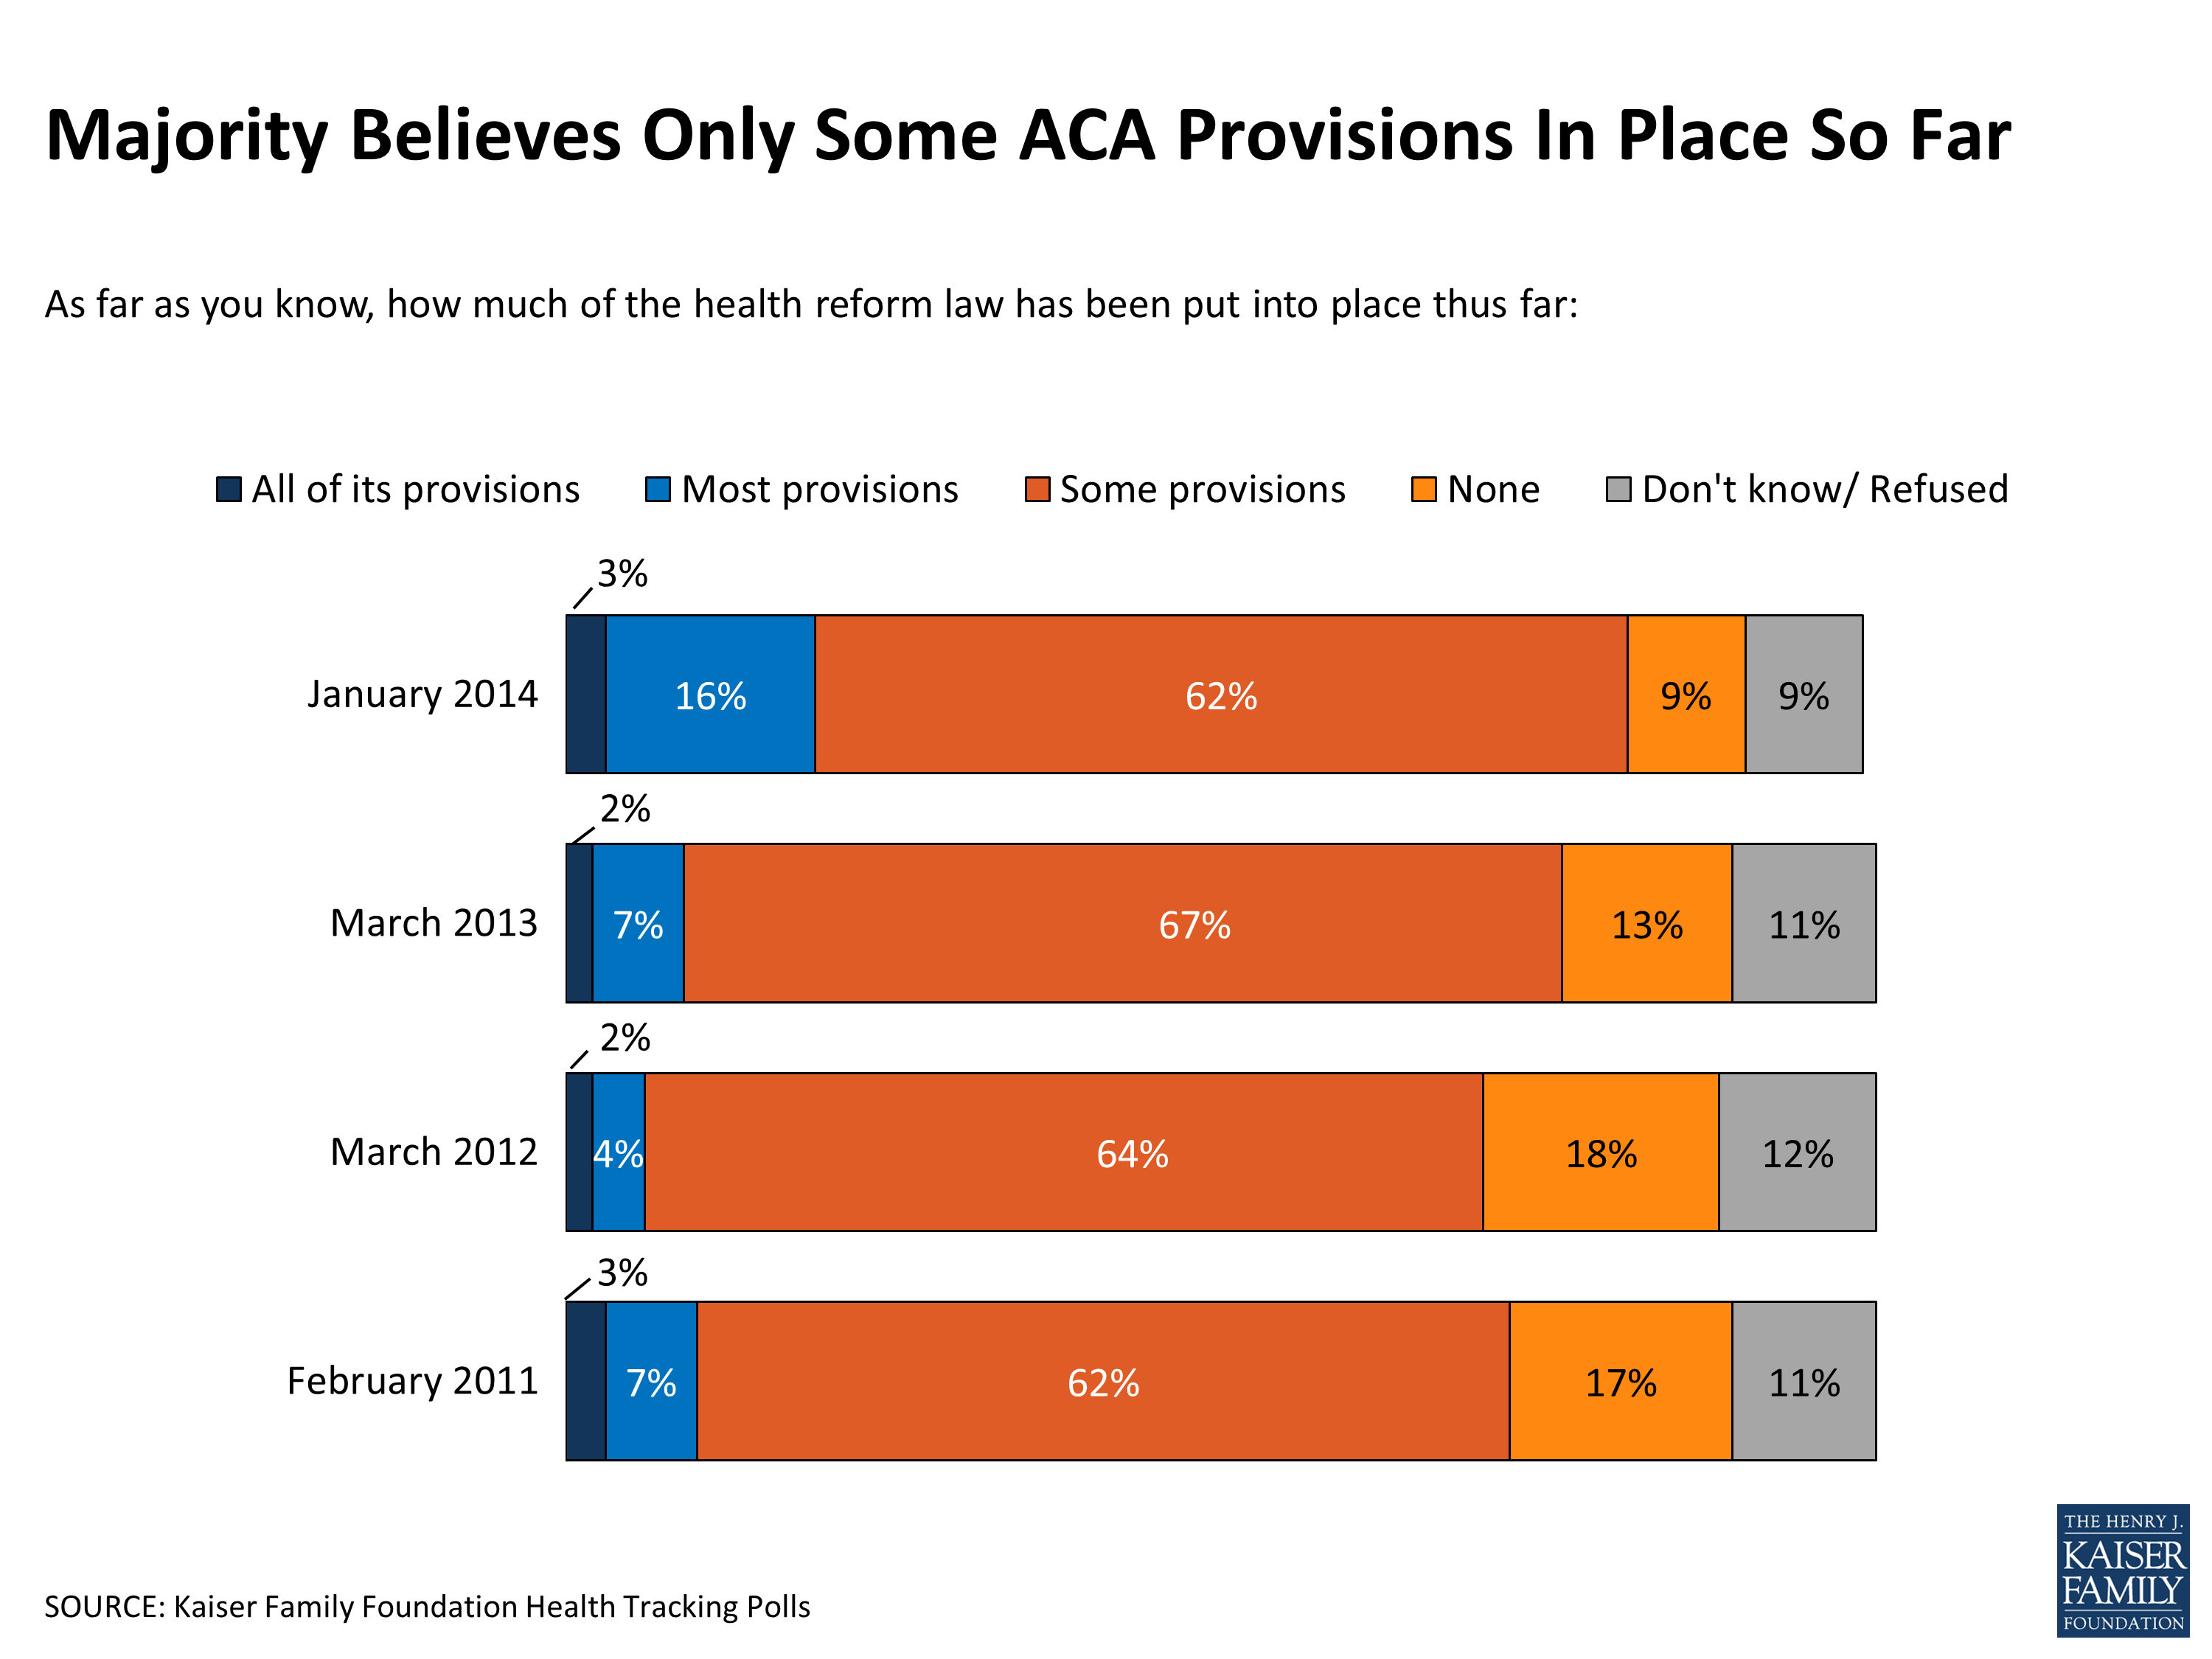
The latest Kaiser Health Tracking Poll finds that even after most of the ACA’s major provisions took effect on January 1, a large majority of the public (62 percent) continues to believe that only “some” provisions of the ACA have been put into place thus far. Only about one in five (19 percent) say “most” or “all” provisions have been implemented, up somewhat from 9 percent last March.
When it comes to the individual elements of the law, awareness has increased slightly for two of the big ones: the individual mandate (81 percent now say it is part of the law, up from 74 percent last March) and the health insurance exchanges (68 percent, up from 58 percent). Still, large shares of the public – and even higher shares of the uninsured – remain unaware of some other major provisions of the law. For example, roughly four in ten adults overall, and about half of the uninsured, are not aware that the law provides financial help to low- and moderate-income Americans to help them purchase coverage, gives states the options of expanding their Medicaid programs, and prohibits insurance companies from denying coverage based on pre-existing conditions.
| FIGURE 2: Many Uninsured Remain Unaware Of Some Major ACA Provisions | ||||
| Total public | Uninsured, age<65 | |||
| To the best of your knowledge, would you say the health reform law does or does not…? | Yes, law does this | No/Don’t know | Yes, law does this | No/Don’t know |
| Require nearly all Americans to have health insurance or else pay a fine | 81 | 19 | 79 | 22 |
| Create health insurance exchanges or marketplaces where people who don’t get coverage through their employers can shop for insurance and compare prices and benefits | 68 | 31 | 62 | 38 |
| Provide financial help to low and moderate income Americans who don’t get insurance through their jobs to help them purchase coverage | 63 | 38 | 54 | 46 |
| Give states the option of expanding their existing Medicaid program to cover more low-income, uninsured adults | 58 | 42 | 49 | 51 |
| Prohibit insurance companies from denying coverage because of a person’s medical history | 54 | 46 | 48 | 53 |
On a more personal level, 44 percent of the public overall – including 66 percent of the uninsured –continue to say they don’t have enough information to understand how the law will impact their families.
Views of the law overall remain more negative than positive this month, with 50 percent saying they have an unfavorable view and 34 percent favorable, almost identical to the split in opinion since November. Still, more than half the public overall, including three in ten of those who view the law unfavorably, say opponents should accept that it’s the law of the land and work to improve it, while fewer than four in ten want opponents to keep up the repeal fight.
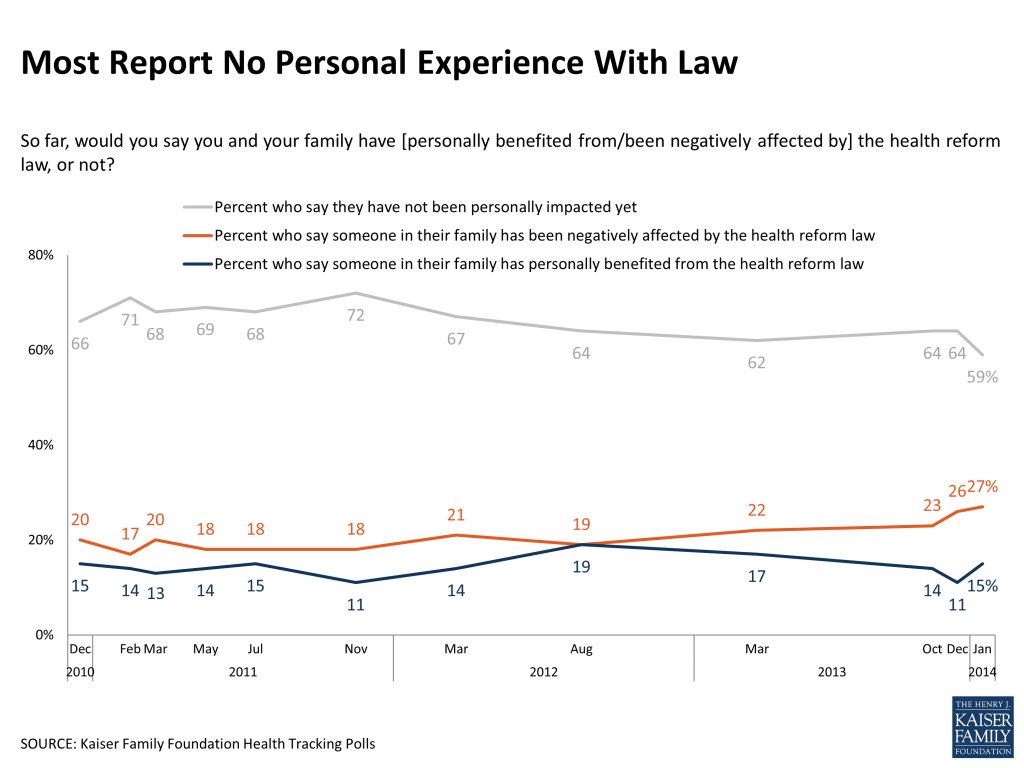
At the same time, most Americans continue to report no personal experience with the law to date. Roughly six in ten say they haven’t been directly impacted by the law in a positive or negative way, though the share who perceive that they’ve been negatively impacted continues to be larger than the share who feel they’ve benefited (27 percent versus 15 percent). Those who feel they’ve been negatively impacted by the law are most likely to point to high costs of health care and insurance as the reason. With official data showing that only a very small share of the public overall have enrolled in the ACA’s coverage arrangements so far, these shares likely reflect people’s perceptions of being helped or harmed by the law, rather than actual experiences with new insurance options under the ACA.
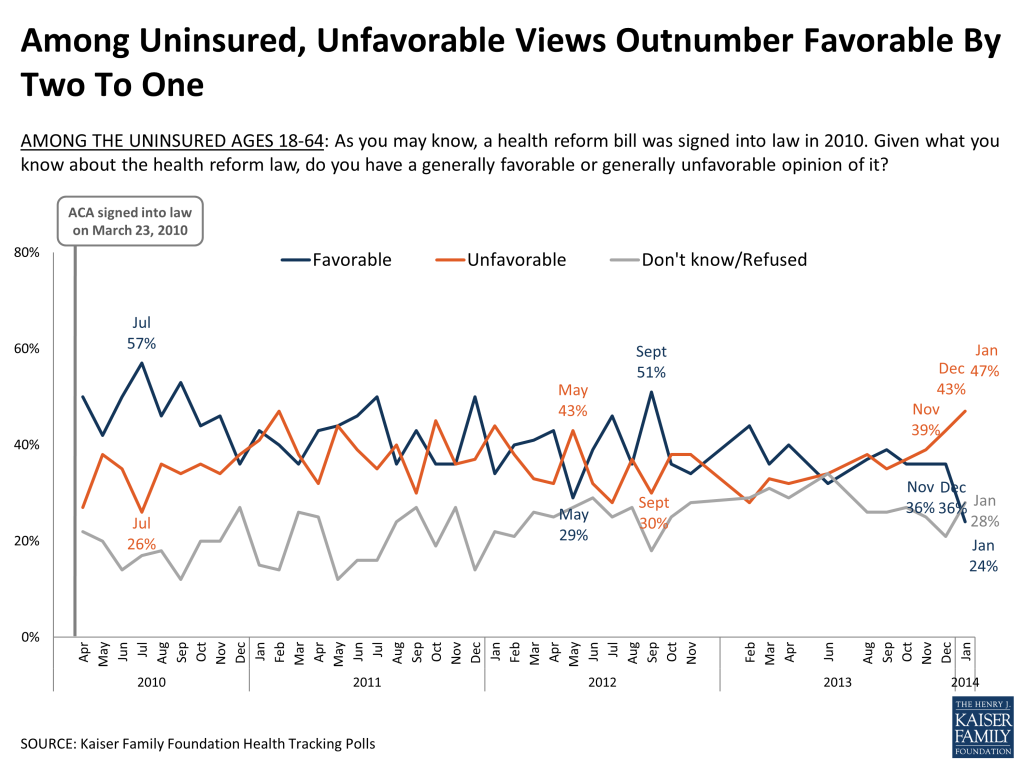
Among the uninsured – a key group targeted by the ACA – views of the law shifted negative this month. A quarter (24 percent) of those who currently lack coverage now say they have a favorable view of the law, while nearly twice as many (47 percent) have an unfavorable view and about three in ten (28 percent) decline to offer an opinion. In December, views among the uninsured were more evenly split (36 percent favorable, 43 percent unfavorable).
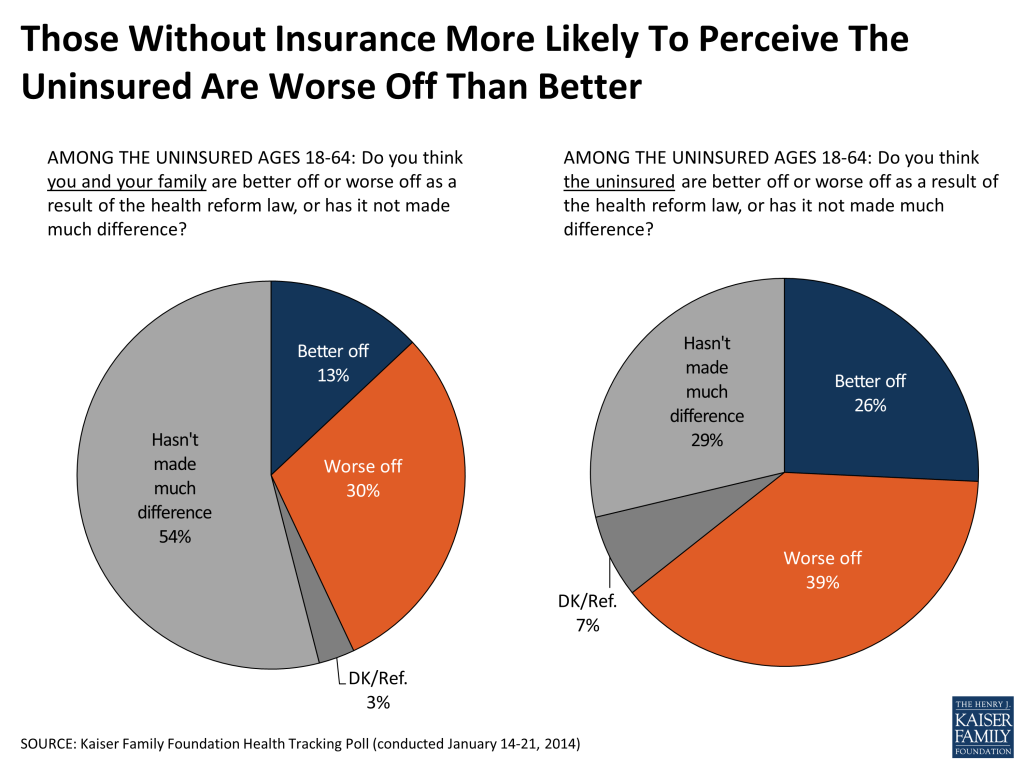
More than half of the uninsured (54 percent) say the law hasn’t made much difference for their families, and the share who feel they’re worse off as a result of the law is more than twice the share who feel they’re better off (30 percent versus 13 percent). When asked about the uninsured as a group, those without coverage are more likely to say the law has left this group worse off than better (39 percent versus 26 percent). We will continue to track these perceptions as more of the uninsured gain coverage.
The survey also finds that most of the uninsured see health insurance coverage as very important (70 percent) and something they need (73 percent). Among those who currently lack coverage, four in ten say they have tried to get it in the past 6 months, including about one in five each who tried to get coverage from Medicaid (19 percent), directly from a private insurance company (19 percent), and through a state or federal health insurance exchange (18 percent).1

When told or reminded of the law’s requirement that most Americans obtain insurance or pay a fine, half the uninsured say they expect to get coverage, including about one in five (18 percent) who expect to purchase it themselves (either from a private insurance company or through an exchange), 8 percent who expect to get it from Medicaid, and 6 percent who expect to get coverage from an employer. A sizable share (17 percent of the uninsured overall) say they expect to get coverage but are unsure where.
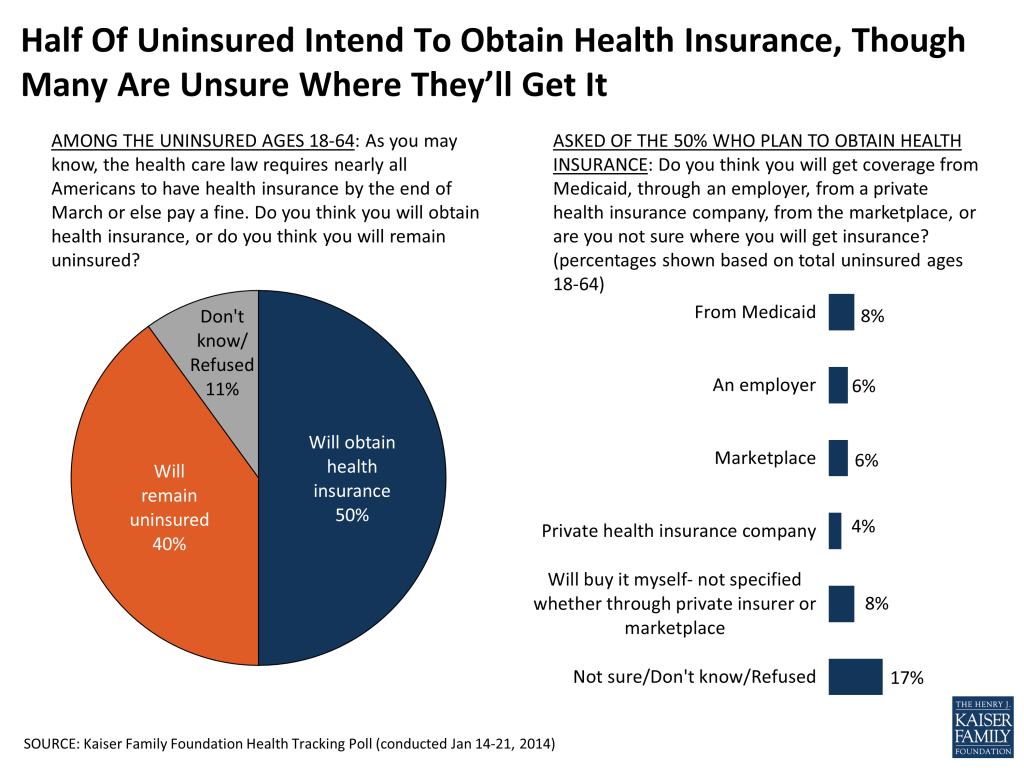
Four in ten of those without coverage say they expect to remain uninsured, with most of these saying they don’t think they’ll be able to find an affordable plan. As noted above, many of the uninsured remain unaware of the additional options available to them under the ACA, including the insurance exchanges, subsidies, and expanded Medicaid in some states.
As we pointed out in this Data Note [hyperlink], national public opinion polls aren’t the best vehicle for measuring the experiences of the small group of people who’ve actually gained coverage through the ACA so far. One thing we can do on the Kaiser Health Tracking Poll is to measure people’s perceptions about changes in their insurance situation and what role they think the law has played in those changes. This month’s poll finds a quarter (24 percent) of the public reports that they’ve had a change in their health insurance situation in the past 6 months, and four in ten of these (10 percent of the public overall) believe this change was a result of the health care law.
Among the 10 percent who perceive that their insurance status has changed as a result of the ACA, twice as many believe it was a change for the worse rather than for the better. However, about half this group currently has coverage through an employer, and most report that the change in their coverage was a change from one plan to another, suggesting that many of them may be attributing regular changes in insurance coverage to the law.

| FIGURE 11: Perceptions And Demographics Of Those Who Believe They Had A Change In Insurance Status As A Result Of The ACA | |
| Among the 10% who had a change in insurance status and believe it was a result of the ACA | |
| Would you say the change in your health insurance situation was a change for the better or a change for the worse? | |
| Better | 29% |
| Worse | 61 |
| No difference/Don’t know/Refused | 10 |
| Which best describes the change in your health insurance situation? | |
| Changed plans | 45 |
| Lost or dropped coverage | 14 |
| Got health insurance after being uninsured | 15 |
| Costs went up (vol.) | 12 |
| Some other change | 10 |
| Current health insurance status/type | |
| Insured (NET) | 92 |
| Employer | 50 |
| Self-purchase | 19 |
| Medicare | 6 |
| Medicaid | 13 |
| Other coverage | 3 |
| Uninsured | 6 |
| Don’t know/Refused | 2 |
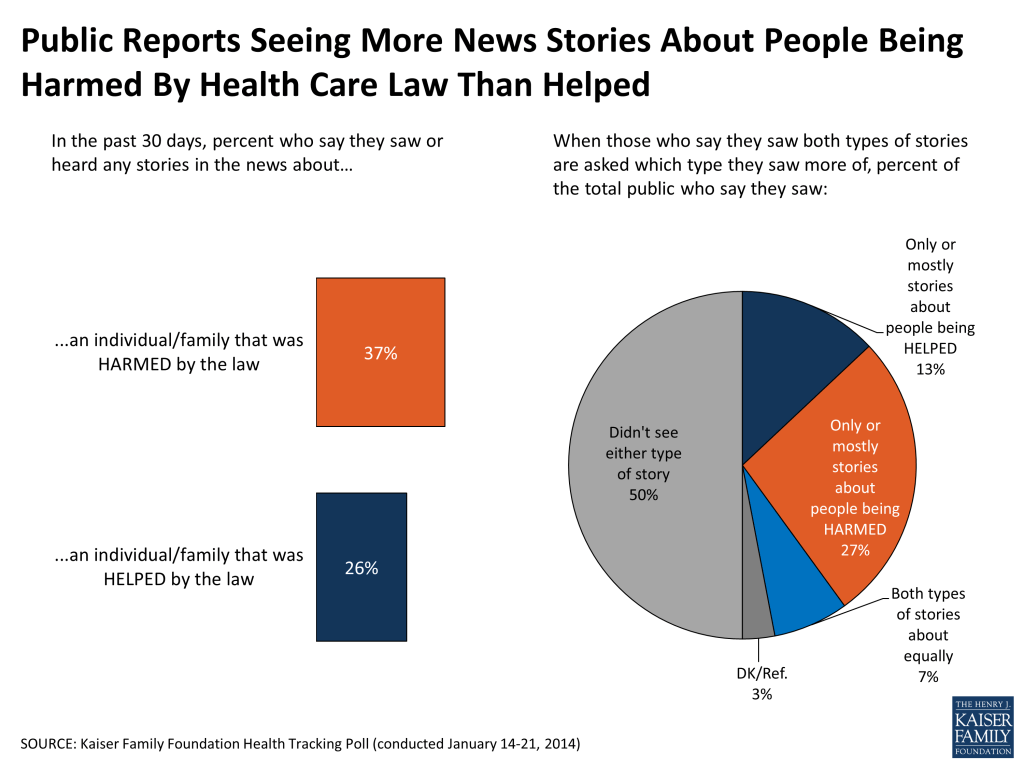
This month’s poll also examined views of the media environment surrounding the ACA, and finds the majority say coverage of the law is focused more on politics and controversies (56 percent) rather than on how the law might impact people (6 percent), shares that have held steady since last fall. When it comes to personal stories in the news, about half the public (47 percent) reports hearing at least one story in the last month about an individual or family who was impacted by the law, with about twice as many saying they saw more stories about people being harmed (27 percent) as saying they saw more stories about people being helped (13 percent).
1. Multiple responses were allowed, since people may have tried to get coverage from more than one source in the past 6 months.
This Kaiser Health Tracking Poll was designed and analyzed by public opinion researchers at the Kaiser Family Foundation (KFF) led by Mollyann Brodie, Ph.D., including Liz Hamel, Bianca DiJulio, and Jamie Firth. The survey was conducted January 14-21, 2014, among a nationally representative random digit dial telephone sample of 1,506 adults ages 18 and older, living in the United States, including Alaska and Hawaii (note: persons without a telephone could not be included in the random selection process). Computer-assisted telephone interviews conducted by landline (753) and cell phone (753, including 402 who had no landline telephone) were carried out in English and Spanish by Princeton Data Source along with interviewers from Survey Technology & Research Center under the direction of Princeton Survey Research Associates International (PSRAI). Both the random digit dial landline and cell phone samples were provided by Survey Sampling International, LLC. For the landline sample, respondents were selected by asking for the youngest adult male or female currently at home based on a random rotation. If no one of that gender was available, interviewers asked to speak with the youngest adult of the opposite gender. For the cell phone sample, interviews were conducted with the person who answered the phone. KFF paid for all costs associated with the survey.
The combined landline and cell phone sample was weighted to balance the sample demographics to match estimates for the national population using data from the Census Bureau’s 2012 American Community Survey (ACS) on sex, age, education, race, Hispanic origin, nativity (for Hispanics only), and region along with data from the 2010 Census on population density. The sample was also weighted to match current patterns of telephone use using data from the January-June 2013 National Health Interview Survey. The weight takes into account the fact that respondents with both a landline and cell phone have a higher probability of selection in the combined sample and also adjusts for the household size for the landline sample. All statistical tests of significance account for the effect of weighting.
The margin of sampling error including the design effect for the full sample is plus or minus 3 percentage points. Numbers of respondents and margin of sampling error for key subgroups are shown in the table below. For results based on other subgroups, the margin of sampling error may be higher. Sample sizes and margin of sampling errors for other subgroups are available by request. Note that sampling error is only one of many potential sources of error in this or any other public opinion poll.
| Group | N (unweighted) | M.O.S.E. |
| Total | 1,506 | ±3 percentage points |
| Uninsured, under age 65 | 173 | ±8 percentage points |
| Favorable opinion of health care law | 566 | ±5 percentage points |
| Unfavorable opinion of health care law | 747 | ±4 percentage points |
| Believe insurance situation has changed as a result of the ACA | 161 | ±9 percentage points |
As increasing data become available on the number of people enrolled in coverage under the Affordable Care Act (ACA), there has been interest in the number that have gained coverage through Medicaid and the role of the ACA in these Medicaid coverage gains. The ACA is anticipated to lead to significant gains in Medicaid enrollment as a result of two key changes:
According to the Congressional Budget Office, by 2016, the ACA is expected to reduce the number of uninsured by 25 million, with a 12 million increase in Medicaid enrollment.2 Overall, an estimated 29% of the current 47.6 million uninsured are eligible for Medicaid in their state.3
CMS reports that state Medicaid and CHIP agencies received a total of 6.6 million applications between October and December 2013.4 This number does not reflect the total number of individuals applying since an application may include more than one person. Moreover, the total number of applications submitted for Medicaid and CHIP over this period is likely higher because this number does not reflect Medicaid and CHIP applications that have been submitted through the State Based Marketplaces (SBMs) and the Federally Facilitated Marketplace (FFM), where many individuals have been directed to apply since open enrollment began in October.
It is difficult to draw conclusions about changes in application volume by comparing changes in new applications to Medicaid and CHIP agencies to baseline data. Because individuals are now applying through multiple pathways, comparisons of application volume to Medicaid and CHIP agencies before and after the ACA will not reflect Medicaid and CHIP application activity now occurring through the Marketplaces. For example, comparisons of application volume to Medicaid and CHIP agencies before and after the beginning of open enrollment show declines in some states, but this may be attributable to a shift in applications from Medicaid and CHIP agencies to SBM or FFM enrollment pathways. Overall, between October and December 2013, CMS reports that over 1.8 million applications for Medicaid, CHIP, or premium tax credits for Marketplace coverage were submitted to SBMs.5 In addition, separate data from HHS show that over 2.7 million applications for Medicaid, CHIP, or Marketplace coverage were submitted through the FFM. It is not possible to disaggregate what share of these applications was for Medicaid or CHIP.6
CMS data show that, between October 1, 2013 and December, 31 2013, state Medicaid and CHIP agencies and the SBMs made over 6.3 million total new eligibility determinations for Medicaid and CHIP.7 These reflect determinations for all Medicaid eligibility groups, not just adults made newly eligible for Medicaid by the expansion. However, the data do not reflect Medicaid and CHIP assessments and determinations through the FFM, which is operating in 36 states. In separate data, HHS reported that, as of the end of December 2013, the FFM and SBMs had determined or assessed nearly 1.6 million individuals as eligible for Medicaid or CHIP, with nearly half (751,000) performed by the FFM.8 The Marketplace data aggregates Medicaid and CHIP determinations and assessments and is not directly comparable to the CMS determination data. For “assessment states” the FFM will transfer the accounts to the state to make a final determination of Medicaid eligibility.
The ACA is expected to increase coverage among adults made newly eligible by the Medicaid expansion as well as among already eligible individuals who were not yet enrolled. In states implementing the Medicaid expansion, millions of low-income adults became newly eligible for the program as of January 2014. Moreover, in all states, more people who were already eligible for the program, including children, are enrolling as they are connected to coverage through broad outreach efforts and the new simplified enrollment processes that all states must implement. Past experience with the implementation of the Children’s Health Insurance Program (CHIP) similarly shows that increases in both CHIP and Medicaid enrollment helped significantly reduce the number of uninsured children through the combined effects of eligibility expansions, simplified enrollment processes, and broad outreach and enrollment efforts.9
The new Medicaid enrollment data do not provide for a separate breakout of the number of enrollees who were made newly eligible by the Medicaid expansion, and it is difficult to quantify the impact of outreach and the new streamlined enrollment processes on enrollment. Moreover, because states are in varied stages of readiness to report the eligibility and enrollment data, there are gaps and limitations in the data that constrain analysis of the early data.10 However, broad comparisons to previous Medicaid enrollment trends suggest that the ACA is having a positive impact on Medicaid enrollment.
Enrollment trends prior to open enrollment show Medicaid enrollment growth peaking during the recession and then slowing as the economy started to recover. Medicaid enrollment is driven by both changes in economic conditions and policy changes. During the recent economic downturn, as unemployment rates climbed and incomes fell, more people became eligible and enrolled in Medicaid. This increased demand, combined with the maintenance of effort (MOE) provisions that helped preserve coverage (which were first enacted as part of the American Recovery and Reinvestment Act and then maintained under the ACA) led to substantial net annual growth. At the height of the economic downturn, monthly Medicaid and CHIP enrollment grew by 3.6 million between June 2008 to 2009 and June 2009 to 2010.11 Since then, economic conditions have continued to slowly improve, resulting in slower enrollment growth, far below recessionary peaks, at 1.4 million between June 2011 and 2012 and 1.0 million between June 2012 and 2013 (Figure 1).12 These changes reflect a net change in individuals coming on and leaving the Medicaid program.
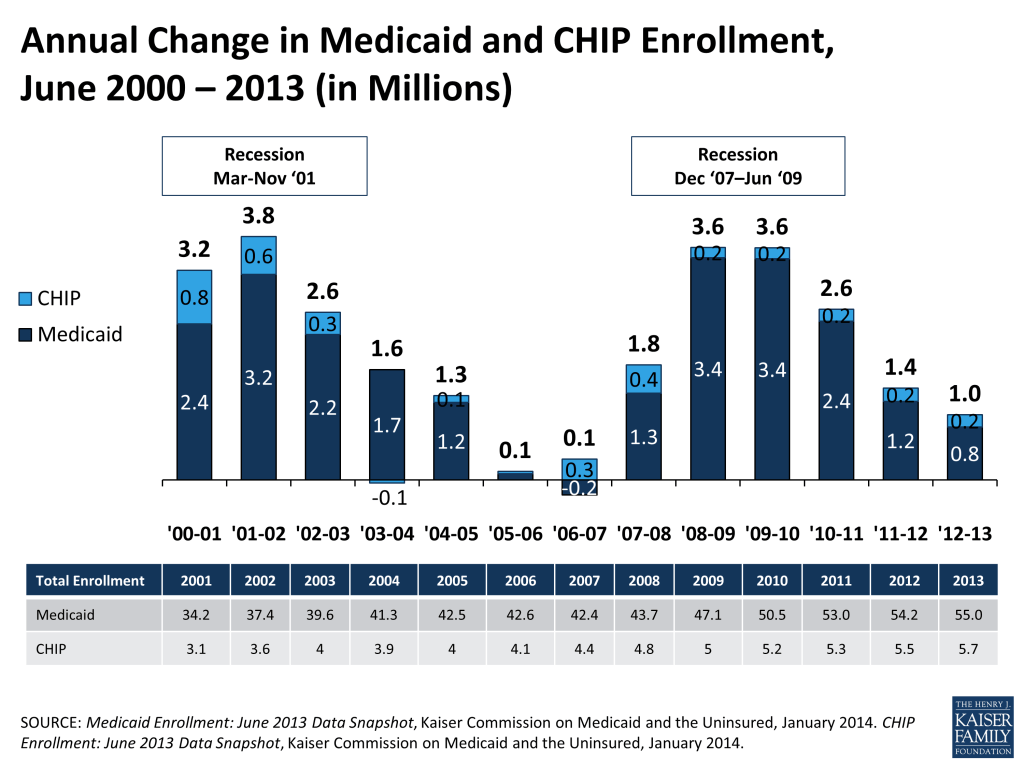
The 6.3 million Medicaid and CHIP eligibility determinations reported by CMS since the beginning of open enrollment outpaces previous Medicaid enrollment trends. While the CMS reported 6.3 million Medicaid and CHIP determinations made since the start of open enrollment is not directly comparable to monthly Medicaid enrollment data, the volume of determinations made exceeds net Medicaid enrollment gains at the height of the Great Recession and also significantly exceeds the net change in monthly enrollment between June 2012 and June 2013 when economic conditions improved. Overall, total Medicaid enrollment gains since open enrollment began could be higher than the reported 6.3 million determinations because they do not include Medicaid and CHIP assessments and determinations processed by the FFM and because some states did not report CHIP enrollment data; however, the number of new determinations could be lower because some states included renewals in this count, although it is not possible to identify the share that are renewals. In addition, these data may be revised by CMS as it continues to work with states to improve the data collection and reporting.
Looking ahead, future CMS data releases are anticipated to show continued Medicaid coverage gains through the end of the open enrollment period for the Marketplaces and beyond. Enrollment in Medicaid is not limited to open enrollment periods, so individuals may continue to enroll over the course of the year. CMS plans to enhance and expand the data it reports on Medicaid eligibility determinations and enrollment. As the data improve, it will allow for greater analysis both within and across states and of changes over time. The early data show a jump in Medicaid and CHIP determinations since open enrollment began relative to recent enrollment trends; however, it is not possible to disaggregate how much of this growth is directly attributable to the ACA. Future CMS data will show how many individuals are newly eligible for coverage as states start to submit claims to access the enhanced federal matching dollars tied to this coverage. However, it will be very difficult to disentangle how much of the overall increased enrollment can be tied to the ACA requirements to streamline Medicaid eligibility and enrollment policies and coordination across health coverage programs that must be implemented in all states regardless of whether they implement the Medicaid expansion.
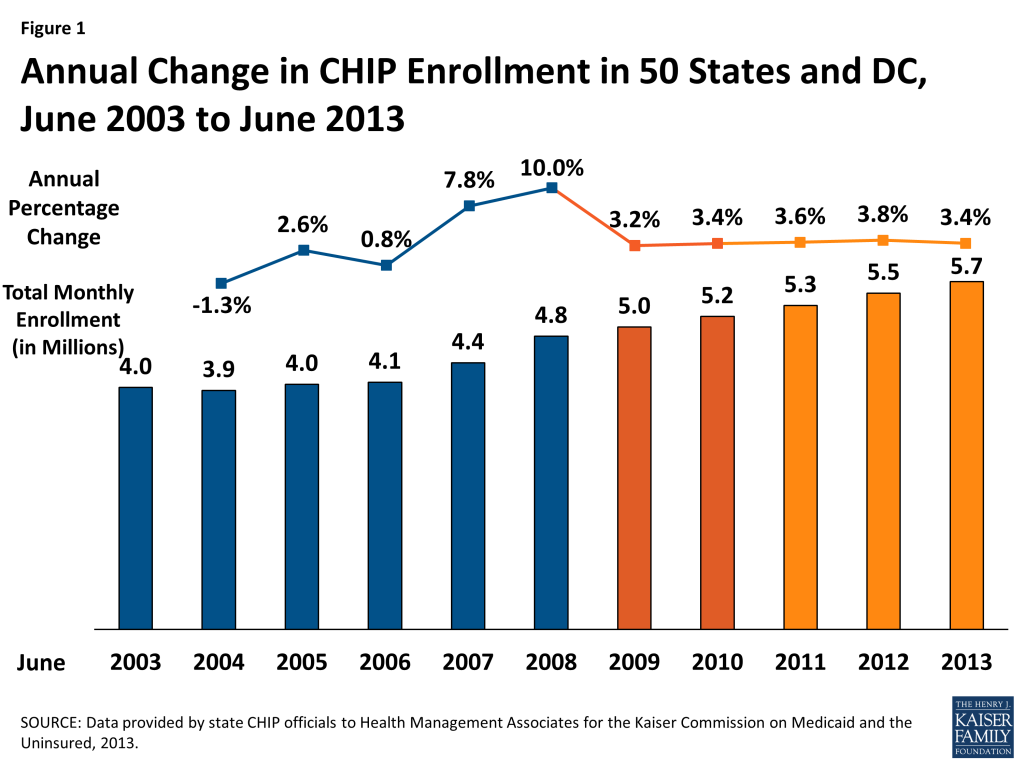
In June 2013, over 5.7 million children were enrolled in the Children’s Health Insurance Program (CHIP.) Enrollment in June 2013 increased by 190,453 or by 3.4 percent, compared to one year earlier. Since 2009, annual rates of growth have remained fairly steady, ranging between 3.2 percent and 3.8 percent. In contrast, during the height of the Great Recession, enrollment increased annually by 7.8 to 10 percent. (Figure 1)
CHIP, combined with Medicaid, provide a crucial safety net of coverage for low-income children. Both programs, aided by maintenance of eligibility (MOE) provisions maintained under the Affordable Care Act (ACA) helped to stave off increases in the number of uninsured children. Between 2007 and 2012, the uninsured rate for children dropped from 10.9% to 9.2%, despite a decline in the share of children with employer-sponsored coverage.1 CHIP offers coverage to low-income children in families without access to affordable coverage but with incomes above Medicaid levels. Economic conditions provide upward and downward pressure on CHIP enrollment. During the economic downturn, many Americans lost jobs and incomes declined, making children in such families eligible for CHIP. However, as family incomes continued to fall, children moved from CHIP to Medicaid.
Policy actions at the federal level have also affected CHIP enrollment. In addition to reauthorizing CHIP through 2015, the Children’s Health Insurance Program Reauthorization Act (CHIPRA) provided performance bonuses through FFY 2013 for states that increased enrollment of children who are eligible for Medicaid coverage but not enrolled and adopt enrollment simplifications. The last performance bonuses were awarded December 30, 2013 for FFY 2013. Over $307 million in such bonuses were awarded to twenty-three states, all of which had also been awarded bonuses in the prior year. Additionally, 15 states received a tier 2 bonus, indicating they exceeded their enrollment targets by more than ten percent.2
In addition to the MOE provisions mentioned above, which require states to maintain eligibility levels until 2019 for children, CHIP programs also face the same ACA requirements in terms of enrollment simplifications, coordination with Medicaid and the new Marketplaces, as well as the use of Modified Adjust Gross Income beginning in 2014. The ACA requires that Medicaid cover children with incomes up to 133 percent of the federal poverty level (FPL) as of January 2014. Before this change, states were required to cover children under the age of six in families with income of at least 133 percent FPL and school-age children and teens with incomes up to 100 percent FPL in Medicaid. Many states already covered children with incomes up to 133 percent FPL in Medicaid, but due to the change in law, 21 states needed to transition some children from their CHIP state plans to their Medicaid state plans.
A few of these 21 states decided to move these children before the requirement was in place. New York and Colorado implemented an early transition of children from CHIP to Medicaid but are maintaining separate CHIP programs. Meanwhile, New Hampshire and California moved or are in the process of transitioning all CHIP kids to Medicaid, not just these older children with incomes under 133 percent FPL. The remaining 17 states will transition an estimated 13 percent to 48 percent of their CHIP coverage to Medicaid.3 These children remain eligible for the Title XXI Federal CHIP match rate.
This CHIP enrollment report series has always included Title XXI-funded enrollees only (children enrolled in both Medicaid expansion CHIP programs and stand-alone CHIP programs) while its companion Medicaid enrollment report has included Title XIX-funded enrollees only; this has ensured an unduplicated count between Medicaid and CHIP children. Because of difficulties in identifying which of these children are in fact being transitioned and to continue to ensure unduplicated counts with the companion report for Medicaid, these older children are still included as CHIP enrollees in this report. Therefore, the early transitions described above are accounted for within CHIP in this report.
Cross State Trends. Over the year from June 2012 to June 2013, monthly CHIP enrollment increased in 29 states. Over 70 percent of the increased CHIP enrollment occurred in two states (Arizona and California.)
California’s CHIP enrollment represents over one-fifth of all CHIP enrollment across the country; enrollment growth in this program therefore has a significant effect on total CHIP enrollment. CHIP enrollment increased in California by 8.8 percent as 101,163 additional children were enrolled in June 2013 compared to one year earlier. The transition of children previously enrolled in the Title XXI Healthy Families to Medi-Cal (Medicaid) would not affect CHIP enrollment numbers reflected in this report because these children are still included in the CHIP counts. The increase in the number of children enrolled in CHIP may be related to outreach and enrollment efforts tied to expanded Medicaid and CHIP coverage programs in California, and also to the improving economy with children moving up the income scale between Medicaid and CHIP.
Arizona’s CHIP program, KidsCare, has been closed to new enrollment since December 2009 due to state budget shortfalls. CHIP enrollment steadily declined for several reporting periods, reaching its lowest level in over a decade in June 2012. However, the state opened a new, temporary program, KidsCare II, in May 2012 for approximately 20,000 children with incomes between 100 and 175 percent FPL.4 Between June 2012 and June 2013, CHIP enrollment in Arizona more than doubled as 30,973 more children had enrolled in coverage. The program was scheduled to end in January 2014. However, the state recently received approval to extend coverage for children with incomes above 133 percent FPL through January 31, 2014 to provide additional time to transition to coverage through the Federally Facilitated Marketplace.5
In contrast, CHIP enrollment declined in 22 states between June 2012 and June 2013. (Figure 2) A number of these declines were relatively small, A number of these states also saw growth among children eligible for Medicaid during this period as well, including Indiana, Maine, and Nevada, which had the largest percentage declines during this period.6
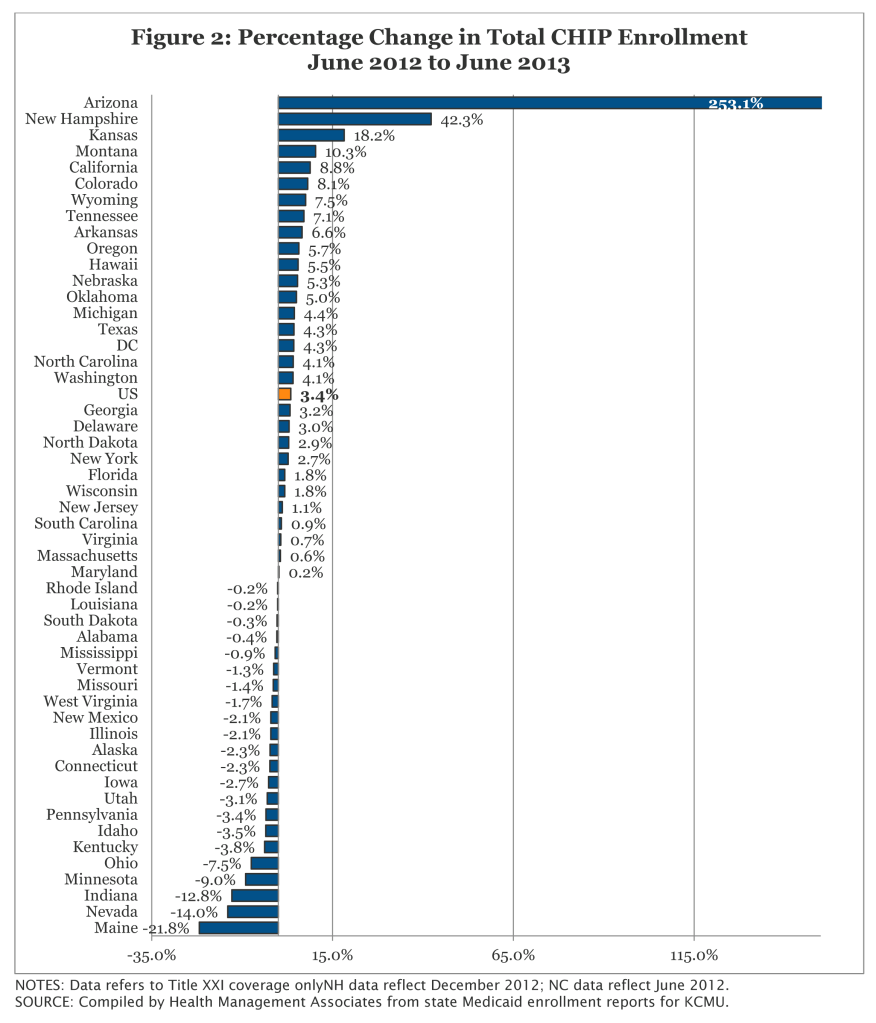
In terms of percentage change from one year to the next, enrollment in 2013 grew at a slower pace than in the prior annual period in 32 states. The only four states that experienced double digit growth were Arizona, Kansas, Montana, and New Hampshire.
CONCLUSION. Overall, CHIP enrollment continued to increase, but growth slow to the lowest rates since the start of the Recession as the economic conditions continued to improve. CHIP programs, along with state Medicaid programs continue to play a critical role in assuring health coverage for uninsured children.
This Data Snapshot was prepared by Vernon K. Smith of Health Management Associates along with Laura Snyder and Robin Rudowitz of the Kaiser Family Foundation.
Methodology. The data in this report reflect the number of children, including individuals covered under the unborn child option, enrolled in CHIP programs in each state. State CHIP officials provided data specifically for the months of December 2012 and June 2013States also were asked to review data in previous reports in this series and to update data as might be appropriate for previous periods. The data for this report were requested in November 2013; responses were returned by December 2013Data for specific states in reports issued by CMS may differ from data in this report. Beyond the “point-in-time” versus “ever-enrolled” counts described below, differences occur when states provide data for this report for a point-in-time other than the final day of a quarter, when states update enrollment counts, e.g., for retroactive eligibility of a Medicaid-expansion CHIP program.
The data in this report are “point-in-time,” meaning the number of individuals enrolled in a specific month, such as June 2013. A “point-in-time” count is distinct from the “ever-enrolled” count, which is provided in reports issued by CMS. The annual count of children ever-enrolled will always exceed the number enrolled at any point- in-time, as long as new enrollments and departures occur during the year. For example, the CMS CHIP annual report for the year ending in September 2011, shows a total of 7,970,879 children enrolled at any point in time and for any length of time during that FFY 2011. In contrast, the number of children enrolled in the month of September 2011 per data provided for this report (not reported here) was 5,419,887 or 68.0 percent remained enrolled in September. Recent experience shows that one-third of CHIP enrollees enrolled at any time during the year were not enrolled at the end of the year.
Net Change. The data collected for this report are net changes in enrollment across the program and within select eligibility groups, taking into account the net impact of children enrolling and disenrolling from the CHIP program. Because this data are not individual level data and states do not make a distinction between enrollment among current beneficiaries and new beneficiaries, it is not possible to determine from this data the number of children that left the program and the number that newly enrolled in a given time period, i.e., the churn within the program. For example, this data set cannot be used to determine how many of the 5.7 million beneficiaries enrolled in June 2013 had been enrolled in June 2012.
| Appendix 1: Total CHIP Enrollment by State , June 2006 – 2013 | ||||||||
| State | 2006 | 2007 | 2008 | 2009 | 2010 | 2011 | 2012 | 2013 |
| Alabama | 65,875 | 67,715 | 71,251 | 69,252 | 75,112 | 81,136 | 85,615 | 85,284 |
| Alaska | 9,582 | 7,793 | 8,743 | 8,721 | 10,148 | 10,917 | 11,040 | 10,788 |
| Arizona | 59,250 | 64,453 | 65,837 | 53,408 | 32,221 | 18,469 | 12,238 | 43,211 |
| Arkansas | 67,170 | 69,349 | 67,832 | 64,213 | 68,017 | 70,372 | 71,621 | 76,327 |
| California | 860,888 | 986,311 | 1,062,303 | 1,127,673 | 1,062,126 | 1,127,027 | 1,152,476 | 1,253,639 |
| Colorado | 53,894 | 51,939 | 60,166 | 64,598 | 69,369 | 63,956 | 82,856 | 89,595 |
| Connecticut | 14,251 | 17,200 | 15,432 | 14,136 | 14,212 | 13,657 | 12,872 | 12,575 |
| DC | 4,844 | 5,069 | 5,484 | 6,090 | 6,342 | 6,244 | 6,401 | 6,676 |
| Delaware | 4,750 | 5,146 | 6,720 | 6,307 | 5,871 | 6,337 | 6,514 | 6,708 |
| Florida | 193,639 | 224,575 | 231,226 | 225,028 | 254,217 | 252,447 | 258,414 | 262,980 |
| Georgia | 257,212 | 276,551 | 225,497 | 198,951 | 205,990 | 207,653 | 220,778 | 227,873 |
| Hawaii | 15,569 | 17,226 | 18,787 | 20,763 | 24,359 | 25,257 | 27,392 | 28,890 |
| Idaho | 14,287 | 19,352 | 26,811 | 29,652 | 24,622 | 24,837 | 25,222 | 24,340 |
| Illinois | 151,253 | 175,145 | 186,107 | 218,161 | 232,370 | 243,571 | 249,361 | 244,138 |
| Indiana | 69,787 | 68,394 | 71,253 | 70,496 | 79,757 | 83,494 | 94,476 | 82,355 |
| Iowa | 36,286 | 33,412 | 34,580 | 43,830 | 44,870 | 57,023 | 65,280 | 63,524 |
| Kansas | 37,631 | 35,374 | 38,047 | 38,731 | 40,065 | 45,694 | 47,078 | 55,663 |
| Kentucky | 50,225 | 52,536 | 53,555 | 53,991 | 59,962 | 67,023 | 67,631 | 65,070 |
| Louisiana | 107,777 | 107,828 | 124,310 | 126,657 | 124,373 | 124,018 | 121,696 | 121,442 |
| Maine | 14,705 | 13,346 | 13,839 | 14,955 | 15,479 | 15,945 | 15,838 | 12,381 |
| Maryland | 101,552 | 104,870 | 110,877 | 99,582 | 96,470 | 97,418 | 97,063 | 97,249 |
| Massachusetts | 75,019 | 87,492 | 105,094 | 103,605 | 113,760 | 116,043 | 119,014 | 119,702 |
| Michigan | 47,710 | 43,375 | 43,354 | 46,308 | 38,525 | 44,043 | 45,072 | 47,071 |
| Minnesota | 2,229 | 2,458 | 2,368 | 2,226 | 2,156 | 2,148 | 2,080 | 1,892 |
| Mississippi | 60,457 | 60,122 | 64,978 | 67,097 | 66,953 | 69,669 | 70,550 | 69,941 |
| Missouri | 61,097 | 61,936 | 58,923 | 65,133 | 71,663 | 70,853 | 70,828 | 69,854 |
| Montana | 13,165 | 13,289 | 16,576 | 18,639 | 20,761 | 24,739 | 28,844 | 31,819 |
| Nebraska | 23,194 | 24,491 | 25,397 | 23,744 | 27,421 | 29,396 | 30,516 | 32,132 |
| Nevada | 27,848 | 29,899 | 26,832 | 22,444 | 21,255 | 21,139 | 24,717 | 21,266 |
| New Hampshire | 7,688 | 7,415 | 8,009 | 7,905 | 8,527 | 8,938 | 8,868 | 12,615 |
| New Jersey | 127,525 | 125,494 | 121,581 | 133,878 | 155,512 | 166,218 | 168,337 | 170,176 |
| New Mexico | 10,598 | 8,072 | 9,706 | 8,647 | 8,615 | 8,165 | 7,926 | 7,762 |
| New York | 388,689 | 394,164 | 365,311 | 382,803 | 394,692 | 409,252 | 452,462 | 464,637 |
| North Carolina | 109,466 | 113,667 | 122,379 | 129,973 | 171,730 | 192,855 | 190,766 | 198,643 |
| North Dakota | 4,454 | 4,553 | 5,785 | 4,644 | 4,666 | 4,706 | 4,818 | 4,956 |
| Ohio | 142,374 | 140,547 | 145,049 | 153,335 | 158,194 | 162,041 | 163,473 | 151,252 |
| Oklahoma | 58,731 | 66,570 | 62,955 | 65,679 | 69,968 | 60,374 | 70,017 | 73,517 |
| Oregon | 29,430 | 39,586 | 50,736 | 47,575 | 56,930 | 68,102 | 72,557 | 76,687 |
| Pennsylvania | 143,501 | 161,166 | 172,662 | 191,497 | 194,721 | 191,508 | 190,279 | 183,773 |
| Rhode Island | 12,412 | 12,612 | 12,348 | 12,454 | 14,361 | 15,032 | 15,209 | 15,179 |
| South Carolina | 40,161 | 36,001 | 45,332 | 54,406 | 56,618 | 61,940 | 66,809 | 67,385 |
| South Dakota | 11,323 | 11,136 | 11,531 | 11,900 | 12,334 | 12,917 | 13,158 | 13,114 |
| Tennessee | – | 31,619 | 53,064 | 67,980 | 73,741 | 78,883 | 77,407 | 82,877 |
| Texas | 293,342 | 326,635 | 554,642 | 544,815 | 574,902 | 576,025 | 615,017 | 641,636 |
| Utah | 35,724 | 25,095 | 35,248 | 41,468 | 41,608 | 37,696 | 36,605 | 35,482 |
| Vermont | 3,012 | 2,820 | 3,215 | 3,330 | 3,478 | 3,721 | 3,936 | 3,886 |
| Virginia | 78,745 | 82,731 | 90,907 | 96,163 | 99,433 | 108,553 | 113,333 | 114,121 |
| Washington | 18,790 | 18,975 | 20,953 | 23,875 | 29,537 | 31,660 | 30,873 | 32,126 |
| West Virginia | 24,835 | 24,939 | 24,418 | 24,555 | 24,824 | 24,069 | 25,114 | 24,679 |
| Wisconsin | 30,954 | 31,368 | 71,590 | 72,153 | 91,737 | 94,470 | 90,468 | 92,060 |
| Wyoming | 5,263 | 5,684 | 6,039 | 5,532 | 5,430 | 5,597 | 5,566 | 5,986 |
| Total | 4,078,163 | 4,397,495 | 4,835,639 | 4,988,958 | 5,160,004 | 5,343,247 | 5,546,481 | 5,736,934 |
| Appendix 2: Total CHIP Enrollment by State (Percentage Change), June 2005 – 2013 | ||||||||
| State | 05-06 | 06-07 | 07-08 | 08-09 | 09-10 | 10-11 | 11-12 | 12-13 |
| Alabama | 2.4% | 2.8% | 5.2% | -2.8% | 8.5% | 8.0% | 5.5% | -0.4% |
| Alaska | -15.7% | -18.7% | 12.2% | -0.3% | 16.4% | 7.6% | 1.1% | -2.3% |
| Arizona | 17.0% | 8.8% | 2.1% | -18.9% | -39.7% | -42.7% | -33.7% | 253.1% |
| Arkansas | 8.1% | 3.2% | -2.2% | -5.3% | 5.9% | 3.5% | 1.8% | 6.6% |
| California | 5.1% | 14.6% | 7.7% | 6.2% | -5.8% | 6.1% | 2.3% | 8.8% |
| Colorado | 32.4% | -3.6% | 15.8% | 7.4% | 7.4% | -7.8% | 29.6% | 8.1% |
| Connecticut | -9.2% | 20.7% | -10.3% | -8.4% | 0.5% | -3.9% | -5.7% | -2.3% |
| DC | 11.1% | 4.6% | 8.2% | 11.1% | 4.1% | -1.5% | 2.5% | 4.3% |
| Delaware | 3.9% | 8.3% | 30.6% | -6.1% | -6.9% | 7.9% | 2.8% | 3.0% |
| Florida | -5.1% | 16.0% | 3.0% | -2.7% | 13.0% | -0.7% | 2.4% | 1.8% |
| Georgia | 12.4% | 7.5% | -18.5% | -11.8% | 3.5% | 0.8% | 6.3% | 3.2% |
| Hawaii | 10.4% | 10.6% | 9.1% | 10.5% | 17.3% | 3.7% | 8.5% | 5.5% |
| Idaho | 3.6% | 35.5% | 38.5% | 10.6% | -17.0% | 0.9% | 1.6% | -3.5% |
| Illinois | 11.2% | 15.8% | 6.3% | 4.9% | 4.7% | 3.0% | 4.2% | 11.4% |
| Indiana | 1.2% | -2.0% | 4.2% | -1.1% | 13.1% | 4.7% | 13.2% | -12.8% |
| Iowa | 3.9% | -7.9% | 3.5% | 26.7% | 2.4% | 27.1% | 14.5% | -2.7% |
| Kansas | 8.7% | -6.0% | 7.6% | 1.8% | 3.4% | 14.0% | 3.0% | 18.2% |
| Kentucky | 1.7% | 4.6% | 1.9% | 0.8% | 11.1% | 11.8% | 0.9% | -3.8% |
| Louisiana | -0.1% | 0.0% | 15.3% | 1.9% | -1.8% | -0.3% | -1.9% | -0.2% |
| Maine | 5.1% | -9.2% | 3.7% | 8.1% | 3.5% | 3.0% | -0.7% | -21.8% |
| Maryland | 6.9% | 3.3% | 5.7% | -10.2% | -3.1% | 1.0% | -0.4% | 0.2% |
| Massachusetts | 6.9% | 16.6% | 20.1% | -1.4% | 9.8% | 2.0% | 2.6% | 0.6% |
| Michigan | -15.1% | -9.1% | 0.0% | 6.8% | -16.8% | 14.3% | 2.3% | 4.4% |
| Minnesota | 5.0% | 10.3% | -3.7% | -6.0% | -3.1% | -0.4% | -3.2% | -9.0% |
| Mississippi | -11.2% | -0.6% | 8.1% | 3.3% | -0.2% | 4.1% | 1.3% | -0.9% |
| Missouri | -34.8% | 1.4% | -4.9% | 10.5% | 10.0% | -1.1% | 0.0% | -1.4% |
| Montana | 20.7% | 0.9% | 24.7% | 12.4% | 11.4% | 19.2% | 16.6% | 10.3% |
| Nebraska | 0.3% | 5.6% | 3.7% | -6.5% | 15.5% | 7.2% | 3.8% | 5.3% |
| Nevada | -3.4% | 7.4% | -10.3% | -16.4% | -5.3% | -0.5% | 16.9% | -14.0% |
| New Hampshire | 9.5% | -3.6% | 8.0% | -1.3% | 7.9% | 4.8% | -0.8% | 42.3% |
| New Jersey | 10.7% | -1.6% | -3.1% | 10.1% | 16.2% | 6.9% | 1.3% | 1.1% |
| New Mexico | -0.5% | -23.8% | 20.2% | -10.9% | -0.4% | -5.2% | -2.9% | -2.1% |
| New York | -8.9% | 1.4% | -7.3% | 4.8% | 3.1% | 3.7% | 10.6% | 2.7% |
| North Carolina | -16.1% | 3.8% | 7.7% | 6.2% | 32.1% | 12.3% | -1.1% | 4.1% |
| North Dakota | 7.7% | 2.2% | 27.1% | -19.7% | 0.5% | 0.9% | 2.4% | 2.9% |
| Ohio | 15.9% | -1.3% | 3.2% | 5.7% | 3.2% | 2.4% | 0.9% | -7.5% |
| Oklahoma | 7.9% | 13.3% | -5.4% | 4.3% | 6.5% | -13.7% | 16.0% | 5.0% |
| Oregon | 17.7% | 34.5% | 28.2% | -6.2% | 19.7% | 19.6% | 6.5% | 5.7% |
| Pennsylvania | 5.1% | 12.3% | 7.1% | 10.9% | 1.7% | -1.7% | -0.6% | -3.4% |
| Rhode Island | 5.6% | 1.6% | -2.1% | 0.9% | 15.3% | 4.7% | 1.2% | -0.2% |
| South Carolina | -23.6% | -10.4% | 25.9% | 20.0% | 4.1% | 9.4% | 7.9% | 0.9% |
| South Dakota | 6.7% | -1.7% | 3.5% | 3.2% | 3.6% | 4.7% | 1.9% | -0.3% |
| Tennessee | – | – | 67.8% | 28.1% | 8.5% | 7.0% | -1.9% | 7.1% |
| Texas | -10.1% | 11.3% | 69.8% | -1.8% | 5.5% | 0.2% | 6.8% | 4.3% |
| Utah | 26.4% | -29.8% | 40.5% | 17.6% | 0.3% | -9.4% | -2.9% | -3.1% |
| Vermont | 0.7% | -6.4% | 14.0% | 3.6% | 4.4% | 7.0% | 5.8% | -1.3% |
| Virginia | 7.6% | 5.1% | 9.9% | 5.8% | 3.4% | 9.2% | 4.4% | 0.7% |
| Washington | -11.1% | 1.0% | 10.4% | 13.9% | 23.7% | 7.2% | -2.5% | 4.1% |
| West Virginia | 1.3% | 0.4% | -2.1% | 0.6% | 1.1% | -3.0% | 4.3% | -1.7% |
| Wisconsin | 10.5% | 1.3% | 128.2% | 0.8% | 27.1% | 3.0% | -4.2% | 1.8% |
| Wyoming | 27.7% | 8.0% | 6.2% | -8.4% | -1.8% | 3.1% | -0.6% | 7.5% |
| Total | 0.8% | 7.8% | 10.0% | 2.7% | 3.3% | 3.5% | 3.9% | 4.0% |
This Data Snapshot provides 50-state data on Medicaid monthly enrollment trends, adding new data for June 2013. Overall, Medicaid enrollment growth continued to slow to the lowest rate since the start of the Great Recession as the economic conditions continued to slowly improve. Looking ahead, Medicaid enrollment growth is expected to increase significantly as states implement the ACA. This report provides baseline data for understanding the impact of the ACA eligibility and enrollment policies on enrollment growth across states. Future reports will examine the changes in trends across states and eligibility groups, especially differences between states that are implementing the Medicaid expansion in 2014 and states not moving forward with the expansion at this time.
In June 2013, six months ahead of the implementation of major coverage expansions and new enrollment standards as part of the Affordable Care Act (ACA), 55 million individuals were enrolled in Medicaid. Nearly three-quarters were non-disabled, non-elderly individuals. Compared to one year earlier, enrollment grew by 814,200 or 1.5 percent – the slowest rate since the start of the Great Recession. At the height of the recessionary period1 , enrollment growth rates peaked at 7.8 and 7.2 percent in 2008-2009 and 2009-2010, adding 3.4 million in each period. (Figure 1)

Changes in enrollment are driven by both economic conditions as well as policy. During the economic downturn, as unemployment rates climbed and incomes fell, more people became eligible for and enrolled in Medicaid. This increased demand, combined with the maintenance of eligibility (MOE) provisions that helped preserve coverage (which were first enacted as part of the American Recovery and Reinvestment Act and then maintained under the ACA) led to substantial annual growth, particularly among non-disabled, non-elderly groups which include children. Increased Medicaid coverage played a critical role in staving off increases in the number of nonelderly uninsured, particularly children.2
As the economy started to improve, Medicaid enrollment growth started to slow, particularly for non-disabled, non-elderly enrollees. (Figure 2)
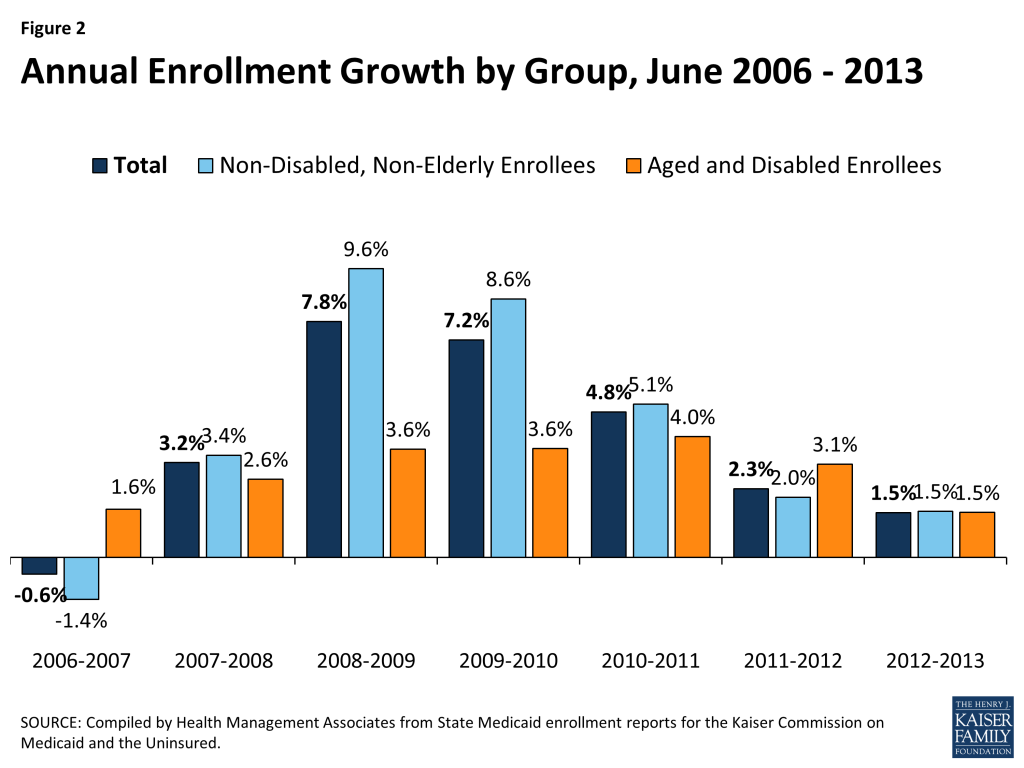
While enrollment growth rates have been generally trending downward as economic conditions continue to slowly improve, some recent enrollment growth is attributable to policy actions including ACA provisions implemented in advance of January 2014, such as expansions of adult coverage in California. However, beginning in January 2014, the ACA is anticipated to lead to significant increases in Medicaid enrollment as a result of new streamlined Medicaid eligibility and enrollment policies and a single application for Medicaid, CHIP, and subsidized Marketplace coverage that are required across all states as well as an expansion in Medicaid eligibility to nearly all adults with incomes below 139% of the federal poverty level for states that are implementing the ACA Medicaid expansion. 3 While this expansion was intended to occur nationwide, the Supreme Court ruling on the ACA effectively made it a state option, and 26 states are implementing the expansion in 2014. (Figure 3)
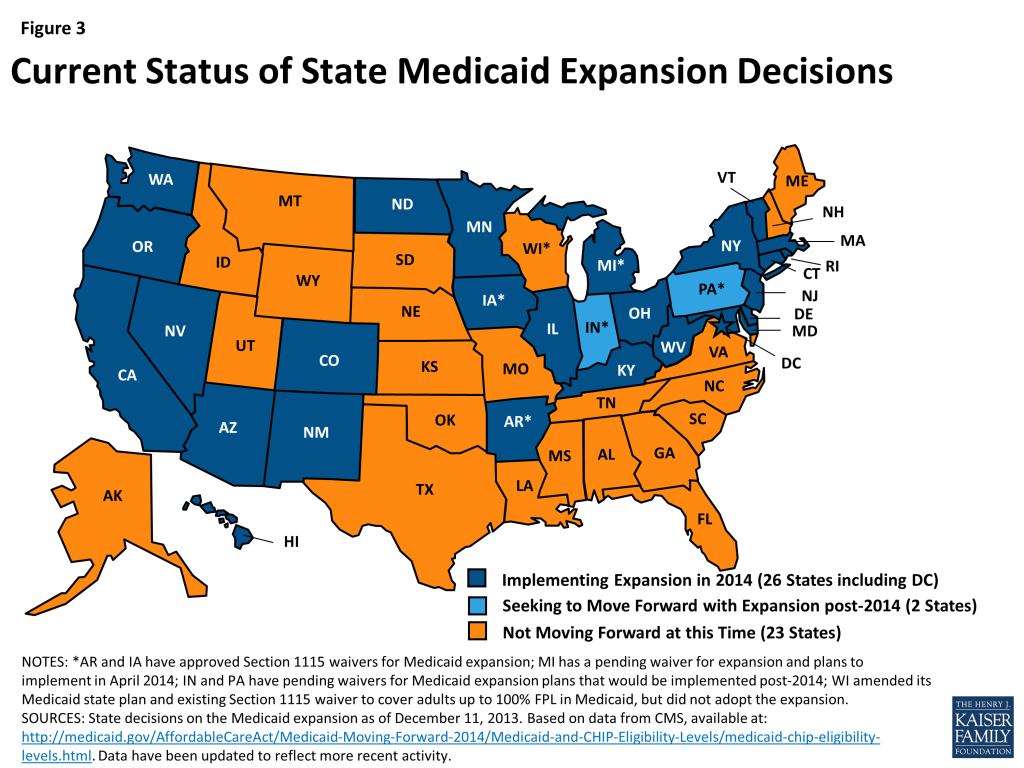
Going forward, states that implement the expansion are expected to experience higher Medicaid enrollment growth compared to states that have not expanded at this time. However, from June 2012 to June 2013 enrollment growth rates across the program are similar in expanding states (1.7 percent) and not-expanding states (1.2 percent.) Looking back over several years, those states expanding in 2014 have generally had slightly higher growth rates than states not planning to expand, though the growth rates were quite similar. (Figure 4)

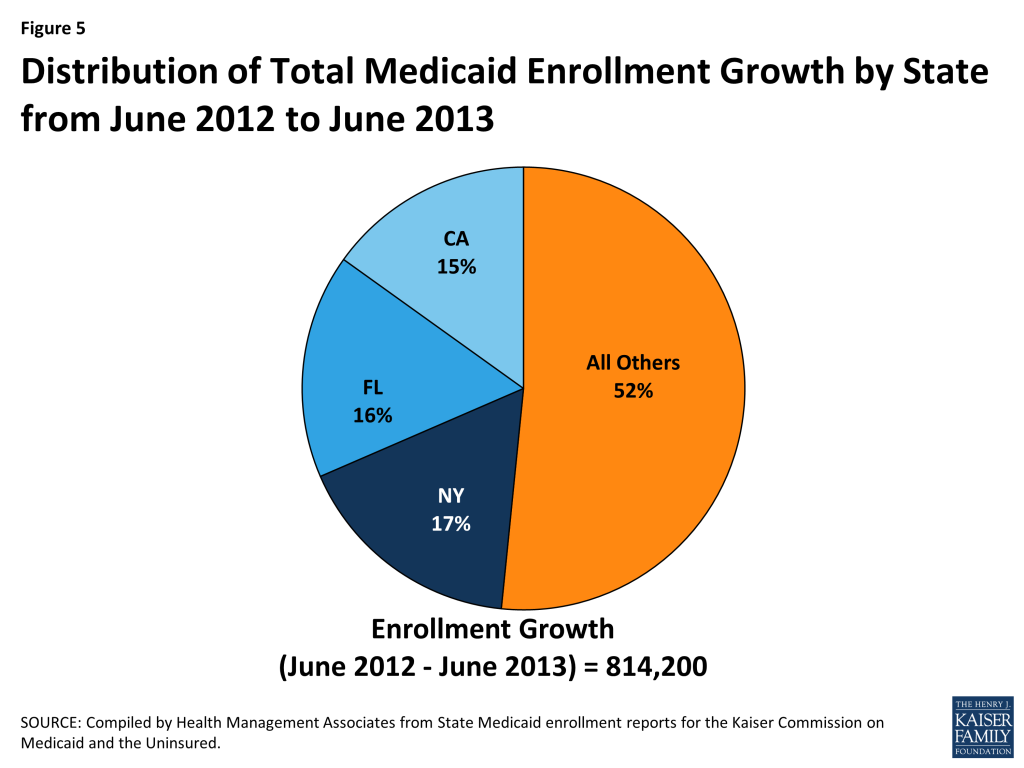
Cross State Trends. Across the country, enrollment in Medicaid reached 55 million as an additional 814,200 individuals enrolled in coverage between June 2012 and June 2013. Almost half of this enrollment growth was accounted for in three states (New York, Florida, and California). (Figure 5) Florida and New York saw enrollment growth across many parts of their programs. On the other hand, enrollment growth in California was driven by growth in its Low Income Health Program (LIHP), a county-based adult Medicaid expansion, discussed in more detail in a later section.
In contrast, declines in enrollment between June 2012 and June 2013 occurred in 13 states. (Figure 6) Three of these states with some of the larger declines during this period (Arizona, Maine and Wisconsin) have recently implemented eligibility restrictions for non-disabled, non-elderly adults that were exempted from the MOE provisions; these restrictions are also discussed in further detail in a later section.

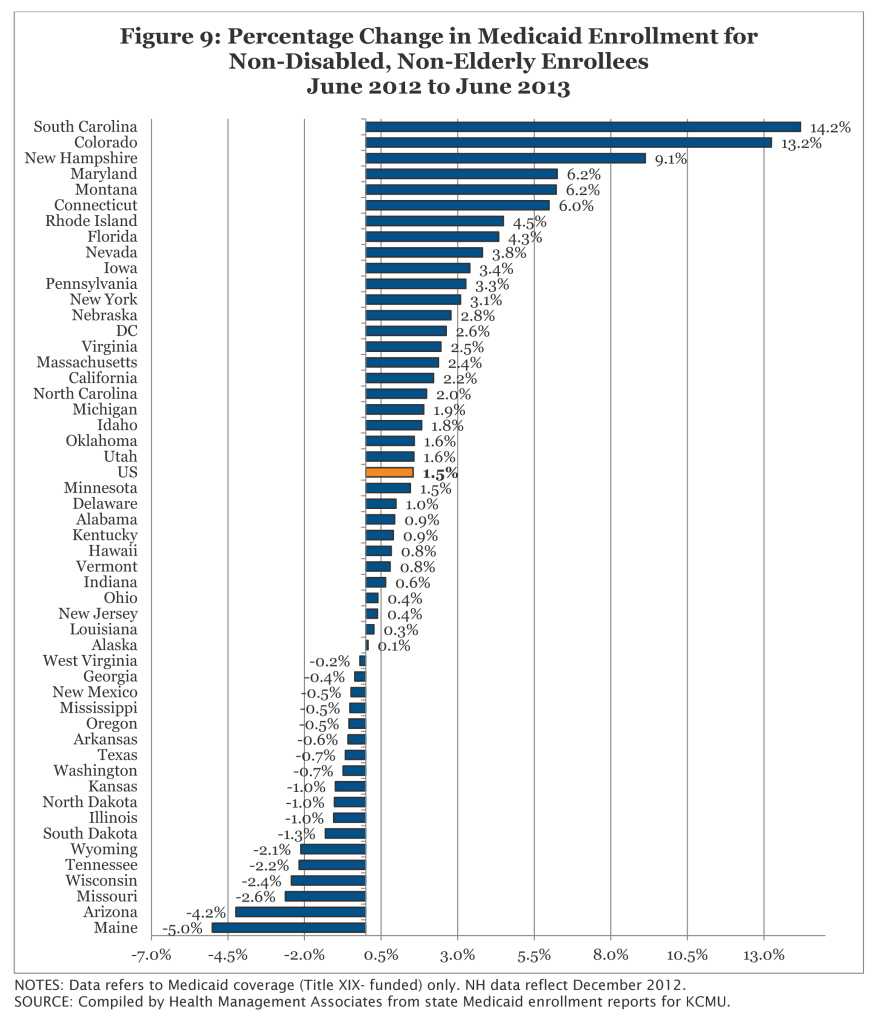
In terms of percentage change from one year to the next, enrollment grew at a slower pace than in the prior annual period in 34 states. Colorado and South Carolina were the only states that experienced double digit growth; both of these states have implemented a number of policy changes and eligibility expansions recently that are discussed in later sections.
In June 2013, nearly 40.2 million non-disabled, non-elderly individuals were enrolled in Medicaid programs across the country. This 40.2 million, which includes over 28 million children as well as nearly 12.2 million non-elderly, non-disabled adults (i.e. parents, pregnant women and childless adults), represents over 70 percent of all Medicaid enrollment.
Enrollment growth for this group is sensitive to changes in economic conditions. As shown in Figure 7, enrollment growth slowed and even declined as the economy improved in the years leading up to the Great Recession, and then peaked again between June 2008 and June 2009 at the height of the Great Recession. Since June 2007, just before the start of the Great Recession, an additional 12.6 million people enrolled in Medicaid programs across the country, nearly 10.2 million of whom were non-disabled, non-elderly individuals. As mentioned earlier, Medicaid programs, as well as CHIP programs, aided by maintenance of eligibility (MOE) provisions maintained under the ACA have played a critical role in staving off increases in the number of non-elderly uninsured, particularly children. Between 2007 and 2012, the uninsured rate for children dropped from 10.9 percent to 9.2 percent, despite a decrease in the share of children with employer-sponsored coverage. Additionally, the uninsured rate for non-elderly individuals declined in 2011 and 2012 for the first time since the start of the Great Recession; this decline was primarily driven by increases in Medicaid coverage among adults.4
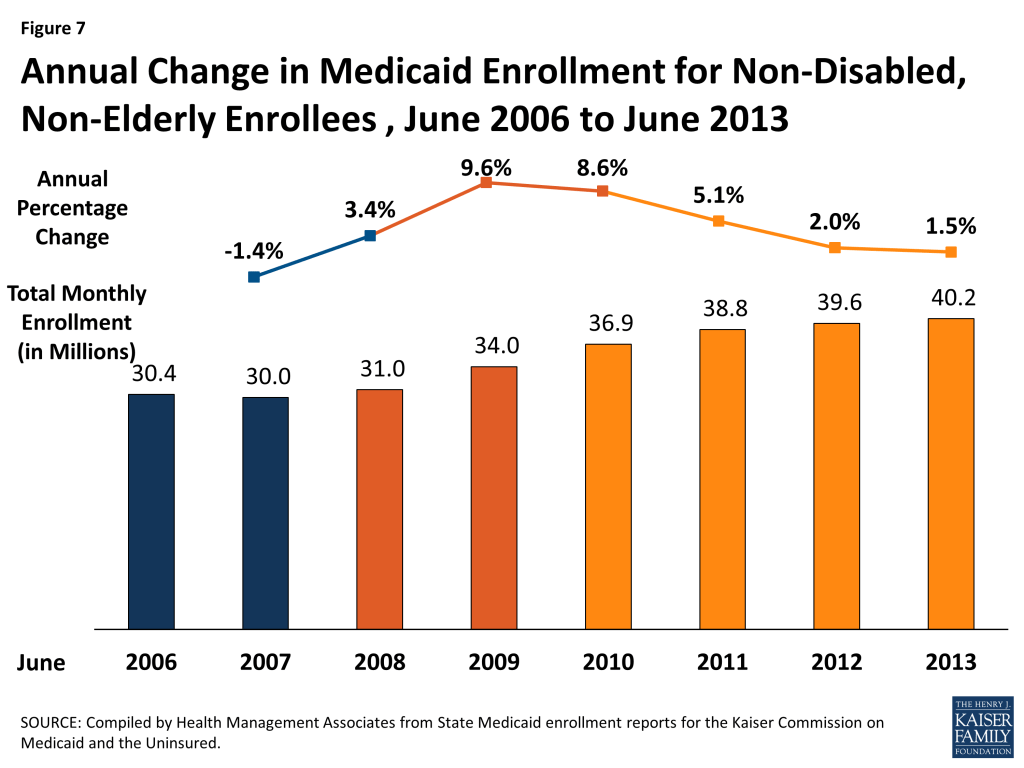
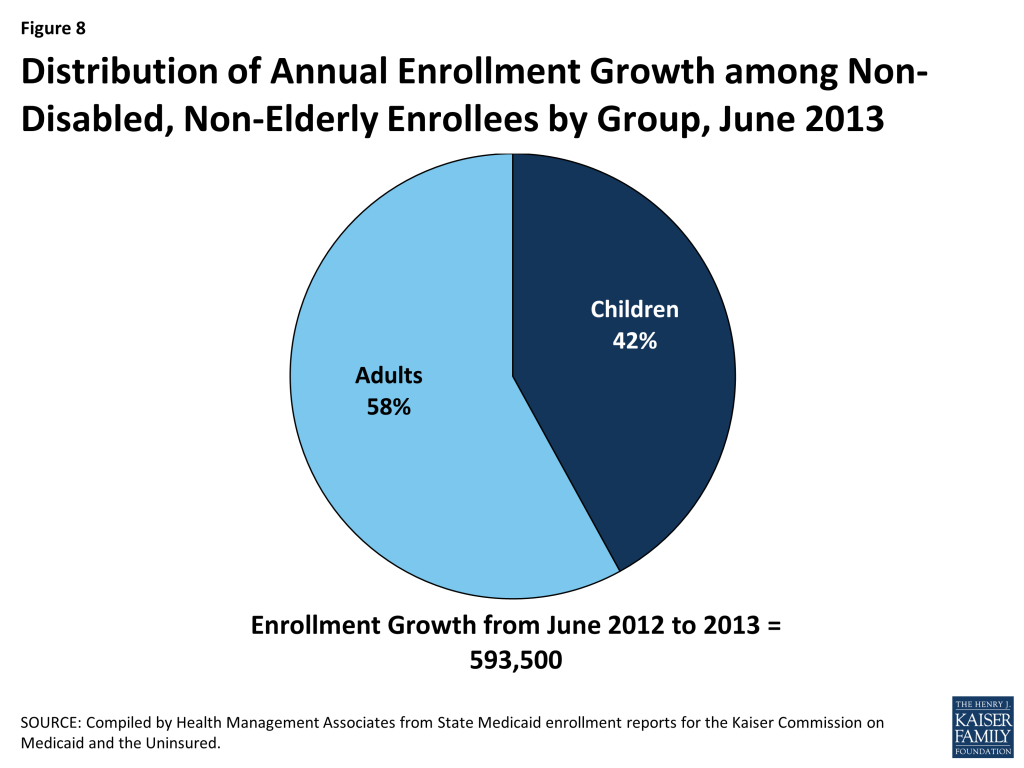
In June 2013, an additional 593,500 non-disabled, non-elderly individuals were enrolled in Medicaid compared to the same month one year earlier. Enrollment growth has slowed for this group, falling to the lowest growth rate since the start of the Great Recession (1.5 percent), reflecting improvements in the economy. Enrollment growth for this population was driven by increased enrollment among adults as well as children. Nearly 60 percent of the most recent annual enrollment growth for this group was due to increased adult enrollment. (Figure 8)
Cross state trends in enrollment for non-disabled, non-elderly adults and non-disabled children are discussed separately below. Enrollment trends for adult expansions are discussed in a separate appendix (Appendix B) at the end of this report.
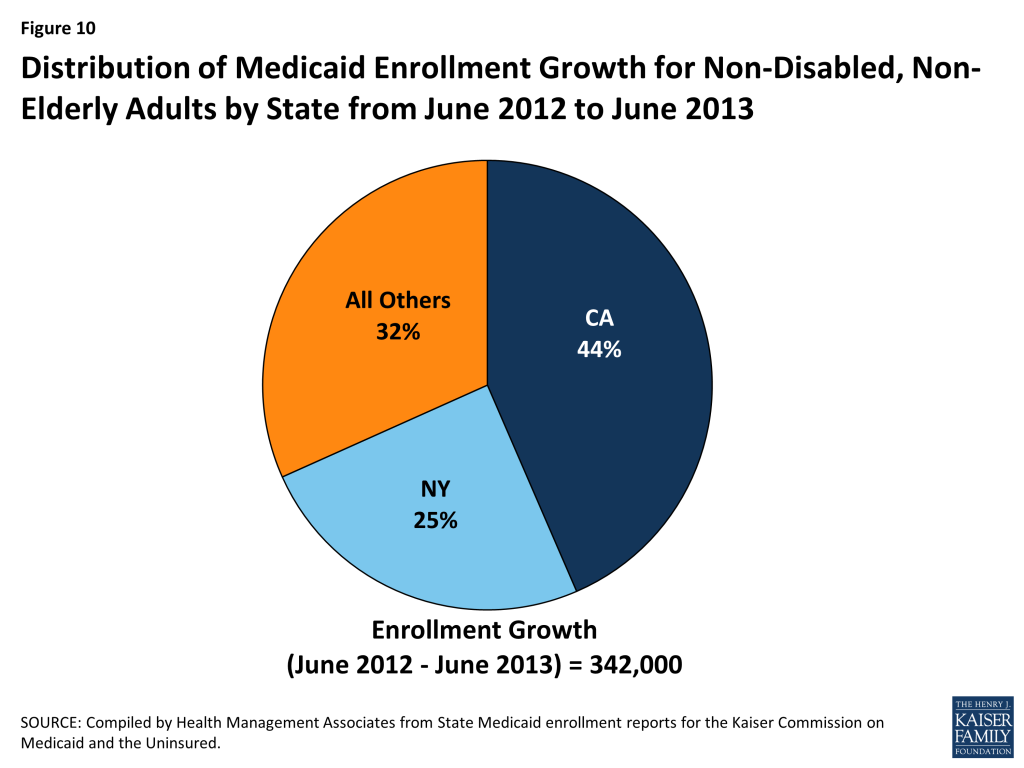
In June 2013, nearly 12.2 million non-disabled, non-elderly adults were enrolled in Medicaid programs across the country. In spite of some states expanding eligibility, enrollment growth among this group has fallen to a post-recessionary low at 2.9 percent. An additional 342,000 adults were enrolled in Medicaid programs between June 2012 and June 2013; over two-thirds of this growth occurred in two states (California and New York.) (Figure 10)
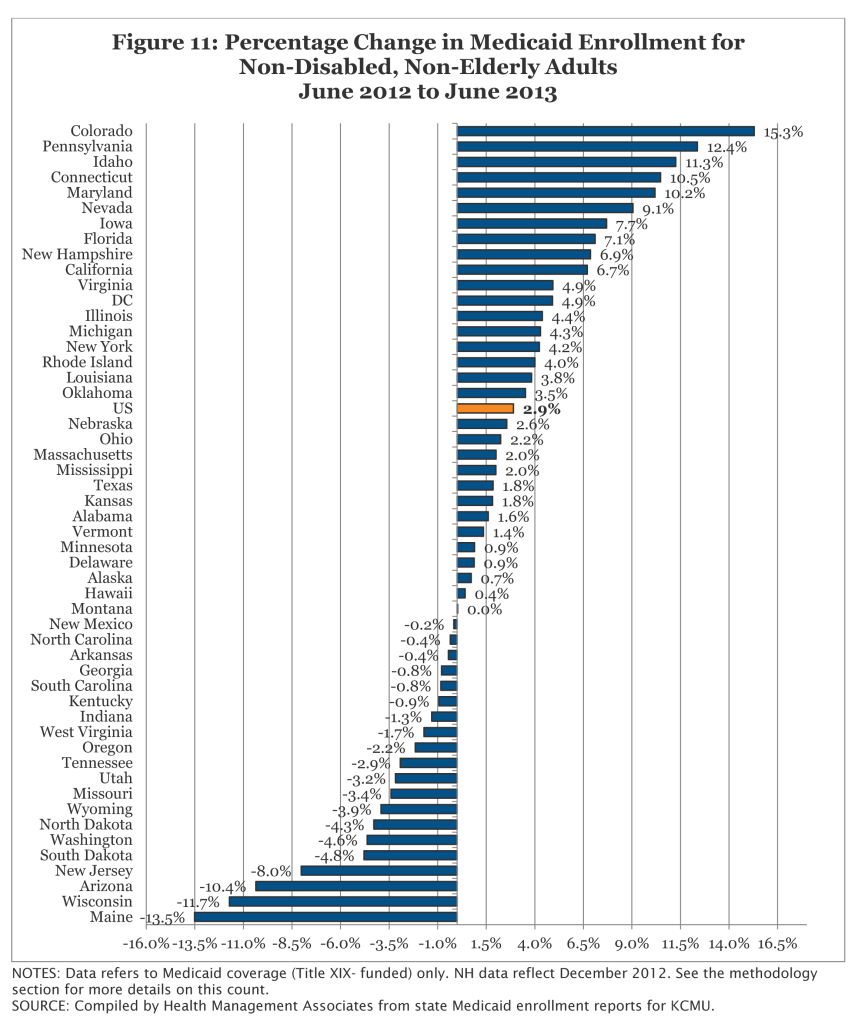
Five states (Colorado, Pennsylvania, Idaho, Connecticut, and Maryland) saw double digit growth among this group during the period from June 2012 to June 2013 (Figure 11); three of these states (Colorado, Connecticut and Maryland) have expanded coverage to childless adults recently. During this same period, 20 states saw declines in enrollment among non-elderly adults. The largest declines occurred in Arizona, Maine, and Wisconsin. Each of these states recently implemented eligibility restrictions permissible under exemptions from the MOE.
In June 2013, over 28 million children were enrolled in Medicaid. As reported for other groups, enrollment growth fell to a post-recessionary low at less than one percent (0.9%.) During this period, an additional 252,000 children were enrolled in the program compared to one year earlier. Nearly 80 percent of this growth occurred in four states (Colorado, Florida, New York, and South Carolina.) (Figure 12) Three of these states implemented policy changes that likely contributed to their enrollment growth among children.8
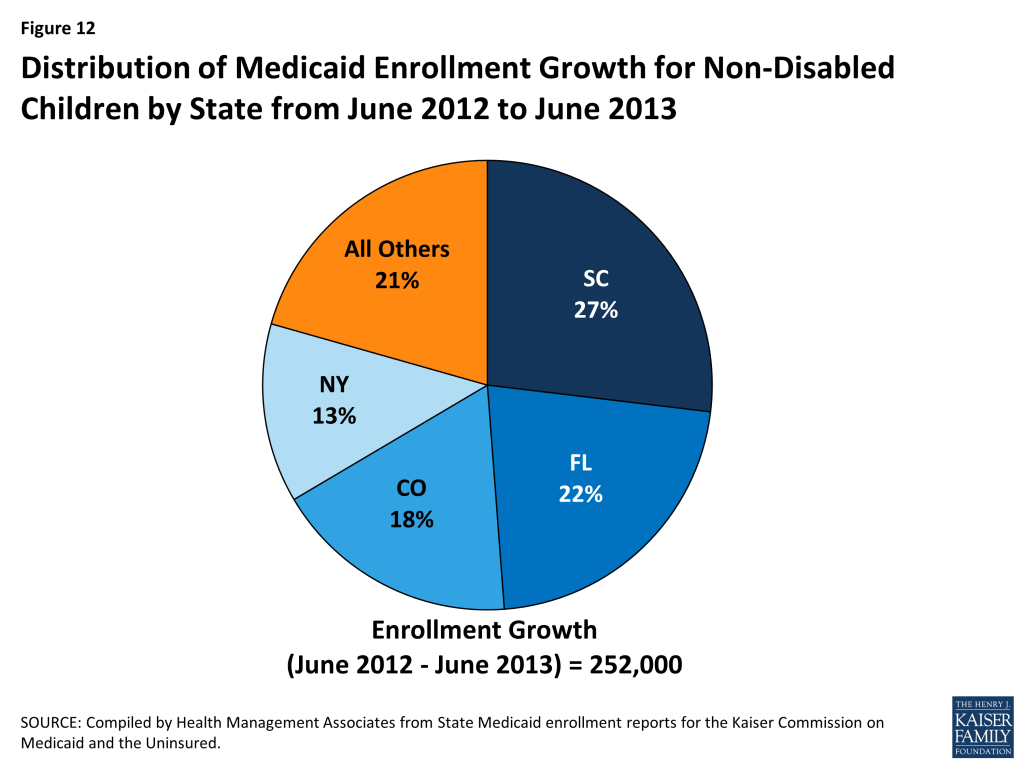
During the period from June 2012 to June 2013, 17 states saw declines in enrollment among children. (Figure 13) However, the declines were relatively small, most under one percentage point. This is due in part to the fact that eligibility levels and enrollment procedures for children in Medicaid and CHIP have been preserved due to the maintenance of eligibility (MOE) requirements; these requirements will remain in effect for children until 2019.

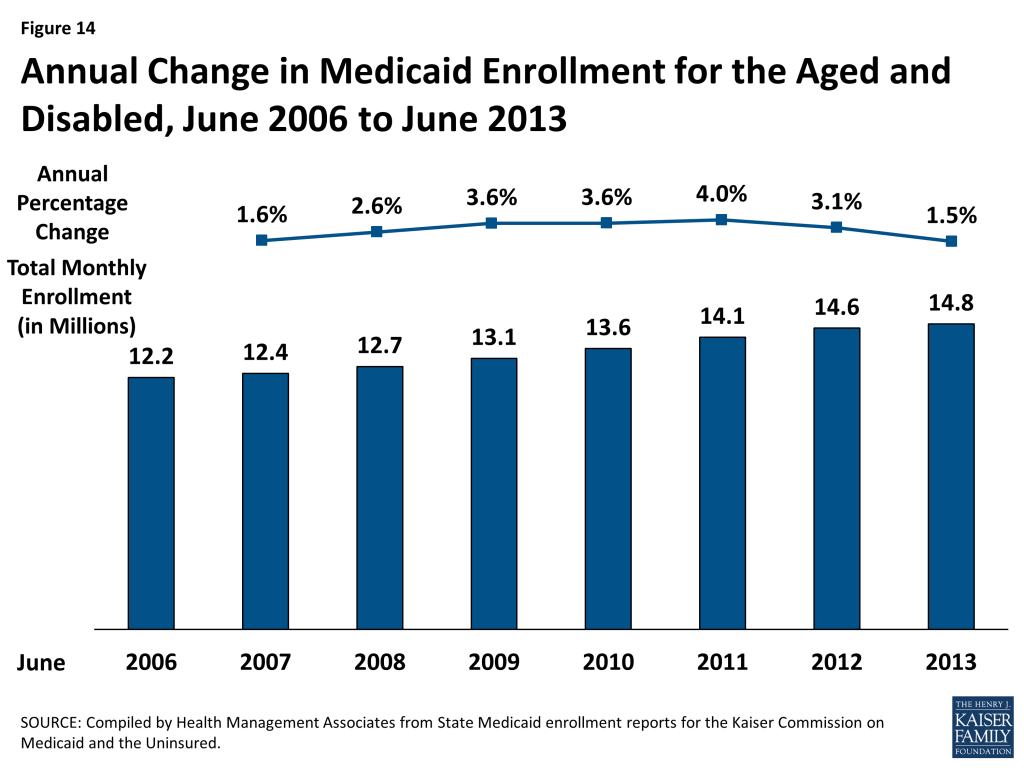
Enrollment among Medicaid enrollees who are aged or living with disabilities, including disabled children and those dually-eligible for Medicare and Medicaid, has risen to nearly 14.8 million in June 2013. Less sensitive to changes in economic conditions, enrollment among the aged and disabled has risen fairly consistently over the past ten years. Nationally, enrollment for this group rose at a slower rate (1.5 percent) over the period from June 2012 to June 2013 than the prior annual period (3.1 percent.) (Figure 14)
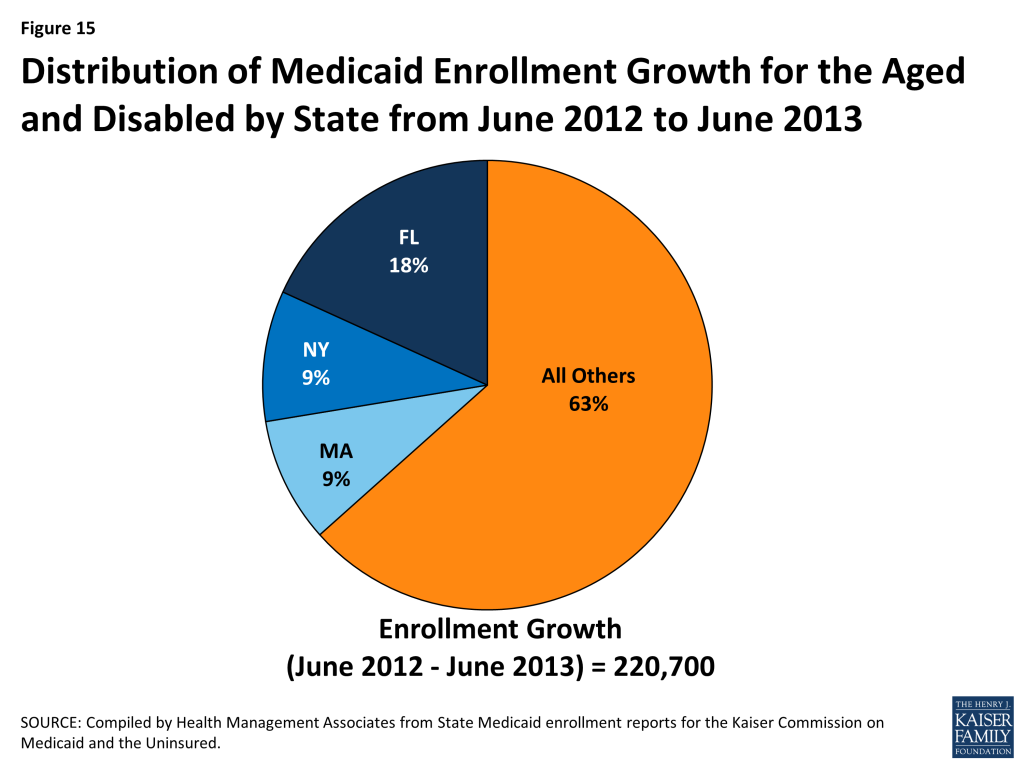
Cross State Trends. Four states (Florida, New York, Massachusetts and Texas) accounted for nearly 40 percent of the annual enrollment growth for this group. (Figure 15) Each of these states has implemented some limited changes to eligibility and enrollment policy in recent years that may partly explain these increases.
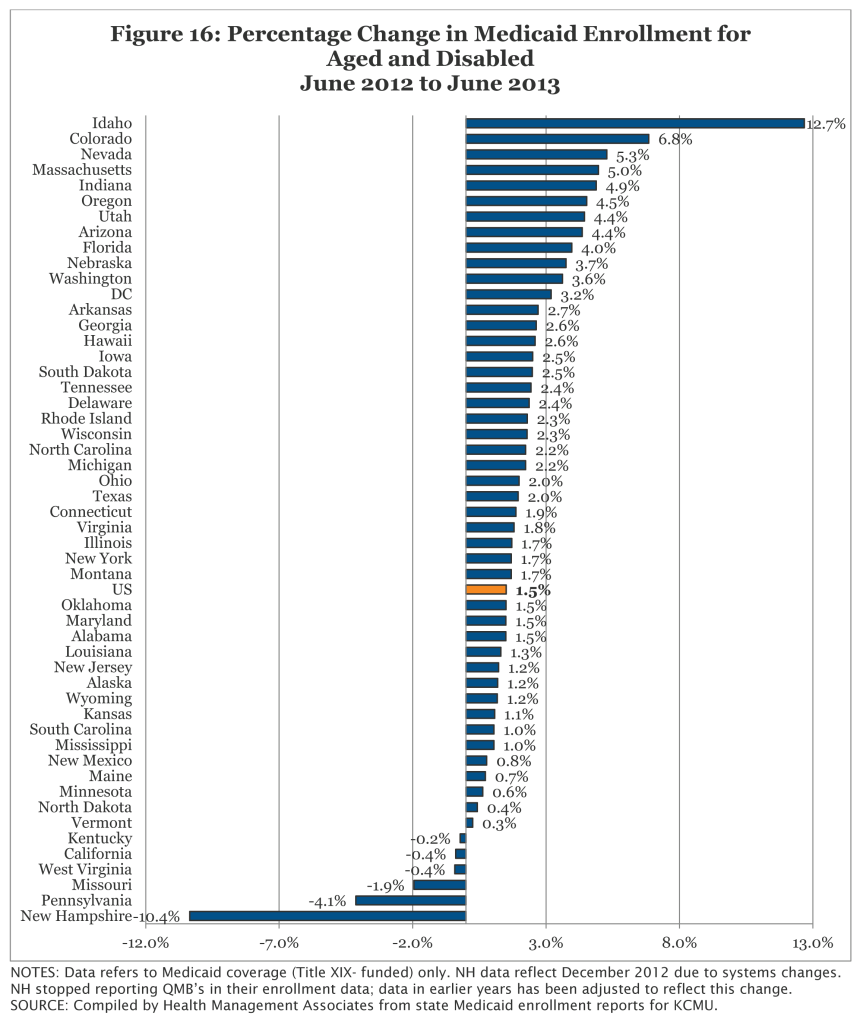
Enrollment for this group grew in all but six states; 41 states saw a slower rate of growth between June 2012 and June 2013 than the previous annual period. The largest decline occurred in Pennsylvania, which saw a decline of over 38,600 among this group during this period (-4.1%.) The decline appears to be concentrated among those individuals enrolled through the General Assistance group.16 In terms of percentage change, Idaho was the only state to experience double-digit enrollment growth for this group during this period (12.7%). (Figure 16) This increase was concentrated among disabled children and adults served by the state’s Total Enhanced Plan.
Overall, Medicaid enrollment growth continued to slow to the lowest rate since the start of the Great Recession as the economic conditions continued to slowly improve. While enrollment growth rates have been trending downward as economic conditions continue to slowly improve, enrollment growth is expected to increase significantly as states implement the ACA. Regardless of whether states decide to implement the Medicaid expansion or not, enrollment is anticipated to grow on average across all states due to new streamlined eligibility and enrollment processes as well as outreach for new coverage.17
This report provides baseline data for understanding the impact of the ACA eligibility and enrollment policies on enrollment growth across states. Future reports will examine the changes in trends across states and eligibility groups, especially differences between states that are implementing the Medicaid expansion in 2014 and states not moving forward with the expansion at this time.
This Data Snapshot was prepared by Laura Snyder and Robin Rudowitz of the Kaiser Family Foundation along with Eileen Ellis and Dennis Roberts at Health Management Associates.
Methodology. This study is based on data provided by each of the 50 states and the District of Columbia. Health Management Associates asked each state to provide the internal reports they use to track enrollment in the program. Each state’s report included total enrollment and enrollment in certain eligibility categories. Report categories are not standardized across states. Where it was possible to do so, the state enrollment data were grouped to further examine trends in specific Medicaid eligibility categories. The data tables and graphs in this document present “point-in-time” monthly Medicaid enrollment counts for the months of June and December of each year from 2000 through 2013 rather than “ever-enrolled” counts published by CMS. The data were provided to HMA by each state Medicaid program in November and early December 2013. Historical data may change over time as states change how they report their enrollment data as well as if a state provides revised data for previous time periods.
Net Change. The data collected for this report are net changes in enrollment across the program and within select eligibility groups, taking into account the net impact of individuals enrolling and disenrolling from the Medicaid program. Because these data are not individual level data and states do not make a distinction between enrollment among current beneficiaries and new beneficiaries, it is not possible to determine from this data the number of individuals that left the program and the number that newly enrolled in a given time period, i.e. the churn within the program. For example, this data set cannot be used to determine how many of the 55.0 million beneficiaries enrolled in June 2013 had also been enrolled in June 2012.
Definitions of Medicaid Enrollment. The counts provided by the states reflect all persons with Medicaid eligibility for each month. Every person with Medicaid coverage was counted as an enrollee with the exception of family planning waiver enrollees and pharmacy plus waiver enrollees. No adjustment was made for other persons who are enrolled in Medicaid categories with less than full coverage. Therefore the enrollment figures reported here include a small number of individuals that are covered by Medicaid only for emergency services as well as persons with Medicare and Medicaid dual eligibility enrolled as either Specified Low-Income Medicare Beneficiaries (SLMBs) or Qualified Individuals (QIs) for whom Medicaid pays only a portion of Medicare premiums, copays and deductibles or as Qualified Medicare Beneficiaries (QMBs) for whom Medicaid covers some additional services Medicare does not as well as the premium and cost-sharing assistance provided to SLMBs or QIs. To the extent possible, state-only health coverage programs and Medicaid expansion CHIP enrollees not funded by Medicaid are excluded.
Non-Disabled Children and Non-Disabled, Non-Elderly Adults. To remain consistent with other enrollment reports, such as the Medicaid Statistical Information System (MSIS), this report groups disabled children in the elderly and disabled category. However, the detail provided in enrollment reports from states varies in the level of detail available. Most states are able to provide data that breaks out the number of non-disabled children either within the same report or through a separate report. In 2 states (IL and WI) some estimation is required due to differences in report totals to determine the number of non-disabled children. Raw data used for California only breaks out children compared to adults and does not break out non-disabled children from disabled children in more recent periods. To make this measure comparable to other states, the ratio of all non-disabled children to all non-disabled, non-elderly adults from an earlier time period was applied to the non-disabled, non-elderly group.
Additionally, there are a relatively small number of enrollees for whom their eligibility pathway was not identified by the state. These individuals were included in the non-disabled, non-elderly adult counts unless they were clearly identified as children.
State Variation in Enrollment Reports. Common variations across the states include how states count “spend-down” enrollees and whether states adjust for “retroactive” eligibiles. Some states include in their enrollment counts persons with excess income that qualify to “spend-down” to Medicaid eligibility whether or not they have incurred sufficient medical costs to become eligible for Medicaid in that month. Other states only include those individuals that have met their “spend-down” requirement. Since a primary goal of this report is to identify trends, these variations have been deemed acceptable given that the state does not change its methodology over time. Data for some states include “retroactive” eligibles, i.e., individuals whose Medicaid eligibility is established at a later date, but whose coverage is retroactive to a prior point in time. Effort was made to use reports that reflect retroactive eligibility where they exist. Yet, it is possible that additional changes occurred after the counts provided for use here.
| Table A-1: Total Medicaid Enrollment by State (Monthly Enrollment in Thousands), June 2006 – 2013 | ||||||||
| State | 2006 | 2007 | 2008 | 2009 | 2010 | 2011 | 2012 | 2013 |
| Alabama | 690.5 | 665.2 | 698.0 | 736.1 | 783.1 | 832.3 | 836.8 | 846.4 |
| Alaska | 88.3 | 85.7 | 83.3 | 86.9 | 100.6 | 107.2 | 109.2 | 109.6 |
| Arizona | 984.7 | 988.4 | 1,056.2 | 1,216.5 | 1,356.6 | 1,370.1 | 1,297.4 | 1,263.9 |
| Arkansas | 480.7 | 492.6 | 487.6 | 514.0 | 526.5 | 538.9 | 544.7 | 548.3 |
| California | 6,425.9 | 6,416.2 | 6,557.0 | 6,899.6 | 7,178.6 | 7,551.9 | 7,844.5 | 7,967.7 |
| Colorado | 401.7 | 381.1 | 407.2 | 467.6 | 526.2 | 588.9 | 651.1 | 729.1 |
| Connecticut | 379.3 | 388.3 | 416.2 | 443.8 | 525.2 | 565.6 | 582.4 | 613.6 |
| DC | 125.7 | 126.5 | 126.2 | 134.1 | 145.4 | 189.9 | 198.2 | 203.7 |
| Delaware | 144.5 | 144.3 | 153.1 | 166.7 | 181.6 | 198.7 | 208.4 | 211.0 |
| Florida | 2,185.3 | 2,055.3 | 2,151.7 | 2,502.8 | 2,801.7 | 2,993.8 | 3,156.8 | 3,290.0 |
| Georgia | 1,325.7 | 1,224.5 | 1,266.9 | 1,387.1 | 1,457.4 | 1,501.7 | 1,528.5 | 1,536.3 |
| Hawaii | 187.6 | 184.9 | 192.3 | 214.4 | 234.9 | 247.0 | 260.5 | 263.5 |
| Idaho | 167.1 | 171.9 | 171.4 | 183.6 | 207.0 | 215.0 | 220.2 | 231.1 |
| Illinois | 1,805.1 | 1,930.3 | 2,043.4 | 2,194.4 | 2,451.8 | 2,566.2 | 2,624.1 | 2,610.7 |
| Indiana | 779.4 | 787.7 | 827.4 | 920.3 | 964.8 | 978.4 | 1,015.3 | 1,033.0 |
| Iowa | 316.3 | 314.1 | 334.9 | 374.3 | 407.4 | 430.9 | 451.9 | 466.2 |
| Kansas | 265.9 | 245.1 | 253.7 | 264.4 | 285.0 | 325.3 | 342.7 | 359.1 |
| Kentucky | 683.5 | 695.0 | 698.5 | 748.5 | 775.0 | 794.5 | 798.4 | 802.1 |
| Louisiana | 892.5 | 827.2 | 858.9 | 898.3 | 962.7 | 997.3 | 1,043.1 | 1,049.2 |
| Maine | 248.4 | 262.0 | 254.5 | 262.1 | 279.7 | 297.6 | 285.6 | 275.7 |
| Maryland | 507.2 | 525.0 | 549.8 | 659.6 | 770.7 | 847.9 | 889.7 | 936.0 |
| Massachusetts | 963.5 | 997.9 | 1,053.6 | 1,095.5 | 1,150.2 | 1,190.9 | 1,233.2 | 1,272.8 |
| Michigan | 1,460.4 | 1,502.1 | 1,526.3 | 1,684.8 | 1,870.0 | 1,940.2 | 1,891.7 | 1,929.2 |
| Minnesota | 585.6 | 585.3 | 603.8 | 663.9 | 714.9 | 831.9 | 868.1 | 879.1 |
| Mississippi | 539.7 | 509.9 | 530.6 | 577.3 | 600.5 | 617.8 | 622.2 | 622.7 |
| Missouri | 724.8 | 717.8 | 750.7 | 778.3 | 817.5 | 824.4 | 816.9 | 797.1 |
| Montana | 84.2 | 90.1 | 89.2 | 95.1 | 105.9 | 112.5 | 115.3 | 120.8 |
| Nebraska | 178.7 | 177.2 | 177.3 | 190.0 | 201.1 | 207.2 | 206.1 | 212.3 |
| Nevada | 171.8 | 170.2 | 188.9 | 213.5 | 263.6 | 290.9 | 301.0 | 313.5 |
| New Hampshire | 108.8 | 110.1 | 114.3 | 124.1 | 130.5 | 133.9 | 134.0 | 138.8 |
| New Jersey | 751.3 | 761.4 | 781.3 | 812.4 | 855.9 | 898.1 | 980.8 | 987.0 |
| New Mexico | 369.0 | 380.4 | 432.3 | 472.7 | 508.7 | 509.4 | 508.9 | 507.6 |
| New York | 4,177.2 | 4,101.0 | 4,139.6 | 4,417.9 | 4,722.2 | 4,902.9 | 5,004.0 | 5,141.7 |
| North Carolina | 1,179.0 | 1,179.6 | 1,238.2 | 1,331.1 | 1,358.4 | 1,391.5 | 1,470.9 | 1,501.3 |
| North Dakota | 53.0 | 51.7 | 51.9 | 58.7 | 63.7 | 65.7 | 65.6 | 65.2 |
| Ohio | 1,601.2 | 1,580.5 | 1,653.3 | 1,796.7 | 1,946.0 | 1,993.3 | 2,055.7 | 2,072.1 |
| Oklahoma | 497.3 | 525.9 | 522.4 | 563.0 | 602.6 | 627.3 | 653.6 | 663.8 |
| Oregon | 361.2 | 338.7 | 356.5 | 393.4 | 455.5 | 541.5 | 568.6 | 572.3 |
| Pennsylvania | 1,877.4 | 1,887.6 | 1,925.7 | 2,017.8 | 2,115.9 | 2,215.7 | 2,098.5 | 2,097.8 |
| Rhode Island | 167.6 | 163.7 | 158.7 | 159.3 | 165.6 | 170.8 | 172.2 | 178.6 |
| South Carolina | 650.2 | 618.6 | 643.4 | 681.7 | 690.8 | 691.5 | 711.0 | 781.1 |
| South Dakota | 88.9 | 89.7 | 90.9 | 95.3 | 101.3 | 102.2 | 102.8 | 102.4 |
| Tennessee | 1,255.7 | 1,215.3 | 1,237.0 | 1,266.3 | 1,266.4 | 1,289.1 | 1,317.8 | 1,305.6 |
| Texas | 2,800.7 | 2,864.9 | 2,882.6 | 3,099.7 | 3,358.5 | 3,592.0 | 3,648.2 | 3,644.2 |
| Utah | 199.5 | 186.3 | 193.0 | 230.8 | 246.0 | 273.0 | 283.3 | 289.9 |
| Vermont | 118.3 | 116.2 | 124.5 | 133.9 | 136.2 | 139.9 | 141.8 | 142.7 |
| Virginia | 646.3 | 638.0 | 665.8 | 720.6 | 785.7 | 808.4 | 832.7 | 851.4 |
| Washington | 865.4 | 860.3 | 888.3 | 969.2 | 1,038.7 | 1,114.5 | 1,128.3 | 1,132.3 |
| West Virginia | 308.8 | 300.2 | 307.4 | 320.1 | 331.4 | 335.4 | 333.5 | 332.6 |
| Wisconsin | 667.3 | 673.6 | 725.3 | 826.7 | 942.3 | 963.4 | 969.7 | 956.5 |
| Wyoming | 58.3 | 56.0 | 55.6 | 61.2 | 67.1 | 67.8 | 67.3 | 66.4 |
| Total | 42,597 | 42,361 | 43,696 | 47,126 | 50,535 | 52,982 | 54,193 | 55,025 |
NOTES: Data refers to Medicaid coverage (Title XIX- funded) only. NH data reflect December 2012.SOURCE: Compiled by Health Management Associates from state Medicaid enrollment reports for KCMU. | ||||||||
| Table A-2: Total Medicaid Enrollment by State (Percentage Change), June 2005 – 2013 | ||||||||
| State | 05-06 | 06-07 | 07-08 | 08-09 | 09-10 | 10-11 | 11-12 | 12-13 |
| Alabama | 0.5% | -3.7% | 4.9% | 5.5% | 6.4% | 6.3% | 0.5% | 1.2% |
| Alaska | 1.6% | -2.9% | -2.9% | 4.3% | 15.8% | 6.6% | 1.9% | 0.3% |
| Arizona | -2.0% | 0.4% | 6.9% | 15.2% | 11.5% | 1.0% | -5.3% | -2.6% |
| Arkansas | 4.9% | 2.5% | -1.0% | 5.4% | 2.4% | 2.4% | 1.1% | 0.7% |
| California | -0.7% | -0.2% | 2.2% | 5.2% | 4.0% | 5.2% | 3.9% | 1.6% |
| Colorado | -2.2% | -5.1% | 6.8% | 14.8% | 12.5% | 11.9% | 10.6% | 12.0% |
| Connecticut | -3.2% | 2.4% | 7.2% | 6.6% | 18.3% | 7.7% | 3.0% | 5.4% |
| DC | -0.7% | 0.6% | -0.3% | 6.3% | 8.4% | 30.6% | 4.3% | 2.8% |
| Delaware | 5.7% | -0.1% | 6.1% | 8.9% | 8.9% | 9.4% | 4.9% | 1.2% |
| Florida | -0.7% | -5.9% | 4.7% | 16.3% | 11.9% | 6.9% | 5.4% | 4.2% |
| Georgia | -3.9% | -7.6% | 3.5% | 9.5% | 5.1% | 3.0% | 1.8% | 0.5% |
| Hawaii | 0.7% | -1.4% | 4.0% | 11.5% | 9.6% | 5.1% | 5.5% | 1.2% |
| Idaho | -0.2% | 2.9% | -0.3% | 7.1% | 12.7% | 3.9% | 2.4% | 4.9% |
| Illinois | 4.5% | 6.9% | 5.9% | 7.4% | 11.7% | 4.7% | 2.3% | -0.5% |
| Indiana | 2.8% | 1.1% | 5.0% | 11.2% | 4.8% | 1.4% | 3.8% | 1.7% |
| Iowa | 9.1% | -0.7% | 6.6% | 11.8% | 8.8% | 5.8% | 4.9% | 3.1% |
| Kansas | 1.5% | -7.8% | 3.5% | 4.2% | 7.8% | 14.1% | 5.3% | 4.8% |
| Kentucky | 1.7% | 1.7% | 0.5% | 7.2% | 3.5% | 2.5% | 0.5% | 0.5% |
| Louisiana | 0.5% | -7.3% | 3.8% | 4.6% | 7.2% | 3.6% | 4.6% | 0.6% |
| Maine | -0.9% | 5.4% | -2.9% | 3.0% | 6.7% | 6.4% | -4.0% | -3.5% |
| Maryland | 0.1% | 3.5% | 4.7% | 20.0% | 16.9% | 10.0% | 4.9% | 5.2% |
| Massachusetts | 4.1% | 3.6% | 5.6% | 4.0% | 5.0% | 3.5% | 3.6% | 3.2% |
| Michigan | 2.7% | 2.9% | 1.6% | 10.4% | 11.0% | 3.8% | -2.5% | 2.0% |
| Minnesota | 0.1% | -0.1% | 3.2% | 9.9% | 7.7% | 16.4% | 4.4% | 1.3% |
| Mississippi | -9.0% | -5.5% | 4.1% | 8.8% | 4.0% | 2.9% | 0.7% | 0.1% |
| Missouri | -17.4% | -1.0% | 4.6% | 3.7% | 5.0% | 0.9% | -0.9% | -2.4% |
| Montana | -1.7% | 7.0% | -1.1% | 6.6% | 11.3% | 6.2% | 2.5% | 4.8% |
| Nebraska | 1.3% | -0.9% | 0.1% | 7.2% | 5.8% | 3.0% | -0.5% | 3.0% |
| Nevada | 0.1% | -1.0% | 11.0% | 13.0% | 23.4% | 10.4% | 3.4% | 4.2% |
| New Hampshire | 2.1% | 1.2% | 3.8% | 8.5% | 5.2% | 2.6% | 0.0% | 3.6% |
| New Jersey | 5.0% | 1.3% | 2.6% | 4.0% | 5.4% | 4.9% | 9.2% | 0.6% |
| New Mexico | 0.6% | 3.1% | 13.7% | 9.3% | 7.6% | 0.1% | -0.1% | -0.2% |
| New York | 1.1% | -1.8% | 0.9% | 6.7% | 6.9% | 3.8% | 2.1% | 2.8% |
| North Carolina | 3.6% | 0.1% | 5.0% | 7.5% | 2.1% | 2.4% | 5.7% | 2.1% |
| North Dakota | 1.2% | -2.5% | 0.4% | 13.1% | 8.5% | 3.2% | -0.1% | -0.6% |
| Ohio | 2.1% | -1.3% | 4.6% | 8.7% | 8.3% | 2.4% | 3.1% | 0.8% |
| Oklahoma | 2.2% | 5.7% | -0.7% | 7.8% | 7.0% | 4.1% | 4.2% | 1.6% |
| Oregon | -1.6% | -6.2% | 5.2% | 10.4% | 15.8% | 18.9% | 5.0% | 0.7% |
| Pennsylvania | 5.1% | 0.5% | 2.0% | 4.8% | 4.9% | 4.7% | -5.3% | 0.0% |
| Rhode Island | 0.1% | -2.4% | -3.0% | 0.4% | 3.9% | 3.1% | 0.8% | 3.7% |
| South Carolina | -0.6% | -4.8% | 4.0% | 6.0% | 1.3% | 0.1% | 2.8% | 9.9% |
| South Dakota | 0.7% | 1.0% | 1.3% | 4.8% | 6.3% | 0.9% | 0.6% | -0.4% |
| Tennessee | -9.3% | -3.2% | 1.8% | 2.4% | 0.0% | 1.8% | 2.2% | -0.9% |
| Texas | 0.6% | 2.3% | 0.6% | 7.5% | 8.3% | 7.0% | 1.6% | -0.1% |
| Utah | -2.7% | -6.6% | 3.6% | 19.6% | 6.6% | 11.0% | 3.8% | 2.3% |
| Vermont | 1.9% | -1.8% | 7.2% | 7.5% | 1.8% | 2.7% | 1.3% | 0.6% |
| Virginia | 2.9% | -1.3% | 4.4% | 8.2% | 9.0% | 2.9% | 3.0% | 2.2% |
| Washington | 2.4% | -0.6% | 3.3% | 9.1% | 7.2% | 7.3% | 1.2% | 0.4% |
| West Virginia | 3.0% | -2.8% | 2.4% | 4.1% | 3.5% | 1.2% | -0.6% | -0.3% |
| Wisconsin | 2.7% | 0.9% | 7.7% | 14.0% | 14.0% | 2.2% | 0.6% | -1.4% |
| Wyoming | 1.1% | -3.9% | -0.7% | 10.1% | 9.6% | 1.1% | -0.8% | -1.4% |
| Total | 0.2% | -0.6% | 3.2% | 7.8% | 7.2% | 4.8% | 2.3% | 1.5% |
| NOTES: Data refers to Medicaid coverage (Title XIX- funded) only. NH data reflect December 2012.SOURCE: Compiled by Health Management Associates from state Medicaid enrollment reports for KCMU. | ||||||||
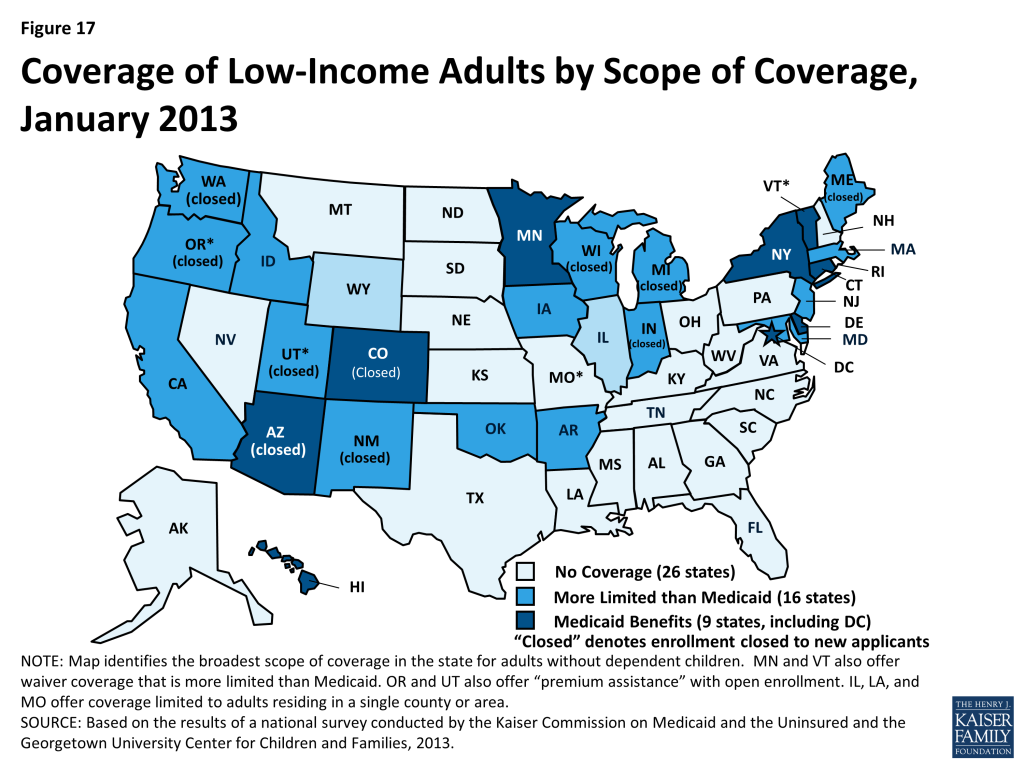
Prior to the ACA, states could not receive federal Medicaid matching funds to cover non-disabled childless adults. As such, states could only cover these adults if they obtained a waiver or through a fully state-funded program. Effective April 2010, the ACA gave states flexibility to expand Medicaid to adults to get an early start on the 2014 expansion. Since April 2010, seven states (CA, CT, CO, DC, MN, NJ, and WA) have expanded coverage to adults through the new ACA option or a waiver to prepare for 2014. However, overall, Medicaid coverage for low-income adults remains very limited. As of January 2013, only nine states, including DC, provided full Medicaid coverage to low-income adults, and enrollment is closed in two of these states. Sixteen states only provide limited coverage to adults, and enrollment is closed in eight of these states. (Figure 17)
In the table on the following page (Table B-1), 17 states were able to report separately enrollment data for childless adults for June 2013; an additional five states reported data that included both parents and childless adults. Of the 2.6 million low-income non-disabled adults covered under expansion programs in these states in June 2013, at least 1.86 million were childless adults. Enrollment in June 2013 was positively affected by continued rollouts of adult expansions in California, Colorado, and Louisiana. In terms of percentage change, four other states (Connecticut, Maryland, Iowa, and Michigan18 ) saw double digit enrollment growth.
In contrast, eleven states reported enrollment declines between June 2012 and June 2013. Enrollment in most of these states for this group was negatively affected by enrollment freezes or enrollment caps either newly instituted or in place in a number of states, most notably in Arizona, where 40,800 fewer childless adults remained enrolled in June 2013 compared to one year earlier.19 Maine and Wisconsin also saw enrollment declines of 25 percent or more, both of which had long-standing enrollment caps for their childless adult waiver programs. Additionally, Wisconsin added premiums to its waiver programs in July 2012.
Coverage for childless adults will markedly change in January 2014. Twenty-six states, including 21 states that currently cover childless adults, plan move forward with the Medicaid expansion in 2014. 20 Eight states (ID, IN, LA, ME, MO, OK, UT, and WI) with current Section 1115 waivers to cover childless adults have indicated that they are not moving forward with the ACA Medicaid expansion in 2014. However, CMS recently approved one-year waiver extensions in 5 of these states (ID, IN, LA, MO, and OK.)21 In these states, the waiver coverage will continue, but coverage will be limited to individuals with incomes below 100% FPL and will not be eligible for the enhanced Medicaid financing available under the ACA. Current Medicaid beneficiaries with incomes above 100% FPL will be eligible for help purchasing coverage in the new Marketplaces. Wisconsin has a waiver proposal would reduce eligibility for childless adults in its existing waiver program to 100% FPL. Maine plans to let their current Section 1115 waiver for childless adults expire, resulting in childless adults covered under the waivers losing eligibility and likely becoming uninsured.
| Table B-1: Adult Expansions June 2011 to June 2013 (Monthly Enrollment in Thousands) | |||||
| State | June 2011 | June 2012 | June 2013 | June 2011 to June 2012 | June 2012 to June 2013 |
| Childless adults | |||||
| Arizona * | 224.5 | 116.4 | 75.7 | -48.1% | -35.0% |
| Colorado | N/A | 7.8 | 14.8 | N/A | 90.5% |
| Connecticut | 72.0 | 79.3 | 91.2 | 10.1% | 15.0% |
| DC ** | 39.2 | 42.9 | 45.3 | 9.3% | 5.8% |
| Delaware | 37.1 | 40.6 | 41.2 | 9.6% | 1.4% |
| Indiana | 16.1 | 15.2 | 12.6 | -5.8% | -17.2% |
| Maine | 16.5 | 13.2 | 9.0 | -20.2% | -31.5% |
| Maryland | 56.8 | 66.7 | 79.6 | 17.4% | 19.2% |
| Massachusetts | 114.7 | 123.4 | 121.0 | 7.5% | -1.9% |
| Michigan | 77.9 | 38.1 | 79.5 | -51.1% | 108.7% |
| Minnesota ** | 83.9 | 83.0 | 87.7 | -1.1% | 5.6% |
| New Jersey**** | N/A | 47.9 | 41.7 | N/A | -13.0% |
| New Mexico ****** | 26.5 | 24.5 | 24.3 | -7.6% | -0.6% |
| New York ***** | 949.3 | 991.7 | 1,046.7 | 4.5% | 5.5% |
| Oregon | 49.5 | 48.5 | 42.5 | -2.0% | -12.5% |
| Vermont | NR | 34.4 | 33.7 | NR | -1.9% |
| Wisconsin | 34.2 | 24.3 | 17.8 | -28.9% | -26.8% |
| Subtotal (Childless adults only) | 1798.3 | 1797.8 | 1864.1 | -0.02% | 3.69% |
| Parents and Childless Adults | |||||
| California | 184.2 | 449.7 | 611.1 | 144.1% | 35.9% |
| Iowa | 46.0 | 56.3 | 65.2 | 22.3% | 15.8% |
| Louisiana ***** | 20.5 | 50.7 | 60.8 | 148.0% | 19.9% |
| Utah **** | 16.8 | 16.7 | 15.5 | -0.3% | -7.3% |
| Washington | 37.9 | 32.9 | 27.6 | -13.2% | -16.1% |
| Subtotal (Parents and Childless adults | 305.4 | 606.3 | 780.2 | 98.5% | 28.7% |
| Total (Both Groups) | 2103.6 | 2404.1 | 2644.3 | 14.3% | 10.0% |
NOTES: There are four additional states that cover childless adults with Title XIX funds that are not included in the table above: Arkansas (premium assistance only), Hawaii, Idaho (premium assistance only), and Oklahoma (premium assistance only.) Enrollment data for childless adults were not included in reports for AR, ID, and OK. Hawaii’s total enrollment data includes this group, but did not break this group out from other enrollees. Additionally, there are county-based expansions in Missouri (St. Louis area), Illinois (Cook County) and Ohio (Cuyahoga County) that were not included in the data reported.NR – The state did not report enrollment for this group for this period.N/A – The state did not cover such individuals during this period.*Arizona data reported here reflect corrections for additional individuals erroneously excluded in prior reporting. Total figures for the state have also been corrected as well.**Data for these states (DC and MN) reflect childless adults covered under state plan options, but do not reflect childless adults covered under an 1115 waivers (though they are reported in total figures.)***New Jersey data reported here reflects enrollment among childless adults covered under the state’s 1115 waiver granted April 2011; data do not reflect enrollment in FamilyCare, which is funded with both Title XIX and Title XXI funds.****Utah data reported here reflect enrollment in their Primary Care waiver program, which covers both parents and childless adults; previous reports had erroneously categorized this as childless adults previously.*****Louisiana has an approved 1115 waiver to establish the Greater New Orleans Community Health Connection (GNOCHC) program. The program serves non-elderly adults in the New Orleans area with incomes under 200% FPL.****** Estimates of the share of childless adults covered under Section 1115 waiver programs in these states (NM and NY) are reported here.SOURCE: Compiled by Health Management Associates from state Medicaid enrollment reports for KCMU. | |||||
On October 1, 2013, open enrollment began for new Health Insurance Marketplaces established under the Affordable Care Act (ACA). To learn more about the early ACA enrollment experience in two states, the Kaiser Commission on Medicaid and the Uninsured and PerryUndem Research and Communication conducted focus groups in Baltimore, Maryland and Reno, Nevada in November 2013 with low- and moderate-income individuals who recently applied for health insurance and consumer assisters trained to help individuals enroll. This study builds on previous work that examined preparations for open enrollment in several states, including Maryland and Nevada, which are both moving forward with the ACA’s Medicaid expansion to low-income adults and have established their own State-based Marketplace (SBM).1 At the time of the study, both states were working through significant problems with their Marketplace websites that hampered enrollment. The focus group discussions included only adults who had successfully applied as well as consumer assisters to gain a greater understanding of these individuals’ experiences. Further, since they reflect the experiences of individuals in these states who sought coverage, they are not representative of the uninsured population.
The recent applicants in the focus groups were low- and moderate-income adults within the income range to qualify for Medicaid (up to 138% FPL) or for tax credit subsidies for Marketplace coverage (139%-400% FPL). Participants in the two consumer assister focus groups included a diverse set of individuals who are helping to reach and enroll eligible uninsured individuals in their communities. They included Navigators in Maryland and Navigators, application assisters, and insurance brokers in Nevada. The assisters reported helping a broad range of people determined eligible for Medicaid, tax credits, and unsubsidized Marketplace coverage under the ACA. Many noted that a large share of people they were helping were found eligible for Medicaid, reflecting the fact that the Medicaid expansion significantly expands eligibility levels for adults. Following are key findings about the early ACA enrollment experience in Baltimore, Maryland and Reno, Nevada based on focus group discussions with these recent applicants and enrollment assisters.
“I need the health insurance because I’ve got some health issues and…if I had to pay… out of my pocket…. It will be extremely, extremely high.”-Recent applicant in Baltimore..
“[I feel] relieved. Just in case something does happen…I can go to my doctor and it’s an amount that I can pay.”-Recent applicant in Reno
.“I’ve had people come in from the hospital; like this woman literally had come out of the hospital from getting her gallbladder surgery and …she had her hospital bracelet on and was like oh yeah, [I want the coverage] because she couldn’t afford the medication.”-Navigator in Baltimore
Recent applicants learned about new coverage options through a number of sources including friends and family, advertising, and the media. Several applicants in Baltimore also said they had heard the President talk about the new health care law on television. Most had seen or heard television and radio advertising from their State-based Marketplace or received information about coverage through their church, at job fairs, or in other places in the community. A few attended town hall meetings hosted by Navigators or received pamphlets from their employers or through other social service offices. In Reno, several participants mentioned that they had heard about the new coverage options directly from their health care provider, as a number were participating in a health care program that connects uninsured adults to discounted health care services, which is now helping to connect adults to the ACA coverage options.
Most individuals were eagerly anticipating their coverage beginning in January, although some expressed concerns about costs. While, historically, stigma has sometimes been a barrier to Medicaid enrollment, most of the focus group participants who were found eligible for Medicaid expressed satisfaction about qualifying for the program and appreciated the program’s limited costs given their constrained financial situations. Assisters also indicated that when consumers they assist qualify for Medicaid, they generally are pleased with the program’s limited costs and broad benefits. A few applicants that qualified for tax credits expressed concern about the cost of new plans, though assisters indicated that applicants’ perceptions of plan costs were often influenced by a variety of factors, including individuals’ financial situation and bills, health needs, and prior experiences paying for health insurance. Those consumers who had previously searched for or paid high premiums for individual policies or COBRA viewed subsidized premiums through the Marketplace as affordable and a good value compared to their earlier experiences. For example, one consumer in Baltimore had searched for private coverage on the individual market prior to the ACA but had a number of preexisting conditions. She was denied coverage by several insurers and was unable to afford the premiums for plans that she was offered. With the premium tax credit subsidy for Marketplace coverage, she was able to find a plan she found to be affordable. In contrast, some individuals who had never paid for insurance and/or who had very limited budgets did not view the premiums as affordable, even though they qualified for subsidies to lower costs. Nevertheless, many focus group participants who had completed the enrollment process had been found eligible for Medicaid or premium tax credit subsidies for Marketplace coverage and said they felt relieved and excited that they would have coverage in January.
“Regular insurance, private insurance cost me a lot of money. It’s like to pay one apartment…and I got denied it because I got diabetes and arthritis and [they] didn’t want to insure me… [In October,] the [insurance agent] told me where I had to go apply. I’m very surprised. I said to the lady, this is so good to be true.-Recent applicant in Baltimore.“…and people are looking for more affordable coverage…I just dealt with a woman who works at a university and her husband is a teacher’s assistant and his insurance was ridiculous, the cost was ridiculous, so I mean people are really looking for less expensive insurance that covers the service needed for their families.”-Navigator in Baltimore
In Maryland and Nevada, a wide range of assisters, including Navigators, enrollment assisters, Certified Application Counselors, and insurance brokers were trained to help consumers with the enrollment process. Nearly all of the recent applicants in the focus groups indicated that had received some help from a Navigator or other assister to apply for health coverage. The assisters participating in the focus groups had varied backgrounds with different levels of previous experience with insurance. While a few had prior experience helping children and families enroll in Medicaid and CHIP, many had previously worked in other sectors and had little experience with health insurance enrollment prior to the ACA. Overall, there was general consensus among the assisters that they received adequate training to help them start their work. However, in both states, only a few assisters had the opportunity to test the online enrollment portal before open enrollment began. Assisters indicated that they continued to learn more as they gained experience working directly with consumers and the enrollment portal and after working with the portal for several weeks, they felt more confident using it.
The assisters explained that a big part of their job is to educate consumers about the new health coverage options. Some are providing broad outreach and education through a variety of locations, including churches, supermarkets, flea markets, health fairs, job training programs, schools, libraries, and food banks. They noted that consumer attendance at these education events is continuing to grow over time.
“We do presentations once a week at one of our main clinics and…we do presentations everywhere, our assistors are mainly at the clinics and sometimes at different places like Catholic charities or the food bank….”-Assister in Reno
“Mine is a unique method; I go to a market, a Korean grocery market on Saturday and Sunday…and give them the brochures and the flyers and give a short explanation that it translate into Korean… And then I go to a Korean church on Sunday and give them the presentation and then they call during the week day and make appointment and enroll.”-Navigator in Baltimore
In addition, assisters in the focus groups indicated that they were providing direct one-on-one assistance to help individuals apply and enroll. In some cases, consumers are coming to assisters at clinics or other locations for this assistance, while other assisters are out in the community using laptops or tablets to help people enroll. As assisters worked with consumers, many developed strategies to facilitate the enrollment process and work around early limitations of the online enrollment portal. For example, a number were printing copies of completed applications and eligibility determinations for their clients to make sure they had a record of their application and could track its status if needed. In Maryland, some assisters had consumers complete paper applications due to early problems with the online portal, but then began inputting those applications into the portal as the issues were resolved. Assisters also noted that they keep in touch with individuals they help to keep them updated on the status of their applications. Assisters in both locations also noted that they have been communicating with their state Marketplaces to help them identify and troubleshoot enrollment portal problems and continue to make improvements.
“The portal’s working so well right now… In fact, I have not had to do a paper application for two weeks…you know…there’s going to be bugs in a system that is just being launched no matter what it is.”-Assister in Reno
“I… keep in touch with [my clients] so they can know that even though their case is not completely finished…I’m still working on it…I can make them feel that they are not alone, that somebody is working on their behalf.”-Navigator in Baltimore
Applicants were generally patient with website problems they encountered as they tried to enroll, noting that they were willing to wait and work through them in order to gain health insurance. Most recent applicants in the focus groups initially tried to apply for coverage online shortly after October 1, when the Marketplaces opened. While a few consumers were able to create accounts and apply in these first few weeks, many encountered slow websites or system glitches and ultimately filled out paper applications or made multiple attempts to enroll, often with the help of assisters. For example, in Nevada, a recent applicant noted that he was having problems with the website and was told by the call center to try back in a couple of days since they were implementing fixes. When he tried to enroll two days later, he was able to smoothly get through the enrollment process. He appreciated getting the feedback and explanation from the call center and was satisfied with his overall enrollment experience. In Maryland, several consumers that experienced problems with the website when they first tried to apply came back to try again later and sought help from assisters or followed up with the call center until they were successful.
Consumers and assisters in both Maryland and Nevada indicated that the Marketplace enrollment websites are continually improving and appreciated new simplified enrollment processes. They recognized that while the initial launch of open enrollment was hampered by website problems, the websites were continuing to improve over time. For example, assisters in Nevada said that the portal is now functioning fairly smoothly and that work is underway to continue to refine it and enhance its functionality. As these initial implementation problems begin to be resolved, an early glimpse of the modernized enrollment process envisioned by the ACA is starting to emerge. For example, assisters reported that documentation requirements have not been a significant barrier to enrollment and that they can electronically scan and upload documents when needed. In addition, assisters in Maryland and Nevada highly praised the provider lookup tool on the sites.
Assisters noted that beyond helping individuals apply, they also provide a significant amount of education about what health insurance is and differences between health plan options. Participants indicated that individuals consider a variety of factors beyond premium costs when selecting a plan, including covered services, cost sharing requirements, and whether their existing doctors participate in the plan’s network, though uninsured consumers often do not have a relationship with a regular doctor, so this is not factor for them when choosing a plan. Assisters indicated that it can be hard for consumers to understand and balance these different factors, particularly for those who have had limited experience with insurance to date. Some assisters noted that they often spend time upfront explaining how the Marketplace works, that financial assistance may be available, what coverage options exist, and answering broader questions about the ACA. In some cases, they also have to provide a basic explanation of what health insurance is, particularly for consumers from other countries who may not have familiarity with the concept of insurance and for those that have not had insurance for many years. In Maryland, a few Navigators noted that they often use analogies to auto insurance to explain the need and importance of health coverage to consumers that have never been insured. Several other assisters said that they likened the Marketplace to a grocery store or shopping center where consumers could pick a plan based on a number of factors including cost.
“…some people…[insurance] is… new to them…I just give [a] five or ten minute explanation with my presentation… show them.”-Navigator in Baltimore
Assisters noted that it is particularly important for them to help educate consumers about the different components of cost sharing within a health plan to help inform their plan choice. For example, they said that many consumers heavily focus on deductible amounts when reviewing plan options but fail to understand that the deductible only applies to certain types of care. As such, assisters often have to explain when the deductible will apply and provide an overview of other cost sharing components such as copayments and the out-of-pocket maximum for consumers to gain a full understanding of a plan and be able to make an informed plan choice. Moreover, few consumers understood that their premiums had been reduced by the subsidies, or were aware of the subsidies to reduce out-of-pocket costs, which likely impacted their perceived value of the plans. Consumers who qualified for tax credits for Marketplace coverage had varied premium costs depending on their income and plan selection, although a number noted that their premiums will be less than $100 per month. While many had already chosen a health plan, many said they were waiting until closer to the December 15th deadline to pay the first month’s premium. However, some had already paid or had set up the payment to be drawn in December. Some assisters in Nevada noted that they were encouraging people to pay the premium when they completed the enrollment process rather than waiting until December to make sure that all steps were completed for their coverage to start in January.
“A lot of people are not exactly clued up on insurance…Their biggest concern is deductible whereas…90 percent, 95 percent of what you could actually need in terms of medical is going to be all co-pays…I’m spending a lot of my time educating them; look, this is how much it’s going to cost.”-Insurance broker in Reno
“..the first person that I enrolled did not want to do this; and he’s like, well I have to or else I’m going to get taxed for it. But then he found that his flu shots would be covered in the future and then he was all about it…”-Navigator in Baltimore
Most of the recent applicants included in the focus groups remained confused about key components of the law, including the deadline for enrolling in Marketplace coverage. Many consumers had heard about the new requirement to obtain health insurance, particularly in Nevada, where information on the requirement is included as part of the Marketplace advertising campaign; however, few knew how much the fine would be or how it would be assessed. Moreover, there was significant confusion about the deadline for obtaining coverage and when open enrollment would end. Most believed that open enrollment would end on January 1, rather than at the end of March. In addition, as noted, few understood that their premium costs had been reduced by the tax credit subsidies. This lack of information likely affects their perceived value of their plan and their perception of the affordability of their premiums. Moreover, many consumers were not aware that Medicaid eligibility had been expanded, even though many qualified for Medicaid when they applied for coverage.
“They know it’s the law, they know that there is Nevada Health Link, but they don’t know what is going on. They don’t know what they need to do to apply…I’ve actually come cross a lot of people who have no idea that there’s a difference between the federal Marketplace and the Nevada one.”-Assister in Reno
In conclusion, the early ACA enrollment experiences of early applicants and consumer assisters in Maryland and Nevada suggest that, as might be expected, these consumers are highly motivated to obtain health insurance. They noted that being uninsured is a personal and financial challenge, and while some expressed concern about new costs, they were eager for coverage to begin. In both states, the Marketplace websites have been continually improving and consumers appeared to be patient with system issues. In addition, consumer assisters in both states are playing an important role in their communities to help educate consumers and connect them to coverage. As consumers enrolled, they needed and wanted information to understand their health plan options and how to use their coverage. Helping consumers make informed plan choices required providing them with a thorough understanding of plans, including covered services, provider networks, and cost sharing requirements, since consumer plan selections are driven by many factors beyond premium costs. These focus groups of early applicants suggest that continued outreach and education about key provisions of the law is needed to ensure consumers understand how the Marketplaces work, and, in particular, the different deadlines for enrolling in coverage.
This brief was prepared by Samantha Artiga and Jessica Stephens from the Kaiser Family Foundation and Michael Perry with PerryUndem Research and Communication.
Many different nations and multilateral organizations provide assistance to support family planning and reproductive health in countries around the globe. This report maps the geographic donor landscape of FP/RH assistance, looking both at donor presence and magnitude of donor assistance. It is intended to serve as an easy-to-use information source and tool for policymakers and other stakeholders in both donor and recipient countries.
The report finds that thirty-six different donors gave family planning and reproductive health assistance from 2009 to 2011 – a number comparable to the number of donors who gave HIV assistance over the same period, and significantly greater than the numbers of donors who provided assistance for malaria and tuberculosis.
The United States was the largest donor, providing 29 percent of total assistance. The top five donors – the United States, the United Nations Populations Fund, the United Kingdom, the Netherlands, and the World Bank – together accounted for nearly three-quarters of family planning and reproductive health assistance.
This is the fourth and final report in a series of analyses examining the donor nations and multilateral organizations involved in addressing different global health challenges in recipient countries worldwide. The reports seek to provide perspective on the geographic presence of global health donors, and to enable more effective coordination and delivery of services globally and within individual recipient nations.
The House and Senate Committees on Appropriations announced the release of the “Consolidated Appropriations Act, 2014” (H.R. 3547), which includes funding for U.S. global health programs. A significant portion of U.S. funding for global health, including funding at the U.S. Agency for International Development (USAID) and the Department of State, is outlined in the bill, however, total funding for global health is not currently available as some funding provided through USAID, HHS, and DoD is not yet available. The table below compares the bill to final FY 2013 enacted (post-sequestration) and the President’s FY 2014 budget request.
According to the text of the bill as posted by the House Appropriations committee and a summary released by the Senate Appropriations Committee, funding for global health programs at USAID and the State Department (through the Global Health Programs account) would total $8,439 million, which is $124.5 million (1.5%) above the President’s request and $378 million (4.7%) above FY 2013 enacted. Funding for PEPFAR at the State Department and USAID, which supports bilateral programs and the Global Fund to Fight AIDS, Tuberculosis and Malaria (Global Fund), is at the same level as the President’s request. Funding in the bill for tuberculosis, neglected tropical diseases (NTDs), maternal and child health, nutrition, vulnerable children, pandemic influenza, and polio are above the President’s request. Funding in the bill for malaria is below the President’s request, but above FY 2013 enacted.
Total funding through all accounts for family planning and reproductive health (FP/RH), which includes $35 million for UNFPA, is below both the President’s request and FY 2013 enacted. Funding for global health activities at the Centers for Disease Control and Prevention (CDC) is $383 million, which is $10 million (2.5%) below the President’s request and $23.7 million (6.6%) above FY 2013 enacted.
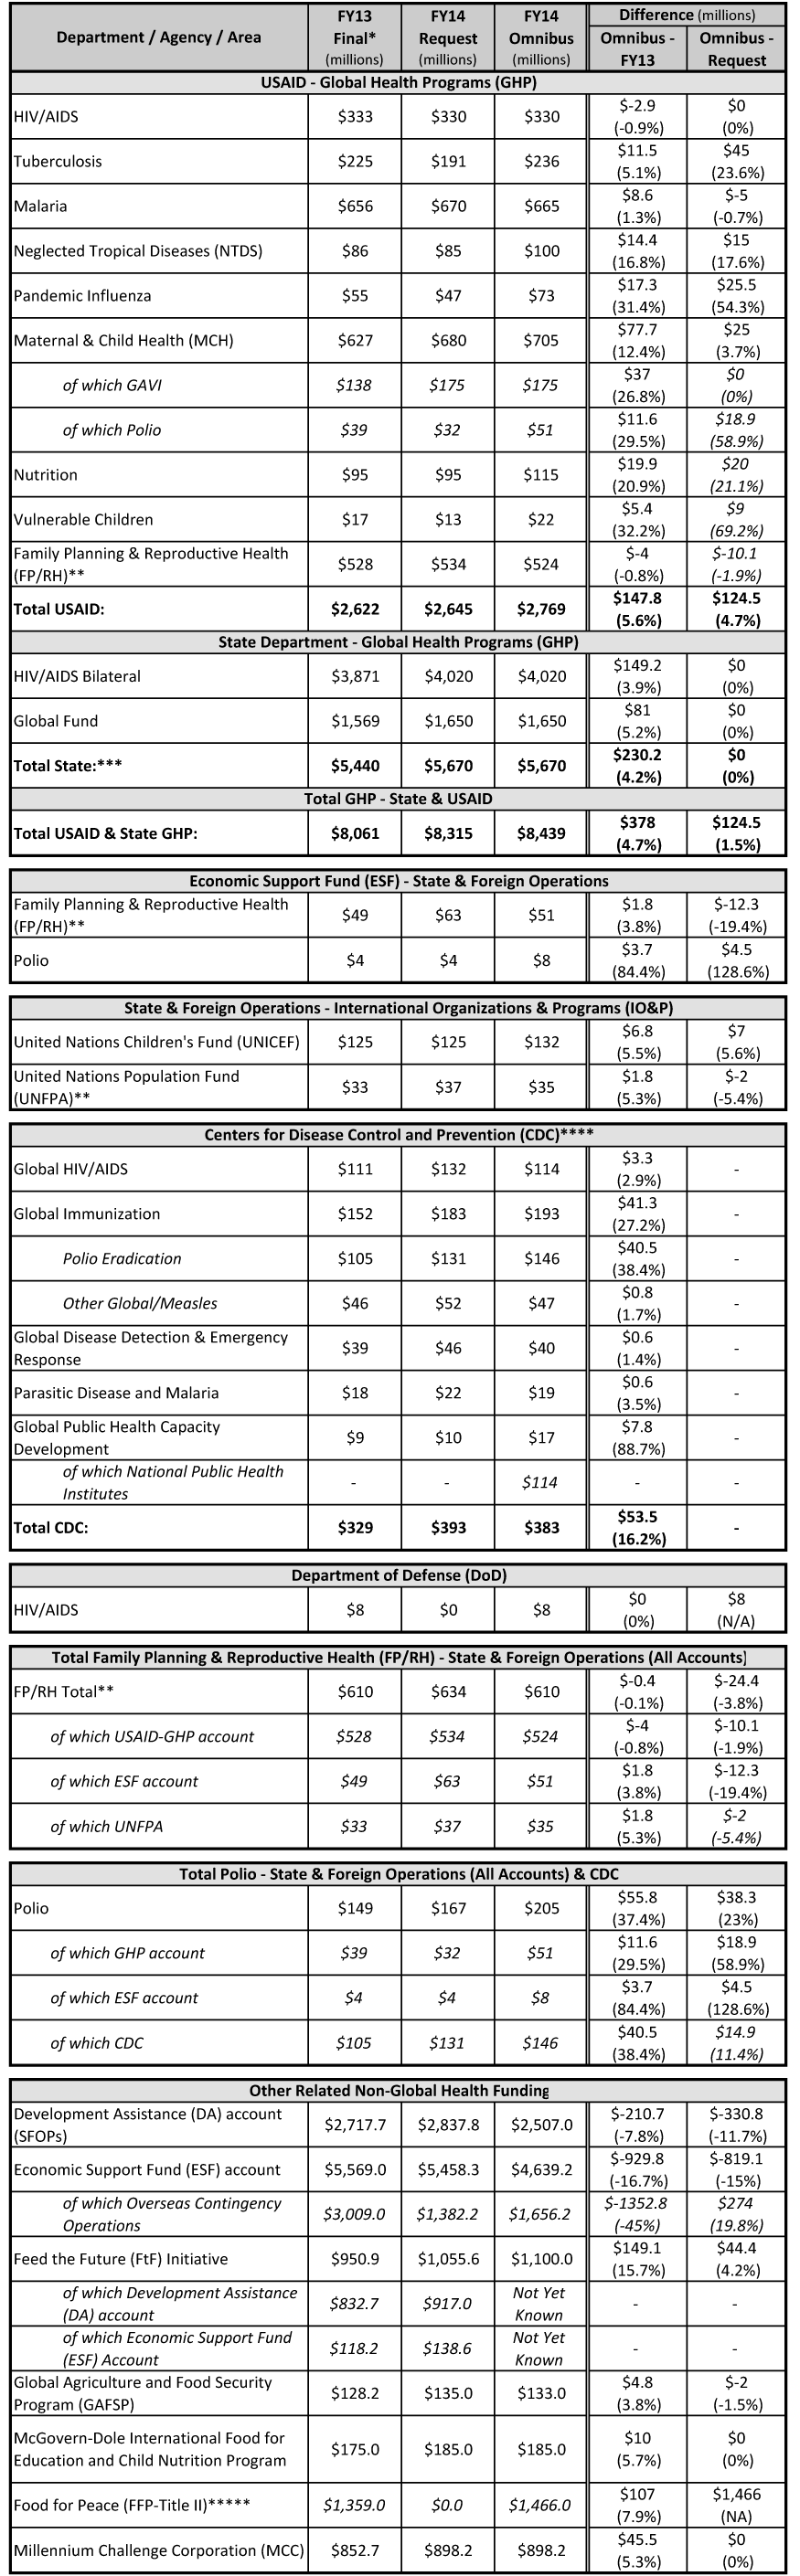
*FY 2013 Final includes the effects of sequestration.**The Senate Appropriations Committee summary of the bill states that “at least $610 million, including $35 million for the UN Population Fund” be provided for FP/RH.***Represents combined PEPFAR funding (HIV bilateral and Global Fund) at the State Department.****The President’s FY 2014 Budget Request for CDC included a realignment of funding for business services. This realignment of funds was not taken into account in the FY 2014 Omnibus bill and has not been included in the FY 2013 Final amounts presented in this table.*****As part of the FY2014 budget request, the Administration proposed a restructuring of U.S. food assistance programs including a reallocation of funding provided through Food for Peace to other accounts.
In recent years, policymakers have focused on a wide range of options to inform the national debt reduction debate, including proposals to help reduce Medicare spending by reforming the current Medicare supplemental insurance (Medigap) market. Due to Medicare’s relatively high cost-sharing requirements, the vast majority of beneficiaries have some source of coverage that supplements Medicare, including 9 million Medicare beneficiaries who purchase Medigap policies. Some beneficiaries with Medigap policies also have other sources of supplemental coverage, including coverage from employer or union-sponsored retiree health plans, the Department of Veterans Affairs (VA) or Medicare Advantage plans.
Nationwide, nearly one in four of all Medicare beneficiaries had a Medigap policy in 2010, including beneficiaries with multiple sources of supplemental coverage (Exhibit 1). Among beneficiaries in traditional Medicare (excluding people in Medicare Advantage), more than one in four (26%) has a Medigap policy.1 In some states, enrollment is much higher than the national average. As described later in the brief, about half of all beneficiaries in five states had a Medigap policy (IA, KS, ND, NE, and SD). Most Medigap enrollees (86%) live on incomes below $40,000 per person, and nearly half (47%) have incomes below $20,000 per person.
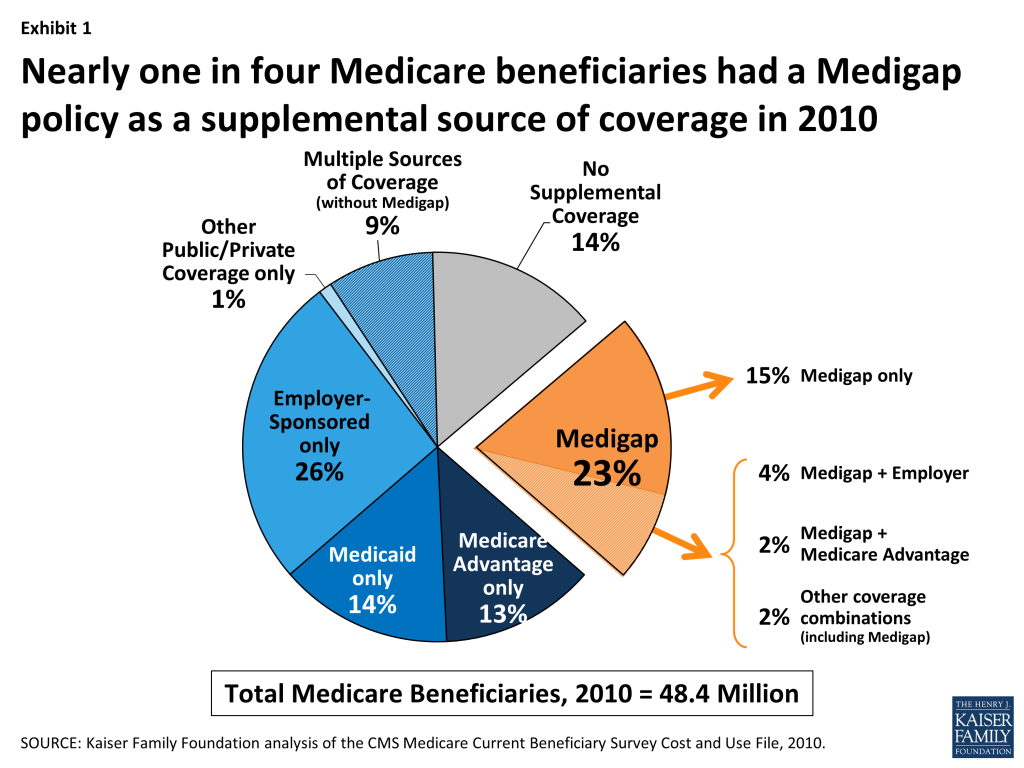
This issue brief contextualizes recent proposals to change Medigap plans in order to understand how they may affect Medicare beneficiaries, using recently available data. The brief begins with an overview of Medigap’s role in providing supplemental coverage for Medicare beneficiaries. It then presents the most current data available on Medigap enrollment and premiums, by state, beneficiary characteristic, and plan type,2 and describes recent Medigap proposals that have emerged as part of efforts to reduce Medicare spending.
Medicare provides broad protection against the costs of many health care services, but has relatively high cost-sharing requirements and significant gaps in coverage. Traditional Medicare has deductibles for Parts A (inpatient) and B (physician and outpatient) services, 20 percent coinsurance for most Part B services, coinsurance for inpatient hospital and skilled nursing facility stays exceeding 20 days, and no maximum on the amount beneficiaries could incur in out-of-pocket costs each year (Table A1). As a result, most beneficiaries covered under traditional Medicare have some form of supplemental coverage to help cover cost-sharing expenses required for Medicare-covered services.
Since the early years of the Medicare program, a substantial share of the Medicare population has relied on Medigap to help with Medicare’s cost-sharing requirements. Medigap enrollees tend to include beneficiaries in traditional Medicare who do not have access to an employer or union-sponsored retiree health plan and beneficiaries who are not poor enough to qualify for Medicaid. Medigap policies have helped to shield beneficiaries from sudden, out-of-pocket costs resulting from an unpredictable medical event, and have allowed beneficiaries to more accurately budget their health care expenses, which is important to a population living on fixed incomes. Because Medicare and private Medigap insurers generally coordinate payments to providers, Medigap also minimizes the paperwork burden for beneficiaries. In most cases, there are no claims to check or bills to pay. Even with Medigap, beneficiaries often incur significant out-of-pocket expenses for services that are not covered by Medicare (such as dental and long-term care) and for costs associated with prescription drug coverage offered separately by Part D plans.
The structure of Medigap policies has become more uniform and regulated over the years to help beneficiaries more easily compare policies and to address concerns about the marketing and quality of Medigap policies. Several laws since the 1970s – and in particular, the Social Security Disability Amendments of 1980 (also referred to as the “Baucus Amendments”) and the Omnibus Budget Reconciliation Act (OBRA) of 1990 – changed the requirements and standards for Medigap policies, including standardizing benefits, limiting the duration of exclusions for pre-existing conditions, and requiring minimum medical loss ratios.3 ,4 As a result, today Medicare beneficiaries can enroll in one of 10 plan types, and all plans of the same letter are required to offer the same benefit package, facilitating an “apples-to-apples” comparison (Table A2).5 Two Medigap plans – C and F – cover both the Part A and the Part B deductible, thus providing “first-dollar” coverage for all Medicare-covered services.6
Enrollment in Medigap has been relatively stable since 2006, despite the rising enrollment in Medicare Advantage plans during this time frame.7 In 2010, nearly one in four (23%) Medicare beneficiaries nationwide had a Medigap policy.8 Beneficiary characteristics are drawn from the Medicare Current Beneficiary Survey Cost and Use File and plan enrollment is from the National Association of Insurance Commissioners (NAIC).
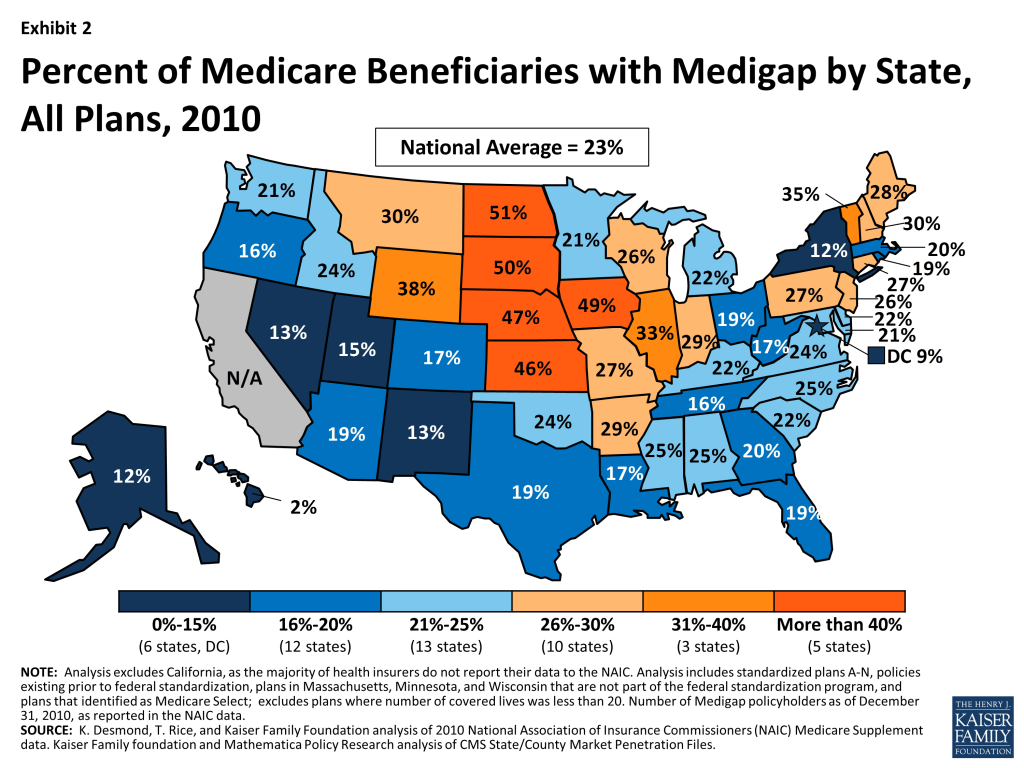
Beneficiaries with Medigap generally pay a monthly premium for their coverage, in addition to their Medicare premiums (Part B and D).11 People with Medigap paid an average of $183 per month in premiums for their policy in 2010, with wide variations across states and by plan type (Table A3). Even when ignoring the least expensive (in the bottom decile) and most expensive (in the top decile) states, average premiums can vary by as much as $79 per month across states for the same plan, despite a standardized benefit package (Exhibit 6). For example, the average plan F premium across all states is $181 per month. Average plan F premiums range from a low of $129 per month in Vermont, to a high of $226 per month in neighboring New York (Exhibit 7); both Vermont and New York require premiums to be community rated, indicating that states’ rating rules do not seem to exclusively determine whether states’ average premiums are relatively low or high.12 In 80 percent of states, the average monthly premium for plan F was between $155 and $197. Similarly, average plan C premiums nationwide are $177 per month, and in most states, the average monthly premium for Plan C was between $161 and $213 (Table A3).
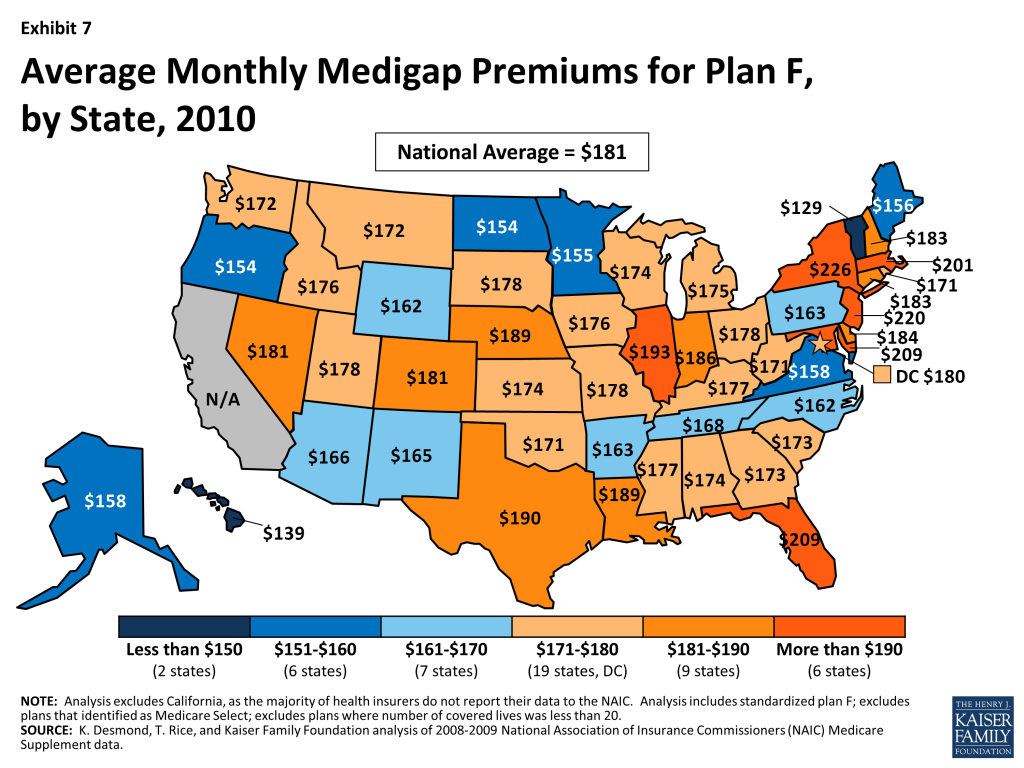
Various proposals and recommendations have emerged in recent years that would restrict, limit and/or penalize Medigap coverage, generally in the context of broader proposals to reduce federal spending (Table 1).13 These proposals and recommendations to change Medigap coverage are often motivated by several studies that find most Medicare beneficiaries with Medigap use more Medicare-covered services and incur higher Medicare costs than beneficiaries without supplemental coverage.14 For example, a study from the Medicare Payment Advisory Commission (MedPAC) showed that spending for Medicare beneficiaries with Medigap policies was 33 percent higher than for beneficiaries without supplemental coverage.15 Researchers have also found that health care spending grew at a faster rate for beneficiaries with Medigap than for beneficiaries in traditional Medicare with no supplemental coverage.16 These studies are consistent with numerous studies that show individuals use fewer services – both necessary and unnecessary – when confronted with larger cost-sharing requirements.17
Prohibiting first-dollar Medigap coverage is therefore projected to reduce total Medicare spending and beneficiary spending, because exposure to higher cost-sharing requirements would lead enrollees to use fewer health care services.18 Requiring beneficiaries to pay higher cost-sharing, however, could also lead to higher aggregate spending over the long term for some vulnerable subpopulations, such as the chronically ill, beneficiaries dually eligible for Medicare and Medicaid, and low-income seniors, if they forgo necessary services as a result, and use more high-cost, acute care services in the future.19
Many proposals and recommendations would prohibit Medigap plans from providing first-dollar coverage by requiring plans to include deductibles for Part A and Part B services. Such proposals are designed to discourage utilization (and reduce spending) by exposing beneficiaries to greater costs when they seek medical care. The Congressional Budget Office (CBO) estimated in its 2013 report Options for Reducing the Deficit: 2014 to 2023 that barring Medigap policies from paying the first $550 in cost-sharing liability and limiting coverage to 50 percent of the next $4,950 in out-of-pocket costs could achieve $58 billion in savings from 2015 to 2023.20 Under this approach, beneficiaries with Medigap could be expected to use fewer Medicare-covered services due to higher cost-sharing requirements, which would lead to a decrease in both average Medigap premiums and Medicare Part B premiums. Analyses have found that most Medicare beneficiaries with Medigap policies would be expected to pay less for their health care overall, but enrollees in relatively poor health would be more likely to face higher overall health care costs.21
Other proposals would apply a premium surcharge (or excise tax) on Medigap premiums. For example, President Obama’s budget for fiscal year (FY) 2014 proposed applying a surcharge on Part B premiums that would be equivalent to about 15 percent of the average Medigap premium on new beneficiaries that purchase Medigap policies with “particularly low cost-sharing requirements,” beginning in 2017.22 The Office of Management and Budget (OMB) estimated that this proposal would save approximately $2.9 billion between 2017 and 2023, or approximately $7 billion over 10 years. The CBO estimated in its 2008 report Budget Options, Volume 1: Health Care that imposing a 5 percent excise tax on all Medigap insurers could achieve savings of about $12.1 billion over ten years.23 In general, this approach is designed to discourage the purchase of Medigap policies, but may not have much of an effect on utilization or spending for individuals who choose to purchase a policy with the added fee.
| Table 1. Comparison of Recent Medigap Proposals and Recommendations | ||
| Date Introduced | Proposal Authors | Medigap Provision |
| April 29, 2013 | Brookings Institution, Engelberg Center for Health Care Reform | Would require Medigap plans to have an actuarially-equivalent co-pay of at least 10 percent. |
| April 18, 2013 | Bipartisan Policy Center | Would require Medigap plans to include a deductible of at least $250, cover no more than 50 percent of beneficiaries’ copayments and coinsurance, and provide an out-of-pocket limit no lower than $2,500, beginning in 2016. |
| April 10, 2013 | President’s FY2014 Budget | Would introduce a surcharge on Part B premiums that would be equivalent to about 15 percent of the average Medigap premium for new beneficiaries that purchase Medigap policies with “particularly low cost-sharing requirements,” beginning in 2017. Current beneficiaries, and individuals who become eligible for Medicare prior to 2017, would not be subject to the premium surcharge. |
| February 26, 2013 | Brookings Institution, The Hamilton Project24 | Would apply an excise tax of up to 45 percent on Medigap plan premiums. |
| February 19, 2013 | Erskine Bowles and Former Sen. Alan Simpson | Would prohibit Medigap and TRICARE for Life plans from covering the Medicare deductible and no more than 50 percent of the base coinsurance, up to the initial limit; in the interim, would apply a surcharge to the Part B premium of Medigap plans. |
| January 24, 2013 | Sen. Orrin Hatch | Would limit Medigap plans from providing first-dollar coverage for cost-sharing. |
| December 17, 2012 | Joseph Antos | Would change Medigap plans so that policyholders are sensitive to the cost of their medical care. Would modify rules to require insurers to offer Medigap coverage whenever beneficiaries apply for it. |
| December 12, 2012 | Sen. Bob Corker,S. 3673 | Would require the NAIC to review and revise the Medigap benefit packages to allow for revised benefit packages to be implemented by January 1, 2015. Revised plans would be prohibited from covering the unified deductible and more than 50 percent of the cost-sharing after the unified deductible. Medigap policies could not be issued after December 31, 2016 to beneficiaries who previously were not covered by a Medigap policy. |
| November 13, 2012 | Center for American Progress | Would prohibit Medigap plans from covering the first $500 of beneficiaries’ cost-sharing for beneficiaries with incomes above 400 percent of the federal poverty level, with exemptions for primary care and care for chronic disease. |
| June 2012 | Medicare Payment Advisory Commission (MedPAC) | Recommended applying a surcharge on Medigap plans and other supplemental insurance. |
| March 15, 2012 | Sens. Rand Paul, Lindsey Graham, Mike Lee, and Jim DeMint | Would prohibit all Medigap policies as of January 1, 2014. |
| February 16,2012 | Sens. Richard Burr and Tom Coburn | Would prohibit Medigap plans from covering the first $500 of beneficiaries’ cost-sharing and limit coverage above $500 to 50 percent of the next $5,000 of Medicare cost-sharing. |
| Source: Kaiser Family Foundation, “Medicare and the Federal Budget: Comparison of Medicare Provisions in Recent Federal Debt and Deficit Reduction Proposals,” October 2013. | ||
Almost since the Medicare program’s inception, Medigap policies have been an important source of supplemental insurance for beneficiaries due to Medicare’s relatively high cost-sharing requirements and significant gaps in coverage. Almost one in four (23%) beneficiaries rely on Medigap to supplement their Medicare coverage, half of whom enroll in plans C or F that provide first-dollar coverage. About half of beneficiaries in five states have Medigap as a source of supplemental insurance; in these same five states, one-third of all beneficiaries have elected plans C or F, which provide first-dollar coverage. Medigap policies help to shield beneficiaries from sudden, out-of-pocket costs, allow beneficiaries to more accurately budget their health care expenses, and minimize the paperwork burden for beneficiaries.
Some policymakers have proposed changes to Medigap in the context of broader efforts to reduce federal spending. Some proposals would prohibit Medigap plans from providing first-dollar coverage, while other proposals would apply a premium surcharge on Medigap premiums to discourage the purchase of the policies. Often these proposals are motivated by studies that find most Medicare beneficiaries with Medigap use more Medicare-covered services and incur higher Medicare costs than beneficiaries without supplemental coverage. Exposing Medigap enrollees to higher cost-sharing, by either prohibiting first-dollar coverage or discouraging the purchase of Medigap policies through a surcharge, is projected to reduce total Medicare spending and beneficiary spending, because studies show that individuals use fewer services when confronted with larger cost-sharing requirements. However, for some vulnerable populations, requiring beneficiaries to pay higher cost-sharing could increase spending over the long term, if they forgo necessary services and as a result use more high-cost, acute care services in the future.
Whether a premium surcharge or a prohibition on first-dollar coverage, such policies could have a disproportionate effect on middle-income beneficiaries who are not poor enough for Medicaid, nor have access to employer-sponsored retiree health care. Either policy could also have a disproportionate effect on beneficiaries in Midwest and Plain states with relatively high Medigap enrollment. Striking a balance between the goals of achieving savings, without imposing financial barriers to care, will be challenging as policymakers grapple with the dual issues of rising program costs and the national debt.
As policymakers consider ways to slow the growth in Medicare spending as part of broader efforts to reduce the federal debt or offset the cost of other spending priorities, some have proposed to increase beneficiary contributions through higher Medicare premiums.1 Some proposals would increase Medicare premiums paid by all beneficiaries, while others would raise premiums only for beneficiaries with higher incomes. This issue brief explains provisions of current law that impose income-related premiums under Medicare Part B and Part D, describes recent proposals to modify these requirements, and analyzes the potential implications for the Medicare population. Under current law, monthly premiums for most people on Medicare equal 25 percent of average per capita Part B expenditures (for Part B enrollees) and 25.5 percent of average per capita Part D expenditures (for Part D drug plan enrollees). The relatively small share of beneficiaries with higher incomes (more than $85,000 for individuals and $170,000 for couples) are required to pay higher premiums for Medicare Part B and Part D, ranging from 35 percent to 80 percent of per capita costs, depending on their income. In 2013, 5 percent of Part B enrollees paid the higher income-related Part B premium, and 4 percent of Part D enrollees paid the income-related Part D premium. Modifications to Medicare’s current income-related premiums have been proposed recently by several policymakers and groups, including the Obama Administration as part of the President’s Fiscal Year (FY) 2013 and FY 2014 budgets, the Bipartisan Policy Center (BPC),2 the Center for American Progress (CAP),3 and the Moment of Truth Project4 (headed by Erskine Bowles and Alan Simpson, co-chairs of the National Commission on Fiscal Responsibility and Reform) (Table 1).5 In general, these proposals would reduce Medicare spending by increasing the share of beneficiaries paying income-related premiums relative to current law, increasing the amount of premiums they are required to pay, or both. This brief includes an analysis of a proposal to modify current-law income thresholds and freeze these thresholds until 25 percent of all Medicare beneficiaries are required to pay the income-related premium, based on the parameters in the President’s FY 2014 budget. As described more fully below, this proposal is estimated to result in higher Medicare premiums for beneficiaries with incomes at or above $45,600 for individuals and $91,300 for couples (in 2013 dollars), once fully implemented in 2036—the year when 25 percent of beneficiaries are estimated to be paying income-related premiums, according to this analysis. The Congressional Budget Office has estimated that the income-related premium proposal in the President’s FY 2014 budget would reduce Medicare spending by $56.3 billion between 2014 and 2023.6 Estimates of 10-year Medicare savings for the other proposals are: $25 billion (CAP), $30.2 billion (President’s FY 2013 budget7 ); $65 billion (Moment of Truth), and $66.2 billion (BPC).
Beneficiaries enrolled in Part B are generally required to pay a monthly premium ($104.90 in 2014). Medicare Part B premiums are calculated as a share of Part B program costs. For most beneficiaries, Part B premiums are set to equal 25 percent of the projected annual Part B expenditures per enrollee ages 65 and over and the remaining 75 percent of Part B program costs is funded by general revenues.8 Until 2007, all Medicare beneficiaries enrolled in Part B were subject to the same monthly Part B premium. The Medicare Modernization Act (MMA) of 2003 included a provision that required higher-income Medicare beneficiaries to pay a greater share of Part B costs, beginning in 2007. The distribution of income among Medicare beneficiaries is highly skewed, with half estimated to have income of about $23,500 or less in 2013 and the top 5 percent having income of $93,900 or more (Exhibit 1).9 The MMA indexed the income thresholds to increase annually with the rate of inflation (CPI-U), so that about 5 percent of all Medicare beneficiaries would pay the higher, income-related premium each year.
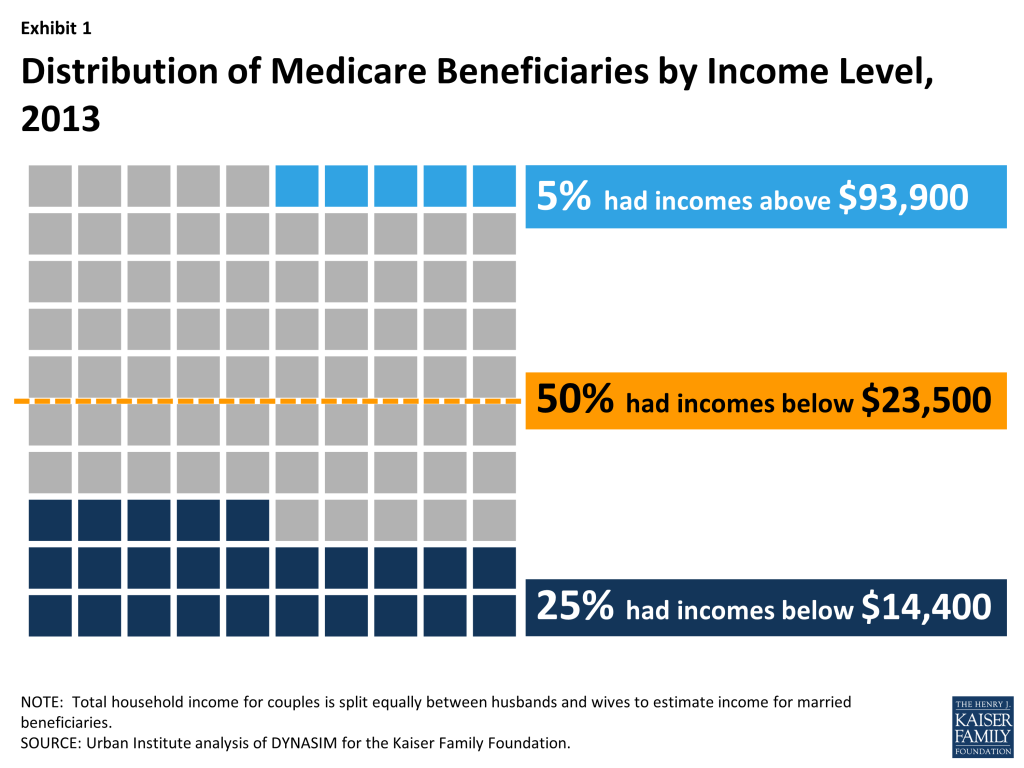
Beneficiaries are required to pay the higher Part B premium in 2014 if their income is equal to or greater than $85,000 for an individual and $170,000 for a couple. Part B premiums for beneficiaries with incomes above the threshold range from 35 percent to 80 percent of Part B program costs, depending on their income (Exhibit 2).
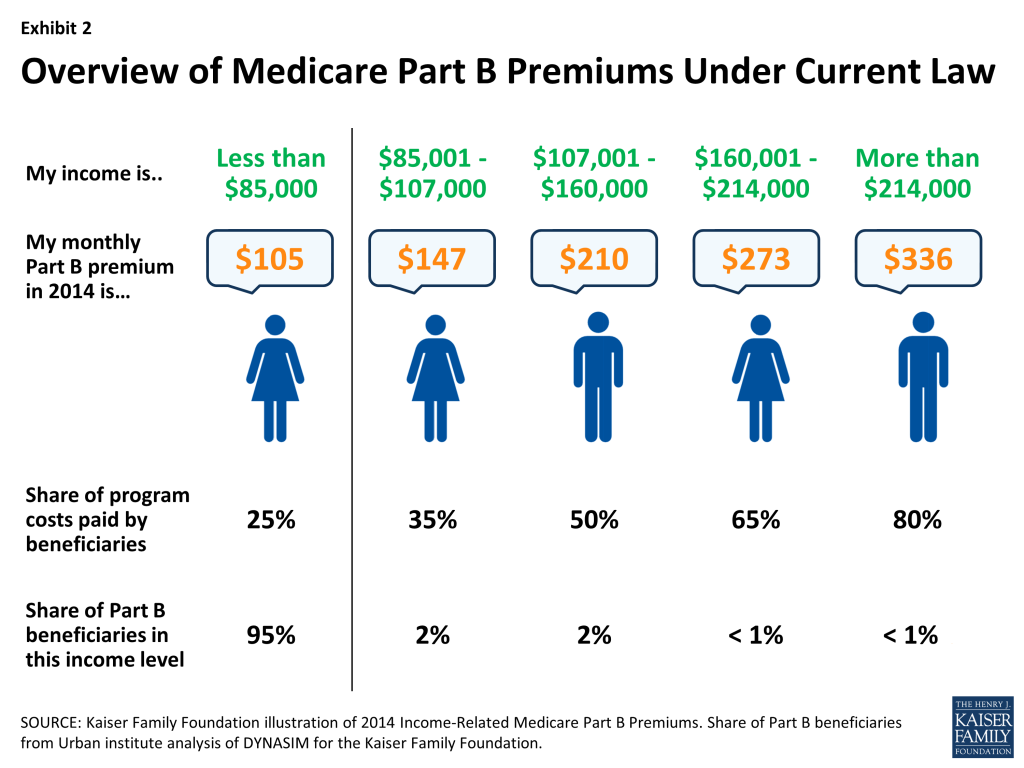
The 2010 Affordable Care Act (ACA) modified current law related to the Part B income-related premium.10 The law imposed a freeze on the income thresholds that were in place in 2010 from 2011 through 2019, rather than allowing the thresholds to rise with inflation.11 This provision will increase the number and share of beneficiaries who will pay the higher income-related Part B premium over these years. In 2020 and subsequent years, the income thresholds will once again be indexed to inflation as if they had not been frozen between 2011 and 2019. Under current law12 :
Higher-income Medicare beneficiaries enrolled in Part D prescription drug plans are also required to pay higher Part D premiums as a result of changes made in the ACA. In the years after the Medicare Part D benefit was implemented in 2006, but prior to 2011, premiums varied by drug plan but all enrollees in the same plan within the same region paid the same premium.16 The monthly premium paid by enrollees was set to cover 25.5 percent of the national average cost of the standard drug benefit, based on bids submitted by Part D plans for their expected benefit payments. Medicare subsidized the remaining 74.5 percent of the Part D premium. The ACA modified these features by establishing an income-related premium for Part D coverage, which took effect in 2011. The Part D income-related monthly adjustment amount (IRMAA) is calculated as a percent of the national average cost of the standard drug benefit, using the same surcharge percentages (35 percent to 80 percent) and income thresholds ($85,000 for an individual and $170,000 for a couple) as for Part B. Similar to the income thresholds for Part B premiums, the income thresholds for the Part D income-related premium are fixed until 2019; that is, they are not indexed to increase annually.17 Unlike Part B, actual premium amounts paid by higher-income Part D enrollees depend on the particular plan they select and the premium charged for that plan. The national average monthly Part D premium in 2014, according to the Centers for Medicare & Medicaid Services (CMS), is $32.42,18 although actual monthly premiums for stand-alone prescription drug plans (PDPs) vary across plans and regions (from a low of $12.50 to a high of $174.70 in 2014).19 The Part D income-related monthly adjustment amount is collected separately from the premium that higher-income enrollees pay to their Part D plan. The income-related adjustment amount is withheld from the enrollee’s Social Security or Railroad Retirement benefit payments in the same manner that the Part B premium is withheld.20 Under current law21 :
Fewer beneficiaries pay the income-related Part D premium than the income-related Part B premium because fewer beneficiaries are enrolled in Part D plans than in Part B. Also, a smaller number of Part D enrollees have relatively high incomes because higher-income Medicare beneficiaries are more likely to receive prescription drug coverage from an employer-sponsored retiree health plan.25 ,26
Several policymakers and groups have proposed modifications to Medicare’s current income-related premiums, including the Obama Administration as part of the President’s Fiscal Year (FY) 2013 and FY 2014 budgets, the Bipartisan Policy Center (BPC), the Center for American Progress (CAP), and the Moment of Truth Project (headed by Erskine Bowles and Alan Simpson, co-chairs of the National Commission on Fiscal Responsibility and Reform) (see Table 1 for a detailed comparison of these proposals). Each of the proposals increases the share of beneficiaries that would be required to pay the income-related Part B and D premiums relative to current law, up to 10 percent of all beneficiaries (CAP), 15 percent (initially) (Moment of Truth), 17 percent (BPC), and 25 percent (President’s FY 2013 and 2014 budgets). The CAP, Moment of Truth, and President’s budget proposals also increase the share of premiums that would be paid by higher-income beneficiaries. The President’s FY 2014 proposal also expands the number of levels of income-related premium payments. This analysis focuses on the parameters outlined in the President’s FY 2014 budget proposal. Under this proposal, the current freeze on income thresholds enacted in the ACA would be extended beyond 2019 until 25 percent of beneficiaries pay an income-related premium. In addition, beginning in 2017, this proposal would increase the lowest income-related premium percentage by five percentage points, from 35 percent to 40 percent; increase the highest amount from 80 percent to 90 percent; and expand the number of tiers of income-related premiums from four under current law (35, 50, 65, and 80 percent) to nine (40, 46.5, 53.0, 59.5, 66.0, 72.5, 79.0, 85.5, and 90.0 percent). The proposal also lowers the income threshold for those paying the highest income-related premium amount from $214,000 to $196,000 (see Table 1 for the income amounts corresponding to the income-related premium percentages under current law and the President’s proposal). This analysis determines the year in which 25 percent of beneficiaries would pay income-related premiums under the President’s proposal, converts the income thresholds in that year into 2013 dollars, and estimates the increase in premiums that higher-income beneficiaries would pay based on the proposed income thresholds and higher premium percentages. The analysis incorporates estimates and projections from the DYNASIM microsimulation model developed by researchers at the Urban Institute (see Methodology below for details).
Under the proposed income-related premium thresholds, it is estimated that by 2036, just over one-quarter of all Medicare beneficiaries enrolled in Part B (20.4 million beneficiaries) will be required to pay the income-related Part B premium, because their incomes are projected to exceed $85,000 per individual or $170,000 per couple that year. The income thresholds for the income-related Part B and D premiums in 2036 are equivalent to about $45,600 for individuals and $91,300 for couples in today’s inflation-adjusted dollars (Exhibit 3). In other words, if the proposal to have 25 percent of beneficiaries pay the income-related premium was implemented in 2013, rather than reached gradually by holding the income thresholds constant over time, beneficiaries with incomes at or above $45,600 for individuals and $91,300 for couples would pay higher income-related Medicare premiums in 2013.
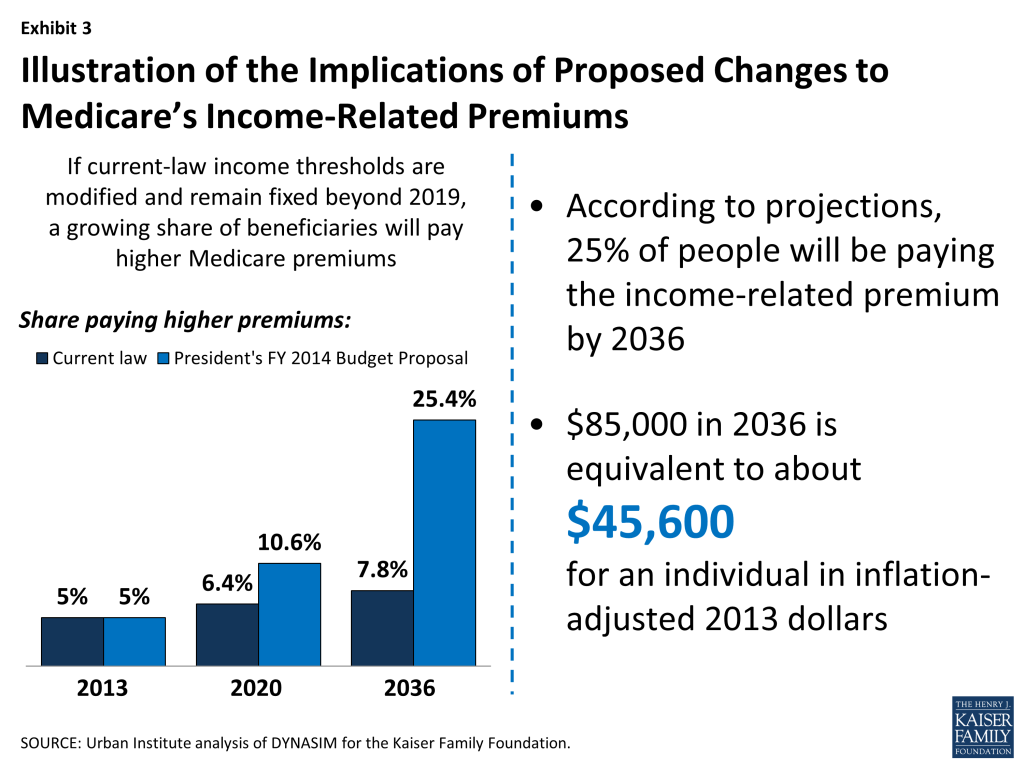
By design, these proposals would gradually increase the number and share of people on Medicare paying an income-related premium (Exhibit 4). For example, under the President’s FY 2014 budget proposal, it is estimated that:

As might be expected, these findings are sensitive to assumptions about the future growth of the economy (see the methodology below for assumptions incorporated in the intermediate-, low-, and high-cost scenarios):
Under most of these proposals, beneficiaries subject to the income-related premium would be required to pay a larger share of the Part B and Part D premiums than they do under current law. For example, under the President’s FY 2014 budget proposal, effective in 2017, beneficiaries who currently pay 35 percent of the premium would pay 40 percent under the proposal, beneficiaries who pay 80 percent of the premium would pay 90 percent, and several new levels of premium percentages would be paid by higher-income beneficiaries, depending on their income (Tables 5 and 6). The following examples illustrate premium changes that higher-income beneficiaries would face under the President’s proposal:
Some recent proposals to address concerns about federal spending have included recommendations to reduce the growth in Medicare spending by increasing beneficiaries’ contributions towards their health care costs. These include proposals to increase the share of beneficiaries who would pay Medicare’s Part B and Part D income-related premiums and increase the portion of program costs they would pay. Part of the appeal of requiring higher-income beneficiaries to pay a greater share of Medicare costs is that these higher costs would only be imposed on those beneficiaries who arguably have greater financial means to bear the additional expenses. In the context of current federal budget discussions, some consider an approach that includes this type of progressive financing to be preferable to one that imposes higher premiums or cost sharing across the board, without regard to beneficiaries’ incomes. There is some concern, however, that the income thresholds used to trigger the imposition of higher premiums for higher-income Medicare beneficiaries ($85,000/individual, $170,000/couple) are substantially lower than the thresholds often used to define higher-income individuals in other policy discussions. For example, the ACA imposed higher Medicare Part A payroll taxes on individuals with income of $200,000 and couples with income of $250,000. For many higher-income beneficiaries, the proposed increase in Medicare premiums might not be a financial hardship. However, if the income thresholds are frozen over a longer period of time relative to current law, then a growing share of elderly and disabled people who would not be considered high income by today’s standards would face higher premiums, and as the income-related premium amounts increase over time, they would consume a larger share of income. In addition, there is some possibility that such changes could lead some higher-income beneficiaries to drop out of Medicare Part B and instead self-insure, which could result in higher premiums for all others who remain on Medicare if the dropout group is large and relatively healthy. Amid ongoing concerns about the nation’s debt and the future financial stability of Medicare, policymakers are likely to continue their discussion of alternative Medicare savings proposals. In light of the financial vulnerability of many people on Medicare and the difficulty they may have paying for rising health care costs on limited budgets, the proposal to require higher-income beneficiaries to pay more in Medicare premiums, rather than raise premiums for all beneficiaries, would protect those with relatively modest incomes. Yet, given the relatively low incomes of most people on Medicare, a significant amount of savings from this proposal is only possible by going relatively far down the income scale to reach a sizeable share of beneficiaries—at which point the affordability of these additional costs could be called into question.
TABLE 1: Comparison of Income Thresholds and Premium Percentages for Medicare’s Income-Related Premiums Under Current Law and Proposals | |||
| Income thresholds | Premium percentage | ||
| Single beneficiaries | Married couple | ||
| Current Law Income thresholds frozen through 2019; indexing thereafter | Not more than $85,000 | Not more than $170,000 | 25.0% |
| $85,000-$107,000 | $170,000-$214,000 | 35.0% | |
| $107,000-$160,000 | $214,000-$320,000 | 50.0% | |
| $160,000-$214,000 | $320,000-$428,000 | 65.0% | |
| More than $214,000 | More than $428,000 | 80.0% | |
| Proposals | |||
| Bipartisan Policy Center27 Lowers income thresholds beginning in 2016 so that approximately 17% of beneficiaries would pay income-related premiums; thresholds frozen through 2018; indexing thereafter | Not more than $60,000 | Not more than $90,000 | 25.0% |
| $60,001-$82,000 | $90,001-$123,000 | 35.0% | |
| $82,001-$135,000 | $123,001-$202,500 | 50.0% | |
| $135,001-$189,000 | $202,501-$283,500 | 65.0% | |
| More than $189,000 | More than $283,500 | 80.0% | |
| Center for American Progress28 Maintains current-law thresholds through 2019; beyond 2019 thresholds would be set so that 10% of beneficiaries would pay; increases the income-related premium percentages by 15% starting in 2014 | Thresholds not specified | Thresholds not specified | Same as President’s FY 2013 Budget Proposal |
| Moment of Truth Project29 Lowers income thresholds so that approximately 15% of beneficiaries would pay income-related premiums initially; thresholds frozen through 2030; increases current-law income-related premium percentages by 15% | Thresholds not specified | Thresholds not specified | Same as President’s FY 2013 Budget Proposal |
| President’s FY 2013 Budget Proposal30 Current-law Income thresholds frozen until 25% of beneficiaries pay income-related premiums; increases the current-law income-related premium percentages by 15% | Not more than $85,000 | Not more than $170,000 | 25.0% |
| $85,000-$107,000 | $170,000-$214,000 | 40.25% | |
| $107,000-$160,000 | $214,000-$320,000 | 57.5% | |
| $160,000-$214,000 | $320,000-$428,000 | 74.5% | |
| More than $214,000 | More than $428,000 | 90.0% | |
| President’s FY 2014 Budget Proposal31 Modifies and increases the number of current-law Income thresholds beginning in 2017; thresholds frozen until 25% of beneficiaries pay income-related premiums | Not more than $85,000 | Not more than $170,000 | 25.0% |
| $85,000-$92,333 | $170,000-$184,666 | 40.0% | |
| $93,333-$99,667 | $184,666-$199,334 | 46.5% | |
| $99,667-$107,000 | $199,334-$214,000 | 53.0% | |
| $107,000-$124,667 | $214,000-$249,334 | 59.5% | |
| $124,667-$142,333 | $249,334-$284,666 | 66.0% | |
| $142,333-$160,000 | $284,666-$320,000 | 72.5% | |
| $160,000-$178,000 | $320,000-$356,000 | 79.0% | |
| $178,000-$196,000 | $356,000-$392,000 | 85.5% | |
| More than $196,000 | More than $392,000 | 90.0% | |
| TABLE 2: Estimates of Medicare Beneficiaries Paying Income-Related Part B Premiums Through 2040Under Current Law and Changes Proposed in the President’s FY 2014 Budget | ||||||
| CURRENT LAW:Income thresholds frozenthrough 2019; indexingthereafter | PROPOSED CHANGES:Modified income thresholds beginning in 2017; income thresholds frozen beyond 2017 until 25% of beneficiaries payincome-related premiums | |||||
| Year | Part B enrollment(in millions) | Number of Part B enrollees paying income-related premiums(in millions) | Percent of totalPart B enrollment | Number of Part B enrollees paying income-related premiums(in millions) | Percent of totalPart B enrollment | Difference between current law and proposed changes(in millions) |
| 2012 | 46.6 | 2.2 | 4.8% | 2.2 | 4.8% | 0.0 |
| 2013 | 48.1 | 2.4 | 5.0% | 2.4 | 5.0% | 0.0 |
| 2014 | 49.6 | 3.0 | 6.1% | 3.0 | 6.1% | 0.0 |
| 2015 | 50.8 | 3.3 | 6.5% | 3.3 | 6.5% | 0.0 |
| 2016 | 52.0 | 3.7 | 7.2% | 3.7 | 7.2% | 0.0 |
| 2017 | 53.4 | 4.3 | 8.1% | 4.3 | 8.1% | 0.0 |
| 2018 | 54.7 | 4.8 | 8.7% | 4.8 | 8.7% | 0.0 |
| 2019 | 56.2 | 5.4 | 9.6% | 5.4 | 9.6% | 0.0 |
| 2020 | 58.1 | 3.7 | 6.4% | 6.2 | 10.6% | 2.5 |
| 2021 | 59.8 | 3.8 | 6.4% | 6.7 | 11.2% | 2.9 |
| 2022 | 61.8 | 3.9 | 6.3% | 7.5 | 12.1% | 3.6 |
| 2023 | 63.6 | 4.2 | 6.6% | 8.3 | 13.1% | 4.2 |
| 2024 | 65.2 | 4.3 | 6.6% | 9.0 | 13.8% | 4.7 |
| 2025 | 67.0 | 4.6 | 6.8% | 9.8 | 14.6% | 5.2 |
| 2026 | 68.9 | 4.7 | 6.9% | 10.7 | 15.5% | 5.9 |
| 2027 | 70.2 | 4.7 | 6.7% | 11.2 | 15.9% | 6.4 |
| 2028 | 71.7 | 5.1 | 7.1% | 12.0 | 16.8% | 7.0 |
| 2029 | 73.1 | 5.2 | 7.2% | 13.1 | 17.9% | 7.9 |
| 2030 | 74.3 | 5.3 | 7.2% | 14.0 | 18.9% | 8.7 |
| 2031 | 75.5 | 5.5 | 7.2% | 15.5 | 20.5% | 10.1 |
| 2032 | 76.3 | 5.9 | 7.7% | 16.4 | 21.5% | 10.5 |
| 2033 | 77.6 | 5.9 | 7.6% | 17.2 | 22.1% | 11.3 |
| 2034 | 78.4 | 6.2 | 7.9% | 18.6 | 23.8% | 12.5 |
| 2035 | 79.6 | 6.3 | 8.0% | 19.8 | 24.8% | 13.4 |
| 2036 | 80.3 | 6.3 | 7.8% | 20.4 | 25.4% | 14.1 |
| 2037 | 80.8 | 6.7 | 8.2% | 21.5 | 26.6% | 14.8 |
| 2038 | 81.3 | 6.5 | 8.0% | 22.5 | 27.6% | 15.9 |
| 2039 | 81.6 | 6.8 | 8.4% | 23.7 | 29.0% | 16.8 |
| 2040 | 82.0 | 6.9 | 8.4% | 24.7 | 30.1% | 17.8 |
| SOURCE: Urban Institute tabulations from DYNASIM for the Kaiser Family Foundation; proposed changes based on the President’s FY2014 Budget. | ||||||
| TABLE 3: Estimates of Medicare Part B Premiums Through 2022 Under Current Law | |||||||
| Income thresholds | |||||||
| Ultimate percentage of program costs represented by premium | |||||||
| Standard | Income-related | ||||||
| 25.0% | 35.0% | 50.0% | 65.0% | 80.0% | |||
| Singles | $85,000 or less | $85,001-107,000 | $107,001-160,000 | $160,001-214,000 | $214,001 or more | ||
| Couples | $170,000 or less | $170,001-214,000 | $214,001-320,000 | $320,001-428,000 | $428,001 or more | ||
| Historical and projected Part B premium amounts under current law | |||||||
| Ultimate percentage of program costs represented by premium | |||||||
| Standard | Income-related | ||||||
| Calendar year | 25.0% | 35.0% | 50.0% | 65.0% | 80.0% | Total per capita Part B costs* | Annual growth rate |
| 2007 | $93.50 | $105.80 | $124.40 | $142.90 | $161.40 | $374.00 | |
| 2008 | $96.40 | $122.20 | $160.90 | $199.70 | $238.40 | $385.60 | 3.1% |
| 2009 | $96.40 | $134.90 | $192.70 | $250.50 | $308.30 | $385.60 | 0.0% |
| 2010 | $110.50 | $154.70 | $221.00 | $287.30 | $353.60 | $442.00 | 14.6% |
| 2011 | $115.40 | $161.50 | $230.70 | $299.90 | $369.10 | $461.60 | 4.40% |
| 2012 | $99.90 | $139.90 | $199.80 | $259.70 | $319.70 | $399.60 | -13.4% |
| 2013 | $104.90 | $146.90 | $209.80 | $272.70 | $335.70 | $419.60 | 5.0% |
| 2014 | $104.90 | $146.90 | $209.80 | $272.70 | $335.70 | $419.60 | 0.0% |
| Projected Part B premium amounts under current-law intermediate estimates | |||||||
| 2015 | $110.70 | $154.90 | $221.30 | $287.70 | $354.10 | $442.80 | 5.5% |
| 2016 | $115.40 | $161.60 | $230.80 | $300.00 | $369.30 | $461.60 | 4.2% |
| 2017 | $120.90 | $169.20 | $241.70 | $314.20 | $386.70 | $483.60 | 4.8% |
| 2018 | $127.40 | $178.30 | $254.70 | $331.10 | $407.50 | $509.60 | 5.4% |
| 2019 | $134.40 | $188.20 | $268.80 | $349.40 | $430.10 | $537.60 | 5.5% |
| 2020 | $141.80 | $198.50 | $283.60 | $368.70 | $453.80 | $567.20 | 5.5% |
| 2021 | $150.00 | $209.90 | $299.90 | $389.90 | $479.80 | $600.00 | 5.8% |
| 2022 | $160.50 | $224.70 | $321.00 | $417.30 | $513.60 | $642.00 | 7.0% |
NOTE: *Total per capita Part B costs consist of the 25 percent standard beneficiary premium payment and the 75 percent federal contribution.SOURCE: Kaiser Family Foundation analysis of current-law intermediate estimates from the 2013 Annual Report of the Boards of Trustees of the Federal Hospital Insurance and Federal Supplementary Medical Insurance Trust Funds. | |||||||
| TABLE 4: Estimates of Medicare Part D Premiums Through 2022 Under Current Law | |||||||
| Income thresholds | |||||||
| Ultimate percentage of program costs represented by premium | |||||||
| Standard | Income-related | ||||||
| 25.5% | 35.0% | 50.0% | 65.0% | 80.0% | |||
| Singles | $85,000or less | $85,001-107,000 | $107,001-160,000 | $160,001-214,000 | $214,001or more | ||
| Couples | $170,000 or less | $170,001-214,000 | $214,001-320,000 | $320,001-428,000 | $428,001or more | ||
| Historical and projected Part D premium amounts under current law | |||||||
| Ultimate percentage of program costs represented by premium | |||||||
| Standard | Income-related | ||||||
| Calendar year | 25.5% | 35.0% | 50.0% | 65.0% | 80.0% | Total per capitaPart D costs* | Annual growth rate |
| 2007 | $27.35 | n/a | n/a | n/a | n/a | $107.25 | |
| 2008 | $27.93 | n/a | n/a | n/a | n/a | $109.53 | 2.1% |
| 2009 | $30.36 | n/a | n/a | n/a | n/a | $119.06 | 8.7% |
| 2010 | $31.94 | n/a | n/a | n/a | n/a | $125.25 | 5.2% |
| 2011 | $32.34 | $44.34 | $63.44 | $82.44 | $101.44 | $126.82 | 1.3% |
| 2012 | $31.08 | $42.66 | $60.94 | $79.22 | $97.51 | $121.88 | -3.9% |
| 2013 | $31.17 | $42.77 | $61.07 | $79.47 | $97.77 | $122.24 | 0.3% |
| 2014 | $32.42 | $44.52 | $63.52 | $82.62 | $101.72 | $127.14 | 4.0% |
| Projected Part D premium amounts under current-law intermediate estimates | |||||||
| 2015 | $36.68 | $50.38 | $71.88 | $93.48 | $115.08 | $143.84 | 13.1% |
| 2016 | $38.66 | $53.06 | $75.76 | $98.56 | $121.26 | $151.61 | 5.4% |
| 2017 | $41.28 | $56.68 | $80.98 | $105.18 | $129.48 | $161.88 | 6.8% |
| 2018 | $43.99 | $60.39 | $86.29 | $112.09 | $137.99 | $172.51 | 6.6% |
| 2019 | $46.99 | $64.49 | $92.19 | $119.79 | $147.39 | $184.27 | 6.8% |
| 2020 | $50.18 | $68.88 | $98.38 | $127.88 | $157.38 | $196.78 | 6.8% |
| 2021 | $53.28 | $73.08 | $104.48 | $135.78 | $167.18 | $208.94 | 6.2% |
| 2022 | $56.59 | $77.69 | $110.99 | $144.29 | $177.49 | $221.92 | 6.2% |
| NOTE: *Total per capita Part D costs consist of the 25.5 percent standard beneficiary premium payment and the 74.5 percent federal contribution.SOURCE: Kaiser Family Foundation analysis of current-law intermediate estimates from the 2013 Annual Report of the Boards of Trustees of the Federal Hospital Insurance and Federal Supplementary Medical Insurance Trust Funds. | |||||||
| TABLE 5: Estimates of Medicare Part B Premiums From 2017-2022 Under Changes Proposed in the President’s FY 2014 Budget | |||||||||||||
| Income thresholds | |||||||||||||
| Ultimate percentage of program costs represented by premium | |||||||||||||
| Standard | Income-related | ||||||||||||
| 25.0% | 40.0% | 46.5% | 53.0% | 59.% | 66.0% | 72.5% | 79.0% | 85.5% | 90% | ||||
| Singles | $85,000 or less | $85,001-92,333 | $92,334-99,667 | $99,668-107,000 | $107,001-124,667 | $124,668-142,334 | $142,334-160,000 | $160,001-178,000 | $178,001-196,000 | $196,001 or more | |||
| Couples | $170,000 or less | $170,001-184,666 | $184,666-199,334 | $199,334-214,000 | $214,001-249,334 | $249,334-284,666 | $284,666-320,000 | $320,001-356,000 | $356,001-392,000 | $392,001 or more | |||
| Part B premium amounts under intermediate estimates with proposed changes | |||||||||||||
| 2017 | $120.90 | $193.44 | $224.87 | $256.31 | $287.74 | $319.18 | $350.61 | $382.04 | $413.48 | $435.24 | |||
| 2018 | $127.40 | $203.84 | $236.96 | $270.09 | $303.21 | $336.34 | $369.46 | $402.58 | $435.71 | $458.64 | |||
| 2019 | $134.40 | $215.04 | $249.98 | $284.93 | $319.87 | $354.82 | $389.76 | $424.70 | $459.65 | $483.84 | |||
| 2020 | $141.80 | $226.88 | $263.75 | $300.62 | $337.48 | $374.35 | $411.22 | $448.09 | $484.96 | $510.48 | |||
| 2021 | $150.00 | $240.00 | $279.00 | $318.00 | $357.00 | $396.00 | $435.00 | $474.00 | $513.00 | $540.00 | |||
| 2022 | $160.50 | $256.80 | $298.53 | $340.26 | $381.99 | $423.72 | $465.45 | $507.18 | $548.91 | $577.80 | |||
| SOURCE: Kaiser Family Foundation analysis of current-law intermediate estimates from the 2013 Annual Report of the Boards of Trustees of the Federal Hospital Insurance and Federal Supplementary Medical Insurance Trust Funds and proposed changes based on the President’s FY 2014 Budget. | |||||||||||||
| TABLE 6: Estimates of Medicare Part D Premiums From 2017-2022 Under Changes Proposed in the President’s FY 2014 Budget | |||||||||||||
| Income thresholds | |||||||||||||
| Ultimate percentage of program costs represented by premium | |||||||||||||
| Standard | Income-related | ||||||||||||
| 25.5% | 40.0% | 46.5% | 53.0% | 59.% | 66.0% | 72.5% | 79.0% | 85.5% | 90% | ||||
| Singles | $85,000 or less | $85,001-92,333 | $92,334-99,667 | $99,668-107,000 | $107,001-124,667 | $124,668-142,334 | $142,334-160,000 | $160,001-178,000 | $178,001-196,000 | $196,001 or more | |||
| Couples | $170,000 or less | $170,001-184,666 | $184,666-199,334 | $199,334-214,000 | $214,001-249,334 | $249,334-284,666 | $284,666-320,000 | $320,001-356,000 | $356,001-392,000 | $392,001 or more | |||
| Part D premium amounts under intermediate estimates with proposed changes | |||||||||||||
| 2017 | $41.28 | $64.75 | $75.28 | $85.80 | $96.32 | $106.84 | $117.36 | $127.89 | $138.41 | $145.69 | |||
| 2018 | $43.99 | $69.00 | $80.22 | $91.43 | $102.64 | $113.86 | $125.07 | $136.28 | $147.50 | $155.26 | |||
| 2019 | $46.99 | $73.71 | $85.69 | $97.67 | $109.64 | $121.62 | $133.60 | $145.58 | $157.55 | $165.85 | |||
| 2020 | $50.18 | $78.71 | $91.50 | $104.30 | $117.09 | $129.88 | $142.67 | $155.46 | $168.25 | $177.11 | |||
| 2021 | $53.28 | $83.58 | $97.16 | $110.74 | $124.32 | $137.90 | $151.48 | $165.06 | $178.64 | $188.05 | |||
| 2022 | $56.59 | $88.77 | $103.19 | $117.62 | $132.04 | $146.47 | $160.89 | $175.32 | $189.74 | $199.73 | |||
| SOURCE: Kaiser Family Foundation analysis of current-law intermediate estimates from the 2013 Annual Report of the Boards of Trustees of the Federal Hospital Insurance and Federal Supplementary Medical Insurance Trust Funds and proposed changes based on the President’s FY 2014 Budget. | |||||||||||||
The analysis of Medicare beneficiaries estimated to pay the income-related premium under current and proposed law are based on the Urban Institute’s Dynamic Simulation of Income Model (DYNASIM3). DYNASIM3 starts with a self-weighting sample of 103,072 individuals from the 1990 to 1993 panels of the Survey of Income and Program Participation (SIPP) and ages this starting sample in yearly increments to 2085 using parameters estimated from longitudinal data sources. The model integrates many important trends and differences among groups in life course processes, including birth, death, schooling, leaving home, first marriage, remarriage, divorce, disability, work, retirement, and earnings. Projections of fertility, disability, mortality, net immigration, employment, average earnings, and price changes are aligned to be consistent with 2013 OASDI Trustees projections, based on the intermediate demographic and economic assumptions (available at http://www.ssa.gov/oact/tr/2013/trTOC.html). For a fuller description of DYNASIM3, see Karen E. Smith, “Projection Methods Used in the Dynamic Simulation of Income Model (DYNASIM3),” Urban Institute Program on Retirement Policy (2012).
The Centers for Medicare & Medicaid Services Office of the Actuary (OACT) has released estimates of actual and projected Part B and Part D enrollees paying income-related premiums under current law, but OACT has not released projections of how many Medicare beneficiaries would pay income-related premiums for Part B or Part D under the proposals discussed in this brief. DYNASIM produces estimates of enrollees paying income-related premiums that are very similar to, but not exactly the same as, OACT’s estimates under current law. The sensitivity analysis of the projected year when one-quarter of Medicare enrollees would be paying the income-related premium is based on DYNASIM projections using the low-cost and high-cost economic growth assumptions from the 2013 OASDI Trustees report. For the purpose of this sensitivity analysis, only the economic assumptions (consumer price index, average wage index, taxable payroll, gross domestic product, and compound interest rates) were modified; the fertility, mortality, disability, immigration, and employment assumptions were unchanged from the intermediate scenario. The low-cost scenario assumes low inflation and interest and high real wage growth. The high-cost scenario assumes high inflation and interest and low real wage growth.