KFF designs, conducts and analyzes original public opinion and survey research on Americans’ attitudes, knowledge, and experiences with the health care system to help amplify the public’s voice in major national debates.
As the November open enrollment period approaches, consumers in the federal and state marketplaces will soon have the opportunity to renew or change health plans for 2015. Health insurance plans often change from one year to the next, and some of these changes could have a real impact on costs and coverage, including changes in premiums, cost-sharing, benefits, formularies and choice of doctors and hospitals. Consumers are advised to review their options carefully before deciding whether to renew their current plan or enroll in a new one. But will they?
This question will sound familiar to those who have been tracking the Medicare Part D and Medicare Advantage markets, and based on this experience, the advice to review plan options makes good sense. Medicare Advantage plans in a given market vary in terms of benefits, cost-sharing and provider networks, and plans often make adjustments from one year to the next. Our analysis of the Medicare Part D market since its inception in 2006 has documented wide variability across plans, and not-insignificant changes in plan costs and benefit design features from year to year.
Yet, even with wide variation across plans and the potential to lower costs by switching plans, our research confirms a high degree of “stickiness” among Part D enrollees, with just over ten percent voluntarily switching plans during a recent open enrollment period. Our focus groups of Medicare beneficiaries help explain why. Seniors told us that they are generally aware of the open enrollment period, in part because they are inundated with marketing materials during the fall of each year. But, they also said that they have little appetite for what they consider the drudgery of comparing plans – even though they recognized it might be a good idea to do so.
The low rate of plan switching among Medicare Part D enrollees should not come as a total surprise. Similar results have been reported in studies of younger adults in health insurance marketplaces, including federal workers in the Federal Employees Health Benefits Program (FEHB) and among enrollees in Commonwealth Care in Massachusetts that was established prior to the ACA – suggesting a very high degree of satisfaction or a strong preference for the status quo, or both, in all three health insurance marketplaces (Exhibit 1).1
Exhibit 1: What Share of Health Insurance Enrollees Voluntarily Switched Plans During the Open Enrollment Period?
This brings us back to the upcoming November enrollment period for consumers in the federal and state marketplaces. While the health insurance marketplaces are clearly still in start-up mode, with enrollees still very much on a learning curve, the hope is that marketplace enrollees will carefully review the health plan options available in 2015, and switch plans when it is in their interest to do so. As my Kaiser Family Foundation colleagues explained in a recent analysis of 2015 marketplace premiums, consumers who chose low premium plans in 2014 may find their plan is no longer a low-cost option in 2015, and could wind up paying substantially more for their coverage unless they switch plans. And, maybe they will.
On the one hand, adults in the Marketplace may be more motivated than Medicare Part D enrollees to switch plans if the premium changes they face are appreciably larger than those for Part D plans; and it would not be a surprise if Marketplace premium increases and decreases are larger in dollar terms because they apply to a full range of medical services, not just prescription drugs, and could be subject to changes that result from a system that ties government premium contributions to the second least cost silver plan. Our Part D analysis found that enrollees with bigger premium increases were more likely than others to switch drug plans. Younger adults are also more likely than seniors to shop online and less likely to have health and cognitive impairments that make these tasks somewhat challenging. And, this year, they can change plans anytime between November 15 and February 15 — more than the six weeks allotted for Medicare beneficiaries.
On the other hand, online plan comparison tools for marketplace enrollees are still evolving, and consumers may have trouble getting all the information they need to compare plans. And, Marketplace enrollees may be less likely than older Part D enrollees to switch plans because they are less likely than seniors to have health problems, and therefore less likely to experience problems with their plan.
This year, the focus during the 2015 open enrollment period may be more on helping people maintain or gain access to coverage, much as it was when the Part D program began. But over time, there is likely to be interest in understanding whether marketplace consumers are “sticky” like their parents and grandparents on Medicare, or if the apple actually does fall far from the tree. The lack of consumer engagement during the open enrollment period is a concern if it means consumers get the short end of the “stick.”
Commonwealth Care was established in Massachusetts prior to the implementation of the Affordable Care Act to provide coverage to the uninsured. As the ACA is implemented, Commonwealth Care will be replaced with ConnectorCare. ↩︎
During the debate over the Affordable Care Act (ACA), some questioned whether the Medicare Advantage market would shrink in response to the reductions in payments to Medicare Advantage plans included in the ACA, expressing concern that plans would exit markets across the country, leading to a drop in enrollment. Instead, enrollment in Medicare Advantage plans has continued to increase; however, each year, the question is raised about how the Medicare Advantage market will change going forward and how the changes will affect beneficiaries. This Data Note examines the availability of plans nationwide and by state in 2015, and changes in plan availability since 2011. It documents the number and share of Medicare Advantage enrollees affected by plan withdrawals each year, the characteristics of plans that will be entering the market and characteristics of those exiting the market in 2015, and assesses the potential implications of these changes for Medicare Advantage enrollees. Finally, this data note compares plan participation at the state-level and provides a snapshot of changes in the Medicare Advantage market in 2015.
Section:
0/0
Issue Brief
During the debate over the Affordable Care Act (ACA), some questioned whether the Medicare Advantage market would shrink in response to the reductions in payments to Medicare Advantage plans included in the ACA,1 expressing concern that plans would exit markets across the country, leading to a drop in enrollment, similar to what occurred after the Balanced Budget Act of 1997 (BBA97).2 Since 2010, enrollment has far exceeded expectations, increasing by nearly 5 million beneficiaries, continuing a steady upward climb that started a decade ago.3 Between 2010 and 2014, the total number of plans has declined modestly, but beneficiaries in 2014 still had the option to choose among 18 Medicare Advantage plans, on average.4 Medicare Advantage plans enter and exit markets for a number of reasons related to business strategies, local market conditions, and profitability. When Medicare Advantage plans make a decision to exit markets, beneficiaries have the option to switch to another Medicare Advantage plan offered in their area or get coverage under traditional Medicare. If they choose traditional Medicare following termination of their plan, they have a special open enrollment period for Medigap policies. In this sense, traditional Medicare serves as a back-up for beneficiaries affected by Medicare Advantage plans terminations.This Data Note examines the availability of plans nationwide and by state in 2015, and changes in plan availability since 2011. It documents the number and share of Medicare Advantage enrollees affected by plan withdrawals each year, the characteristics of plans that will be entering the market and characteristics of those exiting the market in 2015, and also assesses the potential implications of these changes for Medicare Advantage enrollees. While the availability of Medicare Advantage plans varies within states by county, this Data Note compares plan participation at the state-level to provide a snapshot of changes in the Medicare Advantage market in 2015. Plans that consolidate (withdraw from the certain counties, but remain in others) are counted among the exiting plans for areas where they will no longer offer plans in 2015. The analysis excludes group Medicare Advantage plans, Special Needs Plans (SNPs) and other plans not available for general enrollment.
Medicare Advantage Plan Availability
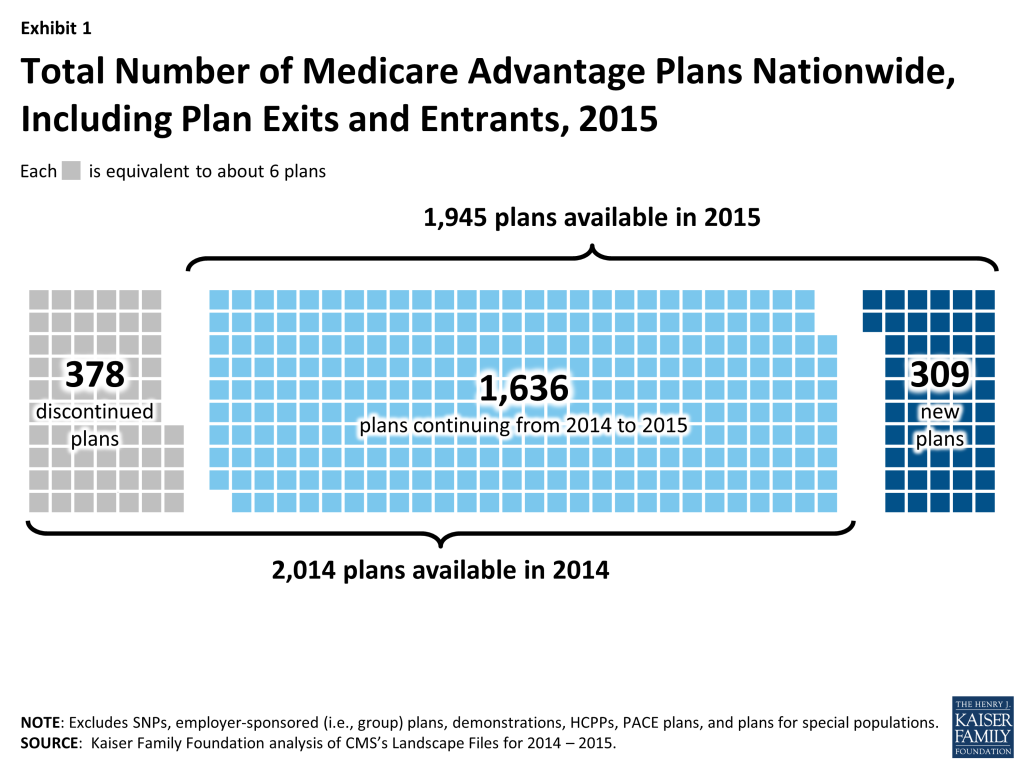
Nationwide. The total number of Medicare Advantage plans will be similar to the number in 2014, declining by 3 percent from 2,014 plans in 2014 to 1,945 plans in 2015 (Exhibit 1). The number of plans reflects both plan exits and entries. Between 2014 and 2015, more Medicare Advantage plans will exit than enter: 378 plans will exit markets across the country at the end of 2014 while 309 new plans will enter markets in 2015. The majority of plans in 2015 (84%) are plans that were also available in 2014.
Exhibit 1: Total Number of Medicare Advantage Plans Nationwide, Including Plan Exits and Entrants, 2015
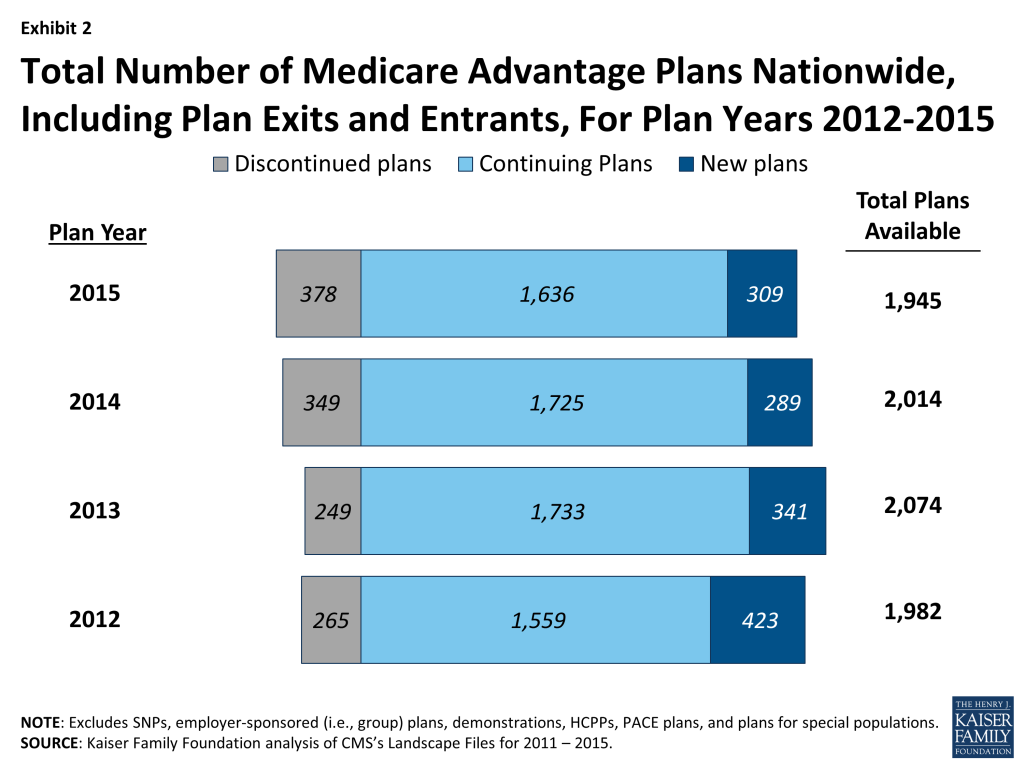
A larger number of plans will exit the market in 2015 than any other year since 2012 (Exhibit 2). At the same time, more Medicare Advantage plans will enter the market in 2015 (309 plans) than in 2014 (289 plans).
Exhibit 2: Total Number of Medicare Advantage Plans Nationwide, Including Plan Exits and Entrants, For Plan Years 2012-2015
By state. Virtually every state (except for AK and WY) will have some change in plan offerings in 2015. Some states will see more departing plans than new plans, while other states will see more new than departing plans. In most states, the total number of plans offered in 2015 will be similar to the number in 2014. In nine states (AR, FL, GA, NC, PA, SC, VA, VT, and WI), the number of departing plans will exceed the number of new plans by at least 10 plans, while in two states (KY and TN) the number of new plans will exceed the number of departing plans by at least 10 plans in 2015. Beneficiaries in four states (CA, FL, NY, and PA) will see large numbers of both new plans and departing plans (20 or more) for 2015. Overall, relatively few states will see sizeable differences in the number of plans available between 2014 and 2015.
Affected Enrollees
Four percent of Medicare Advantage enrollees (479,832 enrollees) are in plans that are exiting the market at the end of 2014 and will need to find an alternative source of Medicare coverage, either another Medicare Advantage plan or traditional Medicare (Appendix Table 1). Last year, at the end of 2013, a larger number (roughly 526,000 enrollees) and a slightly larger share (about 5%) of the Medicare Advantage population were affected by plan departures.5
The share of Medicare Advantage enrollees affected by plan departures ranges from less than 1 percent in 20 states and the District of Columbia to more than 10 percent in 8 states (CT, HI, ID, MD, MT, NC, NH, VT). In Hawaii, 64 percent of enrollees are in exiting plans, the largest of which is a regional PPO offered by Hawaii Medical Services Association (HMSA), a BlueCross BlueShield affiliate; HMSA will continue to offer local PPOs in all counties of Hawaii.6 In most states, less than 5 percent of Medicare Advantage enrollees will be affected by plan departures. In four states (CA, NC, NY, and PA), a larger number (more than 20,000 enrollees), but a relatively small share of enrollees (less than or equal to 7% in CA, NY, and PA; 17% in NC) are enrolled in plans that will not be offered in 2015. In contrast, in 13 states and the District of Columbia, fewer than 1,000 people are enrolled in plans in 2014 that will not be offered in 2015.
Characteristics of Medicare Advantage Market Exits and Entries
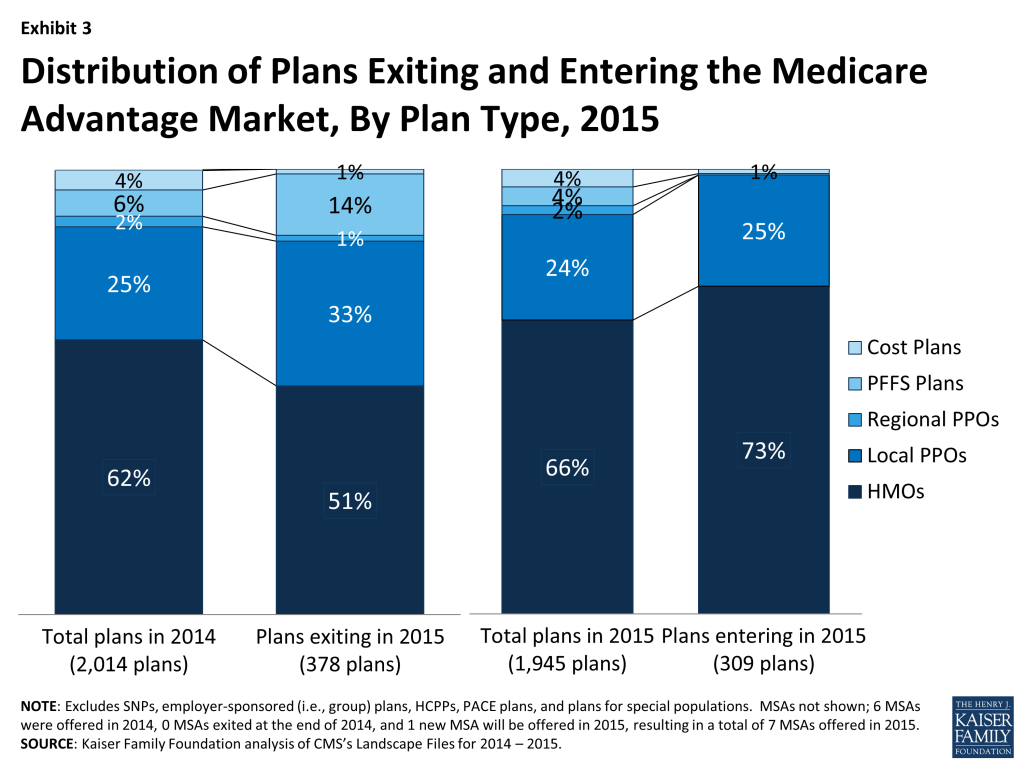
Plan Type. Among departing plans, local PPOs and PFFS (private fee-for-service) plans are disproportionately represented (Exhibit 3). Local PPOs comprise one-quarter (25%) of plans offered in 2014, but one-third (33%) of departing plans in 2015. Similarly, PFFS plans comprise only 6 percent of plans offered in 2014, but 14 percent of departing plans in 2015. In fact, more than four in ten PFFS plans (43%) and more than two in ten local PPOs (24%) are exiting the market in 2015 (Appendix Table 2). The reduction in PFFS plans available between 2014 and 2015 continues the trend in PFFS plan exits that has been observed since the Medicare Improvements for Patients and Providers Act (MIPPA) of 2008 required most PFFS plans to adopt provider networks. PFFS plans have attracted fewer enrollees over the years, dropping from a high of more than 2 million in 2009 to about 300,000 in 2014 – confirming the waning role of PFFS plans in the Medicare Advantage market.
As in prior years, PFFS plans departing the market are expected to be replaced by other plan types. HMOs are disproportionately represented, and comprise 73 percent of the new plans that will be offered in 2015, and comprise 66 percent of all Medicare Advantage plans offered in 2015 (Exhibit 3). In contrast, both regional PPOs and PFFS plans are underrepresented among new plans. These proportions may be reflective of plan choices made by new enrollees in recent years, and business decisions of insurers about the viability and profitability of these products.
Exhibit 3: Distribution of Plans Exiting and Entering the Medicare Advantage Market, By Plan Type, 2015
Tax Status. The majority of plans departing the market at the end of 2014 are for-profit plans (79%), a share which is similar to the proportion of plans that were for-profit in 2014. Similarly, most new plans are for-profit plans (70%) in 2015. Overall, there were no meaningful differences in the tax status of plans exiting or entering the market.
In addition to plan type and tax status, the analysis looked at whether plans that are exiting the market are disproportionately low enrollment and have lower quality ratings. This part of the analysis includes the 215 plans that are terminating their contract with CMS at the end of 2014, but excludes the plans that will consolidate into new plans, because the plans that are consolidating often have different enrollment levels and star ratings in the various areas in which they serve, which cannot be separately analyzed.
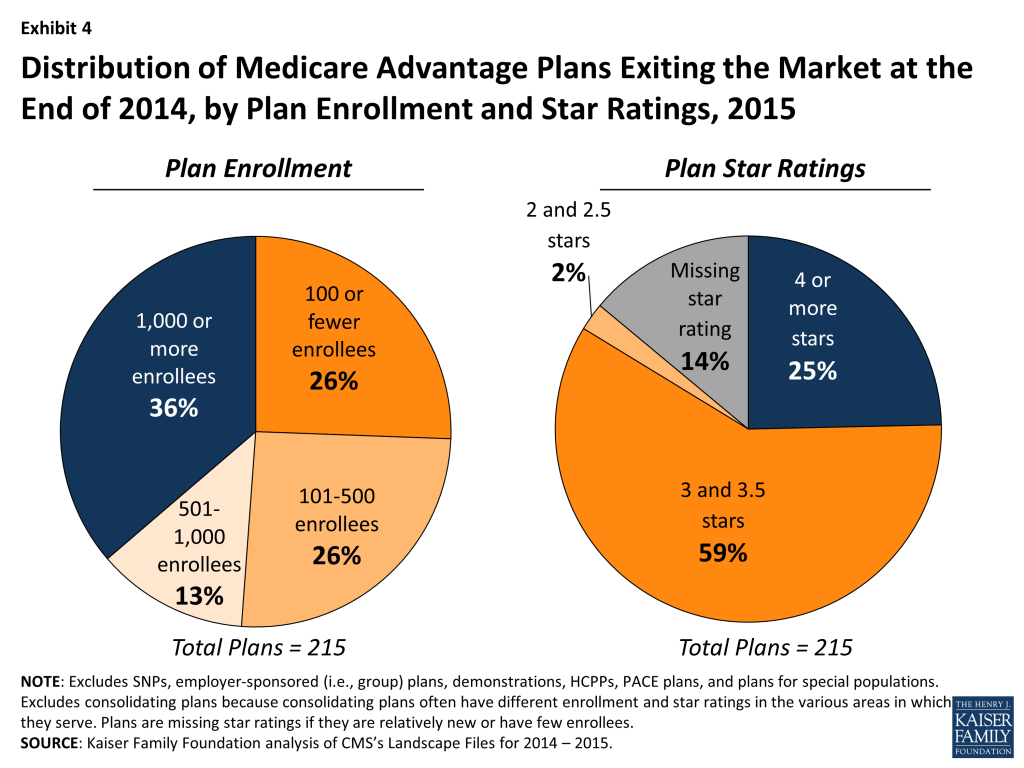
Enrollment. Most of the plans that are departing from the market (excluding those that consolidated into new plans) at the end of 2014, have relatively low enrollment: nearly two-thirds (64 percent) have less than 1,000 enrollees, and about half (51%) have fewer than 500 enrollees in 2014 (Exhibit 4). Plans with fewer than 100 enrollees are disproportionately represented among plans exiting the market; almost three in ten plans with fewer than 100 enrollees (29%) are exiting the market in 2014 (Appendix Table 3). The average number of enrollees in a plan was 5,268 in 2014. Overall, most plans that are exiting the market at the end of 2014 have relatively few enrollees, and few beneficiaries will be affected by the market exits.
Quality Ratings. The majority of plans exiting the market at the end of 2014 have average or below average ratings (Exhibit 4). Most (59%) of the plans terminating their contracts with CMS at the end of 2014 received 3 or 3. 5 stars – ratings for which plans received bonuses in 2014 but will not receive bonuses in 2015 or future years. Among plans with 3 or 3.5 stars, 15 percent are exiting the market at the end of this year. Plans with below average ratings (2 or 2.5 stars) represent a small share of all departing plans, but a disproportionate share (25 percent) of these plans are exiting (Appendix Table 3). In 2015, Medicare beneficiaries will see fewer plans with average or below average ratings.7
Exhibit 4: Distribution of Medicare Advantage Plans Exiting the Market at the End of 2014, by Plan Enrollment and Star Ratings, 2015
Discussion
While the total number of Medicare Advantage plans offered in counties across the country will be slightly lower in 2015 than in 2014, the vast majority of plans offered in 2015 (84%) were also offered in 2014. As in previous years, some plans will terminate their contracts with Medicare before the end of the year, while others will enter new markets, creating new options for Medicare beneficiaries in those areas.
Plans with relatively low enrollment and plans with average star quality ratings or below comprise the majority of plans exiting the markets. These changes are primarily weeding out plans that did not attract many enrollees and plans that received relatively low quality ratings. The CMS quality-based bonus demonstration will draw to a close at the end of 2014, and only plans with above average ratings (4 or more stars) will receive bonuses in 2015 and future years. This could make it more challenging for plans with fewer stars to compete with higher-rated plans, unless they improve their ratings.
Despite concerns that the ACA would result in a major contraction of Medicare Advantage plans, the 2015 market continues to look robust. While some plans have terminated their contracts with Medicare, most have decided to continue to operate, and others are launching new plans across the country in 2015. Companies may have adjusted their business strategies and tightened their belts in response to the changes in the ACA and the sequestration of Medicare spending put in place under the Budget Control Act of 2011. Virtually all Medicare Advantage enrollees will have the option to stay in the same plan in 2015; just 3 percent of enrollees are in plans that are exiting the market at the end of this year, though this rate will vary somewhat by county. In all likelihood, beneficiaries affected by plan exits will have other Medicare Advantage options available, including new plans vying for beneficiaries, in addition to traditional Medicare.
This brief was updated (October 2014) to adjust for the departure of plans from counties and to use September 2014 enrollment; the prior version focused on the departure of plans from states and used enrollment from March 2014. Due to these adjustments, the total number of enrollees affected by plan departures increased from 318,717 to 479,832 Medicare Advantage enrollees nationally, with corresponding changes by state, reflected in Appendix Table 1.
Appendix
Appendix Table 1. Plan Entries and Exits in the Medicare Advantage Market, 2014-2015
State
Total plans in 2014
Plans departingby January 2015
Plans continuing in 2015
New plans in 2015
Total plans in 2015
Number of 2014 market enrollees in departing plans
Percent of 2014 market enrollees in departing plans
Total U.S.
2014
378
1636
309
1945
479,832
4%
Alabama
23
1
22
3
25
206
0%
Alaska
0
0
0
0
0
–
0%
Arizona
44
6
38
3
41
12,440
5%
Arkansas
39
13
26
2
28
7,022
9%
California
201
33
168
34
202
45,151
3%
Colorado
49
1
48
2
50
1,047
1%
Connecticut
18
2
16
7
23
13,595
11%
Delaware
7
2
5
1
6
275
4%
District of Columbia
10
1
9
2
11
24
1%
Florida
188
54
134
20
154
14,640
1%
Georgia
53
24
29
3
32
11,693
5%
Hawaii
17
8
9
5
14
44,740
64%
Idaho
34
2
32
6
38
11,784
14%
Illinois
66
15
51
17
68
2,945
2%
Indiana
47
11
36
4
40
7,244
4%
Iowa
40
10
30
2
32
700
1%
Kansas
33
4
29
2
31
1,391
3%
Kentucky
24
3
21
14
35
3,579
3%
Louisiana
29
2
27
4
31
4,008
2%
Maine
37
10
27
5
32
2,404
5%
Maryland
22
9
13
2
15
12,148
28%
Massachusetts
50
8
42
4
46
798
1%
Michigan
53
2
51
5
56
991
0%
Minnesota
32
2
30
3
33
14,258
4%
Mississippi
26
10
16
1
17
3,065
5%
Missouri
54
11
43
3
46
3,549
1%
Montana
13
4
9
4
13
9,360
31%
Nebraska
14
2
12
4
16
934
3%
Nevada
23
1
22
4
26
336
0%
New Hampshire
19
10
9
1
10
1,699
15%
New Jersey
30
5
25
13
38
8,335
6%
New Mexico
25
5
20
2
22
986
1%
New York
168
33
135
26
161
55,295
7%
North Carolina
46
21
25
11
36
57,424
17%
North Dakota
11
1
10
0
10
111
3%
Ohio
85
15
70
19
89
12,953
3%
Oklahoma
34
5
29
6
35
1,570
2%
Oregon
78
9
69
13
82
6,605
3%
Pennsylvania
163
65
98
20
118
33,768
5%
Puerto Rico
36
11
25
3
28
1,179
1%
Rhode Island
8
0
8
3
11
–
0%
South Carolina
31
13
18
2
20
12,594
10%
South Dakota
14
1
13
0
13
22
0%
Tennessee
41
2
39
16
55
8,292
3%
Texas
126
25
101
18
119
7,467
1%
Utah
13
0
13
3
16
5,186
5%
Vermont
17
11
6
1
7
718
10%
Virginia
80
31
49
12
61
5,851
3%
Washington
70
10
60
3
63
16,869
6%
West Virginia
29
11
18
2
20
2,529
6%
Wisconsin
73
24
49
1
50
10,052
3%
Wyoming
3
0
3
0
3
–
0%
NOTE: Columns do not sum to the Total U.S. due to plans offered in more than one state. Plans with service area reductions were categorized as departing plans in states in which they will no longer operate, as continuing plans in states in which they will continue to operate, and as new plans in states in which they will operate for the first time. Plan counts and enrollment excludes SNPs, employer-sponsored (i.e., group) plans, demonstrations, HCPPs, PACE plans, and plans for special populations (e.g., Mennonites).SOURCE: Kaiser Family Foundation analysis of CMS’s Landscape Files for 2014 – 2015.
Appendix Table 2. Plan Type and Tax Status of Discontinued and New Plans in 2014 and 2015
Total number of plans in 2014
Plans departing by January 2015
Plans continuing in 2015
New plans in 2015
Total number of plans in 2015
Number
Percent of total plans in 2014
Number
Percent of total plans in 2015
Total
2,014
378
19%
1,636
309
16%
1,945
Plan Type
HMOs
1,242
194
16%
1,048
227
18%
1,275
Local PPOs
511
123
24%
388
77
17%
465
Regional PPOs
48
5
10%
43
0
0%
43
PFFS plans
120
52
43%
68
1
1%
69
Cost plans
87
4
5%
83
3
3%
86
MSA plans
6
0
0%
6
1
14%
7
Tax Status
Not-for-profit
524
78
15%
446
59
12%
505
For-profit
1,488
298
20%
1,190
215
15%
1,405
Unknown tax status
2
2
100%
0
35
100%
35
NOTE: Excludes SNPs, employer-sponsored (i.e., group) plans, demonstrations, HCPPs, PACE plans, and plans for special populations. Tax status not known for plans not included in the 2014 Plan Directory. n/a denotes cells not applicable.SOURCE: Kaiser Family Foundation analysis of CMS’s Landscape Files for 2014 – 2015.
Appendix Table 3. Enrollment and Ratings of Discontinued Plans in 2014 and 2015
Total number of plans in 2014
Plans departing by January 2015
Number
Percent of total plans in 2014
Total
2,014
378
19%
Consolidating Plans
n/a
163
n/a
Non-consolidating, departing plans
n/a
215
n/a
Number of Enrollees, Among Non-Consolidating Plans
100 or fewer enrollees
191
55
29%
101-500
337
55
16%
501-1000
242
27
11%
1000+
1,244
78
6%
Star Rating, Among Non-Consolidating Plans
4 or more stars
938
53
6%
3 and 3.5 stars
838
127
15%
2 and 2.5 stars
20
5
25%
Missing star rating
218
30
14%
NOTE: Excludes SNPs, employer-sponsored (i.e., group) plans, demonstrations, HCPPs, PACE plans, and plans for special populations. Consolidated plans were excluded from this analysis because they often have different enrollment levels and star ratings in the various areas in which they serve, which cannot be analyzed separately. Plans that are relatively new or have few enrollees are not rated and thus are missing star ratings. n/a denotes cells not applicable.SOURCE: Kaiser Family Foundation analysis of CMS’s Landscape Files for 2014 – 2015.
Ebola virus has a unique set of characteristics that determine how and why its spreads, and how deadly it can be. To better understand Ebola, a new Kaiser Family Foundation infographic compares it to twelve other infectious diseases that continue to represent public health challenges today and offers five key takeaways about the disease.
Other Kaiser Family Foundation resources on the Ebola outbreak and the U.S. response are available online.
For many women, missing work when their children have a cold or upset stomach takes a financial toll on family income.
A new data note from the Kaiser Family Foundation reports on the number of working mothers who must take unpaid time off when their children are sick and discusses state and national policies addressing the issue.
Four in ten working mothers (39 percent) report that they must take time off and stay home when their children are sick, over ten times the share of men (3 percent).
Among mothers with no alternative to missing work when a child is sick, 60 percent say they aren’t paid for the time off, up from 45 percent in 2004.
Working mothers with lower incomes are particularly affected. More than half report they must miss work to care for sick kids at home, while 36 percent say their jobs offer paid sick leave and 43 percent say they get paid vacation days.
For more information about women’s health policy, visit kff.org.
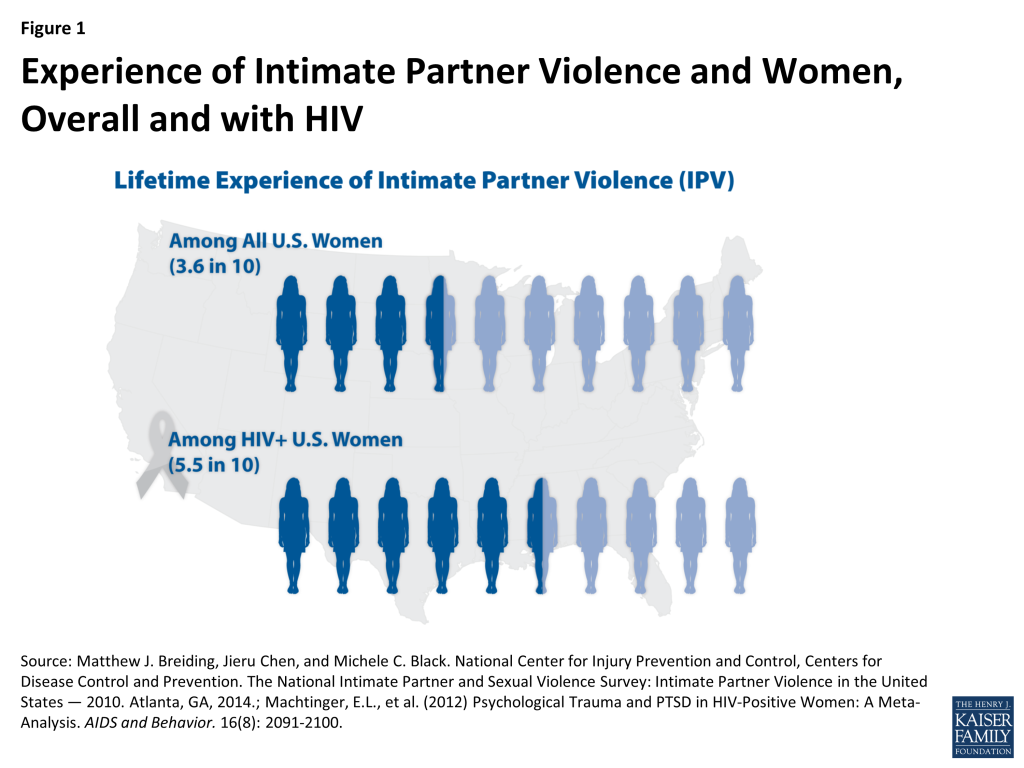
An estimated 36 percent of women in the U.S. report having experienced intimate partner violence (IPV), also called domestic violence, but among HIV positive women 55 percent report such experiences.
A new Kaiser Family Foundation analysis looks at opportunities to address IPV in the Affordable Care Act (ACA) that could help women who are HIV positive or at risk for HIV. The analysis, HIV, Intimate Partner Violence and Women: New Opportunities Under the Affordable Care Act, looks at the law’s broad changes expanding access to affordable health coverage, and its specific provisions designed to protect individuals who have experienced IPV.
Women in the United States experience high rates of violence and trauma, including physical, sexual, and emotional abuse, and women with HIV, who represent about a quarter of all people living with HIV in the U.S., are disproportionally affected.1,2,3 Intimate partner violence (IPV), also called domestic violence (DV)4 , in particular has been shown to be associated with increased risk for HIV among women as well as poorer treatment outcomes for those who are already infected.5,6 In addition, it has been suggested that women are at risk of experiencing violence upon disclosure of their HIV status to partners.7 In recognition of the risks experienced by women with HIV, President Obama issued a Presidential Memorandum in 2012 establishing an interagency working group to examine the intersection of HIV, violence against women and girls, and gender-related health disparities, noting, among other things, that “[g]ender based violence continues to be an underreported, common problem that, if ignored, increases risks for HIV and may prevent women and girls from seeking prevention, treatment, and health services.”8 Given the role that IPV plays in HIV risk, transmission, and care and treatment, finding ways to mitigate its effects is an important part of addressing the HIV epidemic among women in the United States.
Table 1. Key Terms and Definitions
Term
Definition
Violence
Four categories: physical violence, sexual violence, threat of physical or sexual violence, and psychological/emotional abuse.9
Intimate Partner
Intimate partners can include current and former heterosexual or same-sex: spouses (including common-law spouses), non-marital partners, dating partners such as boyfriends/girlfriends, and separated spouses. Partners may or may not be cohabiting and the relationship may or may not involve sexual activities.10
Intimate Partner Violence (IPV)
“Intimate partner violence includes physical violence, sexual violence, threats of physical or sexual violence, stalking, and psychological aggression (including coercive tactics) by a current or former intimate partner.”11
Trauma
Trauma “can refer to a single event, multiple events, or a set of circumstances that is experienced by an individual as physically and emotionally harmful or threatening and that has lasting adverse effects on the individual’s physical, social, emotional, or spiritual well-being.”12
One potential avenue for doing so is the Affordable Care Act (ACA) which, in addition to expanding health coverage to millions of uninsured individuals in the United States, offers new opportunities for addressing the needs of women at risk for and living with HIV who have experienced IPV. This issue brief provides an overview of these new opportunities, as well as a summary of key statistics and definitions. While the focus of this brief is on the experience of IPV and HIV among women, it is important to recognize that men too experience IPV and other forms of violence that put them at increased risk for HIV.13
Key Statistics
Women in the United States experience high levels of violence, including sexual violence, across their lifetimes, with the most recent data indicating that approximately 27% of US women report ever having experienced unwanted sexual contact.14 Moreover, an estimated 36% of all US women report ever having experienced IPV including rape, physical violence, and/or stalking.15 Among HIV positive women, IPV is even more prevalent, reported by 55% of women living with HIV.16 In addition to the traumatic impact IPV has on all women, the experience of trauma and violence is also associated with poor treatment outcomes and higher transmission risk among HIV positive women.17,18
Figure 1: Experience of Intimate Partner Violence and Women, Overall and with HIV
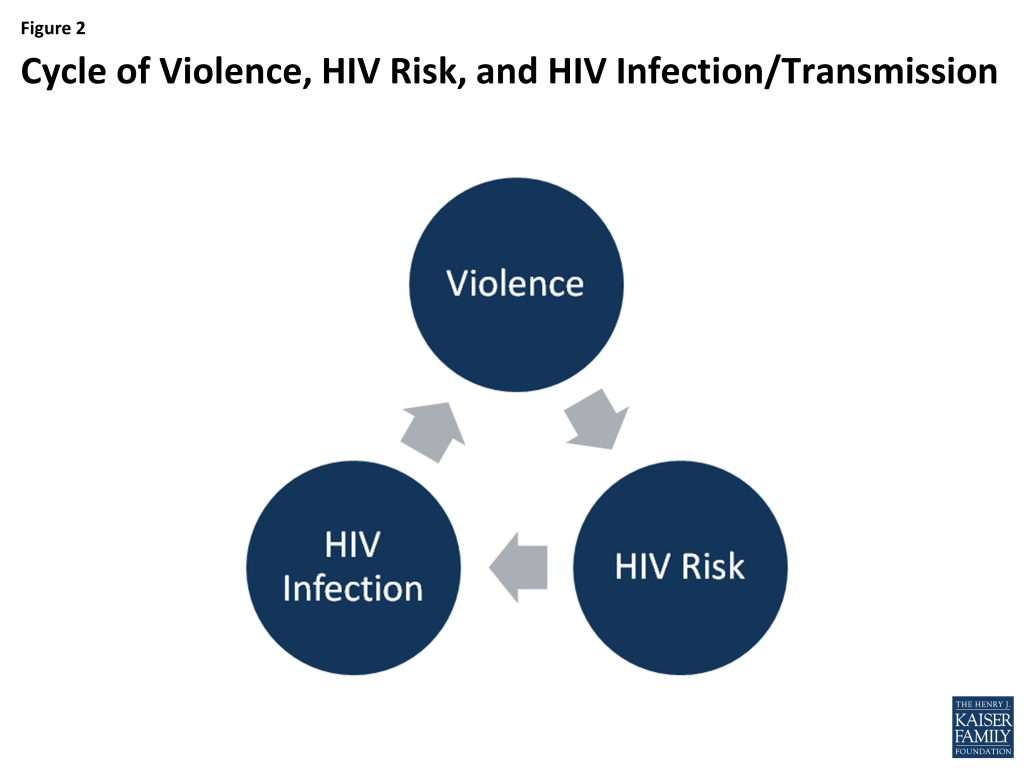
In many cases, the factors that put women at risk for contracting HIV are similar to those that make them vulnerable to experiencing trauma and IPV. Women in violent relationships are at a four times greater risk for contracting STIs, including HIV, than women in non-violent relationships and women who experience IPV are more likely to report risk factors for HIV.19 A nationally representative study found 20% of HIV positive women had experienced violence by a partner or someone important to them since their diagnosis and that of these, half perceive that violence to be directly related to their HIV serostatus.20 Indeed, these experiences are interrelated and can become a cycle of violence, HIV risk, and HIV infection. In this cycle, women who experience IPV are at increased susceptibility for contracting HIV and HIV positive women are at greater risk for becoming victims of IPV.21,22
Figure 2: Cycle of Violence, HIV Risk, and HIV Infection/Transmission
How The ACA Addresses Intimate Partner Violence
The ACA, signed into law in 2010, aims to expand access to affordable health coverage and reduce the number of uninsured Americans through the creation of new health insurance marketplaces in each state and by expanding Medicaid, in states that choose to expand their programs, as well as through other reforms. Beyond these broad changes, there are several provisions that are specifically designed to protect individuals who have experienced IPV, including those with HIV. These include explicit protections in the law, as well as regulatory interpretation and guidance, as follows:
The elimination of pre-existing condition exclusions and premium rate setting based on health status, such as HIV, and other factors, including whether someone is a survivor of IPV. Prior to the ACA, health insurance companies were able to deny insurance coverage or charge individuals different rates based on a range of factors including whether someone was a survivor of IPV; in fact, seven states specifically allowed insurers to deny coverage to survivors and fewer than half of states (22) had enacted comprehensive IPV related anti-discrimination insurance protections.23 Under the ACA, issuers are no longer permitted to deny an individual coverage or charge higher rates based on past or current experience of IPV or gender. Rates are permitted to vary by only age, geographic location, and smoking status. This provision is important for HIV positive domestic violence survivors who in the past could have faced denials or higher rates based on that experience, their gender, or their HIV status.
A range of no-cost preventive services for women including screening and counseling for IPV. Screening and counseling for IPV is now a preventive service under the ACA that must be covered without cost-sharing. Most private health plans and all Medicaid expansion programs, in states that expand, must provide such services free of charge. However, there is no requirement that traditional state Medicaid programs provide no-cost IPV screenings as part of the state benefit package. Screening might occur during a routine office visit or well-woman exam and might entail a provider asking a patient about their current and past relationships. The Department of Health and Human Services’ Office on Women’s Health states that if IPV/DV is disclosed, counseling can consist of a brief session that 1) addresses a patient’s immediate safety; 2) discusses the connection between IPV/DV and other health concerns; and 3) provides linkage to support services and resources.24
Exemption from the individual mandate due to recent experience of IPV. Beginning in 2014, the ACA required most individuals to carry comprehensive health coverage, also known as “minimum essential coverage” or the “individual mandate.” Those without coverage must either qualify for an exemption or pay a tax penalty. One exemption category is for individuals who have recently experienced domestic violence. No additional supporting documentation needs to be provided to qualify, though the applicant is asked to explain how “the hardship,” in this case experience of domestic violence, prevented them from gaining coverage. This exemption recognizes that those who have recently experienced domestic violence may lack financial security, stable housing, or be dealing with other complicated life situations that make obtaining insurance coverage difficult.
Allowance for married survivors of IPV to file taxes separately from their spouse and claim a premium tax credit. To help make insurance coverage more affordable, the ACA provides advanced premium tax credits to individuals between 100% and 400% of the federal poverty level who purchase private insurance through state and federal exchanges. Per the ACA, a married individual needs to file taxes jointly with their spouse to be eligible for premium tax credits which can help make health insurance coverage purchased through a marketplace more affordable. The Department of Treasury and Internal Revenue Service (IRS) issued guidance and subsequent regulations in April and July of 2014 that permit a survivor of IPV living apart from their spouse at the time of tax filing and unable to file a joint return, to claim a premium tax credit while using a married filing separately tax status for up to three consecutive years.25 Allowing DV survivors to file using this tax status and still obtain premium tax credits is designed to protect them from having to interact with an abuser at tax time while still being able to access insurance subsidies.
Special Enrollment Period for survivors of IPV. While enrollment in private health plans through the insurance marketplaces must occur during a specific open enrollment period in most cases, there are exceptions. Individuals experiencing certain qualifying events, such as a marriage, divorce, or birth of a child, may be granted a Special Enrollment Period (SEP) and permitted to enroll outside of the specified open enrollment window. At the close of the first open enrollment period in 2014, in light of the Treasury Department and IRS guidance and regulations (explained above), a special enrollment period (SEP) was extended to victims of IPV in federally facilitated marketplaces and state-run marketplaces were allowed to do the same.26 In this case, the SEP allowed those eligible an additional opportunity to access coverage with tax credits as described above. The SEP lasted through May 30, 2014, a two month extension of the original open enrollment deadline.
Most individual and small group plans and all Medicaid expansion plans now cover mental health and substance use services as one of ten “essential health benefit” categories. The ACA requires that individual and small group plans, sold both inside and outside the health insurance marketplaces, as well as Medicaid expansion plans, provide ten categories of essential health benefits including among others: ambulatory services; hospitalization; prescription drugs; and of note in this instance, mental health and substance use disorder services. Prior to this requirement, it was estimated that about one-third of those enrolled in individual market products lacked coverage for substance use services and about 20 percent were without coverage for mental health services.27 In addition, the ACA applies Mental Health Parity and Addiction Equity Act of 2008 standards to the individual and small group insurance markets which means that these services must now be covered at parity with medical and surgical benefits. Numerous studies have observed an association between IPV and an array of mental health conditions, including Post Traumatic Stress Disorder (PTSD), depression, and anxiety, among others.28,29 Additionally, people with HIV experience mental health and substance abuse comorbidities at higher rates than the population overall.30,31,32 Access to mental health and substance use services, therefore, is an important component of comprehensive health coverage for many people living with HIV and perhaps especially for those dealing with current or past IPV and trauma.
Maternal and child home visitation program includes focus on domestic violence. The ACA funded the Maternal, Infant, and Early Childhood Home Visiting initiative, a competitive grant program that provides states with resources to respond to the needs of children and families in at risk communities and includes specific opportunities to address domestic violence. Seeking to improve, coordinate, and provide home visitation services, the statute required states to conduct a statewide needs assessment for FY11 including identification of communities with concentrations of domestic violence. Participating states are required to demonstrate a reduction in crime or domestic violence, among other benchmarks which were also identified as target outcomes for participating families. A 2013 study of 260 HIV positive women with a mean age of 46, found that 86% of those surveyed were mothers and 31% had children living at home.33 Given that a large share of women with HIV are likely to be parents and that women with HIV are disproportionately affected by IPV, home visits that include opportunities to address domestic violence could be particularly important for this population.
Competitive grant program to support pregnant teens and women, including those experiencing domestic and sexual violence, established under the Pregnancy Assistance Fund. The ACA also established a competitive grant program for states to support pregnant and parenting teens and women, allowing states to use funds to provide intervention and support services to pregnant women who are victims of domestic, sexual violence or stalking. The fund is also available to support the provision of assistance and training related to these issues for federal, state, local and other partners.
The National Prevention Strategy includes Injury and Violence Free Living as a priority area. Finally, the ACA established the National Prevention Council and called for the development of the National Prevention Strategy. With an aim of realizing the benefits of prevention in healthcare, the strategy includes seven national priority areas including Injury and Violence Free Living.34 In framing this this priority area, the strategy makes specific references to intimate partner violence, including the recommendation that the federal government “research and disseminate effective methods to prevent intimate partner violence and sexual violence.”
As mentioned above, in addition to the changes brought on by the ACA, and recognizing the complexity of these issues, in March 2012, President Obama issued a Presidential Memorandum establishing an interagency working group on the intersection of HIV/AIDS, violence against women and girls, and gender-related health disparities.35 The memorandum identifies the need to address violence against women within the Nation’s approach to the domestic HIV epidemic. It required the working group to provide recommended relevant updates to the National HIV/AIDS Strategy to the administration as well as to effectively take on a monitoring role to coordinate efforts to address HIV and violence against women and girls across federal agencies. Two reports have been issued by the working group thus far.36
Looking Ahead
Addressing trauma and violence experienced by both HIV positive and negative women aims to provide critical care and support to women in the immediate term, but in the longer term, may also be an important contribution in combating the domestic HIV epidemic. The ACA provisions outlined above provide important opportunities for targeted interventions to address IPV in HIV positive and at risk women, although several challenges remain.
With respect to screening and counseling for IPV, as with all preventive services, coverage does not necessarily equate with uptake by consumers or with the service being offered by providers. Inclusion of DV screening as a reimbursable service and the associated federal and advisory body recommendations may drive up some provision of the intervention but additional efforts may be necessary to generate more widespread provider led IPV screenings. One recent study found that just 23% of women ages 15 to 44 have discussed dating or domestic violence with a provider in the past three years, demonstrating that these screenings are still relatively rare.37 (See CDC compilation of IPV screening tools: http://www.cdc.gov/ncipc/pub-res/images/ipvandsvscreening.pdf.) In addition, it is important to consider how to maintain confidentiality for women seeking violence-related care, particularly since more women will be covered by private insurance plans that typically send an Explanation of Benefits (EOB) that documents provided services to the principal policy holder, such as a spouse. There also remains the need to raise awareness among providers and women at risk for and living with HIV about the interrelatedness between HIV and intimate partner violence.
Finally, as states make different decisions about ACA implementation, coverage opportunities for enrollees vary across the nation. For example, whether states with state based marketplaces decided to implement the SEP for victims of IPV discussed above is one example. More generally, whether a state decides to expand its Medicaid program to all those below 138% of the Federal Poverty Level (currently 28 states are expanding while 23 are not), as permitted under the ACA, has significant implications for access to coverage for low income individuals. Given that multiple studies have demonstrated that incidence of HIV and IPV both trend with poverty, access to Medicaid expansion, including the associated IPV screening, could play a particularly important role for these populations.38 In addition, access to services, varies by coverage and as noted, IPV screening is not a required covered service for those in traditional Medicaid.
While certain implementation challenges exist, the ACA protections discussed above could present significant opportunities to address IPV, for both women living with HIV as well as those at risk.
Endnotes
Matthew J. Breiding, Jieru Chen, and Michele C. Black. National Center for Injury Prevention and Control, Centers for Disease Control and Prevention. The National Intimate Partner and Sexual Violence Survey: Intimate Partner Violence in the United States — 2010. Atlanta, GA, 2014. http://www.cdc.gov/violenceprevention/pdf/cdc_nisvs_ipv_report_2013_v17_single_a.pdf↩︎
E. L. Machtinger, T. C. Wilson, J. E. Haberer, and D. S. Weiss. “Psychological Trauma and PTSD in HIV-Positive Women: A Meta-Analysis.” AIDS and Behavior. 16:8 (2012): 2091-2100. ↩︎
The terms intimate partner violence (IPV) and domestic violence (DV) are often used interchangeably. While the term IPV is used throughout this issue brief for consistency, the individual statutes and policies cited may have originally employed the term DV. ↩︎
Reed A.C. Siemieniuk, et al. “The Clinical Implications of High Rates of Intimate Partner Violence Against HIV-Positive Women.” JAIDS: Journal of Acquired Immune Deficiency Syndromes. 64:1(2013):32-38. ↩︎
E. L. Machtinger, J. E. Haberer, T. C. Wilson, and D. S. Weiss. “Recent Trauma is Associated with Antiretroviral Failure and HIV Transmission Risk Behavior Among HIV-Positive Women and Female-Identified Transgenders.” AIDS and Behavior. 16:8(2012): 2160–2170. ↩︎
Andrea Carlson Gielen, Karen A. McDonnell, Jessica G. Burke, and Patricia O’Campo. “Women’s Lives After an HIV-Positive Diagnosis: Disclosure and Violence.” Maternal and Child Health Journal. 4:2(2000):111-119. ↩︎
Linda E. Saltzman, Janet L. Fanslow, Pamela M. McMahon, and Gene A. Shelley. National Center for Injury Prevention and Control, Centers for Disease Control and Prevention. “Intimate Partner Violence Surveillance: Uniform definitions and recommended data elements,” version 1.0, 2nd printing. Atlanta, GA, 2002. http://www.cdc.gov/ncipc/pub-res/ipv_surveillance/Intimate%20Partner%20Violence.pdf. ↩︎
Linda E. Saltzman, Janet L. Fanslow, Pamela M. McMahon, and Gene A. Shelley. National Center for Injury Prevention and Control, Centers for Disease Control and Prevention, “Intimate Partner Violence Surveillance: Uniform definitions and recommended data elements,” version 1.0, 2nd printing. Atlanta, GA, 2002. http://www.cdc.gov/ncipc/pub-res/ipv_surveillance/Intimate%20Partner%20Violence.pdf. ↩︎
Matthew J. Breiding, Jieru Chen, and Michele C. Black. National Center for Injury Prevention and Control, Centers for Disease Control and Prevention. The National Intimate Partner and Sexual Violence Survey: Intimate Partner Violence in the United States — 2010. Atlanta, GA, 2014. http://www.cdc.gov/violenceprevention/pdf/cdc_nisvs_ipv_report_2013_v17_single_a.pdf↩︎
Among men overall, it is estimated that 23% have experienced sexual violence other than rape during their lifetimes. These rates are higher among gay and bisexual men, for whom lifetime prevalence of sexual violence other than rape was reported to be 40% and 47%, respectively. In another recent study 18% of gay and bisexual men reported having experienced forced-sex at some point in their lifetimes. With men too, the experience of HIV and IPV appear to be intertwined. Twelve percent of HIV positive men who reported having sex with men in one nationally representative study also reported experiencing violence by a partner or someone close to them since their diagnosis, with nearly half believing that the violence was related to their HIV status. (Sources: Matthew J. Breiding, et al. Centers for Disease Control and Prevention. Prevalence and Characteristics of Sexual Violence, Stalking, and Intimate Partner Violence Victimization — National Intimate Partner and Sexual Violence Survey, United States, 2011. Morbidity and Mortality Weekly Report. 63:SS08 (2014), 1-18.; Mikel L. Walters, Jieru Chen, and Matthew J. Breiding. National Center for Injury Prevention and Control, Centers for Disease Control and Prevention. The National Intimate Partner and Sexual Violence Survey (NISVS): 2010 Findings on Victimization by Sexual Orientation. Atlanta, GA, 2013.; Liz Hamel, et al. Kaiser Family Foundation. “HIV/AIDS In The Lives Of Gay And Bisexual Men In The United States,” 2014.; Sally Zierler, et al. “Violence Victimization After HIV Infection in a U.S. Probability Sample of Adult Patients in Primary Care.” American Journal of Public Health. 90:2(2000): 208-215.)
↩︎
Matthew J. Breiding, et al. Centers for Disease Control and Prevention (CDC). Prevalence and Characteristics of Sexual Violence, Stalking, and Intimate Partner Violence Victimization — National Intimate Partner and Sexual Violence Survey, United States, 2011. Morbidity and Mortality Weekly Report. 63:SS08 (2014), 1-18. http://www.cdc.gov/mmwr/preview/mmwrhtml/ss6308a1.htm↩︎
Matthew J. Breiding, Jieru Chen, and Michele C. Black. National Center for Injury Prevention and Control, Centers for Disease Control and Prevention. The National Intimate Partner and Sexual Violence Survey: Intimate Partner Violence in the United States — 2010. Atlanta, GA, 2014. http://www.cdc.gov/violenceprevention/pdf/cdc_nisvs_ipv_report_2013_v17_single_a.pdf↩︎
E. L. Machtinger, T. C. Wilson, J. E. Haberer, and D. S. Weiss. “Psychological Trauma and PTSD in HIV-Positive Women: A Meta-Analysis.” AIDS and Behavior. 16:8(2012): 2091-2100. ↩︎
Reed A. C. Siemieniuk, et al. “The Clinical Implications of High Rates of Intimate Partner Violence Against HIV-Positive Women.” JAIDS: Journal of Acquired Immune Deficiency Syndromes. 64:1(2013): 32-38. ↩︎
E. L. Machtinger, J. E. Haberer, T. C. Wilson, and D. S. Weiss. “Recent Trauma is Associated with Antiretroviral Failure and HIV Transmission Risk Behavior Among HIV-Positive Women and Female-Identified Transgenders.” AIDS and Behavior. 16:8(2012): 2160–2170. ↩︎
Sally Zierler, et al. “Violence Victimization After HIV Infection in a U.S. Probability Sample of Adult Patients in Primary Care.” American Journal of Public Health. 90:2(2000): 208-215. ↩︎
E. L. Machtinger, T. C. Wilson, J. E. Haberer, and D. S. Weiss. “Psychological Trauma and PTSD in HIV-Positive Women: A Meta-Analysis.” AIDS and Behavior. 16:8(2012): 2091-2100. ↩︎
Kirsten Beronio, Rosa Po, Laura Skopec, and Sherry Glied. Office of the Assistant Secretary for Planning and Evaluation (ASPE). U.S. Department of Health and Human Services. ASPE Issue Brief: Affordable Care Act Expands Mental Health and Substance Use Disorder Benefits and Federal Parity Protections for 62 Million Americans. February 20, 2013. Available at http://aspe.hhs.gov/health/reports/2013/mental/rb_mental.cfm. ↩︎
Mayumi Okuda, et al. “Mental Health of Victims of Intimate Partner Violence: Results From a National Epidemiologic Survey.” Psychiatric Services. 62:8 (2011),959-62. ↩︎
Gina Dillon, Rafat Hussain, Deborah Loxton, and Saifur Rahman. “Mental and Physical Health and Intimate Partner Violence Against Women: A Review of the Literature.” International Journal of Family Medicine, vol.2013 (2013). ↩︎
E. L. Machtinger, T. C. Wilson, J. E. Haberer, and D. S. Weiss. “Psychological trauma and PTSD in HIV-Positive women: A Meta-Analysis.” AIDS and Behavior. 16:8(2012): 2091-2100. ↩︎
E.G. Bing, et al. “Psychiatric Disorders and Drug Use Among Human Immunodeficiency Virus-Infected Adults in the United States.” Archives of General Psychiatry. 58:8(2001),721-8. http://archpsyc.ama-assn.org/cgi/content/full/58/8/721↩︎
Allison R. Webel, et al. “The Impact of Social Context on Self-Management in Women Living with HIV.” Social Science & Medicine. 87 (2013): 147–154. ↩︎
In his latestcolumn forThe Wall Street Journal’s Think Tank, Drew Altman releases new Foundation polling data on the public’s confidence in the Centers for Disease Control and Prevention (CDC) and local health authorities amid the response to Ebola in the U.S. Taken over the weekend, the latest poll finds a majority continues to express confidence in the CDC to handle the Ebola response, though it has fallen with criticism of the response and news about a second nurse being diagnosed with the disease.
All previous columns by Drew Altman are availableonline.
The October Kaiser Health Tracking Poll found that majorities of the public – including at least 6 in 10 Republicans, Democrats, and independents – said that if a case of Ebola were diagnosed in their area, they would have a “great deal” or a “fair amount” of confidence in state, local, and federal health authorities to contain the disease and prevent it from spreading. In that poll, a somewhat larger share expressed confidence in the U.S. Centers for Disease Control and Prevention, or CDC (73 percent) than in their local hospitals (64 percent) and state or local health departments (62 percent). The tracking poll was in the field October 8-14, during which time it was revealed that a nurse in Dallas contracted Ebola from the first U.S. patient to be treated there. The survey came out of the field before the October 15 announcement that a second nurse had been diagnosed, and before widespread news coverage of the fact that the CDC had cleared the second nurse to fly on a commercial airline flight. Given the evolving news story, we re-surveyed the public from October 17-19 to determine whether confidence in health authorities to prevent the spread of Ebola has changed in light of more recent developments.
The more recent poll finds that confidence in the CDC fell, from 73 percent who expressed at least a “fair amount” of confidence in the earlier poll to 62 percent in the later poll. The survey also indicates that the issue of Ebola may be increasingly viewed through a political lens, as the drop in confidence was most pronounced among Republicans (from 70 percent to 50 percent), though there was also a more modest but statistically significant decrease among Democrats (from 79 percent to 70 percent). Levels of confidence in local hospitals and state and local health departments remained similar across the two polls, though the share of Republicans expressing confidence in their local hospitals also decreased somewhat between the first poll and the second (from 64 percent to 52 percent). The U.S. Ebola news story is likely to continue to evolve in the coming weeks and months, and we will continue to measure the public’s views on the issue in future tracking polls.
TABLE: Confidence In Health Authorities To Prevent Spread Of Ebola, Oct. 8-14 vs. Oct. 17-19
TOTAL
REPUBLICANS
INDEPENDENTS
DEMOCRATS
If a case of Ebola were diagnosed in your area, how much confidence would you have in each of the following to contain the disease and prevent it from spreading? (Percent who say they would have “a great deal” or “a fair amount” of confidence in each)
The U.S. Centers for Disease Control and Prevention, or CDC
Oct. 8-14
73%
70%
72%
79%
Oct. 17-19
62%
50%
65%
70%
Change (percentage points)
-11*
-20*
-7
-9*
Your local hospitals
Oct. 8-14
64%
64%
60%
69%
Oct. 17-19
62%
52%
63%
71%
Change (percentage points)
-2
-12*
+3
+2
Your state or local health department
Oct. 8-14
62%
61%
61%
67%
Oct. 17-19
58%
53%
56%
63%
Change (percentage points)
-4
-8
-5
-4
* indicates a statistically significant difference between Oct. 8-14 poll and Oct. 17-19 poll.
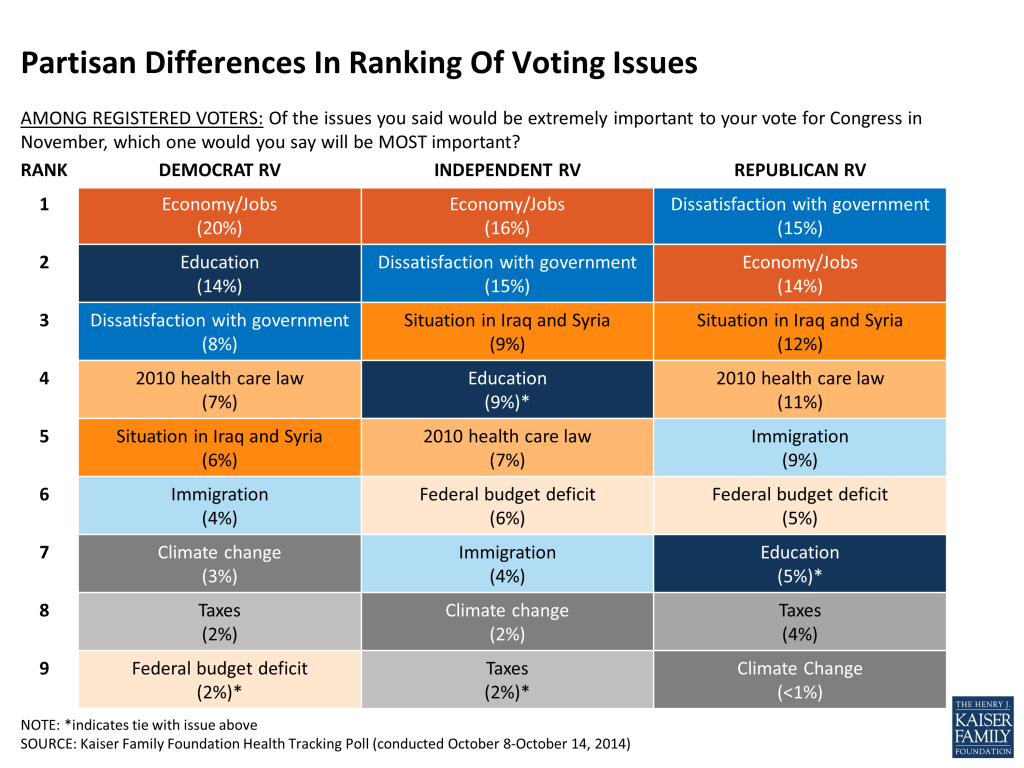
In the final Kaiser Health Tracking Poll before the 2014 midterm elections in November, the Affordable Care Act (ACA) continues to be just one of several issues on voters’ minds. Less than 1 in 10 registered voters (8 percent) identify the ACA as the most important issue to their vote, ranking 5th behind the economy (16 percent), dissatisfaction with government (12 percent), education (10 percent) and the situation in Iraq and Syria (9 percent). The ACA ranks 4th for Democrats, Republicans, and independents alike. Just over half of voters say they’re tired of hearing Congressional candidates talk about the ACA and wish they would move on to other issues, while 44 percent say they want candidates to continue the discussion. Meanwhile, as campaigns make their final appeal to voters, 6 in 10 report seeing political advertising related to the ACA, with more saying they have seen mostly negative advertising about the ACA rather than mostly positive.
On the heels of the election is the start of the ACA’s second open enrollment period on November 15th, and, at this point, one key target – the uninsured – are not yet tuned in. About 9 in 10 of the uninsured are unaware of when the next open enrollment period begins. More specifically, two thirds of the uninsured say they know “only a little” or “nothing at all” about the marketplaces where people can shop for insurance and just over half are unaware of financial assistance available to help low- and moderate-income people purchase insurance. Among the general public more broadly, views on the ACA remain similar to past months with more expressing unfavorable views of the law than favorable and more wanting Congress to work to improve the law rather than repeal it.
Registered Voters’ Views Of The ACA In The Election
ACA Is One Of Many Issues Important To Voters
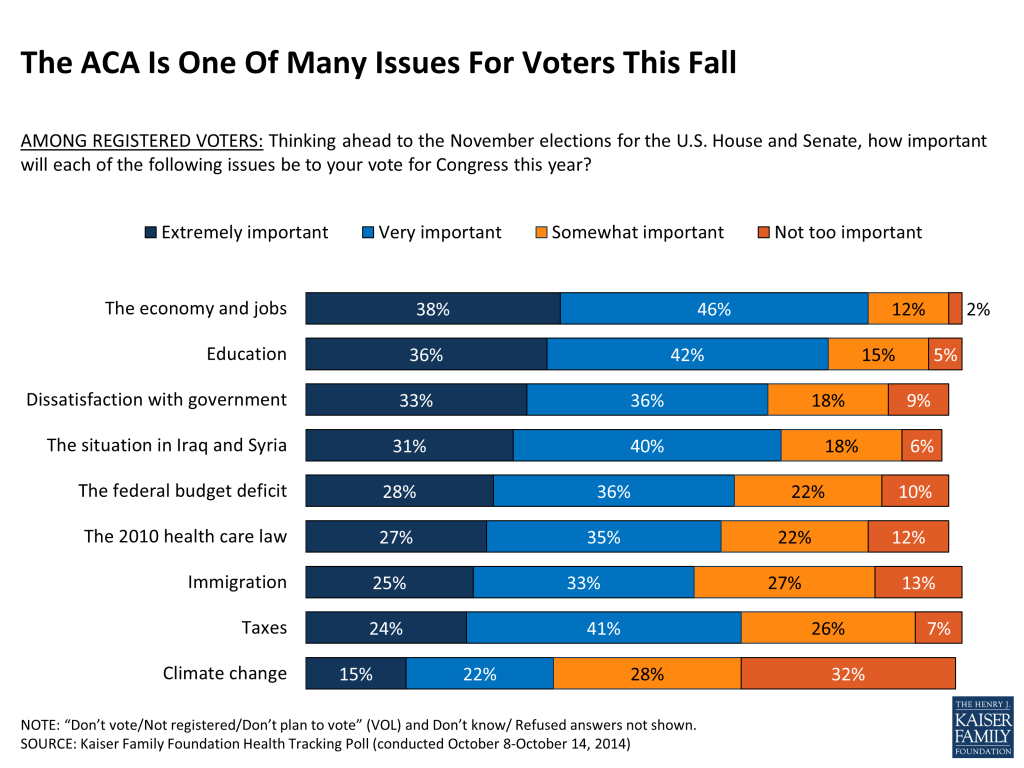
With the 2014 midterm election less than one month away, the latest Kaiser Health Tracking Poll finds the ACA continues to be a second-tier issue on voters’ minds, and many say they are tired of hearing candidates talk about the law. Just over a quarter (27 percent) of registered voters say the health care law will be an “extremely important” issue in their vote and about another third (35 percent) say it will be “very important”. But when asked to choose the MOST important issue, just 8 percent pick health care, ranking behind the economy (16 percent) and dissatisfaction with government (12 percent) and similar to other issues like education (10 percent), the situation in Iraq and Syria (9 percent), and immigration (6 percent). Additionally, 29 percent of voters do not say that any of these issues are extremely important to their vote, perhaps because no one issue outshines another or they consider other factors more important to their vote such as the personal characteristics of the candidates.
Figure 1
Across party lines, the ACA ranks 4th as voters’ most important issue for Democrats, Republicans, and independents alike.
Figure 2
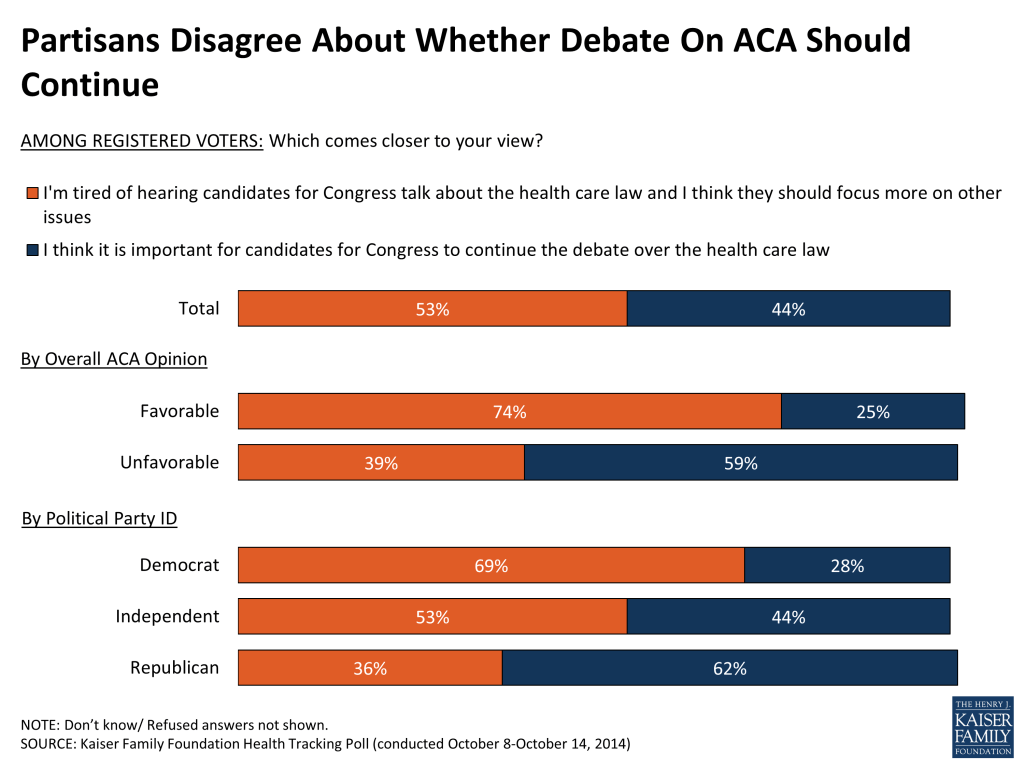
At this point in the election season, slightly more than half (53 percent) of registered voters say they are tired of hearing candidates for Congress talk about the health care law and would prefer they move on to other issues, while 44 percent say they feel it is important for Congressional candidates to continue debating the issue. About 7 in 10 of Democratic voters and voters with a favorable view of the law say they would like candidates to move on, while about 6 in 10 of Republican voters and voters with an unfavorable view of the law say they think it is important for the debate about the law to continue. Independent voters are in the middle, but tilt toward wanting candidates to move on to other issues.
Figure 3
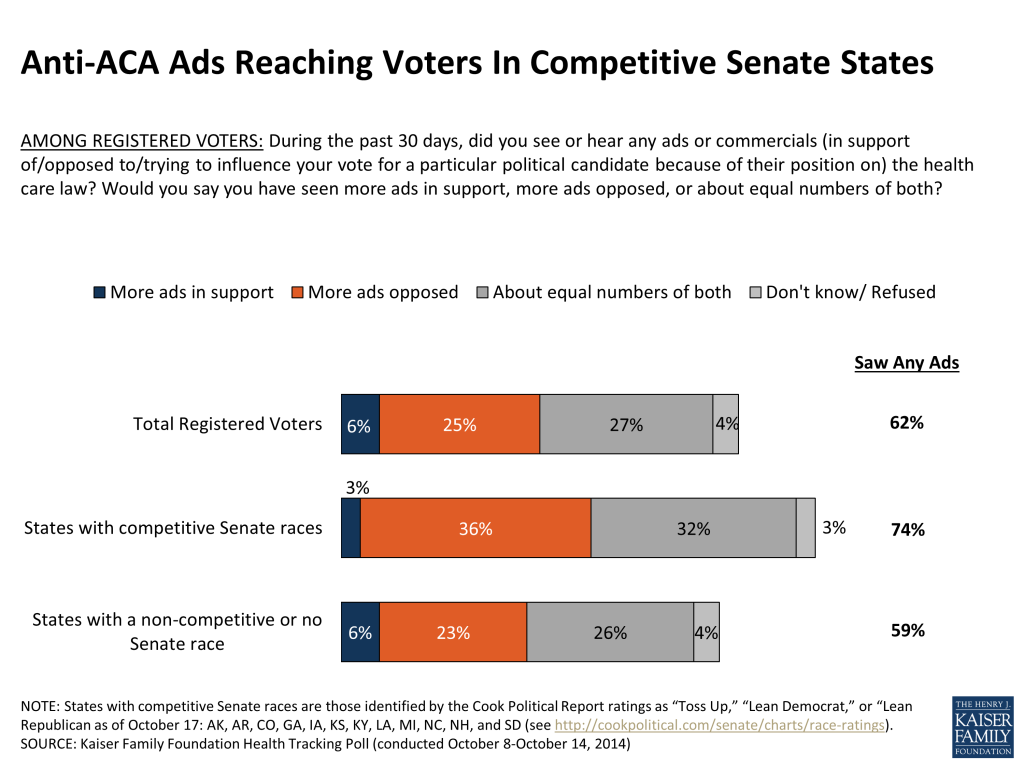
With the midterm elections and the second open enrollment period quickly approaching in November, substantial shares of voters report seeing ads or commercials about the health care law. About 6 in 10 voters (62 percent) say they’ve seen ads in the last 30 days that were opposed to the law, in support of the law, or were trying to influence their vote for a political candidate based on their stance on the law. A larger share of voters report seeing more ads opposed to the law than ads in support of it (25 percent versus 6 percent), although 27 percent say they have seen about an equal number of both and about four in ten (39 percent) say they didn’t see any ads in support of, opposed to or trying to influence their vote. In states with competitive Senate races,1 the share of voters reporting that they have recently seen these ads increases to about three-quarters (74 percent), with over one-third (36 percent) saying more of the ads were negative compared to just 3 percent who said more of the ads were positive.
With open enrollment just around the bend, voters also report seeing advertising related to health insurance. Almost half of voters (45 percent) say they saw an ad from an insurance company about health insurance and a third of voters (33 percent) say that they have seen ads that provide information about how to get health insurance.
Figure 4
ACA-Related Views And Experiences As Open Enrollment Approaches
Nine In Ten Uninsured Unaware Of Start Of Upcoming Enrollment Period
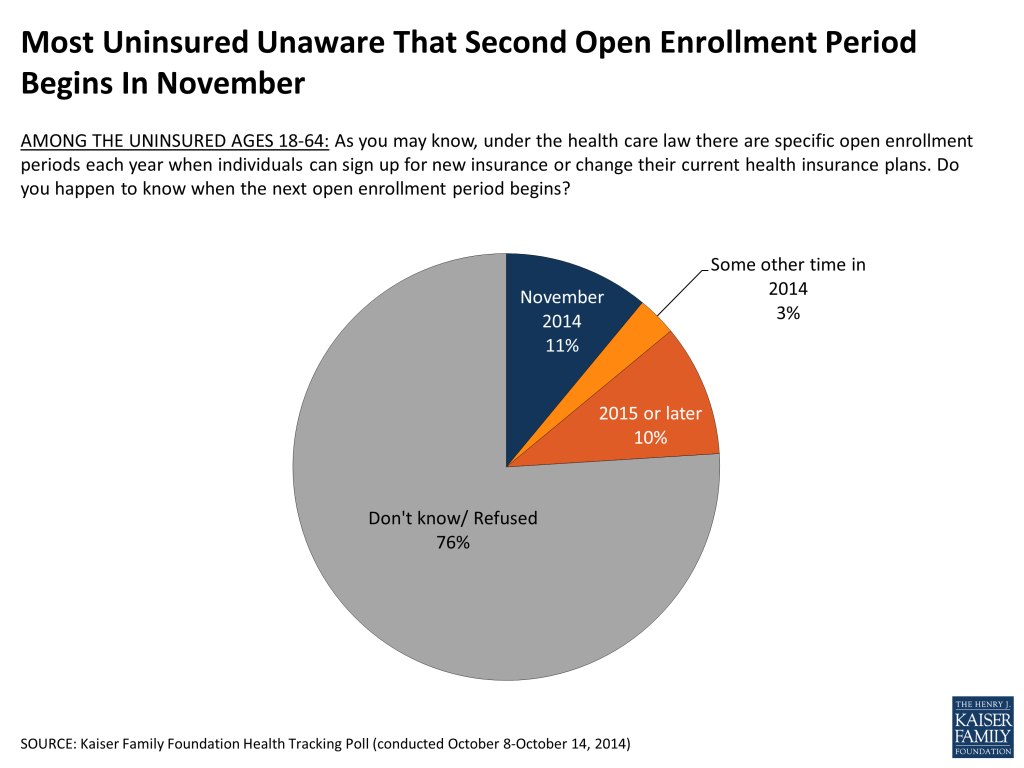
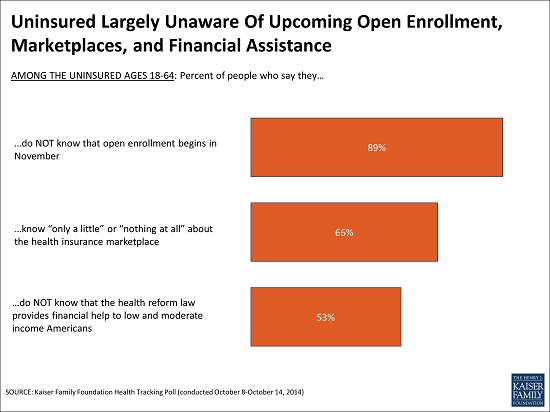
The start of the second open enrollment period under the Affordable Care Act on November 15 is less than a month away, and so far this has not yet come to the attention of one of the primary audiences for open enrollment: the uninsured. Nine in 10 (89 percent) of the uninsured are unaware of when the next open enrollment period begins, including 76 percent who say they don’t know and 13 percent who suggest a time other than November 2014.
Figure 5
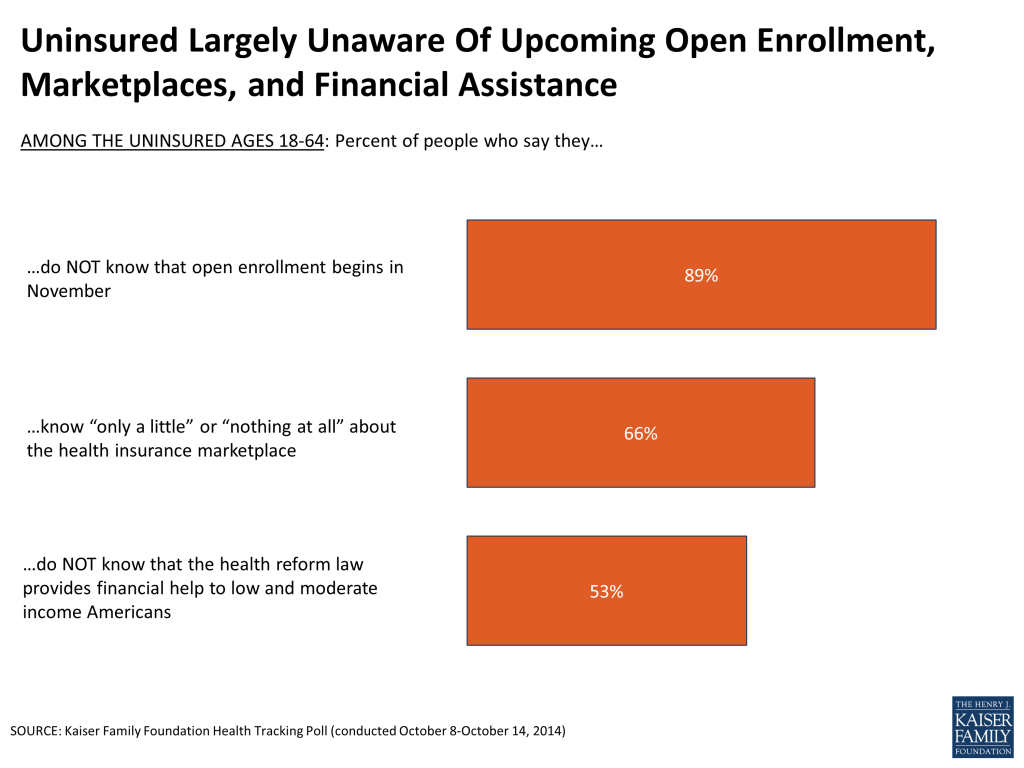
Two-thirds of the uninsured (66 percent) say they know “only a little” or “nothing at all” about the marketplaces where people who don’t get coverage through their employers can shop for insurance and just over half (53 percent) of the uninsured are unaware of the financial assistance available to help low- and moderate-income individuals purchase insurance.
Figure 6
Most Uninsured Plan On Getting Coverage Soon
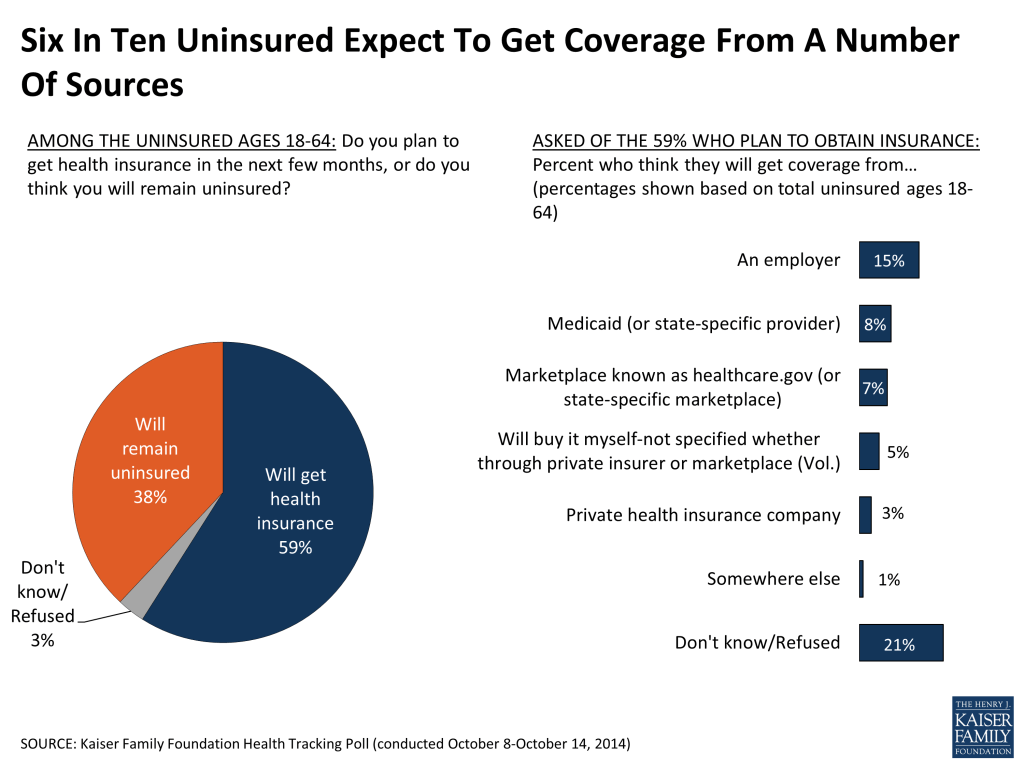
Although many uninsured are unaware about key features of the ACA that can improve their access to coverage, many say they intend to get coverage soon. Most (59 percent) say they will get covered in the next few months, including 15 percent who expect to get coverage from an employer, 15 percent who expect to purchase it themselves (either from a private insurance company or through a marketplace), and 8 percent who think they will get it from Medicaid. One in five (21 percent) say they expect to get coverage but are unsure where.
Figure 7
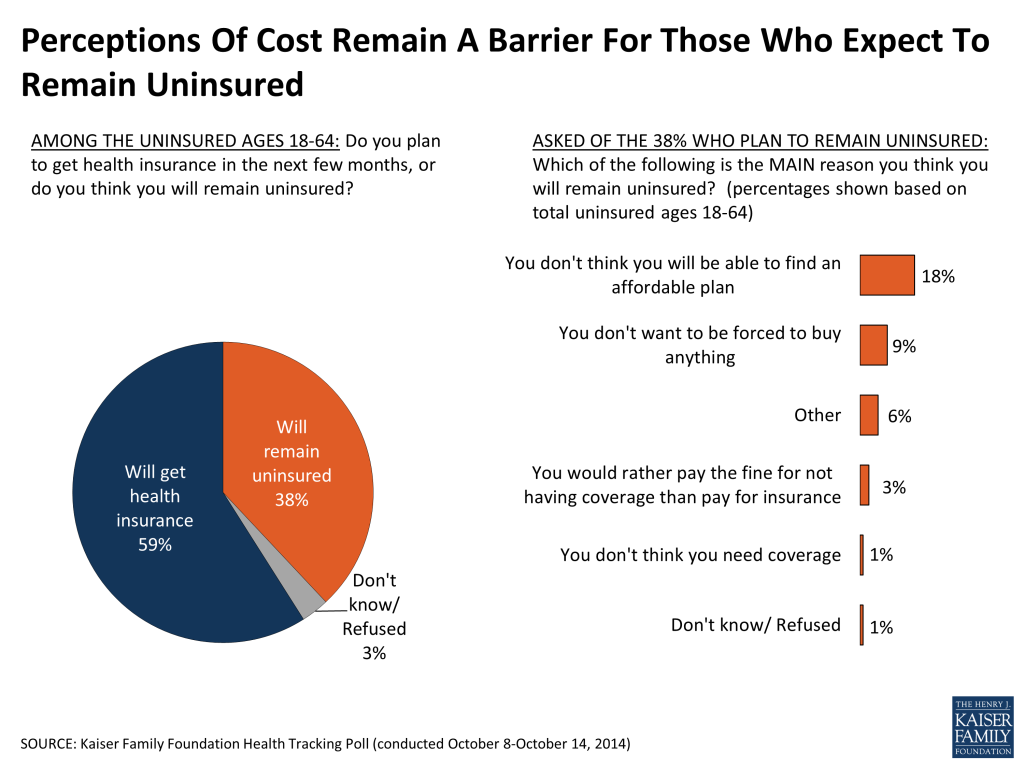
The 4 in 10 who expect to remain uninsured give a variety of reasons why they don’t think they will get coverage. Eighteen percent say they will remain uninsured because they don’t think they will be able to find an affordable plan (18 percent of the uninsured overall), while another 12 percent say they don’t think they will get insurance because they don’t want to be forced to buy anything (including 3 percent who say they would rather pay the fine than pay for coverage).
Figure 8
Who Are The Uninsured?
There are a variety of factors that make the uninsured a difficult group to reach and enroll in coverage. About 6 in 10 (63 percent) report family income of less than $30,000 a year and nearly half (46 percent) have been without health insurance for 2 years or more. In addition, a third (32 percent) identify as Hispanic and 17 percent opted to take the survey in Spanish.
A Check In On The Public’s Views Of The Law
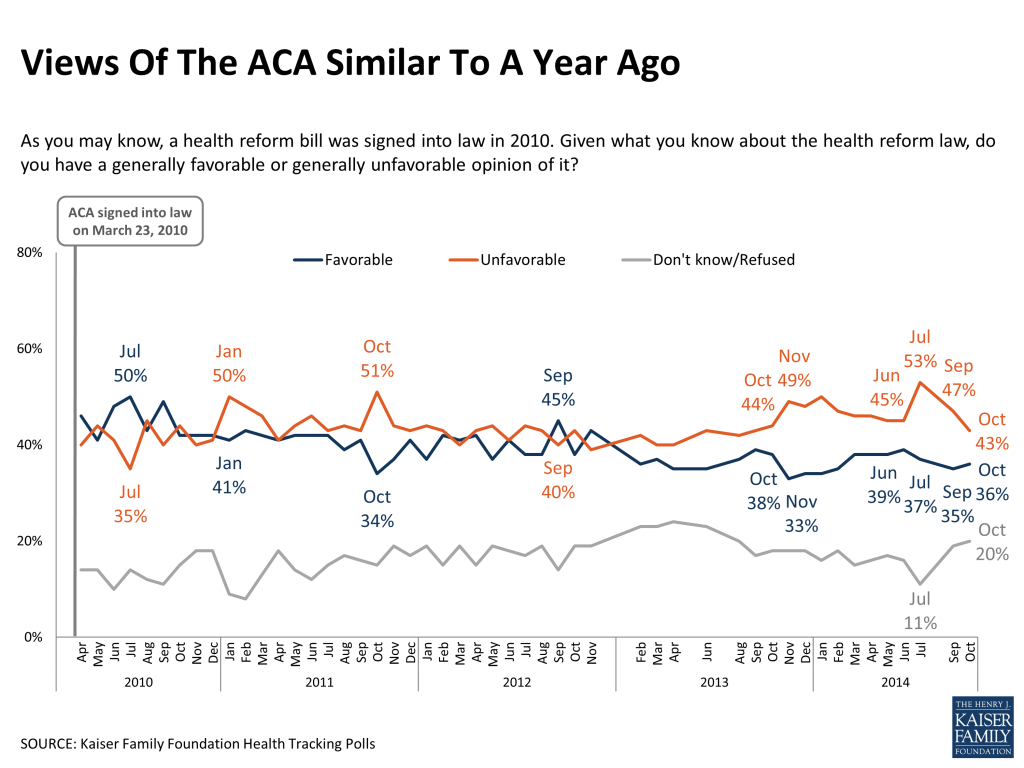
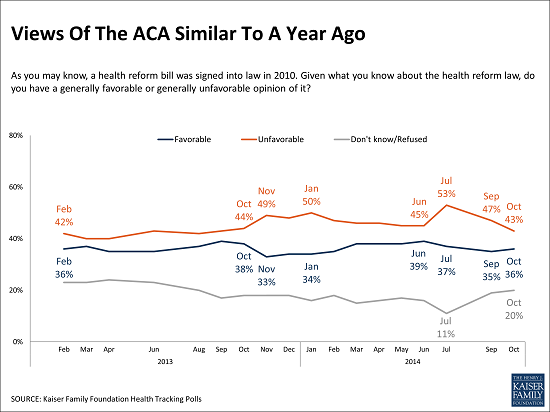
This month’s tracking poll finds few changes in the public’s views of the law. Negative views of the health care law continue to outweigh positive views (43 percent unfavorable, 36 percent favorable). The share expressing an unfavorable opinion had increased to 53 percent in July, but has now returned to levels reported at about this same time last year as the first open enrollment period began.
Figure 9
As has been true since the inception of the law, opinion is starkly divided along partisan lines, with three quarters of Republicans (77 percent) reporting an unfavorable opinion of the law and about six in ten Democrats (59 percent) reporting a favorable one.
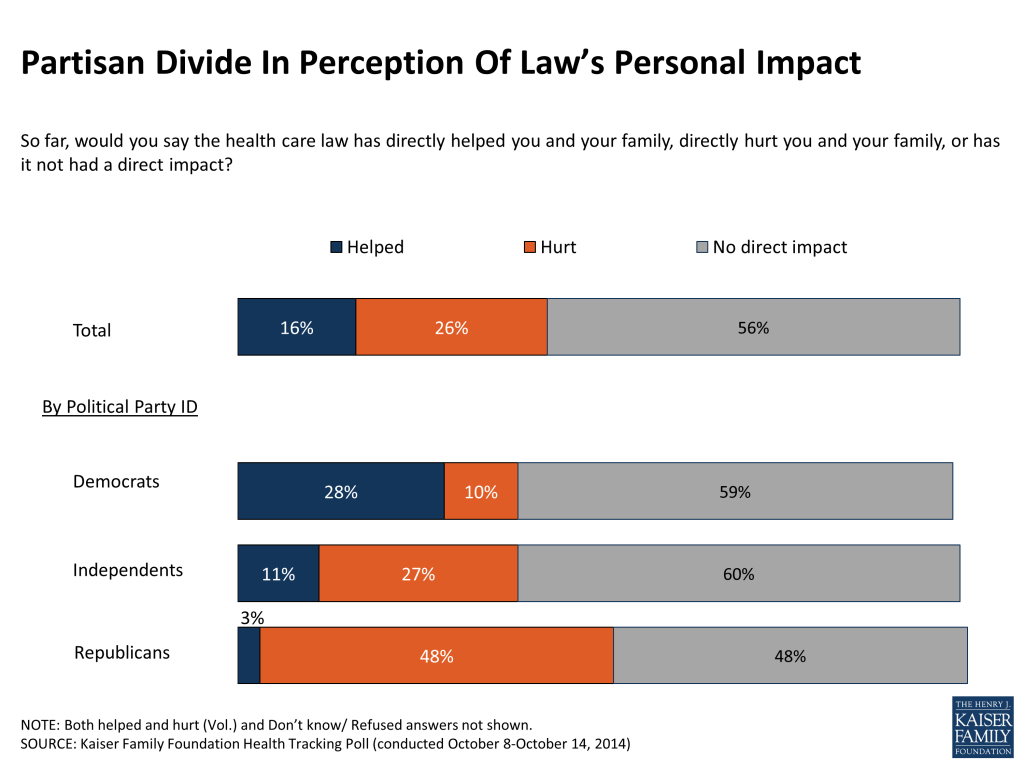
Most Americans (56 percent) say the health care law has had no direct impact on their families. For those who report being impacted, more say the law has hurt them (26 percent) than say it has helped them (16 percent). Perceived personal impact of the law also varies by political affiliation. Republicans are more likely to say they have been hurt by the law (48 percent), Democrats are more likely to say they have been helped (28 percent), and independents fall in the middle of the two, though more independents feel they have been hurt than helped.
Figure 10
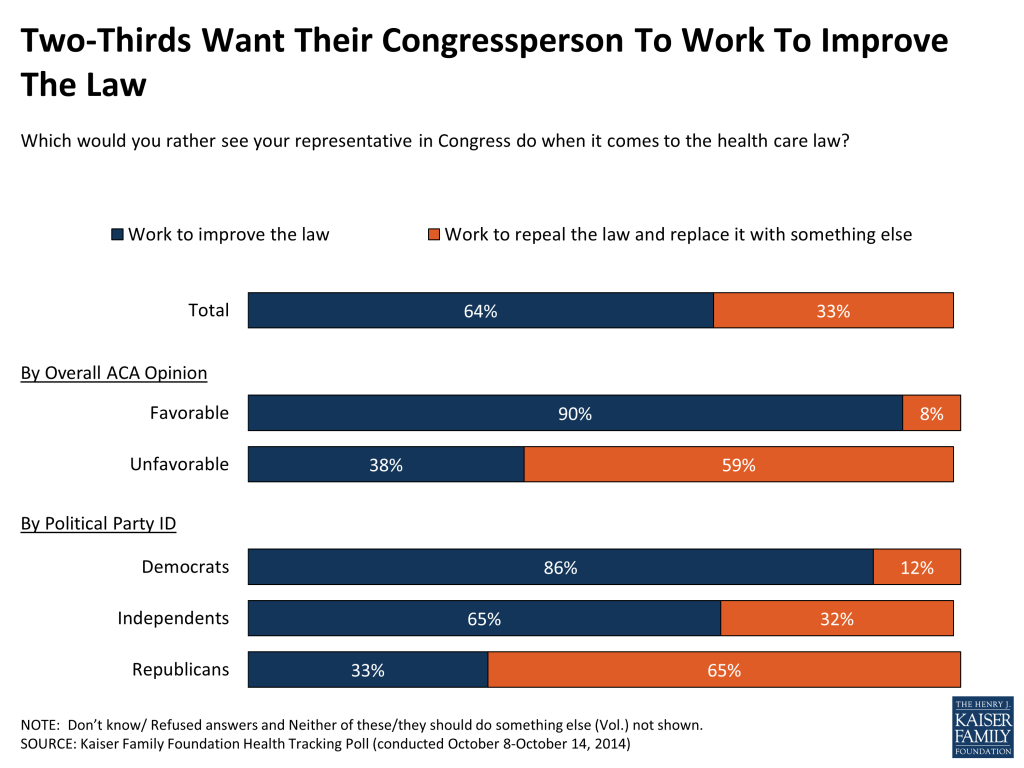
Despite the negative tilt in opinion towards the law overall, nearly two-thirds of the public (64 percent) would rather see their representative in Congress work to improve the law than repeal and replace it with something else (33 percent). A large majority of Democrats (86 percent) want their representative to work to improve the law while a majority of Republicans would rather see their representative work to repeal and replace it (65 percent). Still, sizeable shares of Republicans (33 percent) and those with an unfavorable view of the law (38 percent) say they would rather see their representative work to improve the law than work to repeal and replace it.
Figure 11
This Kaiser Health Tracking Poll was designed and analyzed by public opinion researchers at the Kaiser Family Foundation (KFF). The survey was conducted October 8-14, 2014, among a nationally representative random digit dial telephone sample of 1,503 adults ages 18 and older, living in the United States, including Alaska and Hawaii (note: persons without a telephone could not be included in the random selection process). Computer-assisted telephone interviews conducted by landline (751) and cell phone (752, including 411 who had no landline telephone) were carried out in English and Spanish by Princeton Data Source under the direction of Princeton Survey Research Associates International (PSRAI). Both the random digit dial landline and cell phone samples were provided by Survey Sampling International, LLC. For the landline sample, respondents were selected by asking for the youngest adult male or female currently at home based on a random rotation. If no one of that gender was available, interviewers asked to speak with the youngest adult of the opposite gender. For the cell phone sample, interviews were conducted with the adult who answered the phone. KFF paid for all costs associated with the survey.
The combined landline and cell phone sample was weighted to balance the sample demographics to match estimates for the national population using data from the Census Bureau’s 2012 American Community Survey (ACS) on sex, age, education, race, Hispanic origin, nativity (for Hispanics only), and region along with data from the 2010 Census on population density. The sample was also weighted to match current patterns of telephone use using data from the July-December 2013 National Health Interview Survey. The weight takes into account the fact that respondents with both a landline and cell phone have a higher probability of selection in the combined sample and also adjusts for the household size for the landline sample. All statistical tests of significance account for the effect of weighting.
The margin of sampling error including the design effect for the full sample is plus or minus 3 percentage points. Numbers of respondents and margin of sampling error for key subgroups are shown in the table below. For results based on other subgroups, the margin of sampling error may be higher. Sample sizes and margin of sampling errors for other subgroups are available by request. Note that sampling error is only one of many potential sources of error in this or any other public opinion poll.
Group
N (unweighted)
M.O.S.E.
Total
1,503
±3 percentage points
Party Identification
Democrats
509
±5 percentage points
Republicans
369
±6 percentage points
Independents
446
±5 percentage points
Race/Ethnicity
White
1064
±3 percentage points
Black
147
±9 percentage points
Hispanic
163
±8 percentage points
Education
High school graduate or less
479
±5 percentage points
Some college
415
±6 percentage points
College graduate or more
601
±5 percentage points
Gender
Men
738
±4 percentage points
Women
765
±4 percentage points
Insurance Status
Uninsured, ages 18-64
145
±9 percentage points
Insured, ages 18-64
910
±4 percentage points
Registered Voters (RV)
1,268
±3 percentage points
Party Identification (among RV)
Democrats
449
±5 percentage points
Republicans
346
±6 percentage points
Independents
360
±6 percentage points
Opinion of ACA (among RV)
Favorable opinion of the ACA
485
±5 percentage points
Unfavorable opinion of the ACA
591
±5 percentage points
Senate Races (among RV)
States with competitive senate races
219
±8 percentage points
States with a non-competitive or no Senate race
1,049
±4 percentage points
Endnotes
States with competitive Senate races are those identified by the Cook Political Report ratings as “Toss Up,” “Lean Democrat,” or “Lean Republican as of October 17: AK, AR, CO, GA, IA, KS, KY, LA, MI, NC, NH, and SD (see http://cookpolitical.com/senate/charts/race-ratings). ↩︎
Most of Those Without Health Coverage Report Knowing Little or Nothing About the Insurance Marketplaces or About the Financial Assistance Available to Low- and Moderate-Income Families
Broader Public Opinion on the Law Still Tilts Unfavorably, Though Gap Has Narrowed Since July and Returned to Pre-Rollout Levels
With the second annual open enrollment period under the Affordable Care Act set to begin Nov. 15, the latest Kaiser Family Foundation tracking poll finds major gaps in the awareness of the nation’s uninsured residents who are a primary target for enrollment and outreach efforts.
The survey finds nine in ten (89%) of the uninsured are unaware that open enrollment begins in November — including, 76 percent who say they do not know when open enrollment begins and another 13 percent who name a start date other than November 2014.
In addition, two-thirds of the uninsured say they know “only a little” or “nothing at all” about the marketplaces where people who don’t get coverage through their employers can shop for insurance and just over half (53 percent) of the uninsured are unaware of the financial assistance available to help low- and moderate-income individuals purchase insurance.
In spite of the significant gaps in awareness about open enrollment, most (59%) of the uninsured say they will get covered in the next few months, including 15 percent who expect to get coverage from an employer, 15 percent who expect to purchase it themselves (either from a private insurance company or through a marketplace), and 8 percent who expect to get it through Medicaid. One in five (21%) say they expect to get coverage but are unsure where.
Most of those who expect to remain uninsured say it is because they think they will not be able to find an affordable plan (18% of the uninsured overall) or they don’t want to be forced to buy anything (12%, including 3% who say they would rather pay the fine than pay for coverage).
This month’s tracking poll also finds few changes in the public’s broader views of the ACA, with more people continuing to view it unfavorably (43%) than favorably (36%). The gap, though, has shrunk since July, when unfavorable views rose to 53%, and public opinion now has returned to about the levels it was last year at this time as the first open enrollment period began.
At the same time, nearly two-thirds of the public (64%) would rather see their representative in Congress work to improve the law than repeal and replace it with something else (33%). A large majority of Democrats (86%) want their representative to work to improve the law while a majority of Republicans want their representative to work to repeal and replace it (65%).
Most Americans (56%) say the health care law has had no direct impact on their families. For those who report an impact, more say the law has hurt them (26%) than say it has helped them (16%). Republicans are more likely to say they have been hurt by the law (48%), Democrats are more likely to say they have been helped (28%), and independents fall in the middle, though more independents feel they have been hurt than helped
Among registered voters, the ACA does not stand out as a top issue for the midterm elections. While more than a quarter (27%) say the health care law will be “extremely” important to their vote, just 8 percent choose it as the MOST important issue, behind the economy (16%) and dissatisfaction with government (12%), and a similar level as education (10%), the situation in Iraq and Syria (9%) and immigration (6%).
Across party lines, the ACA ranks fourth as voters’ most important issue for Democrats, Republicans, and independents alike.
METHODOLOGY
The latest tracking poll was designed and analyzed by public opinion researchers at the Kaiser Family Foundation and was conducted from October 8-14, 2014 among a nationally representative random digit dial telephone sample of 1,503 adults ages 18 and older. Interviews were conducted in English and Spanish by landline (751) and cell phone (752). The margin of sampling error is plus or minus 3 percentage points for the full sample and plus or minus 9 percentage points for the uninsured. For results based on subgroups, the margin of sampling error may be higher.