KFF designs, conducts and analyzes original public opinion and survey research on Americans’ attitudes, knowledge, and experiences with the health care system to help amplify the public’s voice in major national debates.
In his first 2015 column for The Wall Street Journal’s Think Tank, Drew Altman explains why this year, status quo for the Affordable Care Act is not an option and how the Supreme Court rules in King v. Burwell will determine its path.
All previous columns by Drew Altman are available online.
In an article in Health Affairs, Gretchen A. Jacobson and Patricia Neuman of the Kaiser Family Foundation and independent consultant Anthony Damico examined whether the 2006-2011 growth in private Medicare Advantage plans was due primarily to new beneficiaries choosing Medicare Advantage from the onset of their eligibility, or because beneficiaries enrolled in traditional Medicare were making a switch. Their study finds that a majority of new enrollees in Medicare Advantage in each year were seniors switching from traditional Medicare. Less than one-quarter of people newly eligible for Medicare enrolled in Medicare Advantage from the outset, and they comprised less than half of all new Medicare Advantage enrollees each year between 2006 and 2011. Seniors in their first few years on Medicare (in their late sixties) switched from traditional Medicare to Medicare Advantage at higher rates than other beneficiaries. People dually eligible for Medicare and Medicaid (“dual eligibles”) and Medicare beneficiaries under age 65 and disabled disenrolled from Medicare Advantage at higher than average rates, a trend worth exploring because these beneficiaries tend to have significant health care needs. Nonetheless, the study, published today in the journal Health Affairs, also finds that the share of seniors who switch between traditional Medicare and Medicare Advantage is relatively small, reinforcing the notion that most Medicare beneficiaries make a coverage choice and stick with it.
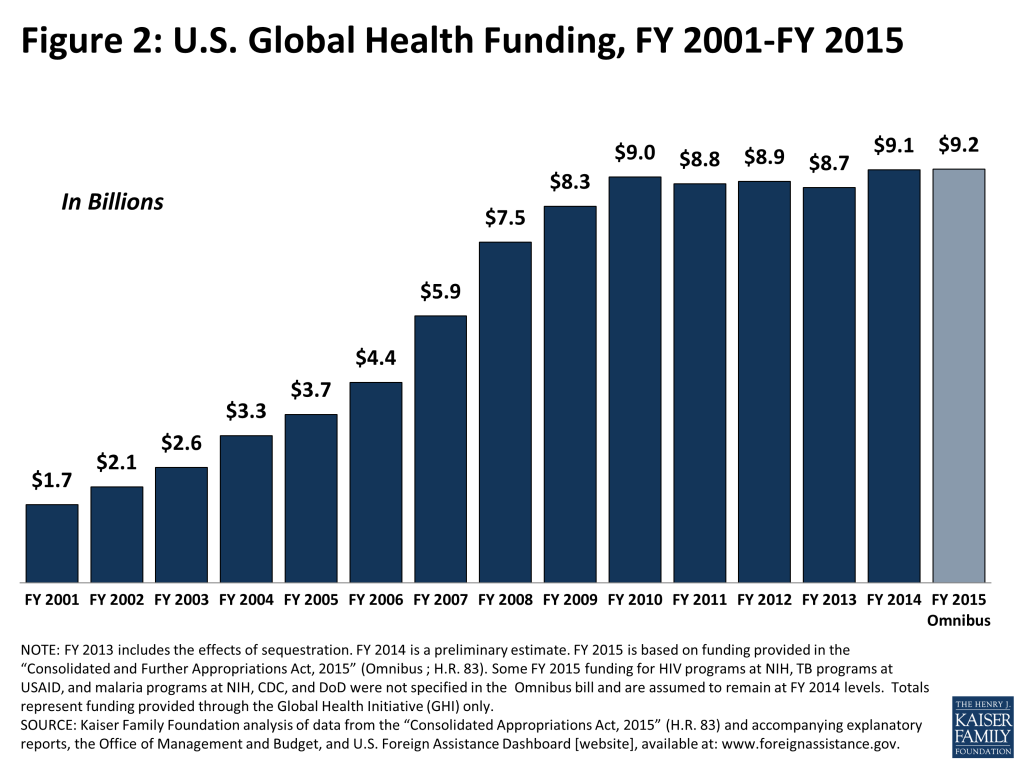
The FY15 Omnibus Appropriations Act contains $5.4 billion in emergency funding to address the Ebola crisis – a significant increase in total U.S. support for global health. Aside from the additional funding for Ebola, global health funding remained essentially flat at $9.2 billion, according to a new Kaiser Family Foundation funding analysis.
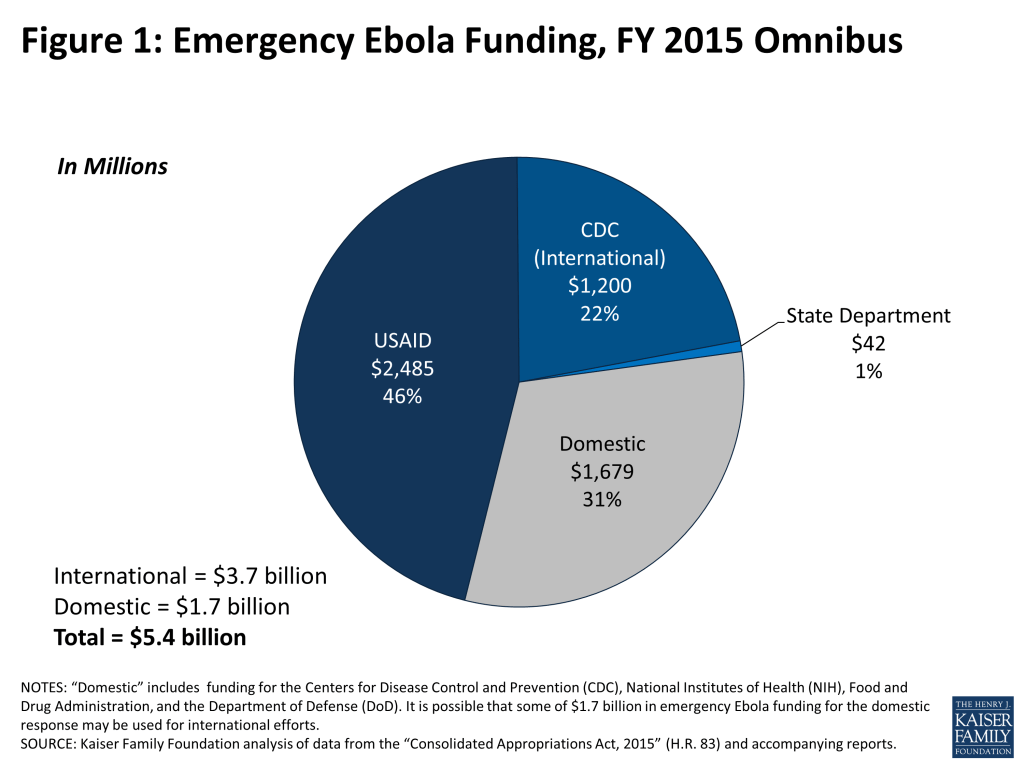
Of the total emergency funding to respond to Ebola, which is outside the budget caps for discretionary spending, $3.7 billion is specifically for international efforts. The majority is provided to the U.S. Agency for International Development (USAID), followed by the Centers for Disease Control and Prevention (CDC) and the State Department. The largest share of the $1.7 billion in domestic funding for Ebola response is provided to the Assistant Secretary for Preparedness and Response at the Department of Health and Human Services (HHS), followed by the CDC.
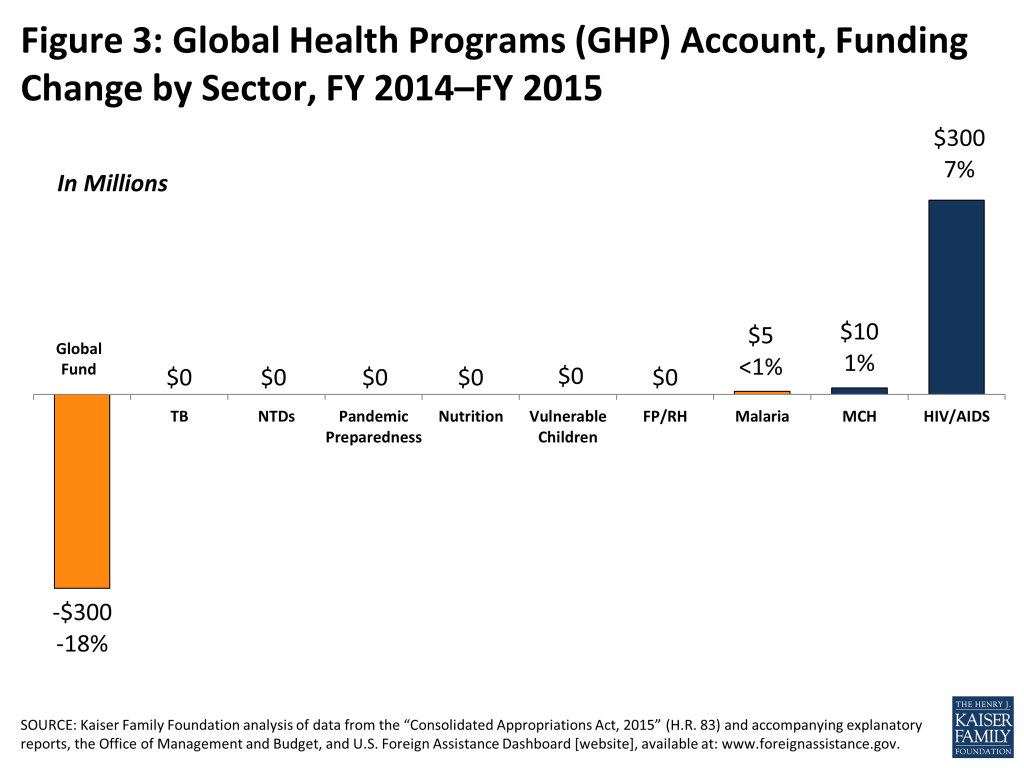
Within the largest global health account for ongoing global health programs (covering $8.2 billion of the total), most programs received approximately the same funding levels as they did in FY14. However, bilateral HIV funding increased by $300 million and the U.S. contribution to the Global Fund to Fight AIDS, Tuberculosis and Malaria decreased by the same amount.
The FY15 Omnibus Appropriations bill,1 which was signed into law by the President on December 16, 2014, includes $5.4 billion in emergency funding to address the Ebola crisis, of which $3.7 billion is specifically designated for international efforts (Table 1 and Figure 1). It also provides approximately $9.2 billion in specified funding for ongoing U.S. global health programs. The Ebola funding was provided by Congress in response to an emergency request made by the President in November and represents a significant increase in total U.S. support for global health, although as an emergency funding measure, it does not count toward existing budget caps on discretionary spending.
Figure 1: Emergency Ebola Funding, FY 2015 Omnibus
In addition to the emergency funding for Ebola, funding for current global health programs increased slightly from FY 2014 levels despite a decrease in base funding for international affairs (see Figure 1).2 This has been part of a longer trend, with global health rising as a share of the international affairs budget (base funding) from 19% in FY12 to 21% in FY15 (see Table 2).3
Figure 2: U.S. Global Health Funding, FY 2001-FY 2015
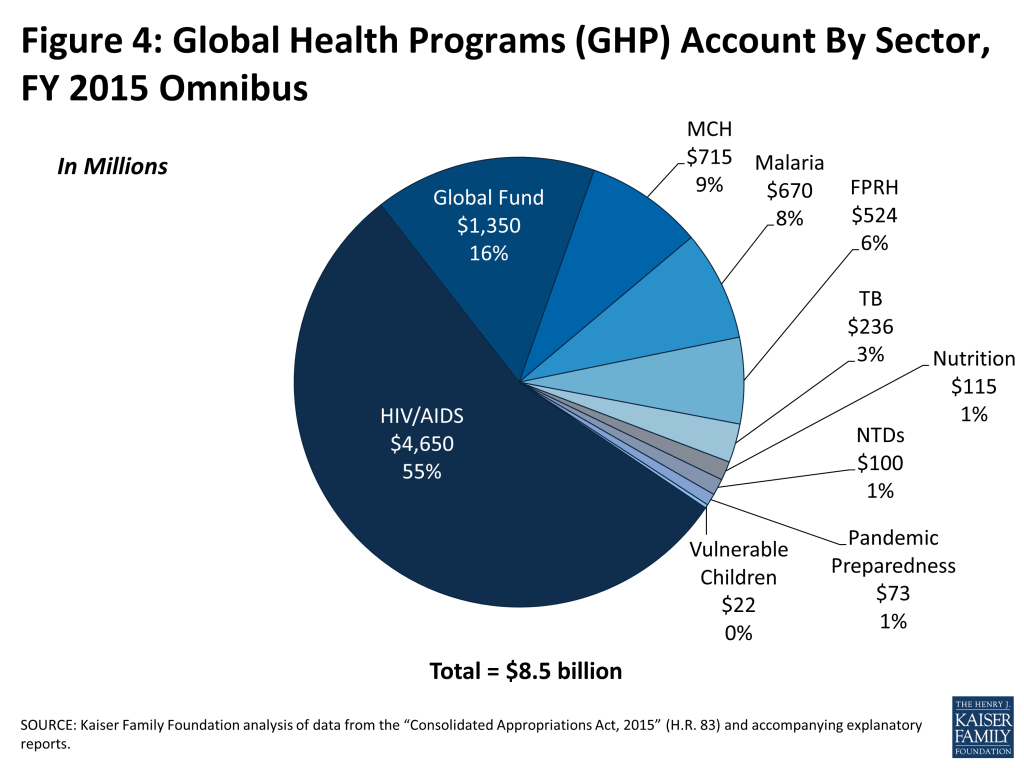
Most of the global health budget ($8.2 billion) specified in the FY15 Omnibus is provided through the Global Health Programs (GHP) account at the U.S. Agency for International Development (USAID) and at the State Department (Table 3). Within the GHP account, most programs remained at or near FY14 levels, with the exception of bilateral funding for HIV, which increased by $300 million, and support for the Global Fund to Fight AIDS, Tuberculosis and Malaria (Global Fund), which decreased by the same amount (see Figure 2). Funding for malaria and maternal and child health (MCH) each increased slightly (by approximately 1%).
Figure 3: Global Health Programs (GHP) Account, Funding Change by Sector, FY 2014–FY 2015
The summary below provides an overview of the emergency Ebola funding as well as funding for ongoing global health programs as specified in the FY15 Omnibus bill (unless otherwise stated, all comparisons are to enacted FY14 levels).
Emergency Ebola Funding
In addition to the $9.2 billion in known funding for ongoing global health programs, Congress provided $5.4 billion in emergency funding for Ebola (see Table 1) in the FY15 Omnibus.4 Of the $5.4 billion, approximately $3.7 billion is designated for international efforts “to prevent, prepare for, and respond to the Ebola virus disease outbreak,” with the majority ($2.5 billion) provided to USAID, followed by the Centers for Disease Control and Prevention (CDC) ($1.2 billion, of which $597 million is designated to support national public health institutes and global health security) and the State Department ($42 million).5
Of the $1.7 billion in domestic funding, the largest share ($733 million) is provided to the Assistant Secretary for Preparedness and Response at the Department of Health and Human Services (HHS), followed by the CDC ($571 million), National Institutes of Health (NIH) ($238 million), Department of Defense (DoD) ($112 million), and the Food and Drug Administration (FDA) ($25 million). This funding supports, among other things, research and development activities at HHS and DOD, as well as a range of activities at the CDC including the establishment of regional treatment centers, medical worker training, and support for quarantine efforts. It is possible that some of the $1.7 billion in domestic funding may be used for international efforts.
Since Congress designated this funding for emergency purposes, it is not counted towards overall budget caps. Additionally, Congress stipulated in the FY15 Omnibus that this funding could be provided over a multi-year period. For instance, Congress specified that the emergency Ebola funding provided to the CDC ($1.8 billion, of which $1.2 billion is for international efforts) would remain available through FY19, while the majority of the $2.5 billion provided to USAID would “remain available until expended.”6
Global Health Programs
PEPFAR/Bilateral HIV
PEPFAR’s bilateral HIV funding through the GHP account totaled $4,650 million ($330 million at USAID and $4,020 million at the State Department), an increase of $300 million (7%) above FY14. Bilateral HIV accounts for the largest share (55%) of any program area within the global health portfolio under the GHP account (See Figure 3). Included within this amount is funding for microbicides research ($45 million) and the U.S. contribution to the Joint United Nations Programme on HIV/AIDS (UNAIDS) ($45 million). The Omnibus bill also provided $128.4 million in HIV funding through the CDC and $8 million for HIV programs at the Department of Defense (DoD); both totals match FY14 levels. Additional funding for HIV research at the National Institutes of Health (NIH) is not yet known (in FY14, it was $376 million).
Figure 4: Global Health Programs (GHP) Account By Sector, FY 2015 Omnibus
Global Fund to Fight AIDS, Tuberculosis and Malaria (Global Fund)
The Omnibus bill included $1,350 million for the U.S. contribution to the Global Fund, a $300 million (18%) decrease from FY14 levels, but an amount that matches the President’s FY15 Budget Request. This fulfills the President’s pledge, made during the Global Fund’s 4th Replenishment Conference held in December 2013, that the U.S. would contribute $1 for every $2 pledged by other donors, and is in line with the Congressionally mandated caps on the amount of funding the U.S. can provide to the Global Fund.7 In the FY15 budget request, the President had included an additional $300 million in potential funding that could be made available to the Global Fund, dependent on additional pledges from other donors, although this was ultimately not included in the final bill.8 The Global Fund accounts for the second largest share (16%) of U.S. funding for global health (in the GHP account).
Tuberculosis
Funding for tuberculosis (TB) programs through the GHP account totaled $236 million, which matches the FY14 level. Additional tuberculosis funding provided through the Economic Support Fund (ESF) account is not yet known (in FY14, it was $6.5 million).
Malaria
Malaria funding totaled $669.5 million and was one of only three program areas under the GHP account that increased above FY14 levels ($4.5 million or 1%). Additional malaria funding through the CDC and DoD and for research activities at the NIH is not yet known (in FY14, CDC funding was $11 million, DoD was $17 million, and NIH research funding was $151 million).
Family Planning & Reproductive Health (FP/RH)
Congress stated in the Omnibus bill that total bilateral funding for FP/RH programs should be “not less than $575 million” ($524 million through the GHP account and $51 million through the ESF account) and included an additional $35 million for the U.S. contribution to the United Nations Population Fund (UNFPA), matching the FY14 enacted funding levels ($610 million).9,10 While the Omnibus bill maintains existing policy requirements prohibiting the use of foreign assistance to pay for the performance of abortion as a method of family planning or to motivate or coerce any person to practice abortion, it does not include a reinstatement of the “Global Gag Rule,” which required foreign non-governmental organizations (NGOs) to certify that they would not perform or promote abortion as a method of family planning using funds from any source as a condition for receiving U.S. funding, nor does it prohibit funding for needle exchange programs – provisions that had been included in the House State and Foreign Operations (SFOPs) appropriations bill. The Omnibus bill also reversed a ban on funding for abortion services for Peace Corps volunteers in cases of life, rape, or incest.
Maternal & Child Health (MCH)
The majority of funding for MCH programs is provided through the GHP account, which totaled $715 million in the FY15 Omnibus, a $10 million (1%) increase above FY14 levels. This includes $515 million in funding for bilateral programs, of which $51.5 million is for Polio, and a $200 million contribution to GAVI. Despite the overall increase in MCH funding through the GHP account, after taking into account increased funding for GAVI (see below), funding for bilateral MCH activities actually declined by $15 million from FY14 levels. Some additional MCH funding provided through other accounts at USAID, such as the ESF and Food for Peace (FFP) accounts, is not yet known.
Specific components of MCH funding provided USAID as well as CDC and the State Department is as follows:
GAVI: The U.S. contribution to GAVI, which is included under MCH funding in the GHP account, totaled $200 million, a $25 million (14%) increase above FY14.
Polio:S. funding for polio programs is provided through USAID (as part of MCH funding via the GHP and ESF accounts) and CDC. Polio funding totaled $59 million at USAID, matching FY14 levels, and $159 million at CDC, an $8 million (5%) increase above FY14 levels.
United Nations Children’s Fund (UNICEF): The U.S. contribution to UNICEF totaled $132 million in the FY15 Omnibus, which matches FY14 levels.11
Nutrition
Nutrition funding through the GHP account totaled $115 million, which matches the FY14 level. Additional nutrition funding provided through other accounts, such as the ESF and FFP accounts, is not yet known.
Vulnerable Children
Funding for vulnerable children, which is provided via the Displaced Children and Orphans Fund (DCOF), totaled $14.5 million in the GHP account matching the FY14 level.
Pandemic Preparedness
Pandemic Preparedness funding through the GHP account totaled $72.5 million, which matches the FY14 level. Additional funding provided through other accounts, such as the ESF account, is not yet known.
Global Public Health Protection
The FY15 Omnibus included $45.4 million for Global Disease Detection and Emergency Response and $9.8 million for Global Public Health Capacity Development at the CDC. In the FY15 budget request, these two areas were included under a broader funding category titled Global Public Health Protection along with funding for a newly launched Global Health Security Initiative.12 While Congress did not provide specific funding for the Global Health Security Initiative, a significant portion of the emergency Ebola funding included in the FY15 Omnibus bill is directed to the CDC for similar activities (see Emergency Ebola Funding section below).
Other Global Health Funding
The U.S. provides additional global health funding in support of water, sanitation and hygiene (WASH) activities, for international global health research efforts conducted through the Fogarty International Center (FIC) at NIH, and for multilateral organizations, such as the World Health Organization (WHO) and the Pan American Health Organization (PAHO), that play an important role in addressing global issues. Congress provided $382.5 million for WASH projects, a $17.5 million (5%) increase above the FY14 enacted funding level.13 It is important to note that WASH is considered a cross-cutting issue supported through direct appropriations as well as funding provided through other programs areas (e.g. HIV, MCH, etc.); the $382.5 million in WASH funding provided through the FY15 Omnibus includes both direct appropriations as well as funding from other program areas and, therefore, is not included within the overall global health total.14 The FY15 Omnibus bill included $67.8 million for international global health research activities at FIC ($0.3 million or 0.4% above FY14). U.S. contributions to WHO and PAHO are not yet known.
Other International Development Programs
The Omnibus bill provided funding for areas and agencies that are not directly involved in U.S. global health, but are related and may impact these efforts including: the Millennium Challenge Corporation (MCC); Feed the Future (FtF), which is the U.S. Government’s Global Hunger and Food Security Initiative; broader food assistance through Food for Peace (FFP) and McGovern-Dole International Food for Education and Child Nutrition (McGovern-Dole); and other funding through the State & Foreign Operations Development Assistance (DA) and Economic Support Fund (ESF) accounts. Among these areas and agencies, FtF was the only item that declined ($99 million or 9%) in the Omnibus bill; funding for MCC and McGovern-Dole increased slightly, and funding for the DA account and FFP remained flat (see Table 4). While funding for the ESF account increased ($158 million or 3%) in the FY15 Omnibus, this entire increase can be attributed to increased funding for Overseas Contingency Operations (OCO), which provides funding for programs in Iraq, Afghanistan, and Pakistan; non-OCO funding in the ESF account actually declined.
Table 1: Emergency Ebola Funding – FY15 Omnibus (millions)*
International Response**
Department of State
$41.7
Diplomatic & Consular Programs
$36.4
International Security Assistance
$5.3
USAID
$2,484.7
Operating Expenses
$19.0
Office of Inspector General
$5.6
Global Health Programs (GHP) account
$312.0
International Disaster Assistance (IDA) account
$1,436.3
Economic Support Fund (ESF) account
$711.7
Centers for Disease Control & Prevention (CDC)
$1,200.0
Total International Response:
$3,726.4
Domestic Response**
Health and Human Services (HHS)
$1,567.0
Centers for Disease Control & Prevention (CDC)
$571.0
National Institutes of Health (NIH)
$238.0
Assistant Secretary for Preparedness and Response
$733.0
Food & Drug Administration (FDA)
$25.0
Department of Defense (DoD)
$112.0
Defense Advanced Research Projects Agency (DARPA)
$45.0
Chemical and Biological Defense Program (CBDP)
$50.0
Equipment Procurement
$17.0
Total Domestic Response:
$1,679.0
Total Ebola Funding:
$5,405.4
NOTES:*The emergency funding for Ebola does not count towards overall budget caps.**It is possible that some of $1.7 billion in emergency Ebola funding for the domestic response may be used for international efforts.
Table 2: Comparison of Global Health Funding to International Affairs Budget (Base Funding),FY 2012 – FY 2015
FY12(millions)*
FY13(millions)**
FY14(millions)***
FY15 Omnibus(millions)
Global Health****
$8,866
$8,714
$9,154
$9,172
of which International Affairs
$8,412
$8,278
$8,666
$8,680
International Affairs*****
$54,368
$51,906
$50,725
$50,928
of which Base (Enduring)
$43,165
$41,084
$44,205
$41,670
of which Overseas Contingency Operations (OCO)
$11,203
$10,822
$6,520
$9,258
Global Health share of International Affairs Budget (Base Funding)
19%
20%
20%
21%
NOTES:*FY12 totals are final funding amounts (see FY14 State and Foreign Operations Congressional Budget Justification).** FY13 totals are final funding amounts and include the effects of sequestration (see FY15 State and Foreign Operations Congressional Budget Justification).***FY14 totals are estimated funding levels (see FY15 State and Foreign Operations Congressional Budget Justification).****Global Health represents total known funding; some global health funding amounts are determined at the agency level (e.g. NIH funding for international HIV research) and are not yet available.*****International Affairs is Function 150 Account only and includes both Base (Enduring) and Overseas Contingency Operations (OCO) funding. OCO has historically included some funding for global health programs, but this amount is not yet known for the FY15 Budget Request. The majority of U.S. global health funding is provided as part of Base (Enduring) funding.
Table 3: U.S. Funding for Global Health Programs, FY 2014 – FY 2015
Department / Agency / Area
FY14 Final(millions)
FY15 Omnibus(millions)
Difference(millions, %)
USAID – Global Health Programs (GHP)
HIV/AIDS
$330.0
$330.0
$0(0%)
Tuberculosis
$236.0
$236.0
$0(0%)
Malaria
$665.0
$669.5
$4.5(0.7%)
Neglected Tropical Diseases (NTDS)
$100.0
$100.0
$0(0%)
Pandemic Influenza
$72.5
$72.5
$0(0%)
Maternal & Child Health (MCH)
$705.0
$715.0
$10(1.4%)
of which GAVI
$175.0
$200.0
$25 (14.3%)
of which Polio
$51.0
$51.5
$0.5 (1%)
Nutrition
$115.0
$115.0
$0(0%)
Vulnerable Children
$22.0
$22.0
$0(0%)
Family Planning & Reproductive Health (FP/RH)*
$524.0
$524.0
$0(0%)
Total USAID:
$2,769.5
$2,784.0
$14.5 (0.5%)
State – Global Health Programs (GHP)
HIV/AIDS Bilateral
$4,020.0
$4,320.0
$300(7.5%)
of which UNAIDS
$45.0
$45.0
$0 (0%)
Global Fund
$1,650.0
$1,350.0
$-300(-18.2%)
Total State:
$5,670.0
$5,670.0
$0 (0%)
Total GHP – State & USAID
Total USAID & State GHP:
$8,439.5
$8,454.0
$14.5 (0.2%)
State & Foreign Operations – Economic Support Fund (ESF)
Family Planning & Reproductive Health (FP/RH)*
$51.1
$51.1
$0(0%)
Polio
$8.0
$7.5
$-0.5(-6.3%)
State & Foreign Operations – International Organizations & Programs (IO&P)
United Nations Children’s Fund (UNICEF)
$132.0
$132.0
$0(0%)
United Nations Population Fund (UNFPA)*
$35.0
$35.0
$0(0%)
National Institutes of Health (NIH)
Fogarty International Center (FIC)
$67.5
$67.8
$0.3(0.4%)
Centers for Disease Control and Prevention (CDC)
Global HIV/AIDS
$128.4
$128.4
$0(0%)
Global Immunization
$200.4
$208.6
$8.3(4.1%)
Polio Eradication
$150.5
$158.8
$8.3 (5.5%)
Other Global/Measles
$49.8
$49.8
$0 (0%)
Parasitic Disease and Malaria
$22.6
$24.4
$1.8(7.9%)
Global Public Health Protection
$62.0
$55.1
$-6.9(-11.1%)
Global Health Security Initiative
–
–
–
Global Disease Detection & Emergency Response
$44.3
$45.4
$1.1 (2.4%)
Global Public Health Capacity Development
$17.7
$9.8
$-8 (-45%)
Total CDC:
$413.4
$416.5
$3.1 (0.8%)
Department of Defense (DoD)
HIV/AIDS
$8.0
$8.0
$0(0%)
Total Global Health Funding
Total Global Health Funding:**
$9,154.4
$9,171.8
$17.4 (0.2%)
NOTES:*Both the FY14 Omnibus (P.L. 113-76) and the FY15 Omnibus (H.R. 83) state that, of the funding appropriated for bilateral assistance, “not less than $575,000,000 should be made available for family planning/reproductive health.” Both bills also provide an additional $35 million as the U.S. contribution to the United Nations Population Fund (UNFPA). According to data on ForeignAssistance.gov, final FY14 funding for FP/RH totaled $621 million ($524 million through the GHP account, $62 million through the ESF account, and $35 million for the U.S. contribution to UNFPA).**Some global health funding amounts (e.g. NIH funding for international HIV research) are not earmarked by Congress in the Omnibus bill and are determined at the agency level.
Table 4: Other Related Non-Global Health Funding, FY 2014 – FY 2015
Department / Agency / Area
FY14 Final(millions)
FY15 Omnibus(millions)
Difference(millions, %)
Development Assistance (DA) account (SFOPs)
$2,507.0
$2,507.0
$0(0%)
Economic Support Fund (ESF) account
$4,589.2
$4,746.8
$157.6(3.4%)
of which Overseas Contingency Operations (OCO)
$1,656.2
$2,114.3
$458.1 (27.7%)
Feed the Future (FtF) Initiative*
$1,100.0
$1,000.6
$-99.4(-9%)
Global Agriculture and Food Security Program (GAFSP)**
$133.0
–
–
McGovern-Dole International Food for Education and Child Nutrition Program
$185.1
$191.6
$6.5(3.5%)
Food for Peace (FFP-Title II)
$1,466.0
$1,466.0
$0(0%)
Millennium Challenge Corporation (MCC)
$898.2
$899.5
$1.3(0.1%)
NOTES:*The bill states that, of the funds appropriated for bilateral assistance, “not less than $1,000,600,000 should be made available for food security and agricultural development programs.”**The bill states that, of the funding appropriated for bilateral assistance programs, a portion “may be made available as a contribution to the Global Agriculture and Food Security Program if such contribution will not cause the United States to exceed 33 percent of the total amount of funds contributed to such program.”
U.S. Congress. “Consolidated and Further Continuing Appropriations Act, 2015” (H.R. 83); December 9, 2014. ↩︎
The international affairs budget is comprised of base funding, which supports enduring programs, and funding for Overseas Contingency Operations (OCO), which has been defined by the Administration as “extraordinary, but temporary” funding supporting efforts in Iraq, Afghanistan, and Pakistan (see Congressional Research Service, State, Foreign Operations, and Related Programs: FY2015 Budget and Appropriations,” December 8, 2014). The global health funding from USAID and the State Department detailed in this analysis is part of base funding in the international affairs budget. In the FY15 Omnibus bill, the total international affairs budget (base and OCO) was $50.9 billion, an increase of approximately $200 million from FY14 estimated levels. However, base funding, was $41.7 billion, a decrease of $2.5 billion from FY14 levels (OCO funding in the international affairs budget totaled $9.3 billion in the FY15 Omnibus, a $2.7 billion increase from FY14 levels). See “Consolidated and Further Continuing Appropriations Act, 2015” (H.R. 83), and “FY 2015 Congressional Budget Justification – Department of State, Foreign Operations, and Related Programs”. ↩︎
See “Consolidated and Further Continuing Appropriations Act, 2015” – H.R. 83, and the FY 2014 and FY 2015 Congressional Budget Justifications (CBJs) for the Department of State, Foreign Operations, and Related Programs (SFOPs). ↩︎
The President had requested a total of $6.2 billion in emergency Ebola funding. ↩︎
The $3.7 billion includes all funding provided to USAID and the State Department, as well as the funding provided to CDC that was specifically designated by Congress for international efforts. Of the remaining $1.7 billion in emergency Ebola funding included in the FY15 Omnibus, it is possible that some of this funding may be used for international efforts. ↩︎
U.S. Congress. “Consolidated and Further Continuing Appropriations Act, 2015” (H.R. 83); December 9, 2014. ↩︎
By law, U.S. contributions to the Global Fund may not exceed 33% of total contributions from all donors. During a hearing on the budget request held on March 12, 2014 before the State, Foreign Operations, and Related Programs Subcommittee of the House Committee on Appropriations, Secretary of State Kerry stated that the U.S. was acting to fulfill its pledge based on the existing commitments of other donors. ↩︎
The FY15 budget request included a newly proposed “Opportunity, Growth, and Security Initiative” that would provide additional funding across many areas, including some for global health activities (e.g. for the Global Fund; see below). However, this new initiative, which proposed an additional $56 billion in discretionary funding (divided evenly between defense and non-defense), would have been offset by mandatory spending reforms and higher revenues; it therefore, required Congressional approval. Congress did not include the “Opportunity, Growth, and Security Initiative” in the FY15 Omnibus bill. ↩︎
Both the FY14 Omnibus (P.L. 113-76) and the FY15 Omnibus (H.R. 83) bills state that, of the funding appropriated for bilateral assistance, “not less than $575,000,000 should be made available for family planning/reproductive health.” Both bills also provide an additional $35 million as the U.S. contribution to the United Nations Population Fund (UNFPA). According to data on ForeignAssistance.gov, actual FY14 funding for FP/RH totaled $621 million ($524 million through the GHP account, $62 million through the ESF account, and $35 million for the U.S. contribution to UNFPA). ↩︎
U.S. funding for UNFPA is provided through the International Organizations and Programs (IO&P) account at the State Department. ↩︎
U.S. funding for UNICEF is provided through the International Organizations and Programs (IO&P) account at the State Department. ↩︎
The Global Health Security Initiative is an effort launched in February 2014 aimed at improving global capabilities to prevent, detect, and respond to epidemics and other emerging public health threats. ↩︎
Congress stated in the Omnibus bill that “not less than $382,500,000 shall be made available for water and sanitation supply projects pursuant to the Senator Paul Simon Water for the Poor Act of 2005.” ↩︎
WASH is considered a cross-cutting issue that receives funding from multiple accounts through both direct appropriations and as part of funding provided to other program areas (e.g. HIV and MCH). Since the FY15 Omnibus bill did not specify the accounts and program areas used to reach the $382 million in WASH funding, this amount was not included in overall global health funding totals in order to prevent double-counting of funding. ↩︎
A new Kaiser Family Foundation issue brief examines the impact of the Affordable Care Act (ACA) on people with HIV in five states – California, Florida, Georgia, New York and Texas. Findings are drawn from focus groups in which participants discussed their experiences during the first year of the ACA’s major coverage expansions, with the goal of understanding the implications for individual HIV health outcomes and the nation’s response to the epidemic.
While many focus group participants gained new health coverage, others were left out of coverage, most often because they lived in a state not expanding its Medicaid program. These individuals expressed ongoing concerns related to health and economic well-being. Participants gaining insurance reported finding access to more comprehensive health services through their new coverage and greater economic security, but many encountered technical difficulties while enrolling. Many assumed their HIV providers and medications were covered by their new plans – but did not confirm this before enrolling. Those who enrolled in Medicaid, in states expanding the program, reported the smoothest coverage transitions. Almost all focus group participants discussed how the Ryan White HIV/AIDS Program has continued to play a major role in their lives, including those with new coverage but especially those living in states that have not expanded Medicaid under the law.
Assuring that people living with HIV have continuous access to high quality health care, particularly antiretroviral therapy (ART), is essential for addressing the ongoing HIV epidemic in the United States. Indeed, antiretroviral therapy is not only critical for the health and longevity of people with HIV, it has also been shown to significantly reduce the risk of HIV transmission.1 However, the majority of people with HIV in the U.S. are not yet engaged in care and not on ART.2 Improving access to health coverage is one key component to addressing this gap.
The Affordable Care Act (ACA) provides new health insurance coverage opportunities for millions of individuals, including people with HIV. To provide greater insight into what the ACA has meant for this population, this report examines the experiences of people with HIV based on focus groups conducted in five states – California, Florida, Georgia, New York, and Texas – between June and September of 2014. Participants were asked to discuss their enrollment and coverage experiences in either their state’s health care marketplace or an expanded Medicaid program. Those participants who did not gain new coverage, largely because they lived in a state that did not choose to expand Medicaid, discussed that experience. In addition, all participants were asked about the role of the Ryan White HIV/AIDS Program, the nation’s safety net for people with HIV who are uninsured or underinsured.
It is important to note that because these focus groups were conducted relatively soon after coverage began, they represent the early experiences of people with HIV in these states and may not fully capture their ongoing coverage and care experiences. Ultimately, understanding the experiences of people with HIV in accessing new coverage, including successes and challenges, has important implications for both individual health outcomes and the nation’s response to the HIV epidemic.
Key findings include:
At the time of the focus groups, the ACA’s health insurance expansions, through health care marketplaces and Medicaid expansion, were already playing a role in the lives of many with HIV who reported gaining new coverage.
Those enrolling in private coverage sold on the marketplaces found that they had access to more comprehensive health services. While in the past many received HIV related care and treatment through the Ryan White Program, participants faced economic and health insecurity related to other, non-HIV, healthcare needs. Some participants found they were able to find much more affordable coverage through the marketplace compared to pre-ACA insurance costs. However, many faced barriers during enrollment and although most of these were surmountable, some became discouraged and did not enroll. A few participants enrolled in plans with very high deductibles and as a result were concerned that their out-of-pocket costs would be prohibitive. In addition, several enrolled in plans without fully understanding their coverage or knowing if their HIV doctor would be in their plan’s network or whether their HIV medications would be covered. Where focus group participants had used their new coverage, it was mostly to access HIV drugs. A smaller share of participants used their coverage more broadly and while they reported staying in care, some had to change providers, pharmacies, and switching to different non-HIV drugs.
Participants gaining new coverage through Medicaid expansion reported continuing to get their HIV care needs met, as they had in the past primarily through Ryan White, while also receiving care for other health problems that had previously gone untreated. These enrollees generally reported smoother coverage transitions compared to those in the marketplace. In addition, most had already used their coverage for accessing HIV care and treatment.
Focus group participants living in states not expanding their Medicaid programs, but who would have otherwise been eligible, continued to receive their HIV care through Ryan White but worried about how to meet other health needs. They were frustrated by their state’s decision not to expand and continued to be worried about health and economic insecurity that accompanied being uninsured.
They Ryan White Program was cited as a key source of care, treatment, and support for many focus group participants, including those gaining new coverage, helping to ensure a smooth transition into new forms of health insurance, helping them to afford new coverage, and supplementing coverage with needed services where gaps remained. In addition, Ryan White continues to be the main source of HIV care for those who remained uninsured.
Issue Brief
Introduction
Assuring that all people living with HIV have continuous access to high quality health care, particularly to antiretroviral therapy (ART), is essential for addressing the ongoing HIV epidemic in the U.S. Indeed, antiretroviral therapy is not only critical for the health and longevity of people with HIV, it has also been shown to significantly reduce the risk of HIV transmission.3 For these reasons, current federal HIV treatment guidelines recommend initiation of ART as soon as one is diagnosed, as well as regular care and monitoring.4 However, the majority of people with HIV in the U.S. are not yet engaged in care and not on ART.5 Improving access to health coverage is one key component to addressing this gap.
The Affordable Care Act (ACA), signed into law in 2010, aims to expand access to affordable health coverage for millions of Americans, including people with HIV. While several provisions of the ACA have implications for people with HIV, two are expected the have the most far reaching effects on coverage – the expansion of Medicaid, in states that choose to expand, and the creation of health insurance marketplaces in each state where individuals can purchase private coverage, along with subsidized coverage for those with low and moderate incomes. However, despite the ACA’s reforms, not all people with HIV will gain new forms of insurance. In addition, even those who do may need further assistance in accessing and paying for health coverage and certain types of services that are important for HIV care, such as case management, may remain unreimbursed in traditional systems of care. For these individuals, the Ryan White HIV/AIDS program, the nation’s safety net for people with HIV who are uninsured and underinsured, will continue to be critical.
To provide greater insight into what the ACA has meant for people with HIV, this report examines their early experiences based on ten focus groups conducted in five states – California, Florida, Georgia, New York, and Texas – between June and September of 2014 (see Methodology for more detail). Together, these states represent half of all people estimated to be living with HIV in the United States. Within these states, focus groups were conducted in the cities of Los Angeles, Miami, Atlanta, New York City, and Dallas. Participants were asked to discuss their enrollment and coverage experiences, as well as their experiences with maintaining ongoing HIV care, obtaining HIV medications, accessing experienced HIV providers, costs, and the role of the Ryan White HIV/AIDS program. The states were chosen for geographic diversity, burden of the epidemic, and varying state approaches to health reform implementation, including Medicaid expansion decisions. Two of the states – California and New York – have moved ahead with Medicaid expansion while the remaining three – Florida, Georgia, and Texas – have not; in addition, California and New York have chosen to run their own health insurance marketplaces while Florida, Georgia and Texas have defaulted to the federally-facilitated marketplace (see Table 1). It is important to note that because these focus groups were conducted during 2014, they represent the early experiences of people with HIV in these states and may not fully capture their ongoing coverage and care experiences. In addition, the views of focus group participants are not necessarily reflective of all people with HIV in a particular state or nationally.
HIV remains a serious public health challenge in the United States (U.S.). More than a million people are living with HIV in the U.S. and approximately 50,000 become newly infected each year.6 Critical to addressing the HIV epidemic is getting those who test positive engaged in care, onto ART and, ultimately, virally suppressed.7 Early initiation of antiretroviral therapy not only significantly delays progression of HIV disease and reduces the occurrence of adverse health events and death, it has also been shown to significantly reduce the risk of HIV transmission.8 As a result, current treatment guidelines recommend initiation of ART immediately after HIV diagnosis.9 Guidelines also recommend that people with HIV be treated by experienced HIV providers, have regular medical visits and laboratory monitoring, and maintain continuous access to HIV care without ART interruptions in order to achieve optimal health outcomes.10 However, it is estimated that 6 in 10 people with HIV in the U.S. are not engaged in ongoing HIV care, and therefore most are not on ART or virally suppressed – some are not yet diagnosed, but others are not yet linked to care or have fallen out of care, due to access barriers including the lack of adequate insurance coverage.11 Health insurance coverage is one key factor in helping to improve health care access, and ultimately health outcomes, for people in the United States, including those with HIV.12
The ACA provides new health insurance coverage opportunities to millions of individuals, including thousands with HIV. As mentioned above, the ACA’s Medicaid expansion and creation of health insurance marketplaces in all states, both of which went into effect in 2014, are expected to have the most far reaching effects on coverage for people with HIV, as follows.
Medicaid Expansion:
One of the most important components of the ACA for people with HIV is the expansion of Medicaid eligibility. Prior to the ACA, Medicaid eligibility for low income childless adults was quite limited and under pre-ACA Medicaid eligibility rules, to qualify for the program, one had to meet financial eligibility criteria and belong to a group that is “categorically eligible” for Medicaid (such as children, parents with dependent children, pregnant women, and individuals with disabilities). Federal law categorically excluded non-disabled adults without dependent children, unless a state obtained a waiver or uses state-only dollars to cover them. These Medicaid eligibility rules presented a “catch-22” for many low-income people with HIV who could not qualify for Medicaid until they were already quite sick and disabled (usually having progressed to an AIDS diagnosis).
The ACA changed this by establishing a new minimum Medicaid income eligibility level of 138% of the federal poverty level (FPL) (about $16,000 for an individual in 2014) for most citizens and legal residents and removed the categorical eligibility requirement. The law required all states to expand eligibility as of 2014. However, a Supreme Court ruling in June 2012, while upholding the ACA, effectively made Medicaid expansion a state option. As of December 1, 2014, 28 states have expanded their Medicaid programs and 23 states have indicated they will not expand or are in the process of deciding whether they will expand their Medicaid programs. (Approximately 40% of people with HIV live in these non-expansion states.13 )
Health Insurance Marketplaces:
The ACA requires most U.S. citizens and legal residents to have qualifying health insurance as of 2014. To help people access affordable coverage, the ACA created new health insurance marketplaces in every state. Marketplaces are intended to create a more competitive market for individuals and small businesses buying health insurance. They offer a choice of different qualified health plans (QHPs), certifying plans that participate and providing information to help consumers better understand their options by making it easier to compare benefits across plans. Importantly, the ACA provides financial assistance for people with low to moderate incomes to purchase insurance in the marketplace. These include tax credits to offset premium costs for those with incomes between 100% FPL and 400% FPL and subsidies to reduce cost-sharing expenses for those with incomes between 100% and 250% FPL. Because the ACA also prohibits health plans from denying, rescinding, or charging higher amounts for coverage based on health status, and ends annual and lifetime caps on coverage, alongside the creation of the health insurance marketplaces, people with HIV now have greater access to the private insurance market than in the past.
Despite these reforms, access to health insurance alone does not equal access to continuous quality HIV care. While these coverage expansions will certainly mean that many individuals with HIV will have greater access to more affordable and more robust forms of health insurance, there will also be significant challenges as the law is implemented. In states that do not expand their Medicaid programs, many low-income HIV positive individuals will find themselves in “the coverage gap,” below 100% FPL and neither eligible for Medicaid or subsidized coverage purchased in the marketplace (which begins at 100% FPL). In addition, implementation will take time and individuals, especially those most vulnerable and unfamiliar with health insurance and systems, may not enroll in coverage overnight and may not be familiar with processes for accessing health systems. As people with HIV move into new forms of coverage under the ACA, understanding gaps, challenges, and successes surrounding those transitions will help to inform future enrollment periods and policy needs. It will be particularly important to assess and monitor the adequacy of provider networks, drug formularies, and the ability of people with HIV to maintain continuous coverage.
Also important will be assessing the role of the Ryan White HIV/AIDS Program (RWP), which operates as payer of last resort for people with HIV who have no or limited coverage. The RWP plays an integral role as a safety net provider of HIV care and treatment but is not comprehensive form of insurance. In addition, because Ryan White is a payer of last resort, there is an expectation that clients newly eligible for Medicaid or marketplace coverage under the ACA will make those transitions. For those who cannot gain new coverage under the ACA, the Ryan White Program will continue to be their main source of HIV care and treatment. For those who do gain new coverage, Ryan White will likely continue to play an important role for many by filling in gaps in benefit packages and assisting with the cost of insurance (prior to the ACA, most Ryan White clients had insurance and were relying on the program to help supplement and/or pay for their coverage14 ). In fact, the federal government has encouraged Ryan White grantees to help educate and enroll clients into new forms of coverage for which they are eligible and to provide financial support through premium assistance when possible.15
Findings
Views About HIV Care and Other Health Care Needs
All focus group participants were asked to discuss their HIV and other care needs, including their views on health care providers and what barriers they may have experienced in accessing care. Assessing whether new health coverage can meet the unique health needs of people living with HIV will be important going forward. Engagement and retention in care and treatment is critical to good HIV related health outcomes so defining what aspects of care people with HIV value in particular and what previous barriers to care have existed will be important.
Almost all participants say receiving ongoing quality HIV care is vital to their health and life. Participants in all groups stress the necessity of continuous HIV care, particularly the importance of avoiding any disruptions in taking their HIV medications. Missing just a small number of doses of medication, they say, can affect their health as well as their resistance to medications. For these reasons, health care issues related to their HIV status take priority when choosing and transitioning to new health care coverage.
Participants wanta health care provider who has HIV expertise and one with whom they can form a relationship. Participants say having a physician with HIV expertise is critical to receiving the best, most up-to-date HIV-related care. They also feel an established relationship with their doctor is important to build a level of trust. Many explained that it was important to them that providers knew about all aspects of their lives so that they could be treated comprehensively, including if they were struggling with addiction, explaining that it is more difficult to be open and honest with a new doctor when that trust is absent. Several have encountered physicians who were judgmental, and some participants say they have felt stigmatized as a result of being HIV positive in healthcare settings. These factors can make changing physicians or finding a new doctor challenging for people with HIV.
“…I would rather a doctor that knew my particular situation, that I have a rapport with that I feel comfortable discussing just all the things that I’m going through in terms of emotionally and physically and mentally with everything else. Juggling kids…having this illness and other things that I have going on in my life, I need a certain type of empathy…” –New York participant, QHP enrollee
Many have significant non-HIV related health needs including cancer, diabetes, mental health, and substance abuse issues. In addition to HIV, many participants also report having other health needs that warrant medical care and treatment. Several participants reported current or past experiences with various types of cancer. One participant had Crohn’s Disease, another suffered from migraines, and several others had nagging ailments from past injuries. A large share of participants spoke of current or former mental health and substance use problems. Some have put off care for these other health issues and report that this is a stressor in their lives. In many cases participants incurred medical debt as a result of seeking care while being uninsured and without other options are unable to do anything to address this debt. Some of the uninsured participants are facing serious illnesses without a way to receive care for non-HIV related medical issues. Many discussed being grateful for assistance the RWP provides but noted that they were left without resources to address these other non-HIV related health problems.
I’ve given…up [on the medical debt]. Sometimes, it depends on your stability; do you want to stress out about something you can’t do anything about? And you get sick again and get some more bills?” – Atlanta participant, uninsured
There are many hurdles participants have to overcome to improve their health and access to care, including: mental health issues, addiction, transportation concerns, medical debt and unemployment. Mental health, addiction, and transportation issues represent major obstacles to coverage and care and studies indicate that the prevalence of mental illness and substance use, complex co-morbid conditions that often require more intensive and coordinated services, is much greater for those with HIV.16,17,18 Addressing these challenges, therefore, is fundamental to ensuring that people with HIV are able to obtain health coverage and to access and remain in HIV care and treatment. Many focus group participants reported that they were struggling day to day with untreated mental health issues. Several participants have received or need ongoing treatment for addiction issues. Participants in Texas and Florida, in particular, say lack of transportation has impeded their ability to go to their doctor’s appointments. Several in Florida recently lost their monthly bus pass after a round of budget cuts in the RWP, which caused stress about how they would get to their doctor appointments, a critical part of HIV care.
Experiences with Private Coverage in the Health Insurance Marketplace
Five groups were held with participants with HIV who attempted to enroll (successfully or unsuccessfully) in Qualified Health Plans (QHPs) through state and federal marketplaces, including one in each of the following cities: Dallas, Long Beach, Atlanta, Miami, and New York City.
People with HIV were motivated to enroll in QHPs for a variety of reasons. Several participants who are or were self-employed reported purchasing individual coverage in the past but at very high rates and were burdened by the costs. In recent years, some saw premiums become unaffordable and had to drop their coverage. Prior to the ACA, private insurance companies could charge higher rates based on health status, including HIV disease, and coverage, when it was available, was often not affordable. The ACA provided them, for the first time, with an opportunity to access affordable coverage. One participant in Los Angeles reported that prior to the ACA, his premium had increased to $1,000 per month before he dropped his coverage and became uninsured. Others had been previously uninsured because coverage was not accessible or unaffordable to purchase in the first place. These participants were hopeful and excited by the ACA and were motivated to enroll by the promise of more affordable coverage. Other participants say the mandate and avoiding the penalty were the main reasons they decided to enroll. In addition to other reasons compelling individuals to seek out coverage, many were looking for greater protections offered by being insured or wanting to take care of health problems they had been ignoring. Some also say their case manager or a counselor at their health center encouraged them to enroll.
The most important factors in choosing a plan include the premium amount, whether their HIV medications would be covered, and whether their current HIV providers were in network. For most participants, the biggest decision factor in choosing a plan was the premium amount. They say they chose a plan based on trying to get the most covered for a price they could afford. Many participants were previously receiving their HIV treatment through Ryan White and in looking at other coverage options say their main question and concern in choosing a plan was whether their HIV medications would be covered. Some got answers to these questions through seeing a list of medications on a formulary, through case managers, or by calling the plans directly. Others made enrollment decisions based on which plans included their current HIV doctor in-network. Several called their current provider to ask whether he or she accepted a specific plan, and others looked on the insurance carrier’s list of providers.
Still, many selected and enrolled in a plan without knowing whether their HIV medications, doctors, lab work, and other vital care would be covered. While some were able to get answers about whether their HIV medications would be covered, some individuals did not know how to ensure that pre-ACA standards of care were continued into new coverage. For instance, staying with a particular provider or making sure a particular drug was covered by a plan at the outset. Many simply assumed medications would be covered and that they would be able to stay with their providers and did not ask questions or did not know where to get answers. Many participants also say they did not know if lab work would be covered.
Participants reported learning about the ACA and open enrollment from a wide range of sources. Many say they heard about the ACA by seeing commercials on TV and through news sources, including CNN. One woman who enrolled in a QHP in New York City says she saw an ad when she was checking her email on Yahoo – she clicked on the link and it took her to the Marketplace website. Others saw friends post on Facebook about their experiences and decided to look into coverage themselves. Some say they heard from friends and family through word of mouth. Many also saw advertisements at their health clinics and doctors’ offices or heard about the ACA from their case managers. A few participants in residential living settings had a navigator visit their residence to educate them on the ACA and enrollment.
For many, case managers played an important role in accessing and navigating the health care system. Case management has been shown to be particularly important for HIV care, helping with linkage, retention, and adherence.19 Indeed, participants frequently cited their case manager, often a Ryan White case manager, as a source of information and help. Participants who felt choosing a plan was too overwhelming and that questions were difficult to get answered were relieved that their case manager could narrow choices and help them choose a plan. Several in California say their case managers assured them of the availability of additional financial assistance through Ryan White to help pay for QHP premiums. Knowing this seemed to take the pressure off of choosing “the right” plan while also weighing premium affordability. In some instances, case managers were central to participants successfully enrolling in a QHP or Medicaid. Some participants felt their case managers at HIV community based organizations had a better understating of what would be “good” plans for someone with HIV to select. In a few cases it seemed that case managers had such an intimate role in decision making that client’s wishes were dwarfed. For instance, one Los Angeles woman felt she was not in the best plan for her but had selected it based on her case manager’s recommendation. In other cases still, participants felt that case managers had very large case loads and that they had to “stay on them” to receive the assistance they needed, saying that the “squeaky wheel is gonna get the grease” when it comes to case management services. Despite the role case managers played for many, other participants reported that they navigated the enrollment process, including starting an application and choosing a plan, without help or outside resources. Still others stuck some kind of a balance seeking some assistance from case managers and doing other parts of enrollment on their own.
“…well the person who was in charge…he helped me kind of, well he didn’t help me pick, but he gave me information as to what plan would be in-network for [my clinic] because that was important to me, to stay with my doctor.”- Dallas, participant QHP enrollee.
Most faced technical problems with marketplace websites and felt frustrated during the process and these issues are the main reason a few did not enroll. Almost all participants who tried to enroll in a QHP faced some type of technical problem, including those attempting to enroll in the federal marketplace (healthcare.gov) as well as, though to a lesser extent, those attempting to enroll in the state exchanges in both California and New York. These included frozen screens, getting kicked out of the website, having to restart their applications, and very long wait times and uninformed representatives when calling for help. For some individuals, these negative experiences were cited as the reason for not enrolling. One man living with HIV in Atlanta tried to enroll in the fall of 2013, but got frustrated by the glitches and gave up. In December, he had open heart surgery followed by two heart attacks in April. Care for these issues resulted in more than $300,000 in medical bills for which he is now in debt. A man in Dallas, who, in addition to being HIV positive is diabetic, also had problems with the website and was unable to enroll. He is looking forward to attempting to enroll during the second open-enrollment period but as a stop-gap measure is getting HIV care and treatment through the Ryan White Program and insulin from a friend, which he sees as his only way to access this medication. A New York woman also experienced website issues so called the state 800-number where she was helped after a twenty-minute wait but she was ultimately able to enroll. Several California participants spoke of waiting on the phone for hours at a time.
“[The website] said ‘please wait, please wait, please wait’ when everybody was first trying to get [on.] Then I tried for a couple of weeks, different times of the day, middle of the night, early in the morning, and I still was never able to get through. And then I started having health problems and I just kind of forgot about it.” – Atlanta participant, uninsured
Participants were confused about basic insurance terms and were unsure of cost-sharing obligations. Participants’ comfort level with insurance terminology and how to use private insurance varied. While some had previous experience and were fairly insurance savvy, many others had low levels of insurance literacy. Insurance terms such as deductible, premium, and copayment were often used interchangeably. Most participants said they did not have a good sense of what out-of-pocket costs would be for different types of care. This was particularly the case since many enrollees had not yet used their coverage at the time of the focus groups.
Another barrier to QHP enrollment was a lack of understanding of the health needs of people with HIV. In some instances the main barrier was that enrollment workers were unfamiliar with the needs of someone with HIV. A man in Miami says that he gave up after multiple website attempts and after speaking to a navigator who was not knowledgeable about HIV and could not answer his questions. A participant from Texas explained that while he thought those that helped him in the enrollment process were knowledgeable about his HIV related care needs, he was not so sure that they were as knowledgeable about whether the plan could meet those needs. He said, that they were “knowledgeable about the care” he would need, but how that aligned with plan benefits “still kind of like remain[s] to be seen because it was so new.” Another Texas participant was frustrated that marketplace call center operators could only give basic information about plan benefit designs and could not help him make a decision about how different plans might meet his HIV needs.
Participants also reported facing high deductibles and unexpected costs. A few participants say they feel disappointed that they finally have insurance only to have a very high deductible they do not think they can afford. One participant in Texas was very upset when he found out after enrolling that his plan had a $6,000 deductible. He, like other participants, did not understand the concept when he purchased his plan. As a result, he feels like care is unaffordable. At the time of the group he was receiving help with his medication from his community based organization (CBO) but he knew that was a temporary fix and was not sure how he would get his treatment in the longer term. A participant in Miami enrolled in a QHP with a monthly premium of $1.85 after his subsidy; even though he knew the plan came with a $6,000 deductible, he was hoping to avoid using his coverage at all. In addition to HIV, he suffers from chronic migraines and would like to receive care, but says he will manage untreated because he cannot afford the costs. Some participants in this situation were hoping to continue receiving treatment through Ryan White.
“I’ve never had insurance besides the job…and we didn’t have a deductible. I have the $6,350, $6,000 amount for a deductible. And I didn’t know how it worked…Talking to family is how I ended up figuring out: if you get a high deductible, you got to pay that before you’re able to go in and get it for free.” – Dallas participant, QHP enrollee
Aside from deductibles, some faced unexpected costs. One participant had pneumonia which required an ambulance to take him to a hospital that was not in-network, resulting in a bill that he did not anticipate and could not afford. Some faced issues when trying to use their new insurance at the pharmacy before coverage had been activated. One participant in Miami paid his premium but only learned his coverage had not been activated when he was told by his pharmacy that his prescription would cost $1,600, presumably the cost to someone without coverage. He was able to get the issue resolved, although the situation caused him stress and frustration. A New York participant had a similar experience. He says he skipped his HIV medication for a day after his pharmacy told him it would cost almost $2,000. Others still saw some increased prescription costs with their new coverage. A few participants in New York said their co-pays went up with their new coverage and some were able to secure lower cost prescriptions by going to different pharmacies. Some individuals were fearful of prescription costs under their new plans so were putting off using them for pharmaceutical coverage. Other participants discussed receiving help through pharmaceutical company patient assistance programs.
At the time of the focus groups, many QHP enrollees had not yet fully used their coverage and those who had did so mostly for accessing their HIV medications. Still, enrollees felt better protected by being insured. At the time of the focus groups, many participants, particularly those enrolled in QHPs, had not yet had the opportunity to use their coverage for all of their needed care. Most QHP enrollees who had used their coverage say it was primarily for their HIV medication. Participants in the last round of focus groups conducted in New York in September, those who been covered for the longest period of time, had used their coverage most broadly. Many were relying on back supplies for prescriptions and some were still using the Ryan White Program while making the transition to new coverage. Despite having used their coverage to a limited extent and having faced other barriers, participants who enrolled in QHPs say they feel “relief” as a result of having coverage. Some say they have peace of mind for the first time in years both in terms of protecting themselves in case of emergency but also in terms of being able to access more affordable coverage. For instance, a Los Angeles participant explained that in the past he had paid $10,000 per year for coverage on an annual income of only $24,000. He described the fact that the ACA passed as “kind of a dream.” He continued, prior to the ACA“…insurance has been killing me for 15 years…I’ve spent half of my savings from my career that was supposed to be for my retirement on health insurance.” Those that had used their coverage more extensively explained that they had been able to stay retained in care but some experienced changes related to their providers, pharmacies, and drugs.
After enrolling in new coverage, several participants reported more limited networks, and having to switch doctors, and some also switched to generic versions of drugs. Some enrolled in their insurance plans not knowing whether or not their doctor would be covered. As a result, a few found out they had to change to a new physician. In New York, one man was grateful to keep his HIV specialist but was upset by having to change his primary care provider and was unhappy with his new physician. Some say they felt stressed having to establish a relationship with their new doctor and rebuild trust. In California, several participants had issues making sure their HIV provider was able to remain their primary care provider and was not designated a specialist which could make visits more expensive or require a referral. In some cases this required some back and forth with their health center and their new insurer or finding a new primary care provider that could refer cases back to their previous provider. A Texas man found that under his new plan, his provider was designation as a specialist and copays went up for him. He explained that the cost difference has an impact on him but that he is willing to pay the difference as he only sees the doctor every three months. He had not realized this cost difference at the outset and was not sure if it would have been a deciding factor in choosing a new plan if he had known about it when enrolling. In addition to changing providers, a few participants reported switching to the generic form of drugs for non-HIV related conditions.
“…my co-pay for my doctor’s visits changed because my HIV doctor change[d] …to a specialist doctor instead of just a regular doctor…it went up to office visits from being under the new plan, instead of $10, it’s $60 for each doctor visit.” –Dallas participant, QHP enrollee
“I had more choices of doctors [in the past]. Now it’s like it’s, I’d say it’s cut in half. Like it’s, I don’t have that many options. And all of the doctors too that I used to use, like regular doctors, my GYN, doctors I used to use in the past, I tried looking for them and none of them are in [my new plan].” – New York City participant, QHP enrollee
Not all of those in the focus groups were able to successfully enroll in QHPs, largely because they lived in a non-expansion state and fell into the “coverage gap.” A few got as far as seeing the price of plans (without a subsidy since they were below 100% FPL) and say they quit the process because the premium amount was far outside their budget. Before learning she was in the “coverage gap” and exempt from the tax penalty, one woman in Georgia, a non-expansion state, decided she would rather pay a fine and not enroll in coverage after seeing that her premium would be $180 a month. One participant planned to enroll in marketplace coverage but when he saw unaffordable premiums, changed his mind. Later he noticed an advertisement in the community that conveyed very affordable coverage, not knowing he was seeing higher premiums because he was ineligible for subsidies, he thought he might have done something wrong so tried again but saw the same unaffordable price. In another instance, a man in Texas, also a state not expanding its Medicaid program, signed up for coverage but realized he could not afford his medication when he went to the pharmacy. When he told the CBO he uses about the situation, he was informed that he should never have signed up, as he did not qualify for a subsidy. Others reported not even trying to enroll because they were told they would not qualify for affordable coverage. These individuals plan on continuing to rely on the Ryan White Program for their HIV care and treatment. Some enrollees weighed the cost of premiums against other household expenses and decided they were not able to prioritize the expense.
“[A navigator or assister] said I fell below the level that they were looking for, I think like, it was like $11,500. My gross income was like $10,800, so there was no sense in me trying to apply for it. So after she said [that], I just left it alone.” – Atlanta participant, uninsured
“I could not afford a $200 [premium] and then afford to send [my kids] to school, make sure [there is] food put on the table, lights paid. They’ll turn the power off, if you don’t pay the bill, so I got to pay them.” – Atlanta participant, uninsured
Experiences with Medicaid
Two groups were held with people with HIV who enrolled in new Medicaid coverage in the two states expanding that program, California and New York. In addition, the views of people with HIV in the three states not expanding Medicaid were also captured.
In California, most participants with HIV had been enrolled in the Low Income Health Program (LIHP), a precursor to Medicaid expansion run by participating counties. For these enrollees, case managers helped with seamless transitions to Medi-Cal (California’s Medicaid program). Despite some of the widely publicized problems Californian’s have faced with Medicaid enrollment, including the substantial backlogs, none-of the participants in the Medicaid group in this state shared those experiences. This may have been in part because LIHP transitions were supposed to happen automatically bypassing parts of the enrollment process. All participants worked with a case manager to transition to Medi-Cal from their previous programs, including the RWP and Healthy Way LA (the Los Angeles LHIP program). Most participants were in Healthy Way LA prior to Medi-Cal coverage and transitioned fairly easily. Some described transitioning without having to do anything at all while others talked about having to do paperwork with case managers. One individual described being enrolled into Health Way LA in November 2013 as a way to ensure that they transitioned to Medi-Cal coverage in 2014. A few enrolled directly into Medi-Cal. No participants reported any significant problems with the enrollment process, though those transitioning from Healthy Way LA to Medi-Cal were sometimes confused about the transition taking place. Several described receiving plan pamphlets and booklets in the mail but not knowing if they needed to do anything with them. Some said that they were overwhelmed at first, but their case managers were able to walk them through the process. While New York also had an early Medicaid expansion ahead of the program under the ACA, no participants reported being a part of that cohort.
Similar to those who enrolled in QHPs, most who enrolled in Medi-Cal / Medicaid assumed their HIV-specific care needs would be covered. Participants are very grateful to have had support from case managers and relied heavily on them to navigate enrollment and get their questions answered. In Los Angeles, much of participants’ knowledge came from their caseworkers, including whether or not their medications would be covered. One participant went so far as to refer to case managers as also being “benefits counselors.”
“In addition to being the case manager, they’re really benefits counselors. So if I have a question about whatever and I don’t even understand it, I know that I can defer to them…. I’m really grateful that we have case managers here.” – Los Angeles participant, Medi-Cal enrollee
“It would be a nightmare [if my case manager did not help me enroll in Medi-Cal]… The volume of paperwork, the bureaucracy, fear about my medical care… and continuity of care.” – Los Angeles participant, Medi-Cal enrollee
Most participants in New York also had some form of help enrolling in Medicaid, which contributed to a fairly easy enrollment process but fewer reported that support coming from a case manager. In New York, several enrolled through clinics and CBOs, some with LGBT and HIV expertise, which gave them assurance that all of their HIV care would be considered in making enrollment decisions, including the HIV/AIDS Services Administration (HASA). One participant signed up over the phone, and another participant received a package in the mail and submitted a paper application. Several New York participants reported checking with providers about their networks and selecting a plan recommended to them. In the case of one New York man, a parole officer helped him with enrollment. None reported being in one of New York’s pre-ACA Medicaid programs for non-disabled adults prior to enrolling in a Medicaid expansion plan.
Participants who had enrolled in the Medicaid expansion had used their coverage more broadly than those enrolled in QHPs. Participants discussed having used Medicaid coverage to access both HIV and non-HIV medications and none reported having to switch regimens. When asked if he had used his coverage for HIV medications yet, one New York participant responded that yes, “that’s especially what they’re for.” Barriers that surfaced for participants were relatively minor and most acknowledge they were easily surmountable. One participant discussed having to switch from a combination drug for a dermatological problem to two separate drugs but he was grateful that his pharmacist was able to find a way to fill the prescription so it was covered. Participants also were able to use their Medicaid coverage to see their same doctors, though one participant reported having to switch back to his regular provider after an auto-assignment placed him with someone new. He said that it was an easy change and that it probably would not have happened if he had been more proactive during enrollment. One individual reported now having to get labs drawn at an offsite laboratory rather than at his clinic which was frustrating for him at first. Overall though, the process of using coverage for Medicaid enrollees was a fairly smooth one.
Those who newly enrolled in Medicaid, but had only had Ryan White for care in the past, felt reassured by having new coverage. While many felt they could rely on the Ryan White program to help address their HIV care needs, other health problems sometimes went untreated. Enrollees reported feeling secure knowing that they would be able to receive non-HIV care if they faced an unexpected accident or illness. Some say they have more opportunities to receive care and can now be more proactive about their health. Several have chronic health issues and some talked about now being able to care for those needs. One participant who lost his job and private health insurance qualified for Medi-Cal under the expansion. As a result, he is able to get physical therapy and pain medications to care for injuries from an accident he had two years ago and is now considering returning to work.
“I’ve had sciatica for the last seven years…then I was hit by a car two years ago and my back’s been in a lot of pain ever since. I’m just now getting physical therapy and pain management because of Medi-Cal. And the doctor was able to make referrals and I was able to get connected to great services and it’s just been wonderful.” – Los Angeles participant, Medi-Cal enrollee
On the other hand, focus group participants who lived in non-expansion states say they feel scared and lack security as a result of being uninsured. While they say the RWP program is vital for accessing HIV-related care, participants worry about accidents or an unexpected illness unrelated to their HIV status. Several are managing other serious conditions that they lack any form of coverage for including cancer and diabetes, to name a few. They worry about the impact of needing care, without coverage, on their lives and their families. Some say they feel as though they are treated as “second-class” without insurance and believe they receive lower quality care when they try to seek it. Several say being uninsured aggravates their anxiety because they do not know where they would go if something went wrong.
Nearly all uninsured participants in non-Medicaid expansion states, who would otherwise have been eligible, express anger with their state’s decision not to accept funds to expand Medicaid and say they would enroll if their state later chose to expand the program. Many are aware of their state rejecting funds to expand Medicaid and they direct their frustration specifically toward their governor. Participants feel angry and frustrated that people who are most in need do not have options. Many described feeling as though they had been left out or “written off.” They also are upset that people like them in other states receive coverage, while their state rejects available funds. Right now, uninsured participants feel limited in where they can go for services and many say they currently receive substandard care. They say Medicaid coverage would enable them to take a more active role in addressing their health problems by seeing more diverse physicians and receiving the types of care they are not currently able to. Participants say Medicaid would provide a security blanket and could help reduce the stress in their lives.
“[Medicaid would give] an opportunity to see diverse physicians. It takes a lot of stress off of you, being able to [get care] if needed.” – Atlanta participant, uninsured
The Role of the Ryan White Program
Participants in all groups discussed the Ryan White Program and in most instances reported a strong connection to the program. The extent to which individuals relied on Ryan White for their care needs varied and was directly related to whether they had access to other forms of coverage or were transitioning to new coverage.
The Ryan White HIV/AIDS Program has played a major role for participants in accessing HIV care in both Medicaid expansion and non-expansion states. Most participants in the focus groups have relied on the RWP for HIV care at some point. A smaller share of participants did not report a connection to the program. Many participants who enrolled in new coverage due to the ACA were receiving care through the RWP before and during the enrollment process. Most participants who remain uninsured still rely on the RWP for primary care and treatment. Without the RWP, these participants say they would be unable to manage their disease and get their essential HIV medications. Participants, but especially those in non-expansion states, place enormous value on the Ryan White Program. They explained that getting care through the RWP provides them with a sense of security that, at the very least, their HIV care needs will be met. However, those who did not enroll in new coverage are cognizant that Ryan White does not meet all their care needs and worry about how they will address non-HIV health problems. For example, one participant in Florida has mental health issues for which she is going untreated, coupled with just finding out she has a recurrence of cancer. She says “all I need is therapy and cancer care,” yet does not know how to get either without health care coverage. Another Florida participant had to stop seeing his psychiatrist because he lost his coverage.
“I had cervical cancer and by me not having insurance, I can’t go take care of myself. I just found out two weeks ago… that it’s back….But by me not having Medicaid …I can’t even go see about myself…I mean Ryan White takes care of my medication, but …I can’t take care of myself…So I just have to sit there, in pain, I’m hurting, I can’t do anything…I don’t have no insurance. I can’t see [the doctors] and honest to God, I need my therapy and I need to go see the oncologist.”-Miami participant, uninsured
Most did not face any disruption in HIV-related care during the enrollment process, in part because the RWP acted as a safety net during this time. As they transitioned to coverage, many people continued to rely on the RWP to avoid interruptions in their care, particularly around medications. Participants who experienced confusion, delays in premium assistance (discussed below), or other enrollment hurdles continued to receive care and medications via the RWP until they knew they were fully covered. In some cases this meant providing care after enrolling in new coverage but before it was activated or before the participant had learned to use it. In other cases this meant filling in when an individual enrolled in a plan without knowing that out-of-pocket costs would be unaffordable. For instance, one participant who enrolled in plan without knowing he had a $6,000 deductible learned his two HIV medications would $2,000 per month when he went to the pharmacy to pick them up. He couldn’t afford this so turned to the AIDS Drug Assistance Program (ADAP), the component of the Ryan White Program that assists clients with accessing treatment and costs related to insurance coverage, to ensure he could continue getting the medication he needed.
Ryan White provides a sense of security that some participants do not feel with their new plans and some are confused about RWP’s role now that they have coverage. The RWP has given many participants a sense of security that, no matter what happens, they will always be able to get the HIV care they need. Many place tremendous value on the program with one Atlanta woman stating “without Ryan White I couldn’t afford the drugs that keep me alive.” With new coverage, however, several are confused about the role of the RWP. Some want to continue receiving care through the RWP. Several worry that their coverage will not be adequate or affordable. One participant in Atlanta had just received news from her pharmacy that ADAP would no longer cover her medications since she had a QHP. She is alarmed because she had assumed ADAP would continue covering her medications. With the news, she is worried about what her out-of-pocket costs will be under her new plan and whether she can afford them.
A key role played by Ryan White for some participants was the provision of premium support to help with the cost of new coverage. Providing premium assistance through Ryan White, an authorized use of Ryan White funds and one encouraged by the Department of Health and Human Services in the context of the ACA, helps HIV positive individuals with low to moderate incomes obtain affordable health insurance. Such assistance is often needed even for those who also receive subsidies in the health care marketplace. Several focus group participants with HIV in California reported that they were able to get help paying their premiums through the state run ADAP, a component of the Ryan White Program. Some clients vocalized that without the state’s Ryan White program stepping in to assist with the cost of HIV prescriptions and premiums, they would not be able to afford coverage. One California participant receiving premium assistance said that without the additional help, coverage “would be way too expensive for me to, I wouldn’t be able, not even close to affording it.”
New York participants were largely unaware of the Ryan White premium assistance even though it appeared that some might be eligible. No participants in the New York QHP group were receiving premium support but when the issue was discussed in the group, several expressed interest in the program, saying it would bring needed relief. While smaller or pilot programs were operating in Georgia and Florida at the time of the focus groups, no participants in those groups were receiving premium assistance through ADAP in those states and Texas’ ADAP program does not support QHP coverage. Some participants did however report receiving premium assistance from alternative sources such as local community based organizations (CBOs) and county offices.In one instance in Dallas, an individual decided to stop receiving premium support from his CBO because he felt he could manage costs on his own with subsidized coverage under the ACA.
“[Having access to premium assistance] would mean relief. It would make me feel less stressful. Um, I feel like I’m proactive with my health in terms of taking my medications and things like that, but I don’t feel like I’m as proactive in terms of actually going to the doctor regularly and checking my counts and my levels and I don’t think I’m as good at going to the doctor as I could be. But I feel like it’s a lot of it is because every time I go to the doctor I feel like I get hit with a bill…” New York City participant, QHP enrollee
Despite the importance of premium support, many faced significant challenges in negotiating this process in the early months. While Ryan White premium assistance may have helped make insurance more affordable, enrolling in that support was in many cases very challenging. In California, several participants who enrolled in a QHP with premium assistance through the RWP had help from case managers or in-person assisters who connected them with the assistance. For some the process of getting premiums paid was problematic. Several participants received initial premium bills from their new QHP and were confused about whether they should pay or ignore the bills. They could not get clear answers from any source, including case managers. Some participants tried to resolve the issue by navigating communications with the marketplace, their new insurer, and ADAP on their own. One participant said that while ADAP paid their premiums six months in advance their issuer continued to send monthly bills to their residence and when they questioned their issuer, they were told to ignore the bill.
Other participants discussed having to front premiums for several months while ADAP premium support was processed. For one participant, the delay and confusion had severe consequences. After she enrolled in her plan in early 2014, she spent hours in communications with her insurer, RWP’s ADAP office, and the marketplace trying to resolve premium payment issues. On several occasions, her insurer had no record of her at all, while the marketplace assured her that she was enrolled. On one call to her issuer she learned that her enrollment had never been processed at all because her premium payment from ADAP had not been received. During these first few months, when she was waiting on her enrollment to be processed and her first premium paid by ADAP, she was admitted to the emergency room for an asthma attack (care for which she was putting off while uninsured). Her emergency room expenses that totaled $5,000 and were her responsibility as her insurance had not yet been processed when she fell ill. She says the entire experience has been incredibly stressful and time consuming.
“I don’t know what really happened. ADAP was supposed to pay for the premiums. That check was never received, I guess. The problem is that when you call, you don’t get any information from [the issuer]. You call ADAP and they tell you, ‘oh, we paid that already.’ So that went on for several months, like three months.” – Los Angeles participant, QHP enrollee
Conclusion
The HIV positive participants in this study demonstrated that the ACA’s health insurance expansions are already playing a role in the lives of many; even those who remained uninsured know about the law and new coverage opportunities. The themes that rise out of these focus groups show that implementation will take time. Some participants have already navigated care transitions with relative ease and have found comfort in new coverage but many HIV positive participants are still figuring out how new coverage opportunities might meet their HIV care and treatment needs; others still have not yet enrolled. For many participants, the Ryan White HIV/AIDS Program continues to play an important role under the ACA, including helping in their transition to new coverage, helping them to afford new coverage through premium support, and serving as the safety net for those who remain uninsured. Taken together, the experiences of focus group participants help to shed light on how people with HIV are navigating a new health care environment, including how new coverage may be affecting their HIV care and treatment. Understanding these challenges and successes is important for assessing the implications of the ACA for a particularly vulnerable group of individuals who have often faced barriers to accessing care in the past and for informing policymakers, providers, and client advocates seeking to help people with HIV gain new coverage and achieve optimal health outcomes.
This issue brief was prepared by Jennifer Kates and Lindsey Dawson of the Kaiser Family Foundation and Tresa Undem and Kathleen Perry of PerryUndem Research and Communication.
The authors of this study would like to express their sincere gratitude to the focus group participants for sharing their time and their stories and to the staff at the CBOs who helped with recruitment and group logistics.
Appendix
Methodology
The Kaiser Family Foundation and PerryUndem conducted ten focus groups in five states – California, Florida, Georgia, New York, and Texas. Within these states, focus groups were conducted in the cities of Los Angeles, Miami, Atlanta, New York City, and Dallas. The states were chosen for geographic diversity, burden of the epidemic, and varying state approaches to health reform implementation, including Medicaid expansion decisions. Two of the states – California and New York – have moved ahead with Medicaid expansion while the remaining three – Florida, Georgia, and Texas – have not; in addition, California and New York have chosen to run their own marketplaces while Florida, Georgia and Texas have defaulted to the federally-facilitated marketplace. Five of the focus groups were conducted among participants who (successfully or unsuccessfully) attempted to enroll in a Qualified Health Plan (QHP) through the ACA. Two groups were conducted among participants newly enrolled in Medicaid coverage through the ACA. Three were conducted among uninsured participants in non-expansion states (See Table 1).
All focus group participants were age 18 and older. A total of ninety individuals participated in the focus groups, which were racially and ethnically diverse and represented a range of sexual orientations and gender identities. The groups were predominantly male but female participants were also represented. All groups took place between June and September of 2014 after the close of the first open enrollment period (which was intended to end on March 31, 2014 but was extended to mid-April in most marketplaces). As such, they represent the experiences of participants during that period only. Given that the groups were conducted fairly early into participants experience with coverage, some had not fully used their new insurance and the findings presented here are limited to that extent. All participants were recruited using professional focus group facilities and community based organizations (CBOs), and groups took place within both settings. Participants and CBOs were compensated for their participation.
It is important to note that while focus groups are helpful for exploring experiences and themes around a given subject and enhancing our understanding of a particular phenomenon, they are not intended to offer definitive explanations or answers and are not necessarily representative of the entire population being studied.
Endnotes
Myron S. Cohen, et al. u201cPrevention of HIV-1 Infection with Early Antiretroviral Therapy.u201d New England Journal of Medicine. 365(2011):493-505. ↩︎
Heather Bradley, et al. Centers for Disease Control and Prevention. u201cVital Signs: HIV Diagnosis, Care, and Treatment Among Persons Living with HIV u2014 United States, 2011.u201d Morbidity and Mortality Weekly Report. 63(47);1113-1117. November 28, 2014. ↩︎
Myron S. Cohen, et al. “Prevention of HIV-1 Infection with Early Antiretroviral Therapy.” New England Journal of Medicine. 365(2011):493-505. ↩︎
Heather Bradley, et al. Centers for Disease Control and Prevention. “Vital Signs: HIV Diagnosis, Care, and Treatment Among Persons Living with HIV — United States, 2011.” Morbidity and Mortality Weekly Report. 63(47);1113-1117. November 28, 2014. ↩︎
Centers for Disease Control and Prevention. “Diagnoses of HIV Infection in the United States and Dependent Areas, 2012.” HIV Surveillance Report, 2012. vol. 24. November 2014. http://www.cdc.gov/hiv/library/reports/surveillance/. ↩︎
Heather Bradley, et al. Centers for Disease Control and Prevention. “Vital Signs: HIV Diagnosis, Care, and Treatment Among Persons Living with HIV — United States, 2011.” Morbidity and Mortality Weekly Report. 63(47);1113-1117. November 28, 2014. ↩︎
Myron S. Cohen, et al. “Prevention of HIV-1 Infection with Early Antiretroviral Therapy.” New England Journal of Medicine. 365(2011):493-505 ↩︎
Heather Bradley, et al. Centers for Disease Control and Prevention. “Vital Signs: HIV Diagnosis, Care, and Treatment Among Persons Living with HIV — United States, 2011.” Morbidity and Mortality Weekly Report. 63(47);1113-1117. November 28, 2014. ↩︎
See for example: Jayanta Bhattacharya, Dana Goldman, and Neeraj Sood. “The Link Between Public and Private Insurance and HIV-related Mortality.” Journal of Health Economics, 22:6(2003):1105–22; Amy Finkelstein, et al. “The Oregon Health Insurance Experiment: Evidence from the First Year.” The Quarterly Journal of Economics, 127:3(2012): 1057-1106.; Melissa Majerol, Vann Newkirk, and Rachel Garfield. Kaiser Commission on Medicaid and the Uninsured. he Uninsured: A Primer – Key Facts About Health Insurance and the Uninsured in America. December 2014. Available at https://modern.kff.org/uninsured/report/the-uninsured-a-primer/.; Patrick Sullivan, et al. “Time to First Annual HIV Care Visit and Associated Factors for Patients in Care for HIV Infection in 10 US Cities.” AIDS Care. Vol. 23 10(2011): 1314-1320; and Baligh R. Yehia, et al. “Sustained Viral Suppression in HIV-Infected Patients Receiving Antiretroviral Therapy.” JAMA, 308:4(2012): 339-42. ↩︎
Kaiser Family Foundation analysis of CDC surveillance data: Centers for Disease Control and Prevention. “Diagnoses of HIV Infection in the United States and Dependent Areas, 2012.” HIV Surveillance Report, 2012. vol. 24. Nov. 2014. http://www.cdc.gov/hiv/library/reports/surveillance/. ↩︎
Department of Health and Human Services, Health Resources and Services Administration, HIV/AIDS Bureau. Ryan White HIV/AIDS Program 2012 State Profiles. Accessed 12-10-14: http://hab.hrsa.gov/stateprofiles/↩︎
Department of Health and Human Services, Health Resources and Services Administration, HIV/AIDS Bureau. Policy Clarification Notice 13-04: Clarifications Regarding Clients Eligible for Private Health Insurance and Coverage of Services by Ryan White HIV/AIDS Program. Revised September 2013. Available at: http://hab.hrsa.gov/manageyourgrant/pinspals/pcn1304privateinsurance.pdf↩︎
E.G. Bing, et al. “Psychiatric Disorders and Drug Use Among Human Immunodeficiency Virus-Infected Adults in the United States.” Archives of General Psychiatry. 58:8(2001),721-8. ↩︎
Michael J. Mugavero, K. Rivet Amico, Tim Horn, and Melanie A. Thompson. “The State of Engagement in HIV Care in the United States: From Cascade to Continuum to Control.” Clinical Infectious Diseases.57:8(2013):1164–71. ↩︎
A new report from the Kaiser Family Foundation examines the role of both Medicare and the Indian Health Service (IHS) in providing access to health care for about 650,000 American Indians and Alaska Natives who are age 65 and older or who have permanent disabilities. While Medicare provides important health care coverage for most in this group, its relatively high cost-sharing and gaps in benefits can be problematic for American Indians and Alaska Native Medicare beneficiaries who do not have additional supplemental coverage or who cannot access IHS providers.
Using the most recent data available, this report shows that elderly American Indians and Alaska Natives face persistent disparities in health status, access to health care, and other socioeconomic disadvantages relative to the overall U.S. population age 65 and older. The report explains the intersection of Medicare and the IHS in health service reimbursement, patient cost sharing, and access to care, and then discusses the implications of potential barriers to enrollment in federal or state programs that could assist American Indians and Alaska Natives with out-of-pocket expenses for health care. It concludes with a discussion of some of the future challenges and opportunities for improving access to care for American Indians and Alaska Natives through Medicare and the IHS.
A previous brief provides an overview of health coverage and care for American Indians and Alaska Natives in 2013, as well as an examination of the potential implications of the ACA coverage expansion. The new report, as well as more information on Medicare and disparities between populations in health and access to care, can be found at kff.org.
Relative to the overall U.S. population, American Indians and Alaska Natives face persistent disparities in health status, access to health care, and other socioeconomic disadvantages, including higher rates of poverty. Even with Medicare coverage, American Indians and Alaska Natives who are age 65 and older or who are living with permanent disabilities experience these problems at comparatively high rates.
This report, divided into four sections, examines these disparities and describes the roles of both the Indian Health Service (IHS) and Medicare in providing access to health care for American Indians and Alaska Natives. The first section draws from recent surveys and other data sources to compare health and other socioeconomic indicators among elderly American Indians and Alaska Natives to the overall population age 65 and older. The second section of this report describes the ways that IHS and other sources of coverage (including Medicare, Medicaid, and private insurance) may and may not provide access to health care services for elderly and disabled American Indians and Alaska Natives. The third section explores the intersection of Medicare and the IHS in health service reimbursement, patient cost sharing, and access to care, and then discusses the implications of potential barriers to enrollment in federal or state programs that could assist American Indians and Alaska Natives with out-of-pocket expenses for health care. The report concludes with a discussion of some of the future challenges and opportunities for improving access to care for American Indians and Alaska Natives through Medicare and the IHS.
Main Findings
Section 1 — Key characteristics of American Indians and Alaska Natives who are age 65 and older or living with permanent disabilities
Among the 5.2 million people who self-identify as either partly or solely American Indian or Alaska Native, approximately 450,000 are age 65 or older. Another 200,000 are under age 65 and living with a long-term disability or health condition which qualifies them for Medicare.
American Indians and Alaska Natives live throughout the country, but are generally concentrated in certain geographic areas, with more than one-third of elderly American Indians and Alaska Natives living in four states (California, Oklahoma, Texas and Arizona).
American Indians and Alaska Natives age 65 and older have higher rates of poverty, report poorer health, and report problems accessing care more often compared with the overall U.S. population age 65 and older. Five times as many elderly American Indians and Alaska Natives report that cost issues made them forego medical care, compared with the overall U.S. population age 65 and older.
Section 2 — Roles of the IHS, Medicare, and other sources of coverage for American Indians and Alaska Natives
The IHS, which is subject to annual appropriations, is the principal federal agency that fulfills the U.S. government responsibility to provide health care services to American Indians and Alaska Natives.
The IHS provides and funds health care services—mostly primary care—to eligible American Indians and Alaska Natives through a variety of facilities operated by either the IHS, tribal entities, or Urban Indian Health Programs (collectively referred to as I/T/Us). The majority of these facilities are in rural areas, typically on or near reservations. When service demands exceed available funds, IHS-funded services are prioritized or rationed, especially for contracted services in the purchased/referred care (PRC) program.
Medicare provides health care coverage to people ages 65 and older (if they or their spouse have made payroll tax contributions for 10 or more years) and to younger adults with permanent disabilities or other qualifying health conditions, such as end-stage renal disease. The majority (96%) of American Indians and Alaska Natives age 65 and older have Medicare coverage, according to analysis of the ACS, but other surveys provide lower estimates. Almost one-third (32%) of American Indian and Alaska Natives with Medicare are under age 65—double the proportion found in the overall Medicare population.
Almost one in four (24%) elderly American Indians and Alaska Natives with Medicare also report having Medicaid—with full benefits (full duals), or partial benefits through the Medicare Savings Programs. More than a quarter (28%) of elderly American Indians and Alaska Natives with Medicare have no supplemental coverage, which means they are exposed to Medicare’s out-of-pocket cost sharing requirements unless receiving services from I/T/Us.
Section 3 — The Intersection between the IHS and Medicare in access and coverage for American Indians and Alaska Natives
About a quarter (23%) of all American Indians and Alaska Natives with Medicare also list IHS as a “source of coverage.” This share is proportional to the percent living on reservations or designated land trusts.
In general, I/T/Us may not charge patients any cost sharing, but because IHS is a payer of last resort, its facilities are expected to seek reimbursement from third-party insurers when applicable. In the aggregate, IHS facilities will collect an estimated $217 million in Medicare reimbursements for services they provide to Medicare beneficiaries in 2014. Though a relatively small part of their operating budgets, these collections are important sources of revenue for these providers, given the fiscal pressures inherent in their IHS funding.
Medicaid, Medicare Savings Programs, and Medicare Part D low-income subsidies (LIS) for prescription drug coverage can play an important role in lowering cost sharing for American Indians and Alaska Natives with Medicare. However, researchers have identified several barriers to enrollment in these programs, some of which are unique to American Indians and Alaska Natives, but many of which are shared among vulnerable populations, more generally.
Section 4 — Future opportunities and challenges
Some opportunities exist within Medicare and the IHS to enhance access to care for American Indians and Alaska Natives. For example, new Medicare initiatives to coordinate care in rural areas could lead to better integration of services for American Indians and Alaska Native beneficiaries. Also, I/T/Us, including pharmacies, may have some opportunities to increase their collections from third-party insurers (including Medicare) in future years—given anticipated increases in both the American Indian and Alaska Native population age 65 and older, most of whom will have Medicare, and increasing coverage under the Affordable Care Act (ACA).
This report pulls from a variety of data sources to examine health status, access to care, and coverage among American Indians and Alaska Natives who are age 65 or older or living with permanent disabilities. While this review is comprehensive, data limitations, including small sample sizes and longstanding problems with identifying race in Medicare claims and administrative files, nevertheless, make it difficult to ensure a full understanding of the health and coverage needs of this population.
Report
SECTION 1: Key Characteristics of American Indians and Alaska Natives who are Age 65 and Older or Living with Disabilities
Among the 5.2 million people who identify themselves as either part or solely American Indian or Alaska Native, about 450,000 are age 65 or older. In total, based on the American Community Survey (ACS), about 1 percent of the U.S. population age 65 and over is American Indian or Alaskan Native, of whom about half report their race as solely American Indian or Alaska Native, and half report it in combination with another race. Women comprise a little more than half (56%) of the elderly American Indian and Alaska Native population—a rate that mirrors the overall U.S. population age 65 and over. (Limitations of the ACS and other data sources are discussed in text boxes 1 and 2).
The proportion of elderly people among American Indians and Alaska Natives is smaller compared with the proportion in the overall U.S. population. Specifically, 9 percent of American Indians and Alaska Natives are age 65 and older, compared with 14 percent in the overall U.S. population. This difference reflects a younger median age and shorter life expectancy among American Indians and Alaskan Natives, attributable in large part to health disparities described later.1By 2060, the number of American Indians and Alaska Natives age 65 and older is projected to more than quadruple, growing to about 2 million—a rate that is nearly two times greater than the overall U.S. population age 65 and older.2
Another 200,000 American Indians and Alaska Natives under the age of 65 are living with a long-term disability (for which they receive Social Security Disability Insurance benefits) or a health condition, such as end stage renal disease, which qualifies them for Medicare. Approximately 4 percent of American Indians and Alaska Natives under age 65 are enrolled in Medicare—similar to the 3 percent observed in the overall U.S. population. From self-reported data in the ACS and other surveys, it is difficult to determine the number of non-elderly American Indians and Alaska Natives living with long-term disabilities who might meet the requirements for Social Security Disability Insurance, but are otherwise not enrolled in Medicare.
Older American Indians and Alaska Natives live throughout the country, but are concentrated in certain geographic areas. More than a third (35%) of all American Indians or Alaska Natives age 65 and older live in four states (California, Oklahoma, Texas and Arizona), and about half live in 8 states (Figure 1) (Appendix Tables 1-2). States with the highest concentration of American Indians and Alaska Natives among their 65 and older population are: Alaska, Montana, New Mexico, Oklahoma, and South Dakota. While about 40 percent of American Indians and Alaska Natives live in rural areas, only 22 percent currently live on reservations or land trusts.3 The remaining share lives in metropolitan or rural areas that are located outside of reservations or Land Trusts.4 The proportion of American Indians and Alaska Natives living away from reservations has grown steadily over time and this demographic shift is expected to continue.5 (Data specific to the share of elderly American Indians and Alaska Natives living on reservations are difficult to verify, but as described later in this paper, about a third of Medicare beneficiaries report IHS as a source of health coverage, which may reflect their proximity to reservations and land trusts.) When American Indians and Alaska Natives live far from reservations, they may have little to no access to IHS-funded services, given the comparatively small scope of the Urban Indian Health Program described later in this issue brief.
Figure 1: American Indians and Alaska Natives, age 65 and older, live throughout the country, but are concentrated in certain states
Regardless of age, some American Indians and Alaska Natives belong to a federally-recognized tribe, some belong to a state-recognized tribe, and others are not members of a tribe. There currently are 566 federally-recognized sovereign tribes and more than 100 state-recognized tribes in the United States.6 Each tribe has its own eligibility requirements and unique customs and beliefs and more than 200 tribal languages are still spoken. Federally-recognized tribes share a government-to-government relationship with the federal government based around the “Federal Trust Responsibility.”7 Treaties and laws have established the federal government’s responsibility to provide federally-recognized tribes certain rights, protections, and services, including health care.In addition to American Indians and Alaska Natives who are members or descendants of members of federally-recognized tribes, IHS services are also authorized for “persons of Indian descent residing in the community being served.”8
Disparities in Income, Education, Health, and access to care
Compared to the overall U.S. population age 65 and older, American Indians and Alaska Natives in this age group have higher rates of poverty and lower educational levels. Analysis of the ACS shows that, among people age 65 and over, 16 percent of American Indians and Alaska Natives report incomes that are at or below the federal poverty level, compared with 10 percent overall.9 Among younger American Indians and Alaska Native adults who qualify for Medicare because of a disability or other health condition, such as end stage renal disease, an even higher share (35%) report living in poverty. With regard to educational attainment, nearly three in ten (27%) American Indians and Alaska Natives age 65 and older did not complete high school, compared to about two in ten (19%) in the overall U.S. population age 65 and older.
Elderly American Indians and Alaska Natives report having health problems at higher rates than the overall U.S. population age 65 and older. Turning to other surveys that focus on health issues, 39 percent of American Indians and Alaska Natives age 65 and over describe their overall health status as “fair” or “poor,” compared with a little more than 26 percent in the overall population age 65 and older (Figure 2). Further, elderly American Indians and Alaska Natives are hospitalized during the year at twice the rate of the overall population age 65 and older (33% vs. 16%), consistent with having higher rates of certain health problems (Figure 3). For example, nearly a third of American Indians and Alaska Natives age 65 and over report having diabetes, compared with 22 percent in the overall 65+ population. While the prevalence of coronary heart disease is comparable between these groups, the share of elderly American Indians and Alaska Natives with a previously diagnosed stroke or heart attack is higher compared with the overall population age 65 and older. Elderly American Indians and Alaska Natives also report more frequently that they suffered depression at some point in their lives, consistent with other research showing higher rates of mental illness among non-elderly American Indians and Alaska Natives.10
Figure 2: Elderly American Indians and Alaska Natives report poorer overall health compared with the general 65+ populationFigure 3: Among people age 65 and older, American Indians and Alaska Natives are more likely to have a hospital stay and certain health conditions
Limitations in activities of daily living are also more common among elderly American Indians and Alaska Natives than among the overall U.S. population ages 65 and older. Approximately one-third of American Indians and Alaska Natives age 65 and older report trouble walking—nearly twice the rate observed for the overall population in this age group (Figure 4). Difficulties with other tasks, such as eating and dressing, bathing/showering are also more common for older American Indians and Alaska Natives. Not surprising, researchers have found that higher rates of functional limitations with activities of daily living are often associated with greater health needs.11 (Other surveys, with slightly different survey questions, show rates of functional limitations that are slightly higher).12
Figure 4: Difficulties with activities of daily living are more common among elderly American Indians and Alaska Natives
A higher share of elderly American Indians and Alaska Natives report problems accessing care compared with the overall population age 65 and older. Given the health needs of elderly American Indians and Alaska Natives, access to timely care is especially important for treatment of chronic conditions and other medical needs. As with the whole U.S. population age 65 and older, Medicare plays a key role for elderly American Indians and Alaska Natives in gaining access to health services. Nevertheless, elderlyAmerican Indians and Alaska Natives report barriers to care more frequently than the overall population age 65 and older, particularly due to long wait times, lack of transportation, and cost (Figure 5). For example, compared to the general population age 65 and older, five times as many elderly American Indians and Alaska Natives reported that cost issues made them forego medical care—a likely reflection of their higher rates of poverty. Other associated access problems are harder to identify, but could include longer wait times in settings that provide care to medically underserved populations and challenges with transportation in remote and rural areas.
Figure 5: Elderly American Indians and Alaska Natives experience greater barriers accessing care
SECTION 2: Roles of the IHS, Medicare, and Other Sources of Coverage for American Indians and Alaska Natives
Role of the Indian Health Service
The IHS is the principal federal agency that fulfills the U.S. government responsibility to provide health care services to American Indians and Alaska Natives, regardless of whether or not they have health insurance coverage, including Medicare. Under this unique obligation, the Congress annually appropriates funds to the IHS—a federal agency within the Department of Health and Human Services—to deliver health care services to American Indians and Alaska Natives through a variety of facilities operated by either: the IHS, tribal entities, or Urban Indian Health Programs (I/T/Us). The overall mission of the IHS is to raise the physical, mental, social, and spiritual health of American Indians and Alaska Natives to the highest level. Health care provided through IHS- and tribally-operated facilities is largely limited to members or descendants of members of federally-recognized tribes, who live on or near federal reservations and therefore have access to the facilities. In Alaska, tribally-operated health care facilities are located throughout the State and are not reservation based. 13 A small portion of IHS funding also supports Urban Indian Health Organizations to provide health care services to American Indians and Alaska Natives who may not live on or near reservations.
The IHS funds and provides health care and disease prevention services to American Indians and Alaska Natives, including those who may also be covered by Medicare, through a network of hospitals, clinics, pharmacies, and contractors.Patients at I/T/Us are generally not charged or billed for any portion of the services they receive, regardless of their insurance status. IHS funds 632 health care facilities, which are operated by either tribes or IHS. These facilities are located mostly on or near reservations.14 In addition, the IHS funds 35 Urban Indian Health Organizations in 57 sites located in cities throughout the U.S.15 Almost half (45%) of all Urban Indian Organizations are Federally Qualified Health Centers, serving other underserved populations as well.16
When IHS- or tribally-operated facilities are unable to provide needed care, the IHS has a limited budget to contract with outside providers to furnish health care services through the Purchased/Referred Care (PRC) Program, formerly called the Contract Health Services program, subject to available funding. Urban Indian Health Organizations are not provided funding to participate in the PRC program.
Overall, health care services provided through the IHS consist largely of primary care (mostly in the form of general outpatient and ambulatory care), but in some instances include ancillary and specialty services.17 Only a small subset of IHS facilities has surgeons or anesthesiologists to provide surgical services. The availability of IHS-provided skilled nursing care, home health services and hospice care, especially on or near the reservations, is also very limited.18 Lack of ready access to these services is particularly problematic for elderly American Indians and Alaska Natives as many of these services also tend not to be available through contract providers due to funding constraints. In cases where American Indians and Alaska Natives require specialty care that is not offered in an IHS or tribal facility, patients may be directed to PRC providers, but as described later in this brief, access to these providers is often limited to urgent medical conditions.
IHS funding is limited and must be appropriated by Congress each fiscal year. Federal funds are distributed through the Congressional appropriations process to IHS and tribal facilities across the country and provide the majority of their annual budgets. When service demands exceed available funds, services are prioritized or rationed, as described later in this brief. For 2014, Congress funded a total of $4.6 billion to IHS, with most ($3.4 billion) going towards clinical and preventive services (Figure 6). The remaining IHS funding was allocated for administrative and facility-management related activities such as equipment and maintenance, and 1 percent ($41 million) was allocated for Urban Indian Health programs.19
Figure 6: Allocation of Indian Health Service Program Funding, FY 2014
In addition to direct federal appropriations, revenues from third-party insurers, including Medicaid, Medicare, and private insurance are a significant part (20%) of the operating budgets for IHS providers. Because IHS is the payer of last resort, IHS providers must collect payment from third-party insurers when providing services to American Indian or Alaska Native patients with health insurance.20 These collections help reduce financial shortfalls between capacity and need. In the aggregate, IHS programs operated with an estimated budget of $5.8 billion for FY2014—representing $4.6 billion (80%) from IHS appropriations and another $1.2 billion (20%) in collections from third-party payers (Figure 6).21 By far, the largest third-party payer is Medicaid, which accounts for $828 million or 70 percent of total third-party revenues to IHS providers. Medicare accounts for another $217 million in collections totaling 19 percent of third-party payments. IHS- and tribally-operated facilities forego potential revenue when serving uninsured patients who are eligible for other insurance programs, including Medicare and/or Medicaid, but have not enrolled in them.
Limited funding has impeded IHS’s ability to meet the health care needs of American Indians and Alaska Natives. Although the IHS discretionary budget has increased over time, funds are not equally distributed across IHS facilities and remain insufficient to meet health care needs of American Indians and Alaska Natives, as discussed in a previous Issue Brief by the Kaiser Family Foundation.22 Access to services through IHS varies significantly across locations, and American Indians and Alaska Natives who rely solely on IHS often lack access to needed care.23 Such access problems may be particularly problematic for people who are elderly or disabled, given their greater health care needs. Long waits to see physicians or get appointments at many IHS facilities are frequently reported.24 Funding to Urban Indian Health Organizations is also very limited and the share of IHS funding going toward urban programs over time has not reflected the overall demographic shift of American Indians and Alaska Natives away from reservations.25 Access to services through the Purchased/Referred Care (PRC) Program is considerably limited with available funding often running out before the end of the year, limiting care to only “medical priority-1 cases, or those that threaten life or limb.”26
Role of Medicare for American Indians and Alaska Natives
Summary of Medicare Benefits
Medicare Part A, Hospital Insurance. Covers inpatient hospital care; generally no premium is required. When patients are hospitalized, they are subject to an inpatient deductible ($1,260 in 2015).
Medicare Part B, Medical Insurance. Covers physician services, outpatient care and certain other services such as physical therapy and medical supplies. The monthly premium in 2015 for most is $104.90, but premiums are higher for those with higher incomes. Cost sharing includes an annual deductible ($147 in 2015) and coinsurance (which, for most services is 20% of Medicare’s approved amount).
Part C or Medicare Advantage (MA). Provides coverage for Medicare Parts A and B through private health plans. A beneficiary may elect to enroll in an MA plan instead of enrolling in traditional fee-for-service Medicare. In addition to the Part B monthly premium, MA enrollees are charged a plan premium although that can be as little as $0 in some areas of the country. Depending on the MA plan, a deductible and coinsurance or copayments may apply to certain services.
Part D or Prescription Drug Coverage—Covers outpatient prescription drugs. Most Medicare enrollees pay a monthly premium and copayments or coinsurance.
Medicare is the federal health insurance program created in 1965 for people ages 65 and older, regardless of income or medical history, and expanded in 1972 to cover people under age 65 with permanent disabilities. Now covering 54 million Americans, Medicare plays a vital role in providing financial security to older people and those with permanent disabilities. Most people ages 65 and older, including American Indians and Alaska Natives, have and are entitled to Medicare if they or their spouse have made payroll tax contributions for 10 or more years. People who are under age 65 and living with a disability generally become eligible for Medicare if they are determined eligible for Social Security Disability Insurance and have received SSDI payments for a 24-month waiting period; other non-elderly people with certain health conditions, such as end stage renal disease, are eligible for Medicare with no waiting period.
Medicare consists of four parts (A, B, C and D) and covers a wide range of services, but there are some notable gaps. People with Medicare Parts A and B have coverage for inpatient and outpatient hospital care, physician care, and post-acute care, such as home health services, and care in skilled nursing facilities. In addition, Medicare covers outpatient prescription drugs for beneficiaries who enroll in a prescription drug plan (PDP) or through a Medicare Advantage Prescription Drug (MA-PD) plan. If I/T/U pharmacies exist in their service areas, PDPs and MA-PDs must provide convenient access to them for their members. In contrast, Medicare Advantage plans are not required to offer in-network contracts to I/T/Us for Parts A and B services.27 This may be a factor in the low rates of Medicare Advantage enrollment among American Indians and Alaska Native described in other research later in this brief and a text box 2.
While Medicare provides protection from many health care costs, it does not pay for some services vital to older people and those with disabilities, including long-term services and supports, dental services, eyeglasses, or hearing aids.
Medicare requires beneficiary cost-sharing for most of the health services that it covers. In addition to an annual deductible, beneficiaries in traditional Medicare are subject to other cost-sharing requirements with no limit on out-of-pocket spending. Like other Medicare beneficiaries, American Indians and Alaska Natives may have other sources of private coverage (such as retiree coverage from their previous employer) or Medicaid coverage for people with low incomes (also described below). These supplemental coverage sources may cover some or all of their Medicare cost-sharing amounts. When receiving services at I/T/Us or under referral through the PRC program, all patients, including Medicare beneficiaries, do not face any cost sharing, in general. In contrast, when American Indian and Alaska Native Medicare beneficiaries seek Medicare-covered services outside the IHS system, they are subject to the same Medicare cost-sharing requirements as other Medicare beneficiaries.
Because elderly American Indians and Alaska Natives are disproportionately low-income, many could be eligible for help from other programs in paying all or some of Medicare’s required cost-sharing. More specifically, low-income Medicare beneficiaries who meet eligibility requirements, based on their income and assets, may qualify under Medicaid for premium and cost-sharing assistance, and other benefits not covered by Medicare, such as long-term services and supports. Low-income Medicare beneficiaries who are not eligible for full Medicaid benefits may nevertheless be eligible for premium and cost sharing assistance through the Medicare Savings Programs (MSPs).28 Medicare provides premium and cost sharing assistance to low-income beneficiaries under Part D.29 In later sections of this brief, we present and discuss estimates of the numbers of low-income American Indians and Alaska Native Medicare beneficiaries who are also enrolled in Medicaid and Medicare Savings Plans, along with the data limitations of these estimates. In addition, we discuss the potential barriers that American Indians and Alaska Natives face in enrolling in these programs.
In addition, the IHS is another potential source of help for Medicare beneficiaries who are American Indians and Alaska Natives; the IHS is authorized to pay Medicare Part B (but not Part D) premiums on behalf of eligible American Indians and Alaska Natives. To date, IHS has not used this authority.30 Some individual Tribes, however, have elected to pay the Part B and Part D premiums for their members.31
Sources of Health care coverage for American Indians and Alaska Natives
Several factors make it difficult to determine the precise number of American Indians and Alaska Natives who are eligible for and covered by Medicare (Parts A, B and/or D). These factors include differences in definitions used to identify and categorize individuals as American Indian or Alaska Native, differences in survey methodologies, and long-standing inaccuracies in Medicare’s administrative data regarding beneficiary race and ethnicity.32 The discussion below relies mostly on estimates calculated from the American Community Survey (ACS)—the nationally representative survey with the largest sample of American Indians and Alaska Natives. It also discusses estimates from other publicly available surveys. A text box 1 provides further discussion about all these surveys and their limitations and the text box 2 examines challenges with using Medicare administrative files and claims data to identify American Indians and Alaska Natives in Medicare.
The majority of elderly American Indians and Alaska Natives (up to 96%) report having Medicare coverage. When asked to list sources of health insurance coverage, 96 percent of American Indians and Alaska Natives age 65 and older list Medicare (Table 1). In addition to Medicare, many report having other sources of coverage that may assist with cost sharing requirements under Medicare. Almost one in four (24%) qualify for Medicaid supplemental coverage—for full benefits (full duals), or partially through the Medicare Savings Programs—due to low incomes, a substantially higher rate than is observed among the total U.S. population age 65 and older. Almost half (48%) of all elderly American Indian and Alaska Natives report having non-Medicaid supplemental coverage, which could include private insurance (such as a Medicare supplemental Medigap policy or retirement benefits from their employer), or other coverage through the Veterans Health Administration. With this survey, it is not possible to distinguish what portion of Medicare beneficiaries are enrolled in a private plan through Medicare Advantage.
Table 1: Health Insurance Coverage for American Indians and Alaska Natives, By Age, 2013
American Indians and Alaska Natives
Percent, by Type of Coverage
Number, by Type of Coverage
Age 65 and older
447,389
Any Medicare
96%
428,575
Medicare only
28%
119,510
Medicare + Medicaid
24%
102,015
Medicare + non-Medicaid supplemental
48%
207,050
No Medicare, but other coverage
2%
9,588
Uninsured
2%
9,226
Under age 65
4,772,715
Any Medicare
4%
201,390
Medicare only
29%
57,834
Medicare + Medicaid
52%
105,577
Medicare + non-Medicaid supplemental
19%
37,979
No Medicare, but other coverage
71%
3,400,727
Uninsured
25%
1,170,598
Total (all ages)
5,220,104
AIAN population in Medicare
12%
629,965
NOTES: American Indians and Alaska Natives (AIAN). Medicare + Medicaid includes individuals with Medicare and full or partial Medicaid coverage. “Medicare + non-Medicaid supplemental” includes individuals with Medicare and additional non-Medicaid insurance, such as a Medigap policy, employer-sponsored retiree coverage, TRICARE, or Veterans Health Administration coverage. Uninsurance rates among the under-65 population is higher in analysis from previous years (2009-2011; see Kaiser Family Foundation, Health Coverage and Care for American Indians and Alaska Natives, October 2013).SOURCE: Kaiser Family Foundation analysis of the American Community Survey, 2013.
Notably, 28 percent of elderly American Indians and Alaska Natives have Medicare, but no supplemental coverage and are, therefore, exposed to Medicare’s out-of-pocket cost sharing requirements unless receiving services from I/T/Us or through a PRC referral. About 4 percent of elderly American Indians and Alaska Natives report that they do not have Medicare coverage, half of whom indicate that they are totally uninsured. Among American Indian and Alaska Native Medicare beneficiaries who are under age 65, more than half (52%) receive Medicaid coverage to supplement Medicare, signaling that a large proportion have low-incomes.
As mentioned, the ACS does not provide further distinctions about beneficiaries’ supplemental coverage, such as the shares enrolled in Medicare Savings Programs or in Medicare Advantage plans or the shares with prescription drug coverage (either through Medicare Advantage plans or through separate drug plans). Some researchers have turned to Medicare claims and administrative data for this information. We describe findings from this research in a text box 2, although there are a number of concerns identifying race and ethnicity using claims data.
About one-third (32%) of Medicare-covered American Indians and Alaska Natives are under age 65, qualifying for Medicare because of a permanent disability—double the proportion found in the overall Medicare population. About 200,000 American Indians and Alaska Natives under the age of 65 have Medicare because of a disability (for which they receive Social Security Disability Insurance benefits) or other qualifying health condition. The rate of people under age 65 enrolled in Medicare is similar for American Indians as it is for the general population (4% and 3% respectively). However, the share of American Indian and Alaska Native Medicare beneficiaries who are under age 65 is twice that found in the overall Medicare population (32% vs. 16%) (Figure 7). Therefore, the relatively larger proportion of American Indians and Alaska Native Medicare beneficiaries who are under age 65 is likely related to shorter life expectancies, as described earlier in this brief.
Figure 7: About one-third of American Indians and Alaska Natives enrolled in Medicare are under age 65
About a quarter (23%) of American Indian and Alaska Native Medicare beneficiaries list IHS as a “source of health coverage” (Figure 8). Although IHS is not technically a source of coverage, but rather a health care service delivery system for eligible American Indians and Alaska Natives, individuals who report having IHS coverage are likely indicating that they rely to some degree on I/T/Us for health care services. This equates to about 145,000 American Indian and Alaska Native beneficiaries. Other research using Medicare claims data estimates about 200,000 Medicare beneficiaries using IHS services (text box 2).
Figure 8: About a quarter of all American Indian and Alaska Native Medicare beneficiaries list the IHS as a source of coverage
The remaining three quarters (77%) of American Indian and Alaska Native beneficiaries who do not list IHS as a source of coverage, may not live on or near reservations or may not qualify for IHS services (or perhaps may not consider IHS a source of coverage, and thus did not list it). Looking only at elderly American Indians and Alaska Natives who have Medicare, rates of reporting IHS coverage are a little higher for those with no supplemental insurance (28%), and a little lower (19%) for those with private or military coverage (not shown).
Other surveys also find that the majority of elderly American Indians and Alaska Natives have Medicare, but at lower rates than estimated by the ACS. Analysis of other surveys suggests a possible lower bound for estimating Medicare coverage rates among American Indians and Alaska Natives age 65 and older. For example, the Survey of Elders finds a Medicare coverage rate, for those ages 65 and older, of 78 percent. While this survey has a large sample of elderly American Indians and Alaska Natives (9,488) and is conducted by trained tribal members, it is not weighted to be nationally representative. Another survey, the National Health Interview Survey (NHIS), finds a Medicare coverage rate of 88 percent among American Indians age 65 and older. While this survey is nationally representative, it has a small sample of elderly American Indian and Alaska Natives (146) which compromises the reliability of its findings.
Federal reports have documented barriers that American Indians and Alaska Natives face in enrolling in Medicare (above and beyond those experienced generally by low-income populations). These issues, as well as methodological issues with race identification, and variation in interviewing techniques, suggest that the percent of elderly American Indians and Alaska Natives without Medicare coverage could range from 22 percent (Survey of Elders) to 4 percent (ACS). Nonetheless, all three surveys—the ACS, the NHIS, and the Survey of Elders—find that Medicare is the most frequently reported source of health care coverage among American Indians and Alaska Natives age 65 and over. Without Medicare, American Indians and Alaska Natives could face significant barriers to care, unless they received all services from an I/T/U or under referral through the PRC program.
SECTION 3: The Intersection between the IHS and Medicare in access and coverage for American Indians and Alaska Natives
American Indians and Alaska Natives who are enrolled in Medicare may receive services from providers and facilities that are either affiliated or unaffiliated with IHS. When beneficiaries receive health care or prescription drugs from facilities operated by IHS, tribal entities, or the Urban Indian Health Program, they are not charged any cost-sharing, in general. However, when they receive care from non-IHS-funded providers, beneficiaries may incur cost sharing (including deductibles, coinsurance and copayments), depending on the service and whether they have supplemental coverage. When seeking care outside of the IHS system, American Indian and Alaska Native Medicare beneficiaries may be able to obtain assistance from their Tribes for cost sharing responsibilities, if they do not have the ability to pay on their own.
As described earlier, most services provided at I/T/Us are for primary care, common specialty services and pharmacy services. For other services, including hospital care, high-technology outpatient procedures, and post-acute care services, American Indians and Alaska Natives who are Medicare beneficiaries may need to go to IHS contracted providers through the Purchased/Referred Care (PRC) program or to providers outside the IHS system. In general, however, access to services through the PRC Program is limited to only high-priority, emergent cases.
Reimbursements from third-party insurers, including Medicare, are important revenue sources for IHS facilities, in light of IHS funding constraints.33 As the payer of last resort, IHS facilities are expected to collect reimbursements for services from patients’ third-party payers, including Medicare. In the aggregate, IHS facilities will collect an estimated $217 million in reimbursements from Medicare for services they provide to Medicare beneficiaries in 2014. While Medicare payments make up a relatively small share of facilities’ operating budgets, these reimbursements are not insignificant, given the fiscal pressures inherent in IHS’s overall funding. When caring for Medicare patients who have no supplemental coverage, IHS facilities receive Medicare’s full payment for the service, but forego the portion that would otherwise be attributable to beneficiary cost-sharing, such as the 20-percent co-insurance for physician services. In contrast, IHS facilities may seek payment for cost-sharing from patients’ supplemental insurers when applicable, including Medicaid, the Medicare Savings Programs, the Part D Low-Income Subsidy Program, VA coverage, or private supplemental insurers, including health plans in the Medicare Advantage program. Similarly, when American Indian and Alaska Native beneficiaries have Medicare prescription drug coverage, I/T/Us may seek reimbursement for applicable costs from beneficiaries’ Part D plans.34
To qualify for Medicare reimbursement, I/T/Us must meet Medicare’s conditions of participation. Medicare payments collected by the IHS- and tribally-operated facilities stay with those facilities and supplement other IHS funds, grants and other sources of funding.35 IHS may not offset its funding to provider facilities based on each facility’s ability to collect from third-party payers, such as Medicare.36
Providers who contract with IHS to provide services to American Indians and Alaska Natives through the PRC program follow the same reimbursement rules as the IHS facilities. That is, when providing services to American Indians and Alaska Natives that are authorized by IHS as emergent and/or high-priority, PRC providers may not seek any reimbursement from their patients, including from those with Medicare, but may seek cost-sharing reimbursement from supplemental insurers, when applicable. Also, hospitals (but not physicians and other facilities) that treat American Indian and Alaska Native patients under contract with IHS may not charge higher-than Medicare rates for their services, regardless of the patient’s type of insurance. This payment policy helps stretch IHS resources since its liability is capped at Medicare rates. Recently, the IHS released a proposed rule that would extend this rate cap to apply to all physicians, health care professionals and non-hospital-based services.37
Funding constraints limit patient access to PRC services to only high-priority, acute, urgent and emergent cases.38 Although the PRC program is designed to expand the availability of non-primary care IHS providers—such as specialty consultations, rehabilitation care, skilled nursing facility and home health services—in reality, access to PRC providers is limited to those with the greatest medical urgency. For example, the IHS reports that in FY 2013, 77 percent of IHS-operated PRC programs were only able to purchase the first priority (most emergent) level of services. In the same year, the PRC denied about $761 million for an estimated 147,000 services needed by eligible American Indians and Alaska Natives. Consequently, in many cases, American Indians and Alaska Natives might need to seek services outside of the IHS system where, if they have Medicare and do not have a PRC referral, are subject to cost-sharing requirements, as are all beneficiaries. When PRC providers furnish care that is not authorized by IHS as high-priority, then they are acting as any other non-IHS funded provider and may, therefore, charge their American Indians and Alaska Natives patients for applicable out-of-pocket expenses.
Potential barriers to enrollment in Medicare and Medicare Savings Programs and Implications for the Indian Health Service
Elderly and disabled American Indians and Alaska Natives face potential factors that may deter enrollment in Medicare and Medicare Savings Programs, which has implications for beneficiaries themselves and for the Indian Health Service. Although data limitations make it difficult to quantify the extent to which eligible American Indians and Alaska Natives are not enrolled in Medicare, federal reports, researchers, and advocacy organizations have cited numerous potential factors that may deter enrollment in Medicare and Medicare Savings Programs.39 In some cases, the Tribal leaders and members may perceive that the Federal Trust responsibility to provide health care to the Tribes means that their members do not need to apply for assistance from federal programs.40 Also, the Tribes or their members may not be aware of programs for which they are eligible, including the Medicare Savings Programs or the Part D Low Income Subsidy Program, because they assume they are required to obtain all of their medical services through the IHS or Urban Indian Health facilities.
This misunderstanding and lack of knowledge about Medicare programs may be due to a number of factors. Effective outreach to American Indians and Alaska Natives has historically been very challenging and, based on research from the Government Accountability Office (GAO) about the outreach experience related to the ACA, requires a “large, multipronged effort, including use of media, direct mail, one-on-one counseling and partnerships with community organizations.”41 To reach the remaining American Indians and Alaska Natives who are eligible and not enrolled or enrolled and not taking advantage of their Medicare status may require a significant investment of IHS resources.
Another area of confusion is the age of eligibility for Medicare. For many tribes, people may be considered “elders” when they are younger than 65. In fact, the IHS defines elder at age 55 compared to more closely match elder-status among American Indian and Alaska Native populations. This contrasts with Medicare, for which eligibility for of non-disabled people starts at age 65. Consequently, American Indians and Alaska Natives may be considered “elders” in their community, but if they try to enroll in Medicare, learn that they are not eligible.42
Other potential factors affecting enrollment are not unique to American Indian and Alaska Native populations, but rather apply to low-income and vulnerable populations more broadly. Communities with high rates of poverty and/or lower education levels have historically faced problems enrolling in federal programs, particularly in rural and some inner city areas. As identified in research and other federal reports, these factors include: complexity of enrolling in financial assistance programs, such as Medicaid, Medicare Saving Programs and the Part D Low Income Subsidy Program; lack of awareness of these programs; transportation barriers (many reservations, for example, lack any form of public transportation, which creates a particular challenge for many elderly American Indians and Alaska Natives who are without cars or are unable to drive them); language (many American Indian and Alaska Natives languages are spoken only, limiting the use of written outreach materials); and low literacy and cultural barriers. The remote rural location of many American Indian and Alaska Natives adds to the difficulties of outreach, education and enrollment assistance. For some American Indians and Alaska Natives, the lack of a permanent address is a major barrier to obtaining care and the necessary financial supports.43
SECTION 4: Future Opportunities and Challenges
While the majority of elderly American Indians and Alaska Natives have Medicare coverage, cost and access challenges remain a concern for this population, particularly among the relatively large share with no supplemental coverage and no access to I/T/Us. These concerns stem from the significant health needs and relatively low incomes of elderly and disabled American Indians and Alaska Natives. Also, these circumstances may be further exacerbated by barriers that they and other disadvantaged populations face when enrolling in programs that provide assistance with out-of-pocket costs, such as Medicaid, Medicare Savings Programs, and low-income subsidy assistance in Part D. American Indians and Alaska Natives with access to clinics and providers that are funded through the IHS have no cost-sharing, but services at these clinics are typically limited to primary care. Further, the IHS is subject to appropriations and thus competes with other programs for federal funding. As a result, constraints on available funding will continue for the foreseeable future.
Data limitations continue to compromise a better understanding of the health and coverage needs of American Indians and Alaska Natives who are age 65 and older or living with long-term disabilities. Several factors make it difficult to determine the precise number of American Indians and Alaska Natives who are eligible for Medicare and who are enrolled in Medicare. These factors include differences in definitions used to identify and categorize individuals as American Indian or Alaska Native, differences in survey methodologies, and longstanding inaccuracies in Medicare’s administrative data regarding beneficiary race and ethnicity. Researchers and advocacy organizations, such as the California Rural Indian Health Board (CRIHB), have called for more attention to race and ethnicity, including establishing the platform for beneficiaries to self-identify race and ethnicity at the time of enrollment in Medicare.
Looking ahead, some opportunities may exist for Medicare to improve access to care among American Indian and Alaska Native Medicare beneficiaries. Ongoing Medicare initiatives to improve population health in rural communities, for instance, could provide American Indians and Alaska Native beneficiaries with access to more coordinated and integrated care. For example, the Frontier Community Health Integration Project—a demonstration project being implemented by the Centers for Medicare and Medicaid Services (CMS) in five states (Alaska, Montana, Nevada, North Dakota, and Wyoming), all of which have relatively higher concentrations of elderly American Indians and Alaska Natives. The purpose of this demonstration is to develop and test ways to coordinate the delivery of acute care, extended care, and other essential health care services to Medicare beneficiaries living in sparsely populated areas. Other Medicare demonstrations run through the CMS Innovation Center include initiatives to focus on providing culturally competent care through advanced primary care models, such as medical homes. This work may lead to greater emphasis on understanding communication differences and health needs that are unique to American Indian and Alaska Native communities.
Opportunities also exist within the IHS. For example, IHS has proposed regulations to stretch the limited dollars available for the PRC program by capping (at Medicare payment rates) the amount that contracted providers may charge for serving any eligible American Indian and Alaska Native patient. IHS facilities and I/T/U pharmacies may also gain additional Medicare reimbursements in future years as the number of elderly American Indians and Alaska Natives increases. Similarly, broad coverage expansions under the Affordable Care Act (ACA), which provide new coverage pathways (through Marketplaces and Medicaid), could increase IHS providers’ access to third-party reimbursements, thereby increasing their operating revenues and enhancing their capacity to provide services to all their patients—including those who are elderly and living with long-term disabilities.
More broadly, the ACA includes other provisions which could improve the health of American Indians and Alaska Natives as they age into Medicare. The ACA permanently reauthorizes the Indian Health Care Improvement Act, which includes provisions designed to: increase the number of providers who serve American Indians and Alaska Natives; increase and improve health promotion and disease prevention services; enhance access to care for urban American Indians and Alaska Natives; and modernize facilities where American Indians and Alaska Natives receive care. Other broad provisions within the ACA that aim to reduce disparities in health and access to care among disadvantaged populations could have important implications for American Indians and Alaska Natives, including: increased funding for community health centers; workforce development and diversity initiatives; improvements in data collection by race and ethnicity; and prevention, wellness, and public health initiatives.
Technical support in preparation of this report was provided by Health Policy Alternatives, Inc. Anthony Damico, an independent consultant, provided programming and statistical support. This report was funded in part by AARP.
Box 1: Selected Population and Health Surveys: Estimating Results for American Indians and Alaska Natives
American Community Survey (ACS)
The ACS is a national survey of approximately 3.5 million households conducted annually by the United States Census Bureau. It focuses on age, sex, race, family and relationships, income and benefits, health insurance, education, veteran status, employment, housing, and transportation. Its primary mode of data collection is through the mail with paper questionnaires. For 2013, the ACS includes a sample size of 62,316 American Indians and Alaska Natives, of whom 6,531 are age 65 and over. Advantages and limitations: By design, the ACS’s relatively large sample size enables it to produce community-level estimates (both by race and ethnicity, and geographic area). The mail-based collection method does not allow respondents to ask clarifying questions while completing the survey. The survey asks only one question regarding health insurance status.
Behavioral Risk Factor Surveillance System (BRFSS)
The BRFSS is a continuous telephone health survey, interviewing more than 500,000 adults in 2013. It collects data on health-related risk behaviors, chronic health conditions, and use of preventative services. The BRFSS has a set of core questions asked nationally of all respondents, as well as some questions that are state-specific. For 2013, BRFSS includes a sample size of 7,789 American Indians and Alaska Native adults, of whom 1,762 are age 65 and over. Advantages and limitations: For a telephone survey, BRFSS has a relatively large sample size and respondents are able to speak to trained, individual interviewers. BRFSS questions on health status and behaviors are comprehensive, but insurance coverage results do not distinguish by type of insurance.
Identifying Our Needs: A Survey of Elders
The Survey of Elders is funded through the Administration on Community Living in the Department of Health and Human Services, and is administered by the National Resource Center on Native American Aging. The survey is fielded in three-year cycles and collects information from Native Americans age 55 and older on general health status, health care and screenings, activities of daily living, tobacco and alcohol usage, weight and nutrition, social support/housing, demographics and social functioning. Trained tribal members often conduct the surveys. Cycle V, released in 2013 includes a sample size of 9,488 American Indians and Alaska Natives age 65 and over. Advantages and limitations: The Survey of Elders has a large sample of elderly American Indians and Alaska Natives and is conducted by people who are either tribal members or familiar with the tribal population, addressing cultural issues that may affect responses in other surveys. Although a sampling frame guides data collection, the survey results are not weighted to be nationally representative.
National Health Interview Survey (NHIS)
The NHIS is a national, face-to-face household survey administered annually by the National Center for Health Statistics to 35,000 households (approximately 87,500 persons) each year. It provides health status, health care access, and health service utilization information, collected through personal household interviews conducted by individuals trained about health insurance information. For 2013, the NHIS includes a sample size of 1,455 American Indians and Alaska Native adults, of whom 146 are age 65 and over. Advantages and limitations: The NHIS provides relatively detailed health insurance information and uses interviewers who have received training on the concepts included in the survey, such as health insurance. The small sample of elderly American Indians and Alaska Natives limits the reliability of results for this population.
Box 2: Using Medicare Claims Data for Analysis of American Indian and Alaska Native Beneficiaries
Some researchers have used Medicare administrative and claims data to analyze Medicare enrollment and service use among beneficiaries who are American Indian and Alaska Native, but most acknowledge significant and long-standing inaccuracies in the racial and ethnic identification of these individuals in the Medicare data.44
Research that uses Medicare claims and administrative data to identify beneficiaries who are American Indians or Alaska Natives, typically categorize beneficiaries as American Indian and Alaska Native if they fulfil one of the following three circumstances: 1) live in an IHS service delivery area, 2) have received a Medicare covered service from an IHS facility, or 3) are listed or self-reported in Medicare’s administrative files as American Indian or Alaska Native and living outside an IHS area. Using these criteria, researchers identified 220,000 beneficiaries enrolled in Medicare in 2010—of which 87 percent are identified through the first two criteria and 13 percent are living outside an IHS area and are identified as American Indian or Alaska Native in Medicare files.45 This low count strongly suggests that relying on Medicare data alone to determine Medicare enrollment among American Indians and Alaska Natives is problematic because it is appears to undercount the number enrolled in Medicare.
Despite the potential shortcomings of the Medicare data, it presents some findings that are consistent with other survey data. For example, analysis by the California Rural Indian Health Board shows a higher proportion of American Indians and Alaska Natives in Medicare are under age 65, compared with the overall beneficiary population. Specifically, among all Medicare beneficiaries in 2009, 29 percent of those using IHS were under 65 and 43 percent of self-declared American Indians and Alaska Native who do not use IHS were under 65.46 Additionally, this claims analysis shows a higher proportion of American Indian or Alaska Native beneficiaries qualify for Medicare because they have end-stage-renal disease and 22 percent of beneficiaries accessing IHS were also enrolled in Medicaid.
Medicare’s administrative data provides some ability to examine American Indian and Alaska Native beneficiaries’ enrollment in supplemental coverage that may assist in out-of pocket expenses, such as MSPs, Medicare Advantage plans or separate drug plans. This research finds that 2009 Part B premiums were paid by an MSP program for about 31 percent of people accessing IHS and 43 percent of self-declared American Indians and Alaska Natives not accessing IHS.47 Claims analysis also shows lower proportions of American Indians and Alaska Natives enrolled in Medicare Advantage, compared with the overall Medicare population. This difference is likely associated with geographic variation in the prevalence of Medicare Advantage plans, with fewer plans offered in rural areas, particularly those associated with Indian reservations.48 Finally, for 2010, 37 percent of IHS-American Indians and Alaska Natives in traditional Medicare had Part D coverage; of them, about 22 percent were eligible for both Medicaid and Medicare (i.e. were full duals) thus qualifying for the Low Income Subsidy that helped pay their Part D premiums.49
Appendices
Appendix Table 1: Overall and American Indian and Native Alaska Population, Age 65+, Alphabetically by State, 2011-2013
State
Population Counts, 65+
AIAN as Share of All in State
AIAN Distribution Across States
Share of AIAN with Medicare
All, Age 65+
AIAN,Age 65+
AIAN, Age 65+with Medicare
AIAN as a (%)of All 65+
(%) of All AIAN,Age 65+
(%) of AIAN 65+ with Medicare
United States
43,044,138
428,644
410,075
1%
100%
96%
Alabama
696,630
5,800
5,716
0.8%
1.4%
99%
Alaska
62,452
8,607
8,081
13.8%
2.0%
94%
Arizona
969,201
25,671
23,762
2.6%
6.0%
93%
Arkansas
441,129
6,146
6,050
1.4%
1.4%
98%
California
4,599,013
58,454
55,606
1.3%
13.6%
95%
Colorado
610,869
6,697
6,461
1.1%
1.6%
96%
Connecticut
530,636
2,513
2,435
0.5%
0.6%
97%
Delaware
141,053
762
754
0.5%
0.2%
99%
DC
71,360
529
500
0.7%
0.1%
95%
Florida
3,501,667
16,570
15,930
0.5%
3.9%
96%
Georgia
1,132,859
5,652
5,510
0.5%
1.3%
97%
Hawaii
212,033
2,540
2,451
1.2%
0.6%
96%
Idaho
212,113
3,025
2,847
1.4%
0.7%
94%
Illinois
1,690,065
8,328
7,803
0.5%
1.9%
94%
Indiana
888,805
5,348
5,162
0.6%
1.2%
97%
Iowa
467,690
1,412
1,412
0.3%
0.3%
100%
Kansas
394,024
5,310
5,231
1.3%
1.2%
99%
Kentucky
612,780
3,806
3,553
0.6%
0.9%
93%
Louisiana
592,675
5,275
5,207
0.9%
1.2%
99%
Maine
226,384
2,290
2,121
1.0%
0.5%
93%
Maryland
761,267
4,628
4,181
0.6%
1.1%
90%
Massachusetts
956,544
4,411
4,059
0.5%
1.0%
92%
Michigan
1,438,392
12,372
12,095
0.9%
2.9%
98%
Minnesota
728,798
5,764
5,220
0.8%
1.3%
91%
Mississippi
401,865
2,097
1,918
0.5%
0.5%
91%
Missouri
882,173
8,812
8,580
1.0%
2.1%
97%
Montana
156,860
5,060
4,689
3.2%
1.2%
93%
Nebraska
257,346
1,616
1,594
0.6%
0.4%
99%
Nevada
360,364
4,836
4,451
1.3%
1.1%
92%
New Hampshire
194,498
1,187
1,187
0.6%
0.3%
100%
New Jersey
1,247,008
4,561
4,323
0.4%
1.1%
95%
New Mexico
294,067
17,629
16,247
6.0%
4.1%
92%
New York
2,750,756
17,389
16,603
0.6%
4.1%
95%
North Carolina
1,341,755
16,067
15,808
1.2%
3.7%
98%
North Dakota
100,506
2,097
2,030
2.1%
0.5%
97%
Ohio
1,701,127
9,554
9,342
0.6%
2.2%
98%
Oklahoma
532,899
40,465
39,008
7.6%
9.4%
96%
Oregon
580,125
9,763
9,435
1.7%
2.3%
97%
Pennsylvania
2,040,227
6,376
6,140
0.3%
1.5%
96%
Rhode Island
158,001
1,325
1,208
0.8%
0.3%
91%
South Carolina
692,481
3,575
3,513
0.5%
0.8%
98%
South Dakota
122,046
5,152
5,027
4.2%
1.2%
98%
Tennessee
915,490
7,122
6,847
0.8%
1.7%
96%
Texas
2,834,788
26,752
25,845
0.9%
6.2%
97%
Utah
271,151
2,748
2,618
1.0%
0.6%
95%
Vermont
99,053
938
886
0.9%
0.2%
94%
Virginia
1,059,298
7,283
7,116
0.7%
1.7%
98%
Washington
906,480
14,670
14,103
1.6%
3.4%
96%
West Virginia
310,292
2,399
2,363
0.8%
0.6%
98%
Wisconsin
820,689
5,818
5,672
0.7%
1.4%
97%
Wyoming
72,370
1,443
1,375
1.9%
0.3%
95%
NOTES: American Indian Alaska Native (AIAN). U.S. totals presented here differ from Table 1 of this paper due to the use of multiple years of data to achieve a sample size that allows state estimates.SOURCE: Kaiser Family Foundation analysis of the American Community Survey pooled data (2011-2013).
Appendix Table 2: Medicare Populations (Overall and American Indian and Alaska Native) Under Age 65, Alphabetically by State, 2011-2013
State
U.S. Medicare Population<Age 65
AIAN Medicare Population<Age 65
AIAN as a (%) of StateMedicare Population<Age 65
United States
7,728,559
200,712
3%
Alabama
196,711
4,619
2%
Alaska
11,737
2,151
18%
Arizona
137,838
9,678
7%
Arkansas
121,997
3,074
3%
California
693,544
21,453
3%
Colorado
97,905
3,830
4%
Connecticut
75,771
1,076
1%
Delaware
27,287
1061
4%
DC
13,766
323
2%
Florida
489,359
7,469
2%
Georgia
256,382
2,991
1%
Hawaii
23,373
687
3%
Idaho
38,194
1458
4%
Illinois
265,795
3,200
1%
Indiana
170,847
2,946
2%
Iowa
68,960
1,110
2%
Kansas
66,277
2,729
4%
Kentucky
178,201
2,519
1%
Louisiana
148,642
2,604
2%
Maine
48,134
1,146
2%
Maryland
115,189
1,738
2%
Massachusetts
145,316
1,940
1%
Michigan
299,751
7,548
3%
Minnesota
99,985
2,882
3%
Mississippi
124,037
1,590
1%
Missouri
188,488
5,499
3%
Montana
24,575
2,393
10%
Nebraska
38,050
1,825
5%
Nevada
57,185
1,540
3%
New Hampshire
34,289
820
2%
New Jersey
183,263
2,262
1%
New Mexico
63,869
6,899
11%
New York
458,382
7,354
2%
North Carolina
288,460
9,791
3%
North Dakota
11,970
1,507
13%
Ohio
309,320
4,558
1%
Oklahoma
120,523
16,710
14%
Oregon
90,668
3,565
4%
Pennsylvania
328,179
3,991
1%
Rhode Island
32,163
750
2%
South Carolina
157,100
2,696
2%
South Dakota
19,947
2,457
12%
Tennessee
223,095
4,715
2%
Texas
533,311
10,138
2%
Utah
44,962
1,269
3%
Vermont
19,205
589
3%
Virginia
199,555
3,725
2%
Washington
150,984
7,801
5%
West Virginia
86,729
2,090
2%
Wisconsin
136,560
3,158
2%
Wyoming
12,729
788
6%
NOTES: American Indian Alaska Native (AIAN). U.S. totals presented here differ from Table 1 of this paper due to the use of multiple years of data to achieve a sample size that allows state estimates.SOURCE: Kaiser Family Foundation analysis of the American Community Survey pooled data (2011-2013).
Endnotes
Kaiser Family Foundation analysis of the 2013 ACS finds that the median age of the AIAN population is 30 and the median age of the U.S. population is 37. Regarding life-expectancy, the Census Bureau estimates that non-Hispanic Blacks and people who identify as American Indian or Alaska Native alone or in combination with another race have a life expectancy of 78 years for women and 72 years for men compared with 81 years and 77 years respectively in the general U.S. population. http://www.census.gov/prod/2014pubs/p25-1140.pdf↩︎
Reservations are areas that have been set aside for tribes through treaties, statues, or executive order. Within these territories, tribes have primary governmental authority. Tribes also have primary authority over land trusts, land held in trust by the federal government for a tribe. Land trusts may exist within reservations or off-reservation. Statistical areas are used by the Census Bureau to present data on recognized tribes that do not have a reservation (U.S. Census Bureau, “American Indian and Alaska Native Areas,” Chapter 5 in Geographic Areas Reference Manual (Washington, DC: November 1994), http://www.census.gov/geo/reference/pdfs/GARM/Ch5GARM.pdf). U.S. Census, Map: American Indians and Alaska Natives in the United States (2010), http://www2.census.gov/geo/maps/special/AIANWall2010/AIAN_US_2010.pdf. ↩︎
Bureau of Indian Affairs, U.S. Department of the Interior, “Indian Entities Recognized and Eligible to Receive Services From the Bureau of Indian Affairs,” Federal Register 77, no. 155 (Friday, August 10, 2012), http://www.bia.gov/cs/groups/public/documents/text/idc-020700.pdf; The Shinnecock tribe of New York was added as a federally-recognized tribe since the last Federal Register publication; Office of Minority Health, “Profile: American Indian/Alaskan Native”, available at: http://minorityhealth.hhs.gov/omh/browse.aspx?lvl=3&lvlid=62 (September 2014). ↩︎
Legal obligation under which the United States “has charged itself with moral obligations of the highest responsibility and trust” toward Indian tribes (Seminole Nation v. United States, 1942). http://www.bia.gov/FAQs/↩︎
See 42 CFR 136.12. Also, in some cases, eligibility criteria for access to I/T/U services can be expanded to include others, particularly in the Urban Indian Health Program. See the “Indian Health Manual” for more details. Available at: http://www.ihs.gov/IHM/index.cfm?module=dsp_ihm_pc_p2c1#2-1.2. ↩︎
Harriet Komisar and Judy Feder, “Transforming Care for Medicare Beneficiaries with Chronic Conditions and Long-term Care Needs: Coordinating Care Across All Services,” October 2011. ↩︎
In Alaska, health care funded by IHS is provided to shareholders in the Alaska Native Claims Settlement Act (ANCSA) regional and village corporations. ↩︎
Department of Health and Human Services, Indian Health Service: Fiscal Year 2015 Justification of Estimates for Appropriations Committees, (February, 2014). ↩︎
Approximately 100,000 American Indians utilize 23 Title V Urban Indian health programs and are not able to access hospitals, health clinics, or contract health services administered by IHS and tribal health programs due to their inability to meet IHS eligibility criteria or residency outside of IHS and tribal service areas. More information on Urban Indian health programs can be found here: http://www.ihs.gov/urban/index.cfm?module=dsp_urban_programs. ↩︎
In addition to medical care, the IHS provides other services, including sanitation and public health functions. ↩︎
A 2005-2007 national survey of long term care for older American Indians and Alaskan Natives found that only 15 percent of tribes had nursing home services and 16 percent had assisted living services available for elders. See AHRQ Health Care Innovations, Exchange American Indian Nation-Owned Skilled Nursing Facility Provides Culturally Responsible Services, Leading to High Patient Satisfaction and Low Staff Turnover, https://innovations.ahrq.gov/profiles/american-indian-nation%E2%80%93owned-skilled-nursing-facility-provides-culturally-responsive. Another study, focused solely on palliative care services for American Indians and Alaska natives in New Mexico, found that from 1999-2003, only 2.3% of Medicare patients at two IHS hospitals were enrolled in hospice when they died. This compared to a state average of 30.8%. Although some of this difference might result from cultural attitudes about death and dying, the researcher concluded that lack of access was also a significant factor. Domer, Timothy and Judith Kaur, Palliative Practice in Indian Health, South Dakota Medicine, 2008. Spec No.:36-40. ↩︎
Funding allocations are described in the “All Purpose Table” (pg. 15) and “FY 2014 Crosswalk” (pg. 22) of the ↩︎
These estimates of third-party collections are based on the 2015 IHS Congressional Budget Justification and does not convey any otherwise unreported revenues. ↩︎
Testimony of Darrin Old Coyote, Crow Tribe of Indians-Apsaalooke Nation, Senate Committee on Indian Affairs, Field Hearing on the Indian Health Service: Ensuring the HIS is living up to its Trust Responsibility, May 27, 2014. ↩︎
The Qualified Medicare Beneficiary (QMB) program pays the Medicare B premiums plus deductibles and, in some instances, coinsurance. (It will also pay the Part A premium in the case of an individual who is subject to such premium because that person does not qualify on the basis of work history but is instead buying into Part A.) The Special Low Income Beneficiary (SLMB) and Qualifying Individual (QI) programs pay Medicare Part B premiums for qualified individuals. Each type of program considers the individual’s (or couple’s) resources and the specific program for which the individual qualifies is based on their income. Applications and eligibility determinations are handled through each state’s Medicaid program. ↩︎
Low income beneficiaries who are not full duals also may be eligible for Part D premium cost sharing assistance, with the maximum amount of assistance available to those below 135% of the federal poverty level and with resources (in 2014) between $8,660 – $13,440 ($13,750 – $26,860 if married). ↩︎
Per telephone conversation between CMS staff and Health Policy Alternatives, September 5, 2014. ↩︎
Government Accountability Office, Medicare and Medicaid. CMS and State Efforts to Interact with the Indian Health Service and Indian Tribes, July 2008, GAO-08-724. ↩︎
A. Zaslavsky, J. Ayanian, L. Zaborski, The Validity of Race and Ethnicity in Enrollment Data for Medicare Beneficiaries, Health Services Research (June 2012), http://www.ncbi.nlm.nih.gov/pmc/articles/PMC3349013/ ; California Rural Indian Health Board, Medicare Statistics for American Indians and Alaska Natives, Centers for Medicare and Medicaid Services American Indian and Alaska Native Data Project (2012); D. Waldo, Accuracy and Bias of Race/Ethnicity Codes in the Medicare Enrollment Database, Health Care Financing Review (Winter 2004-2005), https://www.cms.gov/Research-Statistics-Data-and-Systems/Research/HealthCareFinancingReview/downloads/04-05winterpg61.pdf; S. Arday, D. Arday, S. Monroe, J. Zhang, HCFA’s racial and ethnic data: current accuracy and recent improvements, Health Care Financing Review (2000). ↩︎
The relationships between the Medicare program and the IHS, as well as between Medicare and the facilities and providers operated by the tribes, tribal organizations or urban Indian organizations, are regulated under the Indian Health Care Improvement Act of 1975 and the Indian Self Determination and Education Assistance Act of 1976. ↩︎
GAO, Indian Health Service: Most American Indians and Alaska Natives Potentially Eligible for Expanded Health Coverage, but Action Needed to Increase Enrollment, GAO-13-553 (September 2013). ↩︎
See “Purchased/Referred Care” section of the Department of Health and Human Services, Indian Health Service: Fiscal Year 2015 Justification of Estimates for Appropriations Committees, (February, 2014). ↩︎
Government Accountability Office, Medicare and Medicaid CMS and State Efforts to Interact with the Indian Health Service and Indian Tribes, GAO-08-724 (July 2008); Kathryn Langwell, et al., American Indian and Alaska Native Eligibility and Enrollment in Medicaid, SCHIP, and Medicare, Individual Case Studies for Ten States, Centers for Medicare and Medicaid Services (December 2003), http://www.cms.gov/Research-Statistics-Data-and-Systems/Statistics-Trends-and-Reports/Reports/downloads/langwell_2003_5.pdf ; California Rural Indian Health Board, Medicare Statistics for American Indians and Alaska Natives, Centers for Medicare and Medicaid Services American Indian and Alaska Native Data Project (2012); Edward Fox and Verné Borner, Health Care Coverage and Income of American Indians and Alaska Natives: A Comparative Analysis of 33 States with Indian Health Service Funded Programs, for Tribal Affairs: Centers for Medicare and Medicaid Services (2012), http://www.crihb.org/files/Health_care_coverage_and_income_of_aians.pdf. ↩︎
GAO, Indian Health Service: Most American Indians and Alaska Natives Potentially Eligible for Expanded Health Coverage, but Action Needed to Increase Enrollment, GAO-13-553 (September 2013). ↩︎
California Rural Indian Health Board, Medicare Statistics for American Indians and Alaska Natives, Centers for Medicare and Medicaid Services American Indian and Alaska Native Data Project (2012). ↩︎
A. Zaslavsky, J. Ayanian, L. Zaborski, The Validity of Race and Ethnicity in Enrollment Data for Medicare Beneficiaries, Health Services Research (June 2012), http://www.ncbi.nlm.nih.gov/pmc/articles/PMC3349013/ ; California Rural Indian Health Board, Medicare Statistics for American Indians and Alaska Natives, Centers for Medicare and Medicaid Services American Indian and Alaska Native Data Project (2012); D. Waldo, Accuracy and Bias of Race/Ethnicity Codes in the Medicare Enrollment Database, Health Care Financing Review (Winter 2004-2005), https://www.cms.gov/Research-Statistics-Data-and-Systems/Research/HealthCareFinancingReview/downloads/04-05winterpg61.pdf; S. Arday, D. Arday, S. Monroe, J. Zhang, HCFA’s racial and ethnic data: current accuracy and recent improvements, Health Care Financing Review (2000). ↩︎
J. O’Connell et al, Centers for American Indian and Alaskan Native Health, Colorado School of Public Health, University of Colorado, Denver, Medicare Enrollment, Health Status, Service Use and Payment Data for American Indians & Alaskan Natives, Centers for Medicare & Medicaid Services Tribal Technical Advisory Group, American Indian & Alaskan Native Data Project (February 2014). ↩︎
California Rural Indian Health Board, Medicare Statistics for American Indians and Alaska Natives, Centers for Medicare and Medicaid Services American Indian and Alaska Native Data Project (2012). ↩︎
J. O’Connell et al, Centers for American Indian and Alaskan Native Health, Colorado School of Public Health, University of Colorado, Denver, Medicare Enrollment, Health Status, Service Use and Payment Data for American Indians & Alaskan Natives, Centers for Medicare & Medicaid Services Tribal Technical Advisory Group, American Indian & Alaskan Native Data Project (February 2014).
↩︎
Recent news stories on the heath law did not attract most Americans’ attention, and many are unaware of details and implications of the developments
Weeks before the Affordable Care Act’s employer mandate takes effect in January, a new Kaiser Family Foundation tracking poll finds that six in 10 Americans (60%) say they have a favorable view of the provision, which in 2015 requires employers with 100 or more full time workers to offer health coverage or pay a penalty. In comparison, 38 percent say they have an unfavorable view.
But opinions on the employer mandate aren’t necessarily fixed. The share with a favorable view rises from 60 to 76 percent after opponents are told that “most employers with 100 or more workers already offer health insurance and won’t have to pay the fine.” In contrast, the share with an unfavorable opinion rises from 38 to 68 percent after supporters are told that “some employers are moving some workers from full time to part time to avoid paying the fine.”
As with other elements of the ACA, the poll shows a partisan divide in perception of the employer mandate, with 34 percent of Republicans reporting a favorable view, compared to 78 percent of Democrats and 61 percent of independents.
Meanwhile, the Kaiser Health Policy News Index for December finds that several ACA-related news stories didn’t attract the attention of the majority of Americans. Additionally, few correctly answered some basic questions about details reported in the stories.
A large majority (84%) say they have heard “only a little” or “nothing at all” about the U.S. Supreme Court’s announcement in early November that it will hear the King vs. Burwell case. The case addresses whether low- and moderate-income people in states using the ACA’s federally-operated health insurance marketplace will remain eligible for financial help from the government to pay for plans. Americans are largely unaware that 37 states are using the federally-run marketplace, with roughly three in 10 (28%) correctly noting that more than half of the states use Healthcare.gov.
Another health policy news story, the revision of the official estimate of people signing up for health plans during the marketplaces’ first open enrollment period, also drew limited attention, with about a third of Americans (34%) saying they closely followed coverage (10% very, 24% fairly closely). Of those, only a third (32%) are aware that the revised number was smaller rather than larger.
Of the stories included in the poll, the public reported giving the least attention to comments about the health law made by MIT health economist Jonathan Gruber, with only 22 percent saying they closely followed coverage (10% very and 12% fairly).
On the other hand, nearly half (45%) of Americans say they closely monitored coverage of the lawsuit filed by House Republicans against President Barack Obama over the implementation of the Affordable Care Act. People are more-or-less divided about the perceived motivation behind the suit, with half (50%) saying Republicans are trying to gain political advantage and about four in 10 (38%) saying Republicans believe the president overstepped his legal authority. Opinions varied starkly, and predictably, by party identification.
A year after the ACA’s coverage expansions took effect, the tracking poll shows that the public’s overall view of the law continues to be stable, with 46 percent of Americans reporting an unfavorable opinion and 41 percent reporting a favorable view.
Large shares report a favorable view of several specific provisions, including the creation of insurance marketplaces (78%), availability of financial assistance for low- and moderate-income people to pay for health plans (76%) and the option for states to expand their Medicaid programs (75%). The individual mandate, however, remains largely unpopular with about a third (35%) saying they view it favorably. As with the employer mandate, though, opinion can shift with additional information and that share rises as high as 62 percent or falls as low as 18 percent depending on what else Americans are told about that provision.
A month into the ACA’s second open enrollment period, just 5 percent of the uninsured give the correct deadline for signing up for a health plan in the marketplaces. The vast majority (97%) of the uninsured are unaware of the correct fine amount for 2015, although more than a third (37%) think they will have to pay it for 2014.
Just under three in 10 Americans are closely following news coverage of the second ACA open enrollment period (7% very closely, 21% fairly closely). Nearly half (48%) of the public say there have been fewer problems with the functionality of Healthcare.gov than in the previous sign up period, while 31 percent say the number of problems is about the same and 9 percent say there are more. Republicans (36%) are less likely than Democrats (61%) and independents (48%) to say there have been fewer problems this year. However, across party lines, small shares report thinking there were more problems with the website compared to the first open enrollment period.
METHODOLOGY
The latest tracking poll was designed and analyzed by public opinion researchers at the Kaiser Family Foundation and was conducted from December 2-9, 2014 among a nationally representative random digit dial telephone sample of 1,505 adults ages 18 and older. Interviews were conducted in English and Spanish by landline (750) and cell phone (755). The margin of sampling error is plus or minus 3 percentage points for the full sample. For results based on other subgroups, the margin of sampling error may be higher.
Kaiser Health Tracking Poll: December 2014 Findings
With many of the Affordable Care Act’s (ACA) major provisions taking effect this past year, such as the individual mandate and coverage expansions through Medicaid and the health insurance marketplaces, the December Kaiser Health Tracking Poll finds that many Americans are aware of the main parts of the law and, with the exception of the individual mandate, at least 6 in 10 feel favorably towards them. However, as the employer requirement takes effect in January for firms with 100 or more workers, Americans’ initial opinions of the provision are malleable, particularly if they hear it may cause some employers to move workers from full time to part time. Similarly, opinions on the individual mandate can change when more information is provided.
Despite the individual provisions receiving high marks, opinion of the law overall remains stable with 46 percent reporting an unfavorable view and 41 percent reporting a favorable view. The public is fractured over what Congress should do next with the law with 3 in 10 preferring repeal, about 1 in 10 saying they would like Congress to scale back the law, a fifth saying they want implementation to continue, and a quarter favoring expanding the law. Americans give a wide variety of answers when asked to say in their own words what the law does, but about 4 in 10 say that it expands access to health care and health insurance. And, about one month into the ACA’s second open enrollment period, the poll finds the vast majority of the uninsured don’t know the deadline to enroll, most expect to get health insurance in the next few months, and nearly two-thirds say they don’t think they’ll have to pay a fine, or don’t know if they will, for not having coverage this year.
Employer And Individual Requirements
The Public’s Views On The Eve Of The Employer Requirement
In January, the employer requirement to offer coverage or pay a penalty goes into effect for employers with 100 or more workers. The public generally has a favorable view of the employer requirement with 60 percent favoring the provision and 38 percent with an unfavorable view.
But, opinion on the employer mandate is not fixed and there is some room for movement. After providing those in favor of the employer mandate with the statement that “some employers are moving some workers from full time to part time to avoid paying the fine,” the share with an unfavorable opinion rises from 38 percent to 68 percent.
In contrast, when those with unfavorable views of the employer mandate are provided with the statement that “most employers with 100 or more workers already offer health insurance and won’t have to pay the fine,” the share with a favorable view of the employer requirement rises from 60 percent to 76 percent.
Figure 1
A Focus On The Individual Mandate
This year marks the first year the individual mandate was in effect, requiring nearly all Americans to have health insurance or else pay a fine. The public generally holds an unfavorable view of this provision (64 percent), but some report a favorable view of it (35 percent). However, like in the case of the employer mandate, opinion on the individual mandate is somewhat malleable. The most persuasive message of those tested to move opponents to supporters is the reminder that “most Americans still get coverage through their employers or a public insurance program and so automatically satisfy the requirement without having to buy any new insurance.” Upon hearing this, about 6 in 10 (62 percent) have a favorable view of the requirement to have coverage. Other statements also move opinion more favorably on the individual mandate and over the 50 percent mark, including mention of the hardship exemptions (59 percent), the fact that without the mandate people may wait to buy insurance until they’re sick resulting in higher costs for others (54 percent), and that without such a requirement insurers may deny coverage to those who are sick (51 percent). Being told the actual amount of the fine is not as influential in terms of changing people’s views and leaves about four in 10 (41 percent) with a favorable view of the provision.
Figure 2
Alternatively, some who originally hold favorable views of the provision can also be moved to view the requirement unfavorably. The share with an unfavorable view of the mandate goes up from 64 percent to three-quarters or more after hearing that “requiring all Americans to have health insurance could mean that some people would be required to buy health insurance that they find too expensive or didn’t want” or after hearing the amount of the fine.
Figure 3
Views Of The ACA One Year Into Coverage Expansions
The ACA In Their Own Words
When asked to say in their own words the main thing the law does, 4 in 10 (41 percent) say it expands access to health care and health insurance, with some naming specific groups such as those with lower incomes (7 percent) and the uninsured (5 percent) that stand to benefit from increased access. Many fewer say the law increases costs or makes insurance too expensive (8 percent), requires people to purchase insurance (7 percent), helps them personally or people generally (7 percent), or that it makes health care more affordable (5 percent).
FIGURE 4: In Their Own Words
Can you tell me, in your own words, what do you think the main thing the health care law does?
Category
Percent Mentioning
Quotes
Expands Access
41%
“Gets everyone insured.”“Makes insurance more available for everyone.”“Provides healthcare.”
Increases Costs/ Too Expensive
8
“Raised cost of healthcare.”“Raises the premium.”“It costs us money.”
Requires people to buy coverage
7
“Forced to buy healthcare.”“Requires everybody to get insurance.”“Requires people to be insured.”
Helps me/ people
7
“I think it helps people that need help.”“Helps me to pay my monthly insurance bill.”“Helps people who are less fortunate.”
Made insurance more affordable
5
“It creates a way for people to afford health care.”“It allows more affordable health care.”“It helps people afford their own insurance.”
These responses vary by overall opinion of the law. About 6 in 10 of those with a favorable view of the law (62 percent) say the law expands access, compared to a quarter of those with an unfavorable view (24 percent) who also say the law increases costs (16 percent) or requires people to purchase health coverage (12 percent).
Opinion On The ACA Remains Stable
Nearly 5 years after passage and a year after the coverage expansions under the ACA took effect, overall opinion on the law remains stable with 46 percent of the public reporting an unfavorable view of the law and 41 percent a favorable view. Party identification has long been the factor dividing opinion on the law and the results from this month’s tracking are no different. Eight in 10 Republicans (79 percent) say they have an unfavorable view compared to 7 in 10 Democrats (69 percent) who say they have a favorable view. Independents are more divided with 46 percent favorable and 40 percent unfavorable.
Figure 5
The Public Is Divided On What Next
As a Republican-led Congress prepares to get down to work in January, Americans remain split on what Congress should do next with the law. About 3 in 10 (31 percent) say the law should be repealed entirely, 12 percent say they would like Congress to scale back what the law does, 2 in 10 (21 percent) say the law should be implemented as is, and a quarter say the law should be expanded (24 percent). But like opinion of the law overall, opinion is divided by party. About 6 in 10 Republicans (62 percent) share the view that the law should be repealed entirely, while Democrats feel the law should be expanded (38 percent) or continued as is (36 percent). Opinion among independents is more scattered. For example, 25 percent of independents say they want the law expanded and 27 percent say they would prefer the law repealed.
Figure 6
A Closer Look At Awareness And Views Of Specific ACA Provisions
While opinion on the law overall remains negative, large shares of Americans report feeling favorably toward a number of the law’s specific provisions, including the creation of the marketplaces where people can shop for and purchase coverage (78 percent), the financial assistance available to low- and moderate-income people (76 percent), the option for states to expand their Medicaid programs (75 percent), and, as noted earlier, the requirement that employers with 100 or more full time workers offer coverage or pay a penalty (60 percent). And, while Republicans are relatively unified in their dislike of the law overall, at least half say they have favorable opinions of the provisions that create marketplaces (66 percent), provide financial assistance (55 percent), and allow for the expansion of Medicaid (52 percent). Support drops off considerably among Republicans for the employer mandate (34 percent), compared to majorities of Democrats (78 percent) and independents (61 percent).
A clear exception to the favorable views of several of the law’s provisions is in views of the requirement that nearly all Americans have insurance or else pay a fine. Nearly two-thirds (64 percent) say they have an unfavorable opinion of this provision, including 45 percent who say they feel “very unfavorable.”
FIGURE 7: Many Elements Of ACA Continue To Be Popular Across Parties
Percent who say they have a FAVORABLE opinion of each provision of the law
Total Public
Democrat
Independent
Republican
Create exchanges/marketplaces
78%
91%
79%
66%
Subsidy assistance to individuals
76%
90%
78%
55%
Medicaid expansion
75%
90%
78%
52%
Employer mandate/penalty for large employers
60%
78%
61%
34%
Individual mandate/penalty
35%
53%
31%
17%
Note: Question wording abbreviated. For full question wording, see survey topline.
In addition to viewing most of these provisions favorably, many people also recognize that these elements are included in the law. The most widely recognized provision is the individual mandate (77 percent), but still roughly two-thirds are aware that the law requires employers with 100 or more employees to offer coverage or else pay a fine (69 percent), creates marketplaces (67 percent), provides financial assistance to low- and moderate-income individuals (67 percent), and gives states the option to expand the Medicaid program (62 percent).
Figure 8
While the public recognizes many of the law’s main provisions, they are less familiar with the law’s practical implications, such as the fine for not having health insurance. Over 7 in 10 (72 percent) say they do not know what the fine will be for people who do not get insurance in 2015, and another 19 percent say some amount other than the 2014 or 2015 actual amounts. Six percent reported the 2014 amount ($95 per person or 1% of household income), and just 3 percent responded with an amount similar to the 2015 fine of $325 per person or 2% of household income.
Figure 9
Americans also continue to hold misperceptions about some aspects of the law. For example, about 4 in 10 say the law allows undocumented immigrants to receive financial help from the government to buy health insurance or that it establishes a government panel to make decisions about end-of-life care for people on Medicare, and another 2 in 10 say they are unsure if the law does these things.
FIGURE 10: Misperceptions About ACA Continue
To the best of your knowledge, would you say the health reform law does or does not do each of the following?
CORRECT
INCORRECT
No
Yes
Don’t Know/Refused
Allow undocumented immigrants to receive financial help from the government to buy health insurance
38%
43%
19%
Establish a government panel to make decisions about end-of-life care for people on Medicare
41%
41%
19%
A Look At The Uninsured
About a month into the ACA’s second open enrollment period, very few of the uninsured (5 percent) are aware that the deadline to enroll is February 15 and 13 percent believe the deadline is the end of 2014. A majority of the uninsured explicitly say they don’t know when the deadline is (57 percent), give a date outside of this year’s open enrollment period (12 percent), or say the deadline already passed or that there is no deadline (12 percent). The vast majority of the uninsured are also unaware of what the fine for not having health insurance will be in 2015. Just 3 percent respond with an amount similar to the 2015 fine, while the rest provide an amount similar to the 2014 fine (7 percent), some other amount (17 percent), or say they don’t know (74 percent).
Figure 11
While many uninsured don’t know the fine amount, a little over a third of the uninsured (37 percent) expect to have to pay a fine for not having coverage this year, while over 4 in 10 say they will not (44 percent) and 19 percent say they don’t know. In fact, many uninsured may be exempt from paying a fine due to financial hardship or other exemptions under the law.
Figure 12
Kaiser Health Tracking Poll: December 2014 Methodology
This Kaiser Health Tracking Poll was designed and analyzed by public opinion researchers at the Kaiser Family Foundation (KFF). The survey was conducted December 2-9, 2014, among a nationally representative random digit dial telephone sample of 1,505 adults ages 18 and older, living in the United States, including Alaska and Hawaii (note: persons without a telephone could not be included in the random selection process). Computer-assisted telephone interviews conducted by landline (750) and cell phone (755, including 421 who had no landline telephone) were carried out in English and Spanish by Princeton Data Source under the direction of Princeton Survey Research Associates International (PSRAI). Both the random digit dial landline and cell phone samples were provided by Survey Sampling International, LLC. For the landline sample, respondents were selected by asking for the youngest adult male or female currently at home based on a random rotation. If no one of that gender was available, interviewers asked to speak with the youngest adult of the opposite gender. For the cell phone sample, interviews were conducted with the adult who answered the phone. KFF paid for all costs associated with the survey.
The combined landline and cell phone sample was weighted to balance the sample demographics to match estimates for the national population using data from the Census Bureau’s 2012 American Community Survey (ACS) on sex, age, education, race, Hispanic origin, nativity (for Hispanics only), and region along with data from the 2010 Census on population density. The sample was also weighted to match current patterns of telephone use using data from the July-December 2013 National Health Interview Survey. The weight takes into account the fact that respondents with both a landline and cell phone have a higher probability of selection in the combined sample and also adjusts for the household size for the landline sample. All statistical tests of significance account for the effect of weighting.
The margin of sampling error including the design effect for the full sample is plus or minus 3 percentage points. Numbers of respondents and margin of sampling error for key subgroups are shown in the table below. For results based on other subgroups, the margin of sampling error may be higher. Sample sizes and margin of sampling errors for other subgroups are available by request. Note that sampling error is only one of many potential sources of error in this or any other public opinion poll. Kaiser Family Foundation public opinion and survey research is a charter member of the Transparency Initiative of the American Association for Public Opinion Research.