What’s in Store for Medicare’s Part B Premiums and Deductible in 2016, and Why?

Published: Nov 11, 2015

Issue Brief

On November 10, 2015, the Centers for Medicare & Medicaid Services (CMS) announced the 2016 Medicare Part B monthly premium and annual deductible amounts of $121.80 and $166, respectively.1  The Medicare Trustees had projected that Part B premium and deductible amounts would increase by an unprecedented 52 percent between 2015 and 2016,2  before the Bipartisan Budget Act of 2015 (Public Law 114-74) was passed by Congress and signed into law on November 2, 2015. According to the Trustees, the magnitude of the projected increase in the standard premium was attributable to higher-than-expected Part B spending in 2014; a need to provide for adequate reserves in the Supplementary Medical Insurance trust fund; and the effect of having no cost-of-living adjustment (COLA) for Social Security benefits in 2016. The lack of a Social Security COLA means that 70 percent of Part B enrollees are prevented from paying higher Part B premiums in 2016 due to the so-called ‘hold-harmless’ provision in the Social Security law, while the other 30 percent will face higher premiums.3 

As a result of the Bipartisan Budget Act of 2015, the Part B monthly premium will be increasing for 30 percent of Part B enrollees from $104.90 in 2015 to $121.80 in 2016—a 16 percent increase, but far less than the increase initially projected by the Medicare actuaries (Figure 1). This total amount includes a $3 repayment surcharge, which will be added to monthly premiums over time to cover the cost of the reduced premium rate in 2016. The 70 percent of Part B enrollees who are protected by the hold-harmless provision will pay a monthly premium of $104.90 in 2016, the same as in 2015, and no premium surcharge.
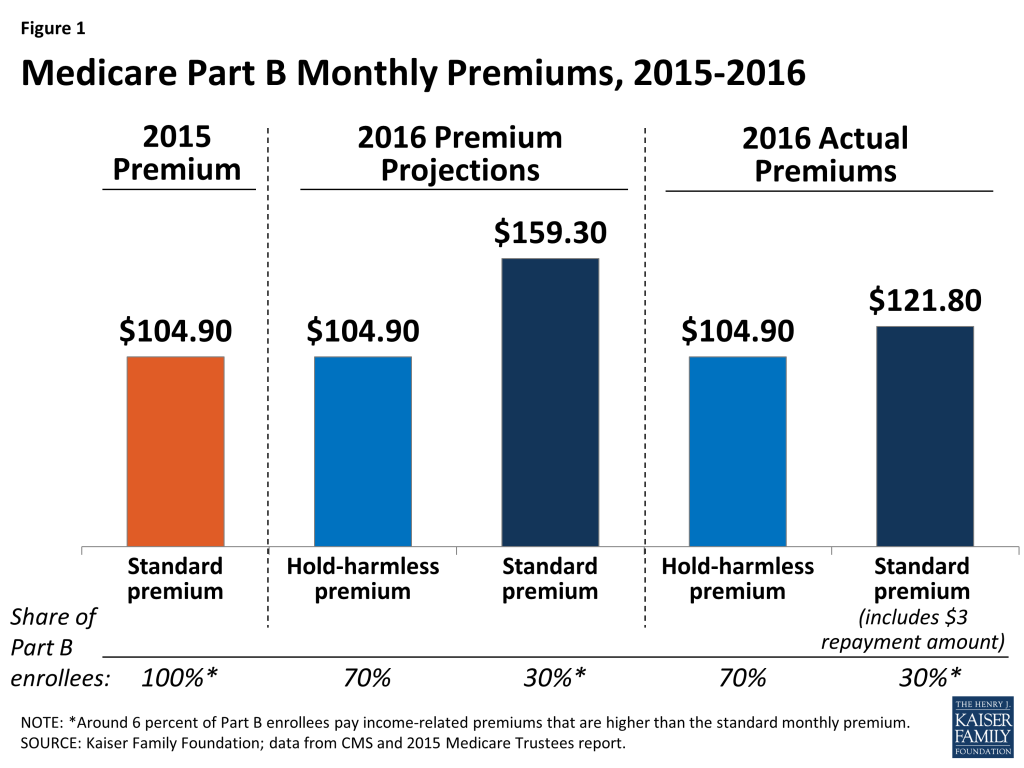
Figure 1: Medicare Part B Monthly Premiums, 2015-2016

This brief explains how the Medicare Part B premium and deductible are changing for 2016, the circumstances that led lawmakers to modify the formula for determining these amounts for 2016, related provisions of the Bipartisan Budget Act of 2015, and the implications for beneficiaries’ premiums and deductibles in 2016 and future years.

How are Medicare Part B premiums calculated?

Medicare’s monthly standard Part B premium amount is derived from a monthly actuarial rate determined by the Secretary of the Department of Health and Human Services (HHS) in September of each year for the succeeding year, such that, in the aggregate, premiums will cover 25 percent of Part B program spending and provide for adequate reserves in the Supplementary Medical Insurance (SMI) Trust Fund, with general revenues covering the remaining 75 percent of program spending. Most beneficiaries pay the standard premium amount, while higher-income Part B enrollees pay a greater share of costs, ranging from 35 percent to 80 percent, depending on their income, and state Medicaid programs pay the premium on behalf of beneficiaries who are dually eligible for Medicare and Medicaid. Premiums are generally deducted from beneficiaries’ Social Security benefits.4 

Over the 50-year history of the Medicare program, Part B premiums have changed nearly every year by varying percentages, ranging from a reduction of 13 percent to an increase of 39 percent. In general, premiums have increased from one year to the next, reflecting the growth in Part B program spending (see Appendix A for actual and projected Part B premiums and rates of growth between 1975 and 2024).

In July 2015, the Medicare Board of Trustees projected that the monthly Part B premium would increase by an unprecedented 52 percent for 30 percent of Part B enrollees, triggered by the lack of a Social Security cost-of-living adjustment (COLA) for 2016, while the other 70 percent of Part B enrollees would pay the same premium in 2016 that they pay in 2015 ($104.90) because of the hold-harmless provision in the Social Security law.5 

What is the connection between the Medicare Part B premium, the Social Security COLA, and the hold-harmless provision?

Social Security recipients typically receive an annual cost-of-living increase that reflects higher costs associated with inflation (see Appendix A for actual and projected Social Security COLAs between 1975 and 2024). The COLA is based on the change in the Consumer Price Index for Urban Wage Earners and Clerical Workers (CPI-W) between the third quarter (July-September) of the current year and the third quarter of the most recent year a cost-of-living adjustment was determined.6  For 2016, the COLA is based on the change in the CPI-W between the third quarters of 2014 and 2015, a period marked by dramatic declines in energy prices (primarily the price of gasoline) that outweighed modest price increases in other consumer goods.7  As a result, on October 15, 2015, Social Security announced there will be no COLA for 2016.8  The zero percent COLA for Social Security recipients in 2016 is the first year with no COLA since 2011 and only the third such year since 1975.

The absence of a COLA affects the amount of the Medicare Part B premium charged to enrollees because it triggers the broader application of a provision in the Social Security law known as the hold-harmless provision. In a year where the Social Security COLA is insufficient to cover the amount of the Medicare Part B premium increase for an individual, the law prohibits an increase in the Part B premium that would result in a reduction in that individual’s monthly Social Security benefits from one year to the next. (For an example of how the hold-harmless provision works in a typical year with a Social Security COLA, see Appendix B.) The hold-harmless provision affects a different number of beneficiaries each year, depending on the level of their Social Security benefits, the size of the COLA, and the increase in the Medicare Part B premium. In years with no COLA, a majority of beneficiaries are protected by the hold-harmless provision.

Which Medicare beneficiaries will not be protected by the hold-harmless provision in 2016?

In 2016, 30 percent of all Part B enrollees will not be protected by the hold-harmless provision,9  including (Figure 2):
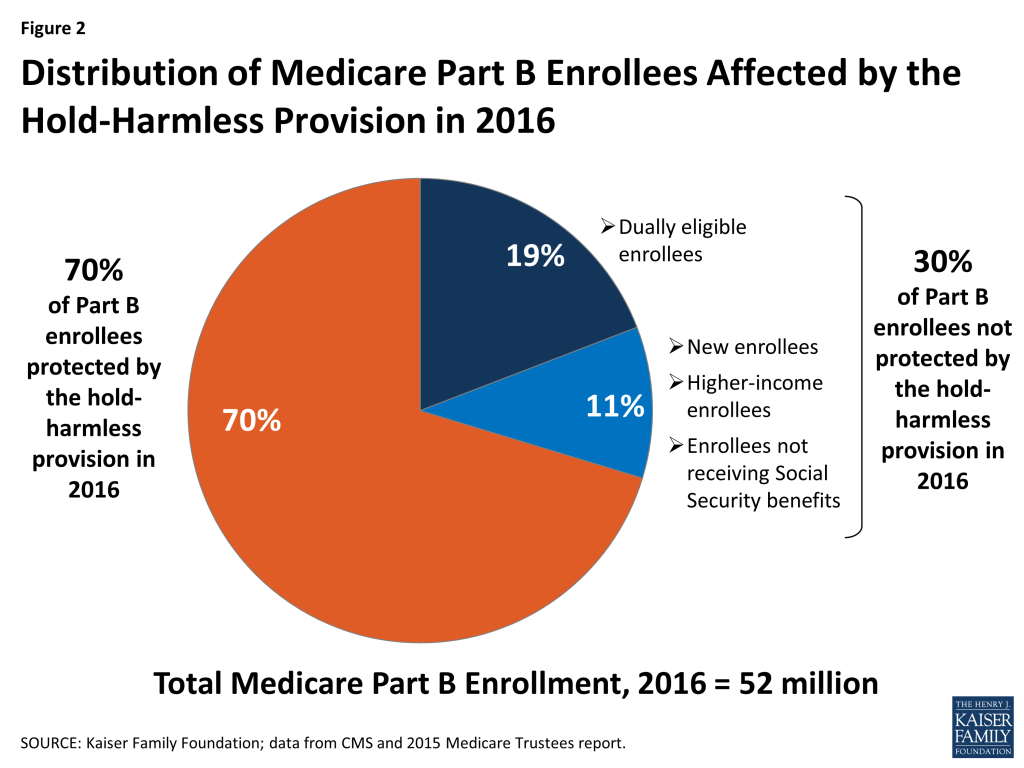
Figure 2: Distribution of Medicare Part B Enrollees Affected by the Hold-Harmless Provision in 2016
  • Medicare beneficiaries who are dually eligible for Medicare and Medicaid, for whom State Medicaid programs (funded jointly by states and the Federal government) pay the monthly Part B premium, and any increase in the premium, on their behalf. There are approximately 10 million dually eligible beneficiaries, representing 19 percent of Part B enrollees and two-thirds of those who are not protected by the hold-harmless provision.
  • Higher-income Medicare beneficiaries, with a modified adjusted gross income greater than $85,000 for individuals and $170,000 for couples in 2016, who are required to pay an income-related surcharge in addition to the standard monthly Part B premium amount.
  • Medicare Part B enrollees who are not receiving Social Security benefits, including people covered under Medicare Part B who have chosen to defer receiving Social Security benefits, and others who are covered under Medicare but not Social Security. In 2013, half of all people on Medicare not receiving Social Security benefits had incomes below $33,000.10 
  • New Medicare enrollees in 2016. Because people who are new to Medicare in 2016 have not been paying Part B premiums in 2015, the increase in the Part B premium cannot result in a decrease in their Social Security benefits in 2016. This group includes people reaching age 65 in 2016 who enroll in Medicare Part B, and people who worked beyond age 65 and sign up for Part B in 2016. It also includes people younger than age 65 who have been receiving Social Security Disability Insurance (SSDI) payments who will exit the 24-month waiting period and go on Medicare in 2016. The Medicare actuaries project the number of Part B enrollees will increase by 1.4 million between 2015 and 2016,11  all of whom will pay a higher Part B premium unless they qualify for both Medicare and Medicaid, in which case states pay the premium on their behalf.

How did the Bipartisan Budget Act of 2015 affect Medicare Part B premiums in 2016 and beyond?

In response to the unusual circumstances surrounding the projected Medicare Part B premium increase for 2016, the recently-passed Bipartisan Budget Act of 2015 modified the way in which the Part B premium and deductible amounts are calculated for 2016. The law requires Medicare to calculate the standard Part B premium for 2016 as if the hold-harmless provision were not in effect and as if all Part B enrollees (rather than just 30 percent) were paying a higher amount. This approach has the effect of reducing the standard Part B premium amount for the 30 percent of Part B enrollees who are not protected by the hold-harmless provision.

In accordance with the new law, CMS announced that the total Part B monthly premium amount for 2016 will be $121.80, which includes a $3 repayment amount that will be added to monthly premiums over time to cover the cost of the reduced premium rate in 2016, as described below. This total premium will be paid by (or on behalf of) the 30 percent of Part B enrollees who are not protected by the hold-harmless provision in 2016. The total (including the repayment amount) represents a 16 percent ($16.90) increase from the 2015 standard monthly premium of $104.90, and $37.50 less than actuaries had projected for 2016 earlier this year. Based on CMS’s calculation of the 2016 actuarial rate of $237.60, the monthly premium rate alone, excluding the $3 repayment amount, is $118.80, or 13 percent more than the 2015 monthly premium (Figure 3).
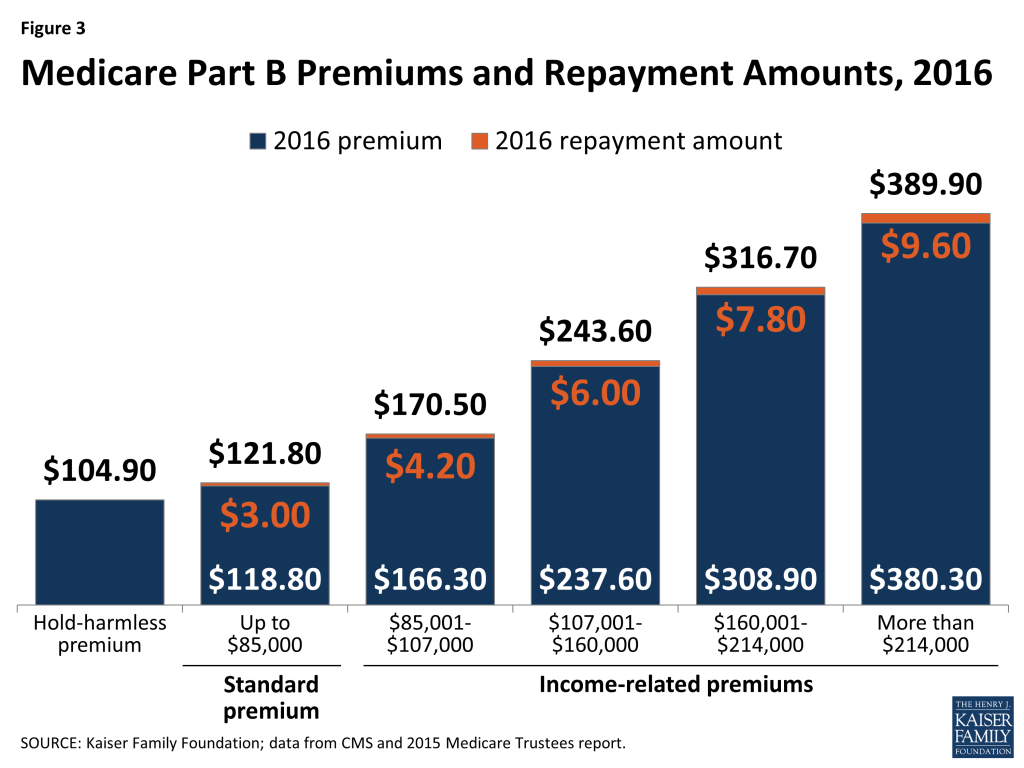
Figure 3: Medicare Part B Premiums and Repayment Amounts, 2016

Thus, under the new law, beneficiaries who are not protected by the hold-harmless provision will pay more than the 2015 standard Part B premium in 2016, but not as much as was projected in the 2015 Trustees report. Beneficiaries who are protected by the hold-harmless provision will pay $104.90 per month in 2016, the same as the standard Part B premium in 2015, and no repayment amount.

According to CMS, this change in the calculation of the Part B premium for 2016 will cost $7.4 billion in federal outlays because there will be a shortfall in beneficiary premium payments in 2016.12  CMS also estimated that states will save a total of $1.8 billion on premium payments for dually-eligible beneficiaries due to the actual premium for 2016 being lower than what was initially projected.

The law calls for a transfer of funds from general revenues to the SMI trust fund to temporarily cover the $7.4 billion cost, but also requires Part B enrollees to repay this amount over time in the form of a modest premium surcharge. Beginning in 2016, a $3 repayment surcharge will be added to the monthly premium payment for the 30 percent of beneficiaries who are not protected by the hold-harmless provision; beneficiaries who pay income-related premiums will pay somewhat higher repayment amounts.

In 2017 and later years until the total cost is repaid, the repayment surcharge will be added to the monthly Part B premium amount paid by all Part B enrollees who are not protected by the hold-harmless provision. For those years where there is a Social Security cost-of-living increase, the vast majority of Part B enrollees will not be protected by the hold-harmless provision and will be required to pay these repayment amounts.

How will Part B premiums change for higher-income Medicare beneficiaries in 2016?

Approximately 6 percent of Part B enrollees are estimated to pay income-related Part B premiums in 2016.13  Beneficiaries are required to pay a higher Part B premium if their income is equal to or greater than $85,000 for an individual and $170,000 for a couple. These beneficiaries pay a higher share of Part B program costs, ranging from 35 percent to 80 percent, depending on their income level. For 2015, the income-related Part B premium amounts range from $146.90 for beneficiaries paying 35 percent of program costs to $335.70 for beneficiaries paying 80 percent of costs.

For 2016, the monthly income-related premiums (including the repayment amounts) will increase by 16 percent, the same percentage increase at each level as for the standard Part B premium. For higher-income beneficiaries, monthly premiums will range from $170.50 (for those with incomes between $85,001 and $107,000) to $389.90 (for those with incomes greater than $214,000) (Figure 4). These amounts include the monthly surcharges, which range from $4.20 for beneficiaries paying 35 percent of program costs to $9.60 for beneficiaries paying 80 percent of costs.
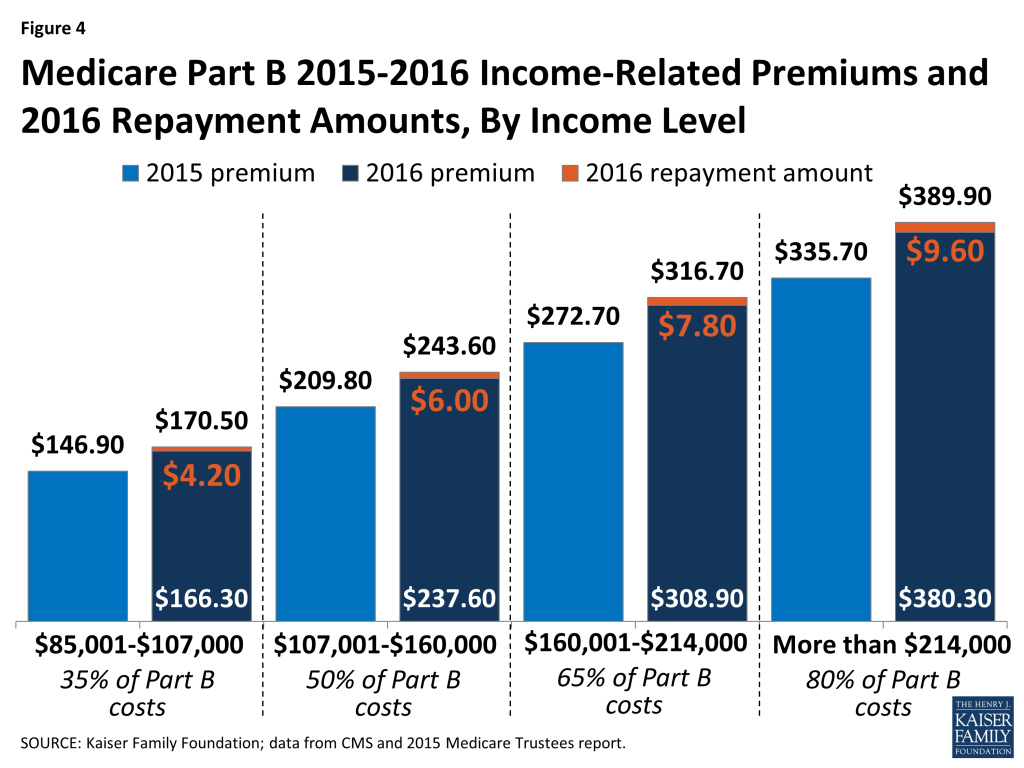
Figure 4: Medicare Part B 2015-2016 Income-Related Premiums and 2016 Repayment Amounts, By Income Level

How is the Medicare Part B deductible changing in 2016?

The Medicare Part B deductible was projected to rise by 52 percent in 2016, because the premium and deductible amounts are indexed to increase at the same rate. Thus, changes to the calculation of the standard Part B premium made in the Bipartisan Budget Act of 2015 also affected the deductible. The annual Part B deductible will be $166 in 2016, increasing by $19 over the 2015 amount of $147 (Figure 5). This represents the same rate of increase (13 percent) as the increase in the monthly Part B premium excluding the repayment surcharge. The annual deductible for 2016 is $57 lower than the $223 amount that was projected by the Medicare Trustees in the 2015 report.
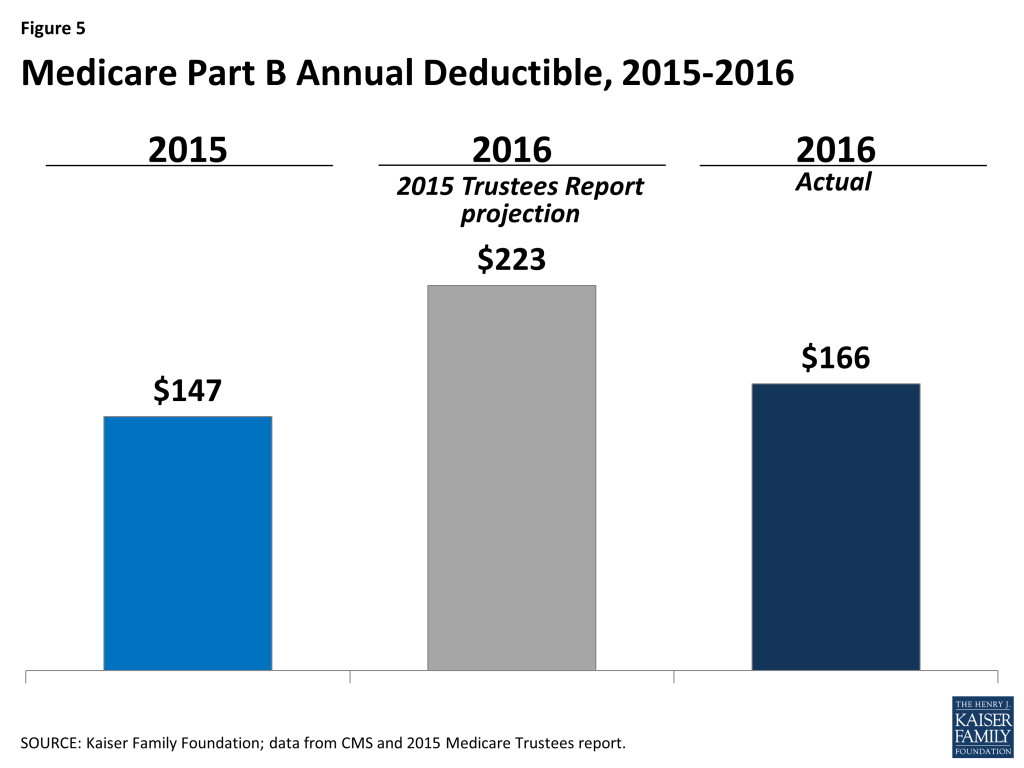
Figure 5: Medicare Part B Annual Deductible, 2015-2016

The hold-harmless provision does not apply to the Part B deductible increase, thus all Part B enrollees who use Part B services will be charged this higher amount. An exception is Medicare Advantage enrollees, who typically pay the Part B premium but may not face the same cost-sharing requirements for Medicare-covered services as beneficiaries in traditional Medicare, including deductibles and coinsurance or cost sharing. Beneficiaries in traditional Medicare who have Medigap supplemental coverage or employer-sponsored plans that help cover their Medicare cost-sharing requirements may not pay the higher Part B deductible directly out of their own pockets, but they could face an increase in their Medigap or employer plan premiums as a result of their plans covering the higher deductible.

What is the expected outlook for 2017?

The Medicare Trustees projected that the Part B monthly premium will be $120.70 in 2017 and the Part B deductible will be $169—similar to the actual amounts in 2016. With the addition of the $3 repayment amount, the total monthly premium in 2017 would be $123.70. This total amount represents an 18 percent ($18.80) increase for the majority of beneficiaries who are protected by the hold-harmless provision in 2016 and a more modest 2 percent ($1.90) increase for all others who are subject to the higher premium amount in 2016—including states, which pay the Part B monthly premium on behalf of dually eligibles beneficiaries.

For the coming years, the Trustees project Medicare’s monthly Part B premium and deductible will increase at an average annual rate of 5.4 percent between 2017 and 2024. This projected rate of growth is roughly in line with the rate of growth in Medicare Part B per capita spending, and also reflects the expectation that Social Security recipients will receive a cost-of-living increase each year between 2017 and 2024. If Part B spending grows faster or slower than projected, premiums would grow faster or slower as a result.

The Social Security Trustees project a 3.1 percent COLA for 2017, which would result in an increase in monthly Social Security benefits in 2017.14  With an increase in the COLA projected for 2017, fewer Medicare Part B enrollees will be affected by the hold-harmless provision than in 2016, which means the beneficiary premium portion of Part B program spending is likely to be spread across a greater share of Part B enrollees in 2017 than in 2016, and the repayment surcharges will be paid by a larger share of beneficiaries as well.

Conclusion

The Bipartisan Budget Act of 2015 averted an unprecedented increase in the 2016 Medicare Part B premium for the 30 percent of Part B enrollees who would have otherwise have faced a 52 percent increase in their premiums. It also reduced the level of increase in the Part B deductible that would have affected virtually all beneficiaries in traditional Medicare. Although the hold-harmless provision protects most beneficiaries against an increase in the Part B premium in a year with no COLA, some beneficiaries could see an actual reduction in their Social Security benefits in 2016 due to rising Part D drug plan premiums—which are increasing by 13 percent on average between 2015 and 201615 —because the hold-harmless provision applies only to premiums for Part B, not Part D. And the absence of a COLA for 2016 in and of itself has direct financial implications for roughly 60 million Social Security recipients, many of whom live on fixed incomes and rely on Social Security benefits as their primary source of income.16  Thus, in the face of flat Social Security benefits and rising out-of-pocket costs, many people on Medicare could have greater difficulty affording their medical care costs in the coming year.

Appendix

Appendix A

Table 1: Historical and Projected Social Security Cost-of-Living Adjustment, Average Monthly Social Security Benefits, and Medicare Part B and Part D Premiums and Deductibles, 1975-2024
YearSocial Security Cost-of-Living Adjustment1Average Monthly Social Security Benefit2MonthlyPart B Premium3Part B Premium Increase (%)Part B Deductible3Part B Deductible Increase (%)
19758.0%$212.07$6.70$60
19766.4%$232.75$6.700%$600%
19775.9%$254.33$7.207%$600%
19786.5%$277.89$7.707%$600%
19799.9%$314.47$8.206%$600%
198014.3%$359.25$8.706%$600%
198111.2%$396.28$9.6010%$600%
19827.4%$410.95$11.0015%$7525%
19833.5%$410.23$12.2011%$750%
19843.5%$429.46$14.6020%$750%
19853.1%$443.09$15.506%$750%
19861.3%$456.93$15.500%$750%
19874.2%$484.01$17.9015%$750%
19884.0%$504.88$24.8039%$750%
19894.7%$538.70$31.9029%$750%
19905.4%$559.32$28.60-10%$750%
19913.7%$592.77$29.905%$10033%
19923.0%$620.66$31.806%$1000%
19932.6%$645.91$36.6015%$1000%
19942.8%$665.67$41.1012%$1000%
19952.6%$688.37$46.1012%$1000%
19962.9%$708.70$42.50-8%$1000%
19972.1%$734.53$43.803%$1000%
19981.3%$754.23$43.800%$1000%
19992.5%$791.18$45.504%$1000%
20003.5%$842.84$45.500%$1000%
20012.6%$881.12$50.0010%$1000%
20021.4%$927.23$54.008%$1000%
20032.1%$963.80$58.709%$1000%
20042.7%$961.12$66.6013%$1000%
20054.1%$1,011.60$78.2017%$11010%
20063.3%$1,045.85$88.5013%$12413%
20072.3%$1,077.55$93.506%$1316%
20085.8%$1,083.34$96.403%$1353%
20090.0%$1,168.60$96.400%$1350%
20100.0%$1,189.77$110.5015%$15515%
20113.6%$1,231.96$115.404%$1625%
20121.7%$1,309.58$99.90-13%$140-14%
20131.5%$1,320.58$104.905%$1475%
20141.7%$1,367.58$104.900%$1470%
20150.0%$1,361.91$104.900%$1470%
20163.1%$1,341.00$118.80/$121.80413%/16%4$16613%
20172.7%n/a$120.702%5$1692%
20182.7%n/a$122.301%$1711%
20192.7%n/a$132.208%$1858%
20202.7%n/a$140.006%$1966%
20212.7%n/a$147.605%$2076%
20222.7%n/a$155.806%$2185%
20232.7%n/a$164.506%$2306%
20242.7%n/a$173.906%$2436%
NOTES: n/a is not available.1COLA increase applies to Social Security benefits in the following year. 2016-2024 amounts are projected.2Average monthly benefit for retired worker, by year of entitlement, December of each year, except for 2015 (August) and 2016 (January estimate).32017-2024 amounts are projected and do not include monthly repayment amounts (where applicable).4Premium amounts and percent increases shown without and with the $3 repayment amount. 5Amount represents percent increase over 2016 premium rate without the repayment surcharge.SOURCE: Kaiser Family Foundation, data from CMS, 2015 Medicare Trustees report, 2015 Social Security Trustees report, and 2016 Social Security Fact Sheet.

Appendix B

How the Hold-Harmless Provision Works

The following example illustrates how the hold-harmless provision works in a typical year with a Social Security COLA. Between 2012 and 2013, the standard Medicare premium increased by $5 from $99.90 to $104.90, and the Social Security COLA for 2013 was 1.7 percent. For a Medicare beneficiary receiving Social Security benefits of $300 per month in 2012, the 1.7 percent COLA translates to an additional $5.10 in 2013, which is sufficient to cover the premium increase. But for a beneficiary receiving $250 per month in Social Security benefits, the 1.7 percent COLA translates to just $4.25 in additional benefits in 2013, which would trigger the hold-harmless provision for this beneficiary. Rather than paying the full standard amount of $104.90 in 2013, this beneficiary would only be responsible for paying an additional $4.25 for the Part B premium, or $104.15. If the hold-harmless provision were not in place, this beneficiary would face a reduction in their Social Security benefits in order to pay the standard Part B premium amount.

Endnotes

  1. Centers for Medicare & Medicaid Services, “2016 Medicare Parts A& B Premiums and Deductibles Announced,” November 10, 2015. ↩︎
  2. 2015 Annual Report of the Boards of Trustees of the Federal Hospital Insurance and Federal Supplementary Medical Insurance Trust Funds. ↩︎
  3. The hold-harmless provision is described in Section 1839(f) of the Social Security Act. ↩︎
  4. Deductions can also be made from Railroad Retirement benefits, if applicable. Certain individuals are exempt from this requirement, including beneficiaries enrolled in both Medicare and Medicaid (“dually eligible” beneficiaries). See Section 1840 of the Social Security Act. ↩︎
  5. The projected 52 percent increase in the Part B premium does not reflect the growth rate in Part B per capita spending. Although the Trustees stated that overall Part B program spending was higher than expected, average Part B per capita spending grew at 2.7 percent in 2011 and 2012, 0.2 percent in 2013, and 4.5 percent in 2014, and is projected to grow at an average annual rate of 4.7 percent between 2014 and 2024. See 2015 Annual Report of the Boards of Trustees of the Federal Hospital Insurance and Federal Supplementary Medical Insurance Trust Funds, Table V.D1. ↩︎
  6. The CPI-W is produced by the U.S. Department of Labor, Bureau of Labor Statistics. ↩︎
  7. Bureau of Labor Statistics, “Consumer Price Index – September 2015,” News Release, October 15, 2015, available at http://www.bls.gov/news.release/cpi.nr0.htm. ↩︎
  8. Social Security Administration, “Law Does Not Provide for a Social Security Cost-of-Living Adjustment for 2016,” Press Release, October 15, 2015, available at http://www.ssa.gov/news/press/releases/#/post/10-2015-1. ↩︎
  9. Centers for Medicare & Medicaid Services, “2016 Medicare Parts A& B Premiums and Deductibles Announced,” November 10, 2015. ↩︎
  10. Unpublished data from Urban Institute/DYNASIM. ↩︎
  11. 2015 Annual Report of the Boards of Trustees of the Federal Hospital Insurance and Federal Supplementary Medical Insurance Trust Funds, Table V.B4. ↩︎
  12. Centers for Medicare & Medicaid Services, Department of Health and Human Services, “Medicare Program; Medicare Part B Monthly Actuarial Rates, Premium Rate, and Annual Deductible Beginning January 1, 2016,” pre-publication version available at https://s3.amazonaws.com/public-inspection.federalregister.gov/2015-29181.pdf; Federal Register, November 16, 2015 (forthcoming), available at http://federalregister.gov/a/2015-29181. ↩︎
  13. Juliette Cubanski and Tricia Neuman, “Medicare’s Income-Related Premiums: A Data Note,” June 2015, available at https://modern.kff.org/medicare/issue-brief/medicares-income-related-premiums-a-data-note/. ↩︎
  14. 2015 Annual Report of the Board of Trustees of the Federal Old-Age and Survivors Insurance and Federal Disability Trust Funds. ↩︎
  15. Jack Hoadley, Juliette Cubanski, and Tricia Neuman, “Medicare Part D: A First Look at Plan Offerings in 2016,” October 2015, available at https://modern.kff.org/medicare/issue-brief/medicare-part-d-a-first-look-at-plan-offerings-in-2016/. ↩︎
  16. The COLA also determines the percentage increases in Supplemental Security Income (SSI), veterans’ pensions, and railroad retirement benefits. ↩︎
News Release

Health Care and the 2016 Debates

Published: Nov 11, 2015

In his latest column for The Wall Street Journal’s Think Tank, Drew Altman discusses the lack of attention to health in the primary debates and last week’s Democratic forum in South Carolina.

All previous columns by Drew Altman are available online.

Round 2 on the Legal Challenges to Contraceptive Coverage: Are Nonprofits “Substantially Burdened” by the “Accommodation”?

Published: Nov 9, 2015

The Affordable Care Act (ACA) requires most private health insurance plans to provide coverage for a broad range of preventive services including Food and Drug Administration (FDA) approved prescription contraceptives and services for women. Since the implementation of the ACA contraceptive coverage requirement in 2012, over 200 corporations have filed lawsuits claiming that including coverage for contraceptives or opting for an “accommodation” from the federal government violates their religious beliefs. The legal challenges have fallen into two groups: those filed by for-profit corporations and those filed by nonprofit organizations.

In the Burwell v. Hobby Lobby decision, the Supreme Court ruled that “closely held” for-profit corporations may be exempted from the requirement. This ruling, however, only settled part of the legal questions raised by the contraceptive coverage requirement, as there are there are other legal challenges brought by nonprofit corporations. The nonprofits are seeking an “exemption,” meaning their workers would not have coverage for some or all contraceptives, rather than an “accommodation,” which entitles their workers to full contraceptive coverage but releases the employer from paying for it. In 2014, the Supreme Court issued emergency orders for a religiously-affiliated nursing home, Little Sisters of the Poor1 , and a religious college, Wheaton College, that allowed these nonprofits to let the government know about its objection to the contraceptive coverage, rather than directly notifying their insurer while the litigation proceeded through the lower courts.

The lawsuits brought by nonprofits have worked their way through the federal courts. Seven federal appeals courts have ruled in favor of the Government upholding the accommodation, and one federal appeals court has ruled in favor of the nonprofits. On November 6, 2015, the Supreme Court agreed to hear seven cases that involve nonprofit corporations. These lawsuits have been filed by: David A. Zubik (the Bishop of the Roman Catholic Diocese of Pittsburgh), Priests for Life, Roman Catholic Archbishop, East Texas Baptist University, Little Sisters of the Poor, Southern Nazarene University, and Geneva College. These cases are explained in more detail below.

This brief explains the legal issues raised by the nonprofit litigation and discusses the impact of the Hobby Lobby decision on the current litigation.

What are the rules that employers with religious objections to contraception must follow?

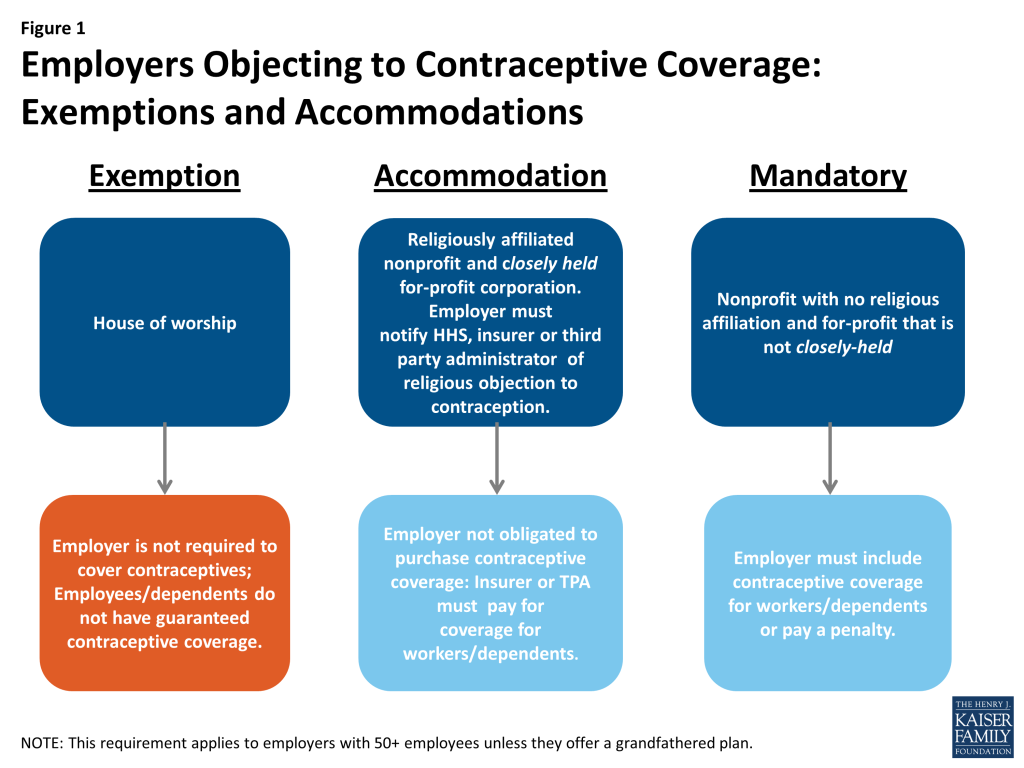
As the contraceptive coverage rules have evolved through litigation and new regulations, there are three classes of employers with differing requirements. Houses of worship can choose to be exempt from the requirement if they have religious objections (Figure 1). Workers and dependents of exempt employers do not have coverage for either some or all FDA approved contraceptive methods. Religiously-affiliated nonprofits and closely held for-profit corporations can opt out of providing contraceptive coverage by electing an accommodation, but are not eligible for an exemption. Women workers and dependents that are covered by a plan sponsored by an employer electing an accommodation have contraceptive coverage, but their employer does not have to pay for it. The accommodation was originally developed to release nonprofit religiously-affiliated employers that oppose birth control from the requirement of paying for contraceptive coverage, and still assure that the employees and their dependents are able to obtain full coverage for contraceptives directly from the insurer as they are entitled to under the law. This is done by requiring the insurer to bear the costs of the employees’ contraceptive coverage rather than the employer.

Figure 1: Employers Objecting to Contraceptive Coverage: Exemptions and Accommodations

Closely held corporations with religious objections to contraceptive coverage were exempt as a result of the Hobby Lobby decision in June 2014, until the Administration issued new regulations in July 2015. The new regulations extend the accommodation available to religiously affiliated nonprofit employers to closely held2  for profit corporations that have adopted a resolution establishing that the corporation objects to some or all contraceptive services on account of the owners’ sincerely held religious beliefs.3  Starting in the new plan year, Hobby Lobby and other closely held corporations with religious objections will be required to notify their insurer, third party administrator, or HHS so that the insurer or administrator can still provide the contraceptive coverage directly to the employees and their dependents. These regulations have the effect of restoring contraceptive coverage to workers employed by closely held corporations with religious objections.

Initially the accommodation was triggered by having the religiously-affiliated nonprofit complete an EBSA 700 form to self-certify that the organization is an eligible organization4  and has a religious objection to providing coverage for some or all of any contraceptive services. The employer had to send the completed form to its insurer or third party administrator. The back of the form has a notice to third party administrators of self-insured plans outlining their legal responsibilities. In August 2014, the Administration issued interim final regulations, that were finalized in July 2015, allowing religiously-affiliated nonprofit corporations that object to the contraceptive coverage an additional choice: either to notify their insurance company or notify the Department of Health and Human Services (HHS) about their objection. The regulations issued in July 2015 extend the same accommodation to closely held corporations with religious objections to contraceptive coverage. These final rules allow religiously affiliated nonprofits and closely held for profit corporations to elect an accommodation by notifying HHS their insurance carrier or their third party administrator. If the nonprofit or closely held corporation notifies HHS, they must include the contact information for their insurance company.

Many of the nonprofits that had raised initial objections still believe that the accommodation, even with ability to notify HHS, does not satisfy their concerns. These religiously-affiliated nonprofit organizations contend that when the insurer separately contracts with an employer’s workers to cover contraception at no cost, it remains part of the employer’s plan and is financed by the employer. They object to notifying HHS, insurance company or their third party administrator “to provide the morally objectionable coverage and allow their health plans to be used as a vehicle to bring about a morally objectionable wrong.”5  They feel that by providing notice they will “facilitate” or “trigger” the provision of insurance coverage for contraceptive services. The Government contends that it is federal law that requires the insurance issuer or the third party administrator to provide this coverage.

What is the basis for the challenges brought by the religious nonprofits?

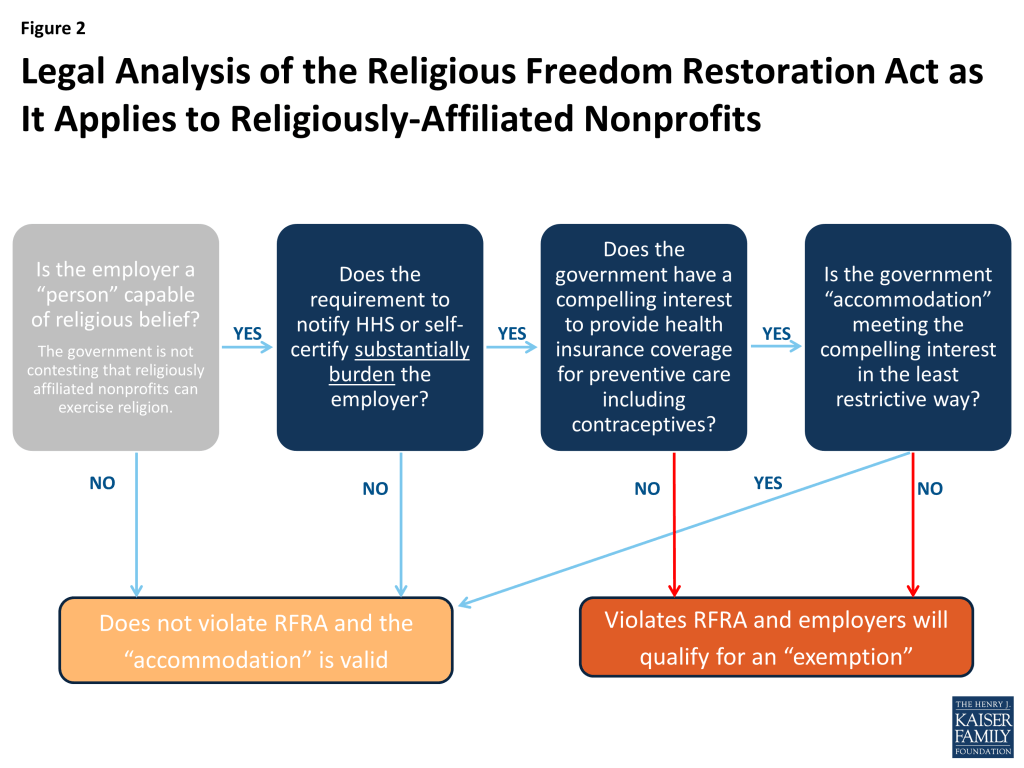
The nonprofit corporations continuing to pursue legal challenges are seeking an “exemption” from the rule, not an “accommodation.” The nonprofit legal challenges involve a different question than the one raised by the for-profit challenges: Does the notice requirement to elect an “accommodation” to the contraceptive coverage requirement “substantially burden” the nonprofits’ religious exercise? The employers challenging the contraceptive coverage requirement contend that they are unjustly burdened under the Religious Freedom Restoration Act (RFRA). RFRA was enacted in 1993 to protect “persons” from generally applicable laws that burden their free exercise of religion.

RFRA requires the government to show the law in question (in this case the requirement that employers notify HHS or their insurance company of their objection to including coverage for some or all contraceptive methods) furthers a “compelling interest” in the “least restrictive means” when it “substantially burdens a person’s exercise of religion.” The Court must consider a series of threshold questions in deciding whether the contraceptive coverage requirement is in violation of RFRA (Figure 2).

Figure 2: Legal Analysis of the Religious Freedom Restoration Act as It Applies to Religiously-Affiliated Nonprofits

In the Burwell v. Hobby Lobby case much of the attention was focused on the first question under the legal analysis: Can closely held for-profit corporations “exercise religion” under RFRA? In the nonprofit cases the focus is shifted to the second question under the RFRA analysis. The nonprofit corporations must demonstrate that the regulation, even with the accommodation, substantially burdens their exercise of religion. Just as in the cases brought by for-profit corporations, if the nonprofit corporation can show that it is substantially burdened, then the government will then need to prove that the contraceptive coverage requirement is a “compelling interest” that is met in the “least restrictive means.”

In the Court’s Hobby Lobby ruling, Justice Alito, wrote about the accommodation as a “less restrictive means,” to provide contraceptive coverage. The Court, however, did not decide whether the accommodation is lawful: “We do not decide today whether an approach of this type complies with RFRA for purposes of all religious claims. At a minimum, however, it does not impinge on the plaintiffs’ religious belief that providing insurance coverage for the contraceptives at issue here violates their religion, and it serves HHS’s stated interests equally well.”6 

What are the pending cases?

Since the Obama Administration issued the new regulations in August 2014, seven federal courts of appeals have issued decisions in nine cases denying stays to nonprofit employers, and one federal court of appeals issued stays to the nonprofits in two cases. (Table 1) On November 6, 2015 the Supreme Court granted review (at least in part) to seven cases.

In February 2015, the Third Circuit Court of Appeals issued a decision in the case brought by Geneva College and the Bishops of Pittsburgh (Zubik) and Eerie (Persico), and nonprofit Catholic Charities. The court ruled that the self-certification procedure is not burdensome to the nonprofits. The Bishops and Catholic Charities then filed an emergency petition with the Supreme Court asking for a stay. In May 2015, Zubik et al.  filed a brief requesting that the Supreme Court review the case. On June 29, 2015, the Supreme Court denied the request for a stay, but allowed the plaintiffs to inform the government of their objection, and the government to facilitate contraceptive coverage for the workers and dependents, while the Court decided whether to take the case in the next term. Geneva College also petitioned the Supreme Court for review of their case. On November 6, 2015, the Supreme Court granted review to both Zubik and Geneva College.

In another case, in November 2014, a panel of the DC Court of Appeals issued a decision in the case brought by Priests for Life,  Roman Catholic Archbishop and other Catholic nonprofit organizations. This court also found that the accommodation offered by the government does not substantially burden the plaintiffs’ religious exercise, the regulations advance compelling government interests, and the regulations are the least restrictive means for advancing those interests. In December 2014, the plaintiffs petitioned for rehearing en banc, asking the full D.C. Circuit to rehear the case. On May 20, 2015, the court denied the request for the rehearing. Priests for Life and Roman Catholic Archbishop of Washington requested review by the Supreme Court, and on November 6, 2015, the Supreme Court granted review for both cases.

In addition, the Supreme Court has sent two cases, previously decided before the Hobby Lobby decision, back to the lower courts to be reconsidered in light of the Hobby Lobby ruling. In March 2015, the Supreme Court granted the University of Notre Dame’s request to order a reconsideration of its claim based on the decision in Burwell v. Hobby Lobby, requiring the 7th Circuit Court of Appeals to rehear of the case. On May 19, 2015 the 7th Circuit Court of Appeals issued a decision, similar to the decisions issued by the 3rd Circuit and the DC Circuit, denying Notre Dame’s request for a stay. The Court again rejected Notre Dame’s argument that the accommodation requires them to be “complicit” in obtaining contraceptive coverage for their students and employees. The court stated, “It is federal law rather than the religious organization’s signing and mailing the form, that requires health-care insurers, along with third party administrators of self-insured health plans, to cover contraceptive services.”7  The 7th Circuit Court of Appeals has issued similar decisions for College of Wheaton College v. Burwell, and for Grace Schools, et al., And Diocese Of Fort Wayne-South Bend, Inc., et al. v. Burwell, holding that the accommodation is not a substantial burden on the nonprofits.

The Supreme Court has also ordered the 6th Circuit court of Appeals to reconsider its decision in Michigan Catholic Charities v. Burwell in light of Hobby Lobby. On August 21, 2015, the 6th Circuit Court of Appeals issued a decision, holding that the accommodation is not a substantial burden on the plaintiffs. Plaintiffs in the case include both religious employers eligible for the exemption and religiously affiliated nonprofits eligible for the accommodation. One exempt employer, Michigan Catholic Conference (MCC), sponsors a health plan that includes the religiously affiliated nonprofit plaintiffs that are not exempt. MCC’s challenge is based on its desire to continue sponsoring a health plan (that does not include contraceptive coverage) for both exempt and non-exempt employers. In the same case, the nonprofit religiously affiliated organizations claim that the accommodation places a substantial burden on them. While the Court re-considered its decision in light of Hobby Lobby, the Court reached the same conclusion that the accommodation does not violate RFRA.

On June 22, 2015, the 5th Circuit Court of Appeals issued a decision for East Texas Baptist University v. Burwell, a consolidated case brought by religious nonprofits. Finding that the accommodation does not violate RFRA, the Court wrote, “Although the plaintiffs have identified several acts that offend their religious beliefs, the acts they are required to perform do not include providing or facilitating access to contraceptives. Instead, the acts that violate their faith are those of third parties. Because RFRA confers no right to challenge the independent conduct of third parties, we join our sister circuits in concluding that the plaintiffs have not shown a substantial burden on their religious exercise.”8  In July 2015, the plaintiffs appealed this case to the Supreme Court, and on November 6, 2015 the Supreme Court granted review.

On July 14, 2015, the 10th Circuit Court of Appeals issued a decision denying the Little Sisters of the Poor, Southern Nazarene University and other religiously affiliated nonprofits’ request for a stay. The Court found: “The accommodation relieves Plaintiffs from complying with the Mandate and guarantees they will not have to provide, pay for, or facilitate contraceptive coverage. Plaintiffs do not “trigger” or otherwise cause contraceptive coverage because federal law, not the act of opting out, entitles plan participants and beneficiaries to coverage. Although Plaintiffs allege the administrative tasks required to opt out of the Mandate make them complicit in the overall delivery scheme, opting out instead relieves them from complicity. Furthermore, these de minimis administrative tasks do not substantially burden religious exercise for the purposes of RFRA.”9  In July 2015, the Little Sisters of the Poor and Southern Nazarene University appealed their  cases to the Supreme Court, and on November 6, 2015 the Supreme Court granted review for both cases.

On August 7, 2015, the 2nd Circuit Court of Appeals issued a decision upholding the accommodation. In a case brought by two Catholic high schools, and two Catholic health care systems, the Court found: “Eligible organizations are provided the opportunity to freely express their religious objection to such coverage as well as to extricate themselves from its provision. At the same time, insured individuals are not deprived of the benefits of contraceptive coverage.”10  The Court compared the accommodation to the notification required by religious objectors to the military draft.11 

On September 17, 2015, the 8th Circuit Court of Appeals became the first federal court of appeals to rule that the accommodation violates RFRA. The Court ruled in two separate cases (Sharpe Holdings Inc. et al. v. Burwell, and Dordt College et al. v. Burwell) that the religiously affiliated nonprofits are substantially burdened by the accommodation to the contraceptive coverage requirement, and the accommodation is not the least restrictive means of furthering the government’s interests.

Are there other types of nonprofits that are litigating?

On August 31, 2015, the DC District Court issued a decision in a case brought by March for Life, and two of its employees. March for Life was formed after the Roe v. Wade decision in 1973, and claims moral objections to many forms of contraceptives. As secular nonprofit, it is not eligible for the exemption or accommodation available to religious organizations. The employer’s claim is that that the government has violated equal protection under the 5th Amendment by treating secular organizations with moral objections differently from religious organizations with religious objections. Two employees of March for Life are also challenging the contraceptive coverage requirement under RFRA claiming they have religious objections to contraceptives, and do not want contraceptive coverage included in their plan. U.S. District Court Judge Leon ruled issued a decision favorable to both March for Life and the two employees. The Administration is likely to appeal this decision to the DC Court of Appeals.

What’s next?

Beginning in the new plan year, Hobby Lobby and other similar corporations will be required to notify their insurer or HHS of their objection to contraceptive coverage so that the insurer can still provide the contraceptive coverage directly to the employees and their dependents. Depending on the outcome of the consolidated case before the Supreme Court, some closely held corporations may challenge the accommodation as applied to them, contending that the accommodation still substantially burdens the corporation, in much the same way that the religiously-affiliated nonprofits have done.

In reviewing the consolidated case,  Zubik v. Burwell, the Supreme Court will have to decide whether the accommodation substantially burdens the religious exercise of both nonprofits, whether the government has a compelling interest, and whether there is a less restrictive way of achieving the same of goal of allowing women coverage for all FDA-approved contraceptive methods without cost-sharing. On a separate track, March for Life has challenged the contraceptive coverage requirement as a secular nonprofit under equal protection principles. This case represents a new legal approach and first time includes employees. The outcome of these cases will determine if the employees and dependents of these corporations will have access to no cost contraceptive coverage, as intended under the ACA.

Table 1: Selected Pending Nonprofit Cases as of November 6, 2015(Shaded cases to be reviewed by Supreme Court this term)
LawsuitCase HistoryStatus
Zubik et. al.v. BurwellOn February 11, 2015, a unanimous 3rd Circuit panel issued a decision that the accommodation does not impose a substantial burden on plaintiffs’ religious exercise. The Third Circuit denied plaintiffs’ petition for a rehearing en banc and request for a stay. Zubik et. al filed an emergency petition with the Supreme Court asking for a stay.On April 15, 2015, Justice Alito issued a temporary stay allowing the plaintiffs to not comply with the accommodation while the Government submitted a response to the Court (submitted April 20, 2015). In May 2015, the plaintiffs filed a brief requesting that the Supreme Court review the case. On June 29, 2015, the Supreme Court denied the request for a stay, but allowed the plaintiffs to inform the government of their objection, and the government to facilitate contraceptive coverage for the workers and dependents, while the Court decided whether to take the case in the next term. On November 6, 2015 the Supreme Court granted review on the RFRA challenges but not the First Amendment challenge.
Geneva College v. BurwellOn February 11, 2015, a unanimous 3rd Circuit panel issued a decision that the accommodation does not impose a substantial burden on plaintiffs’ religious exercise. The Third Circuit denied plaintiffs’ petition for a rehearing en banc and request for a stay.On May 18, 2015 the 3rd Circuit granted Geneva College (which did not join the emergency petition to the Supreme Court) a temporary stay pending a response and further orders by the Supreme Court in Persico and Zubik. In August 2015, Geneva College filed a brief requesting the Supreme Court to review the case. On November 6, 2015, the Supreme Court granted review.
Priests for Life v. HHS;

Roman Catholic Archbishop of Washington  v. Burwell

The DC Circuit Court of Appeals panel ruled that the accommodation does not impose a substantial burden on plaintiffs’ religious exercise, the regulations advance compelling government interests, and the regulations are the least restrictive means. Plaintiffs petitioned for a re-hearing en banc asking the full D.C. Circuit to rehear the case.On May 20, 2015 DC Circuit Court of Appeals denied the request for an en banc hearing. In June 2015, the Priests for Life and Roman Catholic Archbishop of Washington filed  briefs asking the Supreme Court to review the case. The DC Circuit Court has stayed enforcement pending the Supreme Court’s decision on whether to take the case. On November 6, 2015 the Supreme Court granted review for both cases.
East Texas Baptist University v. BurwellThe 5th Circuit Court of Appeals ruled that accommodation does not impose a substantial burden on plaintiff’s religious exercise. RFRA does confer the right to challenge independent conduct of third parties.The 5th Circuit Court of Appeals issued a decision on June 22, 2015. In July 2015, the plaintiffs appealed to the Supreme Court. On November 6, 2015 the Supreme Court granted review for both cases.
Southern Nazarene University et al. v. BurwellU.S. District Court for the Western District of Oklahoma, granted plaintiffs’ motion for a preliminary injunction and then stayed proceedings until March 1, 2014. The government appealed to the 10th Circuit.The 10th Circuit issued a decision on July 14, 2015, denying Southern Nazarene University a stay. On July 24, 2015 the plaintiffs submitted a brief requesting the Supreme Court to review the case. On November 6, 2015 the Supreme Court granted review.
Little Sisters of the Poor v. Burwell  The Supreme Court granted plaintiffs’ emergency application for an injunction pending appeal on the condition that they file notice with HHS that they are organizations that hold themselves out as religious and have religious objection to contraceptive coverage. Following the government’s issuance of interim final rules amending the accommodation for nonprofit, the parties filed supplemental briefs addressing the impact of those rules on the caseThe 10th Circuit issued a decision on July 14, 2015, denying Little Sister of the Poor a stay. On July 28, 2015, the plaintiffs submitted a brief requesting the Supreme Court to review the case. On November 6, 2015 the Supreme Court granted review, but will not consider the question about whether RFRA is violated by treated houses of worship differently than religiously affiliated nonprofits.
Wheaton College v. Burwell Wheaton filed an emergency application for an injunction pending appeal with the Supreme Court. On July 3, 2014, the Supreme Court granted Wheaton’s emergency application for an stay pending an appeal on the condition that it file notice with HHS that it is an organization that holds itself out as religious and has a religious objection to contraceptive coverage. On July 1, 2015, the 7th Circuit Court of Appeals ruled that the accommodation does not impose a substantial burden on plaintiff’s religious exercise.The 7th Circuit Court of Appeals issued a decision on July 1, 2015, denying the request for a stay.
Grace Schools, et al., And Diocese Of Fort Wayne-South Bend, Inc., et al. v. Burwell On September 4, 2015, the 7th Circuit Court of Appeals issued a decision denying the plaintiffs request for a stay, holding the accommodation is not impose a substantial burden on the plaintiffs.The 7th Circuit Court of Appeals issued a decision on September 4, 2015, denying the request for a stay.
University of Notre Dame v. Sebelius The 7th Circuit Court of Appeals issued a decision on February 21, 2014, denying Notre Dame a preliminary injunction. Plaintiffs asked the Supreme Court to require the 7th Circuit Court of Appeals reconsider the case in light of Hobby Lobby. The Supreme Court granted the request.The 7th Circuit Court of Appeals issued a decision on May 19, 2015, denying Notre Dame a preliminary injunction. On July 25, 2015, the 7th Circuit denied plaintiffs’ petition for rehearing en banc.
Michigan Catholic Conference v. Burwell/ Catholic Diocese of Nashville v. Burwell  On June 11, 2014 a unanimous 6th Circuit panel denied plaintiffs a preliminary injunction, holding that the accommodation did not impose a substantial burden. On December 18, 2014, Plaintiffs filed a petition asking the Supreme Court to consider the case. The Supreme Court sent the case back to the 6th Circuit to re-consider in light of Hobby Lobby.On August 21, 2015, the 6th Circuit Court of Appeals issued its decision denying the plaintiffs request for a stay.
Catholic Health Care System et al. v. BurwellThe 2nd Circuit Court of Appeals ruled that the accommodation does not impose a substantial burden on plaintiff’s religious exercise.The 2nd Circuit Court of Appeals issued a decision on August 7, 2015, upholding the accommodation.
Sharpe Holdings, Inc. et al. v. BurwellOn December 20, 2013, the United States District Court for the Eastern District of Missouri issued a stay to the plaintiffs.On Sept 17, 2015, the 8th Circuit Court of Appeals issued a decision upholding the stay for the nonprofits, and ruling that the accommodation is a substantial burden to the plaintiffs, and the government has less restrictive means.
Dordt College et al. v. BurwellOn May 21, 2014, the United States District Court for the Northern District of Iowa issued a stay to the plaintiffs.On Sept 17, 2015, the 8th Circuit Court of Appeals issued a decision upholding the stay for the nonprofits, and ruling that the accommodation is a substantial burden to the plaintiffs, and the government has less restrictive means.
  1. The case of Little Sisters of the Poor raises a new twist in the legal framework surrounding the contraception coverage requirement under the ACA. Little Sisters, a religiously affiliated nonprofit employer eligible for an accommodation, has a self-funded church plan. A church plan is a special designation under federal law that is exempt from ERISA. In the litigation, the Government has stated that it has no authority to require a third party administrator for a self-funded church plan to comply with the federal regulations. Therefore, the workers and dependents of employers with self-funded church plans that object to the coverage will not receive coverage for some or all contraceptives unless the third party administrator voluntarily decides to offer the contraceptive coverage. ↩︎
  2. The Administration defines closely held corporation as an entity that 1) is not a nonprofit, 2) has no publicly traded ownership interests, and  3) has more than 50 percent of the value of its ownership interest owned directly or indirectly by five or fewer individuals. 45 CFR §147.131 (b)(4) ↩︎
  3. 45 CFR §147.131 (b)(2)(ii) ↩︎
  4. This “accommodation” was originally available to “eligible organizations” meeting the criteria: 1) opposes providing for some or all of any contraceptive coverage on account of religious objections; 2) has nonprofit status; 3) holds itself out as a religious organization; and 4) self-certifies that it meets the first three criteria. 26 CFR § 54.9815-2713A; 29 CFR § 2590-2713A; 45 CFR § 147.31 ↩︎
  5. Zubik et al. v. Burwell, Emergency Application to Recall and Stay Mandate or Issue Injunction Pending Resolution of Certiorari Petition, April 15, 2015, page 17 ↩︎
  6. Burwell v. Hobby Lobby Stores, Inc., 134 S. Ct. 2751, at 2775-76 (2014) ↩︎
  7. Seventh Circuit Court of Appeals decision issued May 19, 2015, University of Notre Dame, Plaintiff-Appellant, v. Sylvia Mathews Burwell, Secretary of U.S. Department of Health & Human Services, et al., Defendants-Appellees, and Jane Doe 3, pages 15-16. ↩︎
  8. Fifth Circuit Court of Appeals decision issued June 22, 2015, East Texas Baptist University v. Burwell, pages 15- 16 ↩︎
  9. Tenth Circuit Court of Appeals decision issued July 14, 2015, Little Sisters of Poor v. Burwell, page 32. ↩︎
  10.   Second Circuit Court of Appeals decision issued August 7, 2015,  Catholic Health Care System, et al.  v,  Burwell, page 27 ↩︎
  11. Ibid, Page 31 ↩︎

The Role of Language in Health Care Access and Utilization for Insured Hispanic Adults

Authors: Samantha Artiga, Katherine Young, Elizabeth Cornachione, and Rachel Garfield
Published: Nov 9, 2015

Executive Summary

Language can play an important role in individuals’ access to and use of health care and impact their understanding of their health coverage and communications with their provider. The Affordable Care Act (ACA) coverage expansions may help mitigate barriers people with limited English proficiency (LEP) face in accessing coverage and care. However, individuals with LEP may still face increased challenges after gaining coverage. To better understand how health care experiences vary by language, this analysis examines differences between English- and Spanish-speaking Hispanic adults with insurance using data from the 2014 Kaiser Survey of Low-Income Americans and the ACA. The findings show that among insured Hispanic adults:

Demographics. Spanish-speakers are as likely as English-speakers to have a worker in the family but are lower income, older, and more likely to report an ongoing health condition than English-speakers.

Heath Plan Experiences. There are few differences between Spanish- and English-speakers in experiences choosing a plan, the likelihood of having problems with their plan paying for services, or experiencing difficulties interacting with their plan. However, Spanish-speakers give lower ratings to their plan, have more limited understanding of their coverage, and are more likely to have gaps in coverage for needed services than English-speakers.

Access and Utilization. There are no significant differences between Spanish- and English-speakers in their access to and use of care, although clinics play a significantly larger role as a source of care for Spanish-speakers. The majority of both groups report good communications with their provider.

Affordability. Reflecting their more limited incomes, Spanish-speakers are more likely than English-speakers to be concerned about their ability to afford health care. Further, although Spanish-speakers are less likely to have a premium, those who do are nearly twice as likely as English speakers to report difficulty paying it.

The findings show that, among insured Hispanic adults, Spanish-speakers face some increased challenges compared to English-speakers. They have greater gaps in their understanding of their coverage, and, as such, may benefit from targeted education efforts. Moreover, given their more limited incomes, affordability of coverage and care is particularly important for Spanish-speakers. Despite these challenges, Spanish-speakers are as likely as those who speak English to receive care and communicate well with their provider. These findings suggest that clinics, which most Spanish-speakers rely on as their usual source of care and have a longstanding role serving a diverse population, are likely effective in connecting them to care and ensuring good communication with patients.

Issue Brief

As of 2013, and estimated 25.1 million individuals living in the United States had Limited English Proficiency (LEP), meaning that they reported being unable to speak English “very well.”1  Hispanic, Spanish-speaking adults account for the majority individuals with LEP in the United States.2  Individuals with LEP may face increased barriers to accessing health coverage and care compared to English-speakers.3  While gains in health coverage under the Affordable Care Act (ACA) may help reduce some of these barriers, individuals with LEP may still face increased challenges to accessing and utilizing care, understanding their health coverage, and communicating with their health care providers.

To better understand how health care experiences vary by language spoken, this analysis examines differences between English- and Spanish-speaking Hispanic adults with insurance. It is based on data from the 2014 Kaiser Survey of Low-Income Americans and the ACA. The survey of 10,502 nonelderly adults was fielded between September 2 and December 15, 2014. Data were analyzed for Hispanics with insurance. The total sample of 1,950 people included individuals who completed the survey in Spanish and reported not speaking English well,4  referred to as Spanish-speakers (n=628), and those who completed the survey in English (n=1,322), referred to as English-speakers. Individuals who completed the survey in Spanish and reported speaking English well were excluded from the analysis (n=111).

Findings

Demographic Characteristics, Health Needs, and Health Coverage

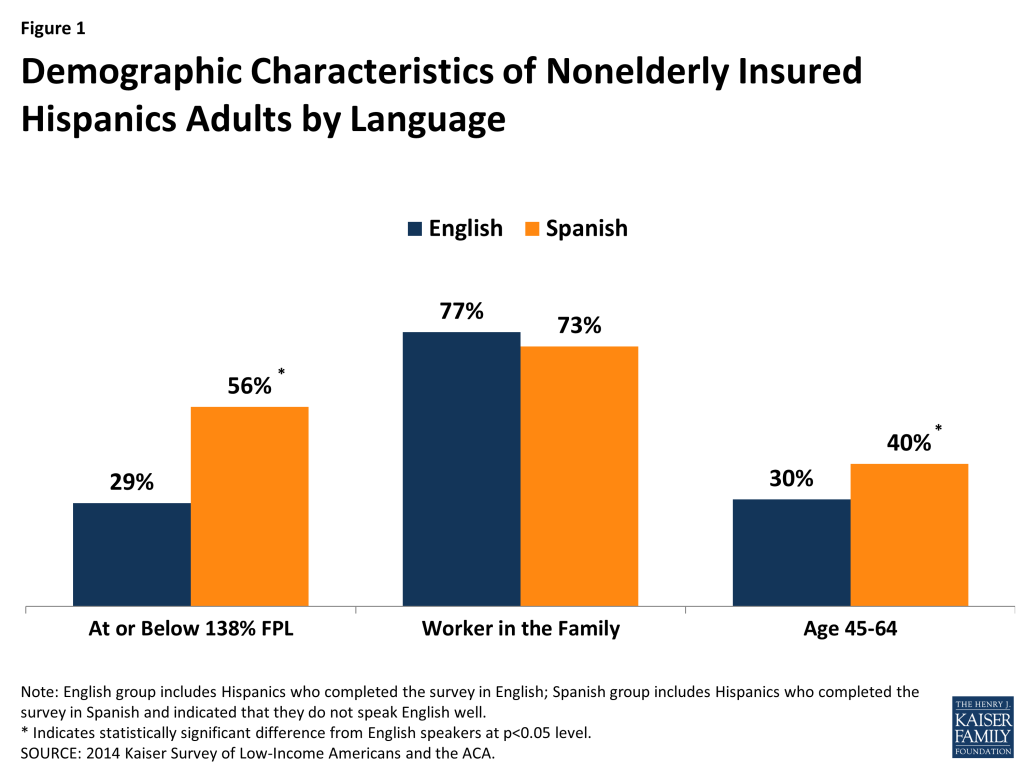
Spanish-speaking insured Hispanic adults are as likely as their English-speaking counterparts to have a worker in the family, but are lower income and older. About one in five (18%) of insured Hispanic adults are Spanish-speakers. Although Spanish-speakers are as likely as those who speak English to have a worker in the family, over half (56%) of Spanish-speakers have incomes below 138% of the Federal Poverty Level (FPL) compared to 29% of those who speak English (Figure 1). With regard to age, four in ten Spanish-speakers are between ages 45-64, compared to three in ten English-speakers. 

Figure 1: Demographic Characteristics of Nonelderly Insured Hispanics Adults by Language

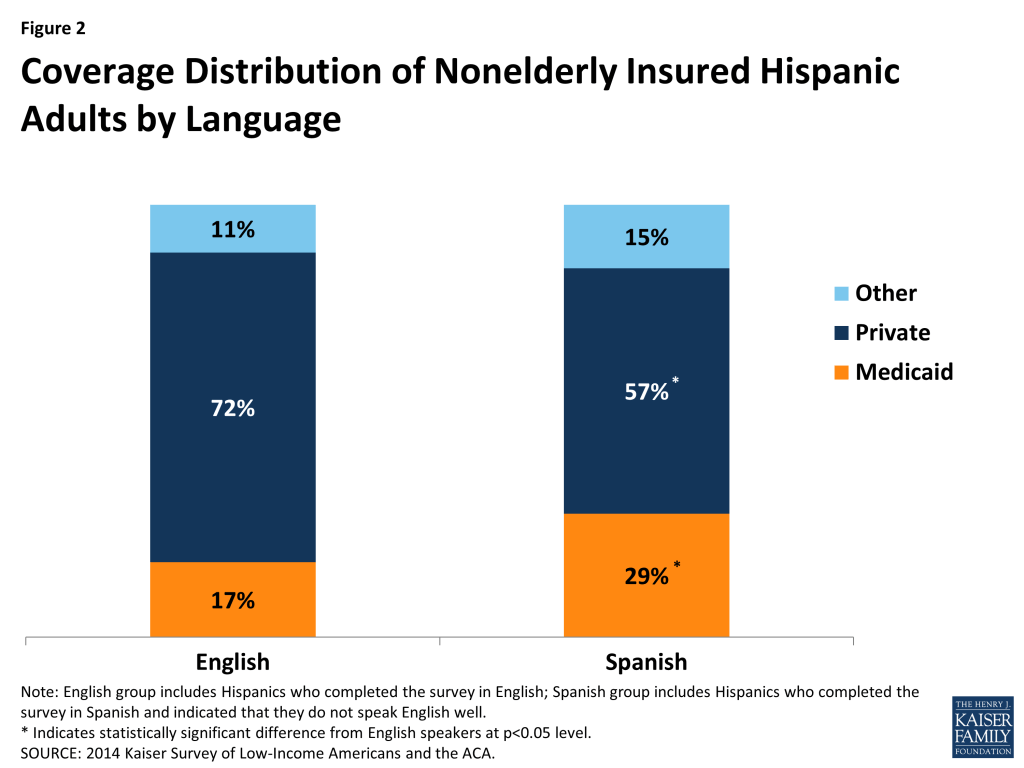
Reflecting their lower incomes, Spanish-speaking insured Hispanic adults are more likely to be covered by Medicaid and less likely to have private coverage compared to English-speakers. Among insured Hispanic adults, 29% of Spanish-speakers are covered by Medicaid compared to 17% of English-speakers (Figure 2). Further, nearly three-quarters (72%) of English-speakers have private coverage versus 57% of Spanish-speakers.

Figure 2: Coverage Distribution of Nonelderly Insured Hispanic Adults by Language

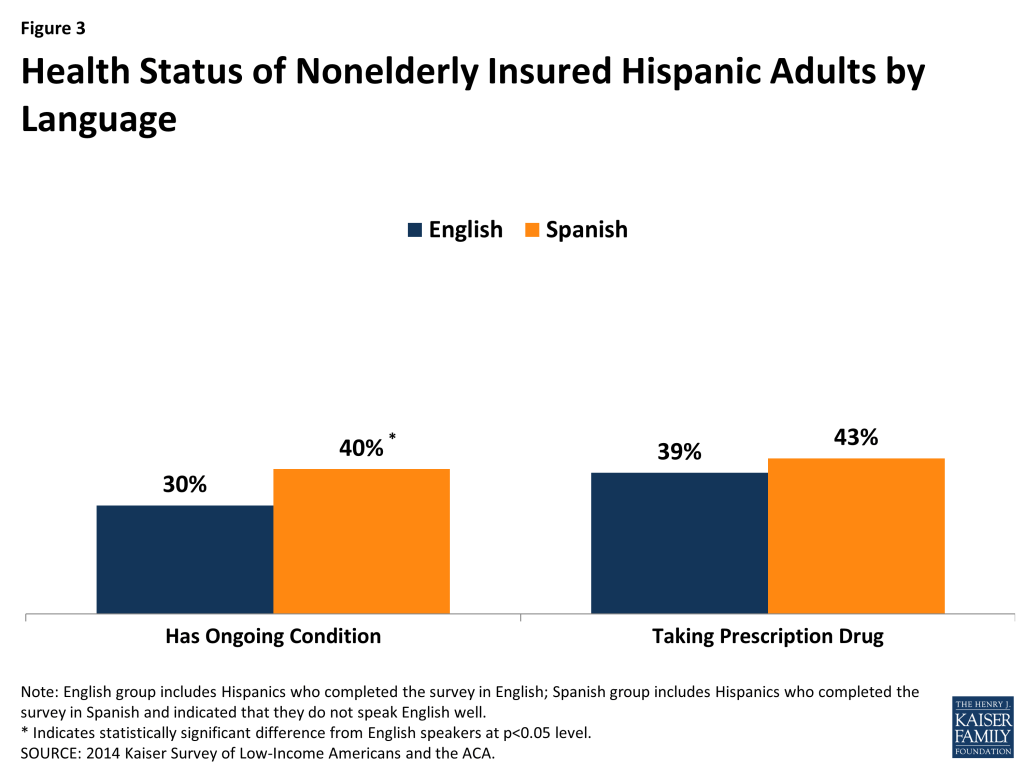
Among insured Hispanic adults, Spanish-speakers are more likely to report an ongoing condition compared to English-speakers. Four in ten Spanish-speakers report an ongoing condition compared to three in ten English-speakers (40% vs. 30%) (Figure 3). However, there are no significant differences in the shares of Spanish- and English-speakers who report taking a prescription drug.

Figure 3: Health Status of Nonelderly Insured Hispanic Adults by Language

Health Plan Experiences and Understanding of Health Coverage

Among insured Hispanic adults, language plays a limited role in whether individuals experience difficulties choosing a plan. There are no significant differences in the shares of English- and Spanish-speakers who found it somewhat or very difficult to compare services or costs when choosing a plan, with roughly a quarter of adults reporting these challenges (Figure 4). Spanish-speakers are significantly less likely than English-speakers to say it is somewhat or very difficult to compare providers when choosing a plan (13% vs. 22%), but still only a minority of both groups report this problem.

Figure 4: Difficulties Choosing a Health Plan among Nonelderly Insured Hispanic Adults by Language

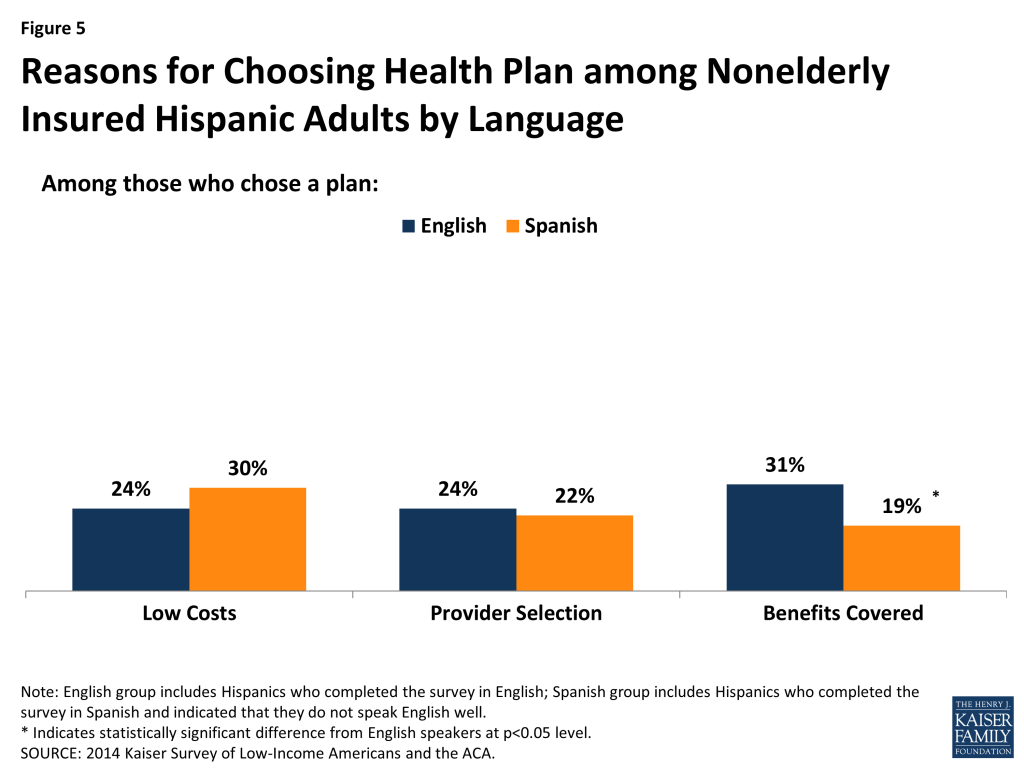
Similarly, there are few differences between Spanish- and English-speakers in reasons for choosing a health plan among insured Hispanic adults. Although Spanish-speakers are lower income than English-speakers, they are not more likely to cite low costs as a reason why they chose their plan (Figure 5). This finding may reflect that fewer Spanish-speakers are subject to costs since they are more likely to be covered by Medicaid, which generally does not charge premiums and limits out-of-pocket charges. Similarly, English- and Spanish-speakers are equally likely to cite provider selection as a reason for choosing their plan, with about a quarter of both groups reporting this as a reason. However, Spanish-speakers are less likely than English-speakers to say the benefit package was a reason why they chose their health plan (19% vs. 31%). This finding may be related to their more limited understanding of their coverage, as discussed below.

Figure 5: Reasons for Choosing Health Plan among Nonelderly Insured Hispanic Adults by Language

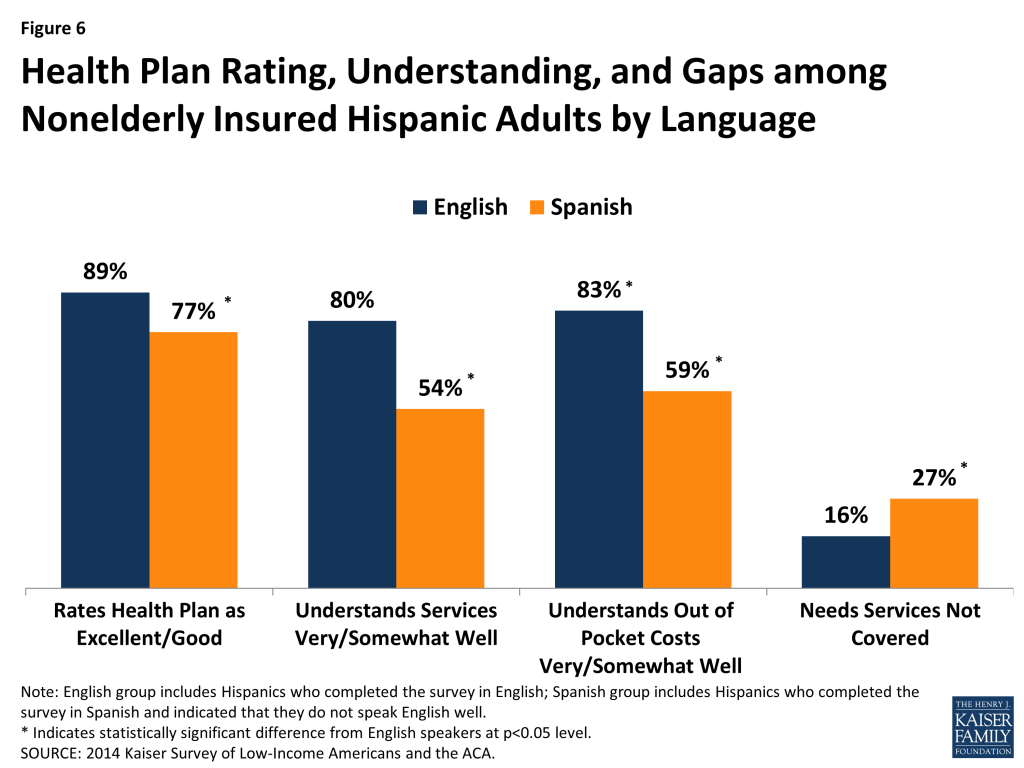
Although language appears to play a limited role in experiences choosing a plan, Spanish-speaking insured Hispanic adults face some increased challenges with their health plan compared to English-speakers. Specifically, Spanish-speakers are less likely than those who speak English to give their health plan a high rating (Figure 6). They also are less likely than English-speakers to say they understand the services covered by their plan and their out-of-pocket costs well. Moreover, they are more likely to experience gaps in their coverage, with over a quarter (27%) of Spanish-speakers reporting they need services that are not covered by their plan compared to 16% of English-speakers.

Figure 6: Health Plan Rating, Understanding, and Gaps among Nonelderly Insured Hispanic Adults by Language

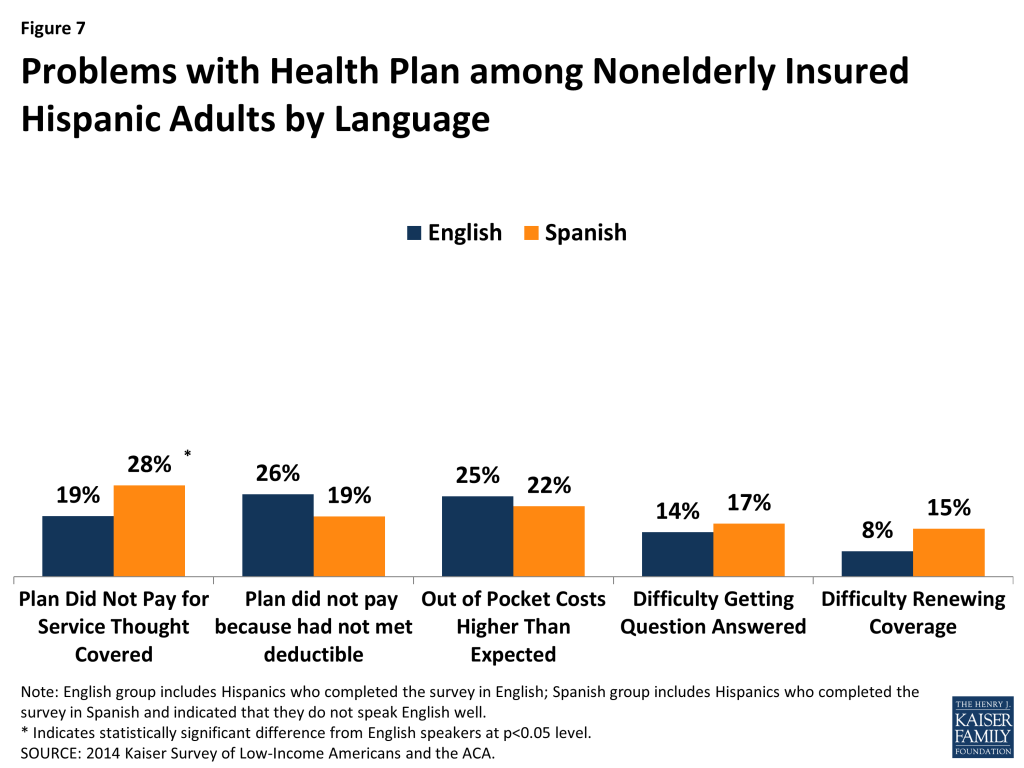
Although Spanish-speakers face some increased challenges with their plan compared to English-speakers, there are few differences between the groups with regard to problems with their plan paying for services or difficulties interacting with their plan. For example, there are no significant differences between Spanish- and English-speaking insured Hispanic adults in the likelihood of the plan not paying because the deductible was not met, facing higher than expected out-of-pocket costs, having difficulty getting questions answered, or experiencing difficulty renewing coverage (Figure 7). However, consistent with the findings above showing that Spanish-speakers were more likely than English-speakers to need services not covered by their plan and to have limited understanding of their covered services, they are more likely to report that the plan did not pay for services they thought would be covered.

Figure 7: Problems with Health Plan among Nonelderly Insured Hispanic Adults by Language

Access to and Utilization of Care

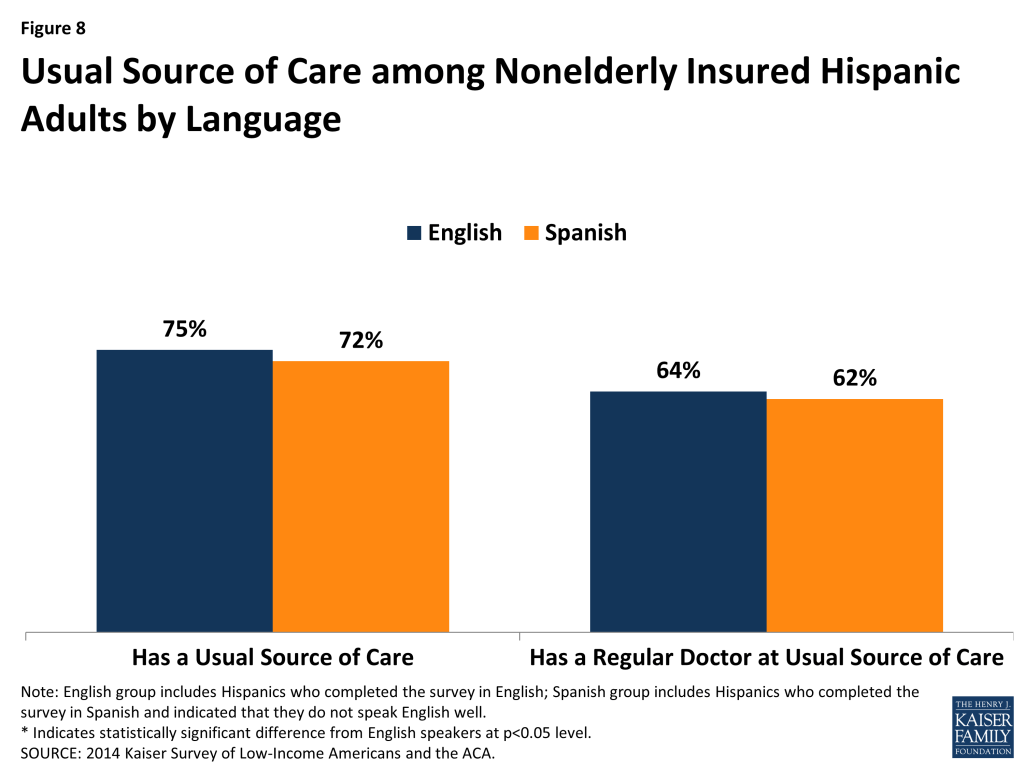
Among insured Hispanic adults, there are no significant differences between Spanish- and English-speakers in the likelihood of having a usual source of care or a regular doctor. About three-quarters of both English- and Spanish-speakers have a usual source of care other than the emergency room and over six in ten of both groups have a regular doctor at a usual source of care (Figure 8).

Figure 8: Usual Source of Care among Nonelderly Insured Hispanic Adults by Language

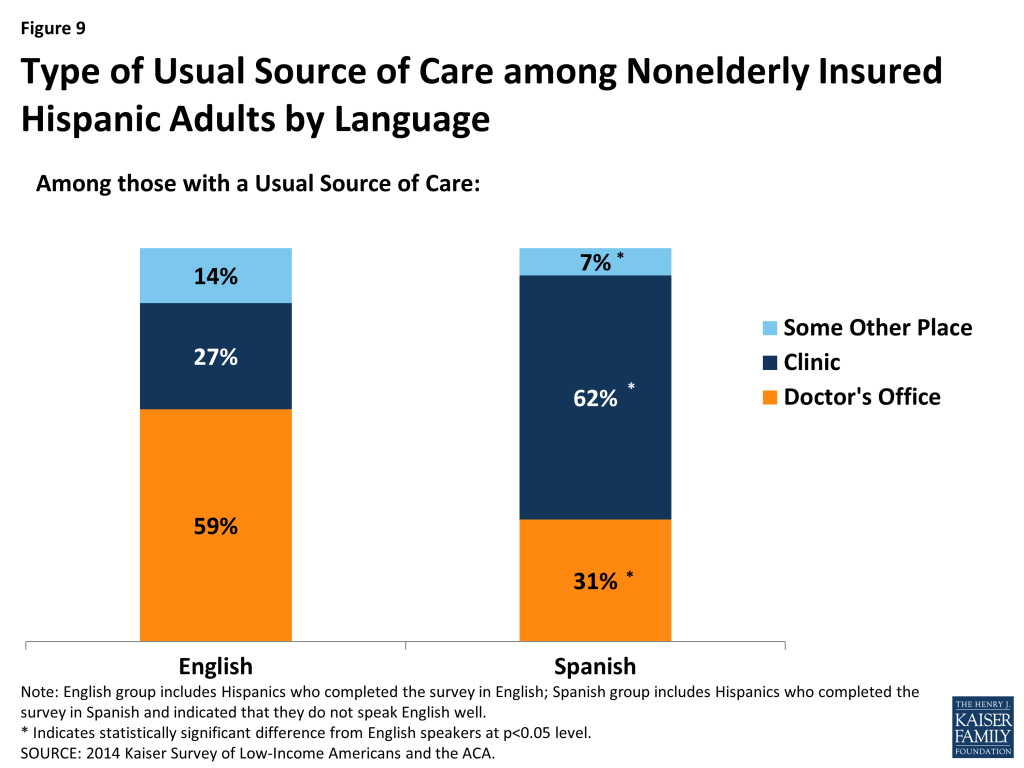
However, Spanish-speaking Hispanic insured adults are significantly more likely than those who speak English to rely on a clinic as their usual source of care. Spanish-speakers are about half as likely as English-speakers to rely on a doctor’s office as their usual source of care (31% vs. 59%) and over twice as likely as to rely on a clinic (62% vs. 27%) (Figure 9).

Figure 9: Type of Usual Source of Care among Nonelderly Insured Hispanic Adults by Language

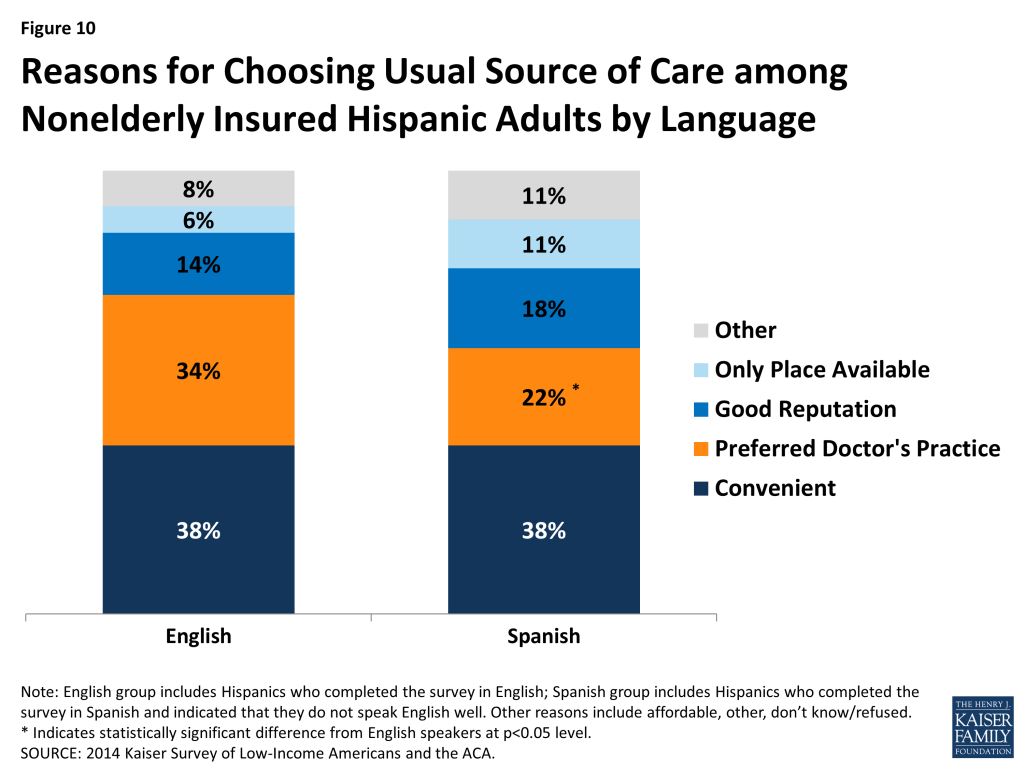
There are limited differences between Spanish- and English-speaking insured Hispanic adults with regard to why they chose their usual source of care. For example, about four in ten (38%) of both groups said convenience was a reason why they chose their usual source of care, while smaller shares said that the place having a good reputation and the place being the only one available were reasons (Figure 10). About a third (34%) of English-speakers said that the place having their preferred doctor was a reason why they chose their source of care, which was higher than the 22% of Spanish-speakers who said this was a reason. It is unclear if this finding reflects that the place having their preferred doctor is a less important factor for Spanish-speakers or if they are less likely to have a preferred doctor prior to choosing a usual source of care.

Figure 10: Reasons for Choosing Usual Source of Care among Nonelderly Insured Hispanic Adults by Language

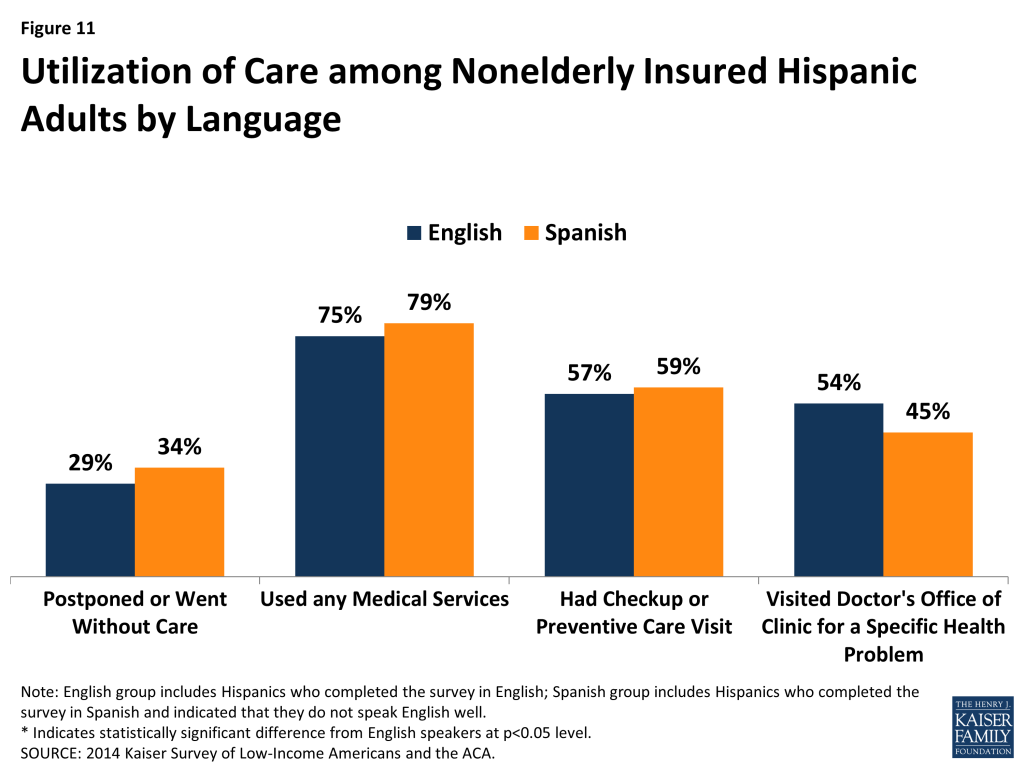
Among insured Hispanic adults, there are no significant differences between Spanish- and English-speakers in the likelihood of postponing or going without care and receiving certain types of care. About three in ten of both Spanish- and English-speakers said they postponed or went without needed care (Figure 11). Over three-quarters of both groups used medical services and nearly six in ten received a check-up or preventive care visit. Although Spanish-speakers are significantly more likely than English-speakers to report having an ongoing condition, there is no significant difference between Spanish- and English-speakers in the share that visited a doctor’s office for a specific health problem.

Figure 11: Utilization of Care among Nonelderly Insured Hispanic Adults by Language

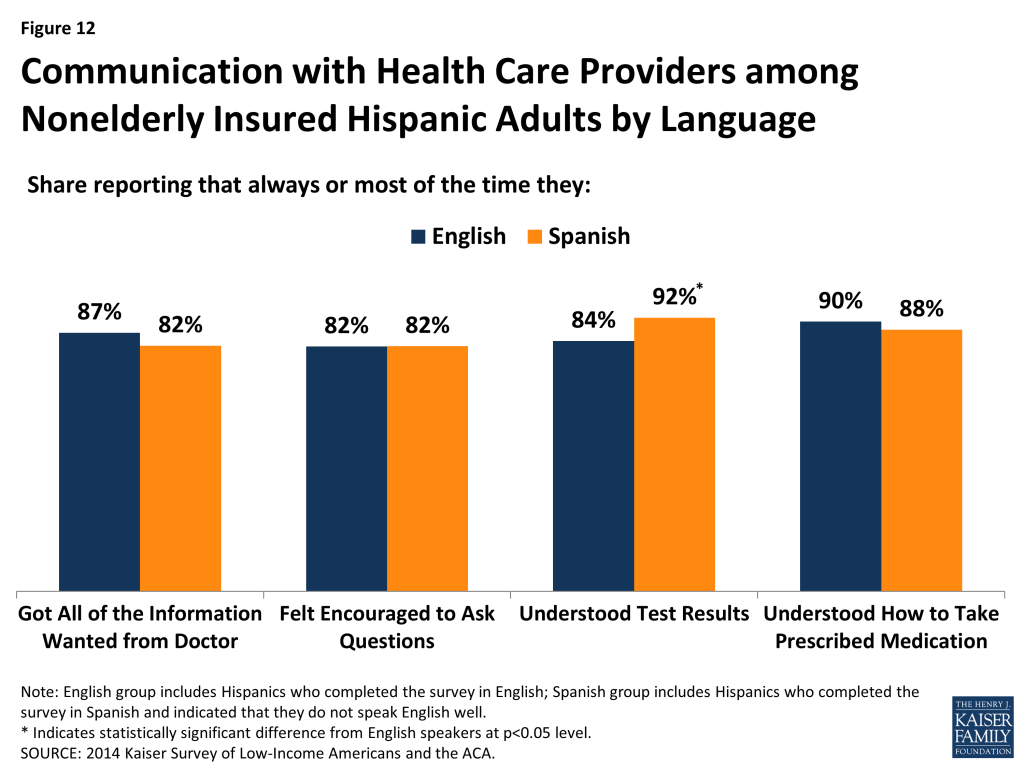
High shares of insured Hispanic adults report good communication with their providers regardless of language. Among both Spanish- and English-speaking insured Hispanic adults, over eight in ten report that they got all the information they wanted from their doctor, felt encouraged to ask questions, understood test results, and understood how to take prescribed medication (Figure 12).

Figure 12: Communication with Health Care Providers among Nonelderly Insured Hispanic Adults by Language

Affordability of Health Care Costs and Financial Security

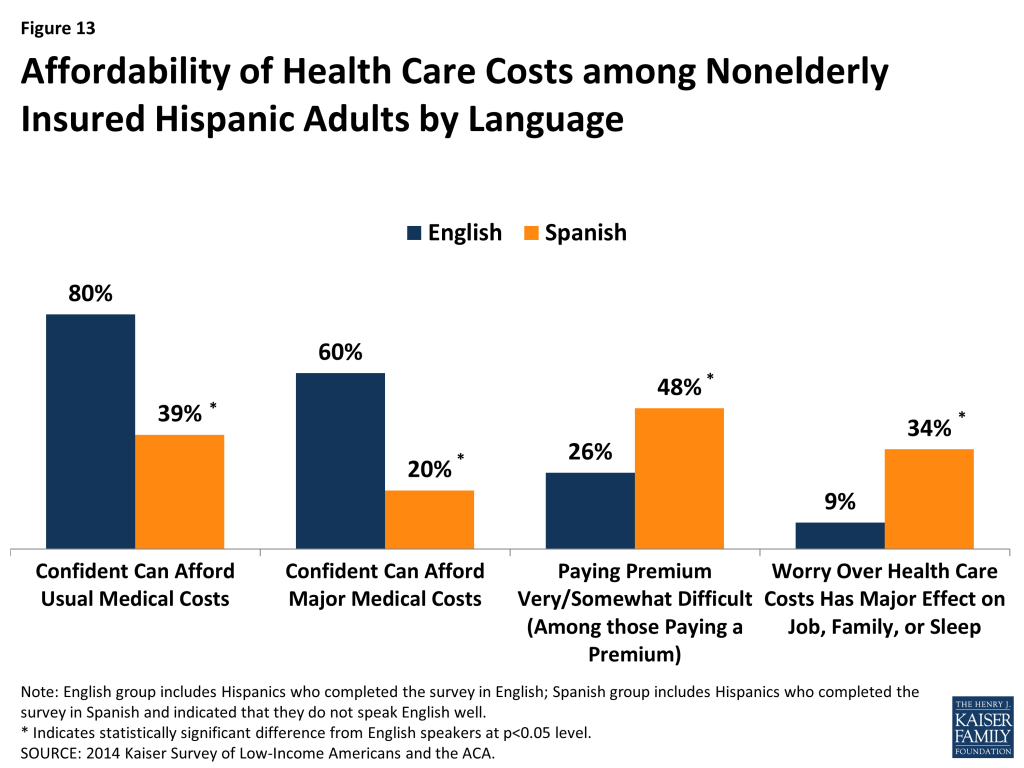
Reflecting their more limited incomes, Spanish-speaking insured Hispanic adults report greater concerns about and difficulty affording health care costs than English-speakers. English-speakers are twice as likely as Spanish-speakers to report confidence in their ability to afford usual medical costs (80% vs. 39%), and three times as likely to report confidence in their ability to afford major medical costs (60% vs. 20%) (Figure 13). In addition, among those who have a premium, Spanish-speakers are almost twice as likely as English speakers to say paying the premium is very or somewhat difficult (48% vs. 26%). However, overall, Spanish-speakers are less likely than English-speakers to have a premium since a larger share is covered by Medicaid, which generally does not charge premiums. Spanish-speakers also are more than three times as likely as English-speakers to say that worries over health care costs have a major effect on their job, family, or sleep (34% vs. 9%).

Figure 13: Affordability of Health Care Costs among Nonelderly Insured Hispanic Adults by Language

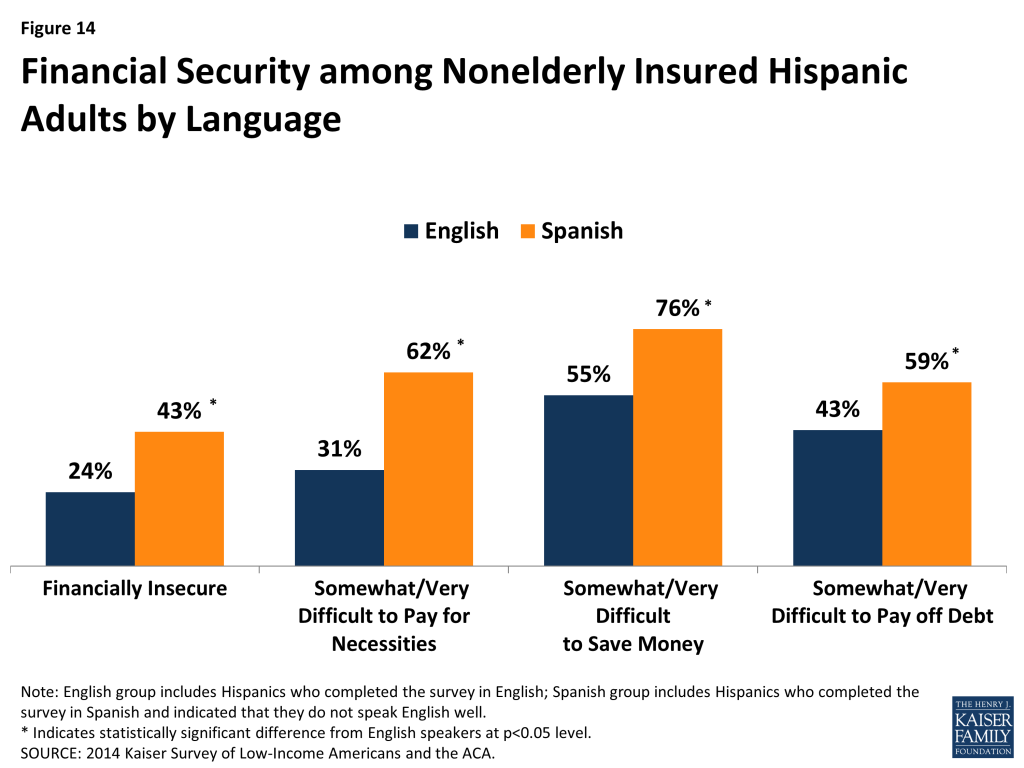
Spanish-speaking insured Hispanic adults also face larger overall financial challenges compared to those who speak English. Spanish-speakers are more likely than English-speakers to say they are financially insecure (43% vs. 24%) and that they find it somewhat or very difficult to pay for necessities (62% vs. 31%), save money (76% vs. 55%), or pay off debt (59% vs. 43%) (Figure 14).

Figure 14: Financial Security among Nonelderly Insured Hispanic Adults by Language

Conclusion

The findings show that, among insured Hispanic adults, Spanish-speakers face some increased challenges compared to English-speakers. They have greater gaps in their understanding of their coverage, and, as such, may benefit from targeted education efforts. Moreover, given their more limited incomes and broader financial challenges, Spanish-speakers are significantly more likely than English-speakers to have concerns about their ability to afford health care and to have difficulty affording premiums. As such, affordability of coverage and care is particularly important for Spanish-speakers. Despite these challenges, Spanish-speaking insured Hispanic adults are as likely as their English-speaking counterparts to receive care and communicate well with their provider. These findings suggest that clinics, which most Spanish-speakers rely on as their usual source of care and have a longstanding role serving a diverse population, are likely effective in connecting them to care and ensuring good communication with patients.

Appendix

Appendix Table A: Demographic Characteristics, Health Needs, and Health Coverage Among Nonelderly Insured Hispanic Adults by Language
EnglishSpanish
Income
≤138% FPL29%56%*
138% – 400% FPL45%42%
>400% FPL26%
Work Status
Worker in the Family77%73%
Full Time Worker in the Family68%64%
Part Time Worker in the Family9%9%
No Worker in the Family23%27%
Gender
Female53%60%
Male47%40%
Age
19 – 2525%
26 – 3420%17%
35 – 4425%35%*
45 – 6430%40%*
Family Status
Married with Dependent Children32%34%
Married without Dependent Children17%16%
Not Married with Dependent Children17%19%
Not Married without Dependent Children33%31%
Health Needs
Has Ongoing Health Condition30%40%*
Taking Prescription Drugs39%43%
Type of Health Coverage
Private72%57%*
Medicaid17%29%*
Other11%15%
NOTE: English group includes Hispanics who completed the survey in English; Spanish group includes Hispanics who completed the survey in Spanish and indicated that they do not speak English well.

* Indicates statistically significant difference from English-speakers at p<0.05 level.

SOURCE: 2014 Kaiser Survey of Low-Income Americans and the ACA.

Appendix Table B: Experiences with and Understanding of Health Plans Among Nonelderly Insured Hispanic Adults by Language
EnglishSpanish
Choosing a Health Plan
Somewhat/Very Difficult to Compare Services24%20%
Somewhat/Very Difficult to Compare Costs20%28%
Somewhat/Very Difficult to Compare Providers22%13%*
Any Problem36%37%
Reasons for Choosing Health Plan
Low Costs24%30%
Provider Selection24%22%
Benefits Covered31%19%*
Family or Friends Recommended
Other Family Also Covered7%
Rating Health Plans
Excellent/Good Rating89%77%*
Not so good/Poor9%19%*
Understanding Health Plans
Understood Services Very/Somewhat Well80%54%*
Understood Out of Pocket Costs Very/Somewhat Well83%59%*
Gaps In Plan
Needs Services Not Covered16%27%*
Problems with Health Plan
Plan Did Not Pay for Services Thought Covered19%28%*
Plan Did Not Pay because Had Not Met Deductible26%19%
Out of Pocket Costs Higher than Expected25%22%
Difficulty Getting Question Answered14%17%
Difficulty Renewing Coverage8%15%
NOTE: English group includes Hispanics who completed the survey in English; Spanish group includes Hispanics who completed the survey in Spanish and indicated that they do not speak English well.

* Indicates statistically significant difference from English-speakers at p<0.05 level.

SOURCE: 2014 Kaiser Survey of Low-Income Americans and the ACA.

Appendix Table C: Access to Care, Utilization of Care, and Communication with Health Care Providers Among Nonelderly Insured Hispanic Nonelderly Adults by Language
EnglishSpanish
Usual Source of Care (USOC)
Has a USOC that is not the Emergency Department75%72%
USOC is a:
Clinic27%62%*
Doctor’s Office59%31%*
Some Other Place14%7%*
Reasons for Choosing USOC:
Convenient38%38%
Only Place Available6%11%
Preferred Doctor’s Practice34%22%*
Good Reputation14%18%
Other (Affordable, Don’t Know, and Refused)8%11%
Has Regular Doctor at USOC64%62%
Utilization of Care
Postponed or Went Without Care29%34%
Never Ended Up Getting Needed Care16%10%
Used any Medical Services75%79%
Had Checkup or Preventive Care Visit57%59%
Visited Doctor’s Office or Clinic for a Specific Health Problem54%45%
Communication with Health Care Providers
Always/Most of the Time Got All of the Information Wanted From Doctor87%82%
Always/Most of the Time Felt Encouraged to Ask Questions82%82%
Always/Most of the Time Understood Test Results84%92%*
Always/Most of the Time Understood How to Take Prescribed Medication90%88%
NOTE: English group includes Hispanics who completed the survey in English; Spanish group includes Hispanics who completed the survey in Spanish and indicated that they do not speak English well.

* Indicates statistically significant difference from English-speakers at p<0.05 level.

SOURCE: 2014 Kaiser Survey of Low-Income Americans and the ACA.

Appendix Table D: Affordability of Health Care Costs and Financial Security Among Nonelderly Insured Hispanic Adults by Language
EnglishSpanish
Affordability of Health Care Costs
Confident can Afford Usual Medical Costs80%39%*
Not Confident can Afford Usual Medical Costs19%60%*
Confident can Afford Major Medical Costs60%20%*
Not Confident can Afford Major Medical Costs38%79%
Worry Over Health Care Costs has Major Effect on Job, Family, or Sleep9%34%*
Paying Premium Very/Somewhat Difficult (Among those Paying a Premium)2648%*
Did Not Have Premium35%52%*
Medical Bill Outcomes
Has Outstanding Medical Bills18%17%
Any Problem Paying Medical Bills11%17%
Problem with Medical Bills Led to Using Up Savings6%9%
Problem with Medical Bills Led to Difficulty Paying for Basic Necessities5%8%
Problem with Medical Bills Led Borrowing Money3%
Problem with Medical Bills Led to Being Sent to Collections5%
Medical Bills Caused Financial Strain8%15%
Financial Security
Financially Insecure24%43% *
Somewhat/Very Difficult to Pay for Necessities31%62% *
Somewhat/Very Difficult to Save Money55%76% *
Somewhat/Very Difficult to Pay off Debt43%59% *
NOTE: English group includes Hispanics who completed the survey in English; Spanish group includes Hispanics who completed the survey in Spanish and indicated that they do not speak English well.

* Indicates statistically significant difference from English-speakers at p<0.05 level.

SOURCE: 2014 Kaiser Survey of Low-Income Americans and the ACA.

Endnotes

  1. “Jie Zong and Jeanne Batalova, The Limited English Proficient Population in the United States (Migration Policy Institute, July 2015), http://www.migrationpolicy.org/article/limited-english-proficient-population-united-states/. ↩︎
  2. Kaiser Commission on Medicaid and the Uninsured, Overview of Health Coverage for Individuals with Limited English Proficiency (Washington, DC: Kaiser Commission on Medicaid and the Uninsured, June 2012), https://modern.kff.org/disparities-policy/fact-sheet/overview-of-health-coverage-for-individuals-with/ ↩︎
  3. Ibid. ↩︎
  4. People who opted to take the survey in Spanish were asked “Would you say you can carry on a conversation in English (both understanding and speaking)—very well, pretty well, just a little, or not at all?” Those who responded saying “just a little” or “not at all” are classified as not speaking English well. ↩︎

State Demonstration Proposals to Integrate Care and Align Financing and/or Administration for Dual Eligible Beneficiaries

Published: Nov 9, 2015


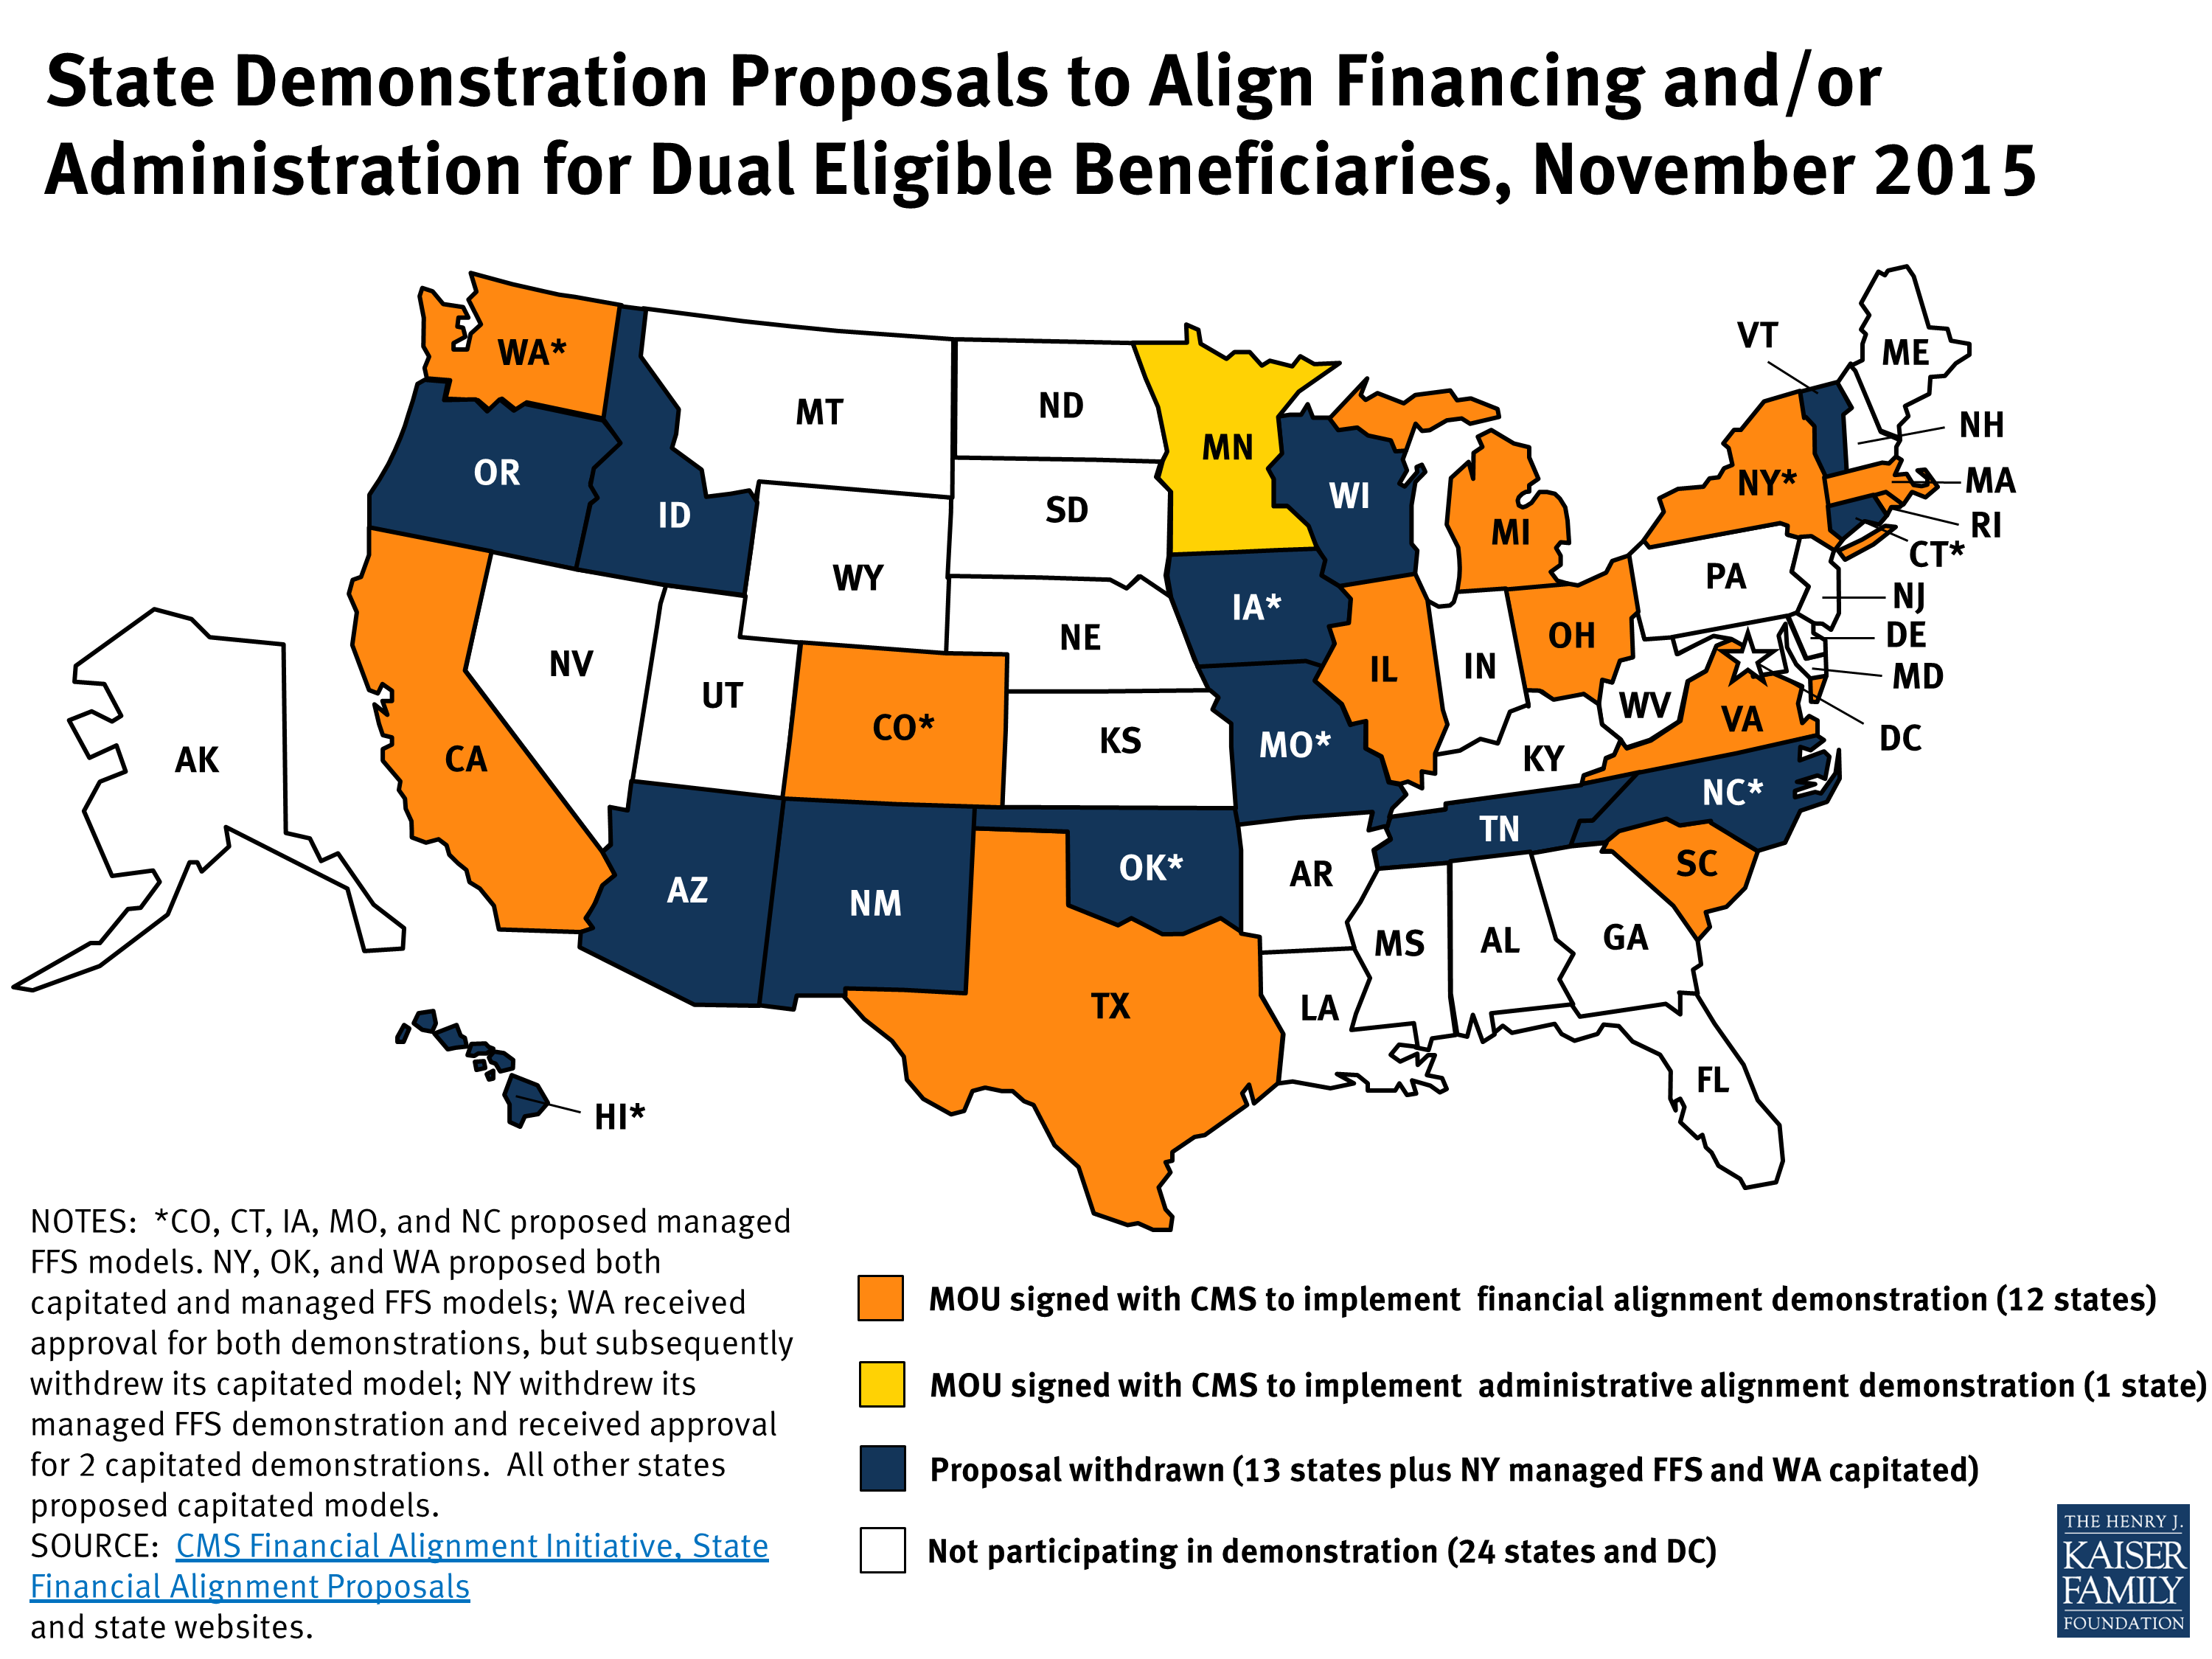
State Demonstration Proposals to Align Financing and/or Administration for Dual Eligible Beneficiaries, November 2015

This map shows the current status of the state demonstration proposals to integrate care and align financing and/or administration for beneficiaries eligible for both Medicare and Medicaid. Over 9.6 million seniors and younger people with significant disabilities are dually eligible for both programs, and as many as 2 million of them may be included in the demonstrations. Dual eligible beneficiaries are among the poorest and sickest beneficiaries covered by either program and consequently account for a disproportionate share of spending in both programs.

A number of states are working with the Centers for Medicare and Medicaid Services (CMS) to test capitated and/or managed-fee-for service models to integrate care and align financing for dual eligible beneficiaries, based on new demonstration authority in the Affordable Care Act. Enrollment in the first demonstration became effective in late 2013, with other states following in 2014 and early 2015.

For more information see Financial and Administrative Alignment Demonstrations for Dual Eligible Beneficiaries Compared: States with Memoranda of Understanding Approved by CMS.

Understanding Health Insurance

Published: Nov 5, 2015

Written and produced by the Kaiser Family Foundation, the YouToons aim to help consumers better understand health insurance. These short videos explain important health insurance concepts, such as health premiums, out-of-pocket health costs, and provider networks.

These segments are part of the 2014 YouToons video, Health Insurance Explained – The YouToons Have It Covered.

Narrated by Former U.S. Senate Majority Leader Bill Frist, a nationally-recognized surgeon and Foundation trustee. Creative production and animation by Free Range Studios.

News Release

GOP Views of Medicaid Expansion Differ From Conventional Wisdom

Published: Nov 4, 2015

In his latest column for The Wall Street Journal’s Think Tank, Drew Altman examines Republican attitudes on Medicaid expansion in light of last night’s election of Republican Matt Bevin as Kentucky’s next governor.

All previous columns by Drew Altman are available online.


Medicaid Home and Community-Based Services Programs: 2012 Data Update

Authors: Terence Ng, Charlene Harrington, MaryBeth Musumeci, and Erica L. Reaves
Published: Nov 3, 2015

Executive Summary

As states continue to implement various aspects of the Affordable Care Act (ACA), developing and expanding home and community-based alternatives to institutional care remains a priority for many state Medicaid programs. 2013 marked the first time that home and community-based services (HCBS) accounted for the majority of national Medicaid long-term services and supports (LTSS) dollars (51%), increasing from 18 percent in 1995.1  State Medicaid programs are operating in an environment of sustained economic improvement and as of 2015, continue to face the competing priorities of implementing the ACA’s streamlined eligibility and enrollment processes, determining whether to adopt the ACA’s Medicaid expansion, and pursuing a variety of delivery and payment system reforms. States also continue to have access to some of ACA’s new and expanded LTSS options, some of which offer enhanced federal matching funds, to expand beneficiary access to Medicaid HCBS.

This report summarizes the key national trends to emerge from the latest (2012) participant and expenditure data for the three main Medicaid HCBS programs: (1) the mandatory home health services state plan benefit, (2) the optional personal care services state plan benefit, and (3) optional § 1915(c) HCBS waivers. It also briefly discusses the provision of Medicaid HCBS through § 1115 demonstration waivers and highlights findings from a 2014 survey of Medicaid HCBS participant eligibility, enrollment, and provider reimbursement policies.  States also may provide HCBS through various options offered by the ACA, which are outside the scope of this report.

  • In 2012, more than 3.2 million people accessed LTSS through one of the three main Medicaid HCBS programs (Figure 1). Within this population, the number of people receiving § 1915(c) waiver services increased slightly from 2011 to 2012 (by 3%), while the number of people receiving personal care state plan services and home health state plan services decreased (by 2% and 4%, respectively). A total of 764,487 people received home health state plan services (in 50 states and DC), 944,507 received personal care state plan services (in 32 states), and almost 1.5 million were served through § 1915(c) waivers (in 47 states and DC). The number of individual § 1915(c) waivers declined slightly (<1%) to 290 nationwide in 2012. States also may offer HCBS through the new ACA options instead of or in addition to these three programs.
Figure 1: Growth in Medicaid HCBS Participants, by Program, 2002-2012
  • In 2012, Medicaid HCBS expenditures for home health state plan services, personal care state plan services, and § 1915(c) waivers totaled $55 billion, increasing slightly from 2011, and lower than the 10-year average of eight percent (Figure 2). In 2012, spending growth in HCBS programs was led by § 1915(c) waivers (6%), followed by home health state plan services (1%). Expenditures on personal care state plan services declined by 20 percent from 2011, with most of the decline driven by California’s shifting of funding to its new Community First Choice state plan option.
Figure 2: Growth in Medicaid HCBS Expenditures, by Program, 2002-2012
  • Per participant annual spending on Medicaid HCBS averaged $17,151 in 2012, but there was considerable variation among states and programs. Across the states, Medicaid HCBS expenditures per participant served ranged from $8,787 in Mississippi to $42,556 in Tennessee. Per participant spending also varied across the three main HCBS programs, ranging from a national average of $7,617 for home health state plan services participants to $27,232 for § 1915(c) waiver participants. These program-to-program differences were due to the types and extent of services offered in the different home and community-based programs. Per participant spending also varied among § 1915(c) waivers targeted to different beneficiary populations. For example, per participant spending in § 1915(c) waivers targeted to beneficiaries with intellectual/developmental disabilities (I/DD) was considerably higher than for other beneficiary groups, reflecting the I/DD population’s relatively more intensive need for LTSS.
Figure 3: Medicaid § 1915(c) HCBS Waiver Enrollees and Expenditures, by Enrollment Group, 2012
  • The aged/disabled population made up the largest share of waiver enrollment (48%) but accounted for 21% of spending on waiver services in 2012. People with I/DD accounted for 41% of HCBS waiver enrollment in 2012, but 72% of spending on waiver services was devoted to this population, again reflecting their more intensive need for LTSS relative to other groups (Figure 3).
  • A minority of states use § 1115 demonstration waivers to deliver HCBS. As of 2012, three states (Arizona, Rhode Island, and Vermont) do not operate any § 1915(c) waivers and instead use § 1115 waivers to administer statewide Medicaid managed care programs that include all covered HCBS for all populations and services. Another five states (Delaware, Hawaii, New York, Tennessee, and Texas) use § 1115 waivers for Medicaid managed care programs that include HCBS for at least some geographic areas and/or populations; these states also offer HCBS via § 1915(c) waivers for other geographic areas and/or populations.2 

2014 Policies in Medicaid HCBS Programs

  • In 2014, all states reported using cost controls in § 1915(c) waivers, such as restrictive financial and functional eligibility standards, enrollment limits, or waiting lists. About 25 percent of § 1915(c) waiver programs used financial eligibility standards that were more restrictive than those used to determine eligibility for Medicaid coverage of institutional care. However, 10 § 1915(c) waivers used more restrictive functional eligibility criteria than those used for institutional care. Almost two-third of states offering personal care state plan services (62%, or 21 states) had some form of cost controls in place, with the majority utilizing service unit limitations. Over half of states (59%, or 30 states) had some form of expenditure or service restriction in place in their home health state plan services programs.
  • In 2014, more than 582,000 people were on § 1915(c) waiver waiting lists, and the average waiting time exceeded two years. The growth in the number of people on waiting lists continued to increase, although by a smaller percent than the average annual growth rate (8.5% in 2013 compared to 11% average growth over the preceding decade). The average national waiting time for § 1915(c) waiver services was 29 months, with wide variations among waivers for different target populations and across states. The average length of time a person spent on a waiting list ranged from three months for HIV/AIDS waivers to 47 months for I/DD waivers.
  • The use of beneficiary self-direction as an alternative service delivery model was present in each of the three major Medicaid HCBS programs. The self-direction model includes initiatives such as beneficiary choice in the allocation of Medicaid service budgets and/or the selection and dismissal of service providers. Forty-two states (or 90%) with § 1915(c) waivers permitted or required self-direction in at least one of their waivers in 2014. Of the states offering personal care state plan services, 24 (or 71%) permitted self-direction. In contrast, only nine states (or 18%) allowed self-direction of home health state plan services in 2014.
  • For both home health and personal care agencies, provider reimbursement rates increased slightly from 2013 to 2014. The national average reimbursement rate per visit for home health agencies was $92.69 and $91.45 in 2014 and 2013, respectively. The hourly reimbursement rate for agencies providing personal care state plan services increased slightly ($18.73 in 2014, and $18.20 in 2013).

Over the past three decades, the increase in access to community-based alternatives to institutional care has resulted in some rebalancing of national Medicaid LTSS dollars, but the size and scope of Medicaid HCBS programs vary across states. Section 1915(c) waivers account for the majority (74%) of spending on LTSS provided in community settings. In the coming years, states will be challenged to continue to expand access to high quality, person-centered HCBS in a cost-effective manner, and it will remain important to monitor states’ adoption of state plan options and other initiatives to expand Medicaid HCBS, differences in services and spending, and the impact of cost control policies on access and quality.

Introduction

Developing home and community-based services (HCBS) alternatives to institutional care has been a priority for many state Medicaid programs over the past three decades. The national share of Medicaid LTSS spending on HCBS has nearly tripled, from 18 percent in 1995 to 51 percent in 2013.3  States’ efforts to expand HCBS options for LTSS have been driven by beneficiary needs and preferences, the United States Supreme Court’s 1999 Olmstead decision finding that the unjustified institutionalization of people with disabilities violates the Americans with Disabilities Act,4  and efforts to control growth in total LTSS expenditures. Medicaid LTSS expenditures represent 34 percent of total Medicaid spending in 2013, with HCBS typically costing less than comparable institutional care.5  Budgetary constraints in an environment of sustained economic improvement after the worst recession since the Great Depression and the administrative complexities of implementing and coordinating the various LTSS options may pose challenges as states and the federal government continue to work toward increasing access to Medicaid HCBS, reducing institutional bias, and rebalancing Medicaid LTSS expenditures.

Over the last fourteen years, the Kaiser Family Foundation’s Commission on Medicaid and the Uninsured (KCMU) has worked with researchers at the University of California, San Francisco (UCSF) to track the development of the three main Medicaid HCBS programs: (1) the mandatory home health services state plan benefit, (2) the optional personal care services state plan benefit, and (3) optional § 1915(c) HCBS waivers. Medicaid HCBS also may be provided through new and expanded options available under the Affordable Care Act (ACA), such as the § 1915(i) HCBS state plan option, the Money Follows the Person demonstration,6  the § 1915(k) Community First Choice state plan option, and the Balancing Incentive Program;7  participants and expenditures attributable to the ACA HCBS options are outside the scope of this report.

In addition, a minority of states provide some or all of their HCBS through § 1115 demonstration waivers, which are briefly discussed in this report. For example, Arizona, Rhode Island, and Vermont do not offer any§ 1915(c) waivers and instead operate their entire Medicaid LTSS programs through § 1115 demonstration waivers.

Beginning in 2002, we also surveyed the policies states use to control spending growth in § 1915(c) waiver programs, such as eligibility criteria and waiting lists. In 2007, we expanded the policy survey to include home health and personal care services state plan benefits. In these state-level surveys, we collect data on eligibility criteria, providers, and scope of services as well as provider reimbursement rates. This report summarizes the main trends to emerge from the latest (2012) participant and expenditure data for the three main Medicaid HCBS programs and findings from the 2014 survey of policies impacting the mandatory home health services state plan benefit, the optional personal care services state plan benefit, and § 1915(c) waivers.

Report: Medicaid Hcbs Participants And Expenditures In 2012

Participants in Medicaid Home Health and Personal Care State Plan Services and § 1915(c) Waivers

In 2012, over 3.2 million individuals received services through the three main Medicaid HCBS programs (Table 1A). Of those participants, 764,487 individuals received home health services through the mandatory state plan benefit, 944,507 individuals received personal care services through the optional state plan benefit, and 1,497,528 individuals were served through § 1915(c) waivers (Figure 4). All states and DC offered the mandatory home health services state plan benefit in their Medicaid programs (Table 1B), while 32 states actively offered the optional personal care services state plan benefit, with Kansas as the latest state to elect this option in 2007 (Table 1C). (Delaware and Rhode Island had approval from the Centers for Medicare and Medicaid Services (CMS) to offer personal care state plan services but did not report any participants in their programs.) Forty-seven states and DC operated multiple § 1915(c) waivers in 2012 (Table 1D).

Figure 4: Medicaid HCBS Participants, by Program, 2012

Participation in the three main HCBS programs declined by less than one percent between 2011 and 2012, the first annual decline since 2006, following two years of slight growth. This was also well below the 10-year average growth rate of three percent (Table 1A and Figure 5).

Figure 5: Growth in Medicaid HCBS Participants, by Program, 2002-2012

Leading the 13 states with a decline in total HCBS enrollment between 2011 and 2012 was Texas, with a 17 percent decline reported. Louisiana recorded the second largest decline with a 9 percent drop in total HCBS enrollment between 2011 and 2012 (Table 1A). Both Texas and Louisiana’s declines in total HCBS enrollment were led by a drop in their § 1915(c) waiver enrollment as the number of waivers declined in both states. Three waivers in Texas were terminated (one for people with I/DD and 2 for the aged/disabled population), while another was converted to a § 1115 Managed Care waiver in 2012.  Louisiana terminated one large aged and disabled waiver. On the other hand, Idaho, Minnesota, and Maine saw the largest increases (27%, 15%, and 14%, respectively) in total HCBS participants in 2012. Idaho’s participant growth was driven by large increases in its two state plan programs while both Minnesota and Maine experienced relatively high participant growth in their home health programs.

The decline in total HCBS enrollment in 2012 was led by declines in participation in both the home health state plan program (-4%) and in the personal care state plan services program (-2%) (Tables 1B and 1C). Nebraska led the decline in home health program enrollment with a 27 percent drop, due to a change in reporting when the state moved to managed care, while Maine led the decline in personal care state plan participation with a 33 percent drop in 2012, also due to a change in reporting. Nationally, § 1915(c) waiver program participation increased by three percent from 2011 to 2012, and seven states reported declines in participation led by Louisiana (-24%) and Texas (-19%) as noted above (Table 1D). Figure 6 illustrates the variation in total Medicaid HCBS program participation among the states.

Figure 6: State Variation in the Number of Medicaid HCBS Program Participants, 2012

Expenditures in Medicaid Home Health and Personal Care State Plan Services and § 1915(c) Waivers

In 2012, total Medicaid spending on HCBS across the three main programs was $55 billion (Table 2A). The large majority of Medicaid spending on HCBS was for § 1915(c) waivers. In 2012, Medicaid spending on § 1915(c) waivers was $40.8 billion, compared to $8.4 billion on personal care state plan services and $5.8 billion on home health state plan services (Tables 2B, 2C, 2D and Figure 7).

Figure 7: Medicaid HCBS Expenditures, by Program, 2012

Between 2002 and 2012, total annual Medicaid spending on HCBS in the three main programs increased by almost $30 billion (119%) with an average annual increase of eight percent (Figure 8). HCBS spending recorded slight growth between 2011 and 2012, the lowest rate of growth within the 14-year study period. However, this low rate of growth in HCBS spending was still more than the decline of four percent recorded for total Medicaid acute and LTSS expenditures in the same period, which corresponded with a decline in total Medicaid spending growth.8  Amid the stagnant growth in HCBS expenditures, 11 states reported a decline in total Medicaid HCBS expenditures between 2011 and 2012. Declines were led by Texas and Wyoming (both -21%) (Table 2A).

Figure 8: Growth in Medicaid HCBS Expenditures, by Program, 2002-2012

However, Medicaid HCBS expenditures as a proportion of total Medicaid LTSS expenditures continued to increase between 2011 and 2012 as they have done every year since 1995.9 

National total Medicaid HCBS expenditure data mask state-to-state variations in spending across the three major programs. First, while national per participant spending on Medicaid HCBS averaged $17,151 in 2012, state spending ranged from $8,787 in Mississippi to $42,556 in Tennessee (Figure 9, Table 3A).

Figure 9: State Variation in Medicaid HCBS Program Expenditures Per Person Served, 2012

Second, differences exist in spending across the three major Medicaid HCBS programs. National per participant expenditures ranged from $7,617 for home health state plan services participants to $27,232 for § 1915(c) waiver participants in 2012 (Table 3B, 3C, 3D and Figure 10). This difference was likely due to the types and extent of services provided in each of the three main HCBS programs. The lower national per participant spending on home health state plan services likely reflects shorter periods of per participant service utilization compared to either § 1915(c) waivers or the personal care services state plan option. Third, there was also significant per participant expenditure variation among § 1915(c) waivers targeted to different populations (Tables 4 and 7).

Figure 10: Medicaid HCBS Average Expenditures Per Person Served, 2002-2012

Medicaid § 1915(c) Waivers

Between 2011 and 2012, the number of § 1915(c) waivers declined slightly to 290. In 2012, with the exception of Arizona, Rhode Island, and Vermont, which operate their entire Medicaid LTSS programs through § 1115 waivers and therefore do not offer any § 1915(c) waivers, every state and DC had § 1915(c) waivers targeted to populations that would otherwise require institutional care. These beneficiary groups include: the aged (age 65 and over), aged or disabled, individuals with physical disabilities, individuals with I/DD, children who are medically fragile or technology-dependent, individuals with HIV/AIDS, and individuals with traumatic brain and/or spinal cord injury (TBI/SCI).

Table 4 details, by waiver type, § 1915(c) waiver enrollment, total expenditures, and per participant expenditures for the two most recent reporting years. In 2012, 1,497,528 participants were served through Medicaid § 1915(c) waivers (Tables 4 and 5). The three percent (or 50,147 beneficiaries) increase from 2011 to 2012 is the same rate of increase as between 2010 to 2011. The largest share of § 1915(c) waiver participants in 2012 (720,204 beneficiaries, or 48%) received services through waivers that targeted the aged and aged or disabled. The next largest group of waiver participants (613,685) was enrolled in § 1915(c) waivers for persons with I/DD, representing 41 percent of national § 1915(c) waiver enrollment (Table 5 and Figure 11). Enrollment in waivers targeted solely to persons with physical disabilities accounted for only six percent (87,017) of § 1915(c) waiver participants nationwide. The § 1915(c) waivers with the smallest enrollment were those for children who are medically fragile or technology-dependent (41,950), individuals with TBI/SCI (17,072), individuals with HIV/AIDS (13,538), and individuals with mental health disabilities (4,061) (Tables 4 and 5). The § 1915(c) waivers with the largest annual increase in participation were those targeted to people with mental health disabilities (12%), followed by those serving aged individuals (8%). There was a slight decline (less than 1%) in participants for waivers serving aged and disabled individuals, the only decline recorded among all waiver groups (Table 4).

Figure 11: Medicaid § 1915(c) HCBS Waiver Enrollees and Expenditures, by Enrollment Group, 2012

In 2012, overall expenditures for § 1915(c) waivers increased to $40.8 billion, a six percent increase compared to 2011, and the same rate of increase as between 2010 to 2011. The vast majority of spending on § 1915(c) waivers was for individuals with I/DD. Although individuals enrolled in I/DD waivers accounted for just 41 percent of total waiver participants, expenditures for this population accounted for 72 percent of all § 1915(c) waiver spending (Tables 4 and 6 and Figure 10). Between 2011 and 2012, the annual rate of expenditure growth was highest for mental health waivers (15%), mainly due to growth in the five existing § 1915(c) waivers for persons with mental health disabilities. There was a four percent decline in expenditures on waivers serving aged and disabled individuals as well as a less than one percent decline recorded in waivers serving individuals with HIV/AIDS (Table 4).

Growth in § 1915(c) waiver expenditures per participant remained at two percent in 2011-2012, the same as the growth rate in 2010-2011, but lower than the 10-year average of five percent (Tables 4 and 7). Persons with I/DD had the highest spending per participant served ($47,522) (Tables 4 and 7). This amount was more than four times higher than average waiver spending on both aged ($11,490) and aged or disabled ($11,834) waiver participants (Tables 4 and 7). Per participant expenditures grew by eight percent from 2011 to 2012 for waivers serving children who are medically fragile or technology-dependent, with waivers serving the aged and disabled, physically disabled and persons with HIV/AIDS all showing slight declines in per participant spending (Table 4).

Medicaid § 1915(c) Waiver Services

As part of the collection of participant and expenditure data for § 1915(c) waivers, service type data were also collected for individual waivers. States may provide many different services within waivers, which have been collapsed into six categories here: (1) case management; (2) respite/home health/personal care; (3) habilitation/day care; (4) nursing/therapy; (5) residential/foster care; and (6) other services. Participants within a waiver may use more than one service, and, as such, the sum of these participants does not equal the unduplicated total waiver participants. Most participants received “other” services including assistance with chores, meals, transportation, and home modifications. More than 799,000 waiver participants received respite, home health or personal care services within waivers in 2011, with Ohio providing these services to the most waiver enrollees (75,334) (Table 8).

Of the total $40.8 billion spent on § 1915(c) waivers in 2012, almost 38% ($15.4 billion) was spent on habilitation or adult day care services, with New York spending more than $5 billion and Pennsylvania spending almost $1.5 billion. States spent more than $11.5 billion on respite, home health or personal care services within waivers, with Ohio spending almost $1.4 billion on such services (Table 9). The most expensive waiver service on a per participant basis in 2012 was habilitation or adult day care services, with more than $28,000 spent per waiver participant nationwide. There is large inter-state variation in habilitation or adult day care services spending per participant, ranging from $1,702 in Georgia to $59,387 in Connecticut. Case management was the least expensive § 1915(c) waiver service nationwide at $1,647 per participant (Table 10).

HCBS and Managed LTSS within § 1115 Waivers

In addition to the Medicaid home health and personal care services state plan benefits and § 1915(c) waivers, states can deliver HCBS through § 1115 demonstration waivers.10  Section 1115 of the Social Security Act allows the Secretary of the Department of Health and Human Services to waive state compliance with certain federal Medicaid requirements and authorizes the use of federal Medicaid funds in ways that are not otherwise allowable. Section 1115 waivers enable “experimental, pilot or demonstration project[s] which, in the judgment of the Secretary, [are] likely to assist in promoting the objectives [of the Medicaid program].”11  Section 1115 waivers have been used to implement a variety of initiatives related to HCBS, such as self-direction of personal care services,12  payments to spouses who provide personal care services, and managed LTSS.

In 2012, three states (Arizona, Rhode Island, and Vermont) use § 1115 waivers to administer statewide Medicaid capitated managed care programs that include all covered HCBS for all populations and services; these states do not offer any § 1915(c) waivers. In 2012, Arizona spent $1 billion on HCBS for 43,231 participants, Rhode Island spent $446 million on HCBS for 4,632 participants, and Vermont spent $247 million on HCBS for 3,675 participants.13  Vermont’s model is unique in that the state serves as the managed care entity. Other states that administer Medicaid managed care programs that include HCBS contract with private health plans to provide covered services for a capitated per member per month rate. In addition to Arizona, Rhode Island, and Vermont’s statewide programs, another five states14  (Delaware, Hawaii, New York, Tennessee, and Texas) use  § 1115 waivers for Medicaid capitated managed care programs that include HCBS for at least some geographic areas and/or populations in 2012; these states also offer § 1915(c) waivers for other HCBS.15  Other states implement Medicaid managed LTSS programs through combination § 1915(b)/(c) waivers (Section 1915(b) waivers allow states to offer Medicaid services in a managed care model or otherwise limit a beneficiary’s choice of providers).16 

Report: Eligibility And Cost Containment Policies Used In Medicaid Hcbs Programs In 2014

Medicaid § 1915(c) Waivers

The Medicaid § 1915(c) waiver authority allows states to use a range of cost-containment strategies to meet federal cost neutrality requirements and limit spending so that expenditures do not exceed state budgetary restrictions. To understand how states controlled spending on HCBS waivers in 2014, we surveyed all state § 1915(c) waiver program administrators to assess financial and functional eligibility standards, use of enrollment and/or expenditure caps, and waiting list status (i.e., number of individuals on the list(s) and average waiting time). The survey finds that every state used some type of cost-containment tool in its § 1915(c) waivers beyond the federal cost neutrality requirement that average annual per participant waiver spending not exceed average per participant spending if services were provided in an institutional setting under the state plan absent the waiver. The following summary of the 2014 survey findings illustrates how states use cost control policies to limit access to § 1915(c) waivers.

Financial Eligibility

Most states set their Medicaid financial eligibility standard for nursing facility services at 300 percent of the federal Supplemental Security Income (SSI) federal benefit rate  ($2,163/month for an individual in 2014). States may set financial eligibility standards for Medicaid § 1915(c) waivers at the same level as that for nursing facilities. There is, however, wide variation in financial eligibility standards across states and HCBS waiver programs as shown in Table 11. Twenty-five percent of reporting waiver programs used more restrictive financial eligibility standards (e.g., 100% of SSI) than used for nursing facilities (300% of SSI) in 2014 (Table 11 and Figure 12).

Figure 12: Medicaid § 1915(c) HCBS Waiver Financial Eligibility Limits, 2014

Functional Eligibility

Another way states limit eligibility for § 1915(c) waivers is by using functional eligibility criteria that are stricter than those used for coverage of nursing facility care. For example, a state could require an individual to exhibit difficulty in performing at least three activities of daily living” (ADLs), (e.g., bathing, dressing, transferring, eating, toileting) for waiver eligibility but require limitations in only two ADLs for nursing facility admission. The 2014 survey found that 10 § 1915(c) waiver programs (3%) used functional eligibility criteria that are more restrictive than the criteria used for institutional care (no table shown); these waivers were reported in Alabama, Florida, Georgia, Indiana, Kansas, New York, Texas, and Utah.

Cost Controls

Approximately 88 percent (42 states) of all states with § 1915(c) waivers utilized some form of cost controls above and beyond the federally mandated cost neutrality formula in 2014. Many states used a mixture of fixed expenditure caps, service provision and hourly caps, and geographic limits (Table 12). Of the states with waiver cost controls in place, half (21 states) utilized more than one form, such as a combination of expenditure caps and service limitations (Table 12).

Self-Direction

Many states have incorporated some form of mandatory or optional self-direction within their § 1915(c) waivers. The self-direction service delivery model can include initiatives such as beneficiary choice in the allocation of service budgets and/or the selection, training, and dismissal of service providers. In 2014, 179 waivers in 42 states (61% of waivers and 90% of states) either allowed or required some form of self-direction (Table 12).

Waiting Lists

States often have more individuals who need Medicaid home and community-based waiver services than the number of available spaces, called “slots,” in a § 1915(c) waiver (Table 13). Many states maintain waiting lists when their program slots are filled or when state legislatures do not fully fund the maximum number of slots approved by CMS. In 2014, 39 states reported waiver waiting lists while 8 states and DC reported no such lists (Table 14). In 2014, there were 582,066 individuals on waiver waiting lists across 154 § 1915(c) waivers. Section 1915(c) waivers for people with I/DD had the greatest number of individuals on waiting lists (349,511 individuals, or 60% of total waiting list enrollment) followed by waivers serving people who are aged and aged or disabled (155,697 individuals, or 27% of total waiting list enrollment) (Table 14, Figure 13). Most states reported that virtually all of the persons on waiver waiting lists currently reside in the community and not in an institution, although they may still be at risk of institutionalization. Due to the varying number of waiver slots available for each population, the average length of time an individual spent on a waiting list varied by population and ranged from three months for HIV/AIDS waivers to 47 months for I/DD waivers, with an average national waiting time of 29 months across all § 1915(c) waivers with waiting lists (Table 14).

Figure 13: Medicaid § 1915(c) HCBS Waiver Waiting Lists, by Enrollment Group, 2004-2014

The number of individuals on § 1915(c) waiver waiting lists grew by 8.5 percent from 2013 to 2014, far outpacing the growth rate of 2 percent in the 2012-2013 period. From 2004 to 2014, waiting list enrollment grew by an average of 11 percent annually. Waiting lists for all § 1915(c) waiver target populations increased, with the exception of waivers for people who are aged as well as those for persons with HIV/AIDS (Table 14). The maintenance and length of state waiver waiting lists has implications for states’ compliance with the Olmstead decision which requires states to provide services outside of institutions if beneficiaries are able to live in the community and do not oppose doing so.

In 2014, more than two-thirds (68%) of all § 1915(c) waivers with waiting lists had a policy of screening individuals for Medicaid waiver eligibility before being placed or while on a waiting list (Table 13). In addition, almost three quarters (73%) of all waivers with waiting lists had a policy of prioritizing certain individuals for waiver services (e.g., persons transitioning to the community from an institution) get priority for waiver services when slots become available). Ninety-two percent of all waivers with waiting lists provided non-waiver services (i.e., state plan services) to Medicaid eligible individuals while they awaited a waiver slot.

Report: Medicaid Home Health And Personal Care Services State Plan Benefits

Unlike waivers, states are not permitted to maintain waiting lists or geographically limit the services provided through Medicaid home health and personal care state plan benefits. State plan services must be available to all beneficiaries as medically necessary. However, federal Medicaid rules allow states to use certain cost-containment strategies for state plan benefits. To understand how states controlled spending for home health and personal care services state plan benefits in 2014, all state Medicaid programs were asked about approved provider types, services provided within the scope of each benefit, the use of any expenditure or service caps, and the availability of self-direction within the programs. The following summary of the 2014 survey findings shows how states use cost control policies to limit access to Medicaid home health and personal care state plan services.  (Although Rhode Island and Delaware did not report participants or expenditures for personal care state plan services in 2014, their policy survey responses are included.)

Providers and Services

To obtain a more comprehensive picture of the three main Medicaid HCBS programs, states were asked about the types of approved providers for state plan HCBS and the scope of benefits provided (no Tables shown). In addition to licensed home health agencies, 16 states (31%) allowed hospice agencies to provide home health state plan services, while Centers for Independent Living and independent providers were allowed to provide personal care state plan services in 13 states (38%) and 20 states (59%), respectively.

In addition to skilled nursing services, therapy services, and home health aide services for assistance with ADLs, 14 states (27%) provided assistance with instrumental ADLs (e.g., medication management, meal preparation) as part of their home health state plan benefit. In addition, although therapy services are optional within the home health services state plan benefit, almost all states provide some form of therapy, such as physical, occupational, or speech. Even though case management is not required under the home health state plan benefit, four states (8%) provided this service.

Among states with personal care state plan services, 31 states (91%) provided assistance with instrumental ADLs, while 14 states (41%) provided some sort of transportation services. Case management was offered in 6 states (18%) within the personal care services state plan option.

Cost Controls

More than half of all states (59%, or 30 states) utilized either expenditure or service limits or both in their home health services state plan programs in 2014, while 62 percent of states with the optional personal care services state plan benefit used cost control limits. Among states offering the optional personal care services state plan benefit, 19 states used service limits while only two states used cost control limits. Among the 30 states with cost controls in their home health services state plan benefit, only Connecticut had a combination of expenditure and service limits; the rest had only one of these limits in place. Service limitations were the most popular form of cost control for home health state plan services, with 26 states (87% of cost control states) using such limits (Table 12).

Self-Direction

In 2014, only nine states allowed self-direction within their home health services state plan programs. In contrast, 71 percent of states (24 states) with the personal care services state plan option allowed self-direction (Table 12).

Provider Reimbursement

The average reimbursement rate that states provided to home health agencies was $92.69 per home health visit in 2014, compared to $91.45 in 2013. In states that paid registered nurses or home health aides directly or mandated their reimbursement rates, the average rate per visit was $87.46 and $54.14, respectively, a slight increase from 2013 (Table 15). For the personal care services state plan option, the average rate paid to provider agencies was $18.73 per hour in 2014, a slight increase from $18.20 per hour in 2013. In states where personal care services providers were paid directly by the state or where reimbursement rates were determined by the state, the average reimbursement rate was $13.02 per hour in 2014 (Table 15). (Note: reimbursement rates for services provided under § 1915(c) waivers are not included in the policy survey.) Medicaid provider reimbursement rates are often set by state legislatures as part of the budget process.

Conclusion

Over the past three decades, the increase in access to community-based alternatives to institutional care has resulted in some rebalancing of national Medicaid LTSS dollars, but the size and scope of Medicaid HCBS programs vary across states. Section 1915(c) waivers account for the majority (74%) of spending on LTSS provided in community settings, and continued growth in waiver waiting list enrollment, to more than 582,000 persons nationally with waiting times of almost two and a half years, highlight the need for community-based LTSS, especially for individuals with I/DD and people who are aged or disabled.

At the same time, competing pressures in state budgets may mean that states may face uncertainties for the provision of Medicaid LTSS in the coming years, and states are continuing to utilize cost control measures within their Medicaid programs. In response to fiscal pressures and a desire to better coordinate beneficiaries’ LTSS, some states are looking to incorporate HCBS into Medicaid managed care arrangements.  States also are working to come into compliance with CMS’s rule defining the qualities of the settings in which Medicaid HCBS can be provided and assessing the impact of the new Department of Labor rules that extends Fair Labor Standards Act minimum wage and overtime pay protections to direct care workers who were previously exempt, which are expected to take effect in fall 2015.17  The impact of all of these initiatives on HCBS access warrants further analysis. In the coming years, states will be challenged to continue to expand access to high quality, person-centered HCBS in a cost-effective manner, and it will remain important to monitor states’ adoption of state plan options and other initiatives to expand Medicaid HCBS, differences in services and spending, and the impact of cost control policies on access and quality.

Endnotes

  1. Eiken, S., Sredl, K., Burwell, B., and Saucier, P. Medicaid Expenditures for Long Term Services and Supports (LTSS) in FY 2013, at 7, Truven Health Analytics (June 2015), available at http://www.medicaid.gov/medicaid-chip-program-information/by-topics/long-term-services-and-supports/downloads/ltss-expenditures-fy2013.pdf. ↩︎
  2. Minnesota has a Section 1115 waiver that offers some fee-for-service HCBS, including Section 1915(i) and Community First Choice services. ↩︎
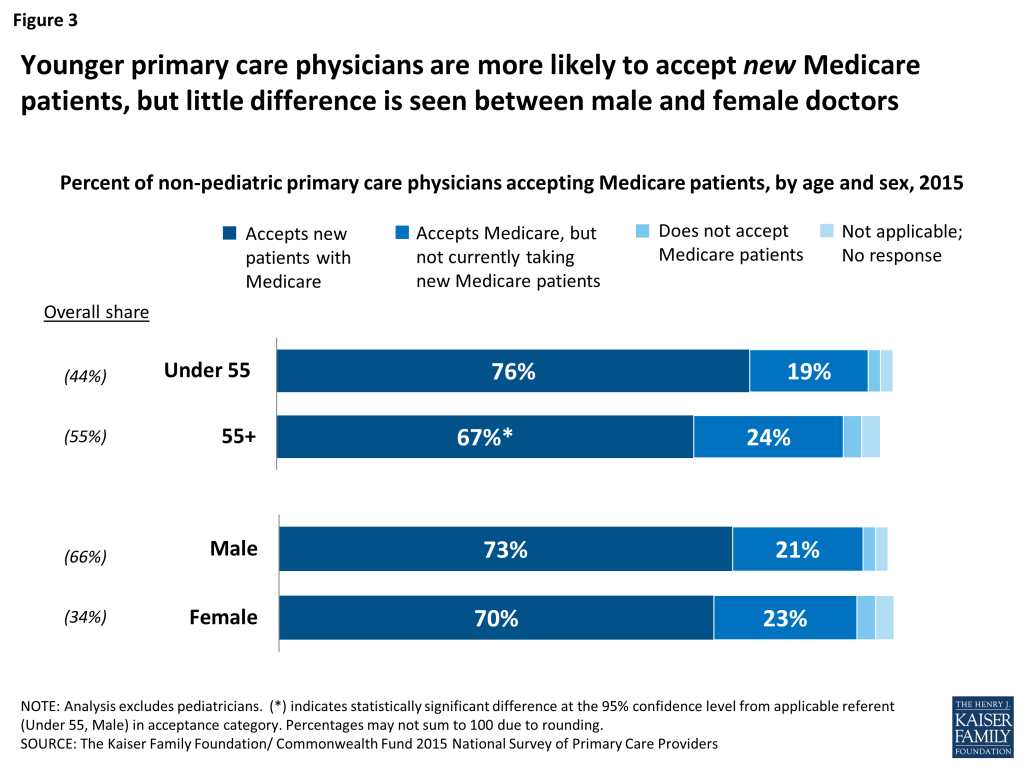
  3. Eiken, S., Sredl, K., Burwell, B., and Saucier, P. Medicaid Expenditures for Long Term Services and Supports (LTSS) in FY 2013, at 7, Truven Health Analytics (June 2015), available at http://www.medicaid.gov/medicaid-chip-program-information/by-topics/long-term-services-and-supports/downloads/ltss-expenditures-fy2013.pdf. ↩︎
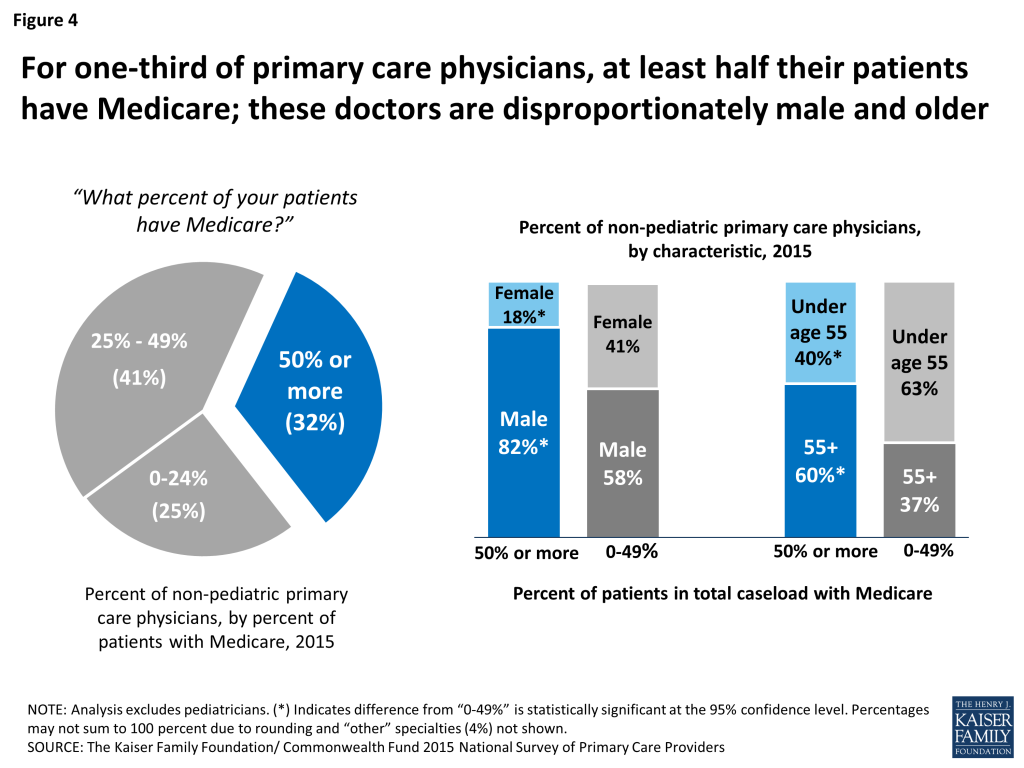
  4. Olmstead v. L.C., 527 U.S. 581 (1999), available at http://www.law.cornell.edu/supct/html/98-536.ZS.html. For a discussion of Olmstead’s legacy, including legal case trends and policy developments in the last five years, see Kaiser Commission on Medicaid and the Uninsured, Olmstead’s Role in Community Integration for People with Disabilities Under Medicaid:  15 Years after the Supreme Court’s Olmstead Decision (June 2014), available at https://modern.kff.org/medicaid/issue-brief/olmsteads-role-in-community-integration-for-people-with-disabilities-under-medicaid-15-years-after-the-supreme-courts-olmstead-decision/. ↩︎
  5. Eiken, S., Sredl, K., Burwell, B., and Saucier, P. Medicaid Expenditures for Long Term Services and Supports (LTSS) in FY 2013, at 5, Truven Health Analytics (June 2015), available at http://www.medicaid.gov/medicaid-chip-program-information/by-topics/long-term-services-and-supports/downloads/ltss-expenditures-fy2013.pdf. ↩︎
  6. MFP funding expires in September 2016.  For more information, see Kaiser Commission on Medicaid and the Uninsured, Money Follows the Person:  A 2015 State Survey of Transitions, Services, and Costs (Oct.  2015), available at https://modern.kff.org/medicaid/report/money-follows-the-person-a-2015-state-survey-of-transitions-services-and-costs/. ↩︎
  7. BIP funding expired on September 30, 2015.  For more information, see Kaiser Commission on Medicaid and the Uninsured, Medicaid Balancing Incentive Program:  A Survey of Participating States (June 2015), available at https://modern.kff.org/medicaid/report/medicaid-balancing-incentive-program-a-survey-of-participating-states/. ↩︎
  8. Kaiser Commission on Medicaid and the Uninsured, Implementing the ACA: Medicaid Spending & Enrollment Growth for FY 2014 and FY 2015 at 4 (Oct. 2014), available at https://modern.kff.org/medicaid/report-section/implementing-the-aca-medicaid-spending-enrollment-growth-issue-brief. ↩︎
  9. Eiken, S., Sredl, K., Burwell, B., and Saucier, P. Medicaid Expenditures for Long Term Services and Supports (LTSS) in FY 2013, at 7, Truven Health Analytics (June 2015), available at http://www.medicaid.gov/medicaid-chip-program-information/by-topics/long-term-services-and-supports/downloads/ltss-expenditures-fy2013.pdf. ↩︎
  10. For background about § 1115 waivers, see Kaiser Commission on Medicaid and the Uninsured, Five Key Questions and Answers About Section 1115 Medicaid Demonstration Waivers (June 2011), available at https://modern.kff.org/health-reform/issue-brief/five-key-questions-and-answers-about-section/. ↩︎
  11. 42 U.S.C. § 1315(a). ↩︎
  12. Self-direction of personal care services is now available to states under the § 1915(j) option, which allows states to offer self-direction provided that states offer personal care services as an optional state plan benefit or through a § 1915(c) waiver.  42 U.S.C. § 1396n(j)(4)(A); 42 C.F.R. § 441.452(a). ↩︎
  13. Expenditure data from Eiken, S., Sredl, Burwell, B., and Saucier, P. Medicaid Expenditures for Long Term Services and Supports (LTSS) in FY 2013, Truven Health Analytics (June 2015), available at http://www.medicaid.gov/medicaid-chip-program-information/by-topics/long-term-services-and-supports/downloads/ltss-expenditures-fy2013.pdf; participant data from Rhode Island Executive Office of Health and Human Services, Global Waiver Quarterly Report, January – March 2013, available at http://www.eohhs.ri.gov/Portals/0/Uploads/Documents/Quarterly%20Global%20Wavier%20Report%20January%20-%20March%20%202013_1.pdf; State of Vermont Agency of Human Services, Global Commitment to Health, Quarterly Report (November 2012), available at http://dvha.vermont.gov/global-commitment-to-health/gc-ffy12-qtr-4-report.pdf. Arizona participation counts as reported by state officials to KCMU and UCSF, 2015. ↩︎
  14. Minnesota has a Section 1115 waiver that offers some fee-for-service HCBS, including Section 1915(i) and Community First Choice services. ↩︎
  15. Medicaid.gov, Waivers, available at http://www.medicaid.gov/Medicaid-CHIP-Program-Information/By-Topics/Waivers/Home-and-Community-Based-1915-c-Waivers.html. ↩︎
  16. For more information about Medicaid managed care, see generally Kaiser Commission on Medicaid and the Uninsured, Medicaid and Managed Care: Key Data, Trends, and Issues (Feb. 2012), available at https://modern.kff.org/medicaid/issue-brief/medicaid-and-managed-care-key-data-trends/; see also Kaiser Commission on Medicaid and the Uninsured, Key Themes in Capitated Medicaid Managed Long-Term Services and Supports Waivers (Nov. 2014), available at https://modern.kff.org/medicaid/issue-brief/key-themes-in-capitated-medicaid-managed-long-term-services-and-supports-waivers/. In addition, Kansas has a combination § 1115/1915(c) waiver managed LTSS; for more information, see Kansas KanCare Waiver (11-W- 00283/7)), State of Kansas “KanCare” Section 1115 Demonstration Application, August 6, 2012, accessed Sept. 10, 2015, available at http://www.medicaid.gov/Medicaid-CHIP-Program-Information/By-Topics/Waivers/1115/downloads/ks/KanCare/ks-kancare-1115-demo-app-08062012.pdf. ↩︎
  17. U.S. Dep’t of Labor, Information on the Final Rule:  Application of the Fair Labor Standards Act to Domestic Service, available at http://www.dol.gov/whd/homecare/finalrule.htm.  While the new rules were to be effective in January, 2015, they have not yet been enforced and were challenged in litigation.  In August, 2015, the D.C. Circuit Court of Appeals upheld the regulations.  Home Care Assoc. of America v. Weil, No. 15-5018 (D.C. Cir. Aug. 21, 2015), available at http://www.dol.gov/whd/homecare/0821appealdecision.pdf.  DOL has revised its time-limited non-enforcement policy, with no actions to enforce the new rules until 30 days after the D.C. Circuit Court’s decision becomes final, and discretion in enforcement actions considering good faith efforts to comply with the new rule through December 2015.  U.S. Dep’t of Labor, We Count on Home Care, Time-Limited Non-Enforcement Policy, available at http://www.dol.gov/whd/homecare/non-enforcement_policy.htm; see also 80 Fed. Reg. 55029 (Sept. 14, 2015), available at http://www.gpo.gov/fdsys/pkg/FR-2015-09-14/pdf/2015-23092.pdf; CMS Informational Bulletin, Self-Direction Program Options for Medicaid Payments in the Implementation of the Fair Labor Standards Act Regulation Changes (July 3, 2014), available at http://www.medicaid.gov/Federal-Policy-Guidance/Downloads/CIB-07-03-2014.pdf; U.S. Dep’t of Justice, Civil Rights Division and U.S. Dep’t of Health & Human Servs., Office for Civil Rights, Dear Colleague letter (Dec. 15, 2014), available at http://www.ada.gov/olmstead/documents/doj_hhs_letter.pdf. ↩︎

Analysis of Insurer Participation in 2016 Marketplaces

Published: Nov 3, 2015

As Marketplace enrollees begin to shop for coverage starting in 2016, the number of insurance choices available to them is changing in some parts of the country.  In early 2015, an average of 6.1 insurer groups offered coverage in each state, up from an average of 5.0 in 2014.  Since then, some insurers have announced their exit or been required to withdraw from the Marketplaces, most notably a number of nonprofit Consumer Operated and Oriented Plans (CO-OPs) and some larger insurers like Blue Cross Blue Shield of New Mexico.  Despite these withdrawals, the Department of Health and Human Services (HHS) recently announced that the average number of issuers per state is increasing slightly in 2016 and that about 9 out of 10 returning Healthcare.gov customers will have 3 or more insurers from which to choose in 2016.

This data note highlights areas where insurer participation is changing in 2016, and where this may have an appreciable effect on market competition. We also examine insurer participation in rural areas, in particular, which have historically had low rates of insurer competition.  This analysis is based on public data in states that use Healthcare.gov (including some state-based exchanges that use the platform).  In some cases, two or more issuers in a given area may be owned or operated by a single parent company.  As the degree to which these subsidiaries compete against each other is unclear, we group issuers by parent company (using data from Mark Farrah Associates and HHS Medical Loss Ratio public use files), and refer to these groupings of affiliated issuers as single “insurers” throughout the analysis.

We found that 40% of counties in states using Healthcare.gov will have just one or two insurers, up from 35% of counties in 2015. With fewer than 3 insurers, these counties may not benefit from insurer market competition to hold down premiums or offer plans with better value. We also found that the number of counties with 5 or more insurers decreased in 2016.

Changes in County-Level Insurer Participation

Overall, 17% of counties in states using Healthcare.gov will see a net increase in the number of insurers offering coverage, while 36% will see a net decrease. The bulk of counties, though, will not have any net change in the number of insurers participating, but in some cases a new company may have entered while another exited.

Table 1: Changes in the Number of Insurers Offering Coverage in States using Healthcare.gov, by county, 2015 – 2016
Change in insurer participation:-2 or more insurers-1 insurerNo net change + 1 insurer+ 2 insurers
Number of Counties132804123241223
Percent of Counties5%31%47%16%1%
SOURCE: Kaiser Family Foundation.

In states using Healthcare.gov, county-level changes in insurer participation range from an increase of 2 insurers (in about two dozen counties, primarily in Virginia, Indiana, and Ohio) to a drop of 7 insurers in Pinal County, Arizona. Arizona counties are particularly hard hit by the withdrawal of three insurers from the state’s marketplace (Assurant, the University of AZ Health Plans, and most recently the co-op plan Meritus), as well as by continuing insurers changing the areas within the state that they service. Ten of the 15 counties in Arizona will have a net loss of five or more insurers.

Figure 1: Distribution of Counties by Number of Insurers Offering Marketplace Coverage

Counties with Low or High Levels of Insurer Participation

Although most states have several insurers offering coverage in their Marketplaces, and the average number of insurers participating in each state is expected to increase slightly in 2016, there is substantial variation within states. For example, although there are 14 insurers (parent companies) offering coverage in Texas’ Marketplace in 2016 (a similar number as last year), 78% of Texas counties will have just one or two insurers from which enrollees can choose (up from 62% of Texas counties in 2015).

In 2016, there are a total of 2,603 counties in states using Healthcare.gov, and in the majority (60%) of these counties, residents will have a choice of plans offered by 3 or more insurers. In fact, most of the counties have consistently had 3 or more insurers in 2015 and 2016.

Even so, in a substantial number of counties (1,045, or 40%) residents will have one or two insurers offering coverage, up from 35% in 2015. Because these counties are largely rural (discussed more in the following section), the share of potential of exchange enrollees in these counties is likely lower than 40% (as these counties represent just 32% of the population in the 38 states using Healthcare.gov).

As shown in the table below, 13% of counties in states using Healthcare.gov will go from having 3 or more insurers to just 1 or 2 in 2016. At the same time, 8% of counties will have a net increase in the number of insurers so that they no longer have just 1 or 2 participating. This leaves a net increase of 142 counties (5% of all counties in Healthcare.gov states) with only one or two participating insurers.

Table 2: Changes in County-Level Insurer Participating in States using Healthcare.gov, 2015 – 2016
Direction of ChangeNumber of Counties% of Total Counties in States using HC.govAverage % of county population living in rural area
Decreased such that the county now has only 1 or 2 insurers35013%64%
Increased such that the county now has 3 or more insurers2088%65%
County consistently had 1 or 2 insurers in both 2015 and 201669527%66%
County consistently had 3 or more insurers in both 2015 and 20161,35052%54%
SOURCE: Kaiser Family Foundation.

Many of the counties with significant changes in insurer participation are concentrated in a handful of states. A number of states went from having at least 3 insurers in every county to having just one or two insurers in a large share of counties, including South Dakota (100% of counties will have just one or two insurers), Utah (79%), Florida (66%), South Carolina (63%), Tennessee (60%), and Arizona (53%).  Iowa and Missouri, by contrast, will now have three or more insurers in the majority of counties whereas there were just one or 2 insurers in the vast majority of both states’ counties in 2015.

County Level Insurer Participation in States Using Healthcare.gov, 2015 – 2016
StateNum. of CountiesAverage Number of Insurersper CountyCounties with 1 or 2 InsurersCounties where the Number of Insurers:
2015201620152016Down to 1 or 2Up to 3 +
U.S. (38 ST)2,6033.43.1903 (35%)1,045 (40%)350208
AK292.02.029 (100%)29 (100%)  – –
AL672.02.164 (96%)60 (90%) –4
AR754.04.00 (0%)0 (0%)  – –
AZ157.82.90 (0%)8 (53%)8 –
DE32.02.03 (100%)3 (100%)  – –
FL673.82.60 (0%)44 (66%)44 –
GA1594.43.60 (0%)30 (19%)30 –
HI52.02.05 (100%)5 (100%) – –
IA992.12.885 (86%)21 (21%)872
IL1024.64.50 (0%)0 (0%) – –
IN924.95.10 (0%)0 (0%)  – –
KS1052.02.0105 (100%)105 (100%) – –
LA643.83.10 (0%)0 (0%)  – –
ME163.03.00 (0%)0 (0%) – –
MI834.33.814 (17%)21 (25%)7 –
MO1152.43.169 (60%)2 (2%) –67
MS822.12.467 (82%)50 (61%) –17
MT564.03.00 (0%)0 (0%) – –
NC1002.12.272 (72%)61 (61%) –11
ND532.82.99 (17%)4 (8%) –5
NE933.74.00 (0%)0 (0%)  – –
NH104.94.90 (0%)0 (0%) – –
NJ214.43.40 (0%)0 (0%)  – –
NM334.14.00 (0%)0 (0%) – –
NV172.91.610 (59%)14 (82%)4 –
OH886.66.70 (0%)0 (0%) – –
OK771.92.063 (82%)77 (100%)14 –
OR367.46.50 (0%)0 (0%) – –
PA674.73.50 (0%)13 (19%)13 –
SC463.32.40 (0%)29 (63%)29 –
SD663.02.00 (0%)66 (100%)66 –
TN953.62.50 (0%)57 (60%)57 –
TX2542.72.0158 (62%)198 (78%)477
UT294.21.60 (0%)23 (79%)23 –
VA1342.63.254 (40%)37 (28%) –17
WI724.44.818 (25%)10 (14%) –8
WV551.01.255 (100%)55 (100%)  – –
WY232.01.023 (100%)23 (100%) – –
SOURCE: Kaiser Family Foundation analysis of premium data from Healthcare.gov, Mark Farrah Associates, HHS MLR Data, and Insurer Rate Filings.

Though plan level enrollment data have not been made available in states using Healthcare.gov (thus making any analysis of the competitiveness of Marketplaces difficult), the participation of 5 or more insurers suggests that residents of some areas may be benefiting from a highly competitive insurer market.

In 2016, 15% of counties in states using Healthcare.gov will have 5 or more insurers participating, down from 19% of counties in 2015. Counties with 5 or more insurers are largely concentrated in a handful of states, such as Oregon, Ohio, and Indiana.

Insurer Participation in Rural Areas

Urban insurance markets tend to be more competitive than markets in rural areas, where there are fewer potential enrollees to attract insurers and also fewer health care providers with whom they can contract.

In counties with just one insurer participating, an average of 64% of the population lives in rural areas, compared to 50% or fewer in areas with 5 or more insurers.

Figure 2: Average Percent of County Living in Rural Area, by Number of Marketplace Insurers Participating

In 2016, counties that are mostly rural will have an average of 2.9 Marketplace insurers participating, down very slightly from an average of 3.1 insurers in 2015.  However, a somewhat larger drop in insurer participation occurred in counties where at least half of the population is living in urban areas; these areas will have an average of 3.5 insurers participating in 2016, down from an average of 3.9 in 2015.

Though counties that are primarily rural were somewhat less likely than urban counties to have a net decrease in the number of insurers – and also somewhat more likely to have an increase in participating insurers in 2016 – this may be explained by the fact that rural areas already had lower insurer participation.

Conclusion

Despite some high-profile insurer exits from Marketplaces, residents of most counties in states using Healthcare.gov will continue to have at least 3 insurers from which to choose – a number that is generally recognized as the minimum necessary for market competition to take place. The bulk of counties (47%) in these states will also have no net change in the number of Marketplace insurers offering coverage.

Still, a substantial portion of counties continue to have just one or two insurers participating. By and large, areas with low insurer participation tend to be more rural, though this analysis suggests that rural areas were somewhat more likely than urban areas to gain insurers in 2016.

Methods

This analysis utilizes publicly available data for states using the Healthcare.gov interface (including state-based exchanges that utilize Healthcare.gov: NV, NM, HI, and OR).  2015 data for HI was supplemented by our review of state regulatory documents, and a fifth county in Hawaii was added to the public use file in 2016.

Issuers that have recently announced their exit, specifically 3 CO-OP plans, were removed from the public use files, as were plans with no premium data for silver coverage. A correction was made to New Mexico insurer participation, where based on our review of rate filings and conversations with state regulators, it appears that New Mexico Health Connections was not fully included in the public use file because of incomplete filings.

We grouped insurers by parent company or group affiliation, which we obtained from a combination of Mark Farrah Associates and the HHS Medical Loss Ratio public use files, matched using HIOS and NAIC plan IDs. We then analyzed, at the county level, how many parent companies participate in these Marketplaces. The percent of county population residing in rural areas was obtained from the Missouri Census Data Center. All averages in this analysis are simple averages across counties and are not weighted by population.

Primary Care Physicians Accepting Medicare: A Snapshot

Authors: Cristina Boccuti, Christa Fields, Giselle Casillas, and Liz Hamel
Published: Oct 30, 2015

Data Note

Policymakers, researchers, and the media have periodically raised questions about the ease or difficulty that Medicare patients experience when trying to find physicians who will see them. Previous studies show that the vast majority of physicians accept Medicare, but the proportion taking new Medicare patients is smaller, particularly among primary care physicians compared with specialists.1  Primary care is especially important for people with Medicare—55 million seniors and adults with permanent disabilities—because they are significantly more likely than others to have multiple chronic conditions.

This Data Note presents findings on reported acceptance of Medicare patients among non-pediatric primary care physicians, based on data from the Kaiser Family Foundation/Commonwealth Fund 2015 National Survey of Primary Care Providers. In addition to comparing physicians’ acceptance of Medicare to private insurance and Medicaid, this Data Note also explores the characteristics of non-pediatric primary care physicians who accept new Medicare patients and who have greater shares of Medicare patients in their caseloads. This analysis is limited to non-pediatric primary care physicians, given its Medicare focus. The methodology for the survey is provided in the Appendix.

Patient acceptance by type of insurance

The vast majority of non-pediatric primary care physicians (93 percent) say they accept Medicare—comparable to the share accepting private insurance (94 percent) (Figure 1). A majority of primary care physicians also say they are also taking new Medicare patients (72 percent), but this share is somewhat lower than the share of primary care physicians accepting new privately insured patients (80 percent).

Figure 1: More than 9 in 10 primary care physicians accept Medicare—similar to private insurance—but acceptance of new Medicare patients is comparably lower

Compared with Medicare and private insurance, a lower share of non-pediatric primary care physicians—67 percent—say they accept Medicaid, the state-federal program that focuses primarily on coverage for children and adults with low-incomes. If pediatricians were included in the analysis of Medicaid acceptance, the share of physicians accepting Medicaid increases to 71 percent, reflecting the higher rate of Medicaid acceptance among pediatricians—84 percent. (Children account for almost half of the Medicaid-covered population.2 ) Further analysis of Medicaid acceptance among primary care physicians is discussed in a recently released issue brief by the Kaiser Family Foundation and the Commonwealth Fund.3 

Primary care physicians who indicate that they are not taking new patients of a given insurance may have “closed practices,” which means they are not taking any new patients, regardless of insurance. In fact, in a separate survey question, about 2 in 10 primary care physicians (19 percent) report that they are not currently taking any new patients (not shown).

Primary care physicians taking Medicare

Demographic analysis reveals some differences in the rates at which different types of physicians report accepting new Medicare patients. For example, 83 percent of primary care physicians who self-identify as Asian accept new Medicare patients, similar to the 86 percent among physicians who self-identify as either Black, Hispanic, or of another or multiple races (Figure 2). In contrast, a lower share of white primary care physicians (66 percent) say they are accepting new Medicare patients. Notably, while higher shares of Black and Hispanic primary care physicians accept new Medicare patients, Black and Hispanic physicians continue to comprise a relatively small share of the overall non-pediatric primary care physician workforce.4 

Figure 2: Acceptance of new Medicare patients is higher among Asian, Black, and Hispanic primary care physicians, though they make up a relatively small overall share of primary care physicians

About two-thirds (67 percent) of primary care physicians age 55 or older say they accept new Medicare patients compared with about three-quarters (76 percent) of primary care physicians under age 55 (Figure 3). Younger doctors may be more likely to be building their patient caseloads and, therefore, may be more willing to take new patients. Alternatively, older physicians may have fuller practices and have less capacity to accept new patients. In fact, 78 percent of non-pediatric physicians age 55 and older say they are accepting new patients (regardless of insurance) compared with 83 percent among their younger counterparts (not shown).

Figure 3: Younger primary care physicians are more likely to accept new Medicare patients, but little difference is seen between male and female doctors

There is little difference between the share of male and female non-pediatric primary care physicians accepting new Medicare patients, though males comprise about two-thirds of the total non-pediatric primary care workforce.

In rural areas, a somewhat higher share of primary care physicians (81 percent) report accepting new Medicare patients relative to their counterparts who practice in cities (72 percent), but differences from cities compared to suburban areas or small towns are not statistically significant (Appendix Table 1). Further analysis by the demographics of physicians’ patient caseloads (income and race, for example), type of practice (such as, hospital-owned or independent practice), does not reveal notable differences regarding acceptance of new Medicare patients. Appendix Table 1 provides these results in more detail.

primary care physicians with relatively high shares of Medicare patients

About one-third of non-pediatric primary care physicians (32 percent) say that at least half their patients have Medicare (Figure 4). This cohort of physicians with the highest share of Medicare patients in their caseload is disproportionately male and older. Among physicians for whom at least half their patients have Medicare, 82 percent are male and 60 percent are age 55 and older. In comparison, among physicians with lower shares of Medicare patients in their caseloads, 58 percent are male and 37 percent are age 55 and older.

Figure 4: For one-third of primary care physicians, at least half their patients have Medicare; these doctors are disproportionately male and older

The Medicare patients of these older doctors have likely been in their caseloads for a long time, given results from other surveys which find that more than 90 percent of people age 65 and older say they did not look for a new primary care physician during the year.5  Therefore, to the extent that Medicare patients are longtime patients of their primary care doctors, the disproportionate share of males in the cohort of physicians with the highest shares of Medicare patients may reflect, to some extent, the relatively low proportion of female physicians three or so decades ago.6 

Further considerations

With the Medicare population aging and increasing by about 2 million each year, efforts to monitor Medicare beneficiaries’ access to primary care are critical. In addition to physician surveys, including the one used for this Data Note, patient surveys are useful to draw a complete picture of access to care. In recent years, national patient-level surveys find that the large majority of Medicare beneficiaries report that they have a usual source of care, can find new doctors when they need one, and can get timely appointments, particularly if experiencing an illness or injury.7  Nonetheless, subsets of Medicare beneficiaries—including beneficiaries with no supplemental insurance or Medicaid and beneficiaries under age 65 living with a permanent disability—report experiencing higher rates of problems finding doctors.8  Further analysis of differences between communities across the country may reveal local market-level variation in access to primary care and could have further policy implications for Medicare.

Appendix

Appendix Table 1: Share of Non-Pediatric Primary Care Physicians Accepting New and Current Medicare patients, by Provider and Practice Characteristics, 2015
Provider/practice characteristicOverallAccepts Medicare including NEW Medicare patientsAccepts Medicare, but not taking new Medicare patientsDoes NOT accept Medicare patientsNot applicable
Overall, unweighted N1,25772%21%2%3%
PHYSICIAN DEMOGRAPHICS   
Provider Sex     
Male (R)66%73%21%2%2%
Female34%70%23%3%3%
Provider Age     
Under 55 (R)55%76%19%2%2%
55 and older44%67%*24%3%3%
Provider Race/ethnicity     
White (R)65%66%26%3%2%
Asian18%83%*15%*0%*2%
Black/ Hispanic/ other15%86%*9%*3%2%
Practice type     
Independent office-based (R)71%72%24%2%1%
Hospital-owned office-based17%76%20%0%*2%
Walk-in retail clinic/other6%44%*10%*10%28%
Community clinic/health center6%87%*9%*1%3%
Area type     
City (R)39%72%21%2%4%
Suburb31%72%24%2%1%*
Small town21%69%22%3%4%
Rural9%81%*15%3%1%
Physician Specialty     
Family Practice (R)50%73%22%2%1%
Internal Medicine46%73%21%2%2%
Other4%
Patient Caseload Characteristics  
Percent with Medicare     
0-24%25%66%22%6%*5%*
25% to 49%41%75%20%1%1%
50% or more (R)32%74%23%1%1%
Percent African American     
0-24% (R)81%70%22%3%3%
25% or more17%79%*17%1%2%
Percent Hispanic     
0-24% (R)82%70%23%3%2%
25% or more15%78%*15%2%5%
Income     
Mostly low-income18%78%15%*1%5%*
Mostly medium-income (R)32%70%24%2%1%
Mixed income46%71%22%*3%3%*
Mostly high-income2%
NOTE: Statistically significant differences at the 95% confidence level are indicated by (*) from the applicable reference group, indicated by (R). Black/Hispanic/other includes primary care physicians who self-identify as Black (non-Hispanic), Hispanic, or of another race or multiple races. (–) indicates sample size too small to analyze. Percentages may not sum to 100 due to rounding and non-responses not shown.SOURCE: The Kaiser Family Foundation/ Commonwealth Fund 2015 National Survey of Primary Care Providers

Endnotes

  1. Boccuti, Cristina, Christina Swoope, Anthony Damico, and Patricia Neuman. “Medicare Patients’ Access to Physicians: A Synthesis of the Evidence,” Kaiser Family Foundation (December 2013). Boukus, Ellyn, Alwyn Cassil, Ann S. O’Malley. “A Snapshot of U.S. Physicians: Key Findings from the 2008 Health Tracking Physician Survey,” Center for Studying Health System Change, Data Bulletin, No. 35 (September 2009). ↩︎
  2. Kaiser Family Foundation, “Distribution of Medicaid Enrollees by Enrollment Group, 2011.” https://modern.kff.org/medicaid/state-indicator/distribution-of-medicaid-enrollees-by-enrollment-group/ ↩︎
  3. Kaiser Family Foundation / The Commonwealth Fund, “Experiences and Attitudes of Primary Care Providers Under the first Year of ACA Coverage Expansion,” (June 2015). ↩︎
  4. Calculations from data released by the Association of American Medical Colleges (AAMC) shows that among non-pediatric primary care physicians, approximately 5 percent are identified as Black or African American and 5 percent as Hispanic or Latino. Association of American Medical Colleges, Diversity in the Physician Workforce: Facts & Figures 2014, Table 11: Primary Care vs. Non-Primary Care by Race, Ethnicity, Age, and Sex, 2013 (December 2014). ↩︎
  5. Medicare Payment Advisory Commission, Report to the Congress: Medicare Payment Policy, Chapter 4, March 2015. ↩︎
  6. Association of American Medical Colleges, “Women in U.S. Academic Medicine and Science: Statistics and Benchmarking Report, 2011-2012.” Table 1: Medical Students, Selected Years, 1965-2011. (2012) ↩︎
  7. Medicare Payment Advisory Commission, Report to the Congress: Medicare Payment Policy, Chapter 4, March 2015. Boccuti, Cristina, Christina Swoope, Anthony Damico, and Patricia Neuman. “Medicare Patients’ Access to Physicians: A Synthesis of the Evidence,” Kaiser Family Foundation (December 2013). ↩︎
  8. Ibid.   ↩︎