KFF designs, conducts and analyzes original public opinion and survey research on Americans’ attitudes, knowledge, and experiences with the health care system to help amplify the public’s voice in major national debates.
Kaiser Health Tracking Poll: December 2015 Findings
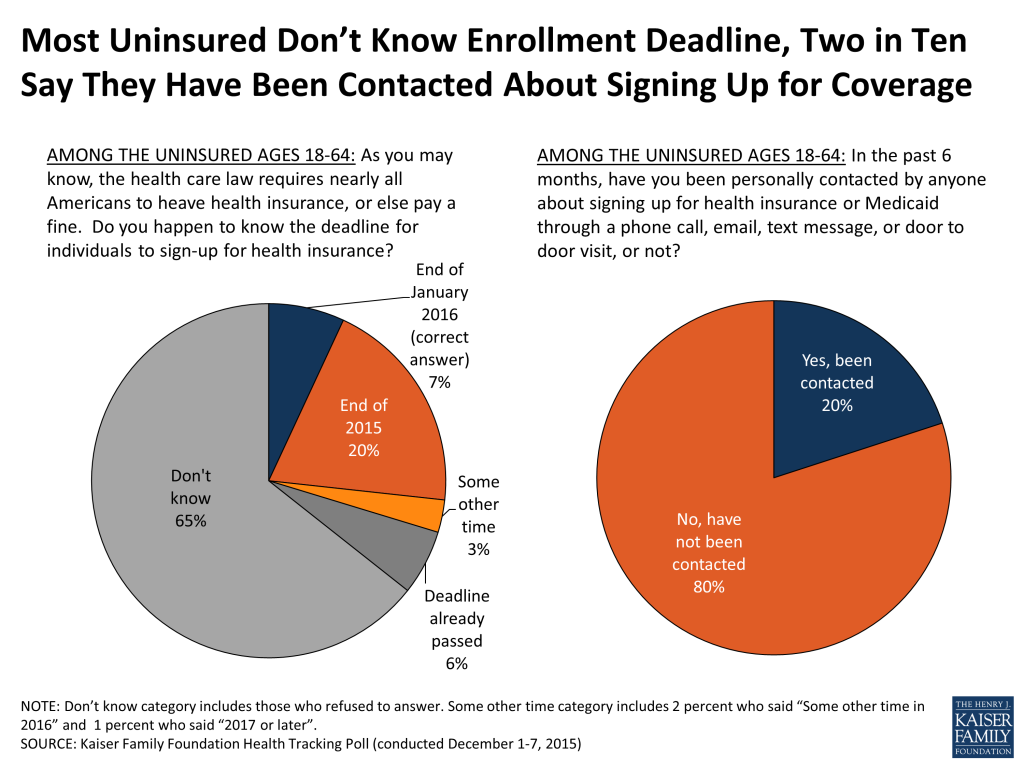
The ACA’s third open enrollment will come to a close at the end of January and the December Kaiser Health Tracking Poll finds that, at this point, only 7 percent of the uninsured correctly identify this as the deadline to enroll in coverage and 20 percent say they have been contacted by someone about signing up for coverage. When asked why they have not personally obtained health insurance this year, nearly half of the uninsured (46 percent) say they have tried to get coverage but that it was too expensive. However, slightly over half of the uninsured (55 percent) say they plan to get health insurance in the next few months.
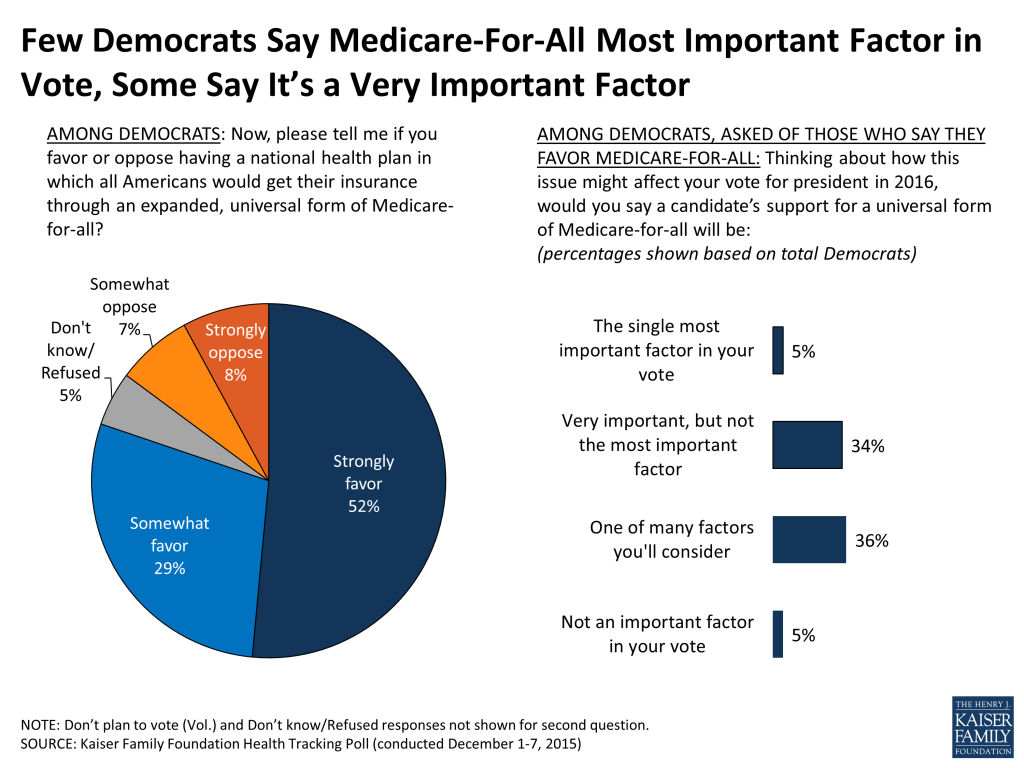
The race for the Democratic presidential nomination has recently included debate about creating a national health plan in which all Americans would get their insurance through an expanded form of Medicare generally called Medicare-for-all. Majorities of Democrats (81 percent) and independents (60 percent) favor the idea of Medicare-for-all compared to 63 percent of Republicans who oppose it. Few Democrats see the issue as a major factor in their vote at this point. Just 5 percent of Democrats say they favor the idea of Medicare-for-all and a candidate’s support for it will be the single most important factor in their vote. However, a third of Democrats (34 percent) say they favor it and it will be very important, but not the most important factor in their vote, 36 percent say it will be one of many factors they will consider and five percent say it will not matter at all. The poll did not present details or arguments for and against Medicare-for-all and future polls may examine support and opposition in greater depth.
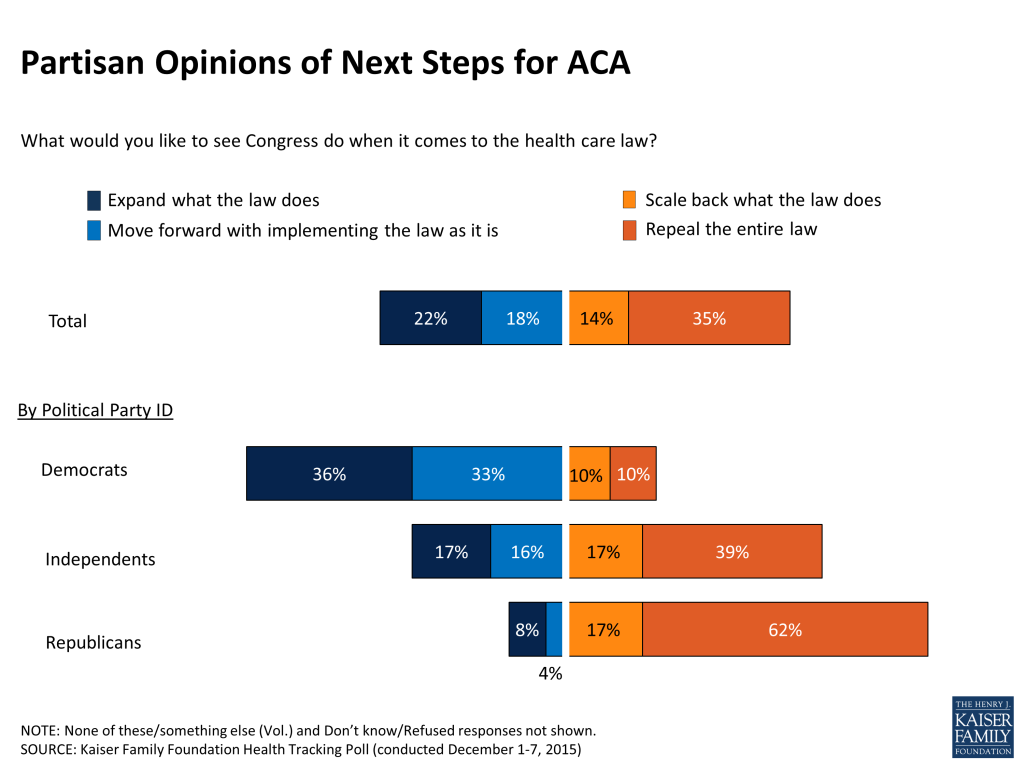
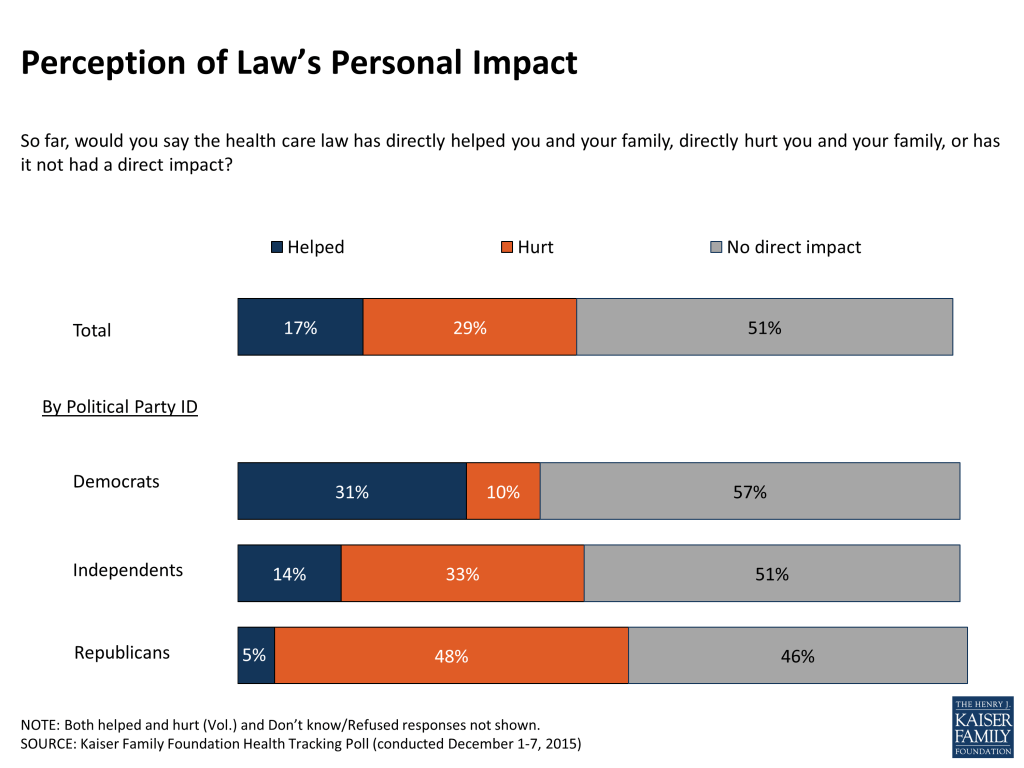
As the U.S. Senate voted to repeal the Affordable Care Act (ACA) earlier this month, more of the public views the health care law unfavorably than favorably (46 percent vs. 40 percent). In addition, the public remains divided over what Congress should do next with the law, with 35 percent supporting repeal, 14 percent supporting scaling back the law, 18 percent who say they would like to see it implemented as is, and 22 percent who say they want the law expanded. While half of the public (51 percent) says they have not been directly impacted by the law, more say they have been hurt by the law than say they have been helped (29 percent vs. 17 percent). These perceptions of the law and its personal impacts vary starkly by political party identification as they have since the law’s inception.
The Uninsured and Open Enrollment
There is about a month and half left of the Affordable Care Act’s third open enrollment period and at this point, 7 percent of the uninsured are aware the deadline to enroll is at the end of January. Another 20 percent say the deadline is at the end of the year, while nearly two-thirds (65 percent) say they don’t know, 6 percent say the deadline has already passed, and 3 percent give another date.
Some uninsured report being the recipient of outreach efforts, with 2 in 10 (20 percent) saying they have been contacted by someone about signing up for health insurance in the past 6 months.
Figure 1
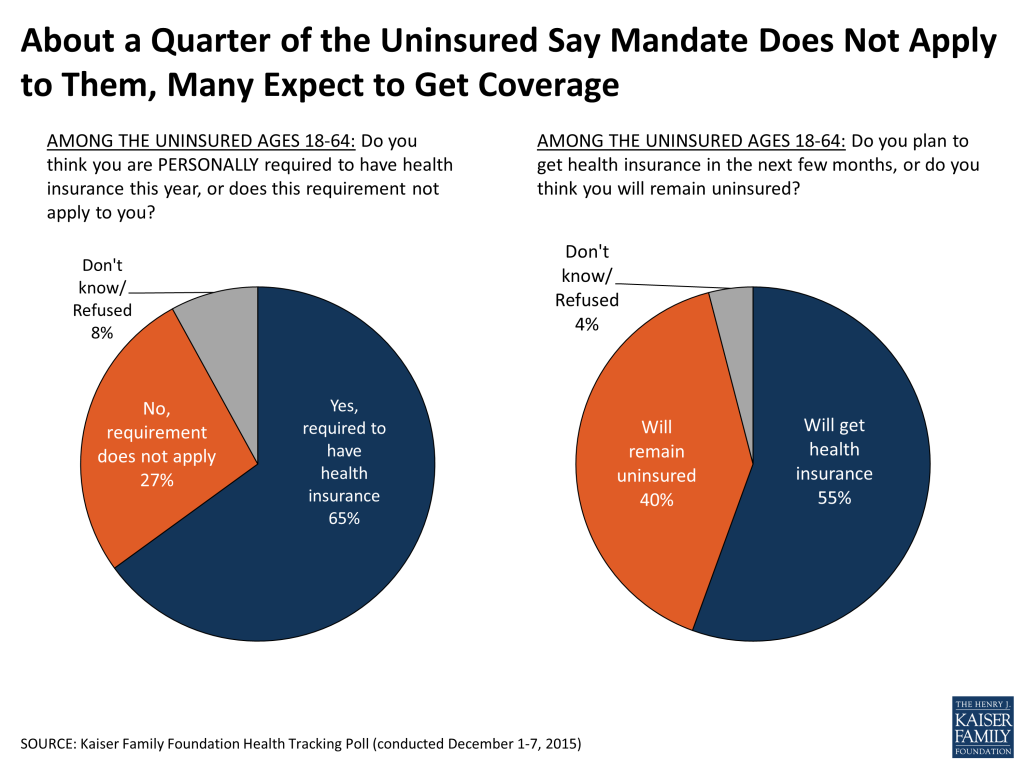
The majority (65 percent) of the uninsured think they are personally required to have health insurance, though about a quarter (27 percent) say they don’t think the requirement applies to them personally. Some of the uninsured may in fact be exempt from the fine because of hardship exemptions available under the law.
Over half of the uninsured (55 percent) say they plan to get health insurance in the next few months while 4 in 10 of the uninsured (40 percent) expect to remain uninsured. Some of the uninsured may in fact be in the midst of a brief period of uninsurance, however over half (55 percent) report that they have been uninsured for two years or more.
Figure 2
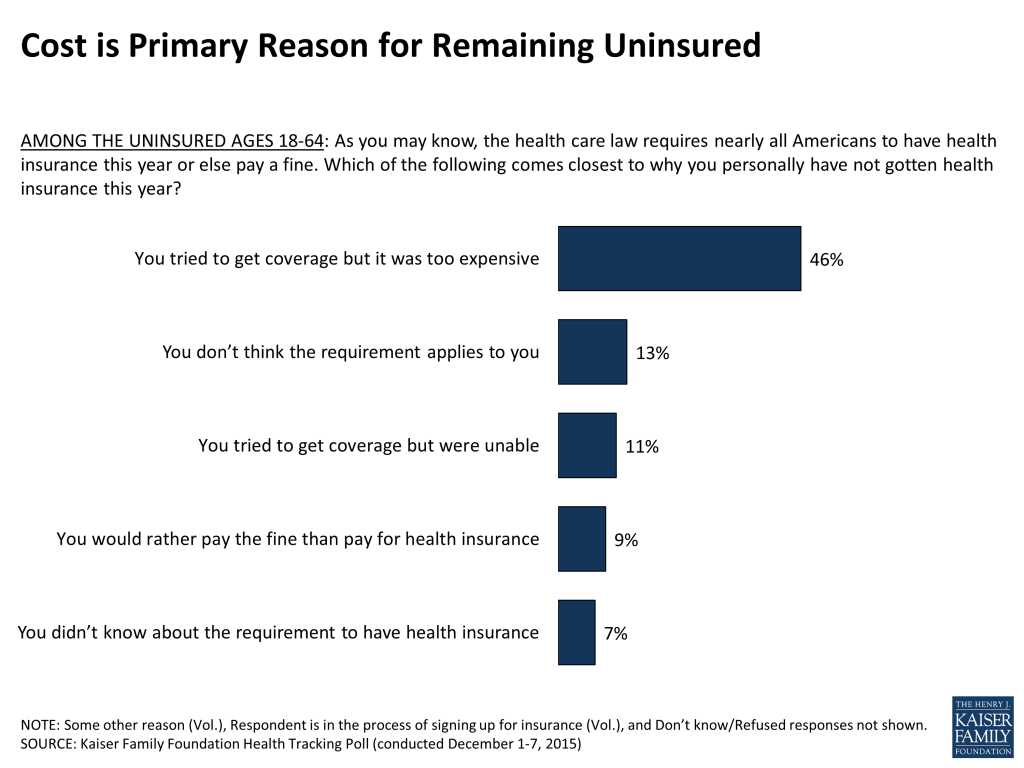
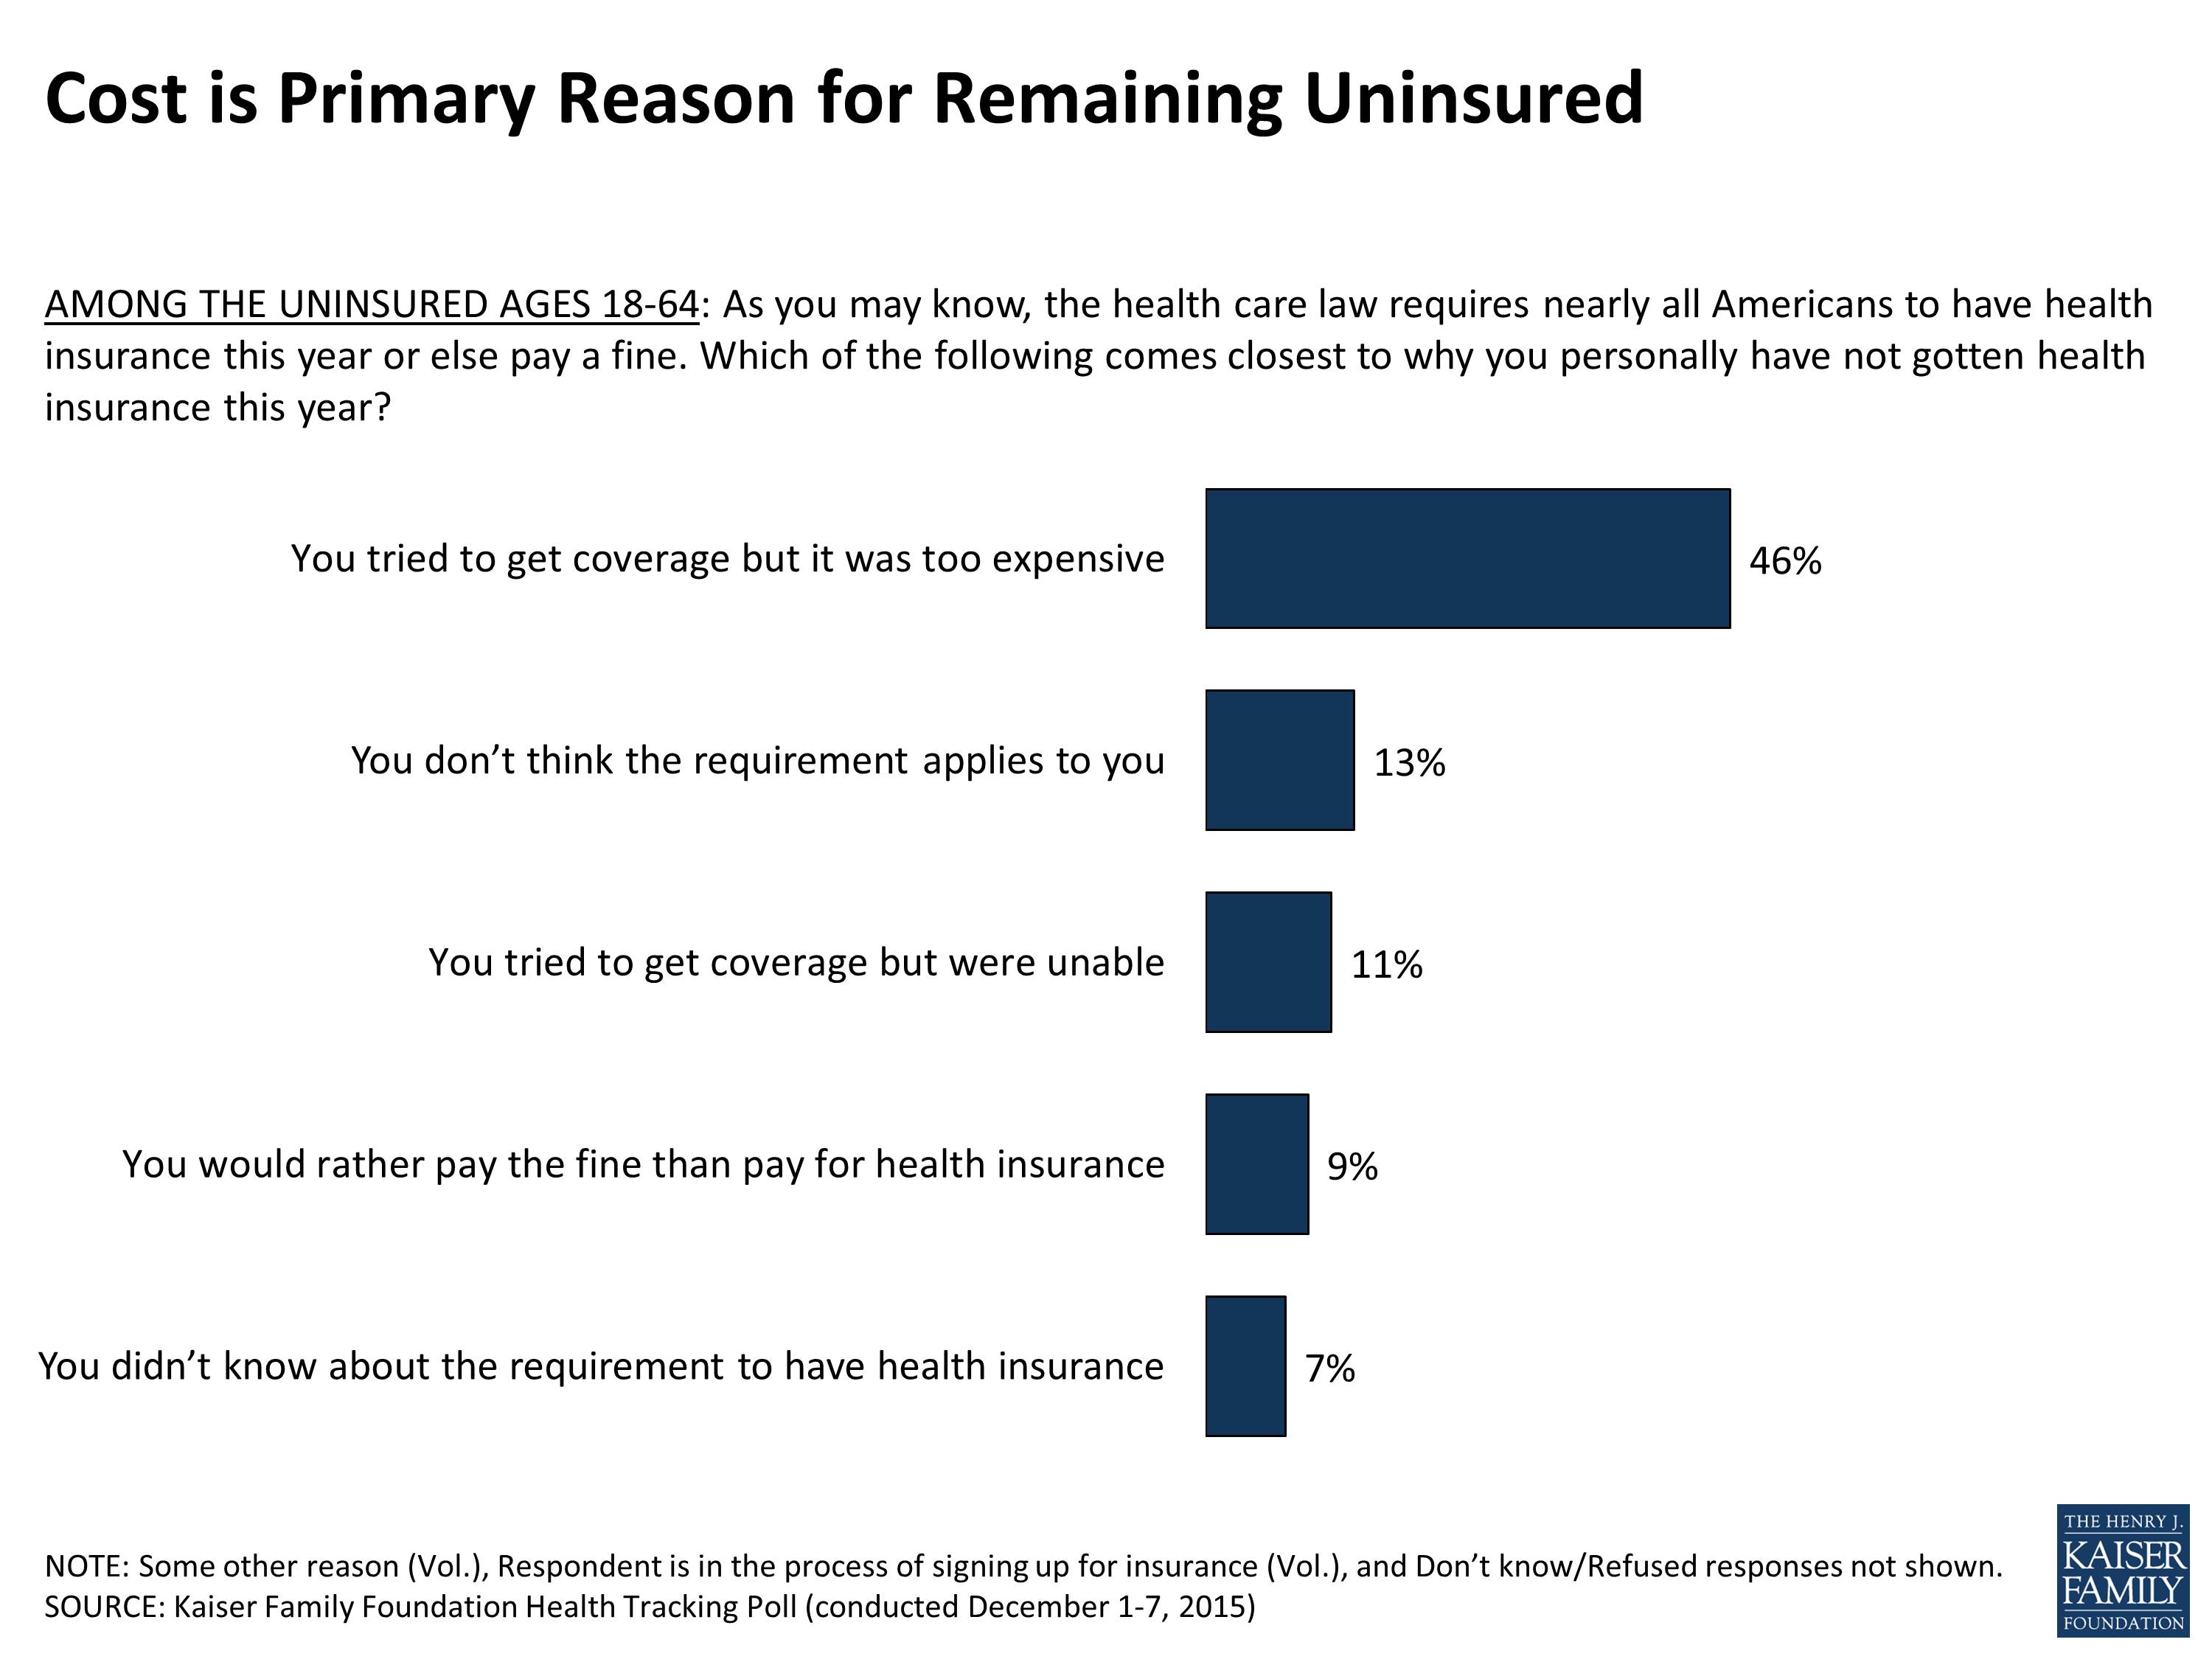
When asked why they have not purchased health insurance this year, nearly half of the uninsured (46 percent) say they have tried to get coverage but that it was too expensive. Others say they don’t think the requirement applies to them (13 percent), that they tried to get coverage but were unable (11 percent), that they’d rather pay the fine than pay for coverage (9 percent) and that they didn’t know about the requirement to have health insurance (7 percent).
Figure 3
Opinions of a Medicare-For-All Idea
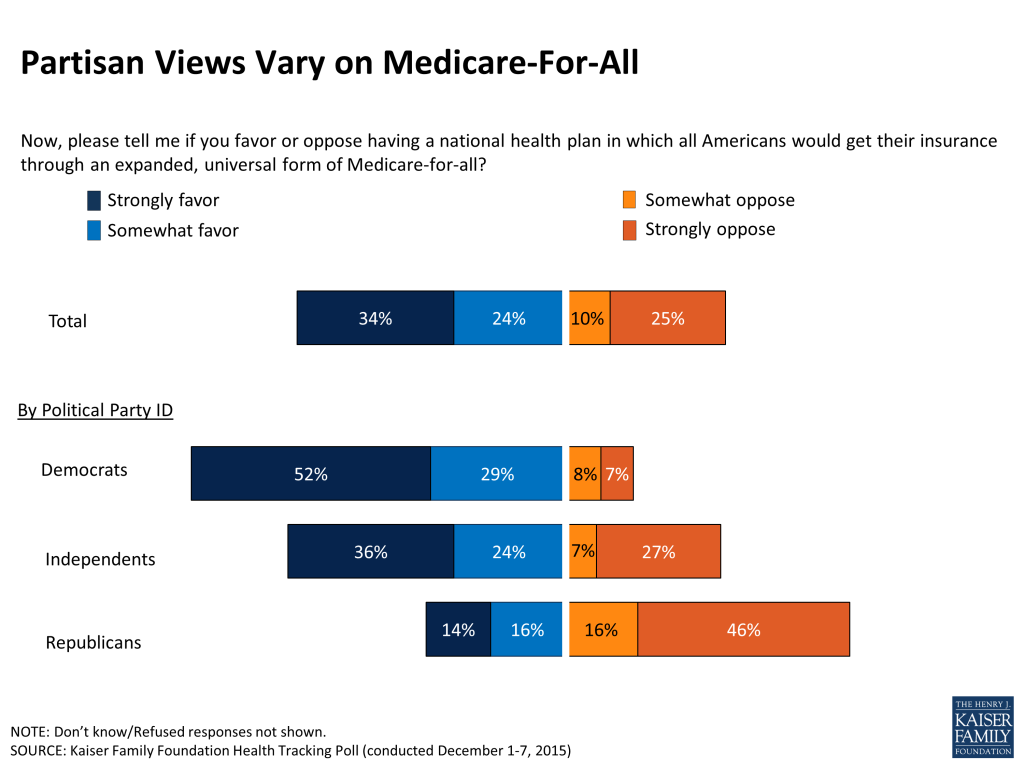
As the presidential primaries inch closer and candidates begin to debate the intricacies of their platforms, a long-discussed health policy option has reemerged in debate between democratic candidates; the idea of creating a national health plan in which all Americans would get their insurance through an expanded, universal form of health insurance called Medicare-for-all. When asked their opinion, nearly 6 in 10 Americans (58 percent) say they favor the idea of Medicare-for-all, including 34 percent who say they strongly favor it. This is compared to 34 percent who say they oppose it, including 25 percent who strongly oppose it. Opinions vary widely by political party identification, with 8 in 10 Democrats (81 percent) and 6 in 10 independents (60 percent) saying they favor the idea, while 63 percent of Republicans say they oppose it.
Figure 4
Medicare-For-All Idea Has Little Influence on Vote Among Democrats
As Democratic presidential primary candidates debate the issue, few Democrats say the issue will be a driving force behind their vote at this point. Looking specifically at Democrats, just 5 percent say they favor Medicare-for-all and that a candidate’s support for it will be the single most important factor in their vote. A third of Democrats (34 percent) say they favor the idea and that it will be very important, but not the most important factor in their vote, 36 percent say it will be one of many factors they will consider, and 5 percent say it will not matter at all.
Figure 5
Views of the ACA
The December Kaiser Health Tracking poll finds that public opinion of the health care law leans negative with 46 percent of the public reporting an unfavorable view of the law and 40 percent reporting a favorable view. The partisan split on the law remains stark. Eight in 10 Republicans (79 percent) say they feel unfavorably toward the law and tw0-thirds of Democrats (67 percent) say the opposite. Independents fall in the middle, but more independents report an unfavorable view of the law than a favorable one (53 percent vs. 32 percent, respectively).
Figure 6
While the Senate voted to repeal the health care law earlier this month,1 the public remains split on what they want Congress to do with the health care law moving forward. The largest share, 35 percent, supports repeal of the law, while 14 percent support scaling back the law, 18 percent would like to see it implemented as is, and 22 percent say they want the law expanded.
Over 6 in 10 Republicans (62 percent) would like to see Congress repeal the health care law, yet they are divided on whether Congress should repeal the law and replace it with a Republican-sponsored alternative (24 percent), or repeal and not replace it (28 percent).
Figure 7
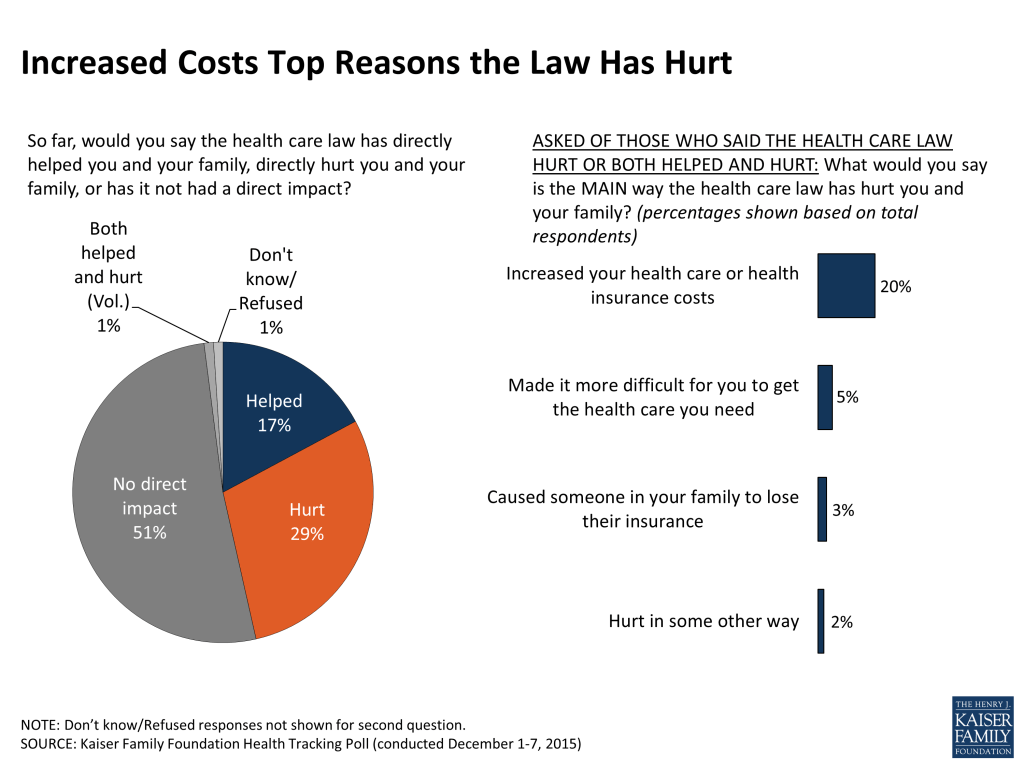
Overall, half of the public (51 percent) says they have not been directly impacted by the health care law, however more say they have been hurt by the law than say they have been helped (29 percent vs. 17 percent). There are partisan differences in how people view the law’s personal impacts. Nearly half of Republicans (48 percent) and a third of independents (33 percent) say they have been hurt by the health care law, while 3 in 10 Democrats (31 percent) say they have been helped.
Figure 8
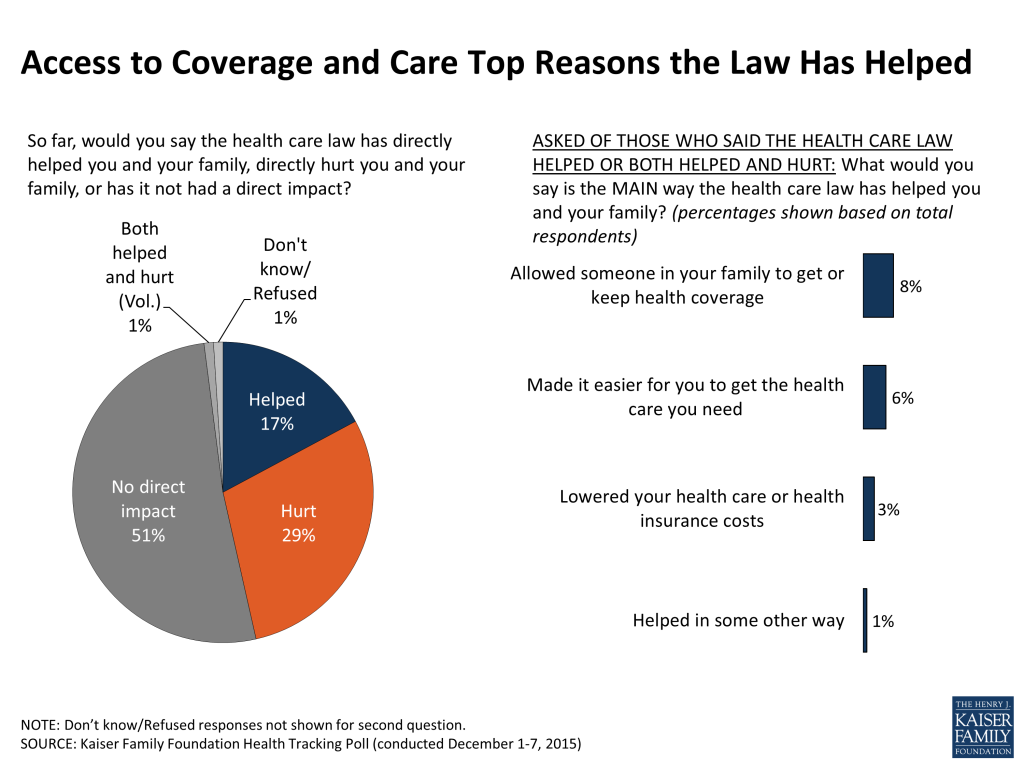
For those who say the law has helped them, they say it has either allowed someone in their family to get or keep health insurance coverage (8 percent of the public overall), made it easier for them to get the care they need (6 percent), or lowered their health care or health insurance costs (3 percent).
Figure 9
For those who say the health care law has hurt them, most say it has increased their health care or health insurance costs (20 percent of the public overall). Smaller shares feel it has made it more difficult for them to get the health care they need (5 percent) or that it has caused someone in their family to lose health insurance (3 percent).
Figure 10
Kaiser Health Policy News Index: December 2015
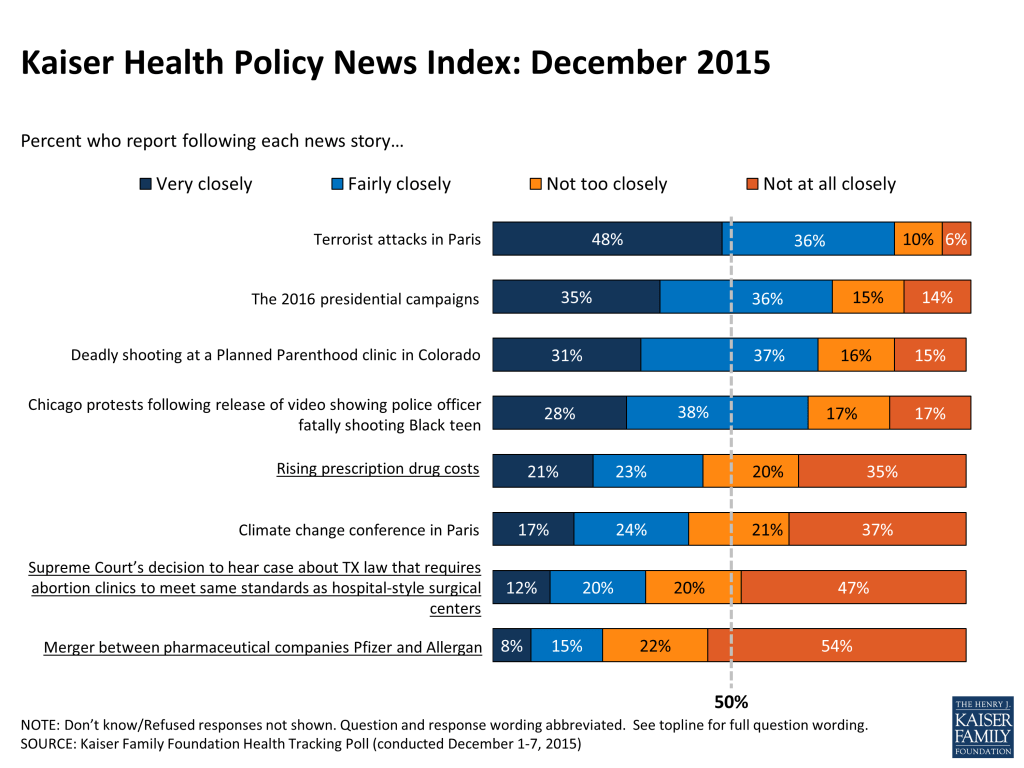
This month, over 4 in 10 of the public (44 percent) report following news about rising prescription drug costs either ‘very’ or ‘fairly’ closely. Other health policy stories were closely followed by smaller shares of the public, such as the Supreme Court’s decision to hear a case about a Texas law requiring abortion clinics to meet the same standards as hospital-style surgical centers (32 percent) and the merger between the pharmaceutical companies Pfizer and Allergan (23 percent). On the other hand, large majorities of the public report closely following news about the terrorist attacks in Paris (84 percent), the 2016 presidential campaigns (71 percent), the deadly shooting at a Planned Parenthood clinic in Colorado the day after Thanksgiving (68 percent) and protests in Chicago following the release of a video showing a police officer fatally shooting a Black teen (66 percent). In addition, 4 in 10 (41 percent) say they closely followed news about the climate change conference in Paris.
Figure 11
Kaiser Health Tracking Poll: December 2015 Methodology
This Kaiser Health Tracking Poll was designed and analyzed by public opinion researchers at the Kaiser Family Foundation (KFF). The survey was conducted December 1-7, 2015, among a nationally representative random digit dial telephone sample of 1,202 adults ages 18 and older, living in the United States, including Alaska and Hawaii (note: persons without a telephone could not be included in the random selection process). Computer-assisted telephone interviews conducted by landline (480) and cell phone (722, including 414 who had no landline telephone) were carried out in English and Spanish by Princeton Data Source under the direction of Princeton Survey Research Associates International (PSRAI). Both the random digit dial landline and cell phone samples were provided by Survey Sampling International, LLC. For the landline sample, respondents were selected by asking for the youngest adult male or female currently at home based on a random rotation. If no one of that gender was available, interviewers asked to speak with the youngest adult of the opposite gender. For the cell phone sample, interviews were conducted with the adult who answered the phone. KFF paid for all costs associated with the survey.
The combined landline and cell phone sample was weighted to balance the sample demographics to match estimates for the national population using data from the Census Bureau’s 2013 American Community Survey (ACS) on sex, age, education, race, Hispanic origin, nativity (for Hispanics only), and region along with data from the 2010 Census on population density. The sample was also weighted to match current patterns of telephone use using data from the July-December 2014 National Health Interview Survey. The weight takes into account the fact that respondents with both a landline and cell phone have a higher probability of selection in the combined sample and also adjusts for the household size for the landline sample. All statistical tests of significance account for the effect of weighting.
The margin of sampling error including the design effect for the full sample is plus or minus 3 percentage points. Numbers of respondents and margins of sampling error for key subgroups are shown in the table below. For results based on other subgroups, the margin of sampling error may be higher. Sample sizes and margins of sampling error for other subgroups are available by request. Note that sampling error is only one of many potential sources of error in this or any other public opinion poll. Kaiser Family Foundation public opinion and survey research is a charter member of the Transparency Initiative of the American Association for Public Opinion Research.
Group
N (unweighted)
M.O.S.E.
Total
1202
±3 percentage points
Party Identification
Democrats
383
±6 percentage points
Republicans
316
±6 percentage points
Independents
339
±6 percentage points
Insurance Status
Insured, ages 18-64
745
±4 percentage points
Uninsured, ages 18-64
106
±10 percentage points
Endnotes
The December Kaiser Health Tracking Poll was in the field when the U.S. Senate voted to repeal the health care law on December 3, 2015. ↩︎
Most Democrats Like Medicare-for-All, But Very Few Say the Issue Will Drive Their Votes in the 2016 Elections
Similar to Last Month, More Hold Unfavorable Views of the ACA than Favorable Ones
The Affordable Care Act’s third open enrollment period will end on Jan. 31, but the latest Kaiser Health Tracking Poll finds that only a small share of people without health insurance realize it.
Just 7 percent of the uninsured correctly identify January as the deadline to enroll; another 20 percent say the deadline is at the end of 2015, while everyone else either says they don’t know, gives another date or says the deadline has already passed.
People without health insurance remain a key outreach target for the government, outreach groups, and insurers, and the poll finds one in five (20%) report that over the past six months they have personally been contacted by someone about signing up for coverage.
The majority (65%) of the uninsured think they are personally required to have health insurance, though about a quarter (27%) say they don’t think the requirement applies to them personally. (Some in fact may be exempt under specific provisions of the law.)
When asked why they have not personally purchased health insurance this year, nearly half of the uninsured (46%) say they have tried to get coverage but that it was too expensive. Relatively few cite other reasons, including 9 percent who say they’d rather pay a fine than pay for insurance.
Most of the uninsured (55%) say they plan to get health insurance in the next few months. Some may in fact be in the midst of a brief period without insurance; however, a majority (55%) say that they have been uninsured for at least two years.
Recently Democratic presidential candidates Hillary Clinton and Bernie Sanders debated the idea of “Medicare-for-all,” which involves creating a national health plan in which all Americans would get their insurance through an expanded version of the Medicare program. A large majority of Democrats (81%) support the idea of Medicare-for-all, as do most independents (60%), while most Republicans (63%) oppose the idea. The poll did not ask about details or tradeoffs.
At the same time, few Democrats say the issue will be the driving force behind their vote: just 5 percent of Democrats say that it will be the single most important factor in their presidential vote. A third of Democrats (34%) say it will be very important, but not the most important factor, while others say it will be one of many factors they will consider (36%) or that it won’t matter at all (5%). Future polls may explore the issue in greater depth.
As the U.S. Senate voted to repeal the Affordable Care Act (ACA) earlier this month, more of the public views the health care law unfavorably (46%) than favorably (40%), statistically unchanged from last month when a gap reopened between unfavorable and favorable views. The public also remains divided over what Congress should do next with the law, with just over a third (35%) supporting repeal and others favoring scaling back the law (14%), implementing it as is (18%) or expanding what the law does (22%).
Half (51%) of the public says they have not been personally impacted by the law, though more say they have been hurt by the law than say they have been helped (29% and 17% respectively). These perceptions continue to vary starkly by party identification.
The poll was designed and analyzed by public opinion researchers at the Kaiser Family Foundation and was conducted from Dec. 1 to 7, 2015 among a nationally representative random digit dial telephone sample of 1,202. Interviews were conducted in English and Spanish by landline (480) and cell phone (722). The margin of sampling error is plus or minus 3 percentage points for the full sample. For results based on subgroups, the margin of sampling error may be higher.
Congress released the FY 2016 Omnibus bill on December 16, 2015, which includes funding for U.S. global health programs at the U.S. Agency for International Development (USAID), the Department of State, and the Centers for Disease Control and Prevention (CDC). Total known* funding for U.S. global health programs in the FY 2016 Omnibus is $9.2 billion, which is approximately $58 million (<1%) higher than the FY 2015 enacted level, and $312 million (4%) above the President’s FY 2016 Budget Request. The tables below compare U.S. global health funding in the FY 2016 Omnibus to the FY 2015 enacted levels and the President’s FY 2016 Budget Request.
Funding for most global health programs remained essentially flat compared to FY 2015 levels. However, funding for malaria, maternal & child health (MCH), and nutrition increased compared to FY 2015; the entire MCH increase was due to an increased contribution to GAVI. Total family planning & reproductive health (FP/RH) funding ($607.5 million) decreased slightly (-$2.5 million) compared to FY 2015 due to decreased funding for the United Nations Population Fund (UNFPA); bilateral FP/RH funding remained flat compared to FY 2015.
It is important to note that the Global Gag Rule (Mexico City Policy), which was included in the House version of the State and Foreign Operations (SFOPs) appropriation bill, was not included in the FY 2016 Omnibus.
*Some funding amounts (e.g. NIH funding for international HIV research) are determined at the agency level, and were not earmarked by Congress in the Omnibus bill.
Medicaid is the nation’s major publicly-financed health insurance program, covering the acute and long-term services and supports (LTSS) needs of millions of low-income Americans of all ages. With limited coverage under Medicare and few affordable options in the private insurance market, Medicaid will continue to be the primary payer for a range of institutional and community-based LTSS for people needing assistance with daily self-care tasks. Advances in assistive and medical technology that allow people with disabilities to be more independent and to live longer, together with the aging of the baby boomers, will likely result in increased need for LTSS over the coming decades. To reduce unmet need and curb public health care spending growth, state and federal policymakers will be challenged to find more efficient ways to provide high quality, person-centered LTSS across service settings. This primer describes LTSS delivery and financing in the U.S., highlighting covered services and supports, types of care providers and care settings, beneficiary subpopulations, costs and financing models, quality improvement efforts, and recent LTSS reform initiatives.
What Are Long-Term Services and Supports?
“Long-term services and supports” encompasses the broad range of paid and unpaid medical and personal care assistance that people may need – for several weeks, months, or years – when they experience difficulty completing self-care tasks as a result of aging, chronic illness, or disability.
Long-term services and supports provide assistance with activities of daily living (such as eating, bathing, and dressing) and instrumental activities of daily living (such as preparing meals, managing medication, and housekeeping). Long-term services and supports include, but are not limited to, nursing facility care, adult daycare programs, home health aide services, personal care services, transportation, and supported employment as well as assistance provided by a family caregiver. Care planning and care coordination services help beneficiaries and families navigate the health system and ensure that the proper providers and services are in place to meet beneficiaries’ needs and preferences; these services can be essential for LTSS beneficiaries who often have substantial acute care needs as well.
Where Are Long-Term Services and Supports Provided and By Whom?
Long-term services and supports are delivered in institutional and home and community-based settings.
These include institutions (such as nursing facilities and intermediate care facilities for individuals with intellectual disabilities) and home and community-based settings (such as group homes or apartments).1 Over the last twenty years, there has been a shift toward serving more people in home and community-based settings rather than institutions due in large part to the growth in beneficiary preferences for home and community-based services (HCBS) and states’ obligations under the Supreme Court’s Olmstead decision which found that the unjustified institutionalization of persons with disabilities violates the Americans with Disabilities Act.2
Long-term services and supports are provided by unpaid family caregivers and by paid providers.
In the U.S., the majority of LTSS is provided by unpaid caregivers – relatives and friends – in home and community-based settings, allowing many with LTSS needs to age in place. According to a 2012 nationally representative survey, the majority of family caregivers are women age 50 and over who care for a parent for at least one year while maintaining outside employment.3 This unpaid care ranges from help with getting to doctor appointments or paying bills to more intensive care such as assisting with bathing or wound care. As a person’s daily care needs become more extensive, paid LTSS delivered by direct care workers – medical professionals (such as physicians or nurses) or para-professionals (such as nurse aides or personal attendants) – may be required in addition to or in place of family caregiver services.
Who Needs Long-Term Services and Supports?
Millions of Americans – children, adults, and seniors – need to access long-term services and supports as a result of disabling conditions and chronic illnesses.
People needing LTSS include elderly and non-elderly people with intellectual and developmental disabilities, physical disabilities, behavioral health diagnoses (such as dementia), spinal cord or traumatic brain injuries, and/or disabling chronic conditions. A beneficiary’s age, gender, socioeconomic status, living arrangement, and access to information about care options, in addition to his or her health and disability status, can influence the types and amounts of LTSS utilized and the duration of care.4,5 People with current or future LTSS needs access information about available services and providers via information and referral networks (such as local Aging and Disability Resource Centers and Area Agencies on Aging) and outreach initiatives (such as peer-to-peer outreach in nursing home-to-community transition programs). The LTSS beneficiary population is growing more racially and ethnically diverse, which has implications for ensuring cultural competency and language access in outreach, assessment, care planning, and service delivery policies and practices.
Demographic trends suggest considerable growth in the number of Americans who will need LTSS in the coming decades.
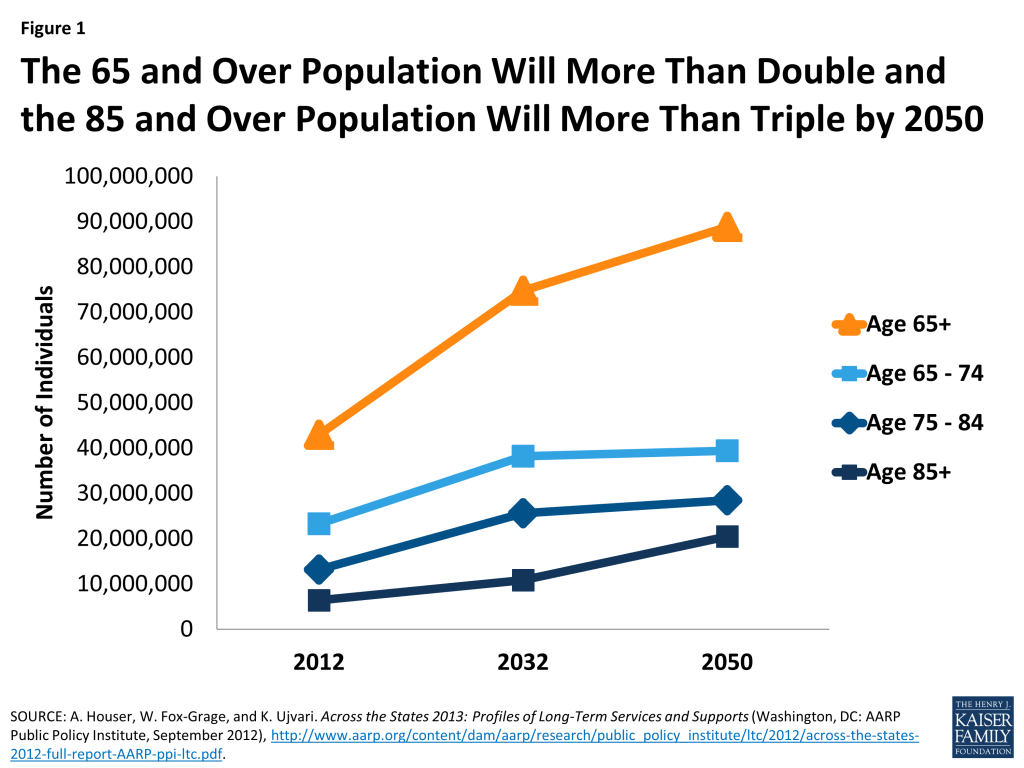
Life expectancy remains relatively high, baby boomers continue to age into older adulthood, and advances in assistive and medical technology allow more people with chronic illnesses and disabling conditions to live longer and independently in the community. The number of elderly Americans is expected to more than double in the next 40 years (Figure 1). According to 2012 estimates, among people age 65 and over, an estimated 70 percent will use LTSS, and people age 85 and over – the fastest growing segment of the U.S. population – are four times more likely to need LTSS compared to people age 65 to 84.6,7 Approximately seven in ten people age 90 and above have a disability, and among people between the ages of 40 and 50, almost one in ten, on average, will have a disability that may require LTSS.8
Figure 1: The 65 and Over Population Will More Than Double and the 85 and Over Population Will More Than Triple by 2050
How Much Do Long-Term Services and Supports Cost and Who Pays For Them?
Long-term services and supports are expensive, with institutional care costs exceeding costs for home and community-based services and supports.
Beyond unpaid care provided by relatives, LTSS costs often exceed what individuals and families can afford given other personal and household expenses. Institutional settings such as nursing facilities and residential care facilities are the most costly. In 2015, the median annual cost for nursing facility care was $91,250.9 Generally, HCBS are less expensive than institution-based LTSS, but may still represent a major financial burden for individuals and their families. In 2015, the median cost for one year of home health aide services (at $20/hour, 44 hours/week) was almost $45,800 and adult day care (at $69/day, 5 days/week) totaled almost $18,000 (Figure 2).10
Figure 2: Long-Term Services and Supports Are Expensive, Often Exceeding What Beneficiaries and Their Families Can Afford
Long-term services and supports are financed with private and public dollars, with the majority covered by publicly financed health insurance programs.
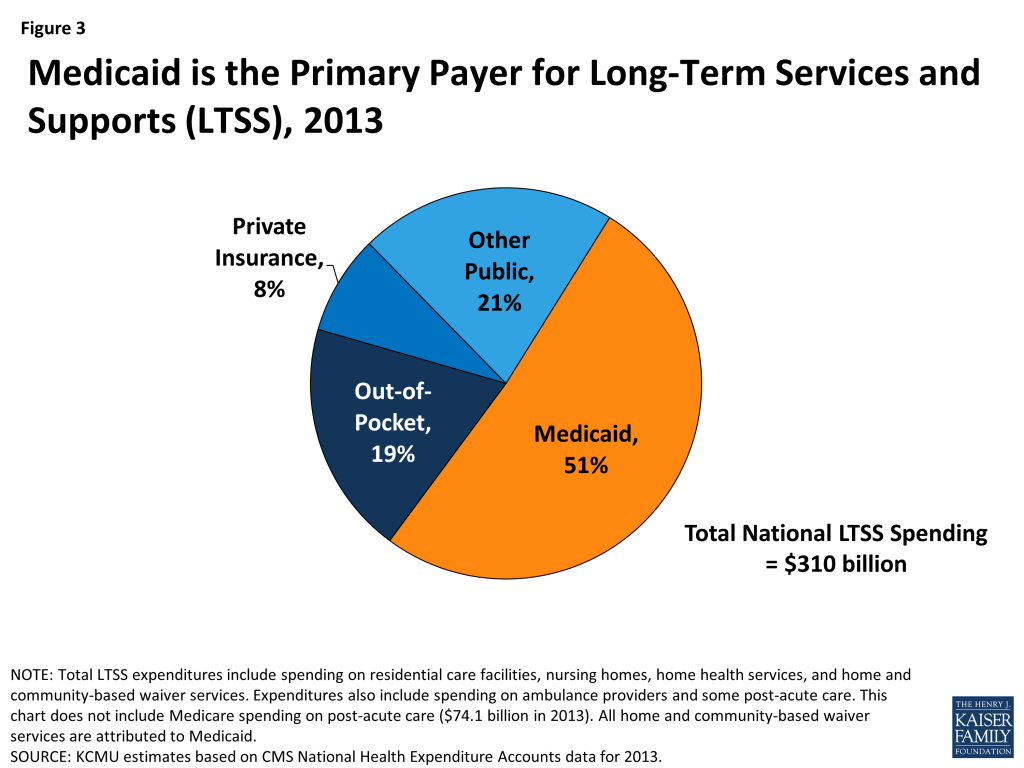
With few affordable options in the private insurance market and limited coverage under Medicare, those with insufficient resources rely on Medicaid. According to the Centers for Medicare and Medicaid Services (CMS) National Health Expenditure Accounts data, total national spending on LTSS was $310 billion in 2013, with Medicaid covering 51 percent of total expenditures followed by other public,11 out-of-pocket spending, and private insurance (Figure 3).
Medicaid is the primary payer for institutional and community-based long-term services and supports. Medicaid, the nation’s main public health insurance program for people with low income, is administered by states within broad federal rules and financed jointly by states and the federal government. In 2013, Medicaid outlays for institutional and community-based LTSS totaled just over $123 billion, accounting for about 28 percent of total Medicaid service expenditures that year.12 Medicaid eligibility, service delivery, financing, and the new and expanded HCBS options under the Affordable Care Act (ACA) are discussed below.
Figure 3: Medicaid is the Primary Payer for Long-Term Services and Supports (LTSS), 2013
Medicare coverage of long-term services and supports for seniors, nonelderly people with disabilities, and people with certain chronic conditions is limited. Medicare covers both acute care (such as physician visits) and post-acute services (such as skilled nursing facility care) for people who have a qualifying work history and (1) are age 65 or older; (2) are under age 65 and have been receiving Social Security Disability Insurance for more than 24 months; or (3) have end-stage renal disease or Amyotrophic Lateral Sclerosis.13 Under Medicare, LTSS coverage is limited. Home health services are only covered for beneficiaries who are homebound, and personal care services are not covered by Medicare. Post-acute nursing facility care is covered for up to 100 days following a qualified hospital stay.
As of 2011, almost 10 million beneficiaries – known as “dual eligibles” – were enrolled in both Medicaid and Medicare, with Medicaid paying for the majority of their long-term services and supports costs.14 The dual eligible beneficiary population comprises seniors and younger people with disabilities who are entitled to Medicare and are also eligible for some level of assistance from their state Medicaid program. Medicare acts as the primary payer for a range of services for dual eligibles; Medicaid provides cost-sharing assistance and may pay for services not covered or limited under Medicare.15,16 In 2011, 62 percent of Medicaid expenditures (or $91.8 billion) for dual eligibles were for LTSS.17 Under new waiver authority in the ACA, selected states are testing models to align Medicare and Medicaid financing, seeking to better integrate and coordinate primary, acute, behavioral health, and LTSS for this vulnerable beneficiary population.18,19
Private long-term care insurance is typically inaccessible to all with current or future care needs often due to high premium prices. Although private long-term care (LTC) insurance, which began as nursing facility insurance, has been available for about 30 years, the market for this insurance product is relatively small. In 2011, 7 to 9 million Americans had private LTC insurance coverage and the average annual premium for an individual policy totaled $2,283.20 Paying for private LTC insurance can be burdensome for individuals and families with limited incomes; this is especially true for seniors who face higher premium costs while living on a fixed income. Furthermore, the benefits are time-limited, so consumers must estimate the amount of time they will require LTSS in the future, which may be difficult to do. Government support for the purchase of private LTC insurance exists in the form of tax incentives and public-private partnerships between states and private insurance companies that allow people with LTSS needs to access Medicaid services, subject to certain eligibility requirements, after purchasing and exhausting benefits under a state-qualified, private LTC insurance policy.21
Few individuals can afford to pay out-of-pocket for needed long-term services and supports, especially those living on fixed incomes with limited personal savings and assets. In 2013, out-of-pocket spending accounted for 19 percent of total national LTSS expenditures.22 A person’s ability to pay for current LTSS needs and/or save for future potential LTSS needs depends on many factors, including, but not limited to, health status, employment status and history, household income, debt and asset levels, and the availability of natural supports (such as a family caregiver); unable to pay, individuals may delay or forego needed formal LTSS. Most seniors have limited resources, with seniors of color facing disproportionately higher economic and health insecurity in retirement.23 In 2013, half of all Medicare beneficiaries, including seniors and younger adults with disabilities, had incomes below $23,500.24
What is Medicaid’s Role in Long-Term Services and Supports Financing?
Medicaid Eligibility
People with long-term services and supports needs may qualify for Medicaid based solely on their low incomes or they may qualify at slightly higher incomes if they also meet disability-related functional criteria. Eligibility criteria vary by state, subject to certain federal minimum requirements. In addition, at state option, people whose income or assets exceed the threshold may later qualify for Medicaid coverage by depleting financial resources, literally “spending down,” to meet the financial eligibility criteria. People seeking Medicaid coverage for nursing facility care must contribute to the cost of care from their monthly income and are subject to an asset transfer review; the transfer of certain assets (such as cash gifts) within the five-year “look back” period may result in a penalty and a period of ineligibility.25 To address the gaps in private LTSS coverage and support people with disabling conditions who desire to secure employment and live in the community, many states opt to allow workers with disabilities to have higher incomes and “buy in” to Medicaid coverage by paying a monthly premium.26
Medicaid Long-Term Services and Supports
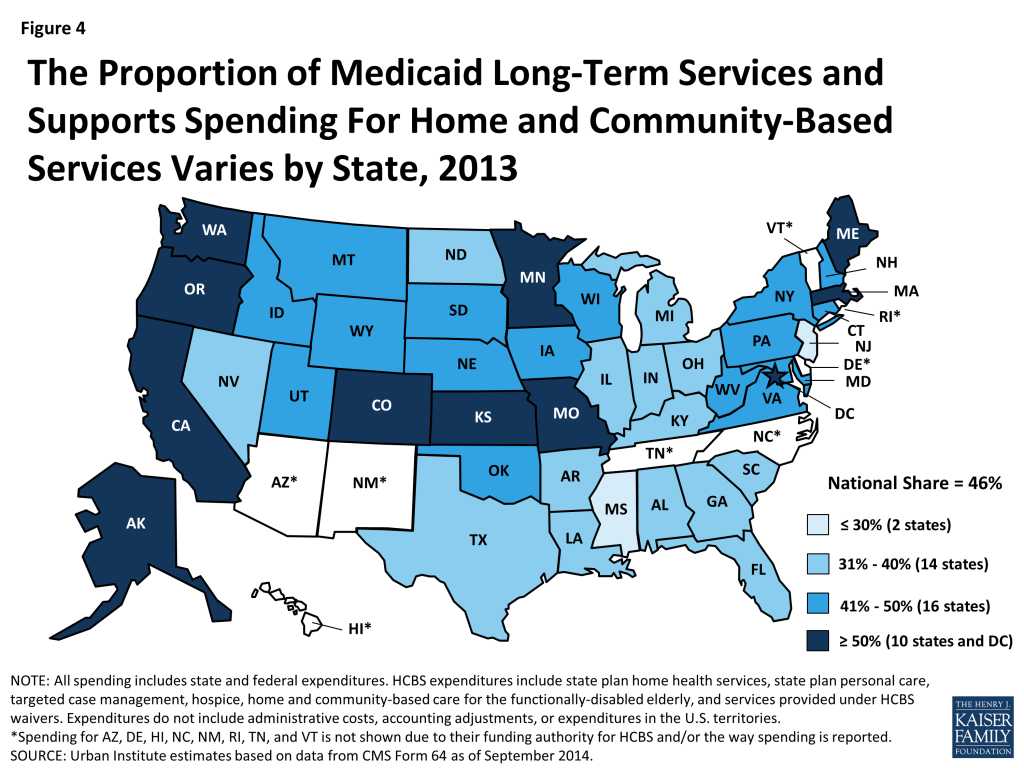
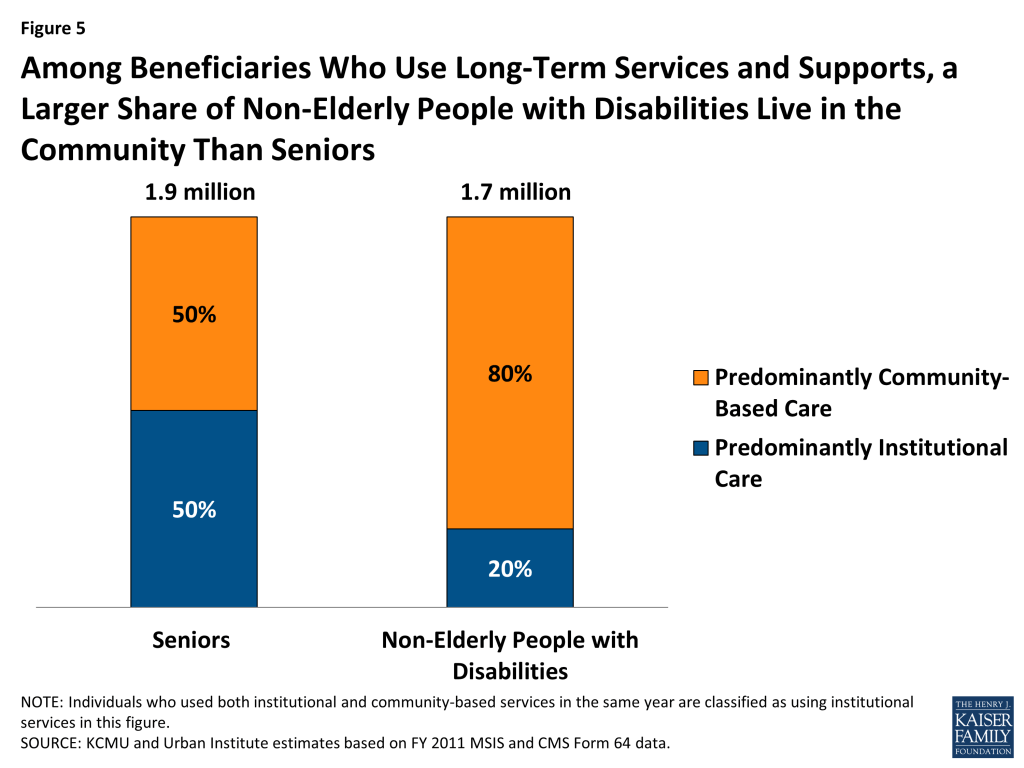
Within the Medicaid program, there has been a historical structural bias toward institutional care. States are required to cover nursing facility benefits, while coverage of most HCBS is optional.27 As a result, Medicaid HCBS spending patterns vary among states, with states spending between 21 percent and 78 percent of their total Medicaid LTSS dollars on HCBS in 2013 (Figure 4).28 In addition, the use of Medicaid HCBS versus institutional services varies across beneficiary subpopulations; in 2011, 80 percent of nonelderly beneficiaries with disabilities used HCBS compared to 50 percent of elderly beneficiaries (Figure 5).29
Figure 4: The Proportion of Medicaid Long-Term Services and Supports Spending For Home and Community-Based Services Varies by State, 2013Figure 5: Among Beneficiaries Who Use Long-Term Services and Supports, a Larger Share of Non-Elderly People with Disabilities Live in the Community Than Seniors
There has been considerable progress in increasing the amount of Medicaid long-term services and supports dollars spent on community-based services and supports over the last two decades. In 2013, spending on HCBS accounted for 46 percent (or $56.6 billion) of total Medicaid LTSS spending, up from 32 percent (or $29.8 billion) in 2002.30 Three benefits account for the majority of Medicaid HCBS spending: (1) home health services, a mandatory state plan service; (2) personal care services, an optional state plan service; and (3) Section 1915(c) HCBS waivers, which allow states to waive certain federal requirements and provide HCBS to people who otherwise would have to access LTSS in an institutional setting. Just over 3.2 million beneficiaries received home health, personal care, or home and community-based waiver services in 2011, with expenditures totaling $55.4 billion or just about $17,200 per beneficiary.31 In addition, states can use Section 1115 demonstration waivers to deliver HCBS, including through managed LTSS delivery systems (discussed below).32 The Medicaid program also provides authority for beneficiaries to self-direct their HCBS by controlling the selection, training, and dismissal of providers and/or the allocation of their service budget.33
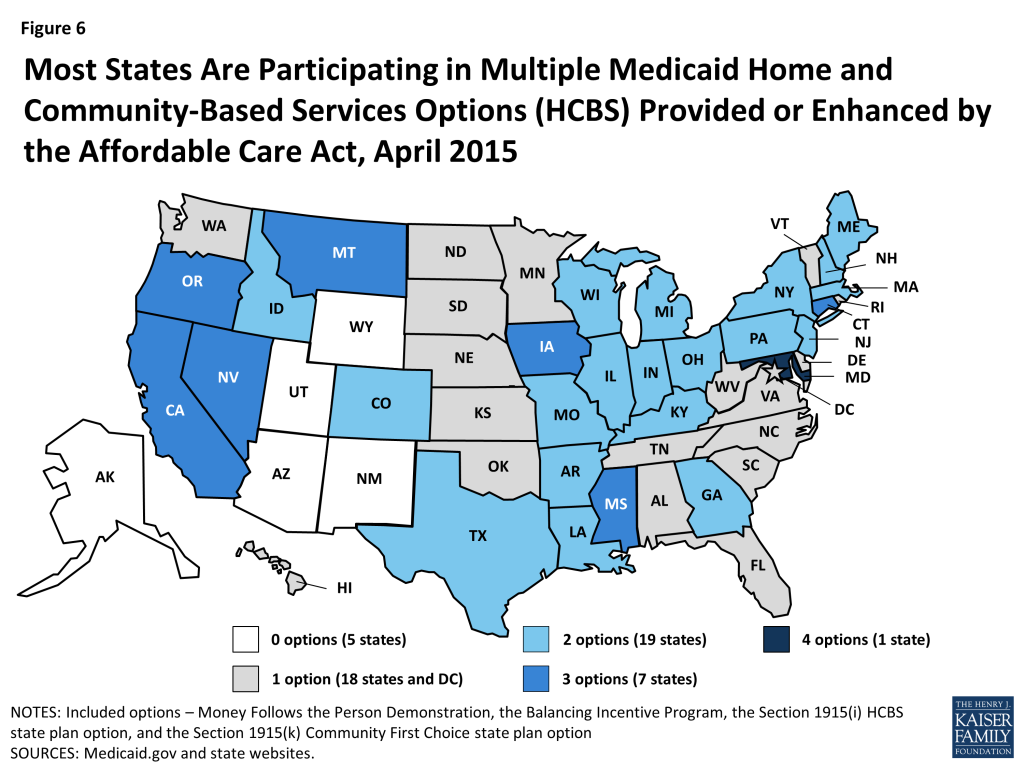
States have numerous options for funding Medicaid home and community-based services, including new and expanded options under the Affordable Care Act.34,35 State implementation of the new and expanded HCBS options under the ACA (i.e., Money Follows the Person Demonstration, the Balancing Incentive Program, the Section 1915(i) HCBS state plan option, and the Section 1915(k) Community First Choice state plan option), some of which provide enhanced federal funding, was relatively slow through 2012. This was due, in part, to competing administrative and fiscal priorities within state Medicaid programs.36 There is now more widespread implementation of the options among states, with numerous states pursuing multiple options either separately or in combination (Figure 6).
Figure 6: Most States Are Participating in Multiple Medicaid Home and Community-Based Services Options (HCBS) Provided or Enhanced by the Affordable Care Act, April 2015
Section 1915(c) waivers accounted for the largest share of Medicaid home and community-based services enrollment and the majority of Medicaid home and community-based services spending in 2011. Expenditures for approximately 1.45 million beneficiaries totaled $38.9 billion across 291 individual Section 1915(c) waiver programs. Not all who are eligible have access to HCBS waiver services as states may implement restrictive financial and functional eligibility standards, enrollment caps, service unit limits, or waiting lists in an effort to contain costs. In 2013, there were over 536,000 individuals in 39 states on a Section 1915(c) waiver waiting list.37
Medicaid Delivery System Reforms
There has been increasing interest among states in transitioning from the traditional fee-for-service financial model to managed care to deliver and coordinate services for Medicaid long-term services and supports beneficiaries. The number of states delivering and financing Medicaid LTSS via a risk-based capitated managed care model is expected to increase,38 and states also are pursuing managed fee-for-service models, including primary care case management. Managed care models, while relatively untested to date, offer potential opportunities for improving care coordination, and/or expanding access to HCBS.39 Given the vulnerability of this beneficiary population, it is important that managed LTSS systems are monitored to ensure access to the necessary services and supports on which beneficiaries rely to live independently in the community.
How is the Quality of Long-Term Services and Supports Evaluated?
Care standards and performance measures are important to inform state and national efforts to improve the quality of long-term services and supports delivered across care settings and service delivery models.
Ensuring timely access to high quality care for people with LTSS needs is a priority for beneficiaries and their families, service providers, and state and federal policymakers alike. However, quality measures for LTSS are not as well developed as those for care provided in clinical settings. In addition, LTSS performance measures can vary by state, prompting efforts to develop a core set of LTSS-specific quality measures to evaluate structural elements (such as provider staffing capacity), service delivery processes (such as timeliness of assessment), or care and performance outcomes (such as an improved ability to complete a self-care task).40,41 Ongoing efforts to streamline assessment processes, improve reporting feedback mechanisms, and examine the effectiveness of LTSS-specific quality standards will be vital to improving service delivery as the LTSS beneficiary population grows and becomes more diverse.
Quality in Institutional settings
Nursing homes certified to participate in the Medicare and Medicaid programs are regulated and must adhere to national and statewide quality assurance and reporting standards, which were expanded by the Affordable Care Act. The ACA, which incorporates the Nursing Home Transparency and Improvement Act, the Elder Justice Act, and the Patient Safety and Abuse Prevention Act, is the first comprehensive institutional care quality legislation since the 1987 Nursing Home Reform Act. The ACA requires CMS and nursing homes to implement provisions aimed at improving transparency and accountability, enforcement, and resident abuse prevention. For example, CMS must establish a national direct care worker payroll data collection and reporting system and add additional facility-level staffing and complaint data to the Nursing Home Compare website,42 and nursing homes must disclose their ownership, management, and financing structures, implement compliance and ethics programs, meet CMS’s quality assurance and improvement standards, and report suspected crimes committed against residents to law enforcement authorities. States and CMS continue to make progress in implementing the federal requirements as the provisions are expected to have a substantial impact on nursing home accountability for care quality.43
Quality in Home and Community-Based Settings
As states continue to increase spending on home and community-based services as an alternative to institutional care, work continues on developing specific quality measures to evaluate and improve home and community-based long-term services and supports. Improving and aligning quality standards across all Medicaid HCBS programs remains a priority for CMS, states, and stakeholders through initiatives such as measurement testing projects and education and training opportunities for states and providers.44 With respect to Section 1915(c) waivers, the largest Medicaid HCBS program, CMS modified the quality assurance reporting system in 2014, with the goal of improving oversight of beneficiary outcomes and realigning state reporting requirements. Examples of ongoing efforts to identify or develop and evaluate HCBS quality measures include the Measure Applications Partnership/National Quality Forum,45 the Agency for Healthcare Research and Quality Medicaid Home and Community-Based Services Measure Scan,46 and the Long-Term Care Quality Alliance Quality Measurement Workgroup.47
Managed Long-Term Services and Supports and Quality
Given the growing interest among states in covering new populations and long-term services and supports benefits through risk-based, capitated managed care arrangements, monitoring beneficiaries’ access to care and outcomes in these systems will remain important. In 2013, CMS issued guidance to states outlining best practices for designing and implementing managed LTSS programs with respect to quality measurement and other key program elements. States implementing managed LTSS programs are expected to include a comprehensive quality strategy for assessing and improving care and quality of life for LTSS beneficiaries that aligns with existing Medicaid quality initiatives and systems.48
What Recent Efforts to Reform National Long-term Services and Supports Financing Have Been Initiated?
Established by the Affordable Care Act but later repealed before implementation, the Community Living Assistance Services and Supports (CLASS) program was designed to provide working adults the opportunity to offset the costs of future long-term services and supports needs.49 CLASS was intended to be a national, voluntary insurance program for purchasing LTSS coverage, financed by individual premium contributions, but concerns about solvency and adequacy of the cash benefit led to the program’s repeal by the American Taxpayer Relief Act of 2013.50
Under the same law that abolished the Community Living Assistance Services and Supports program, Congress established the time-limited, federal, bipartisan Commission on Long-Term Care. The Commission’s September 2013 Final Report, outlines several service delivery, workforce, and financing policy recommendations, e.g., establishing integrated care teams, using technology-enhanced data sharing across care settings and among providers, training family caregivers, finding a sustainable balance of public and private financing for LTSS.51 (Note: Five members of Commission later issued an independent minority report which outlined alternative recommendations for LTSS reform.52 ) While the Commission recommended that future work be carried out through a national advisory committee,53 no such committee has been convened to date, although numerous public and private stakeholders remain interested in advancing the national LTSS agenda.54,55
Looking Ahead
Reforming the nation’s long-term services and supports system is likely to remain a topic of discussion in the coming decades as policymakers and other stakeholders consider options for meeting the growing need for community-based options and addressing the lack of long-term services and supports coverage options outside of Medicaid. Given the significant public investment in the delivery and financing of LTSS, policymakers and other stakeholders have a vested interest in exploring LTSS reform options. In the absence of other viable public or private options to finance current and future LTSS needs for people of all ages, Medicaid will continue to be the major financing and delivery system for institutional and community-based LTSS for millions of Americans. Looking ahead, addressing community-based provider and housing shortages and streamlining access to community-based care that supports functional independence and enhances quality of life will remain key objectives of states’ rebalancing efforts as the need for Medicaid HCBS continues to grow. Policymakers and other stakeholders also may focus on the status of Medicaid initiatives to rebalance LTSS in favor of HCBS, with the expiration of Balancing Incentive Program funds in 2015, and Money Follows the Person funds in 2016. As the general LTSS beneficiary population increases and becomes more diverse, state and federal governments and private stakeholders will be challenged to find innovative ways to coordinate, deliver, and finance high quality, person-centered LTSS in the most appropriate care setting that promotes health and well-being, respects beneficiary preferences and rights, and maximizes efficiency to manage cost growth.
Endnotes
Assisted living facilities are another setting in which LTSS may be provided. In January 2014, Centers for Medicare and Medicaid Services (CMS) finalized new rules outlining the qualities that settings must meet to be considered “home and community-based” for the provision of Medicaid services. 79 Fed. Reg. 2948 (Jan. 16, 2014), http://www.gpo.gov/fdsys/pkg/FR-2014-01-16/pdf/2014-00487.pdf. ↩︎
The “Other Public” payer category includes the Children’s Health Insurance Program, the Department of Defense, the Department of Veterans Affairs, worksite health care, the Indian Health Service, workers’ compensation, general assistance, maternal and child health, vocational rehabilitation, other federal programs, Substance Abuse and Mental Health Services Administration, other state and local programs, and school health. ↩︎
Urban Institute estimates based on FY 2013 data from CMS Form 64, prepared for KCMU, exclude administrative spending, adjustments, and payments to the territories. ↩︎
People with end-stage renal disease must have worked long enough to qualify for Medicare Part A (or be the spouse or dependent child of someone who qualifies for Part A) and be on regular dialysis or require a transplant in order to be eligible for Medicare before the age of 65. For more background see Kaiser Family Foundation, Medicare at a Glance (Washington, DC: Kaiser Family Foundation, September 2014), https://modern.kff.org/medicare/fact-sheet/medicare-at-a-glance-fact-sheet/. ↩︎
Kaiser Commission on Medicaid and the Uninsured and Urban Institute estimates based on data from FY 2011 Medicaid Statistical Information System (MSIS). 2010 MSIS data was used for Florida, Kansas, Maine, Maryland, Montana, New Mexico, New Jersey, Oklahoma, Texas, and Utah. ↩︎
Kaiser Commission on Medicaid and the Uninsured and Urban Institute estimates based on data from FY 2010 MSIS and CMS Form 64. Because 2010 data were unavailable, 2009 MSIS data were used for CO, ID, MO, NC, and WV, and then adjusted to 2010 CMS Form 64 spending levels. ↩︎
America’s Health Insurance Plans (AHIP), Who Buys Long-Term Care Insurance in 2010–2011? A Twenty Year Study of Buyers and Non-Buyers (In the Individual Market) (Washington, DC: AHIP, March 2012), https://www.ahip.org/WhoBuysLTCInsurance2010-2011/. ↩︎
For more information about the Long-Term Care Partnership Program, see U.S. Government Accountability Office, Overview of the Long-Term Care Partnership Program (GAO-05-1021) (Washington, DC: GAO, September 2005), http://www.gao.gov/new.items/d051021r.pdf. ↩︎
KCMU estimates based on CMS National Health Expenditure Accounts data for 2013. ↩︎
Self-direction of personal care services is available to states under the Section 1915(j) option, which allows states to offer self-direction provided that states offer personal care services as an optional state plan benefit or through a Section 1915(c) waiver. 42 U.S.C. § 1396n(j)(4)(A); 42 C.F.R. § 441.452(a). States also must offer beneficiaries the opportunity to self-direct services if they implement the Community First Choice option to provide attendant care services and supports. ↩︎
Susan C. Reinhard, Enid Kassner, Ari Houser, Kathleen Ujvari, Robert Mollica, and Leslie Hendrickson, Raising Expectations, 2014: A State Scorecard on Long-Term Services and Supports for Older Adults, People with Physical Disabilities, and Family Caregivers (Washington, DC: AARP; New York, NY: The Commonwealth Fund; and Long Beach, CA: The SCAN Foundation, June 2014), http://www.longtermscorecard.org/~/media/Microsite/Files/2014/Reinhard_LTSS_Scorecard_web_619v2.pdf. ↩︎
Heather M. Young, Ellen Kurtzman, Martina Roes, Mark Toles, Abigail Ammerman, and Doug Pace, Measurement Opportunities & Gaps: Transitional Care Processes and Outcomes Among Adult Recipients of Long-Term Services and Supports (Washington, DC: Long-Term Quality Alliance, December 2011), http://www.ltqa.org/wp-content/themes/ltqaMain/custom/images/TransitionalCare_Final_122311.pdf. ↩︎
In April 2014, the Bipartisan Policy Center issued a white paper on challenges in financing and delivering LTSS, launching its Long-Term Care Initiative. The Bipartisan Policy Center anticipates it will issue policy recommendations in late 2015 with the objective “to find a politically viable and fiscally sustainable path forward to improve the financing and delivery of LTSS for America’s aging population and working-age Americans with disabilities.” For more information, see “America’s Long-Term Care Crisis: BPC Launches Initiative to Find a Politically and Fiscally Viable Path Forward to Improve the Financing and Delivery of Long-Term Care,” Bipartisan Policy Center, accessed December 10, 2015, http://bipartisanpolicy.org/press-release/americas-long-term-care-crisis-bpc-launches-initiative-find-politically/. ↩︎
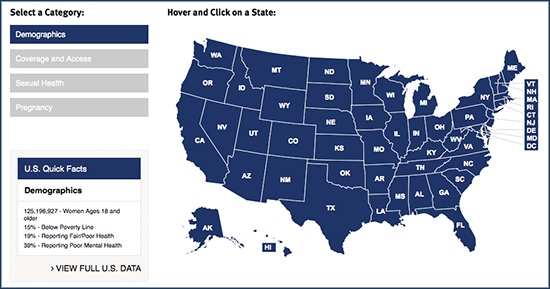
The Kaiser Family Foundation has launched a new interactive map and dashboard that offers the latest national and state-specific data on women’s health in the United States via comprehensive, easy-to-access state profiles.State Profiles for Women’s Health allows users to hover over a state in the map to see key facts for women on demographics, health coverage and access to care, sexual health, or pregnancy. Clicking on a state takes users to a dashboard of charts with state-specific data on women’s health, including insurance and Medicaid coverage, poverty, mental health, HIV, cancer, pregnancy, abortions, and use of preventive services. Many indicators provide health care information for women of different racial and ethnic groups.
The profiles draw from multiple sources, including the latest data from the Centers for Disease Control and Prevention (CDC) and the U.S. Census Bureau. Each chart can be downloaded easily.
For detailed state tables on women’s health status, health care usage, and coverage, see the Foundation’s State Health Facts.
In his latest column for The Wall Street Journal‘s Think Tank, Drew Altman explains why prescription drug spending may be a larger share of health spending than most people think, depending on how you look at it.
The Ebola outbreak of 2014 was a global wake-up call regarding the ongoing threat of emerging infectious diseases. After a slow initial response by the global community, including the U.S. government, the U.S. mounted what has become the largest effort by a single donor government to respond to Ebola. This includes an emergency appropriation of $5.4 billion by Congress as part of its final FY 2015 spending package, a funding amount significantly larger than previous emergency response efforts to address emerging infectious disease outbreaks such as SARS and avian influenza.1,2 Since this funding was designated by Congress as an emergency funding measure, it did not count toward existing budget caps on discretionary spending.
Today, a year later, as Ebola case numbers have dropped and countries have been declared Ebola-free, the emergency response has been winding down and a transition period toward more sustained support for health systems in the region and other vulnerable areas has begun. Given the large U.S. investments for Ebola, including approximately $2.0 billion that has been obligated by the U.S. for the international response effort, now is an opportune time to examine where the U.S. response stands.3,4 What specifically was funding provided for and what is its current status? How is U.S. funding being used to address the outbreak and its aftermath, and prepare for future health threats? How available and transparent is information about these activities? This issue brief seeks to shed light on some of these issues, focusing on the $5.4 billion emergency Ebola funding and providing an overview of its international activities, the agencies carrying out these activities, and the status of funding to date.
Introduction
The West African Ebola outbreak in 2014 caught most of the world by surprise. Although the first cases were identified as far back as March 2014,5,6 the initial response to these early cases was slow and inadequate, and over the summer and fall of 2014 case numbers rose dramatically in the three most affected countries of Guinea, Liberia, and Sierra Leone. By the summer of 2014 the region was experiencing devastating rates of transmission, as high as a thousand new cases every week.7,8 Since that time, transmission of the disease has been almost entirely interrupted. Overall, there have been over 28,000 cases and 11,000 deaths in this outbreak, making it by far the deadliest Ebola outbreak ever.9
As case numbers began to rise in West Africa last year, the United States response was initially delayed and slow to ramp up, but by August 2014 the U.S. government had begun to mount what has become the largest effort by a single donor government to respond to Ebola, a response that has included marshalling financial resources, personnel, and technical expertise. Notably, this included an emergency funding request by the Obama Administration in November 2014 for $6.2 billion.10 Eventually Congress appropriated $5.4 billion in emergency Ebola funding in December 2014, most of which was to be directed to international activities.11 This was significantly larger than previous emergency response funding provided by Congress to address an emerging disease outbreak such as SARS and avian influenza.12
As Ebola case numbers have dropped and countries have been declared Ebola-free, the emergency response is now transitioning toward more sustained support for health systems in the region, including a planned five-year effort through the Global Health Security Agenda to bolster the capacity of countries across sub-Saharan Africa and elsewhere to prevent, detect, and respond to future outbreaks and other emerging health threats.13
Given the large U.S. investments for Ebola in the region, this brief reviews where the U.S. response stands. What specifically was funding provided for and what is its current status? How is U.S. funding being used to address the outbreak and its aftermath, and prepare for future health threats? How available and transparent is information about these activities? This issue brief seeks to shed light on some of these issues, focusing on the $5.4 billion emergency Ebola funding and providing an overview of its international activities, the agencies carrying out these activities, and the status of funding to date.
Background
U.S. efforts to respond to emerging and infectious diseases (EIDs), such as Ebola, are conducted through multiple departments and agencies that oversee both ongoing and emergency programs in both domestic and international settings. Ongoing programs receive funding each year from Congress through the annual appropriations process and primarily support efforts to detect and prevent outbreaks, although, this funding may also be used for emergency response efforts should an outbreak occur. Separately, Congress also provides annual funding for emergency and disaster assistance efforts that can be utilized to respond to emergencies, including health emergencies, such as the Ebola outbreak in West Africa. In addition to these ongoing programs and the support for emergency situations, the USG provides funding for EID-related research activities through the National Institutes of Health (NIH).14
During the Ebola outbreak in West Africa, U.S. government activities to combat the growing epidemic were initially funded using regular appropriations already available at the civilian agencies, particularly the U.S. Agency for International Development (USAID) and the Centers for Disease Control and Prevention (CDC), for ongoing EID programs and emergency and disaster response efforts. The U.S. military was also involved in the response, and the Department of Defense (DoD) initially funded its Ebola response activities through existing appropriations, but eventually sought and received permission from Congress to transfer funding from its Overseas Contingency Operations (OCO) account to support its West Africa operations as its engagement grew in scope.15
It is estimated that initial response funding from U.S. agencies totaled more than $770 million prior to passage of the emergency Ebola appropriation, most of which was provided by USAID.16 As the outbreak worsened and it became apparent that a larger response was necessary to both control further spread and recover from its impacts, the President sent an emergency funding request to Congress.17
Emergency Ebola Funding
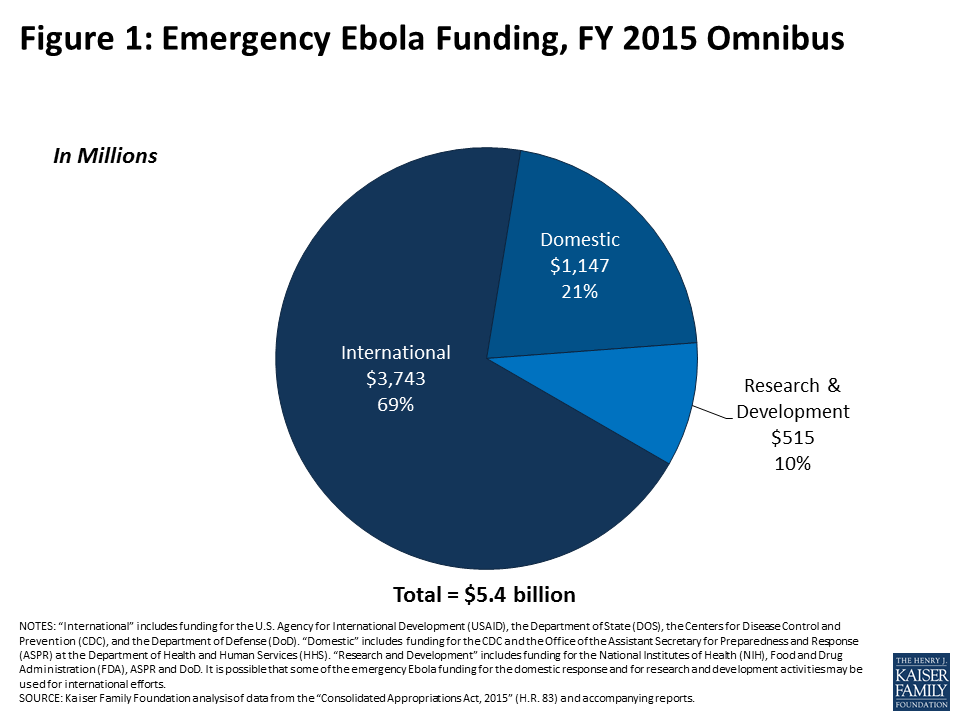
On November 5, 2014, President Obama sent an emergency funding request to Congress for $6.2 billion to support the Ebola response and recovery effort.18 When Congress finalized appropriations for FY 2015 in December 2014, it included $5.4 billion, almost the entire amount, in emergency Ebola funding (see Table 1).19,20,21 Of the $5.4 billion Congress provided, approximately $3.7 billion, or more than two thirds (69%), was designated for international efforts, $1.1 billion (21%) for the domestic response, and $515 million (10%) for research and development activities (see Figure 1). The research and development funding could be used in either domestic or international settings. Additionally, it is possible that some of the domestic funding could be used for international efforts.
Table 1: Emergency Ebola Funding – FY15 Omnibus (millions)
Agency / Department / Account
Total Funding
Expenditure Period
International Response
Department of State
$41.7
–
Diplomatic & Consular Programs
$36.4
“to remain available until September 30, 2016”
International Security Assistance
$5.3
“to remain available until September 30, 2016”
USAID
$2,484.7
–
Operating Expenses
$19.0
“to remain available until September 30, 2016”
Office of Inspector General
$5.6
“to remain available until expended”
Global Health Programs (GHP) account
$312.0
“to remain available until expended”
International Disaster Assistance (IDA) account
$1,436.3
“to remain available until expended”
Economic Support Fund (ESF) account
$711.7
“to remain available until September 30, 2016”
Centers for Disease Control & Prevention (CDC)
$1,200.0
“to remain available until September 30, 2019”
Department of Defense (DoD)
$17.0
–
Equipment Procurement
$17.0
“to remain available until September 30, 2017”
Total International Response
$3,743.4
–
Research and Development
Health and Human Services (HHS)
$420.0
–
National Institutes of Health (NIH)
$238.0
“to remain available until September 30, 2016”
Biomedical Advanced Research and Development (BARDA)
$157.0
“to remain available until September 30, 2019”
Food & Drug Administration (FDA)
$25.0
“to remain available until expended”
Department of Defense (DoD)
$95.0
–
Defense Advanced Research Projects Agency (DARPA)
$45.0
“to remain available until September 30, 2016”
Chemical and Biological Defense Program (CBDP)
$50.0
“to remain available until September 30, 2016”
Total Research and Development
$515.0
–
Domestic Response
Health and Human Services (HHS)
$1,147.0
–
Centers for Disease Control & Prevention (CDC)
$571.0
“to remain available until September 30, 2019”
Assistant Secretary for Preparedness and Response (ASPR)
$576.0
“to remain available until September 30, 2019”
Total Domestic Response
$1,147.0
–
Total Ebola Funding
$5,405.4
–
NOTES: The emergency funding for Ebola does not count towards overall budget caps. Research and development funding may be used for either domestic or international efforts. It is also possible that some of the $1.1 billion for the domestic response may be used for international efforts.SOURCE: Kaiser Family Foundation analysis of the “Consolidated and Further Appropriations Act, 2015” (P.L. 113-235) and associated explanatory statements.
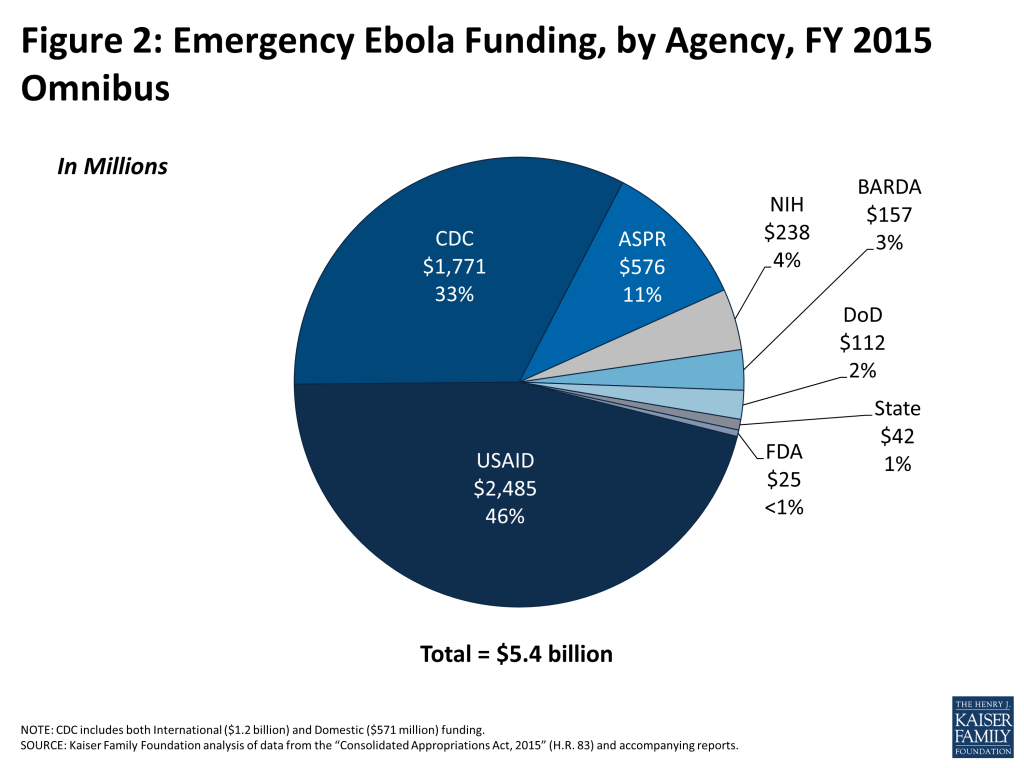
The majority of the $3.7 billion specified for the international response effort was provided to USAID ($2.5 billion), followed by the CDC ($1.2 billion, of which $597 million is designated to support national public health institutes and global health security), the State Department ($42 million), and DoD ($17 million).22 Of the $1.1 billion that was designated for domestic purposes, $576 million was provided to the Office of the Assistant Secretary for Preparedness and Response (ASPR) at the Department of Health and Human Services (HHS) and $571 million was provided to the CDC (it is possible that some of the domestic funding could be used for international purposes). Of the $515 million in research and development funding, which could be used in either domestic or international settings, the National Institutes of Health (NIH) ($238 million) accounted for the largest amount, followed by the Biomedical Advanced Research and Development (BARDA) program at HHS ($157 million), DoD ($95 million), and the Food and Drug Administration (FDA) ($25 million) (see Figure 2).
Figure 1: Emergency Ebola Funding, FY 2015 OmnibusFigure 2: Emergency Ebola Funding, by Agency, FY 2015 Omnibus
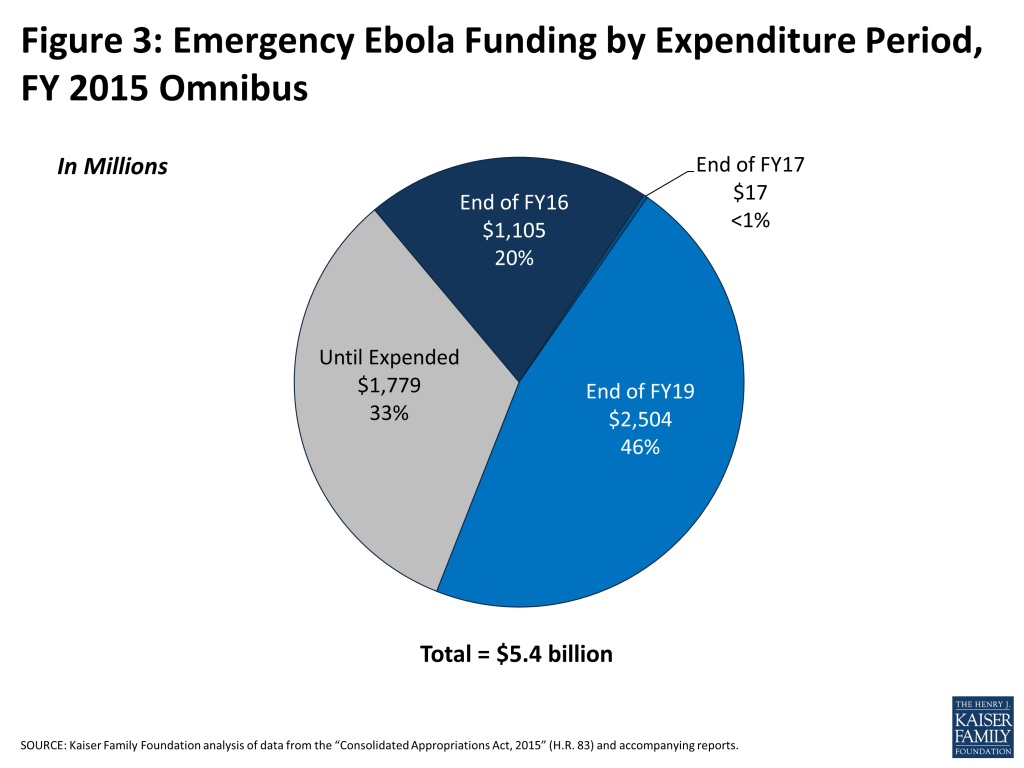
In the appropriations bill, Congress stipulated that the emergency Ebola funding could be used to reimburse previous expenditures/accounts. According to USAID, all of the funding they had already spent to respond to Ebola in 2014 was “back-filled” by the emergency Ebola appropriation; it is not yet known whether other departments and agencies involved in the response also used the emergency appropriation to reimburse prior activities. In addition, the bill specified that funding could be disbursed over a multi-year period, although the periods vary by agency and account. For instance, Congress specified that the funding provided to the CDC ($1.8 billion, of which $1.2 billion is for international efforts) would remain available through FY19, while the majority of the $2.5 billion provided to USAID would “remain available until expended” (see Figure 3). Overall, $1.1 billion (20%) was provided as two-year funding, $17 million (less than 1%) as three-year funding, $2.5 billion (46%) as five-year funding, and $1.8 billion (33%) until expended. Congress also included specific reporting requirements on how the emergency funding was being utilized. For instance, USAID is required to report monthly, while HHS is required to report quarterly. These reports, however, are not publicly available at this time.
Figure 3: Emergency Ebola Funding by Expenditure Period, FY 2015 Omnibus
International Activities Supported by the Emergency Ebola Funding
The overarching goals for the emergency funding, as described in the President’s request to Congress, were to “fortify domestic public health systems, contain and mitigate the epidemic in West Africa, speed the procurement and testing of vaccines and therapeutics, and…enhancing capacity for vulnerable countries to prevent disease outbreaks, detect them early, and swiftly respond before they become epidemics that threaten our national security.”23 When it approved the emergency Ebola appropriation, Congress provided direction to each agency receiving funding as to the kinds of activities to be supported with this funding as follows (see Table 2):
USAID was named the lead agency for the Ebola response, and Congress directed emergency funding to the agency to support a variety of activities including immediate disaster assistance and humanitarian response needs in the highly affected countries. Such activities ranged from the establishment of Ebola treatment units and community care facilities; provision of supplies such as personal protective equipment; community outreach, communication and mobilization efforts; and logistics support. USAID was also directed to use the funding to address the secondary economic and social impacts of the outbreak, from food insecurity to economic stabilization and security.
The Department of State was provided funding to assist countries to “prevent, prepare for, and respond” to Ebola, and to “promote biosecurity practices” and “mitigate the risk of illicit acquisition of the Ebola virus.”
CDC was named the medical lead for the international response, and directed by Congress to use the funding to help countries prevent, prepare for, and respond to the Ebola outbreak through activities such as infection control, contact tracing and laboratory surveillance and training; building up emergency operation centers; and providing education and outreach. CDC has also been involved in the conduct of clinical trials in affected countries to assess the safety and efficacy of vaccine and treatment candidates.
Likewise, Congress identified some funding to go to agencies for the purpose of research and development of vaccines, treatments, and other medical technologies for addressing Ebola.
NIH received funding to help advance clinical trials on the safety and efficacy of Ebola vaccines and therapeutics.
BARDA was directed to use its funding to develop medical countermeasures such as vaccines, therapeutics, diagnostics, and medical supplies.
The Department of Defense was provided emergency funding for clinical trials for vaccines and treatments, and for Ebola diagnostic development.24
The FDA was provided funding to help develop these countermeasures and provide oversight during review of the products and the post-market surveillance of these products.
Many of these activities remain in progress and in some cases have not yet even begun, as some agencies have multiple-year time frames to utilize the funds. As mentioned above, while Congress required reports from agencies detailing progress on these activities and the funds that have been expended to date, these reports have not yet been made public. Therefore, a clear and comprehensive accounting of what has been spent, and for which activities, is not yet available. This includes a lack of information about which activities supported the initial response and which are supporting ongoing transition and recovery efforts as well as more general health system strengthening.
Table 2: Activities Supported by the Emergency Ebola Funding
Agency / Department / Account
Total Funding
International Response
Department of State
–
Diplomatic & Consular Programs
To prevent, prepare for, and respond to the Ebola outbreak
International Security Assistance
Mitigate the risk of illicit acquisition of the Ebola virus and to promote biosecurity practices associated with Ebola
USAID
–
Operating Expenses
To prevent, prepare for, and respond to the Ebola outbreak
Office of Inspector General
Oversight of Ebola activities
Global Health Programs (GHP) account
To prevent, prepare for, and respond to the Ebola outbreak in countries directly affected by, or at risk of being effected by, Ebola
International Disaster Assistance (IDA) account
Assistance for countries affected by, or at risk of being affected by, Ebola
Economic Support Fund (ESF) account
To prevent, prepare for, and respond to the Ebola outbreak and to address economic and stabilization requirements resulting from an outbreak
Centers for Disease Control & Prevention (CDC)
To prevent, prepare for, and respond to the Ebola outbreak internationally
Department of Defense (DoD)
–
Equipment Procurement
Equipment for detection and diagnostic systems, mortuary supplies, and isolation transport units
Research and Development
Health and Human Services (HHS)
–
National Institutes of Health (NIH)
To prevent, prepare for, and respond to Ebola domestically and internationally
Biomedical Advanced Research and Development (BARDA)
To prevent, prepare for, and respond to Ebola domestically and internationally, and to develop necessary medical countermeasures and vaccines including the development and purchase of vaccines, therapeutics, diagnostics, and necessary medical supplies and administrative activities
Food & Drug Administration (FDA)
For an additional amount for “Salaries and Expenses”, to prevent, prepare for, and respond to the Ebola virus domestically and internationally, and to develop necessary medical countermeasures and vaccines, including the review, regulations, post market surveillance of vaccines and therapies, and administrative activities
Department of Defense (DoD)
–
Defense Advanced Research Projects Agency (DARPA)
Clinical trials for vaccines and treatments for Ebola
Chemical and Biological Defense Program (CBDP)
Develop vaccines, treatments, and diagnostic systems for Ebola
Domestic Response
Health and Human Services (HHS)
–
Centers for Disease Control & Prevention (CDC)
To prevent, prepare for, and respond to the Ebola outbreak domestically
Assistant Secretary for Preparedness and Response (ASPR)
For the renovation and alteration of privately owned facilities to improve preparedness and response capabilities and to reimburse domestic transportation and treatment costs for individuals treated in the US.
SOURCE: Kaiser Family Foundation analysis of the “Consolidated and Further Appropriations Act, 2015” (P.L. 113-235) and associated explanatory statements.
Status of Ebola Funding
Data on the status of the emergency Ebola funding are limited. Some data are available from USAID, which has released regularly updated factsheets providing information on the international response effort and funding amounts obligated by USAID, CDC, and DoD, and from the Office of Inspector General (OIG) at USAID, which has released Congressionally mandated quarterly reports on the U.S. government’s international Ebola response and preparedness efforts. To date, the Department of State (DOS), USAID, CDC, and DoD report that they had obligated approximately $2.0 billion in total international funding towards the Ebola outbreak (see Table 3).25,26 USAID accounted for the largest amount ($1.2 billion), followed by the DoD ($474 million), CDC ($364 million), and the DOS ($32 million). An additional $523 million ($365 million through HHS and $158 million through DoD) has been obligated for research and development activities, but this funding could not be disaggregated by international or domestic purposes. In addition, the status of domestic funding is not currently known.
Table 3: Total U.S. Ebola Funding for the International Response (FY 2014 – FY 2016)27,28
Agency
Total Funding(in millions)
International Response
Department of State (DOS)
$32.1
Diplomatic & Consular Programs
$22.1
International Security Assistance
$5.0
Economic Support Fund (ESF)
$5.0
U.S. Agency for International Development (USAID)
$1,158.8
Operating Expenses
$3.0
Office of the Inspector General (OIG)
$1.9
Global Health Programs (GHP)
$159.2
International Disaster Assistance (IDA)
$869.8
Economic Support Fund (ESF)
$124.8
Centers for Disease Control and Prevention (CDC)
$364.5
Department of Defense (DoD)
$473.8
Equipment Procurement
$14.3
Overseas, Humanitarian, Disaster Assistance, & Civic Aid
$406.4
Cooperative Threat Reduction
$53.0
Operations & Maintenance
<$0.1
Total
$2,029.2
NOTES: Includes funding provided prior to and since passage of the emergency Ebola appropriation. The CDC total includes approximately $50 million in funding provided during the FY 2015 Continuing Resolution (CR) period; this funding could not be disaggregated by international and domestic purposes. Funding for Research & Development (R&D) activities, which totaled $533 million ($364.6 million at HHS and $158 million at DoD) as of September 30, 2015, is not included as this funding could not be disaggregated by international and domestic purposes.SOURCES: Funding obligations as detailed in USAID OIG “Lead Inspector General Quarterly Progress Report on U.S. Government Activities: International Ebola Response and Preparedness, September 30, 2015” and USAID “West Africa – Ebola Outbreak, Fact Sheet #5, Fiscal Year (FY) 2016” released on December 4, 2015.
Of the $1.2 billion that USAID has obligated to the response effort, the majority is provided through the International Disaster Assistance (IDA) account ($870 million), followed by the Global Health Programs (GHP) account ($159 million), and the Economic Support Fund (ESF) account ($125 million). According to USAID, the agency’s emergency funding reimbursed all expenditures incurred prior to passage of the emergency Ebola appropriation.29 As such, the entire funding amount that has been obligated to date by USAID would therefore be attributed to the emergency funding provided by Congress, which would leave approximately $1.3 billion in funding that remains to be obligated.
It is not known whether or not the CDC and DoD emergency Ebola funding was used to reimburse prior activities as was done at USAID. As such, the status of CDC’s $1.2 billion in international funding and DoD’s $112 million in the emergency Ebola funding is not yet known. However, if the CDC’s emergency Ebola funding was used to replace prior obligations, as was done with USAID, then $836 million of the $1.2 billion emergency appropriation would remain for international efforts. DoD has obligated more than $600 million towards its Ebola activities ($474 for the international response and $158 million for research and development activities) using a combination of existing funding, which includes prior appropriations supporting the Overseas Contingency Operations account (OCO), and the $112 million in emergency Ebola funding, of which $17 million was for the international effort and $95 million was for research and development activities.30 It is not known how much of the DoD’s $112 million in emergency Ebola funding has been obligated to date.
Conclusion and Looking Ahead
The Ebola outbreak of 2014 was a global wake-up call regarding the ongoing threat of emerging infectious diseases. After a slow initial response, the U.S. mounted what has become the largest effort by a single donor government to respond to Ebola, including $5.4 billion in emergency funding, the greatest amount of emergency funding ever provided by Congress for an international health emergency. Most of this funding (more than two thirds, or $3.7 billion) was directed toward international activities, both for the initial response as well as ongoing recovery and rebuilding efforts, and is channeled through multiple agencies including USAID, State, CDC and DoD. Agencies report that approximately $2.0 billion has been obligated so far, indicating a significant amount of the emergency Ebola funding remains for ongoing and future activities. Congress made most funding available to agencies for at least a five-year period or available until expended, in recognition of the longer term nature of the challenges ahead and the need to transition to broader support for health systems and public health capacities in the affected countries and beyond.
While we have some general information about how the U.S. has spent and plans to spend the Emergency Ebola funding, many questions remain. At the current time, only limited information is publicly available as to the specific activities funded through the emergency funding. With the exception of USAID, information on the approximately $2.0 billion that has been obligated on the Ebola response thus far is not currently available. Data are also not available to indicate what share of this funding is part of the emergency Ebola appropriation and what is from other funding lines. It is also unclear how much will be directed to longer-term rebuilding and health systems strengthening activities, and exactly what form those activities take. Given that the Ebola response represents a historically large expenditure and is a key humanitarian and health security priority for the U.S. government, understanding how the funds were used and their impact is critical to inform how to respond in future global crises and help to build efforts to address future outbreaks of infectious disease.
Endnotes
U.S. Congress. Public Law No: 113-235; December 16, 2014. ↩︎
The President’s Emergency Plan for AIDS Relief (PEPFAR), the US government’s program to address HIV/AIDS internationally has received larger annual appropriations, but these have been made as part of the regular appropriations process, not emergency funding. ↩︎
USAID. West Africa – Ebola Outbreak: Fact Sheet #5, Fiscal Year (FY) 2016; December 4, 2015 (see https://www.usaid.gov/ebola/fy16/fs05). This fact sheet includes funding provided prior to and since passage of the emergency Ebola appropriation. The CDC total includes approximately $50 million in funding provided during the FY 2015 Continuing Resolution (CR) period; this funding could not be disaggregated by international and domestic purposes. USAID funding is as of December 4, 2015, CDC funding is as of November 29, 2015, and DoD funding is as of August 31, 2015. ↩︎
USAID Office of Inspector General. Lead Inspector General Quarterly Progress Report on U.S. Government Activities: International Ebola Response and Preparedness; September 30, 2015. ↩︎
Humanitarian Policy Group. The Ebola response in West Africa; October 2015. ↩︎
CDC. 2014 Ebola Outbreak in West Africa – Reported Cases Graphs; November 12, 2015. ↩︎
CDC. 2014 Ebola Outbreak in West Africa – Reported Cases Graphs; November 12, 2015. ↩︎
BBC News. Ebola: Are cases levelling off?; November 2, 2014. ↩︎
CDC. 2014 Ebola Outbreak in West Africa – Reported Cases Graphs; November 12, 2015. ↩︎
U.S. Congress. Public Law No: 113-235; December 16, 2014. ↩︎
The President’s Emergency Plan for AIDS Relief (PEPFAR), the US government’s program to address HIV/AIDS internationally has received larger annual appropriations, but these have been made as part of the regular appropriations process, not emergency funding. ↩︎
Congressional Research Service (CRS). FY2015 Budget Requests to Counter Ebola and the Islamic State (IS), December 9, 2014. ↩︎
The FY 2015 Omnibus Appropriations bill was signed into law by the President on December 16, 2015. As of December 17, 2014, USAID, CDC, and DoD had committed more than $770 million to the response effort (see USAID, “West Africa – Ebola Outbreak – Fact Sheet #12”, https://www.usaid.gov/ebola/fy15/fs12). Since other agencies and departments were involved in the response effort at this time, it is likely that total USG funding was higher than $770 million. ↩︎
U.S. Congress. Public Law No: 113-235; December 16, 2014. ↩︎
Since this funding was designated by Congress as an emergency funding measure, it did not count toward existing budget caps on discretionary spending. ↩︎
Not included in the funding provided by Congress was approximately $1.5 billion that the President had requested to create a contingency fund for the response. ↩︎
The $3.7 billion includes all funding provided to USAID and the State Department, as well as the funding provided to CDC that was specifically designated by Congress for international efforts. Of the remaining $1.7 billion in emergency Ebola funding included in the FY15 Omnibus, it is possible that some of this funding may be used for international efforts. ↩︎
DoD activities for the Ebola response in West Africa have also been supported through funds transferred from its FY2014 Overseas Contingency Operations budget, as requested by the Department and approved by Congress in November 2014. Congress allowed DoD to transfer up to $750m of the OCO funds for Ebola response activities including: transport of DOD and non-DOD personnel and supplies, equipment and medical supplies, construction of Ebola treatment units and training and education in support of sanitation and mortuary affairs functions to limit the spread of the Ebola outbreak. ↩︎
USAID. West Africa – Ebola Outbreak: Fact Sheet #5, Fiscal Year (FY) 2016; December 4, 2015 (see https://www.usaid.gov/ebola/fy16/fs05). This fact sheet includes funding provided prior to and since passage of the emergency Ebola appropriation. The CDC total includes approximately $50 million in funding provided during the FY 2015 Continuing Resolution (CR) period; this funding could not be disaggregated by international and domestic purposes. USAID funding is as of December 4, 2015, CDC funding is as of November 29, 2015, and DoD funding is as of August 31, 2015. ↩︎
USAID Office of Inspector General. Lead Inspector General Quarterly Progress Report on U.S. Government Activities: International Ebola Response and Preparedness; September 30, 2015. ↩︎
USAID. West Africa – Ebola Outbreak: Fact Sheet #5, Fiscal Year (FY) 2016; December 4, 2015 (see https://www.usaid.gov/ebola/fy16/fs05). This fact sheet includes funding provided prior to and since passage of the emergency Ebola appropriation. The CDC total includes approximately $50 million in funding provided during the FY 2015 Continuing Resolution (CR) period; this funding could not be disaggregated by international and domestic purposes. USAID funding is as of December 4, 2015, CDC funding is as of November 29, 2015, and DoD funding is as of August 31, 2015. ↩︎
USAID Office of Inspector General. Lead Inspector General Quarterly Progress Report on U.S. Government Activities: International Ebola Response and Preparedness; September 30, 2015. ↩︎
Kentucky has received national attention as the only Southern state to fully embrace the Affordable Care Act (ACA) by creating its own state-based health insurance marketplace and by choosing to expand Medicaid to cover more low-income adults. Roughly 425,000 state residents have gained Medicaid coverage since the expansion, and among all states, Kentucky had the second-highest drop in its uninsured rate. On November 3, Republican Matt Bevin was elected as the state’s next governor after promising during his campaign to roll back the Medicaid expansion, end the state marketplace (known as Kynect), and switch Kentucky to the federal marketplace. In light of this, the Kaiser Family Foundation conducted a survey of Kentucky residents to gauge their views on health care policy in the state, including their preferences for the future of the Medicaid expansion and Kynect. This is the Foundation’s second poll of Kentucky residents, following a survey of four Southern states – including Kentucky – conducted in partnership with The New York Times in April 2014.
The poll finds that Kentuckians are divided, leaning negative in their views of the ACA in general (41 percent favorable, 49 percent unfavorable), but they feel more positively about the two biggest ways the law has played out in their state. Over six in ten (63 percent) have a favorable view of the Medicaid expansion, and more have a favorable than an unfavorable view of Kynect (42 percent versus 28 percent, with 29 percent saying they don’t know enough to say). Asked about next steps, more than seven in ten residents (72 percent) say they would prefer to keep the state’s Medicaid program as it is today rather than change it to cover fewer people. One in five (20 percent) would prefer to scale back the program so that fewer people are covered. When it comes to the health insurance marketplace, about half (52 percent) want the new governor to keep Kynect, while roughly a quarter (26 percent) would prefer to switch to the federal marketplace and 18 percent aren’t sure. As in the nation as a whole, Kentuckians’ views on the ACA and its provisions divide sharply along party lines. However, when it comes to Medicaid, even 54 percent of Republicans and 43 percent of those who say they voted for Governor Bevin would prefer to keep Medicaid as it is today rather than scale it back to cover fewer people.
Underlying these preferences is a belief among most residents that Medicaid is important and working well. Personal connections may also play a role, as a majority of residents say they know someone who has gotten coverage either through Kynect or from Medicaid. Still, despite this support for keeping Kynect and the Medicaid expansion in place, residents are somewhat divided as to the impacts these changes have had on the state so far. Six in ten (61 percent) recognize that the number of uninsured in the state has declined, but residents are more divided on whether Kynect and the Medicaid expansion have made it easier or harder for Kentucky residents to get, keep, and afford insurance, and most don’t feel there has been an impact on them personally. While campaigning, Governor Bevin made the argument that Kentucky can’t afford the recent health care expansion, and this argument resonates with many residents. Nearly four in ten (37 percent) say the impact of Kynect and the Medicaid expansion on the state budget has been negative, compared with 18 percent who say it’s been positive (the remainder either say there hasn’t been much impact or they aren’t sure). However there is much confusion over who pays for the Medicaid expansion; only 16 percent of residents know that the federal government pays for most of the cost of the expansion, while about a quarter (24 percent) think the state picks up the majority of the tab and four in ten (39 percent) think the costs are shared equally.
Key Findings
Health Care as a Priority for State Residents
Discussions of health care were prominent in the campaign for Kentucky governor, and that focus is reflected in the list of issues residents want state lawmakers to address going forward. About a quarter (24 percent) of residents name a health care-related issue as one of the top two issues they would like state policymakers to focus on in 2016, ranking above other issues such as jobs (14 percent), education (11 percent), and crime (7 percent).
Health care tops the priority list for Kentucky residents across parties, but is mentioned by a somewhat higher share of Democrats (30 percent) compared with Republicans (21 percent), along with 23 percent of independents. Among those who say they voted in the gubernatorial election, health care is named as a top priority by 42 percent of those who report voting for Attorney General Jack Conway, the Democratic candidate, and a smaller share (28 percent) of those who say they voted for Governor Bevin.
Figure 1: Health Care Tops Public’s Priorities for Kentucky State Lawmakers
The 24 percent of state residents who name health care as a top priority express a variety of specific concerns when asked to expand in their own words on what they want lawmakers to focus on. Almost three in ten (28 percent) of this group mention health care costs and affordability, and a similar share (26 percent) mention maintaining the ACA coverage expansions in Kentucky. Fifteen percent of those who name health care as a priority give the opposite response, saying they want lawmakers to eliminate or scale back the coverage expansions.
Figure 2: Affordability and Maintaining Coverage Expansions Are Top Concerns for Those Who Name Health Care as a Top Priority
General Views on the ACA, Kynect, and Medicaid Expansion
When it comes to the ACA, the views of Kentucky residents lean negative on the law as a whole, but are more positive towards the programs the law has created in the state. About half (49 percent) say they have an unfavorable view of the health care law while about four in ten (41 percent) have a favorable view. When told that Kentucky expanded its Medicaid program under the health care law and asked their view of that expansion, more than six in ten (63 percent) say they have a favorable view and about a quarter (24 percent) are unfavorable. Residents are also more likely to have a favorable rather than an unfavorable view of the state health insurance marketplace, Kynect (42 percent versus 28 percent), though about three in ten (29 percent) say they don’t know enough to say. Among those who say they know “a lot” or “some” about the state marketplace, 58 percent have a favorable view and 34 percent are unfavorable.
Figure 3: Kentuckians’ Views Tilt Unfavorable on ACA, but More Are Favorable than Unfavorable on Medicaid Expansion and Kynect
Views on the Future of Medicaid Expansion in Kentucky
When asked about next steps for the Medicaid expansion in the state, over seven in ten Kentuckians (72 percent) say they think Governor Bevin should keep Medicaid as it is today rather than changing the program to cover fewer people. One in five (20 percent) would prefer to scale back Medicaid so that fewer people are covered. Large majorities of both Democrats (89 percent) and independents (75 percent) favor keeping Medicaid as is over changes that would reduce the number of people covered, as do a slim majority (54 percent) of Republicans. The contrast is sharper among those who report voting in the recent gubernatorial election; 92 percent of those who report voting for Attorney General Jack Conway want to keep Medicaid as is, while those who say they voted for Governor Bevin are more divided (50 percent want to scale back Medicaid to cover fewer people and 43 percent want to keep it as it is today).
Figure 4: Seven in Ten Kentuckians Want to Keep Medicaid as It Is Today; One in Five Prefer to Scale It Back to Cover Fewer People
When those who say they prefer keeping Medicaid as it is today are read arguments about the cost of the expansion, some change their mind, but a majority continues to support keeping the program as is rather than scaling it back to cover fewer people. For example, after being told that Governor Bevin has said the current Medicaid program is unsustainable and unaffordable, 59 percent say they still want Medicaid kept as it is today, while 8 percent switch their position, for a total of 28 percent who want to scale back the program so fewer people are covered. When read the argument that “keeping Medicaid as it is today will require Kentucky to spend more money on Medicaid in the future, even though the federal government would be picking up most of the cost,” 61 percent continue to support keeping Medicaid as it is today, while 6 percent switch their position, for a total of 26 percent who support scaling back the program to cover fewer people after hearing this argument.
Figure 5: After Hearing Arguments Against Expansion, Majorities Continue to Prefer Keeping Medicaid as Is
On the other side, few of those who want to scale back Medicaid to cover fewer people change their minds when read arguments in favor of keeping the program as it is today. Support for keeping Medicaid as is inches up from 72 percent to 75 percent when initial opponents are told that scaling back Medicaid to cover fewer people would mean “Kentucky would be giving up additional federal dollars for covering uninsured residents,” and also up to 75 percent with the argument that “some people would lose the coverage they have now, and many low-income people would be left without insurance.”
Figure 6: Few Change Opinion After Hearing Arguments Against Scaling Back Medicaid to Cover Fewer People
Views of the Future of Kynect
In terms of next steps for the state health insurance marketplace, just over half (52 percent) of state residents want the new governor to keep Kynect, about one quarter (26 percent) want him to switch to the federal marketplace healthcare.gov, and almost one in five (19 percent) say they don’t know enough to say. Among those who say they know “a lot” or “some” about Kynect, support for keeping the state-based marketplace is somewhat higher (59 percent). A majority of Democrats (70 percent) and about half of independents (52 percent) prefer to keep Kynect, while Republicans are more evenly divided (38 percent want Kentucky to switch to the federal marketplace and 35 percent prefer to keep Kynect). Among those who report voting for Governor Bevin, more than twice as many want to switch to the federal marketplace as want to keep the state-run marketplace (53 percent versus 24 percent).
Figure 7: Half of Kentuckians Prefer to Keep Kynect; One Quarter Want to Switch to Federal Marketplace
Arguments for and against keeping the state-based marketplace have the potential to move the needle on residents’ views. When those who support keeping Kynect are told that Governor Bevin has said Kentucky could save money by switching to the federal marketplace, some people change their position so that support for keeping Kynect drops below a majority, to 39 percent, while the share wanting to switch to the federal marketplace increases to 33 percent.
Figure 8: Support For Keeping Kynect Drops Below Majority After Hearing Argument for Switching to Federal Marketplace
On the other side, when those who support switching to the federal marketplace are read the argument that “dismantling the state health insurance marketplace would cost Kentucky 23 million dollars and waste the financial investment that has already been made,” support for keeping Kynect increases from 52 percent to 59 percent, while 15 percent continue to prefer switching to the federal marketplace.
Figure 9: After Hearing Argument Against Switching to Federal Marketplace, Six in Ten Prefer to Keep Kynect
Underlying Views and Personal Connections to Medicaid and Kynect
Underlying residents’ general support for keeping the Medicaid expansion and Kynect in place is a sense that Medicaid is important and that it’s working well. A majority of Kentuckians (56 percent) say that Medicaid is either “very important” or “somewhat important” for them and their family. Among those who feel Medicaid is important, eight in ten, or 46 percent of all adults in Kentucky, say a reason they feel the program is important is because they or someone they know has received health care paid for by Medicaid.
Figure 10: Most Kentuckians Say Medicaid Is Important for Their Families.
Two-thirds (67 percent) of state residents also feel the Medicaid program is working well for most low-income people in Kentucky, a share that rises to 84 percent among those under age 65 who report that they are personally covered by Medicaid.
Figure 11: Two-Thirds Kentucky Residents Say Medicaid Is Working Well; Those Covered by Medicaid Are Even More Positive
Most Kentucky residents also report some level of personal connection to Medicaid and/or Kynect. More than half (56 percent) say they know someone who got health insurance through Kynect, including 11 percent who say they personally got coverage through the marketplace. In total, 65 percent say they know an adult with Medicaid coverage, either from Kynect or otherwise. Overall, 15 percent of adults in the state report that Medicaid is their own main source of health insurance coverage, including 17 percent of those under age 65.
Figure 12: Most Kentuckians Say They Know Someone Who Got Insurance Through Kynect or Medicaid
Views on the Effects of Kynect and Medicaid Expansion in Kentucky
Despite their general support for keeping the Medicaid expansion and Kynect intact, Kentucky residents are somewhat divided as to the impacts these changes have had for people in the state. Reflecting the fact that Kentucky has seen a large decline in the uninsured rate, about six in ten residents (61 percent) believe that Kynect and the expansion of Medicaid have reduced the number of uninsured in Kentucky. This share is up slightly from 52 percent who thought that the health care law had reduced the number of uninsured in a Kaiser Family Foundation/New York Times poll of Kentucky residents in April 2014. However, some residents hold the opposite view, with about almost four in ten (37 percent) believing that Kynect and the Medicaid expansion have caused many people in Kentucky to lose their health insurance.
Figure 13: Six in Ten Kentucky Residents Say Recent Changes to Health Insurance Have Reduced Number of Uninsured
Kentuckians’ views are also somewhat divided when it comes to how Kynect and Medicaid expansion have affected health insurance affordability and access. More than a third (36 percent) say the programs have made insurance more affordable for people in Kentucky, about the same share (32 percent) say they’ve made it less affordable and one in five (21 percent) say there hasn’t been much difference. Views are also divided, but tilting more positive, on access to insurance. About four in ten (41 percent) say Kynect and the Medicaid expansion have made it easier for people in the state to get and keep health insurance, while somewhat fewer (29 percent) say they’ve made it harder and 19 percent don’t see much difference.
Figure 14: Kentuckians Have Mixed Views on Impact of Kynect and Medicaid Expansion on Insurance Affordability and Access
Most residents say Kynect and the Medicaid expansion haven’t had much impact on their own ability to get and keep insurance (59 percent), and about half say they haven’t personally felt an impact in insurance affordability (49 percent). While at least four in ten across income categories say they haven’t seen a personal change in these areas, those with incomes below $20,000 a year are more likely to say recent changes in the state have made insurance more affordable and easier for them to access, while those with higher incomes are more likely to feel their own situations have been negatively affected in these areas.
Figure 15: Most Kentuckians Say Kynect and Medicaid Expansion Have Not Had Much Impact on Their Own Affordability and Access
One area where residents are more likely to see a negative rather than a positive impact of Kynect and the Medicaid expansion is on the state budget. About twice as many say the programs’ impact on the state budget has been negative (37 percent) as say it has been positive (18 percent), while one quarter (25 percent) say there hasn’t been much impact, and a fifth (20 percent) say they’re not sure. The share believing the impact on the state budget has been negative rises to 57 percent among Republicans, and to 66 percent among those who report voting for Governor Bevin.
Figure 16: Almost Four in Ten Say Kynect and Medicaid Expansion Have Had a Negative Impact on State Budget
Awareness Gaps
While health care is a salient issue for many adults in Kentucky, not all are familiar with some of the basic facts about Kynect and Medicaid. One area where there is a large amount of confusion is the issue of who pays for the cost of expanding Medicaid under the health care law. When asked about the source of funding, only 16 percent of state residents correctly answer that the federal government pays for nearly all the costs of expanding Medicaid to cover more low-income adults, while about a quarter (24 percent) think the state government picks up most of the tab and 39 percent think the federal and state governments share costs equally.
Figure 17: Few Kentuckians Aware that Federal Government Pays Most of the Cost of Medicaid Expansion
Awareness gaps exist in other areas as well. About a third of residents say they know “a lot” (12 percent) or “some” (22 percent) about the state insurance marketplace, while about two-thirds say they know “only a little” (31 percent) or “nothing at all” (34 percent). Just over half (56 percent) are aware that Kynect was created as a result of the ACA, while 15 percent say the creation of the marketplace was unrelated to the health care law and 29 percent say they don’t know enough to say. Similarly, about half (51 percent) are aware that Kentucky expanded its Medicaid program under the ACA, while the other half either think the state did not expand Medicaid (15 percent) or say they don’t know (34 percent).
Figure 18: Awareness Gaps on Kynect and Medicaid Expansion in Kentucky
Methodology
Methodology
The Kaiser Family Foundation Survey of Kentucky Residents on State Health Policy was designed and analyzed by public opinion researchers at the Kaiser Family Foundation (KFF). The survey was conducted November 18 through December 1st, 2015 among a random digit dial telephone sample of 1,017 Kentucky residents ages 18 and over.
Computer-assisted telephone surveys conducted by landline (401) and cell phone (616, including 377 who had no landline telephone) were carried out in English by SSRS. KFF paid for all costs associated with the survey.
The sample of landline telephone exchanges called was randomly selected by a computer from a complete list of active residential exchanges in Kentucky. The exchanges were chosen so as to ensure that each region within Kentucky was represented in its proper proportion. Within each exchange, random digits were added to form a complete telephone number, thus permitting access to listed and unlisted numbers alike. Within each landline household, one adult was designated by a random procedure to be the respondent for the survey.
Cell phone numbers were generated by a similar random process. Both the landline and cell phone samples were generated through Marketing Systems Group’s GENESYS sampling system.
The combined landline and cell phone sample was weighted to match estimates for the adult population of Kentucky using data from the Census Bureau’s 2014 American Community Survey on sex, race, Hispanic origin, marital status, age, education, and respondent’s region of residence defined by county. The sample was also weighted to match current patterns of telephone use projected from the 2013 National Health Interview Survey state-level modeled estimates. The weight takes into account the fact that respondents with both a landline and cell phone have a higher probability of selection in the combined sample and also adjusts for the household size for the landline sample. All statistical tests of significance account for the effect of weighting.
The margin of sampling error including the design effect for the full sample is plus or minus 4 percentage points. Numbers of respondents and margins of sampling error for key subgroups are shown in the table below. For results based on other subgroups, the margin of sampling error may be higher. Sample sizes and margins of sampling error for other subgroups are available by request. Note that sampling error is only one of many potential sources of error in this or any other public opinion poll. Kaiser Family Foundation public opinion and survey research is a charter member of the Transparency Initiative of the American Association for Public Opinion Research.
Half of Kentucky Residents Hold Unfavorable Views of the Affordable Care Act, But Seven in Ten, Including Most Republicans, Don’t Want to Scale Back Medicaid Expansion to Cover Fewer People
Half of Residents Want to Keep the State’s Insurance Marketplace Kynect, While a Quarter Favor Switching to Federal Healthcare.Gov Marketplace Instead
Many Believe Coverage Expansions Have a Negative Impact on the State’s Budget
A Kaiser Family Foundation poll of Kentucky residents finds that after much discussion of the issue in the state, health care is the top issue residents want state lawmakers to address, and a strong majority opposes scaling back the state’s Medicaid expansion to cover fewer people as new Gov. Matt Bevin proposed during his winning campaign.
About seven in ten Kentuckians (72%) say they would prefer to keep the state’s Medicaid expansion as it is today rather than change it to cover fewer people. A much smaller share (20%) say they would prefer to scale back the expansion to cover fewer people.
Taken before Gov. Bevin’s inauguration on Tuesday, the poll finds Republicans in the state are more divided about the Medicaid expansion, but a majority (54%) favors keeping it over changes that would reduce the number of people with coverage. Among those who say they voted for Gov. Bevin on Nov. 3, somewhat fewer (43%) support the Medicaid program as it exists, while half (50%) say they want it scaled back to cover fewer people.
“Kentuckians don’t particularly like the Affordable Care Act, but they do like their state’s Medicaid expansion and marketplace, and most want to keep them,” Foundation CEO and President Drew Altman said. “The findings in a red state may show other governors considering expansion that it could be equally popular with their state’s residents, and illustrate to Republicans in Washington how difficult it may be to take away health coverage from people who have it.”
When read arguments in support of scaling back Medicaid expansion, relatively few residents change their minds, and a majority continues to oppose covering fewer people. For instance, after being told that the incoming governor has called the current Medicaid program “unsustainable” and “unaffordable,” 59 percent still say they want Medicaid kept as it is today, while 8 percent change their mind, bringing the share who want the program to cover fewer people up to 28 percent.
A narrow majority (52%) also say they want the governor-elect to keep Kynect, while a quarter of residents (26%) want him to switch to the federal marketplace. Majorities of Democrats (70%) and independents (52%) prefer to keep Kynect, while Republicans are more evenly divided (38% want to switch to the federal marketplace and 35% want to keep Kynect). Among those who report voting for Gov. Bevin, twice as many want to switch to the federal marketplace as want to keep the state-run marketplace (53% versus 24%).
Overall, about half of Kentuckians (49%) view the Affordable Care Act unfavorably, while fewer (41%) report a favorable view. Residents also are more likely to see the law’s coverage expansions as a net drain on the state’s finances, as Gov. Bevin has argued. Twice as many say the programs’ impact on the state budget has been negative (37%) as say it has been positive (18%). Majorities among Republicans (57%) and those who report voting for Gov. Bevin (66%) say the coverage expansions are having a negative impact on the state budgets.
During his inaugural speech Tuesday, Gov. Bevin said he plans to reshape Kentucky’s Medicaid expansion through a federal waiver similar to the one in Indiana. During his campaign, he suggested changes including limiting new enrollment, tightening up eligibility and requiring enrollees to pay more. He also said Tuesday that he would end the state-run health insurance marketplace, Kynect, requiring eligible residents instead to use the federal Healthcare.Gov marketplace to obtain subsidized private health insurance.
This is second time the Foundation has surveyed Kentucky residents, following a survey conducted in partnership with the New York Times in April 2014. The new survey finds Kentucky residents rank health care as the top issue for state policymakers to address, with about a quarter (24%) naming it as one of their top two issues in an open-ended question. Fewer name jobs (14%), education (11%), crime (7%) or any other issue facing the state. Among those who say they voted in the gubernatorial election, health care is named as a top priority a larger share of those who report voting for the Democratic nominee Jack Conway (42%) than of those who say they voted for Gov. Bevin (28%).
The poll also probes Kentucky residents’ awareness and knowledge about the coverage expansion in their state, which has seen a significant reduction in its uninsured rate. Most residents (61%) say that the Medicaid expansion and Kynect have reduced the number of uninsured residents in their state, though almost four in ten (37%) believe the programs have led to many Kentucky residents becoming uninsured.
Residents’ views are also somewhat divided when it comes to how Kynect and Medicaid expansion have affected health insurance affordability and access. Over a third (36%) say the programs have made insurance more affordable for people in Kentucky, but about the same share (32%) say they’ve made it less affordable. Views are also divided on access to insurance: 41 percent say Kynect and Medicaid expansion have made it easier for people in the state to get and keep health insurance, while somewhat fewer (29%) say they’ve made it harder.
The poll was designed and analyzed by public opinion researchers at the Kaiser Family Foundation and was conducted from Nov. 18 to Dec.1 among a representative random digit dial telephone sample of 1,017 Kentucky residents. Interviews were conducted by landline (401) and cell phone (616). The margin of sampling error is plus or minus 4 percentage points for the full sample. For results based on subgroups, the margin of sampling error may be higher.
3.5 Million Could Have a Zero-Dollar Premium Contribution or Pay Less for Health Insurance than Penalty Due to Premium Subsidies; 7.1 Million Would Pay More to Get Coverage
A new analysis from the Kaiser Family Foundation finds that among uninsured people who are eligible for an Affordable Care Act marketplace plan, the average penalty for remaining without coverage in 2016 would be $969 per household – 47 percent higher than the 2015 estimated average of $661.
People without insurance who qualify for premium subsidies in ACA marketplaces face an average penalty of $738 per household if they remain uninsured in 2016, while people not eligible for subsidies – who typically have higher incomes – face an estimated average penalty of $1,450.
The health law’s individual mandate requires most people to have health coverage or pay a tax penalty, with the penalty phased in between 2014 and 2016. The penalty for 2016 is calculated as the greater of two amounts: either a flat dollar amount equal to $695 per adult plus $347.50 per child, up to a maximum of $2,085 for the family; or 2.5 percent of family income in excess of the 2015 income tax filing thresholds. The penalty is capped at an amount equal to the national average premium for a bronze plan, which is the minimum coverage available under the law.
The new analysis finds a bronze plan would cost $0 in premiums or less money than the individual mandate penalty for about 3.5 million uninsured people eligible for ACA marketplace plans, due to premium subsidies. The subsidies are available to low- and middle-income households to defray the costs of premiums in ACA marketplaces. Within the marketplaces, bronze plans have lower premiums, but higher deductibles and other cost sharing than other metal tiers. Bronze plan enrollees are not eligible for the cost-sharing reductions available through silver plans for lower-income households.
In contrast, the least expensive insurance option would cost more than the estimated individual mandate penalty for about 7.1 million uninsured people eligible to purchase an ACA marketplace plan, with or without subsidies, according to the analysis.