KFF designs, conducts and analyzes original public opinion and survey research on Americans’ attitudes, knowledge, and experiences with the health care system to help amplify the public’s voice in major national debates.
Sometimes it takes a call from a friend to take a fresh look at what’s going on in Medicare. My friend Craig, a rugged Coloradan, turned 65 a few years ago and signed up for a Medicare Advantage plan. At the time, this decision was easy. He wanted to stay with the same insurer he had before he was eligible for Medicare. He liked the convenience of having one plan (his Medicare Advantage HMO) instead of three (traditional Medicare, a supplemental Medigap policy, and a separate Medicare drug plan). He also liked the fact that his monthly Medicare HMO premium was lower than what he would have paid, had he opted for traditional Medicare with separate Medigap and Part D policies.
So far so good until he had a serious mountain-biking accident, was rushed to the emergency room, and in the course of getting patched up, learned that he had tumors on his spine and would likely need surgery. After seeking a second opinion, he concluded that the best and most experienced surgeon was one who was out of his plan’s network. His HMO denied his appeal to be treated by the out-of-network surgeon. Had he stayed in his HMO and opted for that surgeon anyway, he could have been on the hook for the full cost of his surgery – a financial non-starter.
After just two years on Medicare, Craig’s priorities had changed. Because of his medical condition, he wanted health insurance that would allow him to choose his own doctors, including the recommended surgeon. He decided to disenroll from his Medicare HMO and shift to traditional Medicare during the next open enrollment period to have greater flexibility in choosing his own providers.
But before making the switch, Craig was surprised to learn that traditional Medicare does not have an annual out-of-pocket limit for inpatient or outpatient care, unlike his HMO. In contrast, all Medicare Advantage plans are required by the Center for Medicare and Medicaid Services (CMS) to provide an annual limit on out-of-pocket spending for services covered under Medicare Parts A and B not to exceed $6,700. Similar protections were provided to the non-elderly under the ACA who typically have the protection of an annual out-of-pocket maximum for covered in-network services, including prescription drugs, under both non-grandfathered employer-sponsored plans and qualified health plans in the Marketplace ($6,850 for an individual in 2016).
Craig’s plan was to purchase a Medicare supplemental insurance (Medigap) policy to limit the risk he might incur under traditional Medicare without an out-of-pocket limit, but he couldn’t. He was denied Medigap coverage because of his pre-existing condition. Under federal law and in many states, insurers are not required to participate in an annual open enrollment period, and are only required to sell a policy under specific circumstances, such as when applicants first enroll in Medicare at age 65 or within a year of trying a Medicare Advantage plan. In other words, consumer protections, such as an annual open enrollment period without pre-existing condition exclusions, do not apply to the Medigap market as they do for Marketplace and Medicare Advantage plans.
This means that seniors who opt for a Medicare Advantage plan when they first go on Medicare can forever be locked out of the Medigap market. Seniors are permitted to switch back and forth between traditional Medicare and Medicare Advantage during the open enrollment period, but if they choose Medicare Advantage from the start, as more and more Boomers are doing, they may be making an irrevocable decision by giving up their right to purchase supplemental insurance later in life.
Although Craig would have preferred coverage under traditional Medicare for its broad choice of surgeons and specialists, he felt he could not expose his family to unforeseeable costs without an out-of-pocket limit or back-up protection under a supplemental policy. He ultimately found a different Medicare Advantage plan that included his surgeon in network, and is hoping that his new plan will cover any other specialist he may need.
Craig’s experience raises important issues for consumers and policymakers. Health insurance choices facing Boomers aging onto Medicare are complex, and may be hard to undo as medical needs and preferences change over time. Craig’s story illustrates how current rules may disadvantage seniors who prefer traditional Medicare because they want greater control over their health care, but feel they need the financial protection of an out-of-pocket limit. Under current rules, seniors are entitled to an out-of-pocket limit only if they sign up for a Medicare Advantage plan, but not if they choose traditional Medicare. And, while seniors have the opportunity to switch from Medicare Advantage to traditional Medicare for any reason during an open enrollment season, they may be unable to protect themselves from unforeseeable costs by purchasing supplemental coverage if they have a medical problem.
People may disagree about the strengths and weaknesses of traditional Medicare relative to Medicare Advantage, but few argue for rules that stack the deck against seniors who prefer traditional Medicare. Over the past several years, the number of beneficiaries in Medicare Advantage plans has continued to rise. Despite the controversial reductions in payments included in the ACA, Medicare still pays more, on average, for people in Medicare Advantage plans than it does for beneficiaries in traditional Medicare, according to MedPAC.
The rise in Medicare Advantage enrollment is due to many factors, including relatively low premiums, extra benefits, and the simplicity of one-stop shopping. But Craig’s experience sheds light on other factors which may explain why more people who initially choose Medicare Advantage feel they cannot switch to traditional Medicare if their needs and preferences change — a cautionary tale for consumers and for others who want to preserve or even strengthen traditional Medicare for the future.
In this post, Alina Salganicoff and Laurie Sobel outline the legal arguments in the U.S. Supreme Court case Zubik v. Burwell and discuss what the case could mean for contraceptive coverage.
In this post on The Huffington Post, Alina Salganicoff and Laurie Sobel offer a Q&A on “contraceptive-only” plans, an approach mentioned during oral arguments in the U.S. Supreme Court case Zubik v. Burwell. In the Zubik case, a group of religiously affiliated nonprofits with religious objections to providing birth control coverage seek an exemption from the Affordable Care Act’s provision requiring most plans to offer such coverage without cost-sharing.
Using recently-released disease-based health spending data compiled by the federal government, the analysis finds that the drivers of health spending growth shifted in the years following the Great Recession. The number of people treated for various diseases picked up, but that was offset early in the economic recovery by slower growth in the cost of treating those diseases (including prices).
Three factors likely influenced the spending trends: the economic recovery, which led to more people seeking treatment; the Affordable Care Act (ACA), which expanded coverage of preventive care services, correlating with an uptick in the number of treated cases; and a phenomenon known as the “patent cliff,” which held down drug prices, as patients substituted generics for brand-name versions of prescription drugs following the expiration of a large number of patents.
The analysis finds that use of preventive services increased sharply in 2011 and 2012, coinciding with the ACA requirement that most plans cover a variety of preventive services without cost-sharing.
The brief is part of the Peterson-Kaiser Health System Tracker, an online information hub dedicated to monitoring and assessing the performance of the U.S. health system.
A Founding Editor of Kaiser Health News Died Last Week of Complications from Rare Health Condition
WASHINGTON, D.C.– The Kaiser Family Foundation (KFF) is honoring the late Peggy Girshman, a founding executive editor of Kaiser Health News (KHN), by naming its annual web reporting fellowship for young journalists the “Peggy Girshman Web Reporting Fellowship.”
Girshman died last week at the age of 61 due to complications from the rare disease amyloidosis, which she had battled for the past few years. Girshman joined the Kaiser Family Foundation in 2008 to help launch Kaiser Health News, which is an editorially-independent news service and major program of KFF. She retired in 2014. Over the course of a journalism career spanning four decades, Girshman won multiple Emmy Awards as a producer. Her stints at local and national outlets included 15 years at NPR, first as a reporter and then as a managing editor, and as a senior medical producer for “Dateline NBC.” The naming of the fellowship memorializes Girshman’s role as a mentor to countless young journalists at KHN and throughout her journalism career.
“Peggy played a vital role in the early days of KHN and was the heart and soul of a great team that took it from a concept on paper to a reality,” said Kaiser Family Foundation President and CEO Drew Altman. “While our hearts are broken by the loss of Peggy, we hope to keep her memory alive through this fellowship for up-and-coming journalists at KHN.”
The Peggy Girshman Web Reporting Fellowship is designed for early career journalists with an interest in politics and health policy. Fellows produce original stories and multimedia content and collaborate with the many seasoned journalists at KHN, reporting on a wide range of health policy issues for KHN and its distribution partners.
Shefali Luthra is the current fellow. She is a former intern of the Texas Tribune where she covered state politics, women’s health and local implementation of federal health reform. Luthra is also a former KFF media intern and a recent graduate of Brown University. Young journalists interested in applying for the year-long fellowship can learn more about it here.
In his latest column for The Wall Street Journal’s Think Tank, Drew Altman examines the role of the Affordable Care Act in the health system on its sixth anniversary, and how the hot debate about the law may have created an exaggerated impression of the good and the bad it can do.
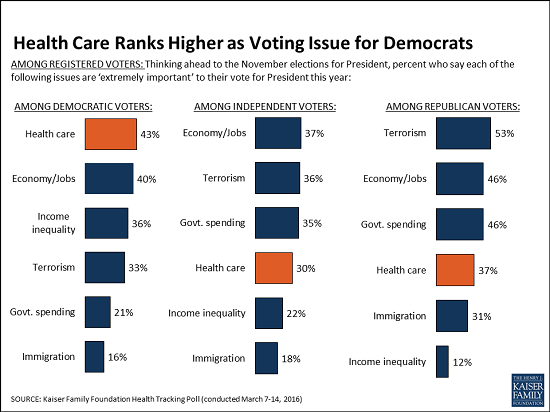
The March Kaiser Health Tracking Poll finds that health care is one of many issues that will be important to voters in the Presidential election, trailing concerns about the economy and jobs and leading concerns about another hot issue, immigration. Health care ranks higher for Democratic voters than for Republican and independent voters and is a higher priority for women than for men.
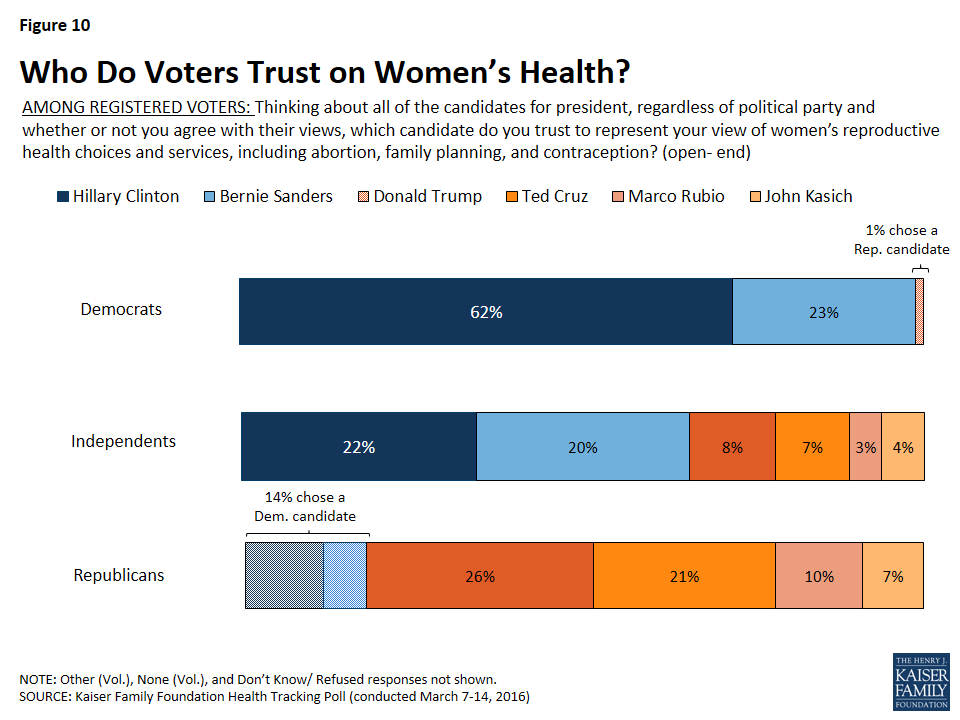
A majority of Democratic voters name Hillary Clinton as the candidate for president they trust to represent their view of women’s reproductive health choices and services, while Republican voters don’t coalesce around any one candidate. About a fourth of Republican voters say they trust Donald Trump to represent their views and about two in 10 name Ted Cruz.
About one-third of Americans say ‘there is a wide-scale effort to limit women’s reproductive health choices and services, such as abortion, family planning, and contraception’ a six percentage point increase from 2012. Women, as a group, express more concern about the state of women’s reproductive health policy than men; however, opinions among women vary along political party lines with an equal share of Republican women saying that the wide-scale effort is a ‘good’ and ‘bad’ thing.
Health care costs remain on the forefront of the minds of both the uninsured and voters, with nearly half of uninsured Americans saying that cost is the main reason they haven’t gotten health insurance and almost three in 10 voters who say health care is important to their vote for President citing health care costs as their top health concern.
The Role of Health Care in the 2016 Presidential Election
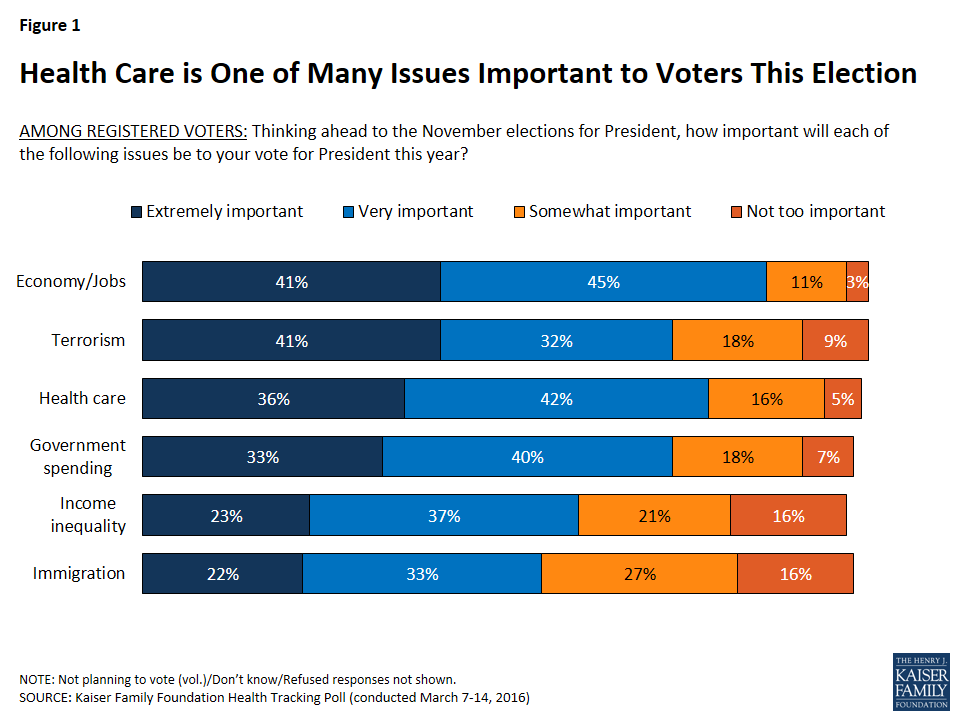
The March Kaiser Health Tracking Poll finds that no one issue truly stands out for voters, with several issues, including health care, cited as important to the majority of registered voters. Most voters rate all of the issues presented as either ‘extremely important’ or ‘very important’ to their vote for President this year, with the largest shares saying that the economy and jobs, terrorism, and health care are ‘extremely important.’
The economy and jobs and terrorism are the top issues with about four in 10 registered voters (41 percent each) saying they are ‘extremely important’ to their vote for President this year. Other top issues for voters are health care (36 percent) and government spending (33 percent). Fewer voters, although still substantial shares, name income inequality (23 percent), and immigration (22 percent) as ‘extremely important’ to their vote for President this year.
Figure 1: Health Care is One of Many Issues Important to Voters This Election
Health Care is More Important to Democrats and Women
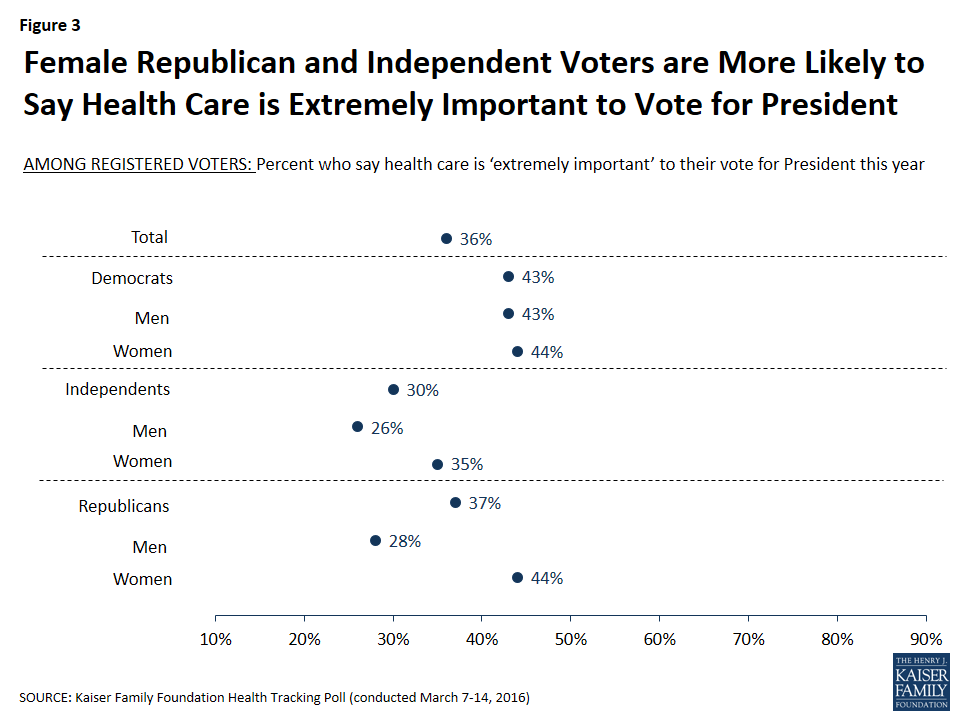
Slightly more Democratic voters than independents and Republicans say that health care is ‘extremely important’ to their vote for President (43 percent vs. 30 percent and 37 percent, respectively). Overall, Democrats rate both health care and the economy and jobs as the most important issues to their vote for President, while independents and Republicans rate the economy and jobs, terrorism, and government spending above health care. More than half of Republican voters (53 percent) say that terrorism is ‘extremely’ important to their vote for President.
Figure 2: Health Care Ranks Higher as Voting Issue for Democrats
Over four in 10 Democratic voters overall (43 percent) – including similar shares of men and women – say health care is ‘extremely important’ to their vote. However, among Republican and independent voters, women are more likely than men to say health care is an extremely important voting issue (44 percent versus 28 percent for Republicans; 35 percent versus 26 percent for independents).
Figure 3: Female Republican and Independent Voters are More Likely to Say Health Care is Extremely Important to Vote for President
What About Health Care Is Important to Voters?
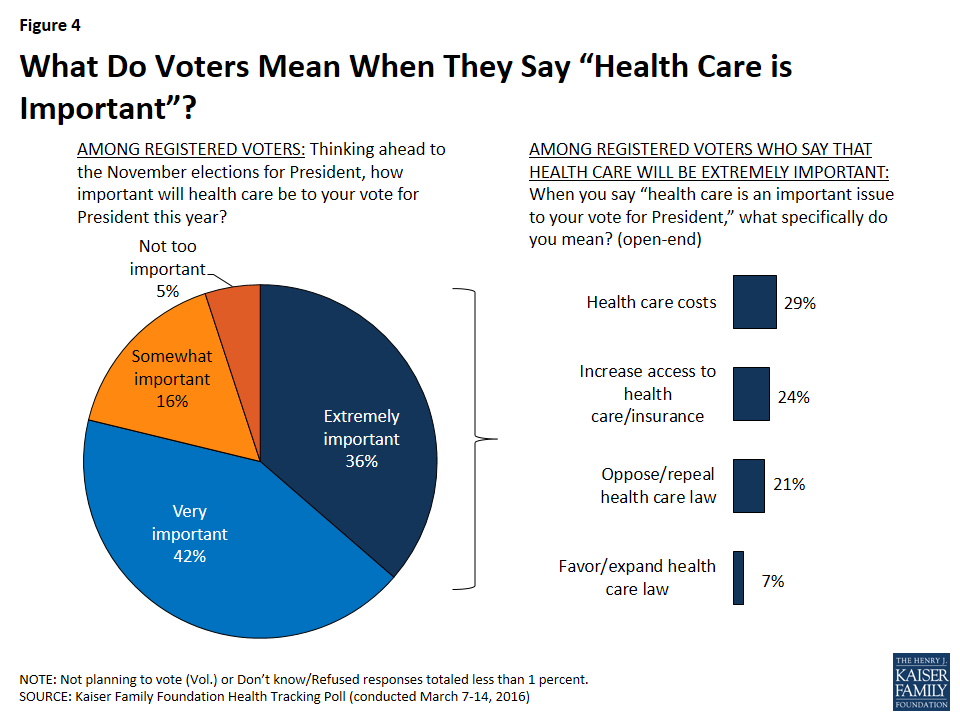
The survey also included an open-ended question asked of those who said health care was one of the issues that would be ‘extremely’ important to their vote (a group representing 36 percent of registered voters) to find out what specifically about the issue was on their minds. Three in 10 (30 percent) of this group mention something about 2010 health care law, with three times as many saying they oppose it or want to repeal it (21 percent) as favor it or want to expand it (7 percent). A similar share mention health care costs (29 percent) and 24 percent mention increasing access to health care/insurance.
Figure 4: What Do Voters Mean When They Say “Health Care is Important”?
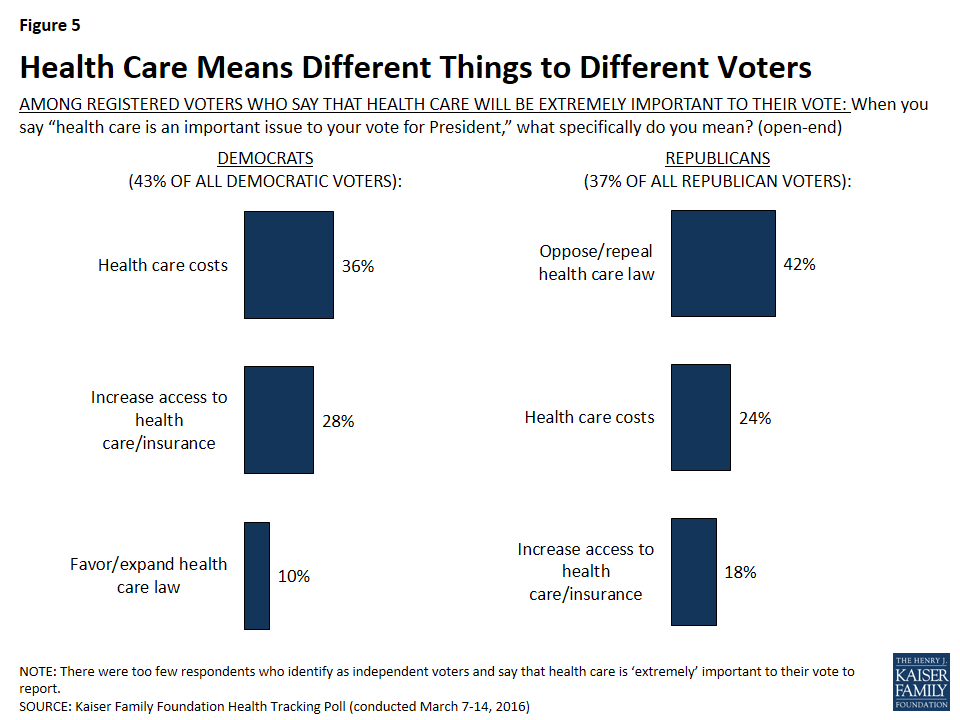
Of the 37 percent of Republican voters who were asked what they meant when they say health care is extremely important to their vote, four in 10 (42 percent) mention opposing or repealing the health care law with many fewer mentioning health care costs (24 percent) and increasing access to health care and insurance (18 percent). On the other side, smaller shares of Democratic voters who were asked what they mean when they say health care is extremely important to their vote mention the health care law (5 percent mention opposing or repealing the law and 10 percent favoring or expanding it), but they are more likely to say increasing access to health care and insurance (28 percent) and cost-related concerns (36 percent).
Figure 5: Health Care Means Different Things to Different Voters
Kaiser Health Policy News Index: March 2016
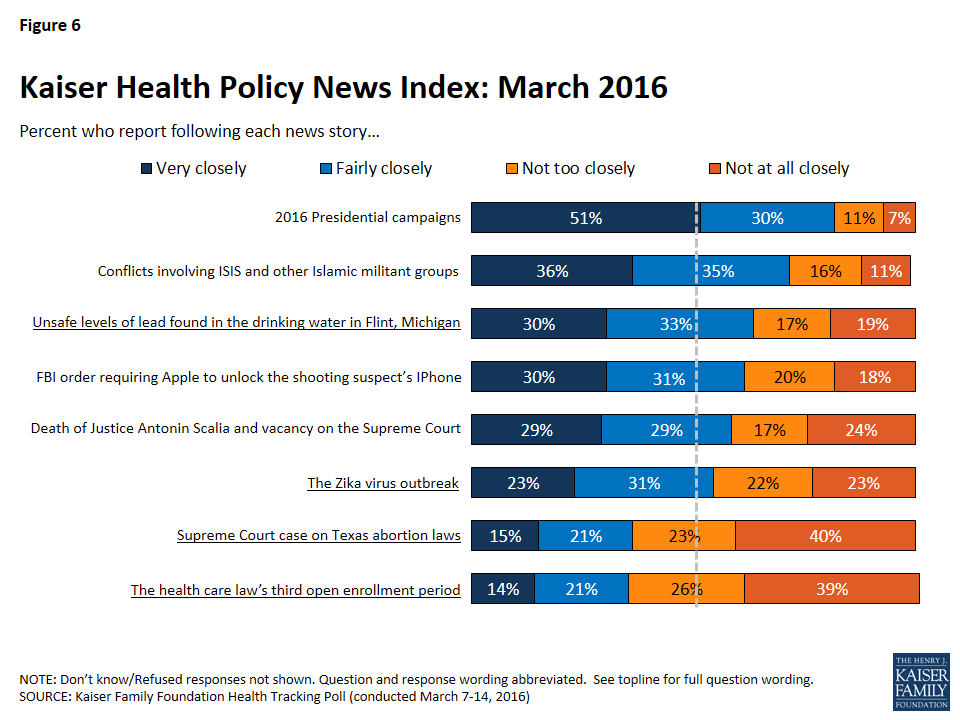
The March Kaiser Health Tracking Poll finds that the vast majority of Americans (81 percent) are following stories about the 2016 presidential campaign, an eight percentage point increase from last month’s Health Tracking Poll. In fact, for the first time this election season, more than half of Americans (51 percent) report following the news of the presidential campaigns ‘very closely.’ Other stories that captured the attention of Americans this month include conflicts involving ISIS and other Islamic militant groups (72 percent), the health policy news story about unsafe lead levels in Flint Michigan’s water (63 percent), the FBI order requiring Apple to unlock the San Bernardino shooting suspect’s iPhone (61 percent), and the death of Supreme Court Justice Antonin Scalia and the subsequent vacancy on the Supreme Court (59 percent). Just over half of the public says they followed news about the Zika virus outbreak (54 percent). Fewer Americans report following two additional health policy stories, with only slightly more than a third saying they closely followed news about the U.S. Supreme Court case on Texas abortion laws (36 percent) and the health care law’s third open enrollment period (34 percent).
Figure 6: Kaiser Health Policy News Index: March 2016
Women’s Reproductive Health Choices and Services
The Supreme Court case on Texas abortion laws, closely followed by 36 percent of the public, is one of two cases regarding women’s reproductive health before the U.S. Supreme Court this term. The other case deals with religious objections to the health care law’s requirement that employers provide contraception coverage for their female employees. In light of these cases, this month’s Kaiser Health Tracking Poll examines how the public, and women specifically, feel about the state of women’s reproductive health policy.
Wide-Scale Effort to Limit Women’s Reproductive Health Choices and Services
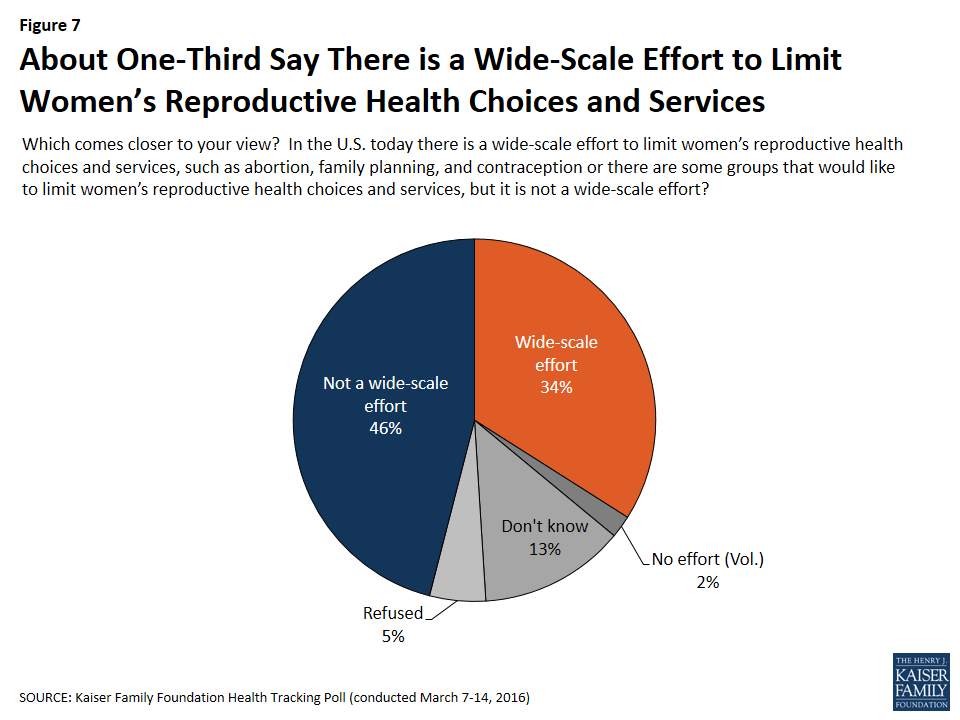
About a third of Americans (34 percent) say ‘there is a wide-scale effort to limit women’s reproductive health choices and services, such as abortion, family planning, and contraception’ while nearly half (46 percent) say that ‘there are some groups that would like to limit these choices and services, but it is not a wide-scale effort,’ and 13 percent say they don’t know. The share that say there is a wide-scale effort is six percentage points higher than it was in 2012 when women’s reproductive health policy garnered similar levels of media attention.
Figure 7: About One-Third Say There is a Wide-Scale Effort to Limit Women’s Reproductive Health Choices and Services
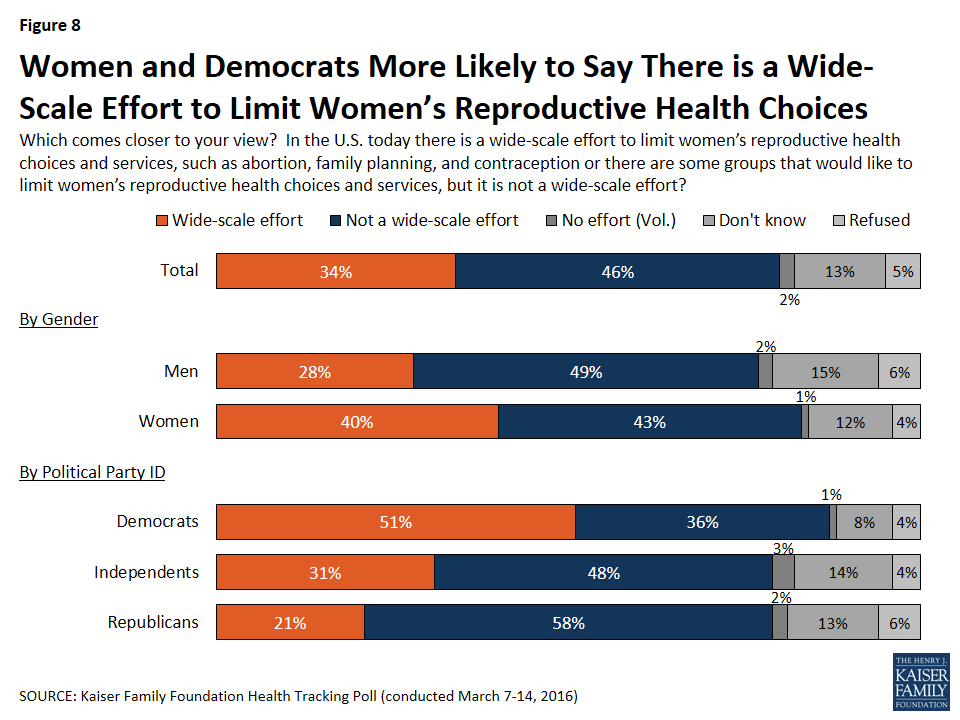
Significantly more women than men (40 percent vs. 28 percent) and more Democrats than independents or Republicans (51 percent vs. 31 percent and 21 percent) say they believe there is a wide-scale effort to limit women’s reproductive health choices and services.
Figure 8: Women and Democrats More Likely to Say There is a Wide-Scale Effort to Limit Women’s Reproductive Health Choices
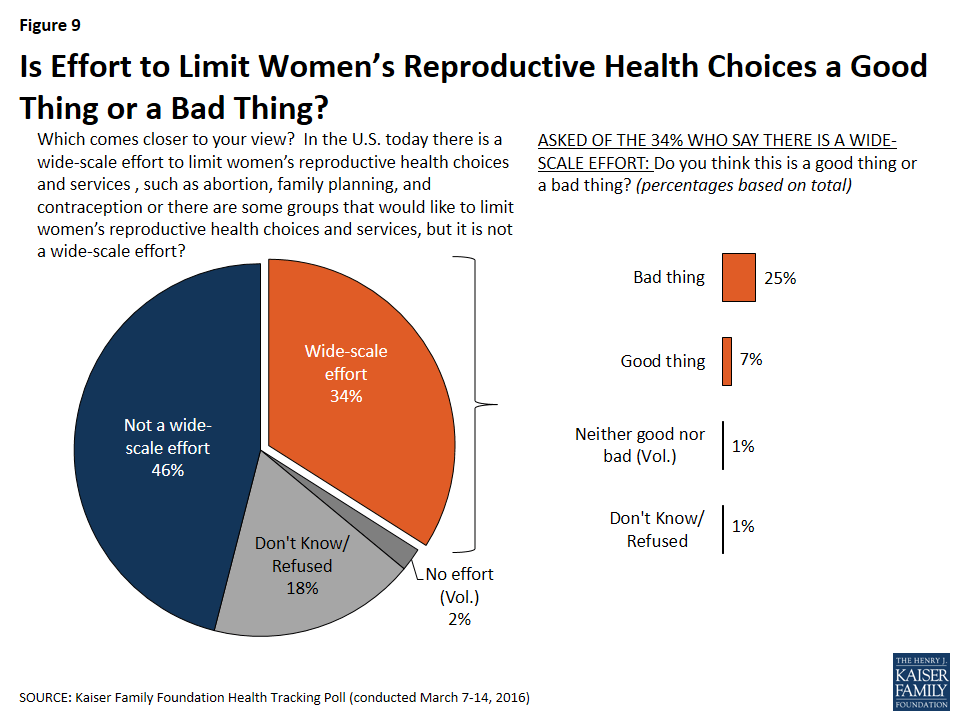
Among those who say there is a wide-scale effort to limit women’s reproductive health choices and services, more say the wide-scale effort is a ‘bad thing’ (25 percent overall), than say there it is a ‘good thing’ (7 percent overall).
Figure 9: Is Effort to Limit Women’s Reproductive Health Choices a Good Thing or a Bad Thing?
A Closer Look at the Opinions of Women Partisans
Opinions among women are by no means uniform when it comes to issues of women’s reproductive health, and fall very distinctly down party lines.
Female Democratic voters are more likely to believe that there is a wide-scale effort to limit women’s reproductive health choices and services than independent and Republican female voters (56 percent vs. 36 percent and 25 percent, respectively). Furthermore, female Democratic and independent voters are much more likely to say that it is a ‘bad thing’ (51 percent and 29 percent) than a ‘good thing,’ while female Republican voters are evenly divided between thinking such an effort is a ‘bad thing’ or a ‘good thing’ (11 percent and 10 percent). About half of female Democratic voters (52 percent) say that they are personally concerned about women’s reproductive health choices and services compared to about three in 10 female independent voters (31 percent) and two in 10 female Republican voters (18 percent) who say the same.
Table 1: Female Partisans on Women’s Reproductive Health Choices and Services
Which comes closer to your view?
Dem Female Voters
Ind Female Voters
Rep Female Voters
There is a wide-scale effort to limit women’s reproductive health choices and services, such as abortion, family planning, and contraception
56%
36%
25%
Good thing
2
4
10
Bad thing
51
29
11
Neither good nor bad (Vol.)
3
3
1
Very or somewhat personally concerned
52
31
18
Not too or not at all personally concerned
4
5
5
There are some groups that would like to limit women’s reproductive health choices and services, but it is not a wide-scale effort
33
45
56
There has been no effort to limit women’s reproductive health choices and services (Vol.)
<1
2
2
Don’t Know/ Refused
11
17
17
NOTE: Don’t Know/ Refused responses not shown for questions asked of those who say there is a wide-scale effort.
Which Candidate Do Voters Trust to Represent Views on Women’s Health
A majority of Democratic voters (62 percent) name Hillary Clinton when asked which candidate for president they trust to represent their view of women’s reproductive health choices and services, while almost a quarter of Democratic voters (23 percent) name Bernie Sanders, and one percent name Republican candidate Donald Trump. On the other side of the political spectrum, Republican voters don’t coalesce around any one candidate as the most trustworthy when it comes to women’s health. About a fourth of Republican voters (26 percent) say they trust Donald Trump to represent their views and about two in 10 (21 percent) name Ted Cruz. Fewer Republican voters name Marco Rubio (10 percent) or John Kasich (7 percent), which is similar to the share of Republican voters who name Democratic candidates Hillary Clinton (9 percent) and Bernie Sanders (5 percent). More independent voters say they trust the Democratic candidates than say they trust the Republican candidates when it comes to women’s reproductive health, however there is no candidate that stands out as the most trustworthy; with Hillary Clinton and Bernie Sanders nearly tied (22 percent and 20 percent, respectively). Female voters’ responses largely mirror the majority of voters from each party.
Figure 10: Who Do Voters Trust on Women’s Health?
Americans’ Opinions of the Affordable Care Act
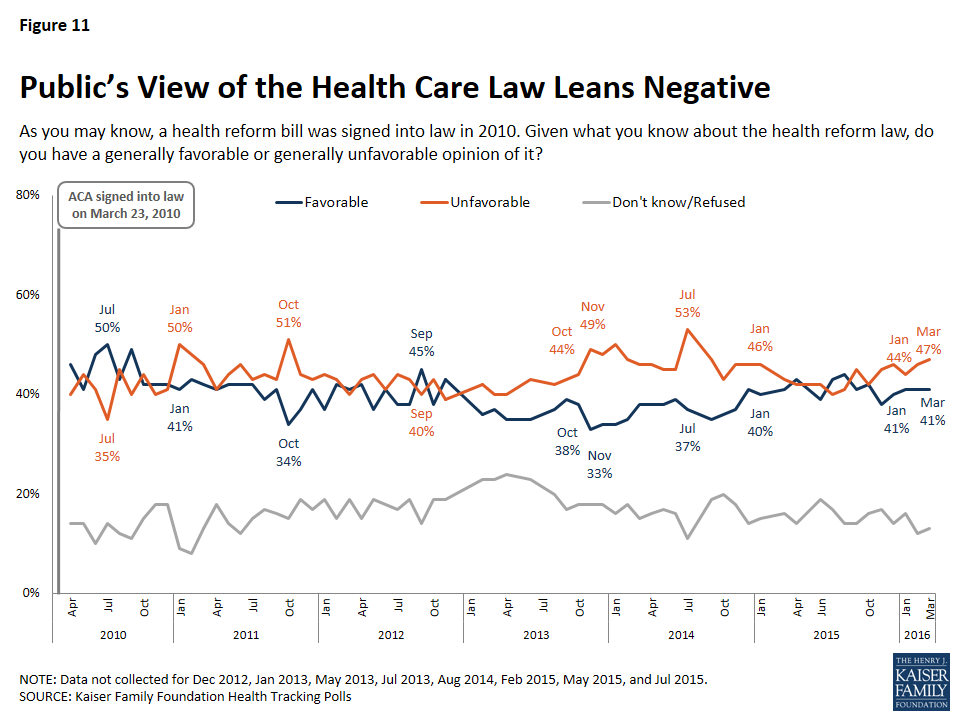
After the close of the ACA’s third open enrollment period on January 31st, Americans’ opinion of the health care law is tilting negative, with 41 percent saying they have a favorable view and 47 percent saying they have an unfavorable view. Furthermore, partisans continue to hold widely differing views; over two-thirds of Democrats (69 percent) report a favorable view, while nearly eight in 10 Republicans (78 percent) report an unfavorable view, and independents fall in the middle, with 40 percent saying they have a favorable opinion and 45 percent saying they have an unfavorable opinion.
Figure 11: Public’s View of the Health Care Law Leans Negative
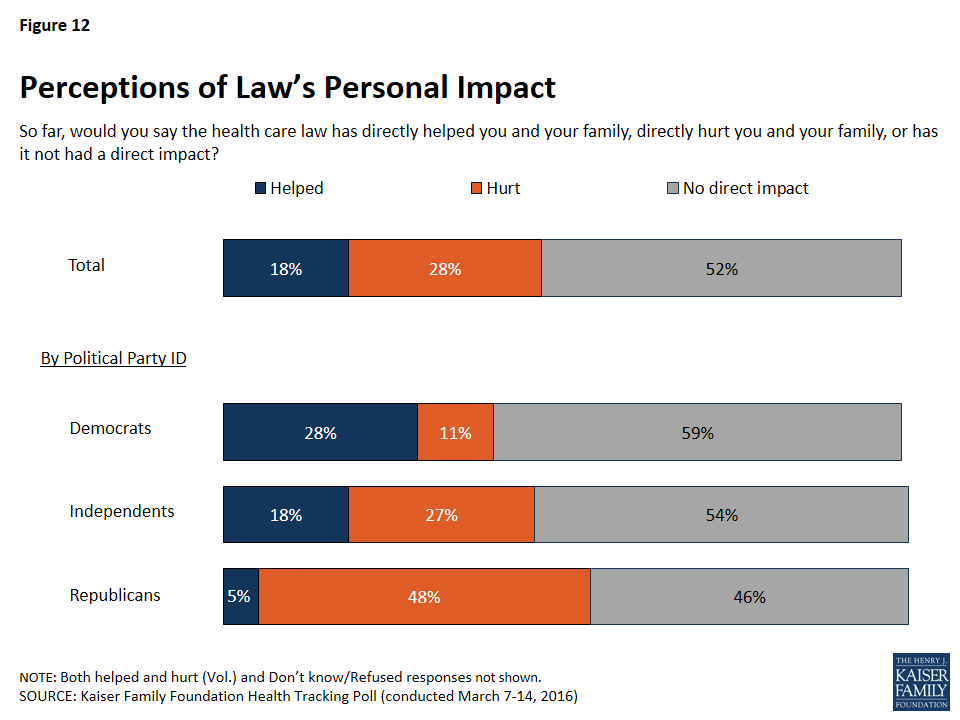
Overall, half of the public (52 percent) says they have not been directly impacted by the health care law, however more say they have been hurt by the law than say they have been helped (28 percent compared to 18 percent). Once again, this significantly differs by party with 28 percent of Democrats reporting that they have been helped while almost half (48 percent) of Republicans reporting they have been hurt by the health care law.
Figure 12: Perceptions of Law’s Personal Impact
Uninsured Americans Cite Costs as Main Reason for Remaining Uninsured
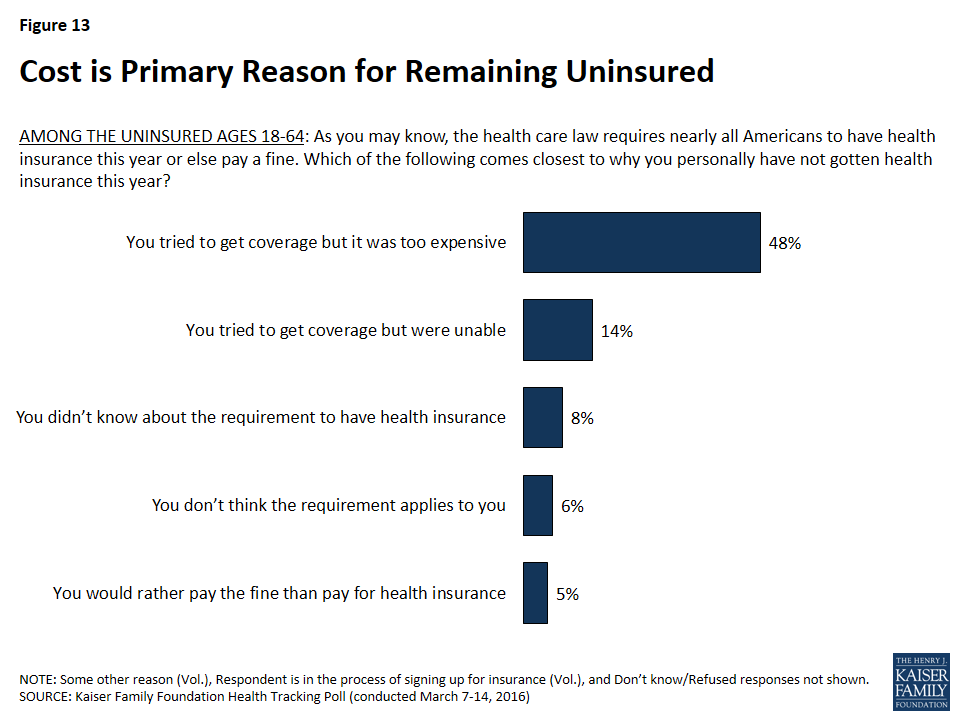
When asked why they have not purchased health insurance this year, nearly half of the uninsured (48 percent) say they have tried to get coverage but that it was too expensive. Others say they tried to get coverage but were unable (14 percent), they did not know about the requirement to have health insurance (8 percent), they did not think the requirement applies to them (6 percent), and they would rather pay the fine than pay for coverage (5 percent).
Figure 13: Cost is Primary Reason for Remaining Uninsured
Methodology
This Kaiser Health Tracking Poll was designed and analyzed by public opinion researchers at the Kaiser Family Foundation (KFF). The survey was conducted March 7-14, 2016, among a nationally representative random digit dial telephone sample of 1,201 adults ages 18 and older, living in the United States, including Alaska and Hawaii (note: persons without a telephone could not be included in the random selection process). Computer-assisted telephone interviews conducted by landline (421) and cell phone (780, including 478 who had no landline telephone) were carried out in English and Spanish by Princeton Data Source under the direction of Princeton Survey Research Associates International (PSRAI). Both the random digit dial landline and cell phone samples were provided by Survey Sampling International, LLC. For the landline sample, respondents were selected by asking for the youngest adult male or female currently at home based on a random rotation. If no one of that gender was available, interviewers asked to speak with the youngest adult of the opposite gender. For the cell phone sample, interviews were conducted with the adult who answered the phone. KFF paid for all costs associated with the survey.
The combined landline and cell phone sample was weighted to balance the sample demographics to match estimates for the national population using data from the Census Bureau’s 2014 American Community Survey (ACS) on sex, age, education, race, Hispanic origin, nativity (for Hispanics only), and region along with data from the 2010 Census on population density. The sample was also weighted to match current patterns of telephone use using data from the January-June 2015 National Health Interview Survey. The weight takes into account the fact that respondents with both a landline and cell phone have a higher probability of selection in the combined sample and also adjusts for the household size for the landline sample. All statistical tests of significance account for the effect of weighting.
The margin of sampling error including the design effect for the full sample is plus or minus 3 percentage points. Numbers of respondents and margins of sampling error for key subgroups are shown in the table below. For results based on other subgroups, the margin of sampling error may be higher. Sample sizes and margins of sampling error for other subgroups are available by request. Note that sampling error is only one of many potential sources of error in this or any other public opinion poll. Kaiser Family Foundation public opinion and survey research is a charter member of the Transparency Initiative of the American Association for Public Opinion Research.
About One Third of Americans Perceive Wide-Scale Effort to Limit Women’s Reproductive Health Choices and Services; Most Who Do Say the Effort is a ‘Bad Thing’
Health care is one of many issues that will be important for voters in the presidential election, particularly for Democrats and women, finds the March Kaiser Health Tracking Poll.
More than a third (36%) of voters consider health care “extremely important” to their vote in this year’s presidential election, ranking it below the economy and jobs and terrorism (41% each), but above government spending (33%), income inequality (23%), and immigration (22%).
Democrats rate health care at the top of their list of issues that will matter to their vote, along with the economy and jobs. Despite the attention Republican presidential candidates have given to Obamacare on the campaign trail, Republicans rate the economy and jobs, terrorism, and government spending above health care, with immigration, a hot issue on the campaign trail, coming in fifth.
Female voters (41%) are more likely than male voters (31%) to consider health care “extremely important” to their vote. Within all groups, more voters say health care is extremely important than say the same about immigration or income inequality.
When those who consider health care to be extremely important to their vote are asked why, three in 10 voters (30%) mention the Affordable Care Act, with three times as many saying they oppose it (21%) as favor it (7%). A similar share (29%) mention health care costs, and about a quarter (24%) mention increasing access to insurance.
With the Supreme Court currently weighing cases involving a Texas abortion law and employers’ religious objections to the Affordable Care Act’s contraception requirements, the poll finds a third (34%) of the public say “there is a wide-scale effort to limit women’s reproductive health choices and services,” while nearly half (46%) say “some groups would like to limit these choices and services, but it is not a wide-scale effort.”
Significantly more women than men (40% vs. 28%) and more Democrats than independents or Republicans (51% vs. 31% and 21%) say they believe there is a wide-scale effort to limit women’s reproductive health choices and services.
Those who perceive a wide-scale effort are more likely to describe the effort as a “bad thing” (25% of the public overall) than a “good thing” (7% of the public overall). Female Republican voters are evenly divided as to whether the effort is good or bad, while female Democratic and independent voters are more likely to view the effort as bad.
Most Democratic voters (62%) name Hillary Clinton as the presidential candidate they trust most to represent their views on women’s reproductive health choices and services, while almost a quarter (23%) name Bernie Sanders. Republican voters are more divided: A quarter (26%) name Donald Trump, a fifth (21%) name Ted Cruz, and smaller shares name Marco Rubio (10%), John Kasich (7%). Some Republicans also name Democratic candidates Hillary Clinton (9%) and Bernie Sanders (5%).
Among independent voters, the largest shares trust the Democratic candidates, Hillary Clinton (22%) and Bernie Sanders (20%), on reproductive health issues. Fewer cite Donald Trump (8%), Ted Cruz (7%), John Kasich (4%) or Marco Rubio (3%).
Americans’ overall view of the health care law is tilting negatively in March, with 41 percent favorable and 47 percent unfavorable. While about half the public (52%) says they have not been directly impacted by the health care law, more say they have been hurt than say they have been helped (28% vs. 18%, respectively). Democrats are more likely to report being helped, while Republican are more likely to report being hurt.
With the ACA’s third open enrollment period over, the survey also assesses why those who remain uninsured did not obtain coverage, and cost remains the main barrier. Among those without health insurance, nearly half (48%) say they tried to get coverage but that it was too expensive. Others say they tried to get coverage but were unable (14%), they did not know about the requirement to obtain coverage (8%) or did not think the requirement applies to them (6%). In addition, 5 percent say they would rather pay a fine than pay for coverage.
Designed and analyzed by public opinion researchers at the Kaiser Family Foundation, the poll was conducted from March 7 to 14, 2016 among a nationally representative random digit dial telephone sample of 1,201. Interviews were conducted in English and Spanish by landline (421) and cell phone (780). The margin of sampling error is plus or minus 3 percentage points for the full sample. For results based on subgroups, the margin of sampling error may be higher.
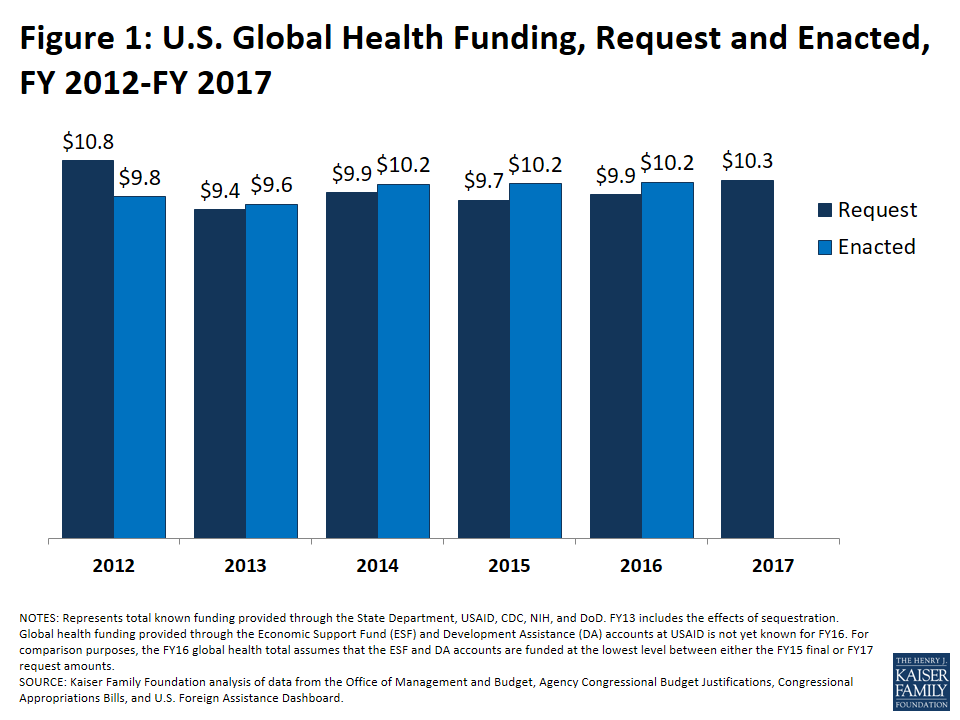
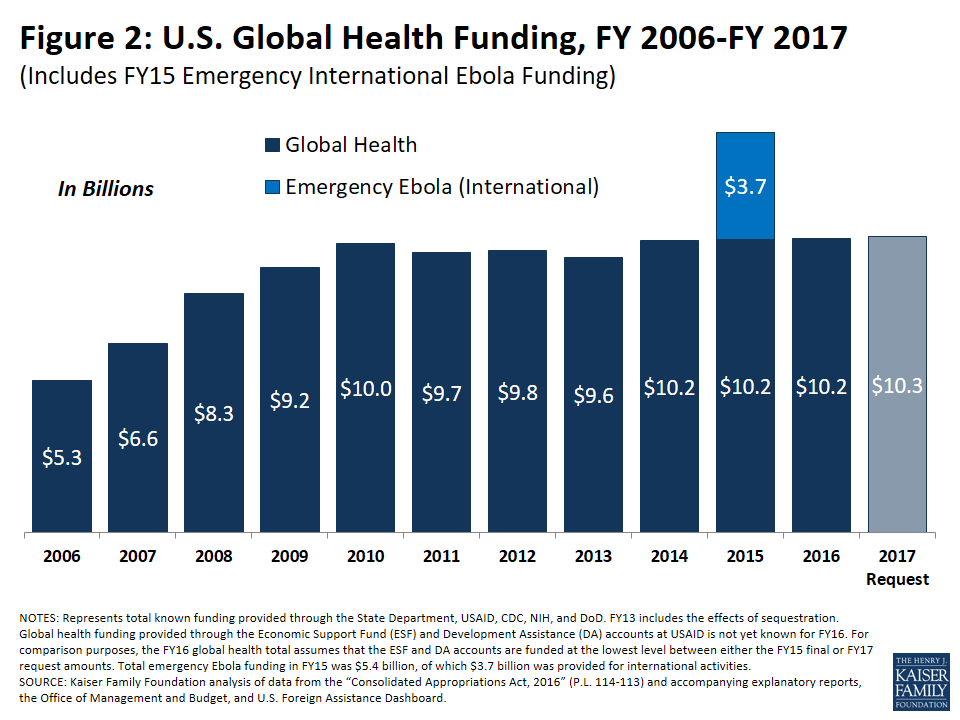
President Obama released the budget request for Fiscal Year 2017 (FY17) on February 9, 2016, his final budget request in office, which included $10.3 billion in total funding for global health programs. This marks the first time in three years that the request for global health is higher than the previous year enacted level, and represents the largest request since FY12 (see Figure 1). If enacted by Congress, it would represent the highest level of global health funding to date (excluding emergency funding for Ebola provided in FY15) (see Figure 2).
Figure 1: U.S. Global Health Funding, Request and Enacted, FY 2012-FY 2017Figure 2: U.S. Global Health Funding, FY 2006-FY 2017
The majority of U.S. global health funding is provided as part of base funding for ongoing programs under the international affairs budget, which includes programs at the U.S. Agency for International Development (USAID) and the Department of State.1 While the FY17 request proposed increased funding for global health, it proposed decreased base funding for the international affairs budget. As a result, when measured as a share of the international affairs budget, global health would continue the recent trend of increasing as a share of the international affairs budget rising from 20% in FY14 to 23% in FY17 (see Table 1).
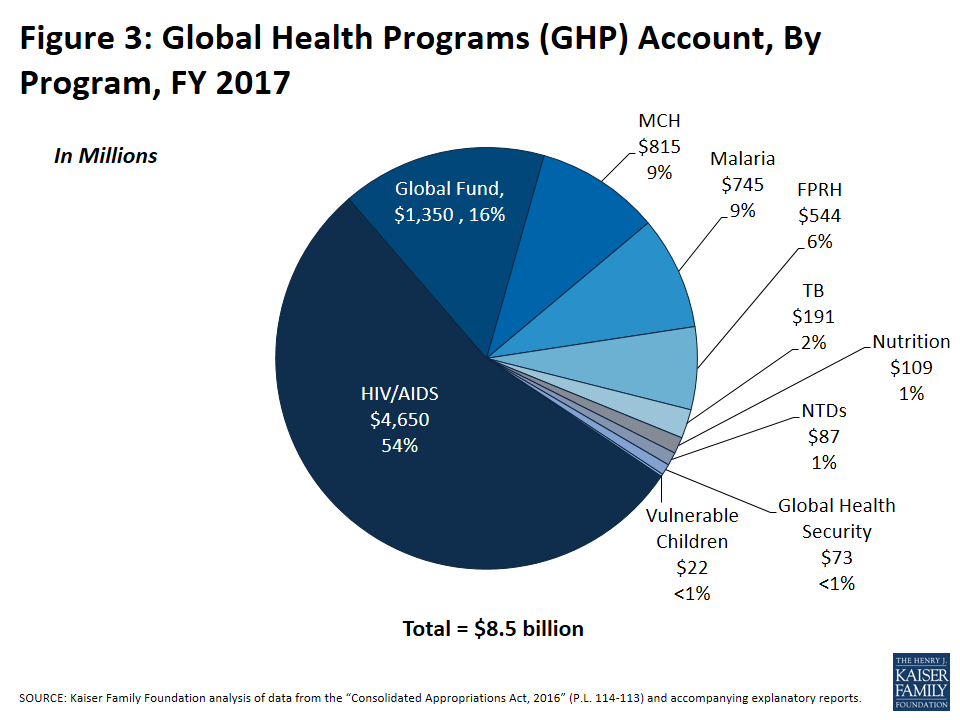
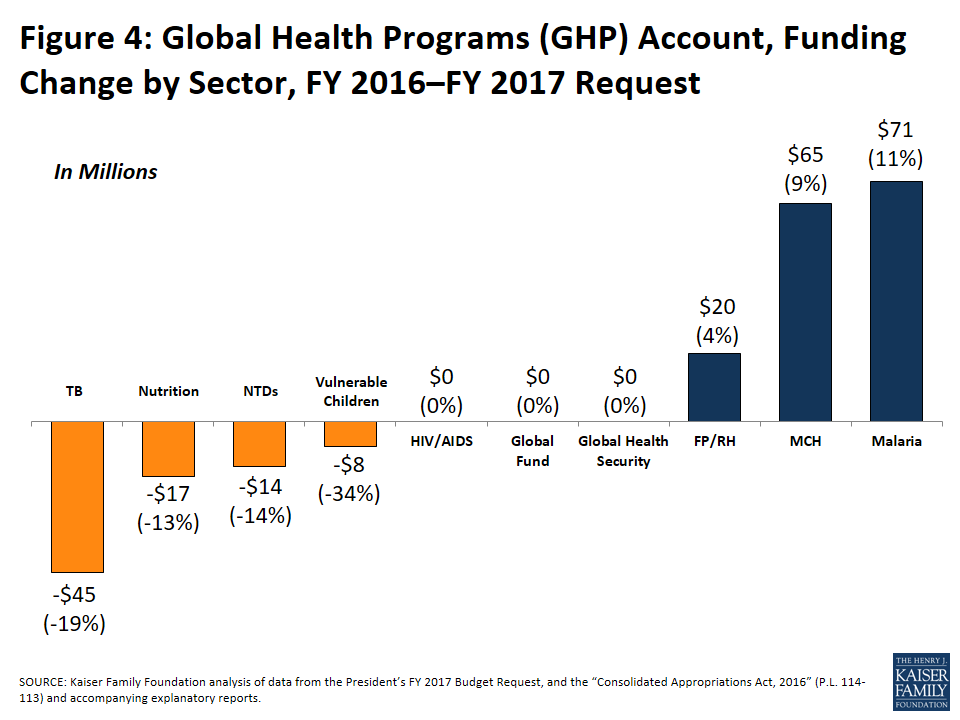
Within the international affairs budget, most of the global health funding ($8.6 billion) specified in the FY17 request is provided through the Global Health Programs (GHP) account at USAID and the State Department, which includes funding for the President’s Emergency plan for AIDS Relief (PEPFAR) and the President’s Malaria Initiative (PMI), as well as other global health programs (see Figure 3). Within the GHP account, three programs increased compared to FY16: malaria, maternal and child health (MCH), and family planning and reproductive health (FP/RH); four areas decreased: tuberculosis (TB), neglected tropical diseases (NTDs), nutrition, and vulnerable children; and three areas remained flat: bilateral HIV, the Global Fund to Fight AIDS, Tuberculosis, and Malaria (Global Fund), and global health security (see Figure 4).
Figure 3: Global Health Programs (GHP) Account, By Program, FY 2017Figure 4: Global Health Programs (GHP) Account, Funding Change by Sector, FY 2016–FY 2017 Request
As Congress reviews the President’s budget request for FY17 and begins drafting appropriations legislation, it is important to note that Congress has approved higher funding levels for global health than those in the President’s budget request in each of the last four fiscal years (FY13-FY16). Whether Congress will continue this trend or change funding levels for specific program areas is not yet known.
Funding by Program
This section provides an overview of global health funding levels by program area as specified in the FY17 budget request (unless otherwise stated, all comparisons are to FY16 enacted levels) (see Table 2).
PEPFAR/Bilateral HIV
PEPFAR’s bilateral HIV funding through the GHP account totaled $4,650 million in the FY17 budget request ($330 million at USAID and $4,320 million at the State Department), matching the FY16 level, but $309 million less than its peak level of funding ($4,959 million) provided in 2010. Bilateral HIV accounted for the largest share (54%) of any program area within the global health portfolio under the GHP account, although it has declined in recent years from a high of 69% in 2008. It included funding for microbicides research ($45 million) and the U.S. contribution to the Joint United Nations Programme on HIV/AIDS (UNAIDS) ($45 million). The request also included $128.4 million in HIV funding through the Centers for Disease Control and Prevention (CDC), $8 million for HIV programs at the Department of Defense (DoD), and $431.9 for HIV research at the National Institutes of Health (NIH); HIV funding through these three agencies essentially matches FY16 levels.
Global Fund to Fight AIDS, Tuberculosis and Malaria (Global Fund)
The President’s request included $1,350 million for the U.S. contribution to the Global Fund, matching the FY16 level, which was $300 million below the peak level of $1,650 million provided in FY14. The Global Fund accounts for the second largest share (16%) of U.S. funding for global health (in the GHP account).
Tuberculosis (TB)
Funding for TB programs through the GHP account totaled $191 million, a $45 million decrease (19%) below the FY16 level. Tuberculosis funding is also provided through the Economic Support Fund (ESF) account which totaled $4.0 million in the FY17 request (tuberculosis funding provided through the ESF account in FY16 is not yet known; in FY15, it was $6.3 million).2 Additional support for TB programs is provided through bilateral HIV programs (GHP account) at the State Department to address TB/HIV co-infection.3
Malaria
Malaria funding totaled $745.0 million in the FY17 request and was one of only three program areas under the GHP account that increased above FY16 levels (an increase of $71 million or 11%). In addition to increased funding for malaria provided through the GHP account, the FY17 request proposed a transfer of $129 million from the emergency Ebola funding provided by Congress in FY15 to address malaria. If the transfer of Ebola funding is approved by Congress, this would bring total malaria funding to $874 million in FY17, an increase of $200 million (30%) above the FY16 level. The budget request also included $10.7 million in malaria funding through the CDC, $7.0 million at DoD, and $171.0 million for malaria research activities at the NIH. The FY17 request for malaria funding at CDC and NIH match the FY16 levels, while DoD funding is a slight increase.
Family Planning & Reproductive Health (FP/RH)
The FY17 request included $585 million in total bilateral funding for FP/RH, an increase of $10 million (2%) above the FY16 level. This includes $544 million through the GHP account and $41 million through the ESF account.4 FP/RH was one of only three program areas to increase under the GHP account. The request also included $35 million for the U.S. contribution to the United Nations Population Fund (UNFPA), an increase of $2.5 million (8%) above FY16 levels, but $20 million less than its peak level of funding ($55 million) provided in 2010.5
Maternal & Child Health (MCH)
MCH was one of the three programs that received increased funding through the GHP account in the FY17 request, totaling $814 million, a $64 million (9%) increase above FY16 levels. This includes $540 million in funding for bilateral programs, a $25 million (5%) increase above FY16 levels, and a $275 million contribution to GAVI, a $40 million (17%) increase above FY16 levels. Additional MCH funding provided through the ESF account totaled $105.2 million (MCH funding provided through the ESF account in FY16 is not yet known; in FY15, it was $116.6 million). Funding for global immunization programs at CDC totaled $224.0 million, an increase of $5.0 million (2%) above the FY16 level.
Specific components of MCH funding provided through USAID as well as CDC and the State Department are as follows:
GAVI: The U.S. contribution to GAVI, which is included under MCH funding in the GHP account, totaled $275 million, a $40 million (17%) increase above FY16.
Polio: U.S. funding for polio programs is provided through USAID (as part of MCH funding via the GHP and ESF accounts) and CDC. Polio funding totaled $51.7 million at USAID, a $7 million decrease (12%), and $174 million at CDC, a $5 million (3%) increase above FY16 levels.
United Nations Children’s Fund (UNICEF): The U.S. contribution to UNICEF totaled $132 million in the FY17 request, which essentially matches FY16 levels.6
Nutrition
Nutrition funding through the GHP account totaled $108 million in the FY17 request, a decrease of $16 million (13%) below the FY16 level. Additional nutrition funding through the ESF and Development Assistance (DA) accounts totaled $36.5 million and $9.9 million, respectively (nutrition funding provided through these accounts in FY16 is not yet known; in FY15, $21.2 million was provided through the ESF account and $1.0 million was provided through the DA).
Vulnerable Children
Funding for vulnerable children, which is provided via the Displaced Children and Orphans Fund (DCOF) at USAID, totaled $14.5 million in the GHP account in the FY17 request, a decrease of $7.5 million (34%) below the FY16 level.
Global Health Security
The Global Health Security Agenda (GHSA), an effort launched in February 2014 aimed at improving global capabilities to prevent, detect, and respond to epidemics and other emerging public health threats, includes funding from multiple agencies. At USAID, funding for Global Health Security (formerly Pandemic Influenza and Other Emerging Threats) is provided through the GHP account and totaled $72.5 million in the FY17 request, matching FY16 levels. Funding for Global Public Health Protection at CDC, which includes funding for Global Disease Detection and Emergency Response as well as Global Public Health Capacity Development, totaled $65.2 million, an increase of $10 million (18%) above FY16 levels.
Other Global Health Funding
The U.S. provides additional global health funding in support of water, sanitation and hygiene (WASH) activities, for international global health research efforts conducted through the Fogarty International Center (FIC) at NIH, and for multilateral organizations, such as the World Health Organization (WHO) and the Pan American Health Organization (PAHO), that play an important role in addressing global issues. The FY17 request included $255.6 million in funding for WASH activities provided through multiple accounts and programs (since WASH is considered a cross-cutting issue supported through direct funding as well as funding provided through other programs, such as HIV and MCH, it is not included within the overall global health total in order to prevent double-counting).7 The FY17 request included $69.2 million for international global health research activities at FIC, essentially matching FY16 levels. The request also included a $113 million contribution to WHO and a $63 million contribution to PAHO, essentially matching FY16 levels.
Other International Development Programs
The FY17 request included funding for areas and agencies that are not directly involved in U.S. global health, but are related and may impact these efforts including: the Millennium Challenge Corporation (MCC), which is an independent U.S. foreign assistance agency that has the goal of reducing poverty in developing countries through supporting economic growth; Feed the Future (FtF), which is the U.S. Government’s Global Hunger and Food Security Initiative (GAFSP); broader food assistance through Food for Peace (FFP) and McGovern-Dole International Food for Education and Child Nutrition (McGovern-Dole); and other funding through the State & Foreign Operations Economic Support Fund (ESF) and Development Assistance (DA) accounts. Funding for the ESF account and the DA account both increased compared to FY16 levels.8 The FY17 request included $1,000 million for MCC, an increase of $99 million (11%). Funding for FtF, GAFSP, FFP, and McGovern-Dole all decreased compared to FY16 levels (see Table 3).
Acronym List
AEECA
Assistance for Europe, Eurasia and Central Asia
CDC
Centers for Disease Control and Prevention
DoD
Department of Defense
DA
Development Assistance
DCOF
Displaced Children and Orphans Fund
ESF
Economic Support Fund
FP/RH
Family Planning and Reproductive Health
FtF
Feed the Future
FIC
Fogarty International Center
FFP
Food for Peace
GAFSP
Global Hunger and Food Security Initiative
GHP
Global Health Programs
GHSA
Global Health Security Agenda
MCC
Millennium Challenge Corporation
MCH
Maternal and Child Health
NIH
National Institutes of Health
NGOs
Non-Governmental Organizations
PAHO
Pan American Health Organization
PEPFAR
President’s Emergency Plan for AIDS Relief
PMI
President’s Malaria Initiative
SFOPs
State & Foreign Operations
TB
Tuberculosis
USAID
U.S. Agency for International Development
UNAIDS
Joint United Nations Programme on HIV/AIDS
UNICEF
United Nations Children’s Fund
UNFPA
United Nations Population Fund
WASH
Water, Sanitation and Hygiene
WHO
World Health Organization
Tables
Table 1: Comparison of Global Health Funding to International Affairs Budget, FY 2012 – FY 2017 (i)
FY12(millions)
FY13(millions)
FY14(millions)
FY15(millions)
FY16 Omnibus (millions)
FY17 Request (millions)
Global Healthii
$9,792
$9,571
$10,150
$10,135
$10,173
$10,269
of which International Affairs
$8,793
$8,607
$9,019
$9,028
$9,076
$9,137
International Affairsiii
$54,368
$51,906
$50,885
$51,865
$54,581
$54,147
of which Base (Enduring)
$43,165
$41,084
$44,365
$42,500
$39,685
$39,252
of which Overseas Contingency Operations (OCO)
$11,203
$10,822
$6,520
$9,365
$14,895
$14,895
Global Health share of International Affairs Budget (Base Funding)
20%
21%
20%
21%
23%
23%
NOTES:i – FY12 through FY15 are final funding amounts. FY16 and FY17 are preliminary estimates.ii – Global health funding provided through the Economic Support Fund (ESF) and Development Assistance (DA) accounts at USAID is not yet known for FY16. For comparison purposes, the FY16 global health total assumes that the ESF and DA accounts are funded at the lowest level between either the FY15 final or FY17 request amounts.iii – International Affairs is Function 150 Account only and includes both Base (Enduring) and Overseas Contingency Operations (OCO) funding. OCO has historically included some funding for global health programs, but this amount is not yet known for the FY15 or FY16. The majority of U.S. global health funding is provided as part of Base (Enduring) funding.
Table 2: U.S. Funding for Global Health Programs, FY 2016 – FY 2017 (i)
Department / Agency / Area
FY16 Omnibus (millions)
FY17 Request (millions)
Difference (millions, %)
USAID – Global Health Programs (GHP)
HIV/AIDS
$330.0
$330.0
$0(0%)
Tuberculosis
$236.0
$191.0
$-45(-19.1%)
Malariaii
$674.0
$745.0
$71(10.5%)
Neglected Tropical Diseases (NTDS)
$100.0
$86.5
$-13.5(-13.5%)
Global Health Securityiii
$72.5
$72.5
$0(0%)
Maternal & Child Health (MCH)
$750.0
$814.5
$64.5(8.6%)
of which GAVI
$235.0
$275.0
$40(17%)
of which Polio
$51.5
$49.7
$-1.8(-3.6%)
Nutrition
$125.0
$108.5
$-16.5(-13.2%)
Vulnerable Children
$22.0
$14.5
$-7.5(-34.1%)
Family Planning & Reproductive Health (FP/RH)iv
$524.0
$544.0
$20.1(3.8%)
Total USAID:
$2,833.5
$2,906.5
$73.1(2.6%)
State – Global Health Programs (GHP)
HIV/AIDS Bilateral
$4,320.0
$4,320.0
$0(0%)
of which UNAIDS
$45.0
$45.0
$0(0%)
Global Fund
$1,350.0
$1,350.0
$0(0%)
Total State:
$5,670.0
$5,670.0
$0(0%)
Total GHP – State & USAID
Total USAID & State GHP:
$8,503.5
$8,576.5
$73(0.9%)
State & Foreign Operations – Other Accounts
Family Planning & Reproductive Health (FP/RH)iv
$51.1
$41.0
$-10.1(-19.7%)
HIV
Not Yet Known
$0.2
–
Maternal & Child Health (MCH)
Not Yet Known
$105.2
–
Polio
$7.5
$2.0
$-5.5(-73.3%)
Nutrition
Not Yet Known
$46.4
–
Other Public Health Threats
Not Yet Known
Not Yet Known
–
Tuberculosis
Not Yet Known
$4.0
–
State & Foreign Operations – International Organizations & Programs (IO&P)
United Nations Children’s Fund (UNICEF)
$132.5
$132.0
$-0.5(-0.4%)
United Nations Population Fund (UNFPA)
$32.5
$35.0
$2.5(7.7%)
State & Foreign Operations – Contributions to International Organizations (CIO)
World Health Organization (WHO
$112.7
$113.1
$0.4(0.3%)
Pan American Health Organization (PAHO)
$64.5
$63.3
$-1.2(-1.9%)
National Institutes of Health (NIH)
HIV Research
$431.1
$431.9
$0.8(0.2%)
Malaria Research
$171.0
$171.0
$0(0%)
Fogarty International Center (FIC)
$70.4
$69.2
$-1.3(-1.8%)
Centers for Disease Control and Prevention (CDC)
Global HIV/AIDS
$128.4
$128.4
$0(0%)
Global Immunization
$219.0
$224.0
$5(2.3%)
Polio Eradication
$169.0
$174.0
$5(3%)
Other Global/Measles
$50.0
$50.0
$0(0%)
Parasitic Disease and Malaria
$24.5
$24.5
$0(0%)
Global Public Health Protection
$55.2
$65.2
$10(18.1%)
Global Disease Detection & Emergency Response
$45.4
Not Yet Known
–
Global Public Health Capacity Development
$9.8
Not Yet Known
–
Total CDC:
$427.1
$442.1
$15(3.5%)
Department of Defense (DoD)
HIV/AIDS
$8.0
$0.0
$-8(-100%)
Malaria
$5.3
$7.0
$1.6(30.9%)
Total Global Health Funding
Total Global Health Funding:i
$10,172.9
$10,269.4
$96.6(0.9%)
NOTES:i – FY15 and FY16 are preliminary estimates. Global health funding provided through the Economic Support Fund (ESF) and Development Assistance (DA) accounts at USAID is not yet known for FY16. For comparison purposes, the FY16 global health total assumes that the ESF and DA accounts are funded at the lowest level between either the FY15 final or FY17 request amounts.ii – In addition, the FY17 request proposes a transfer of $129.0 million in emergency Ebola funding, which was provided in the FY15 Omnibus bill (P.L. 113-235), to malaria programs.iii – Formerly Pandemic Influenza and Other Emerging Threats.iv – The FY16 Omnibus (P.L. 114-113) states that, of the funding appropriated for bilateral assistance, “not less than $575,000,000 should be made available for family planning/reproductive health,” and provides an additional $32.5 million as the U.S. contribution to UNFPA. In recent years, final FP/RH funding amounts have been greater than the amount specified in the annual appropriations bills. For instance, according to data on ForeignAssistance.gov, final FY15 funding for FP/RH totaled $621 million (includes both bilateral funding and the U.S. contribution to UNFPA).
Table 3: Other Related Non-Global Health Funding, FY 2016 – FY 2017
Department / Agency / Area
FY16 Omnibus (millions)
FY17 Request (millions)
Difference (millions, %)
Development Assistance (DA)
$2,781.0
$2,959.6
$178.6(6.4%)
Economic Support Fund (ESF)
$4,319.0
$6,080.6
$1761.6(40.8%)
of which Overseas Contingency Operations (OCO)
$2,422.7
$3,672.2
$1249.5(51.6%)
Assistance for Europe, Eurasia and Central Asia (AEECA)
$929.7
–
–
of which Overseas Contingency Operations (OCO)
$438.6
–
–
Feed the Future (FtF) Initiativei
$1,000.6
$978.0
$-22.6(-2.3%)
Global Agriculture and Food Security Program (GAFSP)ii
$43.0
$23.0
$-20(-46.5%)
McGovern-Dole International Food for Education and Child Nutrition Program
$201.6
$182.0
$-19.6(-9.7%)
Food for Peace (FFP-Title II)ii
$1,716.0
$1,350.0
$-366(-21.3%)
Millennium Challenge Corporation (MCC)
$901.0
$1,000.0
$99(11%)
NOTES:i – The FY16 Omnibus bill states that, of the funds appropriated for bilateral assistance, “not less than $1,000,600,000 should be made available for food security and agricultural development programs.”ii – According to the Explanatory Statement, the Omnibus bill provides $1,466 million for Food for Peace Title II Grants and “an additional one-time increase of $250,000,000 . . . [for] ongoing food assistance requirements as a result of growing conflicts throughout the world . . . [and] to respond to areas suffering from natural disasters.”
Endnotes
The international affairs budget is comprised of base funding, which supports enduring programs, and funding for Overseas Contingency Operations (OCO), which has been defined by the Administration as “extraordinary, but temporary” funding supporting efforts in Iraq, Afghanistan, and Pakistan (see Congressional Research Service, State, Foreign Operations, and Related Programs: FY2015 Budget and Appropriations, December 8, 2014). The global health funding from USAID and the State Department detailed in this analysis is part of base funding in the international affairs budget. In the FY17 request, the total international affairs budget (base and OCO) was $54.1 billion, a decrease of approximately $433.6 million from the FY16 enacted level. Base funding was $39.3 billion in the FY17 request, a decrease of $433.4 million from the FY16 enacted level, while OCO funding totaled $14.9 billion in the FY17 request, a $0.2 million decrease from the FY16 enacted level. ↩︎
The Assistance for Europe, Eurasia and Central Asia (AEECA) account was eliminated in FY13. Funding provided through this account was incorporated into other accounts (e.g. GHP and ESF). The FY16 Omnibus reconstituted the Assistance for Europe, Eurasia, and Central Asia (AEECA) account, which had historically provided additional funding for TB, however, AEECA funding for TB programs in FY16 is not yet known. The FY17 request eliminates the AEECA account. ↩︎
The FY17 request included $137.6 million in TB funding provided through bilateral HIV programs (GHP account) at the State Department (see U.S. Department of State, Congressional Budget Justification, Foreign Operations, Appendix 2, February 26, 2016). TB funding provided through bilateral HIV programs (GHP account) at the State Department is not known for prior years. ↩︎
FY16 Omnibus (P.L. 114-113) bill states that, of the funding appropriated for bilateral assistance, “not less than $575,000,000 should be made available for family planning/reproductive health” ($524 million through the GHP account and $51 million through other accounts such as ESF and/or AEECA). ↩︎
U.S. funding for UNFPA is provided through the International Organizations and Programs (IO&P) account at the State Department. ↩︎
U.S. funding for UNICEF is provided through the International Organizations and Programs (IO&P) account at the State Department. ↩︎
WASH is considered a cross-cutting issue that receives funding from multiple accounts through both direct appropriations and as part of funding provided to other program areas (e.g. HIV and MCH). Since the FY16 Omnibus bill did not specify the accounts and program areas used to reach the $400 million in WASH funding, this amount was not included in overall global health funding totals in order to prevent double-counting of funding. ↩︎
The Assistance for Europe, Eurasia and Central Asia (AEECA) account was eliminated in FY13. Funding provided through this account was incorporated into other accounts (e.g. GHP and ESF). The FY16 Omnibus reconstituted the Assistance for Europe, Eurasia, and Central Asia (AEECA) account, which had historically provided additional funding for TB, however, AEECA funding for TB programs in FY16 is not yet known. The FY17 request eliminates the AEECA account. ↩︎
The majority of nonelderly people get their health coverage through an employer-based plan. This issue brief uses data from the National Health Interview Survey (NHIS) to examine trends in employer-sponsored health insurance (ESI) for different types of people and households.1 While ESI remains the leading source of coverage for nonelderly people (those under age 65), the percentage covered by an employer plan has declined over the last fifteen years. A similar pattern exists with firm offer rates; fewer workers were offered health insurance from their employer in 2014 than in 1999. The decrease in offer and coverage rates has not been universal; families with low and modest incomes have been most affected by the decline. While coverage rates have declined over time, the percentage of the nonelderly population covered by ESI is similar between 2013 and 2014.
Both the percentage of employers who offer insurance and the percentage of people covered will be important to watch as the changes brought about by the Affordable Care Act (ACA) continue to unfold. New coverage provisions and financial assistance provided in the ACA affect employers’ decision to offer coverage and employees’ decisions to take up any coverage they are offered at work. The employer shared responsibility provision, for example, requires employers with 50 or more full-time equivalent employees to offer coverage to full-time employees and their dependent children or face a financial penalty. This provision should tend to expand the number of workers offered coverage in these firms, and, because most individuals are required to have health insurance or pay a penalty (the individual responsibility provision), more workers may take up the coverage offered at work. At the same time, new coverage options and financial assistance available through health insurance marketplaces may encourage some small employers (who are exempt from the employer shared responsibility provisions) to stop offering health benefits if they feel that their employees would be better off getting coverage through the marketplaces.2 Larger employers may also reconsider who they offer coverage to; some may stop offering coverage to part-time workers so those workers are eligible to receive a subsidy on the marketplaces. The percentage of people who received coverage through an employer sponsored plan in 2014 remained similar to the coverage rates in 2010, the year of the ACA’s passage.
Trends in offer rates
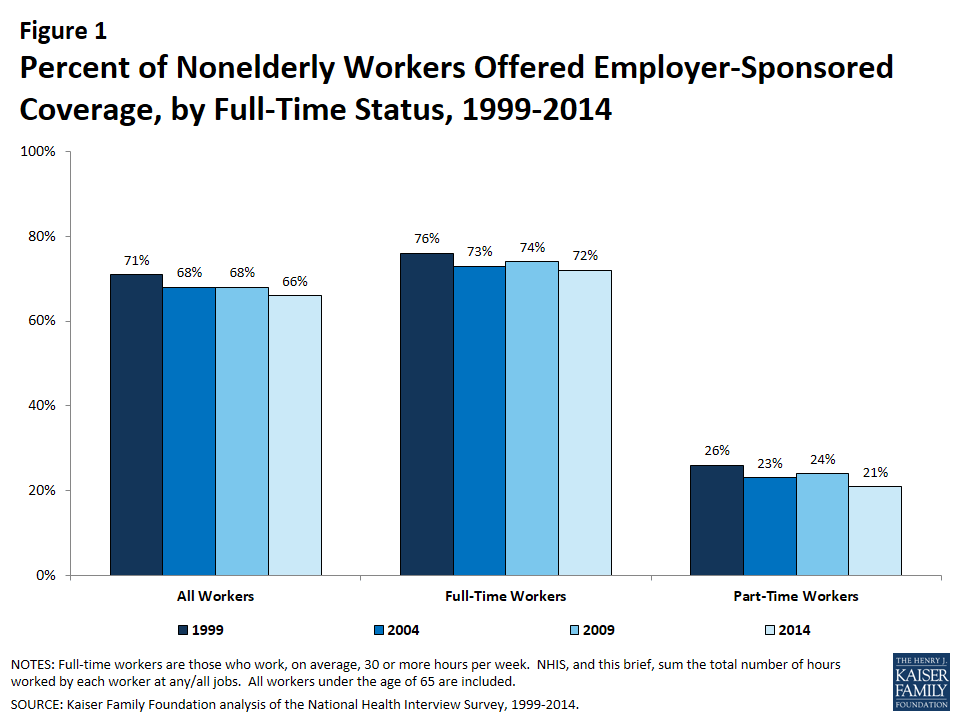
In 2014, 66% of nonelderly workers received an offer of coverage from their employer; less than the 71% offer rate in 1999 (Figure 1). ESI offer rates vary by workers’ full-time status. Employees who worked part time (less than 30 hours a week at all their jobs) were less likely to be offered coverage from their employer than were employees who worked full time (30 or more hours a week) (21% vs. 72%).
Figure 1: Trends in Employer-Sponsored Insurance Offer and Coverage Rates, 1999-2014
Offer rate differences by income
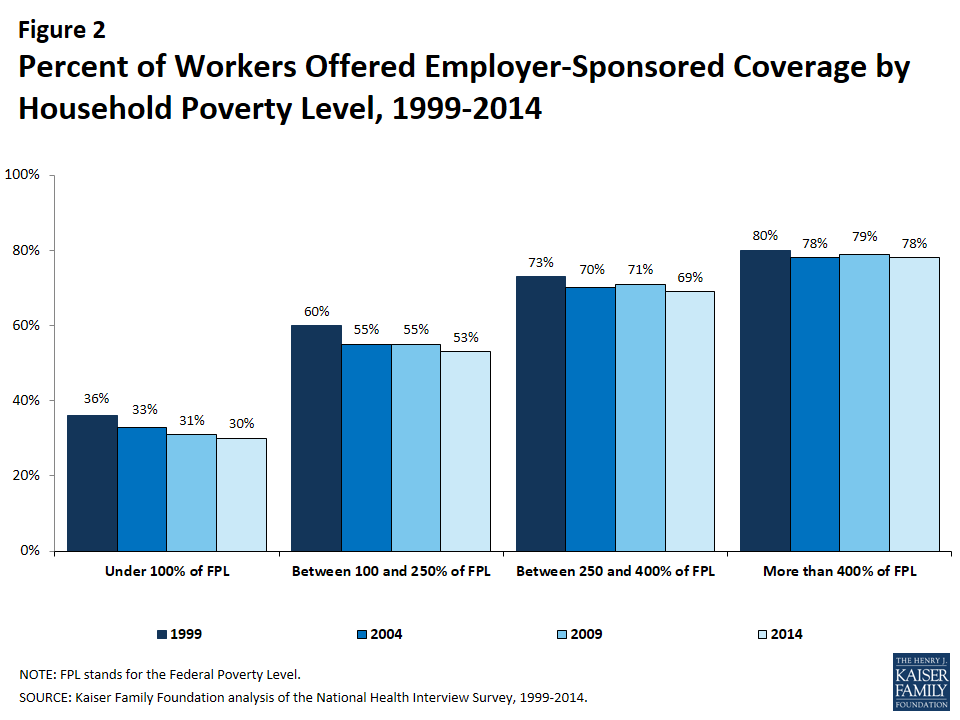
There are differences in ESI offer rates based on household income (Figure 2). Workers in higher income households, (those that earn more than four times the federal poverty level (FPL)) are most likely to receive an offer of ESI (78%), whereas workers in households with lower incomes (those that earn less than the FPL) are least likely to receive an offer of ESI (30%).
Since 2004, offer rates have remained stable for workers in households over 400% of the FPL, but have decreased for households below the poverty line (Figure 2). The percentage of workers offered employer sponsored coverage has decreased from 1999 to 2014 for all income groups.
Figure 2: Percent of Workers Offered Employer-Sponsored Coverage by Household Poverty Level, 1999-2014
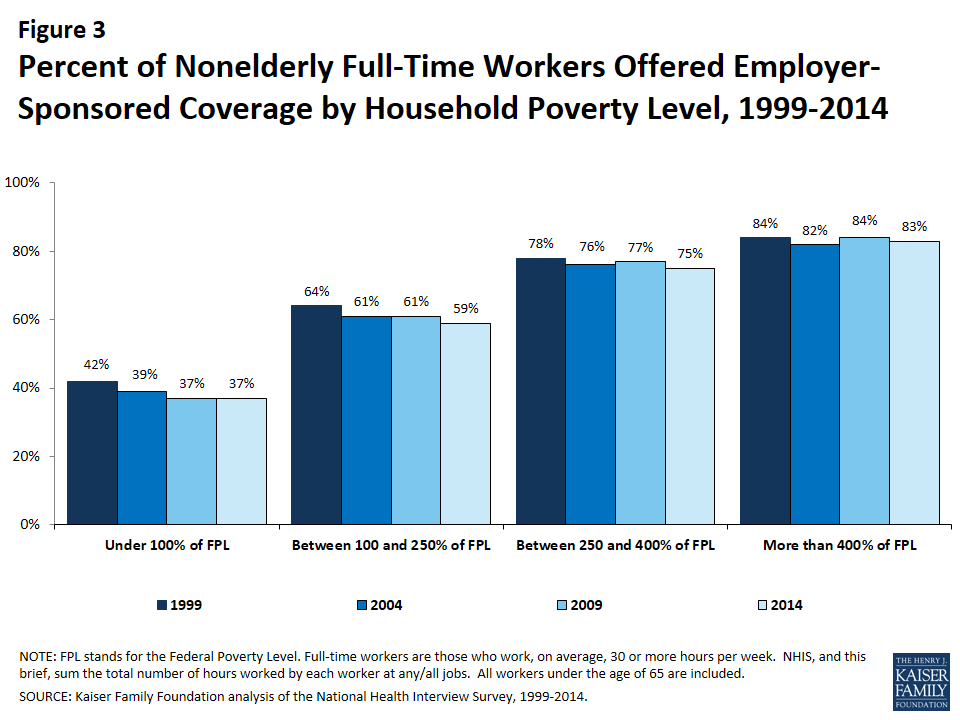
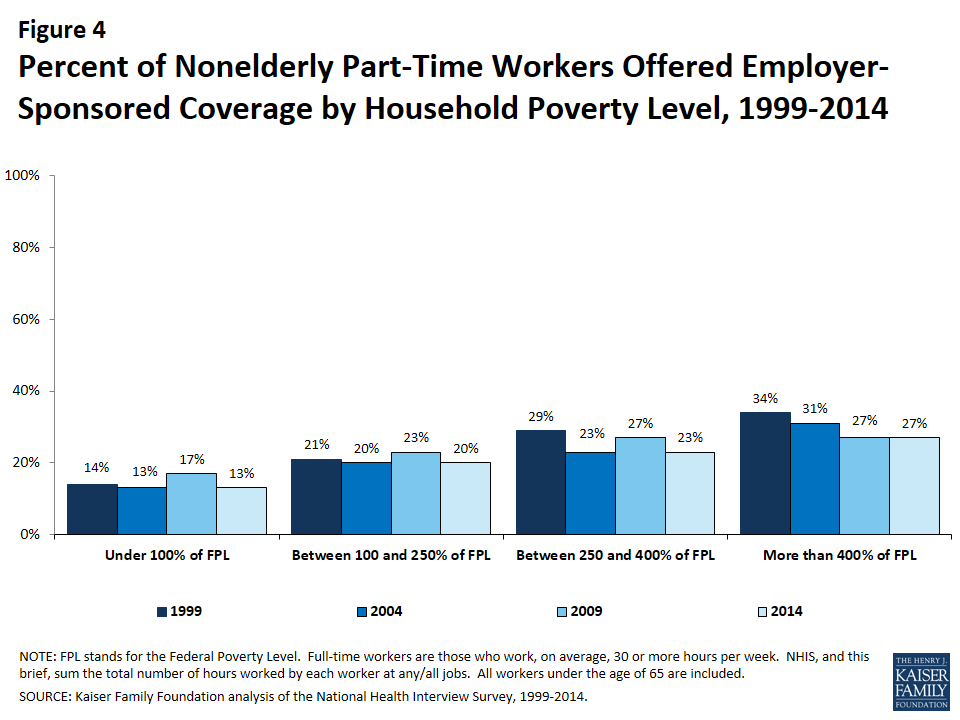
A similar pattern exists for both full-time workers and part-time workers; workers in higher income households are more likely to have an offer of employer coverage than workers in a household earning less than 100% of the FPL (Figures 3 and 4).
Figure 3: Percent of Nonelderly Full-Time Workers Offered Employer-Sponsored Coverage by Household Poverty Level, 1999-2014Figure 4: Percent of Nonelderly Part-Time Workers Offered Employer-Sponsored Coverage by Household Poverty Level, 1999-2014
Trends in coverage rates
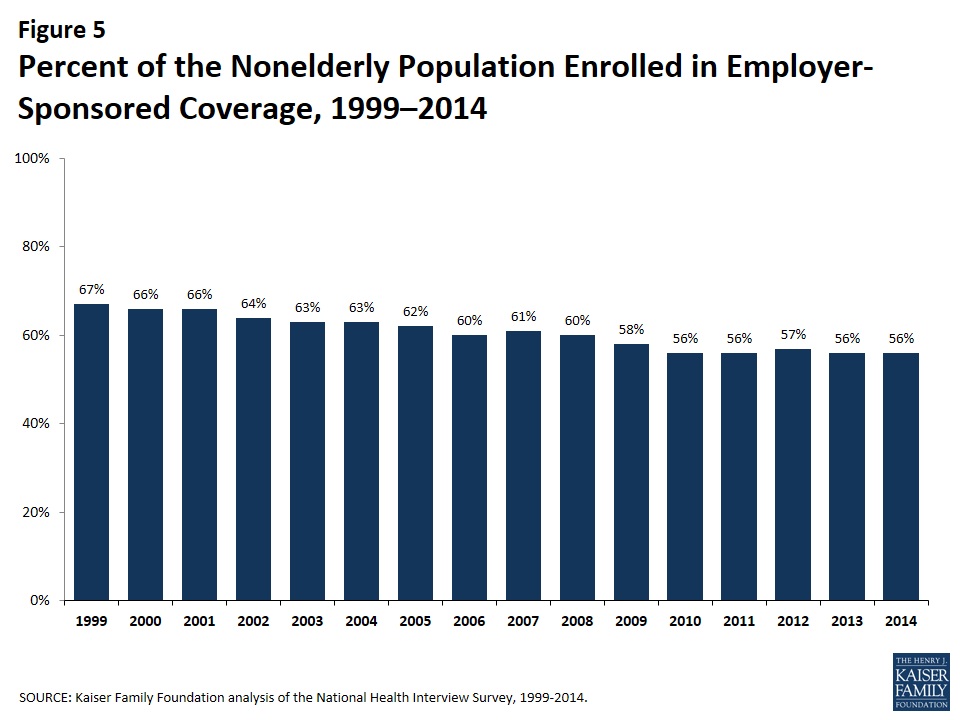
In addition to looking at the percentage of workers who are offered benefits, we can look at the percentage of the nonelderly population that is covered by ESI (Figure 5).3 Not all workers who are offered coverage accept their employer’s benefits, and many nonelderly people (with or without a job) receive coverage as a dependent on a family member’s plan. In 2014, 56% of nonelderly people were covered by ESI, similar to recent years, but a decline from the 67% covered by ESI in 1999. A variety of factors may contribute to this decline. First, changes in the economy and labor market; for example, a decrease in the percentage of people employed, known as the labor market participation rate, will decrease the percentage of individuals eligible for employer coverage.4,5 In 2014, people in families with a full-time worker were more likely to be covered by ESI (63%) than those in a family without a full-time worker (26%). In addition to changes in the labor market, employer coverage may also be less prevalent because fewer employers are offering coverage; in 2014, a smaller percentage of firms offered coverage than in 1999 (55% vs. 66%),6 and a smaller percentage of workers at firms offering benefits were covered by those benefits (62% vs. 66%).7
Figure 5: Percent of the Nonelderly Population Enrolled in Employer-Sponsored Coverage, 1999–2014
There is considerable interest in how employers and individuals alike will respond to changes brought on by the ACA. Beginning in 2014, millions of individuals enrolled in private health insurance subsidized with premium tax credits. As of yet, the NHIS data do not show that employer coverage is diminishing in its importance. The same percentage of the nonelderly households were covered by ESI in 2014 as in 2010 (56%).
Coverage differences by income
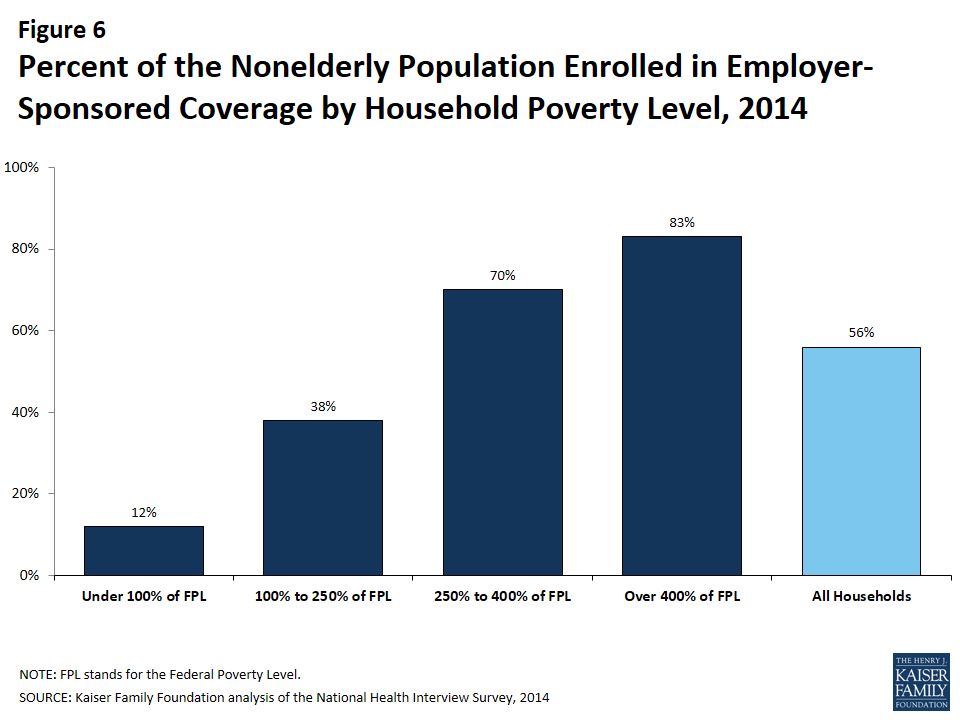
There are important differences in who is covered by ESI based on a household’s income. Employer-sponsored coverage remains the main source of coverage for people in higher-income households while substantially fewer people in lower-income families are covered by an employer (Figure 6). Eighty-three percent of nonelderly people in families that earn more than four times the FPL are enrolled in employer coverage.8 Households at more than four times the FPL earn different incomes depending on a family’s composition; for example, in 2014, a single nonelderly adult would earn about $49,000 and a family of four including two children would earn about $96,000.9
Figure 6: Percent of the Nonelderly Population Enrolled in Employer-Sponsored Coverage by Household Poverty Level, 2014
People in families with lower incomes are less likely to be covered by an employer. The ACA aims to provide alternate health coverage options for this population. For example, people who are not offered affordable coverage options and are in families earning between 100 and 400% of the FPL can qualify for premium subsidies through the ACA’s health insurance exchanges.10 Households between 100 and 250% of the FPL are eligible for additional cost-sharing subsidies. Only 38% of people in families earning between 100 and 250% of the FPL are covered by ESI. However, 70% of individuals in families earning between 250 and 400% of the FPL are covered through ESI. Overall, people in families whose income qualifies them for subsidies on the health insurance exchanges are less likely to be covered through an employer plan than those in households whose income does not qualify them for subsidies.11 Among households that earn too little to qualify for any subsides (those making less than 100% of the FPL), 12% of individuals are covered by ESI.12
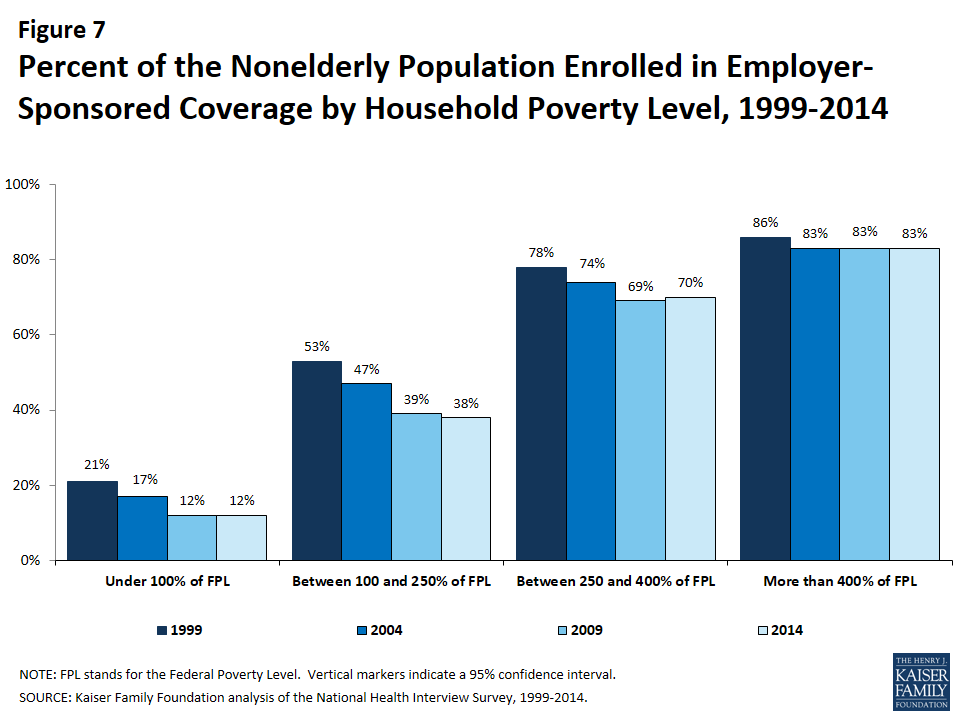
While the percentage of individuals covered by ESI has decreased, the decline has been more precipitous among lower income families (Figure 7). Comparing 2004 to 2014, there has been no change in the percentage of individuals covered by ESI in families earning more than 400% of the FPL. Alternatively, the percentage of individuals covered by ESI in households earning 100 to 250% of the FPL has decreased from 47% in 2004 to 38% in 2014. Similarly, for those in families between 250 and 400% of the FPL, the percentage covered by ESI has decreased from 74% in 2004 to 70% 2014. These trends indicate that there has been relative stability in ESI enrollment for higher-income households. Since 1999, the decrease in the percentage of nonelderly people covered by ESI has been slower for households above 400% of the FPL than households earning between 100 and 250% or between 250 and 400% of the FPL.
Figure 7: Percent of the Nonelderly Population Enrolled in Employer-Sponsored Coverage by Household Poverty Level, 1999-2014
There have not been significant changes recently in the percentage of people covered by ESI based on income; a similar percentage of people have been covered by ESI for households in each of the income groups between 2009 and 2014. Since 2013, there has not been a significant change in the percentage of people covered by ESI within any of the household income groups.
Coverage Differences by Age
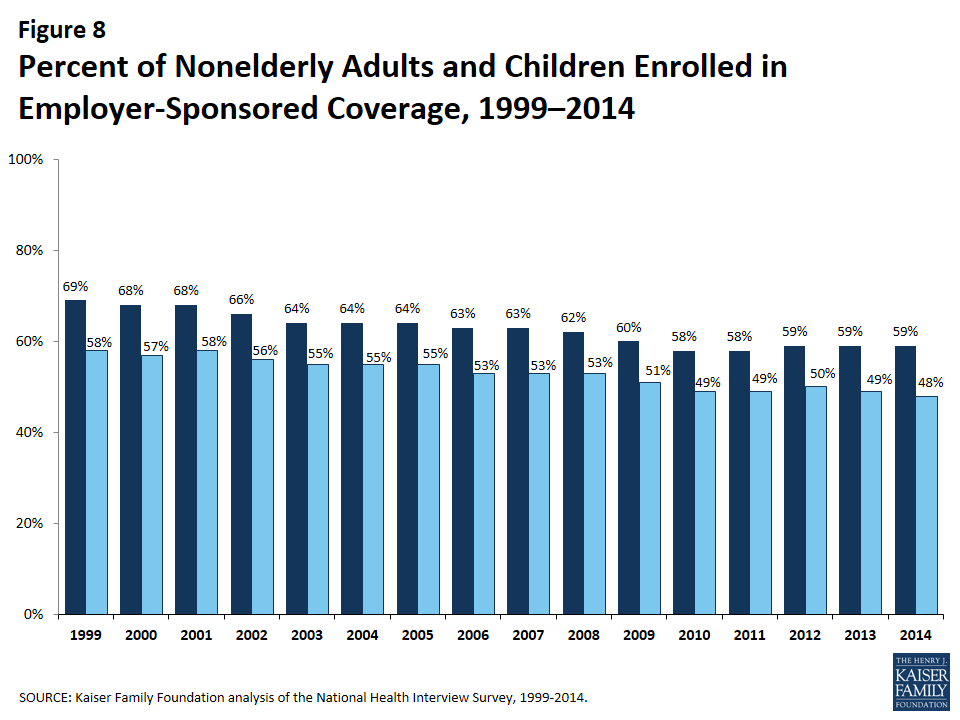
ESI is a more prevalent source of coverage for adults than children (Figure 8). In 2014, 59% of nonelderly adults (ages 19 to 64) were covered by ESI compared to half of children under 19. The percentage of both nonelderly adults and children covered by ESI has decreased since 1999. There are important differences by income; 86% of children in households above 400% of the FPL are covered by employer coverage compared to 6% of children in households under 100% of the FPL and 35% of children between 100 and 250% of the FPL. The percentage of both nonelderly adults and children covered by ESI has decreased since 1999. The growth in public programs, namely State Children’s Health Insurance Program (SCHIP), plays an important role in coverage for children.
Figure 8: Percent of Nonelderly Adults and Children Enrolled in Employer-Sponsored Coverage, 1999–2014
Conclusion
Employer-sponsored coverage became the central component of the American health insurance system for a variety of reasons, including the tax preference of employer’s spending on health benefits over wages, as well as the advantages of purchasing coverage as a group rather than as individuals. Many employers and employees continue to believe that offering health benefits is an important way for firms to recruit, retain and value talent. With employers facing rising costs, many commentators are speculating about the long-term stability of the employer-sponsored insurance system.
While employer-sponsored coverage remains the most common source of healthcare coverage, a smaller proportion of people are covered by employers than a decade ago. Estimates from the non-partisan Congressional Budget Office (CBO) suggest that employer coverage will remain the leading source of insurance coverage for nonelderly Americans even after the ACA is fully implemented.13 At the same time, changes in the American workforce and economy will continue to impact employer coverage. Health reform has expanded coverage to the uninsured while providing incentives for employers to continue to offer benefits (such as tax credits for small employers who offer coverage and penalties for large employers who do not). How employers respond to increasing costs and regulatory changes will, in part, determine how people receive coverage in the years to come.
Gary Claxton, Matthew Rae, and Michelle Long are with the Kaiser Family Foundation. Anthony Damico is an independent consultant to the Kaiser Family Foundation.
Endnotes
The National Health Interview Survey (NHIS) is a national probability survey of American Households sponsored annually by the U.S. Census Bureau and the Center for Disease Control and Prevention (CDC). Although NHIS was started in 1957, the survey was redesigned in 1997; therefore, in most cases, this analysis uses the years 1999 through 2014. For more information on NHIS, please see http://www.cdc.gov/nchs/nhis.htm. ↩︎
While individuals who are offered coverage that meets minimum value and affordability requirements may purchase coverage on the health insurance exchanges, they are not eligible for advanced premium tax credits or cost-sharing subsidies. ↩︎
Individuals covered by Tricare are included among those with ESI. Some individuals have multiple types of coverage; individuals who are covered by a Medicaid or Medicare Part B in addition to an employer plan are not included. Individuals who are covered by Medicare Part A and an employer plan are assumed to have ESI as their primary coverage (less than 1% in 2014). Regardless of secondary coverage source, 57% of non-elderly people are covered by ESI. ↩︎
Reschovsky, James, Strunk, Bradley, and Ginsburg, Paul. “Why Employer-Sponsored Insurance Coverage Changed, 1997–2003.” Health Affairs. May 2006 vol. 25 no. 3774-782. ↩︎
This analysis uses the U.S. Census Bureau’s definition of families and poverty thresholds. In 2014, the federal poverty threshold was $24,008 for a family of four including two children. “Poverty Thresholds 2014.” U.S. Census Bureau. Social, Economic, and Housing Statistics Division. https://www.census.gov/hhes/www/poverty/data/threshld/.↩︎
It is important to note that NHIS uses the Census Bureau’s federal poverty thresholds, while HHS and this portion of the brief use federal poverty guidelines to determine eligibility for some public assistance programs. ↩︎
A person’s family poverty threshold is often, but not always, the same as his or her exchange marketplace eligibility level, which is based on the federal poverty guidelines. ↩︎
In states that elected to expand Medicaid to the federal maximum, households up to 138% of the FPL will be eligible for Medicaid. Only households between 100 and 400% of the FPL are eligible for exchange subsidies. For more information on premium subsidies please see “Explaining Health Care Reform: Questions About Health Insurance Subsidies.” Kaiser Family Foundation, October 2014. https://modern.kff.org/health-reform/issue-brief/explaining-health-care-reform-questions-about-health/. ↩︎