Medicare Spending at the End of Life: A Snapshot of Beneficiaries Who Died in 2014 and the Cost of Their Care

Authors: Juliette Cubanski, Tricia Neuman, Shannon Griffin, and Anthony Damico
Published: Jul 14, 2016

Introduction

Of the 2.6 million people who died in the U.S. in 2014,1  2.1 million, or eight out of 10, were people on Medicare,2  making Medicare the largest insurer of medical care provided at the end of life. Spending on Medicare beneficiaries in their last year of life accounts for about 25% of total Medicare spending on beneficiaries age 65 or older.3  The fact that a disproportionate share of Medicare spending goes to beneficiaries at the end of life is not surprising given that many have serious illnesses or multiple chronic conditions and often use costly services, including inpatient hospitalizations, post-acute care, and hospice, in the year leading up to their death.

This data note provides a snapshot of Medicare beneficiaries who died at some point in 2014 and spending at the end of life. It examines Medicare per capita spending in 2014 and trends since 2000, both overall and by type of service, for beneficiaries in traditional Medicare who died at some point during the year (referred to here as “decedents”) compared to those who lived for the entire year (referred to here as “survivors”). The analysis includes beneficiaries who are under age 65 with disabilities, those who qualified for Medicare due to having end-stage renal disease, and those who are age 65 or older.4  The analysis of per capita spending excludes beneficiaries enrolled in Medicare Advantage because data on Medicare spending, overall and by type of service, are not available for these enrollees.5  The analysis is based on data from a 5% sample of Medicare claims for services covered under Parts A, B, and D for traditional Medicare beneficiaries from the Centers for Medicare & Medicaid Services (CMS) Chronic Conditions Data Warehouse (CCW) from 2000 to 2014.

Findings

What are the characteristics of medicare beneficiaries who died at some point in 2014?

More than half of Medicare decedents were age 80 or older in 2014.

  • Of the more than 2.1 million Medicare beneficiaries who died at some point in 2014—representing 4.0% of the total Medicare population that year—over half (55%) were age 80 or older, which is more than double their share of the Medicare population overall (22%) (Figure 1). Just over half (52%) of decedents were women and eight out of 10 were non-Hispanic white (81%), roughly comparable to their shares of the overall Medicare population (54% and 77%, respectively).
Figure 1: More than half of Medicare beneficiaries who died at some point in 2014 were age 80 or older
  • More than seven in 10 (72%, or 1.5 million) Medicare decedents were in traditional Medicare in 2014, and the remainder (28%, or 0.6 million) were enrolled in Medicare Advantage plans, reflecting overall enrollment patterns in traditional Medicare and Medicare Advantage.
  • Diseases that were highly prevalent among decedents in traditional Medicare in 2014 include hypertension (67%), ischemic heart disease (53%), chronic kidney disease (51%), congestive heart failure (48%), Alzheimer’s disease or dementia (43%), diabetes (38%), and cancer (17%). The prevalence of each of these conditions was higher among beneficiaries who died at some point in 2014 than among beneficiaries overall, in some cases substantially higher (Table 1). For example, more than 4 in 10 decedents had Alzheimer’s or dementia, compared to only 9% of beneficiaries overall, and more half of decedents had ischemic heart disease, compared to one fourth of beneficiaries overall.

How does medicare per capita spending differ for decedents and survivors in 2014 and over time?

Average total Medicare per capita spending was nearly four times higher for beneficiaries in traditional Medicare who died at some point in 2014 than for those who lived the entire year.
  • Average Medicare per capita spending on services covered under Parts A, B, and D for traditional Medicare beneficiaries who died at some point in 2014 was $34,529—nearly four times higher than per capita spending for survivors ($9,121) and more than three times higher than the average among all beneficiaries in traditional Medicare ($10,126) (Figure 2).
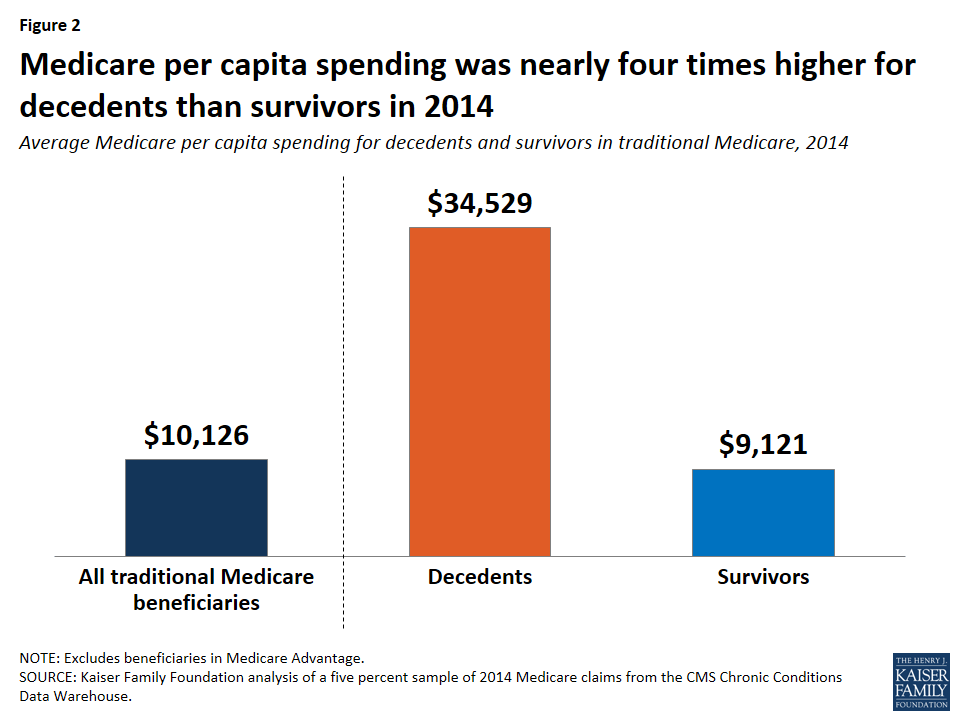
Figure 2: Medicare per capita spending was nearly four times higher for decedents than survivors in 2014
  • In 2014, beneficiaries who died at some point during the year accounted for 4% of all beneficiaries in traditional Medicare, but 13.5% of traditional Medicare spending. This amount is disproportionate to the decedent share of beneficiaries overall, but it accounts for a relatively small share of total spending that year. This estimate is lower than the 25% estimate cited earlier because it is based on Medicare spending for people who died at some point in a given calendar year (in this case, 2014), rather than the last 12 months of spending for people who died.6 
The share of total traditional Medicare spending on beneficiaries who died at some point during the year has decreased over time.
  • The share of total traditional Medicare spending on beneficiaries who died at some point during the year has dropped over time, from 18.6% in 2000 to 13.5% in 2014 (Figure 3). This drop is likely due to a combination of factors affecting total traditional Medicare spending over time and spending on decedents, including: growth in the number of Medicare beneficiaries overall, particularly in recent years as the baby boom generation ages on to Medicare, which means more younger, healthier beneficiaries, on average; longer life expectancy, which means people are living longer and dying at older ages (as seen in a decline in the share of traditional Medicare beneficiaries who die at some point in a given year—from 4.9% in 2000 to 4.0% in 2014); lower average per capita spending on older decedents compared to younger decedents (as described further below); and slower growth in the rate of annual per capita spending for decedents than survivors (also described further below).
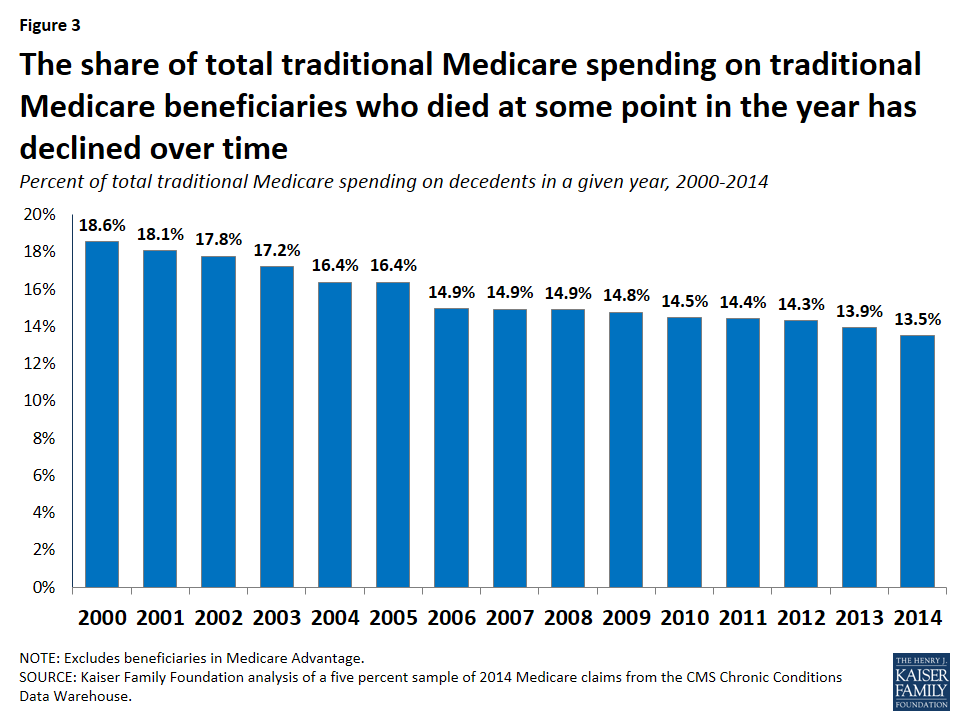
Figure 3: The share of total traditional Medicare spending on traditional Medicare beneficiaries who died at some point in the year has declined over time
Between 2000 and 2014, the annual rate of growth in average Medicare per capita spending was lower among decedents than survivors.
  • Average Medicare spending among decedents was 80% higher per person in 2014 ($34,529) than in 2000 ($19,130), while average spending among survivors more than doubled between 2000 and 2014, from $4322 to $9,121 (Figure 4).
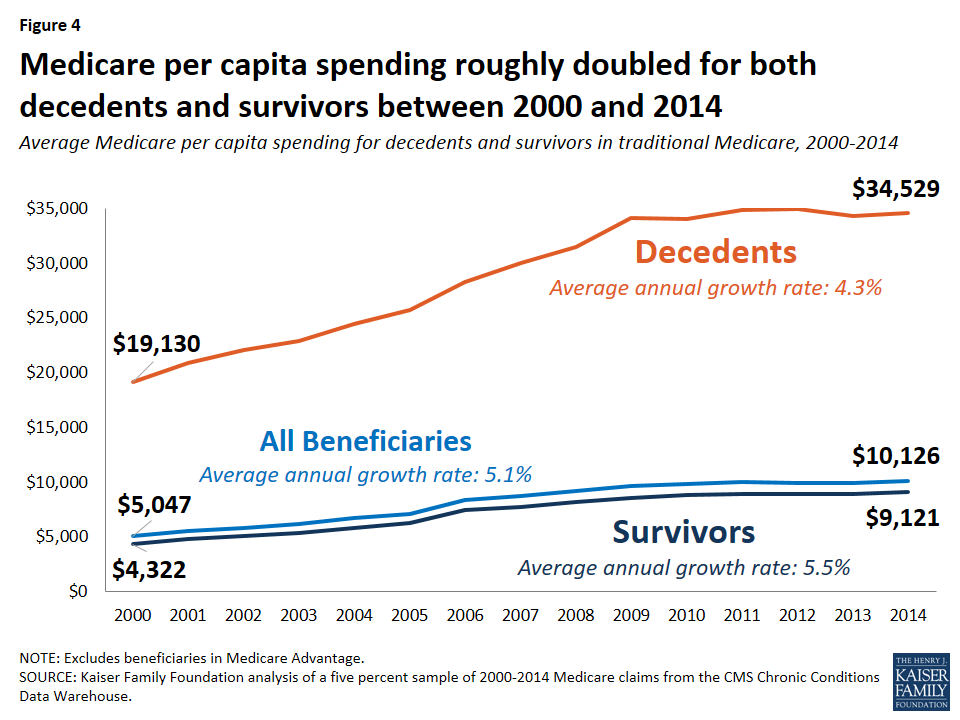
Figure 4: Medicare per capita spending roughly doubled for both decedents and survivors between 2000 and 2014
  • Although average per capita spending was higher for decedents than survivors in each year between 2000 and 2014, the average annual rate of growth in spending over this time period was lower for decedents (4.3%) than for survivors (5.5%).

What services account for the difference in medicare per capita spending between decedents and survivors?

Higher Medicare per capita spending among decedents than survivors in traditional Medicare is primarily driven by much higher spending on inpatient hospital services.
  • Spending on inpatient hospital services accounted for the largest amount of per capita Medicare spending by type of service among decedents in traditional Medicare in 2014 (Figure 5; Table 2), and was the primary reason for the substantial difference in spending between decedents and survivors. Per capita inpatient hospital spending among decedents was $17,574 in 2014, on average, seven times higher than among survivors ($2,497). Decedents also incurred much higher spending on post-acute care (skilled nursing facility (SNF) and home health services) and hospice care than survivors in 2014.
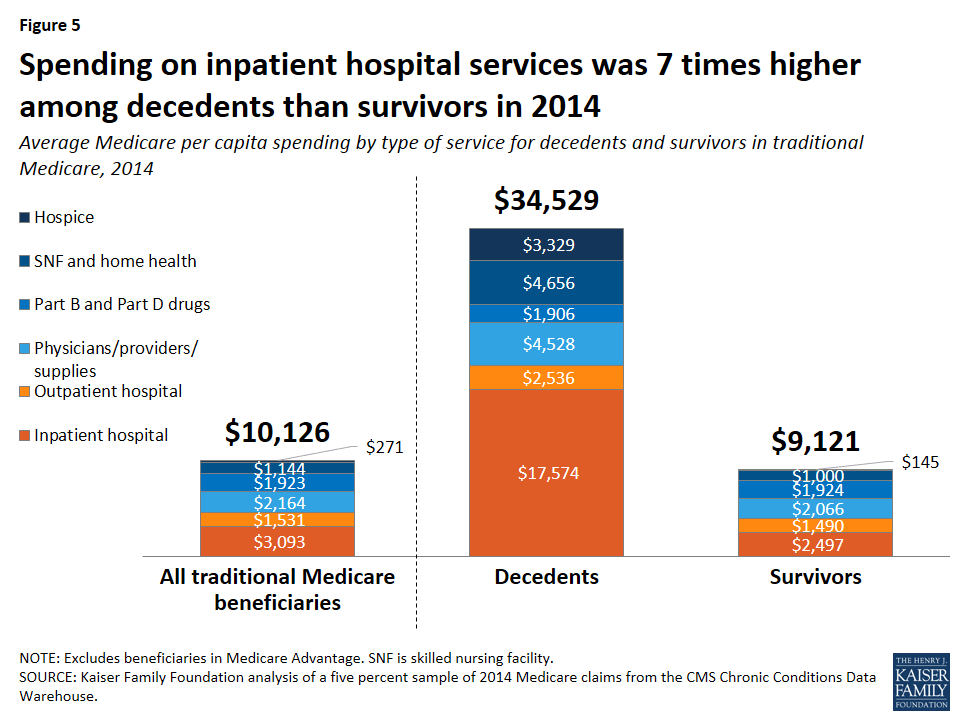
Figure 5: Spending on inpatient hospital services was 7 times higher among decedents than survivors in 2014
  • Inpatient hospital services accounted for the largest share of average Medicare per capita spending by type of service for traditional Medicare beneficiaries overall in 2014 (31%), but the share of per capita spending on inpatient hospital services was particularly large for decedents, accounting for just over half (51%) of total spending in 2014 (Figure 6).
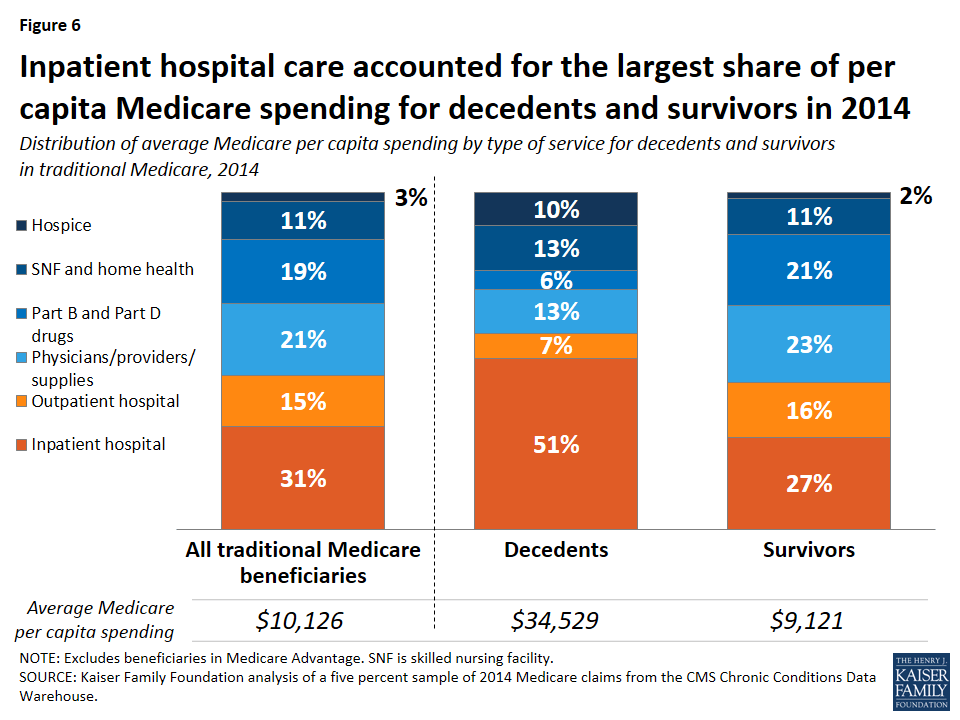
Figure 6: Inpatient hospital care accounted for the largest share of per capita Medicare spending for decedents and survivors in 2014
  • For decedents, the next largest service categories were physicians, providers, and supplies combined and post-acute care (skilled nursing facilities and home health services), at 13% each, followed by hospice care (10%). For surviving beneficiaries in traditional Medicare, inpatient hospital services accounted for 27% of total per capita Medicare spending in 2014, followed closely by spending on physicians/providers/supplies (23%) and Part B and Part D prescription drugs (21%).

How does Medicare per capita spending differ for decedents under and over age 65, and what accounts for the difference in spending?

Medicare per capita spending was higher for decedents under age 65 in 2014 than for those over age 65.
  • Among decedents in traditional Medicare in 2014 who were younger than age 65, Medicare per capita spending was $41,950, on average (Figure 7). This amount is 25% more than average per capita spending among decedents over age 65 in 2014 ($33,676).
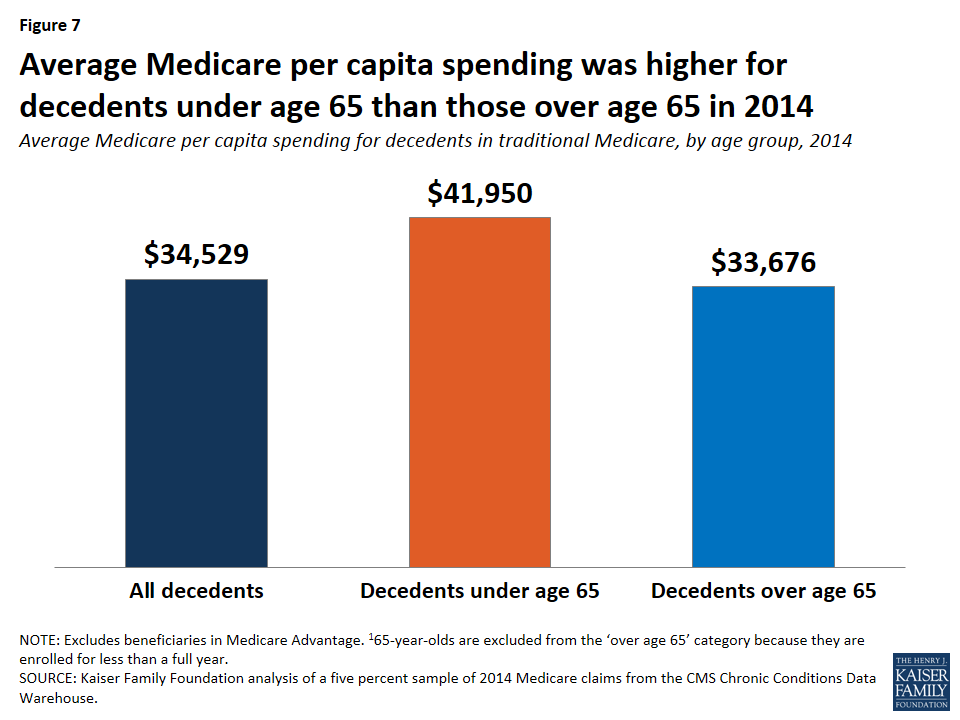
Figure 7: Average Medicare per capita spending was higher for decedents under age 65 than those over age 65 in 2014
  • The fact that Medicare per capita spending is higher for decedents under age 65 than those over age 65 is related to the fact that a larger share of traditional Medicare beneficiaries under age 65 who died at some point in 2014 is dually eligible for Medicare and Medicaid than of decedents who are over age 65, and their Medicare per capita spending is significantly higher, on average, than dually eligible beneficiaries over age 65. Among dually eligible decedents in 2014, average Medicare per capita spending among those under age 65 was $51,997, compared to $36,037 among those over age 65.
  • In terms of Medicare spending by type of service, higher per capita spending among decedents under age 65 than among those over age 65 was driven by higher spending on inpatient hospital services ($24,515 versus $16,701, respectively), along with higher spending on outpatient hospital, physician/providers/supplies, and Part B/D prescription drugs (Figure 8). By contrast, among decedents over age 65, spending was higher on post-acute care and hospice care.
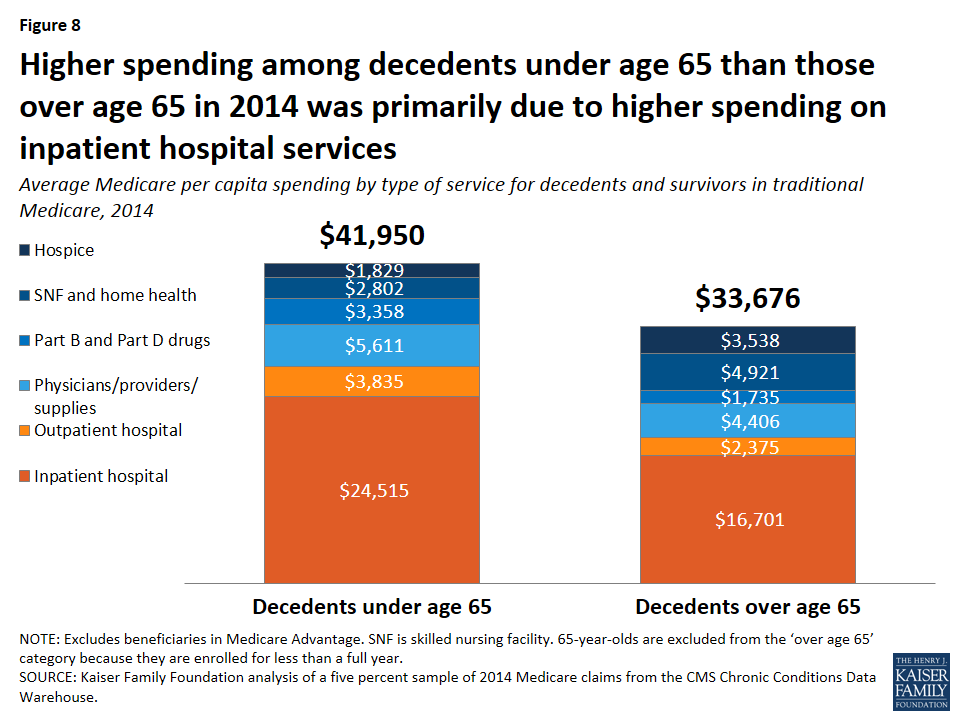
Figure 8: Higher spending among decedents under age 65 than those over age 65 in 2014 was primarily due to higher spending on inpatient hospital services

How does medicare per capita spending differ among decedents over age 65?

Per capita Medicare spending generally declines with age among decedents in traditional Medicare who are over age 65.
  • Among decedents over age 65, Medicare per capita spending was highest for those in their early 70s and then declined with each year of age in 2014 (Figure 9). Among survivors over age 65, the opposite pattern occurred, with spending rising steadily with each year of age in 2014.
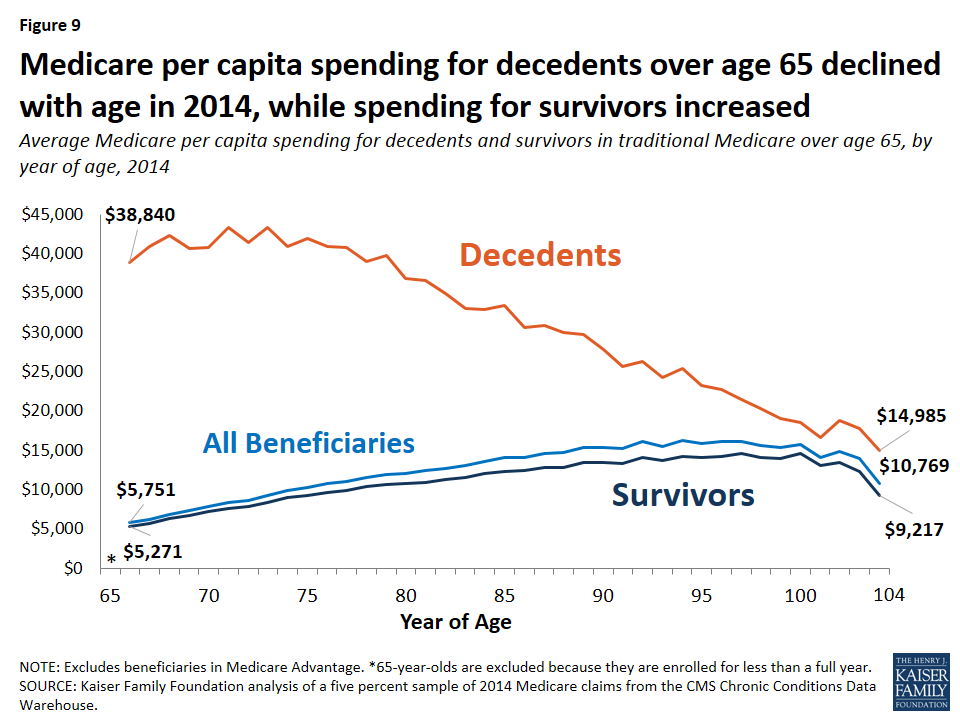
Figure 9: Medicare per capita spending for decedents over age 65 declined with age in 2014, while spending for survivors increased

What services account for the difference in spending by age among decedents over age 65?

The decline in Medicare per capita spending by age for decedents over age 65 in 2014 was mainly due to lower inpatient spending.
  • Per capita Medicare spending on inpatient hospital services decreased steadily with age among decedents in 2014 (Figure 10; Table 3), declining from more than $20,000 for decedents in their late sixties and seventies to around $10,000 or less among decedents older than age 90. In contrast, per capita spending for hospice services increased with age among decedents, from around $2,000 to $5,000 or more between the ages of 66 and 100. Spending on post-acute care (SNF and home health) also increased with advancing age.
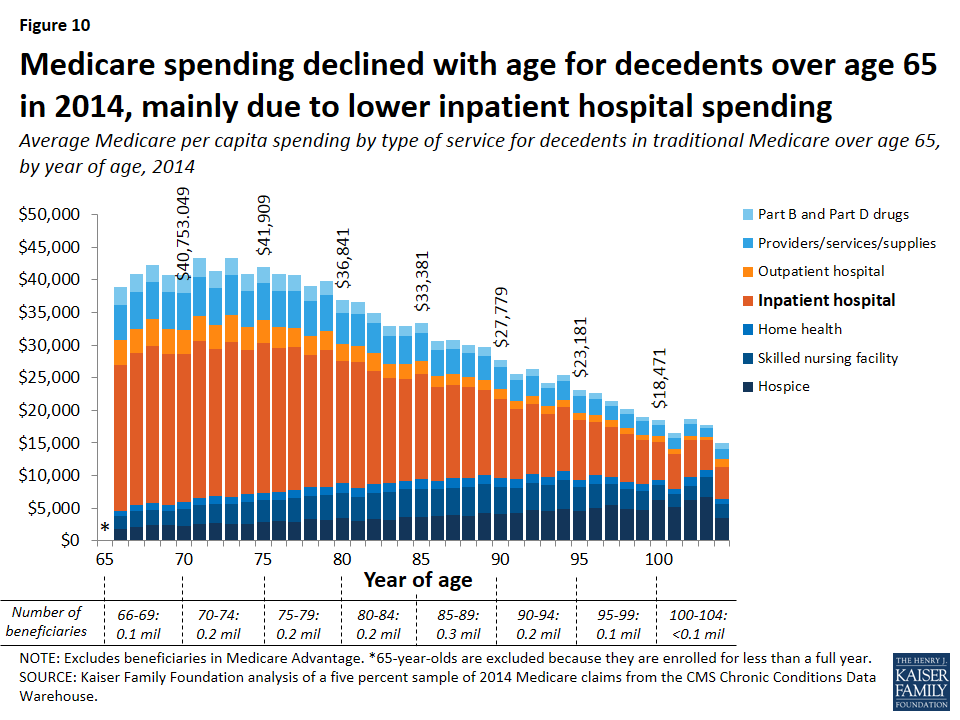
Figure 10: Medicare spending declined with age for decedents over age 65 in 2014, mainly due to lower inpatient hospital spending
  • In contrast, spending increased with each year of age among survivors over age 65 in 2014, primarily due to increasing spending on post-acute and hospice care (Figure 11; Table 4). Inpatient hospital care was the costliest type of service for survivors in traditional Medicare up to the early nineties, after which age spending on post-acute care was the largest amount.
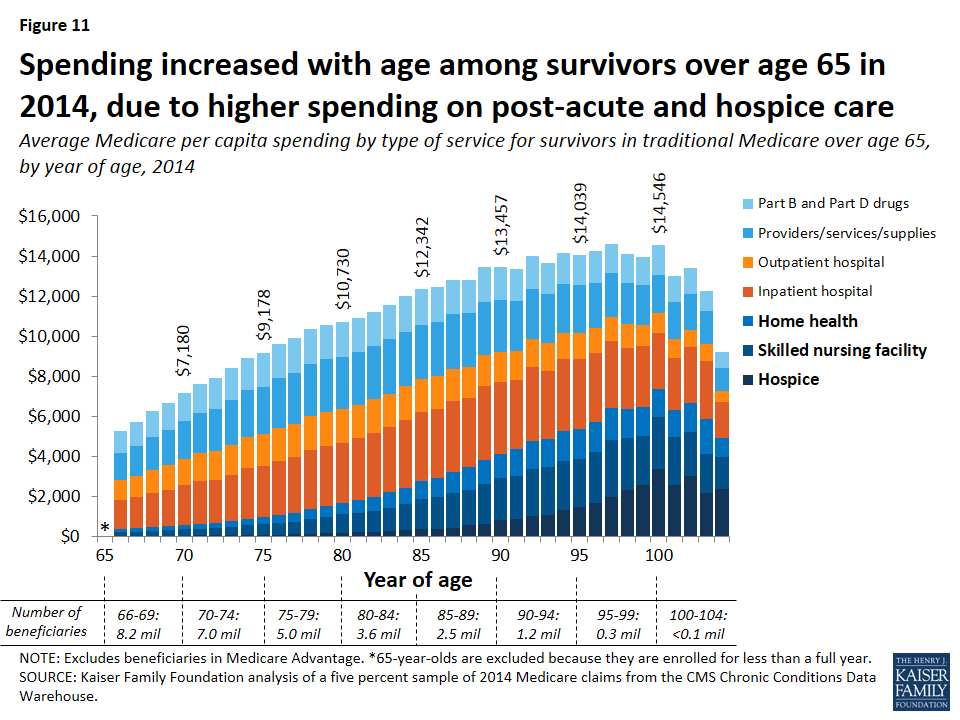
Figure 11: Spending increased with age among survivors over age 65 in 2014, due to higher spending on post-acute and hospice care

Discussion

Much attention has been focused lately on end-of-life care, the services patients receive at the end of life, and Medicare spending on these services. This analysis contributes a number of important findings to the discussion surrounding these issues.

Our analysis shows that Medicare per capita spending for beneficiaries in traditional Medicare who died at some point in 2014 was substantially higher than for those who lived the entire year, as might be expected. It also shows that Medicare per capita spending among beneficiaries over age 65 who die in a given year declines steadily with age. Per capita spending for inpatient services is lower among decedents in their eighties, nineties, and older than for decedents in their late sixties and seventies, while spending is higher for hospice care among older decedents. These results suggest that providers, patients, and their families may be inclined to be more aggressive in treating younger seniors compared to older seniors, perhaps because there is a greater expectation for positive outcomes among those with a longer life expectancy, even those who are seriously ill.

In addition, we find that total spending on people who die in a given year accounts for a relatively small and declining share of traditional Medicare spending. This reduction is likely due to a combination of factors, including: growth in the number of traditional Medicare beneficiaries overall as the baby boom generation ages on to Medicare, which means a younger, healthier beneficiary population, on average; gains in life expectancy, which means beneficiaries are living longer and dying at older ages; lower average per capita spending on older decedents compared to younger decedents; slower growth in the rate of annual per capita spending for decedents than survivors, and a slight decline between 2000 and 2014 in the share of beneficiaries in traditional Medicare who died at some point in each year.

This analysis focuses exclusively on beneficiaries in traditional Medicare, excluding the roughly one in three beneficiaries who are enrolled in Medicare Advantage plans,7  because comparable spending data for Medicare Advantage enrollees are not available. With research showing significant differences in certain demographic and health status characteristics between decedents in traditional Medicare and in Medicare Advantage,8  it is possible that spending and service use patterns may differ as well. While the majority of Medicare beneficiaries who died at some point in 2014 were in traditional Medicare, the inclusion of Medicare Advantage enrollees would provide a better understanding of whether and how the experiences of traditional Medicare and Medicare Advantage beneficiaries differ at the end of life.

Decisions pertaining to end-of-life care are among the most difficult for patients, families, and health care providers. The recent change in Medicare payment policy to reimburse physicians for conversations about advance care planning with their patients9  could bring about changes that better align services delivered with patient preferences and that also potentially reduce the costs associated with care at the end of life.

Juliette Cubanski, Tricia Neuman, and Shannon Griffin are with the Kaiser Family Foundation. Anthony Damico is an independent consultant.


Tables

Table 1: Prevalence of Selected Conditions Among Traditional Medicare Beneficiaries, 2014

Condition

All traditional Medicare beneficiaries

Decedents

Survivors

Hypertension 50% 67% 49%
Ischemic Heart disease25%53%23%
Chronic Kidney Disease15%51%14%
Anemia20%50%19%
Congestive Heart Failure12%48%11%
Alzheimer’s Disease/Dementia9%43%8%
Diabetes24%38%24%
Rheumatoid Arthritis/Osteoarthritis27%35%26%
Chronic Obstructive Pulmonary Disease10%29%9%
Depression15%27%14%
Any Cancer7%17%7%
Stroke/Transient Ischemic Attack3%11%3%
NOTE: Excludes beneficiaries in Medicare Advantage.SOURCE: Kaiser Family Foundation analysis of a five percent sample of 2014 Medicare claims from the CMS Chronic Conditions Data Warehouse.
Table 2: Amount and Distribution of Average Medicare Per Capita Spending Overall and by Type of Service for Traditional Medicare Beneficiaries, 2014
Type of servicePart of Medicare covering serviceAll traditionalMedicare beneficiariesDecedentsSurvivors
AmountPercent of totalAmountPercent of totalAmountPercent of total
Total$10,126100.0%$34,529100.0%$9,121100.0%
Part D drugsD1,59015.71,3523.91,60017.5
Acute inpatient hospitalA2,69126.615,58645.12,16023.7
Outpatient hospitalA1,53115.12,5367.31,49016.3
Other inpatient hospitalA4024.01,9885.83373.7
Evaluation & managementB4464.42,0265.93814.2
Other Part B proceduresB4774.76361.84705.2
Skilled nursing facilityA7026.93,4259.95896.5
Physician office servicesB3903.92770.83954.3
Home healthA or B14434.41,2313.64104.5
Part B drugsB3333.35541.63243.5
TestsB2362.32110.62372.6
Durable medical equipmentB1431.41900.61411.6
Other Part B servicesB1661.67642.21411.5
ImagingB1571.62640.81531.7
HospiceA2712.73,3299.61451.6
DialysisB210.2570.2200.2
AnesthesiaB510.5810.2500.5
Ambulatory surgery centerB770.8210.1790.9
 NOTE: Excludes beneficiaries in Medicare Advantage. Percentages may not sum to 100% due to rounding.1Home health services can be covered under Part A or Part B depending on whether or not the services follow a hospital stay.SOURCE: Kaiser Family Foundation analysis of a five percent sample of 2014 Medicare claims from the CMS Chronic Conditions Data Warehouse.
Table 3: Amount and Distribution of Average Medicare Per Capita Spending Overall and by Type of Service for Decedents in Traditional Medicare Over Age 65, by Age, 2014
TOTAL PER CAPITAInpatient hospitalOutpatient hospitalPart B providers/ services/ suppliesPart B andPart D prescription drugsSkilled nursing facilityHospiceHome health
AGEAmount% of totalAmount% of totalAmount% of totalAmount% of totalAmount% of totalAmount% of totalAmount% of totalAmount% of total
All >65$33,676100%$16,70149.6%$2,3757.1%$4,40613.1%$1,7355.2%$3,64110.8%$3,53810.5%$1,2803.8%
6638,84010022,28957.43,8429.95,49314.12,6146.71,9074.91,8494.88462.2
6740,84310023,26557.03,7019.15,65713.92,7346.72,3755.82,1585.39542.3
6842,31410024,11157.04,1309.85,60713.32,6966.42,3215.52,4125.71,0382.5
6940,69210023,10156.83,7979.35,75114.12,4736.12,1605.32,3855.91,0242.5
7040,75310022,55755.33,7729.35,59913.72,8176.92,6316.52,2815.61,0962.7
7143,31610023,94255.33,9429.15,94113.72,8566.62,9506.82,5505.91,1352.6
7241,38110022,52054.43,6648.95,75713.92,5876.32,9017.02,7896.71,1622.8
7343,35310023,65254.64,1249.56,13314.12,6556.13,0917.12,5475.91,1502.7
7440,93910022,07953.93,5488.75,59213.72,5686.33,4328.42,5156.11,2062.9
7541,90910022,99454.93,4328.25,79113.82,3325.63,3348.02,8566.81,1712.8
7640,88210022,03453.93,1497.75,64913.82,5226.23,1737.83,0287.41,3273.2
7740,75810021,85153.63,0077.45,66013.92,4266.03,5758.82,9567.31,2823.1
7839,01410020,22351.82,9607.65,39513.82,2195.73,6729.43,2788.41,2683.3
7939,76010020,95452.72,9767.55,52613.92,0315.13,7589.53,2228.11,2933.3
8036,84110018,71050.82,5727.04,80013.01,8965.13,85810.53,5499.61,4564.0
8136,64010019,39652.92,3936.54,98613.61,8064.93,6429.93,0738.41,3443.7
8234,93810017,40849.82,6947.74,55213.01,5914.63,96211.33,3009.41,4314.1
8332,96910016,08148.82,1446.54,37213.31,5424.74,19912.73,2639.91,3684.1
8432,88010015,59547.42,2696.94,25212.91,5264.64,16812.73,72411.31,3474.1
8533,38110016,10548.22,0096.04,30412.91,5234.64,39913.23,62010.81,4224.3
8630,63410014,38847.01,7595.73,88512.71,4074.64,12313.53,78912.41,2854.2
8730,83110014,24946.21,6445.33,93512.81,3654.44,20413.63,94012.81,4954.9
8830,00910013,84146.11,6275.43,70112.31,1673.94,39314.63,83912.81,4404.8
8929,65510012,99843.81,4965.03,61212.21,3874.74,43715.04,27414.41,4514.9
9027,77910012,03043.31,5005.43,45412.41,1184.04,19915.14,06414.61,4155.1
9125,59210010,71741.91,3075.13,13612.39633.83,79914.84,32916.91,3415.2
9226,27610010,74040.91,2204.63,11811.99613.74,15115.84,66217.71,4245.4
9324,2701009,62739.71,2135.02,77411.48353.43,96016.34,56818.81,2935.3
9425,4431009,86738.81,0914.32,88311.39223.64,50317.74,86419.11,3135.2
9523,1811009,12939.41,0464.52,69111.69404.13,69015.94,53819.61,1474.9
9622,6681008,10735.81,1235.02,54811.28553.83,65216.15,06822.41,3175.8
9721,4911007,76836.11,0004.72,22310.37503.53,19214.95,47525.51,0835.0
9820,2591007,34436.28934.42,13010.58144.03,09115.34,81623.81,1705.8
9919,0111006,74035.57714.12,10711.16843.62,93015.44,73924.91,0415.5
10018,4711005,92632.18134.41,6889.17734.22,27912.36,24733.87454.0
10116,5641005,28831.98255.01,6049.78425.11,95811.85,16331.28855.3
10218,7391005,71430.55703.01,87610.08414.52,20311.86,18833.01,3487.2
10317,7141004,48825.35162.91,3387.64672.63,01517.06,72738.01,1636.6
10414,9851004,93232.91,2068.01,4699.89616.42,24315.03,43822.97364.9
NOTE: Excludes beneficiaries in Medicare Advantage. 65-year-olds are excluded from the analysis of spending by year of age because they are enrolled for less than a full year. Percentages may not sum to 100% due to rounding.SOURCE: Kaiser Family Foundation analysis of a five percent sample of 2014 Medicare claims from the CMS Chronic Conditions Data Warehouse.
Table 4: Amount and Distribution of Average Medicare Per Capita Spending Overall and by Type of Service for Survivors in Traditional Medicare Over Age 65, by Age, 2014
TOTAL PER CAPITAInpatient hospitalOutpatient hospitalPart B providers/ services/ suppliesPart B andPart D prescription drugsSkilled nursing facilityHospiceHome health
AGEAmount% of totalAmount% of totalAmount% of totalAmount% of totalAmount% of totalAmount% of totalAmount% of totalAmount% of total
All >65$8,839100%$2,44127.6%$1,40415.9%$2,15424.4%$1,50917.1%$6917.8%$1792.0%$4615.2%
665,2711001,47227.998618.71,36826.01,09220.71833.5190.41512.9
675,6941001,55127.21,05218.51,50926.51,17420.62103.7260.51723.0
686,2571001,73827.81,12818.01,65526.51,28220.52393.8270.41883.0
696,6761001,82427.31,23218.51,77826.61,33820.02684.0300.42063.1
707,1801002,00327.91,27717.81,90326.51,41219.73114.3400.62353.3
717,6321002,14228.11,37418.02,02126.51,45319.03304.3510.72603.4
727,8891002,15027.21,42218.02,09826.61,53619.53524.5510.72803.6
738,3981002,29227.31,48817.72,22826.51,60719.13964.7720.93143.7
748,9331002,50928.11,56917.62,32726.11,64018.44725.3760.83403.8
759,1781002,51727.41,59917.42,39026.01,69318.55215.7840.93724.1
769,6271002,66727.71,64417.12,49225.91,72818.05886.1900.94164.3
779,8861002,79628.31,63116.52,53625.61,74217.66426.51011.04394.4
7810,3701002,94728.41,72216.62,60325.11,73816.87247.01281.25084.9
7910,5791003,02128.61,69716.02,62424.81,72816.38107.71471.45525.2
8010,7301002,98627.81,67815.62,61824.41,76416.49208.61781.75875.5
8110,9091003,09928.41,63615.02,62224.01,72015.89678.92262.16405.9
8211,2011003,18128.41,67314.92,67723.91,68015.01,0889.71991.87046.3
8311,5401003,28628.51,63514.22,71123.51,70614.81,16410.12722.47666.6
8411,9831003,39128.31,67314.02,71722.71,78014.91,30310.92992.58216.9
8512,3421003,44927.91,63913.32,73122.11,77014.31,46011.83903.29027.3
8612,4341003,42527.51,67613.52,67721.51,73514.01,56412.63903.19677.8
8712,7931003,51827.51,63412.82,70621.21,71013.41,75813.74303.41,0368.1
8812,8181003,48827.21,53812.02,66920.81,67813.11,78113.95514.31,1128.7
8913,4461003,66827.31,53411.42,68520.01,72212.82,02315.06134.61,2018.9
9013,4571003,58826.71,50711.22,59219.31,64512.22,11315.78086.01,2059.0
9113,3351003,48126.11,42510.72,50518.81,57611.82,16616.28716.51,3119.8
9213,9991003,70126.41,3909.92,51017.91,62111.62,33416.71,0377.41,40610.0
9313,6401003,41925.11,41410.42,44317.91,52411.22,36517.31,0938.01,38110.1
9414,1731003,55725.11,3279.42,43617.21,56711.12,44717.31,3419.51,49710.6
9514,0391003,52625.11,2849.12,37016.91,50210.72,38217.01,47310.51,50310.7
9614,2321003,44424.21,2428.72,23915.71,57211.02,57518.11,66111.71,49810.5
9714,6201003,34922.91,1788.12,20615.11,47010.12,88119.71,95713.41,57910.8
9814,1141003,06421.71,1958.52,06714.61,44210.22,59118.42,31916.41,43610.2
9913,9291003,06522.01,0387.52,01514.51,3719.82,43417.52,57818.51,42810.3
10014,5461002,79119.29766.71,94013.31,47010.12,56317.63,37723.21,4299.8
10113,0181002,62520.29527.31,83114.11,31310.12,37818.32,59319.91,32710.2
10213,3861002,79020.88646.51,81613.61,2599.42,19216.43,02422.61,44210.8
10312,2731002,93823.98336.81,63013.31,0288.41,93515.82,18217.81,72814.1
1049,2171001,78019.35826.31,13912.48018.71,63217.72,35025.593510.1
NOTE: Excludes beneficiaries in Medicare Advantage. 65-year-olds are excluded from the analysis of spending by year of age because they are enrolled for less than a full year.SOURCE: Kaiser Family Foundation analysis of a five percent sample of 2014 Medicare claims from the CMS Chronic Conditions Data Warehouse.

Endnotes

  1. National Center for Health Statistics, Health, United States, 2015: With Special Feature on Racial and Ethnic Health Disparities, 2016, Table 19: “Leading causes of death and numbers of deaths, by sex, race, and Hispanic origin: United States, 1980 and 2014,” available at http://www.cdc.gov/nchs/data/hus/hus15.pdf#019. ↩︎
  2. Kaiser Family Foundation analysis of a five percent sample of 2014 Medicare claims from the Centers for Medicare & Medicaid Services’ Chronic Conditions Data Warehouse. ↩︎
  3. Gerald F. Riley and James D. Lubitz, “Long-Term Trends in Medicare Payments in the Last Year of Life,” Health Services Research April 2010; 45(2):565-576. ↩︎
  4. We exclude beneficiaries who are exactly age 65 from the analysis of spending by year of age and spending comparisons between beneficiaries under age 65 and over age 65 because many are enrolled for less than a full year, resulting in less than an entire year of Medicare spending data. ↩︎
  5. Medicare spending for Medicare Advantage enrollees takes the form of monthly capitation payments which are not based on actual service utilization. ↩︎
  6. We are unable to examine spending data that spans the last 12 months of life for decedents in our analysis because we are unable to disaggregate spending data for a given beneficiary for periods of time less than one calendar year. Had we been able to calculate Medicare spending for a 12-month period for both survivors and dependents, the difference in per capita spending between decedents and survivors and the estimate of spending on decedents as a share of total Medicare spending would have been larger. ↩︎
  7. Gretchen Jacobson, Giselle Casillas, Anthony Damico, Tricia Neuman, and Marsha Gold, “Medicare Advantage 2016 Spotlight: Enrollment Market Update,” Kaiser Family Foundation, May 2016, available at https://modern.kff.org/medicare/issue-brief/medicare-advantage-2016-spotlight-enrollment-market-update/. ↩︎
  8. Elena Byhoff, John A. Harris, and John Z. Ayanian, “Characteristics of Decedents in Medicare Advantage and Traditional Medicare,” Research Letter, JAMA Internal Medicine June 2016; Published online ahead of print: E1-3. ↩︎
  9. For more information, see “10 FAQs: Medicare’s Role in End-of-Life Care,” Kaiser Family Foundation, November 2015, available at https://modern.kff.org/medicare/fact-sheet/10-faqs-medicares-role-in-end-of-life-care/. ↩︎
House Appropriations Committee approves FY 2017 State and Foreign Operations Appropriations Bill

Published: Jul 13, 2016

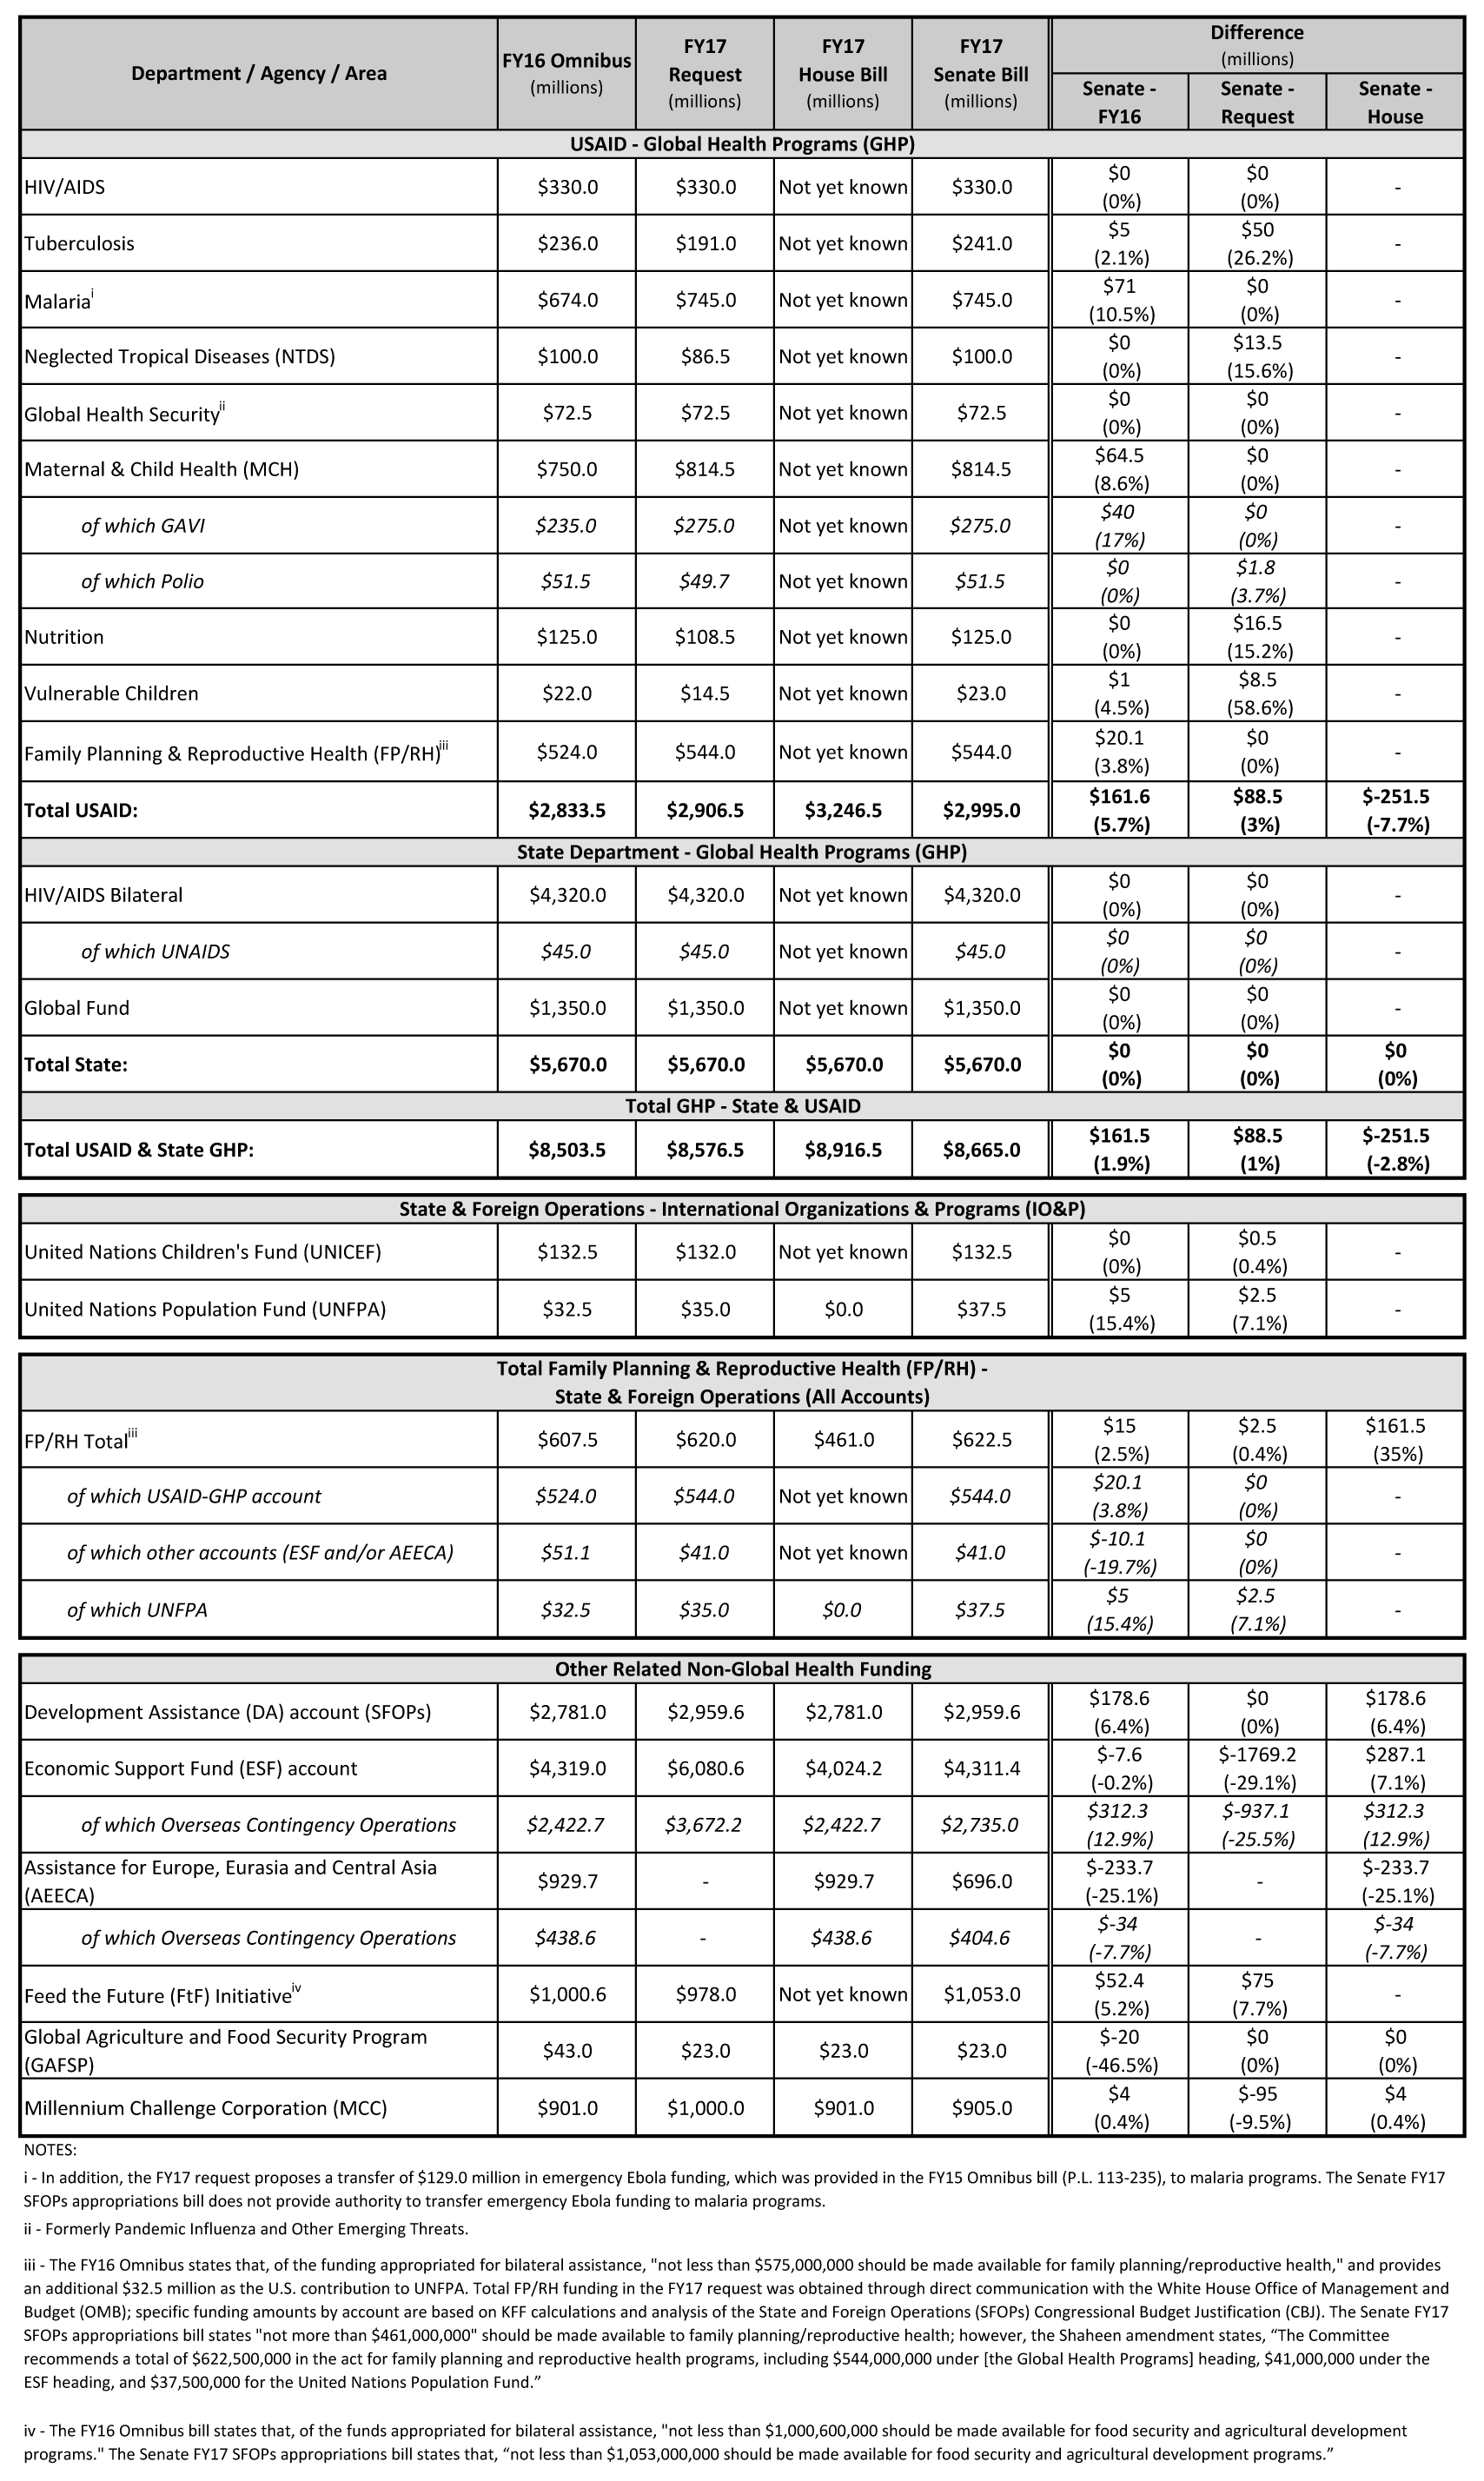
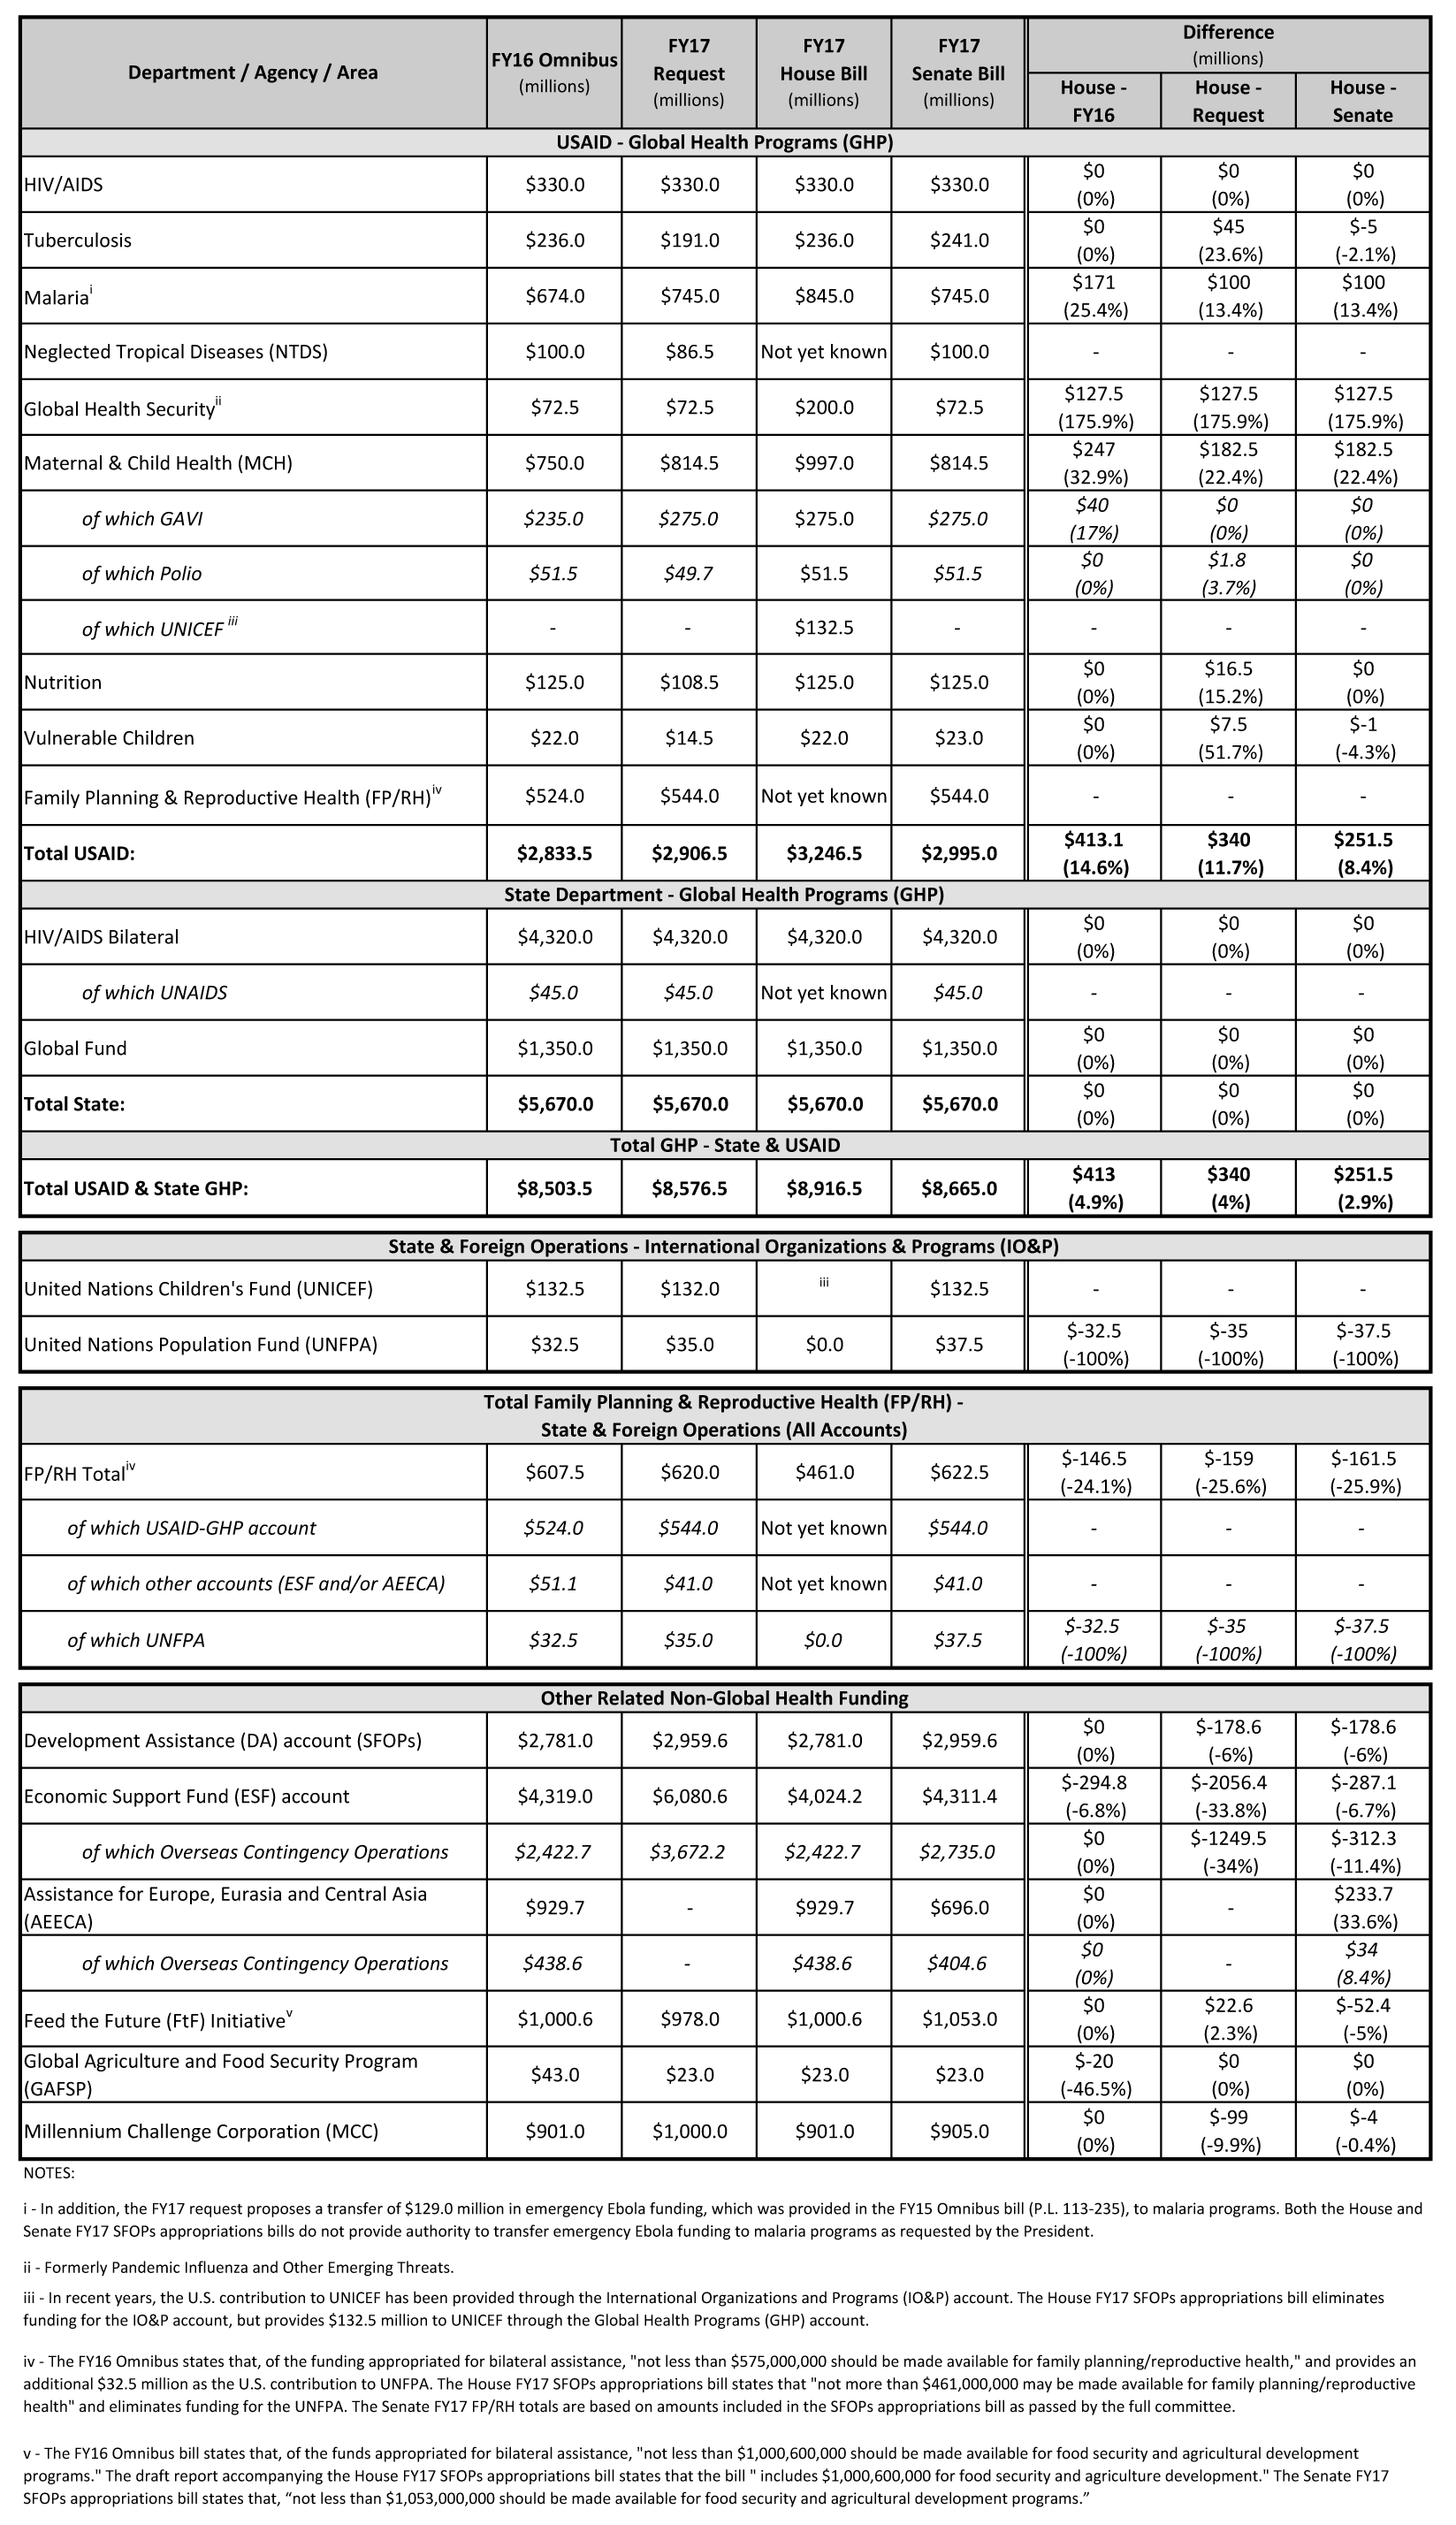
The House Committee on Appropriations approved the FY 2017 State and Foreign Operations Appropriations bill and associated committee report, which includes funding for U.S. global health programs at the U.S. Agency for International Development (USAID) and the State Department (see table below) comprising a significant portion of U.S. funding for global health (total funding for global health is not currently available as some funding provided through USAID and DoD is not yet available).

Funding in the bill for the Global Health Programs (GHP) account, which includes the majority of global health funding, totaled $8.9 billion, $413 million (5%) above the FY16 enacted level, $340 million (4%) above the President’s FY17 request, and $252 million (3%) above the Senate FY17 SFOPs appropriations bill.

Funding for most global health programs under the GHP account increased in the House FY17 SFOPs appropriations bill compared to both the President’s FY17 Request and the FY16 enacted level including for the following program areas: tuberculosis, malaria, global health security, maternal and child health (MCH), nutrition, and vulnerable children. Funding for bilateral HIV programs as part of the President’s Emergency Plan for AIDS Relief (PEPFAR) and the U.S. contribution to The Global Fund to Fight AIDS, Tuberculosis and Malaria (Global Fund) matched the President’s request and the FY16 enacted level. Family Planning and Reproductive Health (FP/RH) was the only program that declined in the House FY17 SFOPs bill as funding was capped at $461 million, $159 million (-26%) below the President’s Request and $147 million (24%) below the FY16 enacted level. Funding for neglected tropical diseases (NTDs) was not specified in the bill.

While the House FY17 SFOPs appropriations bill provides increased funding for malaria ($845 million) through the GHP account compared to the President’s request ($745 million) and the FY16 enacted level ($674 million), the House bill does not provide the authority requested by the President to transfer an additional $129.0 million in emergency Ebola funding to malaria programs resulting in an overall total that is lower than the President’s Request.

The bill also included the following policy provisions:

• Reinstates the Mexico City Policy (also known as the “Global Gag Rule”)• Prohibits funding for the United Nations Population Fund (UNFPA)

Additional Information:- Learn more about the Senate SFOPs appropriations bill here.

FY17 House SFOPs_071316


News Release

Former Secretary Kathleen Sebelius and Former Senator Olympia Snowe Elected to KFF Board of Trustees

Published: Jul 13, 2016

Menlo Park, CA – The Henry J. Kaiser Family Foundation (KFF) announced today that the Honorable Olympia Snowe, former U.S. Senator from Maine, and the Honorable Kathleen Sebelius, former U.S. Secretary of Health and Human Services and former governor of Kansas, have been elected to its Board of Trustees.

Snowe had a longstanding career of service in public office for the state of Maine and is the first woman ever to serve in both houses of a state legislature and to serve in both houses of Congress. Elected to three terms as U.S. Senator, serving from 1995-2013, she is known for her work on budget-deficit reduction, fiscal issues, health care, women’s issues, and foreign affairs. Snowe became a member of the Maine House of Representatives in 1973, was elected to the Maine Senate three years later, and was voted into the U.S. House of Representatives in 1978. After leaving Congress, Snowe authored the book Fighting for Common Ground: How We Can Fix the Stalemate in Congress, drawing on her professional and life experiences as a policy maker. She currently is a senior fellow at the Bipartisan Policy Center and is a co-chair of its Commissions on Political Reform and on Tax Reform.  In addition, Snowe serves on corporate and nonprofit boards, advisory boards, and as an advisor to Square Roots, a company focusing on maternal and child health.  In 2014, Snowe established the Olympia Snowe Women’s Leadership Institute to help future generations of young women become leaders by raising their confidence and aspirations.

Sebelius served as the U.S. Secretary for Health and Human Services from 2009 to 2014, during the passage and implementation of the Affordable Care Act. Her extensive experience in public office and health care policy include election to two terms as governor of Kansas, a position she held from 2003 to 2009. She also served as Kansas’ insurance commissioner and in the state’s legislature. Secretary Sebelius is currently chief executive officer of Sebelius Resources LLC, providing strategic advice to private companies, non-profit organizations, higher education institutions, and financial investors. Sebelius serves on several boards and holds numerous advisory positions, including as a senior advisor to the Aspen Institute, where she co-chairs the Aspen Health Strategy Group.

“The Kaiser Family Foundation is delighted to have Secretary Sebelius and Senator Snowe bring their deep policy experience and passion for health care issues to our board as the country adjusts to a changing policy landscape and faces new challenges,” said Governor James E. Doyle, chairman of the board of trustees.

KFF’s board has 13 members, including its President and Chief Executive Officer Drew Altman, and former government officials and national leaders from journalism and the nonprofit sector, who serve up to two five-year terms. Additional information on KFF and its board can be found at https://www.kff.org/about-us/. Sebelius and Snowe will begin their board terms in March 2017.

Visualizing Health Policy: HIV Awareness and Testing, 2013 and 2014

Published: Jul 12, 2016

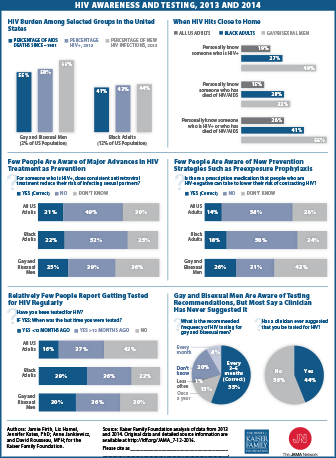
This Visualizing Health Policy infographic provides a snapshot of HIV-related awareness and experiences among adults in the United States, including two demographic groups that make up a disproportionate share of people with HIV: black adults, and gay and bisexual men. Four in 10 black adults, and more than half of gay and bisexual men said they personally know someone who is HIV-positive (HIV+) or who has died of HIV/AIDS, compared with only 28% of adults in the United States overall. In 2014, only 21% of US adults were aware that consistent antiretroviral treatment can significantly reduce the risk of HIV transmission, and only 14% had heard of a new prevention strategy, preexposure prophylaxis. Awareness was only slightly higher among black adults and gay and bisexual men. Although a majority of US adults said they have been tested for HIV, only 16% reported they’ve been tested within the past 12 months; these rates were higher for black adults (39%) and gay and bisexual men (30%). More than half of gay and bisexual men said they are aware that it is recommended they be tested for HIV every 3 to 6 months, yet 56% reported that a clinician has never suggested testing.

jama_2016june_hiv awareness and testing_thumb

Visualizing Health Policy is a monthly infographic series produced in partnership with the Journal of the American Medical Association (JAMA). The full-size infographic is freely available on JAMA’s website and is published in the print edition of the journal.

View Source Slides

News Release

Visualizing Health Policy: HIV Awareness and Testing, 2013 and 2014

Published: Jul 12, 2016

This Visualizing Health Policy infographic provides a snapshot of HIV-related awareness and experiences among adults in the United States, including two demographic groups that make up a disproportionate share of people with HIV: black adults, and gay and bisexual men. Four in 10 black adults, and more than half of gay and bisexual men said they personally know someone who is HIV-positive (HIV+) or who has died of HIV/AIDS, compared with only 28% of adults in the United States overall. In 2014, only 21% of US adults were aware that consistent antiretroviral treatment can significantly reduce the risk of HIV transmission, and only 14% had heard of a new prevention strategy, preexposure prophylaxis. Awareness was only slightly higher among black adults and gay and bisexual men. Although a majority of US adults said they have been tested for HIV, only 16% reported they’ve been tested within the past 12 months; these rates were higher for black adults (39%) and gay and bisexual men (30%). More than half of gay and bisexual men said they are aware that it is recommended they be tested for HIV every 3 to 6 months, yet 56% reported that a clinician has never suggested testing.

jama_2016june_hiv awareness and testing_thumb

Visualizing Health Policy is a monthly infographic series produced in partnership with the Journal of the American Medical Association (JAMA). The full-size infographic is freely available on JAMA’s website and is published in the print edition of the journal.

What’s At Stake in the Future of the Kentucky Medicaid Expansion?

Published: Jul 7, 2016

To date, Kentucky has had one of the most successful ACA implementation experiences among states. Beginning in 2014, the state expanded Medicaid to low-income adults and built its own State-Based Marketplace, kynect. Research points to gains in coverage and reductions in the uninsured, increases in access and health care utilization and positive fiscal impact as a result of the Medicaid expansion.

Governor Bevin, elected in December 2015, ran on a platform to dismantle kynect and to end the Medicaid expansion. However, post-election, the Governor said he would seek a waiver to make changes to the Medicaid expansion. On June 1, Kentucky received approval from the Centers for Medicare and Medicaid Services (CMS) to move forward with plans to transition from kynect to healthcare.gov. On June 22, 2016, Governor Bevin released his proposed Section 1115 demonstration waiver proposal called Kentucky HEALTH (Helping to Engage and Achieve Long Term Health) as an alternative to the current Medicaid expansion.

The proposed Medicaid waiver, modeled largely after the waiver program in Indiana (HIP 2.0), would modify the state’s existing Medicaid expansion and make changes that would affect new enrollees as well as traditional Medicaid enrollees. CMS has indicated it may not approve additional waivers similar to Indiana in advance of an evaluation of Indiana’s program. Kentucky’s proposed waiver includes many provisions similar to those in Indiana and additional provisions not approved in other states, such as employment requirements, and graduated premiums based on length of time on the program. Governor Bevin said in a press conference when he released the waiver proposal for state comment that if the waiver is not approved he would end the expansion. This brief examines what has happened to coverage, access and utilization and the economic impact of the Medicaid expansion in Kentucky and the implications for changes going forward.   A summary of the proposed waiver can be found here.

What Happened to Coverage?

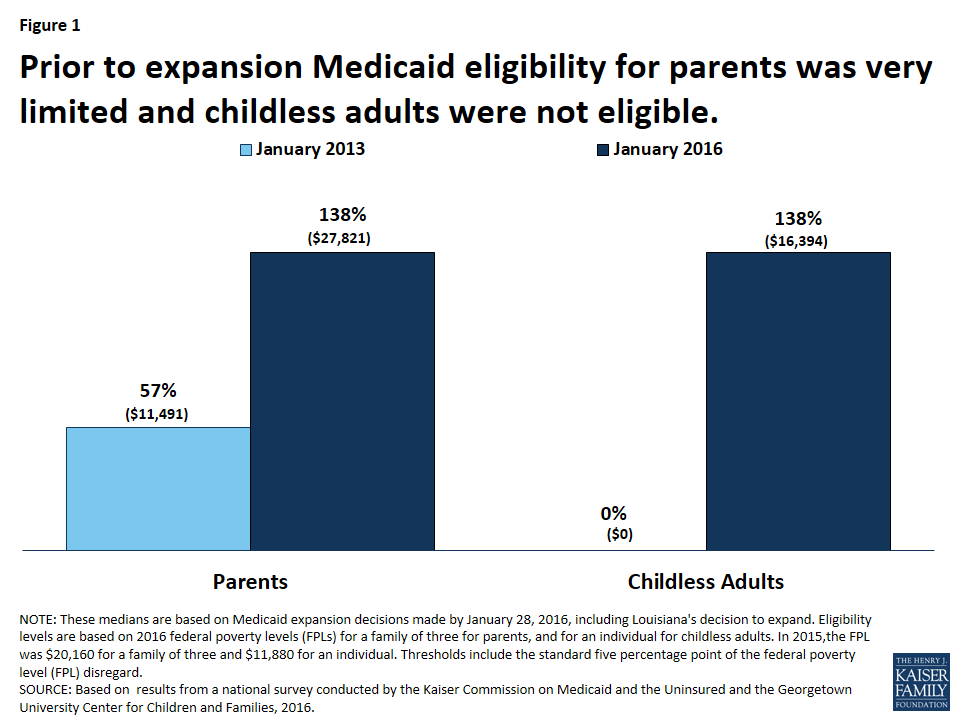
Since implementing the ACA, Kentucky’s uninsured rate for the nonelderly fell from 18.8% in 2013 to 6.8% in 2015, one of the largest reductions in the country.1   The reduction is largely attributable to changes in Medicaid eligibility and gains in Medicaid coverage.  Before the implementation of the expansion, eligibility for parents was at 57% FPL ($11,491 for a family of 3 in 2016) and there was no coverage for adults without dependent children.2  Under the ACA Medicaid expansion, eligibility for adults was expanded up to 138% of poverty ($16,394 for an individual or $27,821 for a family of 3 in 2016).  (Figure 1)

Figure 1: Prior to expansion Medicaid eligibility for parents was very limited and childless adults were not eligible.

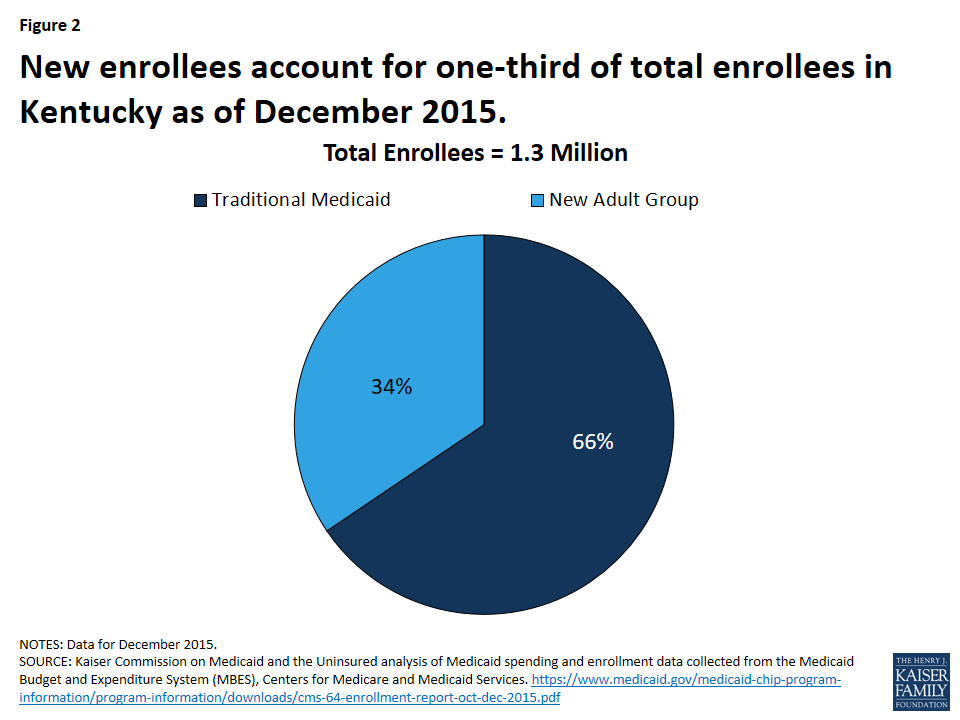
CMS data show that Medicaid enrollment in Kentucky from pre-ACA to January 2016 increased by 95% (the highest growth across all states).3  Other data show that of the 1.3 million Medicaid enrollees as of December 2015, 439,000 (or one-third) are “new enrollees” and qualify for 100% federal matching funds (Figure 2).4   Without the expansion, the large majority (more than eight in ten) of these new enrollees would have been uninsured and without a coverage pathway because their income is below poverty.

Figure 2: New enrollees account for one-third of total enrollees in Kentucky as of December 2015.

What Happened to Access and Utilization?

Research shows that the expansion in Kentucky has helped to increase access and utilization of health care services in a state with historically poor health status indicators. For example, one study shows that compared to Texas, Medicaid expansion in Kentucky was associated with significant reductions in skipping medications because of cost as well as decreases in trouble paying medical bills among low-income adults between Nov.-Dec. 2013 and Nov.-Dec. 2014.5   Another study shows that by the end of 2014, low-income Kentuckians experienced a 16 percentage point (40%) reduction in unmet medical need because of cost relative to the pre-expansion (2006-2013) period.6  Finally, another study shows that more than 300 new behavioral health providers enrolled in Kentucky Medicaid and at least 13,000 individuals with a substance use disorder received related treatment services during the first year of expansion.7 

What Are the Economic Implications?

Studies point to fiscal gains associated with the Medicaid expansion. For example, one study shows state savings were realized by transitioning individuals accessing Medicaid services through pre-ACA eligibility categories to the new eligibility group (with initial 100% enhanced federal funding).8  In addition, another study shows that the expansion was estimated to have a positive cumulative fiscal impact of $819.6 million by SFY 2021.9  The same study shows that Medicaid expansion created more than 12,000 jobs in Kentucky in SFY 2014, including 5,400 health care and social service jobs. Expansion is projected to create more than 40,000 jobs in Kentucky through SFY 2021 with an average salary of about $41,000.10  Finally, Kentucky hospitals experienced a reduction of $1.15 billion in uncompensated care charges when comparing the first three quarters of CY 2013 to the same period in CY 2014.11 

Looking Ahead

Kentucky has had a successful implementation of the ACA Medicaid expansion to date. Robust enrollment has resulted in significant coverage gains and reductions in the uninsured as well as increases in access to care and financial protections for families.  Other studies point to net fiscal benefit from the expansion including increases in jobs, and reductions in uncompensated care for hospitals. A Kaiser Family Foundation survey of the views of Kentucky residents completed just after the Governor’s election in 2015 found that nearly three in four (72%) Kentuckians said they would prefer to keep the state’s Medicaid program as it is rather than scale it back it to cover fewer people.  About two-thirds (67%) felt that the Medicaid program is working well for most low-income people in the state; this share rises to 84% among adults who are actually covered by Medicaid.12  Ending or altering the expansion as proposed in the recent demonstration waiver proposal could jeopardize coverage, access and fiscal gains achieved under the expansion to date.

  1. Health Insurance Coverage: Early Release of Estimates from the National Health Interview Survey, 2013 and 2015 ↩︎
  2. Trends in Medicaid Income Eligibility Limits, (Kaiser Family Foundation, State Health Facts, accessed June 2016), https://modern.kff.org/data-collection/trends-in-medicaid-income-eligibility-limits/ ↩︎
  3. Total Monthly Medicaid and CHIP Enrollment  (Kaiser Family Foundation, State Health Facts, accessed June 2016), https://modern.kff.org/health-reform/state-indicator/total-monthly-medicaid-and-chip-enrollment/ ↩︎
  4. Total Medicaid Enrollees ‐ VIII Group Break Out Report, December‐2015.  Updated June 2016.  Reported on the CMS-64.  https://www.medicaid.gov/medicaid-chip-program-information/program-information/downloads/cms-64-enrollment-report-oct-dec-2015.pdf ↩︎
  5. Benjamin Sommers, Robert Blendon, and E. John Orav, “Both the ‘Private Option’ And Traditional Medicaid Expansions Improved Access To Care For Low-Income Adults,” Health Affairs 35, no. 1 (January 2016): 96-105, http://content.healthaffairs.org/content/35/1/96.abstract ↩︎
  6. Joseph Benitez, Liza Creel, and J’Aime Jennings, Kentucky’s Medicaid Expansion Showing Early Promise on Coverage and Access to Care, Health Affairs (February 2016), http://content.healthaffairs.org/c ontent/early/2016/02/16/hlthaff. 2015.1294 ↩︎
  7. Deloitte Development LLC, Commonwealth of Kentucky Medicaid Expansion Report, (Deloitte Development LLC, February 2015), http://jointhehealthjourney.com/i mages/uploads/channelfiles/Kentucky_Medicaid_Expansio n_One-Year_Study_FINAL.pdf ↩︎
  8. Deborah Bachrach, Patricia Boozang, Avi Herring, and Dori Glanz Reyneri, States Expanding Medicaid See Significant Budget Savings and Revenue Gains, (Manatt Health Solutions, prepared by the Robert Wood Johnson Foundation’s State Health Reform Assistance Network, March 2016), http://www.rwjf.org/content/dam /farm/reports/issue_briefs/2016/ rwjf419097 ↩︎
  9. Deloitte Development LLC, Commonwealth of Kentucky Medicaid Expansion Report, (Deloitte Development LLC, February 2015), http://jointhehealthjourney.com/i mages/uploads/channelfiles/Kentucky_Medicaid_Expansio n_One-Year_Study_FINAL.pdf ↩︎
  10. Ibid. ↩︎
  11. Ibid. ↩︎
  12. Liz Hamel, Mira Norton, and Mollyann Brodie, Survey of Kentucky Residents on State Health Policy, (Kaiser Family Foundation, December 2015), https://modern.kff.org/health-reform/poll-finding/survey-of-kentucky-residents-on-state-health-policy/ ↩︎

A Look at Rural Hospital Closures and Implications for Access to Care: Three Case Studies

Authors: Jane Wishner, Patricia Solleveld, Robin Rudowitz, Julia Paradise, and Larisa Antonisse
Published: Jul 7, 2016

Executive Summary

Executive Summary

The number of rural hospital closures has increased significantly in recent years. This trend is expected to continue, raising questions about the impact the closures will have on rural communities’ access to health care services. To investigate the factors that contribute to rural hospital closures and the impact those closures have on access to health care in rural communities, the Kaiser Commission on Medicaid and the Uninsured and the Urban Institute conducted case studies of three hospital closures that took place in 2015: Mercy Hospital in Independence, Kansas; Parkway Regional Hospital in Fulton, Kentucky; and Marlboro Park Hospital in Bennettsville, South Carolina. Two of these hospitals were in states that did not adopt the Medicaid coverage expansion under the Affordable Care Act (ACA) (Kansas and South Carolina), while one of the hospitals was located in a Medicaid expansion state (Kentucky). Key findings include the following:

A number of factors contributed to the rural hospital closures, including aging, poor, and shrinking populations, high uninsured rates and a payer mix dominated by Medicare and Medicaid, economic challenges in the community, aging facilities, outdated payment and delivery system models, and business decisions by corporate owners/operators.

The hospital closures reduced local residents’ access to care, especially emergency care. While inpatient hospitals in these and other communities may not be sustainable, without new models of health care delivery in place, hospital closures can lead to gaps in access. The closures led to an outmigration of health care professionals and worsened pre-existing challenges around access to specialty care. Some communities were able to adapt to fill in gaps in access to primary care. Elderly and low-income individuals were more likely than others to face transportation challenges following the closures, and were thus more likely to delay or forgo needed care.

New care models may be better able to address the health care needs of rural communities.  Some rural hospitals may be able to adapt and new models may be created to address changing demographics and delivery systems.  Such reconfiguration may require federal support and assistance as well as regional planning efforts. A state’s decision about the Medicaid expansion has an important impact on hospital revenues and access to care, but the sustainability of rural hospitals depends on a broader set of factors.

Issue Brief

Introduction and Methods

The number of rural hospital closures has increased significantly in recent years. This trend is expected to continue, raising questions about the impact the closures will have on access to health care services in rural communities.1  To investigate the factors that contribute to rural hospital closures and the impact of those closures on access to health care in rural communities, the Kaiser Commission on Medicaid and the Uninsured and the Urban Institute conducted case studies of three hospital closures that took place in 2015: Mercy Hospital in Independence, Kansas; Parkway Regional Hospital in Fulton, Kentucky; and Marlboro Park Hospital in Bennettsville, South Carolina.

In selecting hospital closures for study, we limited ourselves to hospitals that: 1) had closed recently, 2) had not converted to another type of facility (e.g., an urgent care facility) following the closure; and 3) had been reimbursed by Medicare under the prospective payment system (PPS) through predetermined fixed reimbursement rates, not on a cost basis. We applied these criteria to enhance our understanding of the immediate impacts of complete rural hospital closures on community access to care, and to eliminate the effect of Medicare reimbursement type as a confounding factor in our analysis. Also, because we wished to examine the role of state decisions about whether or not to expand Medicaid to nonelderly adults under 138% of the federal poverty level under the Affordable Care Act (ACA), we selected two hospital closures that took place in states that did not expand Medicaid (Kansas and South Carolina) and one closure that took place in a Medicaid expansion state (Kentucky).2 

For each case study, we conducted 6-8 interviews with community stakeholders, including nearby hospitals, community health centers, provider associations, health plans, public officials, and local business leaders. We also reviewed publicly-available materials related to the closures and, where available, state and regional rural health analyses and planning initiatives, and interviewed state and national rural health experts to gain perspective on these closures in the context of broader trends.

The case studies addressed the following research questions:

  1. What factors contributed to the hospital closure?
  2. How has the closure affected access to care?
  3. What were the broader community effects of the closure? and
  4. Did the state Medicaid expansion decision make a difference in the closure of the hospital or on residents’ ability to access care after the closure?

This brief addresses each of these questions and concludes by addressing the implications of a growing number of rural hospital closures for rural communities and rural health.

Background

In 1946, Congress authorized the Hill-Burton program, which provided federal funding for construction of public and nonprofit hospitals in rural communities. The program led to a significant increase in the number of rural hospitals in the country, particularly in the South. In 1983, responding to significant increases in Medicare hospital spending, Congress mandated use of fixed predetermined reimbursement rates for hospitals through the PPS. Following the adoption of PPS, many rural hospitals closed in the 1980’s and 1990’s.3  In response to growing concerns over rural health care access, CMS implemented the Medicare Rural Hospital Flexibility Program of 1997 (Flex Program), which authorized payment of inpatient and outpatient services on a “reasonable cost basis” for hospitals designated as Critical Access Hospitals (CAHs).4  To be classified a CAH, a hospital must have no more than 25 inpatient beds and must be at least 15 miles by secondary road and 35 miles by primary road from the nearest hospital; until 2006, however, states could waive the distance requirement by designating a hospital as a “necessary provider.”5  The closure trend slowed for several years following adoption of the Flex Program, but picked up again during the Great Recession of 2008-09.

There are nearly 5,000 short-term, acute care hospitals in the United States. Half of these hospitals are in urban areas and half are in rural areas. About 4 in 10 rural hospitals are located in the South.6  More than half of rural hospitals are CAHs (53.5%); smaller shares of rural hospitals are designated as Sole Community Hospitals (SCHs) (13%), Medicare Dependent Hospitals (MDHs)(8%), and Rural Referral Centers (RRCs) (11%).7  All of these designations provide enhanced or supplemental reimbursement under Medicare, using different formulas.8  Rural hospitals that do not qualify for these Medicare programs are reimbursed as standard Medicare PPS Hospitals.

In 2012-2013, rural hospitals had an average of 50 beds and a median of 25 beds. They had an average daily census of 7 patients and 321 employees, and they were 10 years old on average. Compared to urban hospitals, rural hospitals are more likely to be in counties with an elderly and poor population.9  According to The North Carolina Rural Health Research Program (NC RHRP) at the Cecil G. Sheps Center for Health Services Research, which tracks rural hospital closures, there were 72 rural hospital closures between January 2010 and April 2016, compared to 42 closures between 2005 and 2009, and since the 2008-2009 recession, the annual number of closures has increased each year.10  More than half of all rural hospital closures since 2010 were in the South and few Southern states have expanded Medicaid under the ACA.

This report focuses on three hospital closures that took place in 2015: Mercy Hospital in Independence, Kansas; Parkway Regional Hospital in Fulton, Kentucky; and Marlboro Park Hospital in Bennettsville, South Carolina. All three hospitals were privately owned. Bed size ranged from 45 to 102, and two of the hospitals had fewer than 1,000 admissions per year. Occupancy rates were also low. The nearest hospital post-closure was 12 to 15 miles away; in one community, the nearest hospital was across the state line. Table 1 shows selected basic characteristics of the three hospital closures we studied. More detailed information about the hospitals can be found in the Appendix.

Table 1: Selected characteristics of the three study hospitals
Parkway  Regional Hospital, Fulton KY11 Mercy Hospital, Independence, KS12 Marlboro Park Hospital,Bennettsville, SC13 
Date of ClosureMarch 2015October 2015April 2015
Owner / Ownership StatusCommunity Health Systems (CHS) / For-ProfitMercy Health / Not-For-ProfitA subsidiary of Community Health Systems operated the hospital; Medical Properties Trust, a real estate trust owned the facility / For-Profit
Number of Beds7045102
OccupancyUnknown25%13.9% as of 2013
Employees170-190243 (11 physicians as of 2013)100
Admissions700 in 2014995/yearUnknown
Nearest Hospital/Distance awayTennova Healthcare-Volunteer Martin, in Martin, TN (owned by Community Health Systems) Approximately 12 miles

Jackson Purchase Medical Center (Life Point Health), in Mayfield, KYApproximately 22 miles

Wilson Medical Center, in Neodesha, KS (owned by Duke LifePoint) Approximately 14 miles

Coffeyville Regional Medical Center, in Coffeyville, KS (city-owned hospital)Approximately 20 miles

McLeod Health Cheraw, in Cheraw, SC (owned by McLeod Health)Approximately 15 miles.Scotland Memorial Hospital, in Laurinberg, NC (community- owned and -controlled, not-for-profit)Approximately 17 miles
Medicaid Expansion StateYesNoNo
NOTES: Data regarding the number of beds, occupancy rate, number of employees, and admission rates were collected from local news outlets that reported on the respective closures, not from formal reports produced by the hospitals. Many of the media reports did not cite the original source for the data, or data were not available for all three communities. Information regarding the location of nearby hospitals is based on interviews with stakeholders and was verified with data from Google Maps.

Key Findings

What factors contribute to rural hospital closures?

Rural areas face challenging demographic, social, and economic pressures. Respondents in all three communities pointed to similar economic and demographic trends that contributed to the closures. They cited high poverty and uninsured rates in rural communities, high rates of Medicare and Medicaid coverage, and declining populations. In each community, poverty rates were higher than state and national averages and median incomes were lower, and the population was shrinking. Two of the counties where the study hospitals were located (Fulton County, Kentucky and Montgomery County, Kansas) had higher rates of elderly residents, and two counties (Fulton and Marlboro County, South Carolina) had higher rates of Black residents relative to the rates in the state overall and the U.S. (See Appendix Table 1)

Stakeholders also noted the loss of major employers, the “evaporation” of local industry (i.e., mining, textiles, manufacturing and agriculture), and the subsequent rise in unemployment and loss of employer health coverage as factors contributing to the closures. The communities’ economic difficulties were exacerbated by the recent recession. With the disappearance of jobs, many young adults have left town in search of other opportunities, leading to further population decline and to a graying population with greater health care needs.

Privately insured patients often went elsewhere for care, hurting the local hospital’s revenue base and contributing to perceived low quality of the local hospital. In all three case studies, respondents reported that, prior to the hospital closure, community residents with private insurance or other resources typically travelled to bigger, newer hospital systems outside the community, weakening the hospital’s payer mix and also reinforcing local perceptions – often based on anecdotal accounts from friends and family members — that the local hospital was of low or poor quality. The local community hospital may have been older, and due to financial struggles prior to closure, may have invested less in infrastructure improvements compared to facilities in nearby urban areas, contributing to its perceived poor quality. The fact that, even while the local hospital was operating, residents had to go elsewhere for many types of specialty care, including labor and delivery services and surgery in some cases, reinforced views that the hospital was inferior. Without privately insured patients, study hospitals were left with high rates of uninsured patients and patients with public insurance (Medicare and Medicaid), which pay lower reimbursement rates than commercial insurance that are often below costs. All these factors resulted in negative margins. With insufficient revenues to maintain their aging facilities, the hospitals declined further, adding to negative perceptions of their quality, leading in turn to continuing deterioration of their finances.

“If you have health insurance and a car, you’ll drive [out of the community] for care because a perception exists that bigger, brighter facilities offer better quality services.” – South Carolina Stakeholder

“Would-be patients from Independence chose to get their care elsewhere, which contributed to the death spiral for Mercy Hospital.” – Kansas Stakeholder

Rural hospitals built in neighboring communities under Hill-Burton now compete for limited patients, federal dollars, and health care resources. All three case study hospitals were located in close proximity to larger hospitals in nearby communities. One respondent commented: “If you were going to plan placement of hospitals now, you would implement a very different design.” Clusters of hospitals within a small geographic area are not only a barrier to CAH designation, but also result in hospitals competing for limited federal dollars, resources, providers, and patients. Along the same lines, some respondents observed that rivalries between neighboring communities, counties, and hospitals have bred competition instead of collaboration, sometimes leading to redundant health care and other services and costly inefficiencies.

Corporate business decisions, rather than assessments of local needs or planning, drove the hospital closures. In all three sites, the large health systems that owned and managed the hospitals made the decision to close them based not on community needs, but on corporate business considerations that favored other hospitals in their system over the ones they closed. Typically, there was little or no local process of consultation or public input. In both Fulton, Kentucky and Bennettsville, South Carolina, local stakeholders reported that the hospital’s owner/operator invested its resources preferentially in a neighboring community hospital that it also owned, at the expense of the closed facility. Mercy Health System invested in rebuilding its hospital in Joplin, Missouri – 75 miles from Independence – after it was destroyed by a tornado, and reportedly “lost its focus” on the smaller Mercy Hospital in Independence. Although the hospital worked with an advisory group that included community stakeholders to address the closure of Mercy Hospital and potential alternative uses of the facility, the advisory group had limited influence over the ultimate decision by Mercy Health System to close it. The group was also reportedly required to maintain confidentiality; as a result, the public felt uninformed and excluded from the process. In Kentucky, public officials from Fulton County wanted to take over the hospital and find other providers who might continue services in the area, but CHS rejected this offer, likely, to preempt competition for patients in the county. Further, CHS placed restrictions on the use of the hospital – namely, it permitted no acute care facility to operate there, an action that one respondent said “strangled” the community’s access to local health care services.

Several respondents cited the “shift from mission to margin” as a major factor in the hospital closures and in the lack of consideration or planning for the impact on the community. A number observed that local residents and public officials often lack the expertise or experience needed to negotiate with large corporate health systems and have limited understanding of the transformations taking place in health care delivery and payment systems widely.

Changes in Medicare and Medicaid payment over the past few years have had an adverse effect on rural hospitals. Decreases in Medicare reimbursement rates have exacerbated financial pressure on already struggling rural hospitals, especially those with an older patient population. In recent years, Medicare cuts arising from budget sequestration and other federal policies14  have led to lower reimbursement rates overall, while specific provisions of the ACA, such as the Readmissions Reduction Program, under which CMS reduces PPS payments to inpatient hospitals with high readmission rates, have also resulted in lower Medicare reimbursements for many hospitals.15  CAHs are often in a stronger financial position than rural PPS hospitals because they receive cost-based Medicare reimbursement, but our study hospitals either did not meet the criteria to qualify as a CAH or had declined to explore conversion options. Since 2006, it also has been more difficult to obtain a CAH designation because states can no longer waive the CAH distance requirements by identifying a hospital as a “necessary provider.”

Rural hospitals may also be adversely affected by budget-driven state policy actions, such as Medicaid rate freezes or other reductions, and by transitions to Medicaid managed care. For example, a stakeholder in Fulton, Kentucky reported that some Medicaid managed care plans were working to discourage inappropriate emergency department (ED) use by reimbursing the hospital only a small triage fee, rather than the full fee, for visits later determined to be non-emergent. Because the ED is a major access point for primary care in rural communities, the majority of patients in the ED present with more common ailments that do not require emergency care. Nevertheless, ED providers must determine if patients have a life-threatening condition and may deliver a variety of services to patients who turn out to need urgent or primary care; due to the triage fee policy, they will not be reimbursed for a significant portion of their costs for such patients.16  Because rural hospitals are generally more reliant on public payers, changes to Medicare and Medicaid reimbursement can have a more significant effect on these hospitals. An analysis of profitability of urban and rural hospitals by Medicare payment classification shows that rural PPS hospitals with 26-50 beds and Medicare Dependent Hospitals had the lowest profitability.17 

Rural hospitals have not adapted to new models of payment and service delivery that emphasize preventive and primary care provided in outpatient settings. Increasingly, Medicare, Medicaid, and large private payers are implementing payment and delivery system reforms that move “from volume to value” and shift investment away from inpatient care and toward preventive and primary care and greater access to care in outpatient settings. As one South Carolina stakeholder put it, “We used to pay hospitals to keep patients in, now we pay to keep them out.” Consistently, we heard from respondents that rural hospitals have been slow to adapt to these reforms and have instead maintained their hospital-centric focus oriented toward generating inpatient admissions.

South Carolina’s Healthy Outcomes Plan (HOP) is an initiative to support hospitals proposing service delivery models to coordinate care for chronically ill, uninsured, high utilizers of emergency department (ED) services.  Approximately $40 million was reportedly spent statewide, with some funding for Marlboro Park Hospital.  However, it was not enough to save the hospital; one respondent described the impact of the program on rural hospitals as “like putting a finger in a dike.”

What is the impact of rural hospital closures on access to care?

The hospital closures reduced access to emergency care. In all three case studies, stakeholders emphasized that a major impact of the hospital closure was the loss of access to emergency care in the community. They pointed out that the hospitals’ EDs had also served as a safety-net for people with acute mental health or addiction treatment needs18  by stabilizing them and arranging for their transport when needed; when the hospital closed, local capacity to address these needs disappeared. Respondents cited the immediate and ongoing need to ensure emergency transportation to neighboring hospitals following the closure.

Some public investment in ambulance services may be needed in the wake of a rural hospital closure. After Mercy Hospital closed, for example, the city of Independence purchased two new ambulances and hired an additional EMS crew. Fulton, Kentucky officials responded to Parkway Regional’s closure by funding the ambulance service with city and county dollars. However, respondents also noted that there can be challenges transporting patients back home after they are taken by ambulance to another community for care and this problem can be significant for low-income patients who do not have the means or support system in place to ensure their travel home.

Many physicians and other providers left the community immediately following the rural hospital closure. Regardless of hospital closures, rural communities characteristically face difficulty recruiting and retaining providers, resulting in systemic workforce shortages. The large hospital systems in the three study communities typically employed the local physicians, so when the hospital closed, many physicians relocated to another hospital in the owner’s system or left the area. As a result, the communities were often left without key providers. In Independence, Kansas, providers began to leave Mercy Hospital even before it closed when talk of closure “was in the air,” hastening the deterioration of the already struggling hospital. Some also said that Mercy Health System made competitive offers to physicians formerly employed by the hospital to induce them to transfer to another hospital in the Mercy system, farther away from Independence. Respondents reported that physicians formerly employed by the hospital in Bennettsville, South Carolina were barred from entering into agreements with other hospitals in the area and were relocated to CHS’ Martin, Tennessee facility following the closure. In all three study sites, respondents cited the outmigration of providers in the wake of the hospital closure as a significant problem, especially given the challenges of recruiting providers to rural areas.

Because hospital emergency departments are a major source of primary care in rural areas, closures can have a significant impact on access to primary care, but some communities can fill these gaps. Respondents in all three study sites reported that most visits to the hospital ED were for urgent care or primary care because access to such care in community-based outpatient settings was limited; “true emergencies” made up only a small percentage of all ED visits. One South Carolina respondent referred to a “culture of overutilization” of rural EDs. Stakeholders from Kansas estimated that as many as 90% of ED visits to Mercy Hospital were for non-emergencies.

In two of the communities we studied (Independence, Kansas and Bennettsville, South Carolina), some stakeholders described a relatively smooth transition to community-based primary care following the closure. In both cases, federally qualified health centers (FQHCs) in or near the community were able to expand their provision of primary care. In Independence, office-based primary care is available in the community, while in Bennettsville, more people have to travel to obtain primary care since the closure. Some respondents commented that, following the closure of the hospital in Independence, nearby hospital systems opened competing primary care clinics in the community, leading to a fragmented health system. However, others noted that increased provider and health system interest in serving their community, often as a means to expand their market share, improved access to primary care.

At the time of our interviews, access to primary care remained more challenging in Fulton, Kentucky, where there was no nearby FQHC. Respondents reported that access to care is affected by ongoing competition between the two main health systems in the area, CHS and LifePoint. The border between Kentucky and Tennessee runs through the Fulton community and, following the closure, CHS moved some providers and staff to its Martin, Tennessee facility and relocated its outpatient services from Fulton to a new clinic across the state border in South Fulton, Tennessee, where at least some Medicaid patients are not eligible to receive care. LifePoint is trying to establish clinics in Fulton County but CHS placed a restriction on the Parkway Regional facility to prevent it from being used as a primary care hospital or operating in an acute capacity.

The hospital closures also exacerbated gaps in access to specialty care. Rural hospitals in small communities cannot afford to offer the range of specialty services available in hospitals in larger communities, and rural residents routinely travel for certain types of specialty care, particularly for complex medical needs. But respondents reported that pre-existing difficulties in accessing specialty care increased following the closures. In many cases, specialists who had visited the local hospital on a regular basis to provide outpatient visits were no longer available to see patients locally after the hospital closed. With the closure, local residents also lost their access point for referrals to subspecialists. Several respondents commented that many people now forgo lab work and diagnostic imaging rather than travel to another community for the services. Problems with access to obstetric care, diagnostic testing, laboratory tests, and mental health care – services that had often been provided at the hospital before its closure but were no longer available locally – were a consistent theme. Unmet need for mental health and substance use disorder treatment, a significant issue before the hospital closures, has also intensified. Respondents across all three communities reported that longer travel time and distance exacerbate tendencies to delay or forgo care, particularly among elderly and low-income individuals.

What are the other effects of rural hospital closures on communities?

Hospital closures result in job losses and have other ripple effects in the surrounding community. A hospital closure can eliminate a hundred or more jobs immediately, a significant loss in communities with small populations. In some cases, the local hospital is one of the largest employers in the community. Some health care providers and other hospital employees move away following a closure; others remain but commute elsewhere for work. The loss of jobs and residents has a negative impact on the tax base in the community, shrinking available resources for schools and other public services, potentially impacting jobs in the public sector as well.

Hospital closures can make it more challenging for rural communities to attract employers. The loss of a hospital makes it more difficult for rural communities to recruit new industries and employers to the area. Some businesses require, as a condition of locating in an area, that their employees have access to a hospital ED in close proximity. Thus, a hospital closure can compound the very same economic strains that contributed to the closure in the first place. Some respondents noted that the impact of the hospital closure on the local economy was more significant than its impact on access to care. The challenge, according to one expert, raises issues beyond health policy: “How can we make sure rural communities can be left financially viable without a hospital?”

How do state Medicaid expansion decisions affect rural hospitals and access to care?

Medicaid expansion increases access to care in rural communities.19  In Fulton, many uninsured adults gained coverage when Kentucky implemented the Medicaid expansion, giving them access to providers and services they were previously unable to afford. Respondents reported that Medicaid coverage of non-emergency medical transportation is very important in rural communities and even more so in the event of a local hospital closure, because residents more often have to travel to get care. Respondents in Kansas and South Carolina reported that the tendency of uninsured residents in rural communities to forgo preventive care and to delay treatment until their health conditions worsen can be exacerbated by the loss of a local hospital, and they said that a decision by their state to expand Medicaid would have increased access to needed care for the low-income uninsured population.

However, Medicaid expansion alone cannot overcome the financial challenges facing rural hospitals. Respondents in all three case studies expressed the opinion that although Medicaid expansion can bring increased revenues into struggling hospitals, it is only one of many factors that impact hospitals’ financial sustainability. Kentucky respondents pointed out that the state’s Medicaid expansion may have delayed Parkway Regional Hospital’s closure, but that since the Medicaid expansion, Parkway Regional and three other rural hospitals in the state have closed. In Kansas, respondents likewise cited the lack of Medicaid expansion as one of many factors that contributed to Mercy Hospital’s closure – one person described the hospital’s demise as “death by a thousand cuts.”20  The theme that emerged in all three case studies is that what caused the hospital closure was the confluence of difficult rural demographic and economic trends, the failure of the hospital or health system to adapt to changing health care payment and delivery systems, aging facilities and challenging payer mixes. Stakeholders across the board said they believed that increased financing through Medicaid expansion could help other at-risk rural hospitals, but not alone overcome these fundamental challenges.

A recent study found that while rural hospitals were showing declines in charity care as a result of the ACA, the net financial impact was less clear because of bad debt from high-deductible plans as well as “shortfalls” between payments and costs of care in Medicare and Medicaid.21  The study also noted concern about upcoming cuts to Medicaid Disproportionate Share payments.

What do increasing hospital closures imply for the future of rural health care delivery and access?

Rural communities could benefit from new health care delivery models that can provide access to care. Several stakeholders emphasized that new health care delivery models are necessary to address rural health needs. They discussed various strategies to meet the need for more primary and preventive care, effective referral systems for specialty care, and alternative access to emergency services when a hospital closes. They also emphasized the need for reforms to permit increased use of telehealth services. They suggested that an appropriate model would lie somewhere between a CAH and an FQHC; such models, they noted, would require changes in federal Medicare reimbursement policy and/or changes in health care facility state licensure rules. Several leading rural models are summarized in the table below. In addition, the federal government has funded several rural health demonstration projects to test out new models of care.22   (See box about Rural Health Transformation Models)

More investment in transportation could mitigate the impact of rural hospital closures. Road systems were good in areas surrounding our study communities and, in all three sites, there was at least one neighboring hospital within 15 miles. But even in these communities, respondents stressed the need for more reliable transportation systems to facilitate access to health care services. Many rural communities do not have public transportation systems, so patients must have a car or someone willing to share their car or drive them, and money for gas to travel to seek medical care. Travel is an issue particularly for elderly people, who often cannot drive. One respondent emphasized that rural health policy needs to address the social determinants of health as well.

The investment of additional resources to support community needs assessments and regional planning could help further efforts to ensure access to care in rural communities. Despite the widespread movement away from hospital-centric health care delivery elsewhere, many rural communities continue to rely on the local hospital as the locus of care. Rural communities frequently lack the resources and infrastructure to evaluate community needs and develop a plan for access to care post-hospital closure. When there is no plan for the future, the announcement of a hospital closure can lead to chaos and divisions in a community. Regional planning efforts and technical assistance could help to educate and engage local residents, support assessments of community health care needs, improve the ability of communities to negotiate with large health systems, and promote integrated systems of primary care, referral centers for specialty care, and rational allocation of health care resources overall. Regional planning in areas where large hospital systems are present has the potential to bring the advantages of these systems’ resources, health information systems, and capacity to invest in facilities, recruit providers, develop specialty referral systems, and implement telehealth initiatives, to rural communities. With such planning, these communities might be able to demonstrate to prospective new employers that a strong health care system is in place, even if there is no hospital in the local community.

Rural Health Transformation Models

Current State Initiatives

The Kansas Hospital Association is promoting “Primary Health Centers” to shift small rural hospitals away from a focus on admissions to more outpatient and transitional services. They are proposing two alternative models, both of which would be open 365 days a year, but one for 12 hours/day and the other 24 hours/day. Such a model will require changes in state licensing requirements to authorize this new provider type and changes in Medicare reimbursement policies.23 

The Oregon Rural Health Reform Initiative is an effort to sustain rural hospitals financially by transitioning them away from a cost-based reimbursement model. Instead, rates at these rural hospitals will be negotiated with local coordinated care organizations, under the oversight of the Oregon Health Authority (OHA). Currently, OHA is working to determine which hospitals will remain financially viable should they shift to a coordinated care payment model, and which hospitals should continue to operate with cost-based reimbursement.24 

National Initiatives

The Medicare Payment Advisory Commission (MedPAC) Proposal offers two possible models designed to preserve access to health services in rural areas while eliminating the financial burden of maintaining an acute inpatient care facility. In the first model, struggling hospitals would maintain their ED 24/7 and would also continue to provide outpatient services. Hospitals would be reimbursed by a PPS rate per service and would also receive a fixed grant to help offset standby costs. The second option involves hospitals transitioning to a primary care clinic or FQHC-like model that would be open between 8 and 12 hours per day, along with ambulance services that would be available at all times. These hospitals would also be reimbursed by a PPS rate per service and would receive a fixed grant to help fund the “ambulance standby capacity” as well as any other uncompensated care costs.25 

The REACH Act (Rural Emergency Acute Care Hospital Act), introduced by Senators Charles Grassley (R-IA) and Cory Gardner (R-CO), would create a new Medicare payment designation called a Rural Emergency Hospital (REH), to sustain emergency care in rural communities. The new designation is aimed at addressing the difficulty that CAHs may have in achieving occupancy rates high enough to keep their inpatient beds, and thus the hospitals themselves, open. REHs would provide only 24/7 emergency care, observation care, and outpatient services (which could include telehealth services), as well as ambulance services to transport patients who need a higher level or care or inpatient admission to larger regional medical centers; REHs would not operate any acute-care inpatient beds themselves. CAHs and other small rural hospitals (<50 beds) that meet these criteria would be eligible for the designation. The idea is that these hospitals would likely be more financially viable without an inpatient center and could instead focus solely on stabilizing and transporting patients to larger regional medical centers, while continuing to receive the benefit of higher Medicare reimbursement rates.26 

The Save Rural Hospitals Act introduced by Representative Same Graves (R-MO) would reverse sequester cuts made to CAHs and small rural hospitals, and also seek to preserve or increase federal payments for low-volume and Medicare-dependent hospitals. Among other provisions, the Graves proposal delays penalties for small rural hospitals that have failed to transfer to an electronic health record system, and also increases Medicare payments for ground ambulance services in rural areas.27 

Conclusion

The number of rural hospital closures has increased significantly in recent years. This trend is expected to continue, raising questions about the impact the closures will have on rural communities’ access to health care services. Both the examination of rural hospital closures in three communities as well as interviews with national experts show that a number of factors contribute to rural hospital closures, including demographics (aging, poor, and declining populations), hospital finances (high uninsured rates and high shares of public paying patients), and overall changes in how care is delivered. This research also revealed that the hospital closures reduced local residents’ access to care (especially emergency care), led to an outmigration of health care professionals, and worsened pre-existing challenges in obtaining access to specialty care. Although some communities were able to adapt to fill in gaps in primary care post-closure, elderly and low-income individuals were more likely to face transportation challenges and thus more likely to delay or forgo needed care. The experience of study hospitals, stakeholder interviews, and other research show that a state’s decision about the Medicaid expansion has an important impact on hospital revenues and access to care, but the sustainability of rural hospitals depends on a broader set of factors. Looking ahead, new models of health care delivery, along with new models of payment and financing, may be better able than current admissions- and volume-driven systems to support the needs of rural communities. Such reconfiguration may require federal support and assistance as well as regional planning efforts.

This issue brief was prepared by Jane Wishner and Patricia Solleveld from the Urban Institute and Julia Paradise, Robin Rudowitz and Larisa Antonisse from the Kaiser Family Foundation’s Commission on Medicaid and the Uninsured (KCMU).  The authors thank John Holahan from the Urban Institute for his comments on drafts of this brief. They also express their appreciation to individuals who were interviewed for this report. Their expertise and insights were invaluable to this project.

Appendix

Description of Selected Hospitals

Marlboro Park Hospital – Bennettsville, South Carolina

Marlboro Park Hospital stopped admitting patients on April 25, 2015 and transferred all its remaining patients to nearby Chesterfield General Hospital in Cheraw, South Carolina, approximately 15 miles away.28  Both hospitals were owned by a real estate trust and had been operated by Community Health Systems (CHS), which announced in 2014 that it would not renew the leases for either hospital when they expired on April 30, 2015. McLeod Health Systems, a South Carolina system, assumed operation of Chesterfield General Hospital and renamed it McLeod Health Cheraw, but it declined to operate Marlboro Park. According to the South Carolina Department of Health and Human Services, Marlboro Park Hospital lost nearly $35 million between 2009 and 2013 – more than any other hospital in South Carolina, while Chesterfield generated an $8.5 million profit during those same years. Currently, some residents of Bennettsville receive care at McLeod Health Cheraw, while others travel to one of the two hospitals in Florence, South Carolina (approximately 40 miles away by car) and Scotland Memorial Hospital in Laurinberg, North Carolina (approximately 17 miles away by car).

Mercy Hospital – Independence, Kansas

Mercy Hospital, part of the Mercy Health System, began a phased closure on October 10, 2015. In 2014, the hospital formed a task force to consider an affiliation with the Coffeyville Regional Medical Center, but those discussions ended after the hospitals were unable to reach an agreement.  The nearest hospitals are now 16 minutes away in Neodesha and 20 miles away in Coffeyville (the Coffeyville hospital is now the only hospital in Montgomery County).

Parkway Regional Hospital – Fulton, Kentucky

After serving one of the poorest counties in western Kentucky for over two decades, Parkway Regional Hospital closed its emergency department and 70-bed inpatient hospital in Fulton, Kentucky in March, 2015.  Two nearby hospitals in Union City and Martin, Tennessee competed with Parkway Regional for many of the same patients.29  Fulton residents who had private insurance or could afford the cost typically left Fulton to seek care, primarily at Tennova Healthcare – Volunteer Martin, a 100-bed hospital only 12 miles away in Martin, Tennessee. Community Health Systems (CHS), the owner of Parkway Regional, also operates the hospital in Martin and promoted use of that Tennessee facility, including for specialty care, both before and after the closure of Parkway Regional. The closest Kentucky hospital is Jackson Purchase Medical Center (operated by LifePoint Health) in Mayfield, Kentucky – 22 miles from the town of Fulton. Some Fulton County residents received care at Jackson Purchase before the closure, including women who went there for labor and delivery services.

Appendix Table 1: Characteristics of Study Communities Compared to State and U.S. Overall, 2014

Table 1: Characteristics of Select Communities Compared to State and U.S. Overall, 2014
U.S OverallKentuckyFulton County, KY
Population 318,857,0564,413,4576,265
Percent Change in  Population (2010-2014)3.3%1.7%-8.4%
Age
Under 1823.1%22.9%21.0%
Over 6514.5%14.8%19.4%
Race/ethnicity
White, single race77.4%88.3%72.4%
Black, single race13.2%8.2%24.3%
Hispanic or Latino17.4%3.4%1.5%
Poverty Rate14.8%19.1%31.2%
Median Household Income (2010-2014)$53,482$43,342$32,948
NationalSouth CarolinaMarlboro County, SC
Population 318,857,0564,832,48227,924
Percent Change in Population (2010-2014)3.3%4.5%-3.5%
Age
Under 1823.1%22.4%20.7%
Over 6514.5%15.8%15.2%
Race/ethnicity
White, single race,77.4%68.3%42.1%
Black, single race13.2%27.8%51.0%
Hispanic or Latino17.4%5.4%3.2%
Poverty Rate14.8%18.0%31.4%
Median Household Income (2010-2014)$53,482$45,033$28,765
 NationalKansasMontgomery County, KS
Population 318,857,0562,904,02134,065
Percent Change in  Population (2010-2014)3.3%1.8%-4.0%
Age
Under 1823.1%24.9%23.9%
Over 6514.5%14.3%18.1%
Race/ethnicity
White, single race77.4%86.8%85.2%
Black, single race13.2%6.3%5.8%
Hispanic or Latino17.4%11.4%6.3%
Poverty Rate14.8%13.6%18.0%
Median Household Income (2010-2014)$53,482$51,872$40,716
SOURCE: All estimates are from the Census Bureau’s 2014 QuickFacts. QuickFacts provides statistics for all states and counties and for cities and towns with a population of 5,000 or more. http://www.census.gov/quickfacts/table/PST045215/00

Endnotes

  1. Brystana G. Kaufman, Sharita R. Thomas, Randy K. Randolph, Julie R. Perry, Kristie W. Thompson, George M. Holmes, and George H. Pink, “The Rising Rate of Rural Hospital Closures,” Journal of Rural Health. 32, no. 1 (2016): 35-43, http://onlinelibrary.wiley.com/doi/10.1111/jrh.12128/epdf;  Kristin L. Reiter, Marissa Noles and George H. Pink, “Uncompensated Care Burden May Mean Financial Vulnerability for Rural Hospitals in States that Did Not Expand Medicaid. Health Affairs  vol. 34, no. 10 (2015): 1721-1729, doi: 10.1377/hlthaff.2014.1340. http://content.healthaffairs.org/content/34/10/1721.abstract; Sharita Thomas, Mark Holmes, George Pink.  2012-2014 Profitability of Urban and Rural Hospitals by Medicare Payment Classification. (NC Rural Health Research Program, March 2016).  http://www.shepscenter.unc.edu/product/2012-14-profitability-of-urban-and-rural-hospitals-by-medicare-payment-classification/ ↩︎
  2. For a current list of state Medicaid expansion decisions, see https://modern.kff.org/health-reform/state-indicator/state-activity-around-expanding-medicaid-under-the-affordable-care-act/ ↩︎
  3. Kaufman, Thomas, Randy K. Randolph, Julie R. Perry, Kristie W. Thompson, George M. Holmes, and George H. Pink, “The Rising Rate of Rural Hospital Closures,” Journal of Rural Health. 32, no. 1 (2016): 35-43, http://onlinelibrary.wiley.com/doi/10.1111/jrh.12128/epdf; Mark Holmes and George H. Pink, Change in Profitability and Financial Distress of Critical Access Hospitals from Loss of Cost-Based Reimbursement. (NC Rural Health Research Program, December 2013),  http://www.shepscenter.unc.edu/wp-content/uploads/2013/12/Change-in-Profitability-and-Financial-Distress-of-CAHs-November-2013.pdf. For a history of the Medicare prospective payment system, see Centers for Medicare & Medicaid Services, Office of Inspector General, Office of Evaluation and Inspections, Region IX, “Medicare Hospital Prospective Payment System, How DRG Rates Are Calculated and Updated” (August 2001). http://oig.hhs.gov/oei/reports/oei-09-00-00200.pdf ↩︎
  4. The Flex Program was initially authorized by the Balanced Budget Act of 1997. For more information on the Flex Program, see https://www.ruralcenter.org/tasc/flex-program-fundamentals ↩︎
  5. The Medicare Payment Advisory Commission, Critical Access Hospitals Payment System. (Washington DC: October 2014). http://www.medpac.gov/documents/payment-basics/critical-access-hospitals-payment-system-14.pdf ↩︎
  6. Victoria Freeman, Kristie Thompson, H. Ann Howard, Randy Randolph, and G. Mark Holmes. The 21st Century Rural Hospital Chart Book, March 2015.  (Rural Health Research and Policy Center, March 2015). http://www.shepscenter.unc.edu/wp-content/uploads/2015/02/21stCenturyRuralHospitalsChartBook.pdf ↩︎
  7. Ibid. Rural Referral Centers (RRCs) may also be classified as Medicare Dependent Hospitals (MDHs) or Sole Community Hospitals (SCHs). The percentages given for MDHs and SCHs refer to hospitals that have only those designations and are not also RRCs. As explained by Freeman, Thompson, et al., “[t]hese payment programs [CAHs, MDHs, SCHs and RRCs] recognize the challenges of providing care in rural settings and provide enhanced or supplemental reimbursement. Qualifications for these programs are complex and may include locations, hospital size, staffing, network agreements, patient demographics including insurance, and patient referral patterns.” ↩︎
  8. The Medicare Payment Advisory Commission, Critical Access Hospitals Payment System. (Washington DC: October 2014). http://www.medpac.gov/documents/payment-basics/critical-access-hospitals-payment-system-14.pdf ↩︎
  9. Ibid. ↩︎
  10. The North Carolina Rural Health Research Program defines a rural hospital as “any short-term, general acute, non-federal hospital” that is either: (a) not located in a metropolitan county; (b) located in a Rural-Urban Commuting Area Code (RUCA) type 4 or higher; or (c) a Critical Access Hospital. For a list of the hospitals and more information about the project, see http://www.shepscenter.unc.edu/programs-projects/rural-health/rural-hospital-closures/   ↩︎
  11. Robert Bradfield. Parkway Regional Hospital ending in-patient and ER services. (Paducah, Kentucky, WPSD Local 6 News, December 10, 2014). http://www.wpsdlocal6.com/story/27598425/parkway-regional-hospital-ending-in-patient-and-er-services; West Kentucky Star Staff. Fulton Hospital Closing ER, Inpatient Service. (The West Kentucky Star, December 12, 2014). http://www.westkentuckystar.com/News/Local-Regional/Western-Kentucky/Fulton-Hospital-Closing-ER-Inpatient-Service.aspx; Amanda Roberts. Last day open for Parkway Regional Hospital. (Paducah, Kentucky, WPSD Local 6 News, March 31, 2015). http://www.wpsdlocal6.com/story/28676177/last-day-open-for-parkway-regional-hospital; Rob Canning. Hospital Closure Will Have ‘Domino Effect’ on Fulton Economy” (WKMS, Murray State’s NPR Station, December 12, 2014). http://wkms.org/post/hospital-closure-will-have-domino-effect-fulton-economy#stream/0 ↩︎
  12. Alan Bavley and Dave Helling. Closing of Kansas hospital adds to Medicaid expansion debate. (Kansas City, Kansas, The Kansas City Star, October 17, 2015). http://www.kansascity.com/news/business/health-care/article39620442.html#storylink=cpy; U.S. News and World Report. Mercy Hospital Independence, Independence KS. http://health.usnews.com/best-hospitals/area/ks/mercy-hospital-independence-6670440. More information on the Mercy Health system available at: https://www.mercy.net/ ↩︎
  13. Rod Overton. Marlboro Park Hospital in Bennettsville to close, officials say. (WBTW News13, April 22, 2015). http://wbtw.com/2015/04/22/marlboro-park-hospital-in-bennettsville-to-close-officials-say/ South Carolina Health Data, Statistics and Insights in SC Health Care. (2013). http://schealthdata.org/list; McLeod Health Cheraw, History. http://www.mcleodhealth.org/cheraw/mcleod-health-cheraw-history.html ↩︎
  14. The American Hospital Association (AHA) prepared a summary of Medicare policies unrelated to the ACA that have resulted in lower payments to hospitals since 2010. Helen Adamopoulos. AHA: Hospital Medicare, Medicaid Payments Cut by $113B Since 2010. (Becker’s Hospital Review, January 15, 2014). http://www.beckershospitalreview.com/finance/aha-hospital-medicare-medicaid-payments-cut-by-113b-since-2010.html. AHA’s chart can be found at http://www.aha.org/content/16/acahospitalcuts.pdf ↩︎
  15. Information about the Readmission Reduction Program can be found at https://www.cms.gov/medicare/medicare-fee-for-service-payment/acuteinpatientpps/readmissions-reduction-program.html ↩︎
  16. Melissa Patrick. Bill would require Medicaid managed-care firms to pay contracted fees for ER visits; Senate hearing targets two companies. (Kentucky Health News, February 27, 2015). http://kyhealthnews.blogspot.com/2015/02/bill-would-require-medicaid-managed.html ↩︎
  17. Sharita Thomas, Mark Holmes, George Pink. 2012-2014 Profitability of Urban and Rural Hospitals by Medicare Payment Classification. (NC Rural Health Research Program, March 2016). http://www.shepscenter.unc.edu/product/2012-14-profitability-of-urban-and-rural-hospitals-by-medicare-payment-classification/ ↩︎
  18. While our interviews did not address what type of mental health and substance use incidents led people to the emergency departments of these hospitals, rural communities are facing significant challenges with the current opioid epidemic. See Toliver, Z. The Opioid Epidemic: Testing the Limits of Rural Healthcare. (The Rural Monitor, Rural Health Information Hub, May 18, 2016). https://www.ruralhealthinfo.org/rural-monitor/opioid-epidemic/ ↩︎
  19. All three of our case studies involved hospitals that were located close to a state border. The ability of Medicaid patients to access care across state lines may depend on state rules and Medicaid managed care contracts and networks even if a provider in another state is the closest provider. ↩︎
  20. Others have used this concept to describe the current status of many rural hospitals. See, e.g., Lemming M, Wyland M. February 23, 2016. Death by a Thousand Cuts: The Flickering Lights of the U.S. Rural Hospital. Boston, Massachusetts: The Nonprofit Quarterly https://nonprofitquarterly.org/2016/02/23/death-by-a-thousand-cuts-the-flickering-lights-of-the-u-s-rural-hospital/ ↩︎
  21. Kristie Thompson, Kristen Reiter, Rebecca Whitaker, Sharita Thomas. Does ACA Insurance Coverage Expansion Improve the Financial Performance of Rural Hospitals?  (NC Rural Health Research Program, April 2016).  http://www.shepscenter.unc.edu/product/aca-insurance-coverage-expansion-improve-financial-performance-rural-hospitals-2/ ↩︎
  22. Several of these demonstrations are described at https://www.ruralhealthinfo.org/new-approaches ↩︎
  23. Kansas Hospital Association Rural Health Visioning Technical Advisory Group. March 2015. Sustaining Rural Health Care in Kansas, The Development of Alternative Models. Topeka, Kansas: Kansas Hospital Association. http://www.healthforum-edu.com/rural/PDF/2016/BendbutDontBreakFlexibleDeliveryModelsforRuralCommunities2.pdf; Susan Morse, Kansas plan would convert many rural hospitals into primary health clinics. (Healthcare Finance, August 18, 2015). http://www.healthcarefinancenews.com/news/kansas-plan-would-convert-many-rural-hospitals-primary-health-clinics ↩︎
  24. The Oregon Health Authority oversees the state’s Rural Health Reform Initiative. Information about the plan is available at  http://www.oregon.gov/oha/pages/rhri.aspx ↩︎
  25. Ron Shinkman. MedPAC suggests alternative models for rural hospitals. (Fierce Healthcare, October 15, 2015). http://www.fiercehealthcare.com/finance/medpac-suggests-alternative-models-for-rural-hospitals More information on MedPAC’s proposals is available at: http://www.medpac.gov/documents/october-2015-meeting-presentation-models-for-preserving-access-to-emergency-care-in-rural-areas-.pdf?sfvrsn=0 ↩︎
  26. Rural Emergency Acute Care Hospital Act. S. 1648. 114th Congress. (2015). https://www.congress.gov/bill/114th-congress/senate-bill/1648 ↩︎
  27. Save Rural Hospitals Act. H.R. 3225, 114th Congress. (2015).  https://www.congress.gov/bill/114th-congress/house-bill/3225/text ↩︎
  28. Lauren Sausser. Two rural Pee Dee hospitals may close in May.(The Post and Courier, January 10, 2015). http://www.postandcourier.com/article/20150110/PC16/150119974 ↩︎
  29. Staff report. Fulton patients to get care at local clinic. (The Paducah Sun, December 19, 2014). http://www.paducahsun.com/news/local/121914_PS_Fulton-hospital-folo ↩︎
News Release

New Video Series From Greater Than AIDS Gives Voice to Trans Women About High Rates of HIV Facing Their Community

Diverse Group of Trans Women Open Up about Overcoming Challenges to Live Authentic and Healthy Lives

Published: Jul 7, 2016

MENLO PARK, Calif., – At a time of growing dialogue about transgender people and issues, the impact of HIV on the community has been largely absent. Transgender women are among those at highest risk for HIV today. The CDC estimates that one in four trans women in the U.S. is living with HIV, and among Black trans women it is one in two.

In response to these overwhelming statistics and the vulnerability of trans women, Greater Than AIDS is launching a new video series that gives voice to transgender women to share their own narrative about HIV, both the impact and response that is needed.

Produced by the Kaiser Family Foundation and the UCSF Center of Excellence in Transgender Health, with funding from ViiV Healthcare’s Positive Action Programme, Empowered: Trans Women & HIV confronts the social stigma facing many transgender women and promotes actions to improve health and well-being.

“We’ve come a long way. We don’t have to live in the shadows anymore, but we still have more work to do. We are not yet where we need to be when it comes to HIV and its impact on trans women,” said JoAnne Keatley, MSW, Director, UCSF Center of Excellence for Transgender Health, who appears in and advised on the campaign. “With this video series, we take a huge step forward as a community in bringing these issues into the light.”

Empowered_Trans_Women__HIV.jpg

Anchored by an intimate and inspiring conversation, a diverse group of trans women, including some living with HIV and others who are not, share challenging moments of diagnosis, disclosure, discrimination, and the loss of close friends, as well as triumphs of finding gender-affirming health care providers, learning about PrEP and transitioning safely while on HIV treatment.

“This campaign is a wake-up call to the health care community about the need for gender-affirming care and services when it comes to addressing the high rates of HIV among trans women,” said Tina Hoff, Senior Vice President, Media Partnerships & Health Communications, Kaiser Family Foundation. “Preventing and treating HIV should not stand in the way of living as one’s true authentic self.”

“The campaign supports trans women in a way that’s meaningful to them and makes sure those important issues connected to their well-being, including HIV, can be explained and discussed candidly. As a company, we are proud to support this innovative programme which gives voice to trans women, as an important part of our commitment to all people at risk or affected by HIV.” said Michael Joyner, Director, Positive Action for MSM and Transgender Programme.

The campaign will be featured at the upcoming International AIDS Conference in Durban, South Africa (July 18-22), which for the first time includes a Trans pre-conference (July 17).

For more about the campaign, including a community toolkit, go to empowered.greaterthan.org and to watch the full series go to youtube.com/greaterthanaids.

About Greater Than AIDS

Greater Than AIDS is a leading public information response focused on the U.S. HIV/AIDS epidemic from the Kaiser Family Foundation. Through targeted media campaigns and community outreach, Greater Than AIDS and its partners work to increase knowledge and fight stigma, while promoting direct actions to reduce the spread of HIV.

About Kaiser Family Foundation

The Kaiser Family Foundation, a leader in health policy analysis, health journalism and communication, is dedicated to filling the need for trusted, independent information on the major health issues facing our nation and its people. The Foundation is a non-profit private operating foundation based in Menlo Park, California.

About UCSF Center of Excellence for Transgender Health

The Center of Excellence for Transgender Health works to improve the overall health and well-being of transgender individuals by developing and implementing programs in response to community-identified needs. The CoE combines the unique strengths and resources of a nationally renowned training and capacity-building institution, the Pacific AIDS Education and Training Center (PAETC), and an internationally recognized leader in HIV prevention research, the Center for AIDS Prevention Studies (CAPS), both of which are housed at the University of California San Francisco.

About ViiV Healthcare’s Positive Action Programme

Positive Action works with those communities most vulnerable to HIV disease, including youth, girls and women, sex workers, gay men, men who have sex with men (MSM), transgender people, injecting drug users (IDU), the homeless and the incarcerated. Our projects range across education, prevention, care and treatment-related activity such as treatment literacy and community/clinical engagement.

Senate Appropriations Committee approves FY 2017 State and Foreign Operations Appropriations Bill

Published: Jun 30, 2016

The Senate Appropriations Committee approved the FY 2017 State and Foreign Operations Appropriations bill on June 29, 2016, which includes funding for U.S. global health programs at the U.S. Agency for International Development (USAID) and the State Department (see table below) comprising a significant portion of U.S. funding for global health (total funding for global health is not currently known as some funding provided through USAID, HHS, and DoD is not yet available).

A press release from the committee states that funding in the bill for global health would total $8.67 billion, which is $89 million (1%) above the President’s request and $162 million (2%) above the FY 2016 enacted level, but $252 million below (-3%) the House SFOPs appropriations bill .

Funding for bilateral HIV programs as part of the President’s Emergency Plan for AIDS Relief (PEPFAR) matches the President’s request as does funding for the Global Fund to Fight AIDS, Tuberculosis and Malaria (Global Fund), maternal and child health (MCH), family planning and reproductive health (FP/RH), global health security, and malaria (although, the Senate bill does not provide authorization to transfer emergency Ebola funding to malaria programs as was included in the President’s request). Funding for tuberculosis, neglected tropical diseases (NTDs), nutrition, and vulnerable children would increase compared to the President’s request.

The tables below compare U.S. global health funding in the FY 2017 State and Foreign Operations Appropriations bill to the FY 2016 enacted levels and the President’s FY 2017 Budget Request.

FY17 Senate SFOPs