Improving Access to Oral Health Care for Adults in Medicaid: Key Themes from a Policy Roundtable

Author: Julia Paradise
Published: Aug 17, 2016

Executive Summary

State Medicaid and CHIP programs have made significant strides in improving low-income children’s access to and use of dental care, but access to dental care for low-income adults lags far behind. To probe current opportunities, challenges, and strategies related to expanding access to oral health care for adults in Medicaid, the Kaiser Commission on Medicaid and the Uninsured convened a group of experts and stakeholders in Spring 2016 to discuss the issues. Several key themes emerged from the conversation:

  • Oral disease affects overall health and well-being and also bears on other major national concerns. Poor oral health has adverse impacts on overall health and well-being. The detrimental effects of poor oral health and lack of access to services among low-income adults also ramify to employability, opiate abuse, emergency department use, and health disparities.
  • Good oral health among low-income adults is an achievable goal. The science of dental caries is understood and dentistry possesses the clinical tools to prevent and manage it. Emphasizing that this capability exists and raising awareness about the burden and impact of oral disease on low-income adults could increase support and political will to expand Medicaid dental coverage for adults.
  • States have levers in Medicaid to improve access to dental care for adults. States can expand Medicaid to low-income adults, expand dental benefits, ease administrative burdens that dampen dentist participation, improve provider payment, and make strategic use of incentives to improve access to and utilization of dental care.
  • Innovative workforce approaches can help maximize current oral health resources and expand access. Elimination of scope-of-practice restrictions, new provider types, teledentistry, and health center expansion can increase the supply and availability of oral health care to address the growing demand for care among low-income adults as coverage expands.
  • Experts say that ending the oral health crisis will not be possible without transforming the oral health care system. Ending the epidemic of poor oral health among poor populations will require an oral health system centered on prevention and evidence-based care, not driven by an invariable set of covered benefits; integration of oral and primary care; and community-based models of care.

Report

Introduction

A little over 15 years ago, Oral Health in America: A Report of the Surgeon General documented a “silent epidemic” of dental and oral diseases among poor Americans and people of color. Through concerted efforts by the Centers for Medicare and Medicaid Services (CMS) and the states in recent years, the share of low-income children enrolled in Medicaid and the Children’s Health Insurance Program (CHIP) who receive preventive dental care and treatment services has been growing, although continued efforts are needed to further reduce income- and insurance-related disparities in children’s utilization of dental services. Compared to children, access to oral health care for low-income adults has lagged far behind, for two main reasons. First, historically, Medicaid eligibility for non-elderly adults has been very restrictive, leaving many uninsured. Second, while states must provide dental benefits for children in Medicaid and CHIP, adult dental benefits are a state option.

The environment for efforts to increase access to dental care for low-income adults is favorable. Millions of previously uninsured adults have gained coverage under the Affordable Care Act’s (ACA) expansion of Medicaid to non-elderly adults with income up to 138% of the federal poverty level. Growing awareness of the importance of oral health to overall health and well-being, the movement toward more integrated care, and improving state economies have all brought the issue of strengthening adult dental benefits in Medicaid into sharper focus. A major infusion of federal funding has enabled health centers, a key source of dental care in underserved communities, to expand their service capacity. And new workforce and care delivery models designed to increase access to dental care are spreading.

To probe current opportunities, challenges, and strategies associated with improving access to oral health care for adults in Medicaid, the Kaiser Commission on Medicaid and the Uninsured convened a diverse group of experts and stakeholders in Spring 2016 for a roundtable discussion of the issues. Participants included federal and state Medicaid officials, dental providers, a large health center and large Medicaid health plan, leading clinical experts, and policy researchers, who brought a range of expertise and perspectives to the discussion. This report summarizes key themes that emerged from the conversation. A related brief provides key data and information about low-income adults’ oral health status, their access to dental care, and coverage of adult dental benefits in Medicaid.

Key Themes

Good oral health among low-income adults is an achievable goal.

Good oral health is integral to overall health and well-being.

As one roundtable participant put the point: “The mouth is part of the body.” Discussants cited associations between oral infection and chronic diseases prevalent among low-income adults, such as diabetes, and poor birth outcomes. They also stressed the broader impacts of oral health problems on individual well-being, including pain and suffering and potential adverse implications of bad or missing teeth for nutrition, employability, and self-esteem.

The capability to prevent dental disease exists.

It was noted emphatically that dental caries (tooth decay) – in sharp distinction to many other health conditions – is well-understood scientifically, and dentistry possesses the clinical know-how and technology to prevent and manage it. However, federal and state policy decisions have led to limited public spending for oral health coverage and care. Discussants suggested that messaging to policymakers and the public that emphasizes that we have capability to solve this problem, but are under-spending, could build more pressure to increase funding for adult dental coverage and services.

Failure to address the oral health needs of low-income adults affects other national priorities as well; connecting the dots could impel more action.

Roundtable participants underscored that poor access to oral health care among low-income adults stands in the way of national goals to improve population health and health equity. They also pointed out that, in addition to its adverse impact on adult oral health itself, lack of access to dental care is also a factor in both high rates of preventable emergency departments (ED) use and the opioid abuse epidemic. Individuals who lack dental coverage and care often have no alternative but to seek care in a hospital ED when they have oral pain and, since EDs do not generally provide dental services, prescription pain relief medication and a referral slip for dental care is often all they can offer. Discussants also observed that poor teeth can jeopardize job prospects among low-income adults. Interconnections were drawn between oral health problems, drug use, unemployment and economic marginalization, and incarceration, and between these risk factors and persistent social and economic disparities. Attendees suggested that, in framing initiatives to expand Medicaid adult dental coverage, articulating these connections might help broaden the constituency and strengthen the case for federal and state policy action.

A federal initiative to improve access to oral health care for adults would bring focus and resources to the issue and help drive state action.

Reflecting on the CMS Oral Health Initiative focused on children in Medicaid and CHIP, launched in 2010, and the important gains in low-income children’s utilization of dental care that have been achieved since then, discussants proposed that a similar federal initiative directed toward adults in Medicaid that sets goals for improvement, provides technical assistance to states, increases reporting, and establishes dental quality metrics, would sharpen states’ attention to this issue and increase its traction as a policy and financing priority among state decision-makers. CMS could help guide states that are interested in moving forward by providing a model Medicaid adult dental benefit and tools for estimating the cost of adding dental benefits.

More work is needed to improve oral health literacy.

Discussants highlighted the need for increased outreach and education to improve public awareness regarding the importance of oral health. One official from a state with a robust adult dental benefit in Medicaid reported that only about one-third of adults had used the benefit, and he cited low oral health literacy and patient navigation challenges as key causes of under-utilization. While Medicaid coverage of dental services removes financial barriers to access for low-income adults, overcoming these less obvious barriers, too, is necessary to convert coverage to consumer understanding of the value of dental care and the actual receipt of care. There was also discussion of the need for more education and engagement of primary care providers regarding adult oral health, generally, but also especially in light of the risks poor oral health poses to pregnancy outcomes and the management of diabetes and other chronic conditions prevalent among low-income adults.

Addressing barriers within Medicaid could improve low-income adults’ access to oral health care.

Because adult dental benefits are a state option in Medicaid, establishing, sustaining, or improving them can be challenging.

In Medicaid expansion states, millions of previously uninsured low-income adults now have health coverage. However, adult dental services are an optional benefit in Medicaid and most states cover limited or emergency-only services.1  Even in states with extensive benefits, caps on per-enrollee dental spending may constrain access for adults with high needs. State dental officials indicated that, especially in tight budget environments, prioritizing funding for Medicaid adult dental benefits is an uphill battle even when internal support for them is strong. They said that just maintaining benefits year to year can be a struggle because adult dental coverage is often seen as “low-hanging fruit” by policymakers seeking to cut spending. They added that, after new benefits are introduced, states must simultaneously implement them and think about how to keep them. Some state dental officials said that they had been able to identify temporary revenue sources to finance dental benefits, such as an unclaimed property trust fund, but sustainability remains a challenge. Limited and unstable benefits hinder access to dental care for Medicaid adults and deter dentists from seeing Medicaid patients because of uncertainty about whether services will be covered.

Dentists in many states face Medicaid policies that may discourage participation.

The roundtable discussion affirmed that low Medicaid fees and high administrative barriers dampen dentist participation in Medicaid. Managed care organizations (MCOs) often set payment rates for dentists by discounting already low Medicaid fee-for-service (FFS) rates. Onerous provider enrollment processes and prior authorization systems also deter participation, and discussants mentioned that the ACA requirement for revalidation of providers every five years has also led to some loss of dentists from the program. Government audits are often perceived as adversarial. Other barriers were cited, too. Small dental offices lack the expertise and resources to analyze and compare managed care plans’ coverage policies and payment rates. They also find it burdensome to file applications with multiple plans to participate in their networks and to deal with plans’ different credentialing processes. Medicaid coverage that pays for extractions but limits or does not pay for services that can save patients’ teeth (e.g., root canals, crowns) frustrate dentists, as do policies that thwart continuity of care, such as loss of maternal dental benefits following pregnancy in some states. One participant indicated that dental practices that serve primarily low-income patients can find it harder to get bank loans or face higher interest rates to borrow.

  • Dental benefits. Recognizing the extensive unmet need for oral health care among poor adults, some states are taking steps to expand dental benefits and dentist participation in Medicaid. Participants stated that, with millions of low-income working-age adults entering the Medicaid program, awareness of the urgent need for dental care in this population has sharpened. In recent years, a number of states have restored adult dental benefits that were previously cut, introduced an adult dental benefit, or added new benefits, such as preventive dental services. The point was made that the adult Medicaid population is not monolithic and that there is need to think about subgroups with special oral health needs, including pregnant women, individuals with disabilities, and people with diabetes. Some states with limited adult dental benefits have taken steps to provide more expansive access to services for selected groups. For example, one state with caps on covered services instituted a “benefit limit exceptions” process to permit additional services, including dentures, crowns, and endodontic and periodontic care, for pregnant women as well as adults with a serious chronic or other condition when certain criteria are met. Other states provide a more robust dental benefit package for pregnant women. It was suggested that, in states where a more meaningful adult dental benefit is not possible, even paying for toothbrushes and toothpaste in Medicaid could improve prevention and self-care among adult enrollees. One participant proposed that a 90% federal match rate, as now applies to family planning services in Medicaid, would go a long way to secure a sound dental benefit for adults.
  • Dental payment rates and participation. State dental officials mentioned several tacks that states are taking to improve dentist participation in Medicaid. Increased Medicaid payment rates for dentists and/or targeted increases to sustain or boost dentist participation in rural or other underserved areas are one lever states can use; one discussant noted that even small rate increases are important because they are a legislative “foot in the door.” A couple of states have instituted incentives to dental providers to participate. Under a time-limited program in one state at the table, dentists and dental hygienists enrolled in Medicaid receive an incentive payment if they take five additional Medicaid patients (and provide two visits to each), and additional incentive payments for larger increases in their Medicaid patient panels. Along similar lines, under the Dental Transformation Initiative in California’s section 1115 waiver, the state will pilot incentive payments to Medi-Cal FFS dental providers (including safety-net clinics) based on year-on-year continuity in the provider and location of the annual dental exam received by a child.2 
  • Medicaid delivery system choices. State policy choices regarding how dental benefits are delivered can also impact dentist participation in Medicaid and Medicaid enrollees’ access to dental care. One state Medicaid official emphasized that when his state introduced an adult dental benefit in 2014, it decided to administer the benefit itself, using an Administrative Services Only contract rather than contracting with managed care organizations (MCOs) on a capitation basis. This approach kept the state in control of credentialing, network development, and pricing, which addressed the dental community’s apprehension about managed care and reimbursement. Many states see managed care as a better means to deliver the dental benefit and ensure access to care for Medicaid enrollees. Contracts with MCOs give states leverage to establish network adequacy standards and performance requirements and hold plans accountable, and capitation payment provides plans with flexibility and incentives to organize and pay for services in innovative ways. Discussants suggested that administrative barriers to dentist participation in Medicaid could be lowered if plans within a state had uniform credentialing and other processes.

Leadership, stakeholder engagement, and being ready matter.

Roundtable participants cited the critical role of leadership and advocacy by the Governor, legislative champions, state oral health coalitions, and the state dental association in the success of state effort to strengthen Medicaid adult dental benefits. Broad stakeholder engagement and an inclusive, deliberative planning process also emerged as important factors. Discussants identified turnover in state legislatures and term limits as a challenge to gaining policymakers’ attention and commitment and legislative traction. At the same time, there can be a sudden but fleeting opportunity to advance an initiative, so having a well-developed proposal ready to go is strategically important.

Innovative workforce and service delivery models have potential to expand access to oral health care, within and beyond Medicaid.

We have not maximized the potential of our current health care workforce to supply oral health services.

Roundtable participants observed that, while more dentists and other dental professionals are likely needed to meet increasing demand for services as insurance coverage expands, it is possible to increase the supply of care available with today’s workforce. There was wide agreement that enabling dental hygienists to work “at the top of their license” by eliminating state scope-of-practice restrictions would enlarge the supply of care, especially in areas underserved areas, where dental hygienists are more willing to work and dentists are scarce. Primary care providers can also be trained and paid to furnish basic preventive services, and new provider types such as dental therapists can expand existing oral health care capacity and access. Another point discussants raised is that states may have leverage to work with dental schools – most of which are public institutions – to bring more dentists to disadvantaged and underserved communities.

Health centers remain a cornerstone of access to dental care for low-income adults.

Discussants emphasized the crucial role of health centers as a source of dental care for both Medicaid enrollees and other low-income adults, including uninsured individuals as well as QHP enrollees, many of whom lack dental coverage and qualify for health centers’ sliding fees. Most health centers have dental clinics onsite, and the large ACA investment in health centers over a 5-year period and further extended by Congress has enabled health centers to expand the oral health services they provide and increase the number of patients they serve.

It is important that strategies to provide integrated, whole-person care incorporate oral health care.

Citing the widespread efforts to integrate behavioral and physical health care in Medicaid, discussants expressed the importance of including oral health in integrated care approaches as well. They explicitly recognized health centers as leaders in the integrated delivery of oral and primary care. Discussants also highlighted the increasing number of states that previously “carved out” dental benefits from their MCO contracts but are now carving them in, holding medical directors responsible for oral health as well. The MCO executive at the table expressed strong support for integration, but observed that oral health care is not a core competency of most MCOs, so, for the near-term, many may need to pass the risk for these services to other entities. Turning to the data needs for truly integrated care, participants identified how integrated patient health records and clinical decision-support tools can improve patient care – for example, prompting dental providers when their patients are due for a cancer screen, or generating oral health messages to physicians for their patients with diabetes. Discussants suggested that other approaches to integrated care at the provider level, such as having dentists screen for hypertension and physicians screen for oral disease, could also improve patient care.

Experts said that it will not be possible to grow our way out of the oral health crisis among low-income adults without reforming the current care delivery paradigm.

Clinical experts at the table stressed that high rates of oral disease among adults in Medicaid are unlikely to change in the years ahead without fundamental reorientation of our oral health care system. The prevailing structure of dental coverage is provider-driven, based on a more or less uniform set of services and periodicity

schedules regardless of individual risk factors, and on FFS payment. Even as states move to risk contracting, the capitation rates they set assume FFS fee levels and utilization experience. Discussants urged the need to move to evidence-based models of coverage and care that emphasize prevention, early intervention, and caries risk management, and to payment models like pay-for-performance, bundled payments, and other approaches that incentivize the provision of preventive care and reward improvement in outcomes rather than simply reimburse for utilization. While stressing that a transformed system that revolves around prevention is imperative if we are to get ahead of the epidemic of oral disease among low-income adults, roundtable participants stated that, for the foreseeable future, capacity for “rescue operations” performed by dentists must also be maintained or even expanded to deal with the current burden of disease and new demand for services as coverage expands.

New models to increase access to oral health care in underserved communities and populations show promise.

A thread running through the discussion was the need to rethink how services are delivered. The vast majority of dental visits take place in dentist offices today, but new models are bringing oral health care to people where they live, go to school, and work. The discussion highlighted the “virtual dental home” demonstration in California. In this technology-facilitated model, specially licensed dental practitioners provide preventive and simple restorative care in community settings including Head Start sites, residential facilities for people with disabilities, and long-term care facilities. These providers are equipped with portable imaging and other equipment and a web-based dental record system, which enables them to exchange patient information with a collaborating dentist. The dentist reviews the information and creates a treatment plan, and the community-based providers furnish the services they can in their setting and refer patients to dentists for more complex care. It was noted that this model involved state legislation both to expand the scope of practice for allied health personnel and to require California’s Medicaid program to pay for teledentistry services. Another model, known as “hub-and-spoke,” connects dentists in their main practice locations (hubs) to settings in nearby communities (spokes) where the dentist or a dental hygienist provides dental care on scheduled days.

Data needs

Quality measures for adult oral health are needed.

Discussants suggested that prioritizing adult oral health is made more challenging by the absence of commonly accepted adult dental quality measures. Such measures would help convey the scope and scale of the problem, identify key gaps (e.g., by state or poverty level), and provide benchmarks against which performance and improvement can be assessed – data that are needed to guide Medicaid and other health policy. One policy expert noted that the American Dental Association’s Dental Quality Alliance is developing and testing several adult as well as pediatric measures, but added that only pediatric measures had been at all embraced by states, consistent with the CMS Oral Health Initiative’s tight focus on low-income children’s oral health and the much more limited coverage of adults and adult dental services in Medicaid.

Monitoring the impact of adding adult dental coverage in Medicaid may require a phased approach.

One state official emphasized that the impacts of a newly established adult dental benefit emerge over time as implementation is solidified, changes in access to care and utilization occur, and outcomes potentially improve,and that state monitoring strategies should be structured to take this reality into account. This discussant’s state adopted a multi-year monitoring plan when it launched an adult dental benefit in Medicaid. Reflecting expectations about the early impacts of the benefit, state monitoring in Year 1 focused modestly on increases in dentist participation in Medicaid, and monitoring in Year 2 focused on reductions in ED visits for non-emergency dental care. Over time, the state will focus its monitoring on measures tied more closely to long-term goals for improved oral health outcomes.

Determining the return on investment (ROI) from covering dental benefits for adults in Medicaid is challenging.

While being able to demonstrate ROI from adult dental coverage, or provide a cost-benefit analysis, could enhance efforts to stabilize and expand these benefits, the discussion highlighted several issues that present challenges. Fundamentally, costs tend to be easier to quantify than benefits. In addition, benefits often taken longer to materialize. Oral health outcomes, in particular, are lagging indicators and measurable gains may not occur in the budget or election or term-limit timeframe relevant to policymakers. Offsets or savings within Medicaid, for example, from reduced ED visits or hospital uncompensated care, can be difficult to attribute directly to expanded adult dental coverage and to quantify. Further, as new low-income adults continually cycle into Medicaid, their oral disease burden can conceal or wash out improvements in utilization, spending, and outcomes in the underlying Medicaid population. Identifying and quantifying returns to adult dental benefits beyond the Medicaid program (e.g., improved diabetes control and lower health spending, ability to work, social integration) is even more difficult analytically.

Technical assistance could help states move forward on Medicaid adult dental coverage.

Participants agreed that the availability of tools to estimate the cost of adding adult dental benefits would help states, advocates, and others begin to formulate proposals and model different alternatives. Other technical assistance from CMS and mechanisms to facilitate sharing of state experience and best practices, such as learning collaboratives, could also provide support to states considering dental benefit expansions and help guide their planning and implementation. In addition, discussants said, demonstration funding for innovative oral health care models and their evaluation could help identify promising delivery and payment system reforms and advance their diffusion.

Conclusion

The roundtable discussion on improving access to oral health care for low-income adults, drawing on the wide-ranging perspectives and expertise of the participants, yielded important themes and observations. Overarching all of them was a collective emphasis on the importance of prioritizing access to oral health care as part of the health care policy agenda. Medicaid’s growing role in covering low-income adults, combined with the large infusion of federal dollars for Medicaid expansion and health center growth, provides an opportunity to address the high rates of oral disease and unmet dental need among low-income adults by expanding adult access to dental care in Medicaid. The ramifications of poor oral health among low-income adults, which extend beyond health to employment, drug use and incarceration, social isolation, and wide-ranging disparities, enlarge the context for considering action on this issue. As a

growing number of states are demonstrating with their own initiatives, states have important levers to expand both adult coverage and the availability of dental providers in Medicaid; health plans, health centers, and provider practices are a locus of innovation as well. Federal leadership focused on measuring and improving access to dental care among adults in Medicaid could accelerate progress, and broader efforts to address workforce shortages, oral health literacy, and other factors will also be important. But ultimately, leading experts agree, ending the epidemic of oral disease among poor populations will depend on greater integration of oral and primary care and a transformed oral health system defined by an emphasis on prevention, patient risk assessment and evidence-based care, and community-based models of service delivery.


Endnotes

  1. Medicaid Adult Dental Benefits: An Overview, Center for Health Care Strategies, July 2016. Available at: http://www.chcs.org/resource/medicaid-adult-dental-benefits-overview/. ↩︎
  2. Dental Transformation Initiative (DTI), Medi-Cal 2020 Waiver, California Department of Health Care Services. Available at: http://www.dhcs.ca.gov/provgovpart/Pages/DTI.aspx. ↩︎
Similar but Not the Same: How Medicare Per Capita Spending Compares for Younger and Older Beneficiaries

Authors: Juliette Cubanski, Tricia Neuman, and Anthony Damico
Published: Aug 16, 2016

Issue Brief

Medicare is most commonly known as a health insurance program for people ages 65 and older, but, since 1973, the program has also provided coverage to millions of people with permanent disabilities who are younger than age 65.1  People under age 65 qualify for Medicare after they receive Social Security Disability Insurance (SSDI) payments for 24 months. Younger adults with end-stage renal disease (ESRD) and amyotrophic lateral sclerosis (ALS) are eligible for Medicare as soon as they begin receiving SSDI benefits. Over time, the share of Medicare beneficiaries under age 65 has more than doubled, from 7% (1.7 million people) in 19732  to 16% (9.1 million) this year.3 

Medicare beneficiaries under age 65 with disabilities differ from beneficiaries age 65 and older in several ways.4  In 2012, nearly two-thirds of all younger Medicare beneficiaries (65%) had a cognitive or mental impairment, compared to 29% of seniors. Nearly 6 in 10 (59%) reported their health status as fair or poor and almost the same share (58%) reported having one or more limitations in their activities of daily living, compared to 20% and 34% of seniors, respectively. In 2014, half of all Medicare beneficiaries under age 65 lived on income less than $17,050, one third less than median income of $26,150 among beneficiaries age 65 and older.5 

Differences in health status between younger and older Medicare beneficiaries suggest that Medicare spending could also differ for these two groups. In 2014, Medicare beneficiaries under age 65 accounted for 18% of the 38.5 million beneficiaries in traditional Medicare (excluding Medicare Advantage enrollees), and a somewhat higher share (23%) of total traditional Medicare spending that year.6  Per capita spending also could vary for these two groups, both overall and by type of service. This data note compares average per capita Medicare spending and service use for beneficiaries under age 65 to spending among those over age 65.7  The analysis is based on data from a 5% sample of Medicare claims for services covered under Parts A, B, and D for traditional Medicare beneficiaries from the Chronic Conditions Data Warehouse (CCW) of the Centers for Medicare & Medicaid Services (CMS) from 2000 to 2014. The analysis excludes beneficiaries enrolled in Medicare Advantage because comparable data on Medicare spending by service are not available for these enrollees.8 ,9 

Findings

Average Medicare per capita spending on Part A and Part B services is only modestly higher for beneficiaries under age 65 than those over 65. Average total spending is higher for beneficiaries under age 65, mainly due to Part D prescription drug spending.

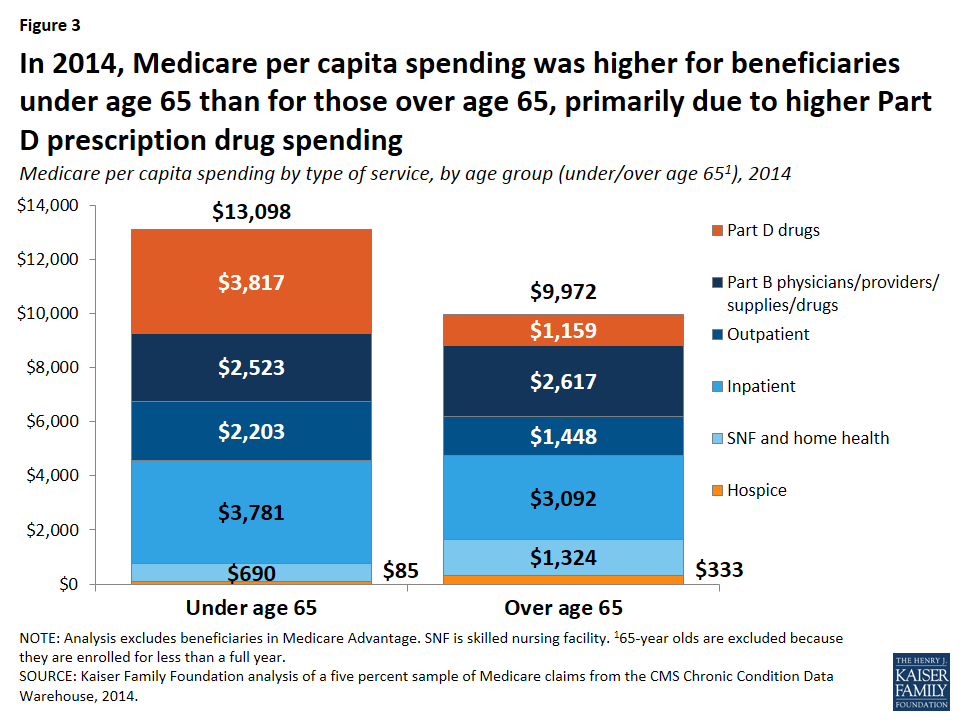
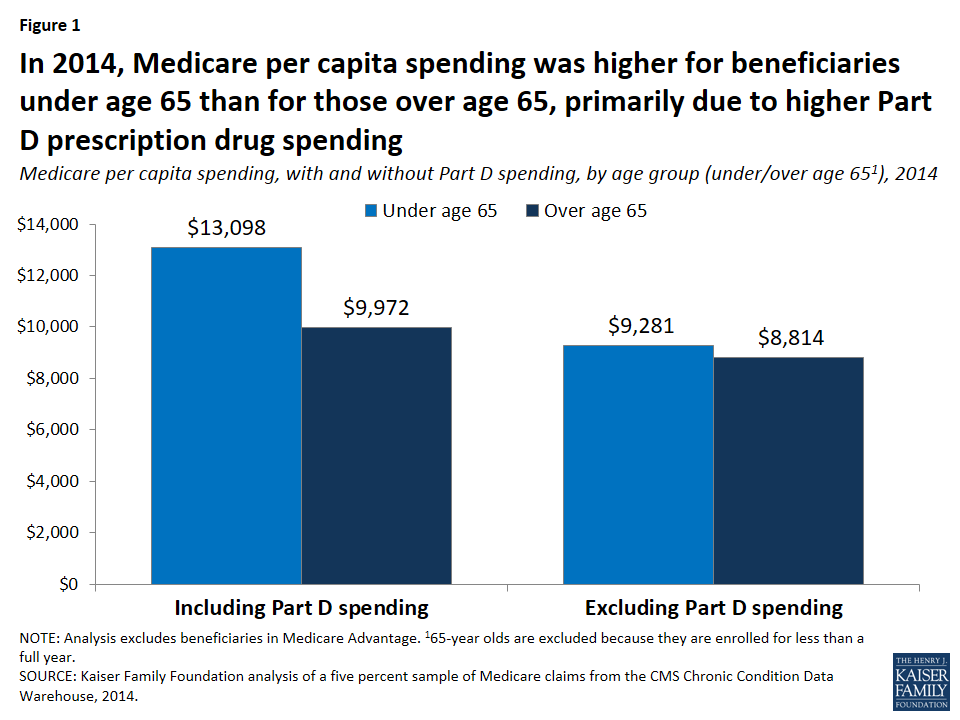
  • Medicare per capita spending for beneficiaries younger than age 65 averaged $13,098 in 2014, nearly one third more than average per capita Medicare spending for beneficiaries over age 65 ($9,972) (Figure 1). Excluding Part D drug spending, the difference narrows considerably, to $9,281 for beneficiaries under age 65 and $8,814 for those over age 65, on average.
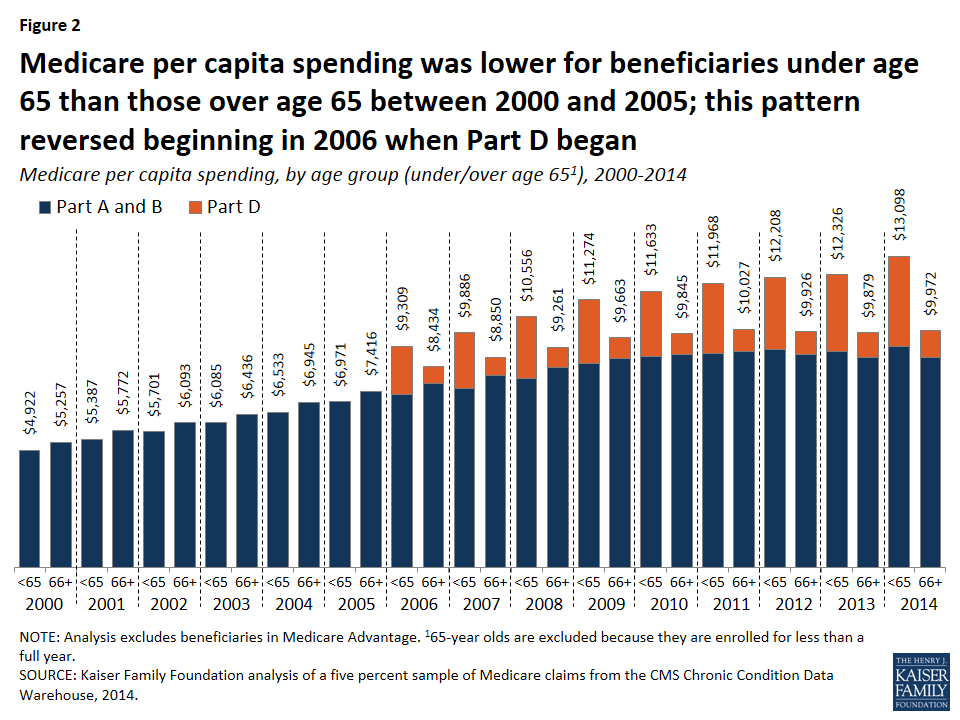
  • Since 2000, per capita spending for Medicare-covered services under Part A and Part B has been similar for beneficiaries under and over age 65. Beginning in 2006, with the start of the Medicare Part D prescription drug benefit, average total per capita Medicare spending for those under age 65 surpassed that of beneficiaries over age 65, due to higher Part D spending among younger beneficiaries. (Figure 2)

    Figure 1: In 2014, Medicare per capita spending was higher for beneficiaries under age 65 than for those over age 65, primarily due to higher Part D prescription drug spending

    Figure 2: Medicare per capita spending was lower for beneficiaries under age 65 than those over age 65 between 2000 and 2005; this pattern reversed beginning in 2006 when Part D began

The pattern of spending by type of service is different for beneficiaries under age 65 with disabilities than for those over age 65. On average, beneficiaries under age 65 have higher per capita spending for drugs covered under Part D and for inpatient and outpatient services, but lower spending on post-acute and hospice care than beneficiaries over age 65.

  • In 2014, average Medicare per capita spending on outpatient Part D prescription drugs was more than three times larger for beneficiaries under age 65 ($3,817) than for those over age 65 ($1,159).10  Part B drug spending, however, was somewhat lower among those under age 65 ($287) than those over age 65 ($360). (Figure 3; Table 1) The pattern of much higher Part D drug spending but somewhat lower Part B drug spending by beneficiaries under age 65 compared to those over age 65 could be because a considerable share of total Part B drug spending is for drugs used to treat cancer and its side effects,11  which may be more likely to be used by older beneficiaries.12 
  • Medicare per capita spending on hospital inpatient and outpatient services was higher among beneficiaries under age 65 ($3,781 and $2,203, respectively) than among older beneficiaries ($3,092 and $1,448) in 2014.
  • Conversely, average Medicare per capita spending for post-acute care (skilled nursing facility and home health services) was half as much for younger beneficiaries with disabilities than for those over age 65 in 2014 ($690 versus $1,324). Although a similar share of both groups of beneficiaries used inpatient services in 2014, smaller shares of beneficiaries under age 65 used post-acute care services than those over age 65.13 
  • Similarly, average Medicare per capita spending on hospice care was considerably lower for beneficiaries under age 65 than those over age 65 ($85 versus $333). This is partly because the death rate is lower among beneficiaries under age 65 than among those over age 65,14  and because roughly half as many younger Medicare beneficiaries who died in 2014 used hospice services than older beneficiaries who died that year.15 
Figure 3: In 2014, Medicare per capita spending was higher for beneficiaries under age 65 than for those over age 65, primarily due to higher PartD prescription drug spending

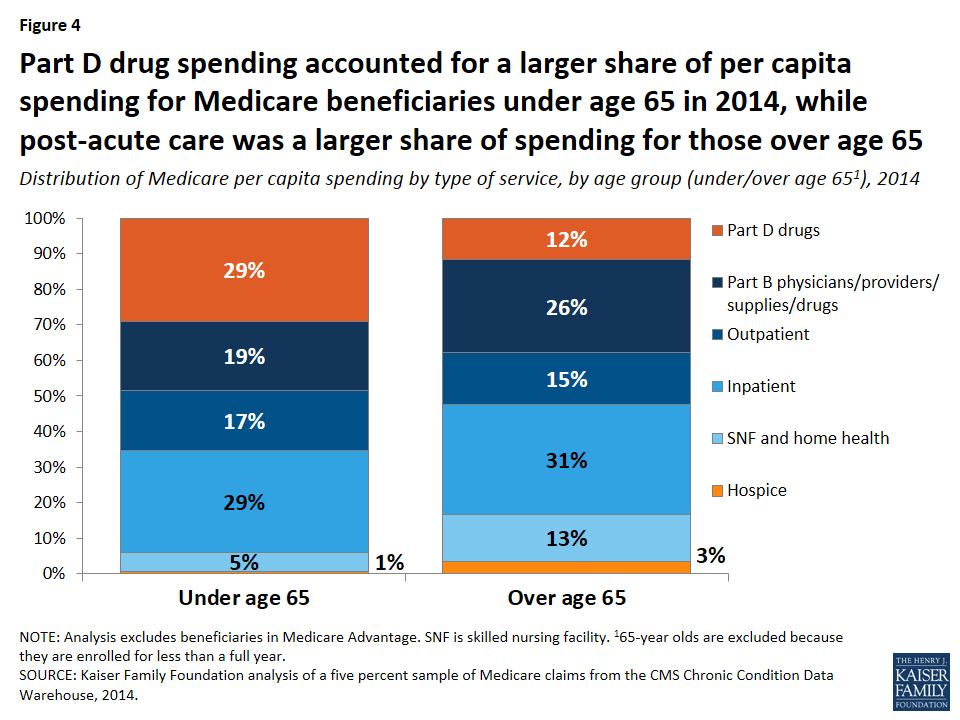
Part D prescription drug spending accounts for a much larger share of total spending for beneficiaries under age 65 than older beneficiaries, while post-acute care spending accounts for a larger share of spending among beneficiaries over age 65.

  • Part D drug spending accounted for 29% of per capita spending among beneficiaries younger than age 65 in 2014, but just 12% of per capita spending for beneficiaries over age 65. (Figure 4; Table 1)
  • Post-acute care services (skilled nursing facility and home health services) comprised a much smaller share of total per capita spending for beneficiaries under age 65 than those over age 65 (5% versus 13%).
  • Inpatient and outpatient services accounted for similar shares of per capita spending in 2014 for both beneficiaries under age 65 (29% and 17%, respectively) and those over age 65 (31% and 15%, respectively).
Figure 4: Part D drug spending accounted for a larger share of per capita spending for Medicare beneficiaries under age 65 in 2014, while post-acute care was a larger share of spending for those over age 65

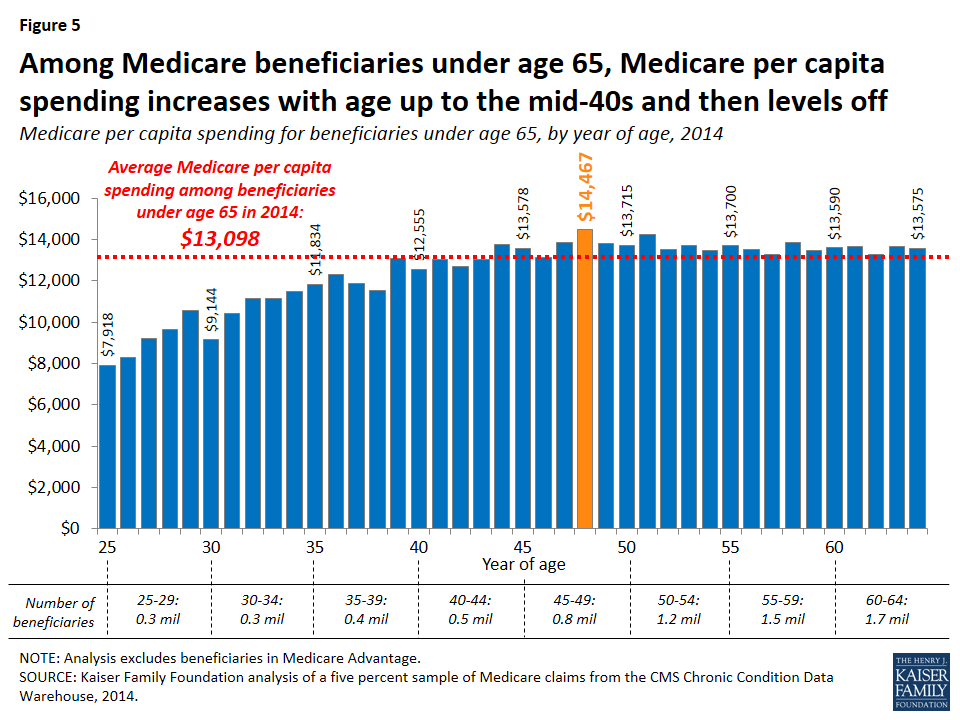
Among beneficiaries under age 65, Medicare per capita spending increases with age until beneficiaries reach their 40s and then generally levels off.

  • In 2014, average per capita Medicare spending increased from $7,918 for 25 year-olds to $11,834 for 35 year-olds to $13,578 for 45 year-olds, leveling off at around that amount for beneficiaries between the ages of 45 and 64. (Figure 5; Table 1)
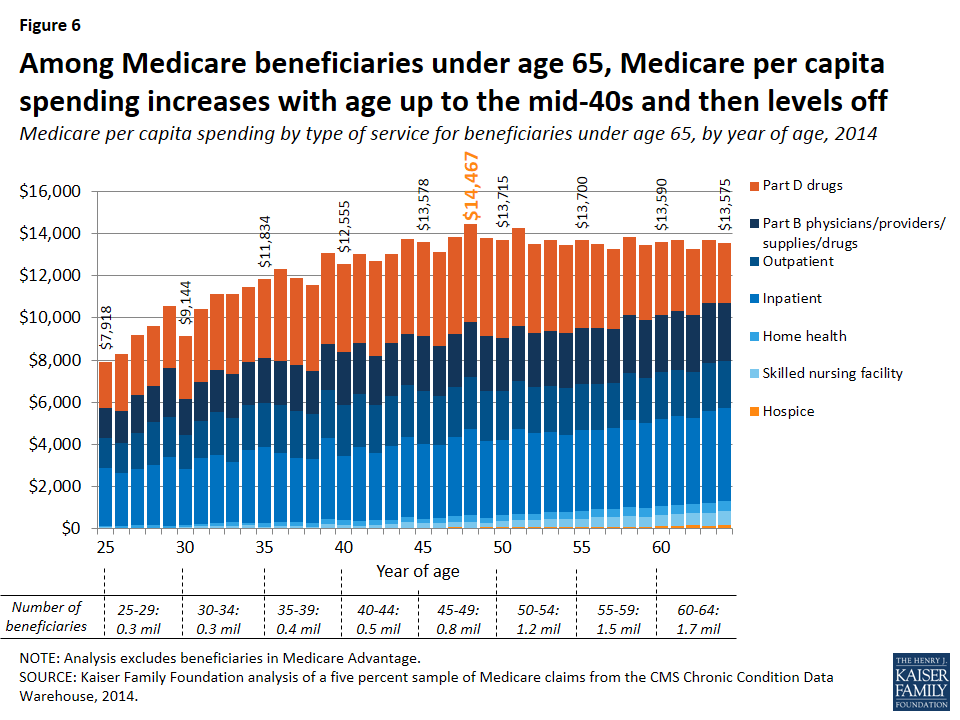
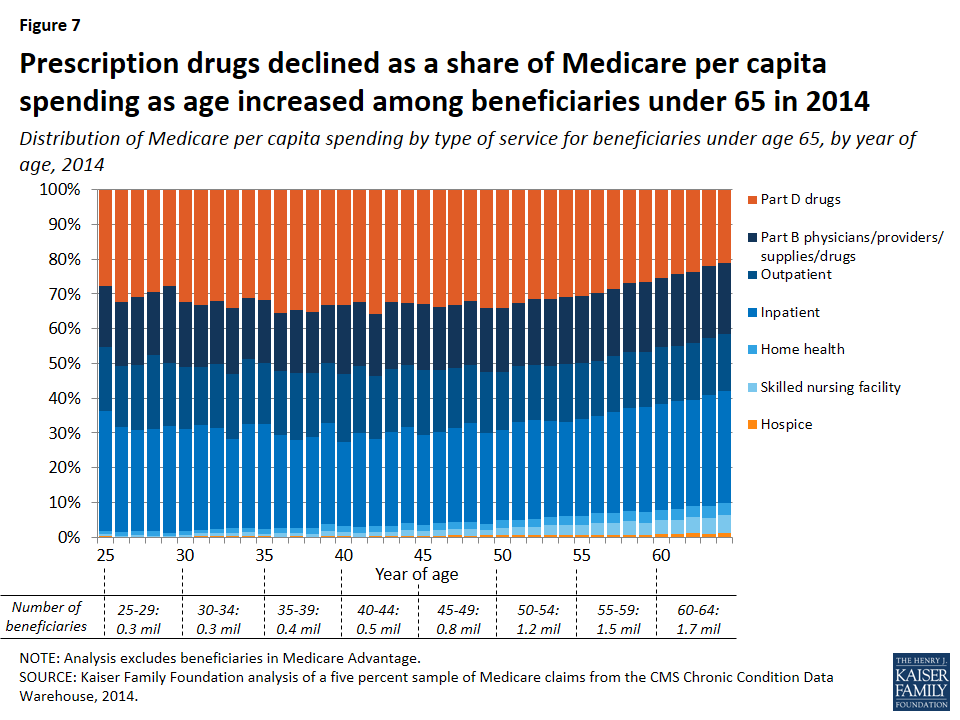
  • Both in dollar amounts and as a share of total spending, Medicare per capita spending for inpatient, outpatient, and physician services is similar at different ages among beneficiaries younger than age 65, while per capita Part D prescription drug spending increases modestly but then declines as beneficiaries age. (Figures 6 and 7)
  • Average per capita spending on skilled nursing facility, home health, and hospice services increases by year of age among beneficiaries under age 65, but these services account for a very small share of total Medicare spending for younger beneficiaries—ranging from less than 1% to 5% of total per capita spending for skilled nursing facility services, 1% to 3% for home health services, and around 1% for hospice services for beneficiaries as they age from 25 years old to 64 years old.
Figure 5: Among Medicare beneficiaries under age 65, Medicare per capita spending increases with age up to the mid-40s and then levels off
Figure 6: Among Medicare beneficiaries under age 65, Medicare per capita spending increases with age up to the mid-40s and then levels off
Figure 7: Prescription drugs declined as a share of Medicare per capita spending as age increased among beneficiaries under 65 in 2014

Among beneficiaries over age 65, Medicare per capita spending is nearly two times higher for those who initially qualified for Medicare before age 65 due to disability or ESRD.

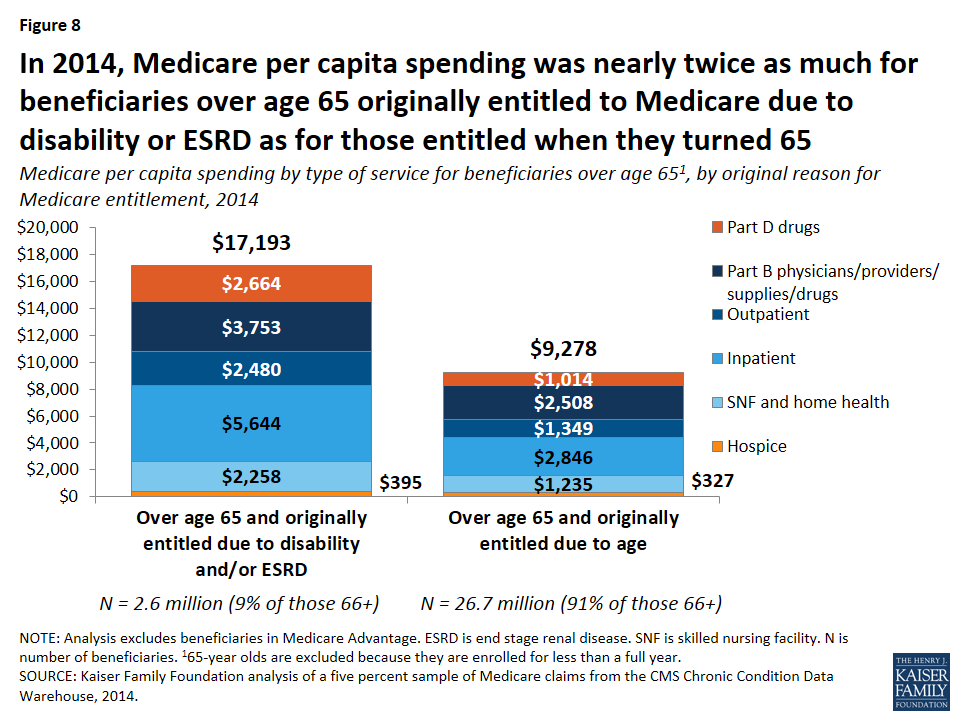
Among beneficiaries over age 65, average Medicare per capita spending is considerably higher for those who originally qualified for Medicare before they turned 65 due to having a permanent disability, ESRD, or ALS, than for older beneficiaries who qualified for Medicare based on age alone. In 2014, 2.6 million traditional Medicare beneficiaries over age 65 (9% of all traditional Medicare beneficiaries over age 65) initially qualified for Medicare due to receiving disability insurance benefits, having ESRD, or both prior to turning age 6516 ; these beneficiaries had average spending of $17,193, nearly twice the level of average spending among the 26.7 million traditional Medicare beneficiaries over age 65 who first became entitled to Medicare when they turned 65 ($9,278) (Figure 8).

Figure 8: In 2014, Medicare per capita spending was nearly twice as much for beneficiaries over age 65 originally entitled to Medicare due to disability or ESRD as for those entitled when they turned 65

Discussion

Comparing Medicare per capita spending by beneficiaries under age 65 with disabilities and spending by those over age 65 shows a large difference between the two populations, primarily due to substantially higher Part D prescription drug spending for beneficiaries under age 65. Other spending differences by type of service—such as lower spending on post-acute care services and higher spending on inpatient and outpatient services among beneficiaries under age 65 compared to those over age 65—reflect variation in medical needs and treatment among beneficiaries at different years of age.

Contrary to what might be expected based on health status differences between Medicare beneficiaries under age 65 with disabilities and older beneficiaries, average Medicare per capita spending on services covered under Part A and Part B was only moderately higher among those under age 65 than over age 65 in 2014, and was in fact somewhat lower among younger beneficiaries between 2000 and 2011. Total per capita spending began to diverge more widely beginning in 2006 when the Part D prescription drug benefit took effect, with much higher average Part D spending among beneficiaries under age 65. These findings suggest that curtailing rising drug costs would have the effect of reducing the Medicare spending gap between beneficiaries under and over age 65.

While this analysis shows that younger beneficiaries with disabilities have similar spending patterns as older beneficiaries for Medicare-covered hospital and physician services combined, we are unable to examine spending for certain services not covered by Medicare that may be needed and used more often by younger beneficiaries with disabilities, in particular long-term services and supports and dental care. For these services, state Medicaid programs may be playing a much greater role for Medicare beneficiaries with disabilities than older beneficiaries. Addressing gaps in Medicare-covered benefits could help to address unmet needs for long-term services and supports and dental services that both younger and older beneficiaries may face—especially those who are not dually eligible for Medicare and Medicaid—but would also add to Medicare’s bottom line.

Juliette Cubanski and Tricia Neuman are with the Kaiser Family Foundation.Anthony Damico is an independent consultant.


Tables

Table 1: Amount and Distribution of Medicare Per Capita Spending Overall and By Type of Service for Traditional Medicare Beneficiaries Under Age 65 and Over Age 65, 2014
Type of servicePart of Medicarecovering serviceUnder age 65Over age 651
AmountPercent of totalAmountPercent of total
Total $13,098100.0% $9,972100.0%
Part D drugsD3,81729.1%1,15911.6%
Acute inpatient hospitalA3,14124.0%2,72227.3%
Outpatient hospitalA2,20316.8%1,44814.5%
Other inpatient hospitalA6404.9%3693.7%
Evaluation & managementB5033.8%4594.6%
Other Part B proceduresB3702.8%5245.3%
Skilled nursing facilityA3662.8%8268.3%
Physician office servicesB3652.8%4164.2%
Home healthA or B23242.5%4995.0%
Part B drugsB2872.2%3603.6%
TestsB2712.1%2392.4%
Durable medical equipmentB2251.7%1321.3%
Other Part B servicesB2111.6%1641.6%
ImagingB1301.0%1711.7%
HospiceA850.6%3333.3%
DialysisB590.5%130.1%
AnesthesiaB520.4%530.5%
Ambulatory surgery centerB500.4%860.9%
NOTE: Analysis excludes beneficiaries in Medicare Advantage. 165-year olds are excluded because these beneficiaries are enrolled for less than a full year. 2Home health services can be covered under Part A or Part B depending on whether or not the services follow a hospital stay.SOURCE: Kaiser Family Foundation analysis of a five percent sample of Medicare claims from the CMS Chronic Conditions Data Warehouse, 2014.
Table 2: Amount and Distribution of Medicare Per Capita Spending Overall and By Type of Servicefor Traditional Medicare Beneficiaries Under Age 65, by Year of Age, 2014
TOTAL PER CAPITAPart D prescription drugsInpatient hospitalOutpatient hospitalPart B providers/ services/ supplies/drugsSkilled nursing facilityHospiceHome health
AGEAmount% of totalAmount% of totalAmount% of totalAmount% of totalAmount% of totalAmount% of totalAmount% of totalAmount% of total
All <65$13,098100%$3,81729.1%$3,78128.9%$2,20316.8%$2,52319.3%$3662.8%$850.6%$3242.5%
257,9181002,18527.6%2,73034.5%1,46418.5%1,40317.7%430.5%210.3%710.9%
268,2821002,67632.3%2,49730.1%1,45517.6%1,52718.4%290.4%00.0%991.2%
279,1991002,83630.8%2,69029.2%1,69718.4%1,81719.8%550.6%40.0%1011.1%
289,6231002,84629.6%2,82729.4%2,04621.3%1,72718.0%370.4%50.0%1341.4%
2910,5781002,94327.8%3,24630.7%1,92518.2%2,32422.0%410.4%70.1%920.9%
309,1441002,96432.4%2,67529.3%1,63217.8%1,71118.7%610.7%80.1%931.0%
3110,4081003,45533.2%3,14730.2%1,72916.6%1,85717.8%970.9%240.2%1001.0%
3211,1171003,57032.1%3,21628.9%2,06718.6%2,00218.0%1010.9%280.2%1341.2%
3311,1501003,79334.0%2,85425.6%2,08418.7%2,11619.0%1030.9%280.3%1711.5%
3411,4741003,58231.2%3,45630.1%2,11918.5%2,02017.6%1361.2%310.3%1311.1%
3511,8341003,75731.7%3,59630.4%2,08017.6%2,13318.0%660.6%350.3%1671.4%
3612,3011004,35835.4%3,29226.8%2,26618.4%2,06416.8%1391.1%160.1%1651.3%
3711,8761004,09734.5%3,03325.5%2,25619.0%2,18418.4%990.8%280.2%1781.5%
3811,5491004,04935.1%3,03026.2%2,12918.4%2,04117.7%860.7%120.1%2021.7%
3913,0791004,32333.1%3,82929.3%2,26817.3%2,18116.7%1841.4%530.4%2411.8%
4012,5551004,16233.1%3,02124.1%2,46219.6%2,50119.9%1621.3%320.3%2151.7%
4113,0131004,18632.2%3,50626.9%2,52819.4%2,41018.5%1351.0%180.1%2301.8%
4212,7121004,54035.7%3,15524.8%2,31618.2%2,28117.9%1401.1%500.4%2311.8%
4313,0341004,20832.3%3,54427.2%2,35418.1%2,52319.4%1611.2%480.4%1951.5%
4413,7471004,49432.7%3,81127.7%2,42517.6%2,45417.9%2601.9%410.3%2621.9%
4513,5781004,44832.8%3,51525.9%2,53418.7%2,59419.1%1971.5%580.4%2321.7%
4613,1141004,43433.8%3,44726.3%2,32517.7%2,38118.2%2051.6%550.4%2672.0%
4713,8311004,58733.2%3,75227.1%2,37017.1%2,51518.2%2551.8%680.5%2842.1%
4814,4671004,65332.2%4,10228.4%2,43816.9%2,63218.2%2711.9%510.4%3192.2%
4913,8021004,68133.9%3,61026.2%2,40517.4%2,56718.6%1821.3%920.7%2631.9%
5013,7151004,68434.1%3,55625.9%2,30716.8%2,50218.2%2832.1%670.5%3162.3%
5114,2501004,63032.5%4,01728.2%2,27315.9%2,60918.3%3282.3%750.5%3182.2%
5213,5101004,24331.4%3,82728.3%2,16516.0%2,56119.0%3222.4%800.6%3122.3%
5313,7031004,31331.5%3,77827.6%2,18315.9%2,62119.1%4022.9%720.5%3352.4%
5413,4491004,15130.9%3,66727.3%2,21716.5%2,60919.4%3682.7%980.7%3392.5%
5513,7001004,17630.5%3,83828.0%2,19516.0%2,66019.4%3892.8%950.7%3472.5%
5613,5261004,01529.7%3,77127.9%2,16816.0%2,63919.5%4783.5%820.6%3722.8%
5713,2461003,77628.5%3,85729.1%2,12616.0%2,56119.3%4573.5%940.7%3742.8%
5813,8441003,72726.9%4,11829.7%2,23816.2%2,72119.7%5263.8%1030.7%4123.0%
5913,4501003,55626.4%4,04230.1%2,14716.0%2,72320.2%4473.3%1010.8%4343.2%
6013,5901003,46425.5%4,14730.5%2,24116.5%2,67419.7%5404.0%1150.8%4103.0%
6113,6741003,32724.3%4,25331.1%2,16715.8%2,80820.5%5634.1%1260.9%4303.1%
6213,2891003,13623.6%4,07330.6%2,17416.4%2,71820.5%5954.5%1691.3%4243.2%
6313,6721002,98321.8%4,37632.0%2,26316.6%2,84220.8%6244.6%1341.0%4513.3%
6413,5751002,85421.0%4,38332.3%2,23616.5%2,77520.4%6935.1%1671.2%4663.4%
NOTE: Analysis excludes beneficiaries in Medicare Advantage.SOURCE: Kaiser Family Foundation analysis of a five percent sample of Medicare claims from the CMS Chronic Conditions Data Warehouse, 2014.


Endnotes

  1. This provision was included in the Social Security Amendments of 1972, with Medicare coverage effective July 1, 1973. ↩︎
  2. Centers for Medicare & Medicaid Services (CMS), 2013 Medicare & Medicaid Statistical Supplement, Table 2.1 Medicare Enrollment: Hospital Insurance and/or Supplementary Medical Insurance Programs for Total, Fee-for-Service and Managed Care Enrollees as of July 1, 2012: Selected Calendar Years 1966-2012. ↩︎
  3. CMS/Office of Enterprise Data and Analysis/Office of the Actuary, CMS Fact Facts, available at https://www.cms.gov/fastfacts/ ↩︎
  4. Except as noted, estimates in this paragraph are for 2012 and based on Kaiser Family Foundation analysis of the Medicare Current Beneficiary Survey 2012 Cost and Use file. ↩︎
  5. Gretchen Jacobson, Christina Swoope, Tricia Neuman, and Karen Smith, Income and Assets of Medicare Beneficiaries, 2014-2030, Kaiser Family Foundation, September 2015, available at https://modern.kff.org/medicare/issue-brief/income-and-assets-of-medicare-beneficiaries-2014-2030/. ↩︎
  6. Kaiser Family Foundation analysis of a five percent sample of Medicare claims from the CMS Chronic Conditions Data Warehouse, 2014. Total spending for traditional Medicare in 2014 was $390 billion. ↩︎
  7. The analysis excludes beneficiaries who are age 65 because some of these beneficiaries are enrolled for less than a full year; therefore, a full year of Medicare spending data is not available for all people at this year of age. ↩︎
  8. Medicare spending for Medicare Advantage enrollees takes the form of monthly capitation payments which are not based on actual service utilization. ↩︎
  9. As of 2013, the share of beneficiaries enrolled in Medicare Advantage was lower among beneficiaries under age 65 than among older beneficiaries (22% versus 29%); Medicare Payment Advisory Commission, A Data Book: Health Care Spending and the Medicare Program, June 2015, Chart 9-11, available at http://www.medpac.gov/documents/data-book/june-2015-databook-health-care-spending-and-the-medicare-program.pdf. ↩︎
  10. Total Part D spending includes payments by Part D plans for covered drugs and Low-Income Subsidy (LIS) payments for cost-sharing subsidies for eligible Part D enrollees. A disproportionate share of LIS subsidy recipients are beneficiaries under age 65. In 2014, three quarters of Medicare beneficiaries under age 65 and enrolled in Part D received LIS (76%), three times the share of those over age 65 and enrolled in Part D receiving LIS (23%) (based on Kaiser Family Foundation analysis of CCW data). ↩︎
  11. See Medicare Payment Advisory Commission, A Data Book: Health Care Spending and the Medicare Program, Section 10: Prescription Drugs, Chart 10-2, June 2015; Steven Sheingold, et al., “Medicare Part B Drugs: Pricing and Incentives,” ASPE Issue Brief, Department of Health and Human Services, Office of the Assistant Secretary for Planning and Evaluation, March 2016. ↩︎
  12. In 2014, 9% of traditional Medicare beneficiaries over age 65 had a diagnosis of breast, colorectal, endometrial, lung, or prostate cancer, compared to 2% of beneficiaries under age 65 (based on Kaiser Family Foundation analysis of CCW data). ↩︎
  13. In 2014, 17% of all traditional Medicare beneficiaries under age 65 used inpatient services, 2% used skilled nursing facility services, and 6% used home health services. This compares to 16%, 5%, and 10% (for each type of service, respectively) of beneficiaries over age 65 (based on Kaiser Family Foundation analysis of CCW data). ↩︎
  14. In 2014, 2% of all traditional Medicare beneficiaries under age 65 died, compared to 5% of beneficiaries over age 65 (based on Kaiser Family Foundation analysis of CCW data). ↩︎
  15. In 2014, 26% of all traditional Medicare beneficiaries under age 65 who died used hospice services, compared to 49% of beneficiaries over age 65 who died that year (based on Kaiser Family Foundation analysis of CCW data). ↩︎
  16. Beneficiaries with ALS are included in this group but not separately identifiable. ↩︎

Medicare’s Role for People Under Age 65 with Disabilities

Authors: Juliette Cubanski, Tricia Neuman, and Anthony Damico
Published: Aug 12, 2016

Issue Brief

Medicare was established in 1965 as the health insurance program for Americans age 65 and over; since 1973, it has also covered people under age 65 who receive Social Security Disability Insurance (SSDI) benefits.1  To qualify for SSDI, people must be unable to engage in “substantial gainful activity” because of a medically-determined physical or mental impairment expected to last at least 12 months or until death. Medicare also covers certain widows and widowers under age 65 with disabilities, as well as disabled adult children of retired, deceased, or disabled workers. Today, Medicare covers 9.1 million people with disabilities who are under age 65,2  or 16% of the Medicare population, up from 7% (1.7 million people with disabilities under age 65) in 1973.3  When people under age with disabilities on Medicare turn 65, their coverage from Medicare continues.4 

How do people under age 65 with disabilities qualify for Medicare?

People under age 65 become eligible for Medicare if they have received SSDI payments for 24 months. Because people are required to wait five months before receiving disability benefits, SSDI recipients must wait a total of 29 months before their Medicare coverage begins. People under age 65 who are diagnosed with end-stage renal disease (ESRD) or amyotrophic lateral sclerosis (ALS) automatically qualify for Medicare upon diagnosis without a waiting period.5  Of those who were receiving SSDI in 2014, 34% qualified due to mental disorders, 28% due to diseases of the musculoskeletal system and connective tissue, 4% due to injuries, 3% due to cancer, and 30% due to other diseases and conditions.6 

What are the characteristics of Medicare beneficiaries under age 65 with disabilities compared to beneficiaries age 65 or older?

Medicare beneficiaries under age 65 with disabilities differ from beneficiaries age 65 or older in several ways, including their demographic, socioeconomic, and health status profiles.

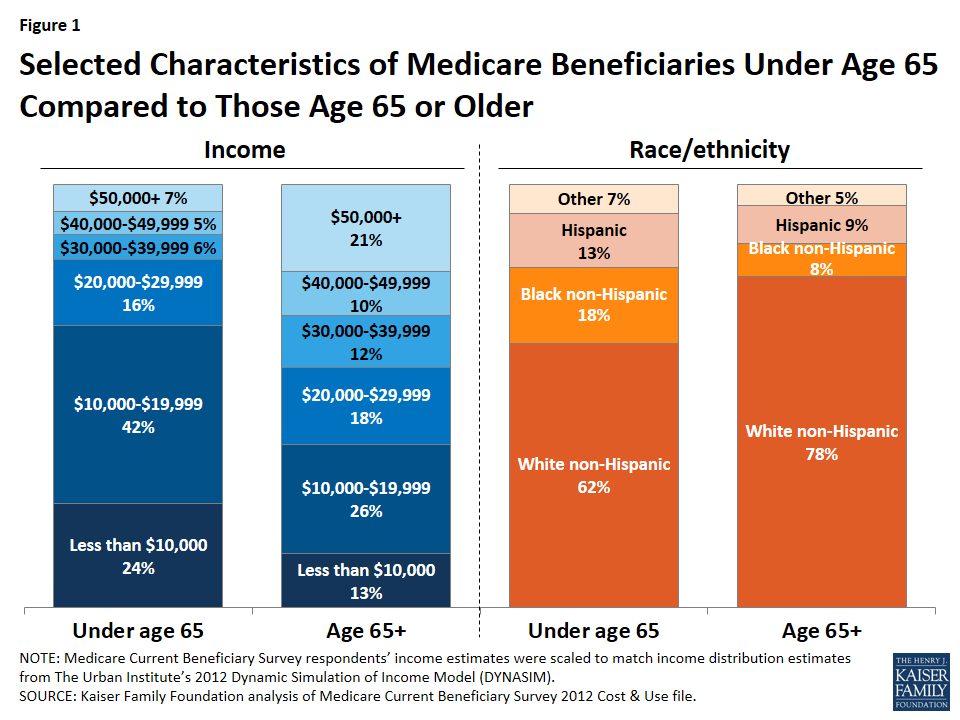
Income: In 2012, a much larger share of beneficiaries under age 65 with disabilities than older beneficiaries had low annual incomes (Figure 1). Nearly one quarter (24%) of younger beneficiaries with disabilities had incomes less than $10,000 per year and two-thirds (67%) had incomes less than $20,000 per year, compared to 13% and 39%, respectively, of older beneficiaries.7 

Figure 1: Selected Characteristics of Medicare Beneficiaries Under Age 65 Compared to Those Age 65 or Older

Race/ethnicity and gender: A larger share of beneficiaries under age 65 than older beneficiaries are black (18% and 8%, respectively) and Hispanic (13% and 9%, respectively), and a larger share are male (53% and 44%, respectively).

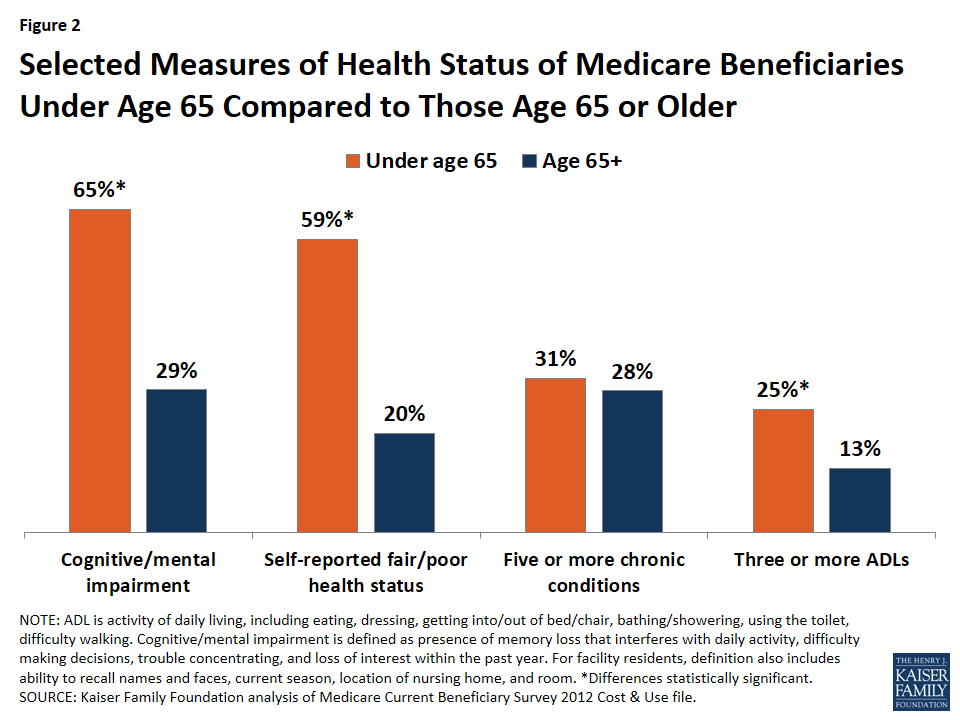
Health status: Nearly two-thirds of all younger Medicare beneficiaries (65%) had a cognitive or mental impairment in 2012, compared to 29% of older beneficiaries (Figure 2). This includes memory loss that interferes with daily activity, difficulty making decisions, trouble concentrating, and loss of interest within the past year.8  Nearly 6 in 10 (59%) reported their health status as fair or poor and almost the same share (58%) reported having one or more limitations in their activities of daily living, compared to 20% and 34% of beneficiaries age 65 or older, respectively. But roughly the same share of both younger beneficiaries with disabilities and older beneficiaries report having five or more chronic conditions (31% and 28%, respectively).

Figure 2: Selected Measures of Health Status of Medicare Beneficiaries Under Age 65 Compared to Those Age 65 or Older

How do sources of supplemental coverage and prescription drug coverage differ for Medicare beneficiaries under age 65 with disabilities and older beneficiaries?

Supplemental coverage

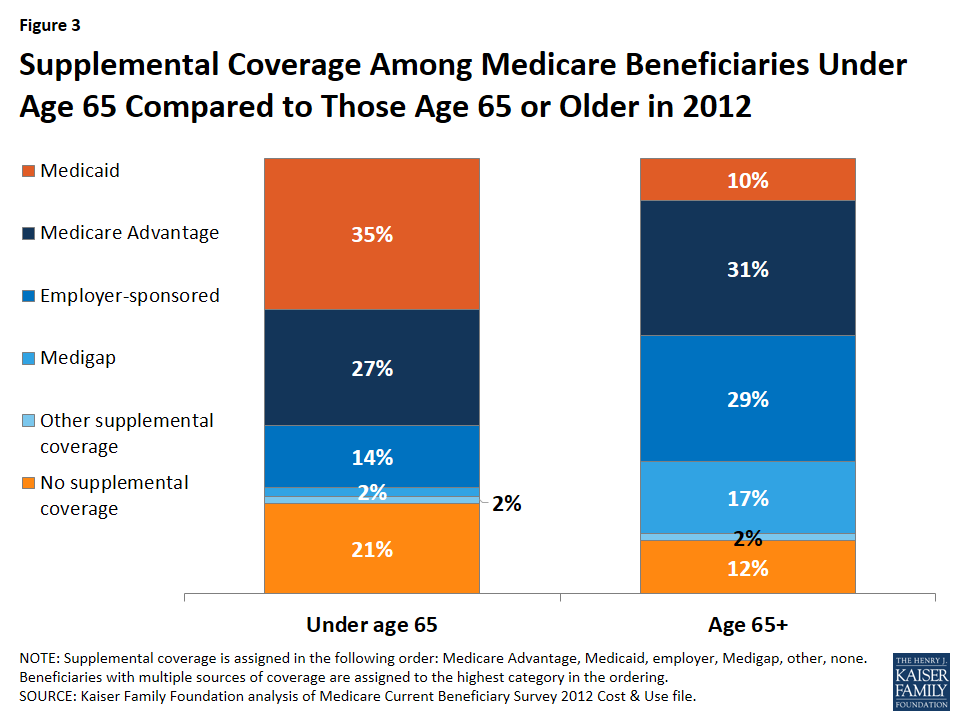
Most Medicare beneficiaries, including those under age 65 with disabilities, have public or private supplemental insurance to help cover Medicare’s cost-sharing requirements.9  A much larger share of beneficiaries under age 65 with disabilities than older beneficiaries rely on Medicaid to supplement Medicare (35% versus 10%) because of their relatively low incomes (Figure 3).10  Medicaid helps with Medicare premiums and cost-sharing requirements, and covers services needed by many people with disabilities that are not covered by Medicare, particularly long-term services and supports.

Figure 3: Supplemental Coverage Among Medicare Beneficiaries Under Age 65 Compared to Those Age 65 or Older in 2012

A smaller share of beneficiaries under age 65 with disabilities than older beneficiaries have employer-sponsored coverage (14% and 29%, respectively), Medigap (2% and 17%, respectively), or are enrolled in a Medicare Advantage plan (27% and 31%, respectively). A larger share of older beneficiaries have employer-sponsored coverage as a result of having retiree health benefits from former employers or because they are currently working and have Medicare as a secondary payer. The small share of beneficiaries under age 65 with disabilities who report having a supplemental Medigap policy may be largely due to the fact that federal law does not require insurance companies to sell Medigap policies to people under age 65, and while some states do impose this requirement, others do not.11  Insurers also may use medical underwriting in deciding whether to issue a Medigap policy to people with disabilities and how much to charge. By contrast, people who qualify for Medicare when they turn 65 have a six-month open enrollment period when they can purchase Medigap coverage without medical underwriting and regardless of what state they live in or their health status, as well as certain other special enrollment periods.

Just over 1 in 5 (21%) beneficiaries under age 65 has no supplemental coverage, compared with 12% of those age 65 or older. Lack of supplemental coverage among Medicare beneficiaries is associated with higher rates of access problems, but rates of access problems are higher among younger beneficiaries with disabilities who lack supplemental coverage than among older beneficiaries, including not seeing a doctor for a health problem when they think they should (31% and 10%, respectively) and having trouble getting needed health care (17% and 5%, respectively).12  Regardless of whether or not they have supplemental coverage, however, a larger share of younger beneficiaries with disabilities than older beneficiaries experience access and cost-related burdens (see discussion under “Access to Care and Cost-Related Problems” below).

Prescription drug coverage

The Medicare Part D drug benefit, which offers outpatient prescription drug coverage through private stand-alone prescription drug plans (PDPs) or Medicare Advantage drug plans (MA-PDs), is the primary source of drug coverage for all Medicare beneficiaries, but covers a larger share of those under age 65 with disabilities than older beneficiaries.

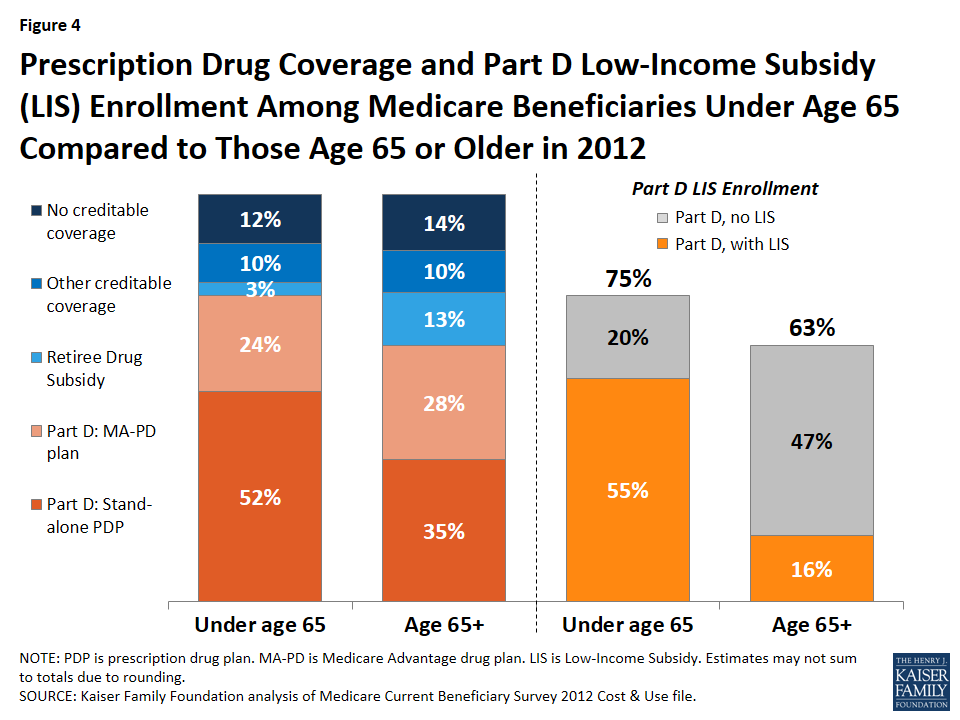
Three-fourths (75%) of Medicare beneficiaries under age 65 are enrolled in a Part D drug plan, either a stand-alone prescription drug plan (PDP) (52%) or a Medicare Advantage drug plan (24%), compared to roughly two-thirds (63%) of older beneficiaries enrolled in Part D (Figure 4). Reflecting their lower incomes and higher rate of Medicaid enrollment, more than half of all Medicare beneficiaries under age 65 (55%) receive the Part D Low-Income Subsidy (LIS), compared to just 16% of beneficiaries age 65 or older.

Figure 4: Prescription Drug Coverage and Part D Low-Income Subsidy (LIS) Enrollment Among Medicare Beneficiaries Under Age 65 Compared to Those Age 65 or Older in 2012

Roughly the same share of younger beneficiaries with disabilities and older beneficiaries have no reported source of creditable drug coverage (12% and 14%, respectively). Creditable coverage is drug coverage that is at least equal in value to the standard Part D benefit and can include, for example, coverage from employer-sponsored retiree health benefits, the Department of Veterans Affairs, and TRICARE.

How do Medicare spending and use of services differ for beneficiaries under age 65 with disabilities and older beneficiaries?

Medicare per capita spending

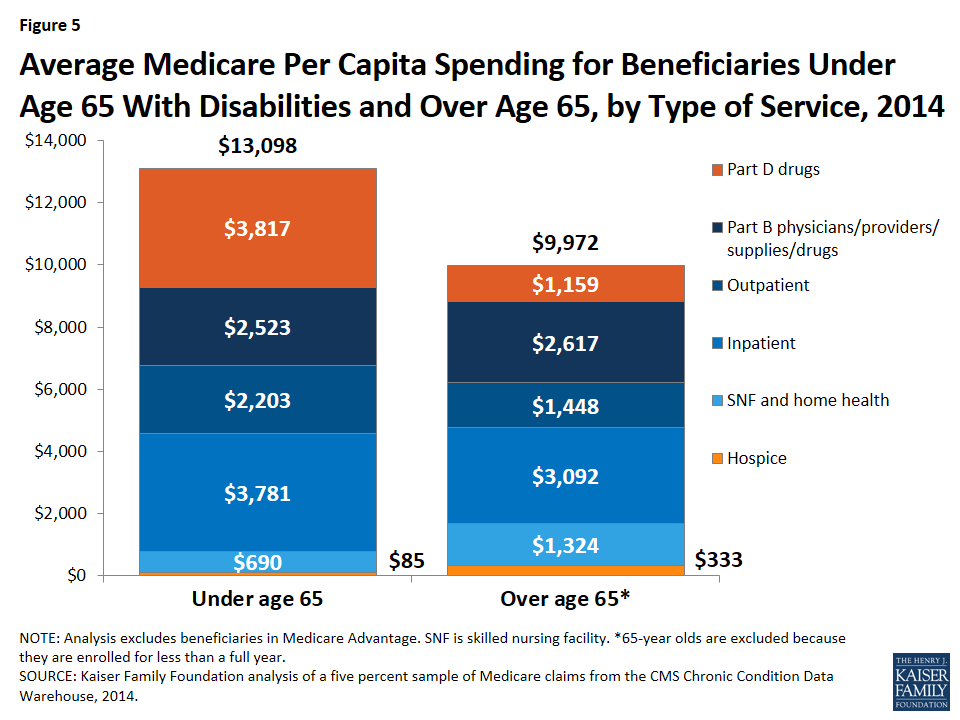
Average total Medicare spending is higher for traditional Medicare beneficiaries under age 65, mainly due to higher Part D prescription drug spending.13  Medicare per capita spending for beneficiaries younger than age 65 averaged $13,098 in 2014, nearly one third more than average per capita spending for beneficiaries over age 65 ($9,972).14  Excluding Part D drug spending, the difference narrows considerably to $9,281 for beneficiaries under age 65 and $8,814 for those over age 65, on average. On average, beneficiaries under age 65 have higher per capita spending for drugs covered under Part D and for inpatient and outpatient services, but lower spending on post-acute and hospice care than beneficiaries over age 65 (Figure 5; Table 1).

Figure 5: Average Medicare Per Capita Spending for Beneficiaries Under Age 65 With Disabilities and Over Age 65, by Type of Service, 2014

Use of medical services

Among beneficiaries in traditional Medicare in 2012,15  a somewhat smaller share of younger beneficiaries with disabilities than older beneficiaries had an office visit (66% and 77%, respectively), but a somewhat larger share of younger beneficiaries than older beneficiaries had an emergency department visit (19% and 14%, respectively) (Table 3). A smaller share of younger beneficiaries with disabilities than older beneficiaries used dental services (35% and 49%, respectively), and, as might be expected, use of post-acute care services, including skilled nursing facility stays and home health visits, was also lower among those with disabilities. But the same share of both groups had a hospital stay (18%) and the vast majority of both groups used prescription drugs (88% and 90%, respectively).

How do beneficiaries’ out-of-pocket spending and access to care differ for those under age 65 with disabilities and those age 65 and older?

Out-of-pocket spending

Although total Medicare per capita spending is higher for Medicare beneficiaries under age 65 with disabilities than for older beneficiaries, younger beneficiaries in traditional Medicare spend significantly less out of pocket, on average. This is likely due to the fact that a greater share of younger beneficiaries with disabilities than older beneficiaries have Medicaid coverage (35% and 10%, respectively16 ), as well as Part D Low-Income Subsidies (55% and 16%, respectively), that help cover their premiums and cost sharing. Overall, out-of-pocket spending by younger beneficiaries with disabilities is 40% less than that of older beneficiaries (averaging $3,706 and $6,146, respectively) (Table 2). Younger beneficiaries have lower average out-of-pocket spending than older beneficiaries for insurance premiums ($1,383 and $2,979, respectively) and for medical and long-term care services combined ($2,324 and $3,167, respectively).

On average, in 2012 beneficiaries in traditional Medicare with disabilities spent the largest share of their total non-premium out-of-pocket costs on medical providers (29%), followed by prescription drugs (26%) and long-term care facility costs (20%). These services also were the top three in terms of out-of-pocket costs for older beneficiaries, but in a different order: older beneficiaries spent the largest share of their out-of-pocket costs on facility costs (31%), followed by medical providers (24%) and prescription drugs (17%).

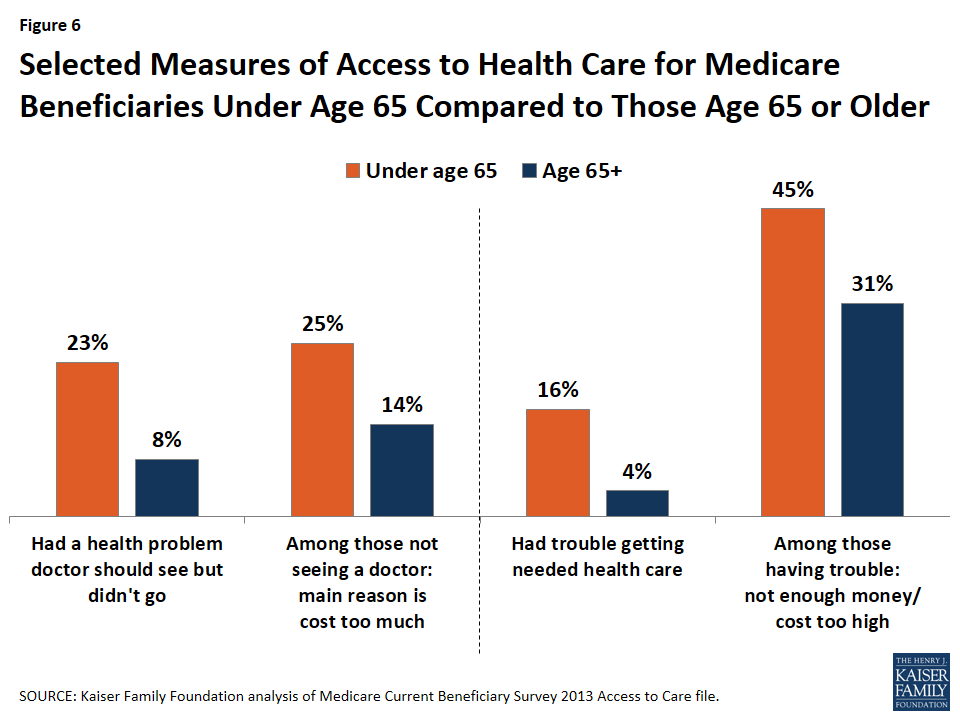
Access to care is generally good for a majority of Medicare beneficiaries overall across a number of standard measures, but a larger share of younger beneficiaries with disabilities than older beneficiaries report experiencing a range of access problems, often due to the cost of care. In 2013, nearly one quarter (23%) of younger beneficiaries with disabilities reported that they had a health problem they think a doctor should see but didn’t see a doctor about, compared to 8% of older beneficiaries. And of those not seeing a doctor, 25% of beneficiaries with disabilities cited cost as the main reason they didn’t see a doctor, compared to 14% of older beneficiaries. Also in 2013, 1 in 6 (16%) beneficiaries under age 65 with disabilities reported that they had trouble getting needed health care, compared to only 4% of beneficiaries age 65 or older. Among those reporting trouble getting care, close to half (45%) of younger beneficiaries with disabilities reported that it was because they did not have enough money or the cost was too high, compared to 31% of older beneficiaries (Figure 6).

Figure 6: Selected Measures of Access to Health Care for Medicare Beneficiaries Under Age 65 Compared to Those Age 65 or Older

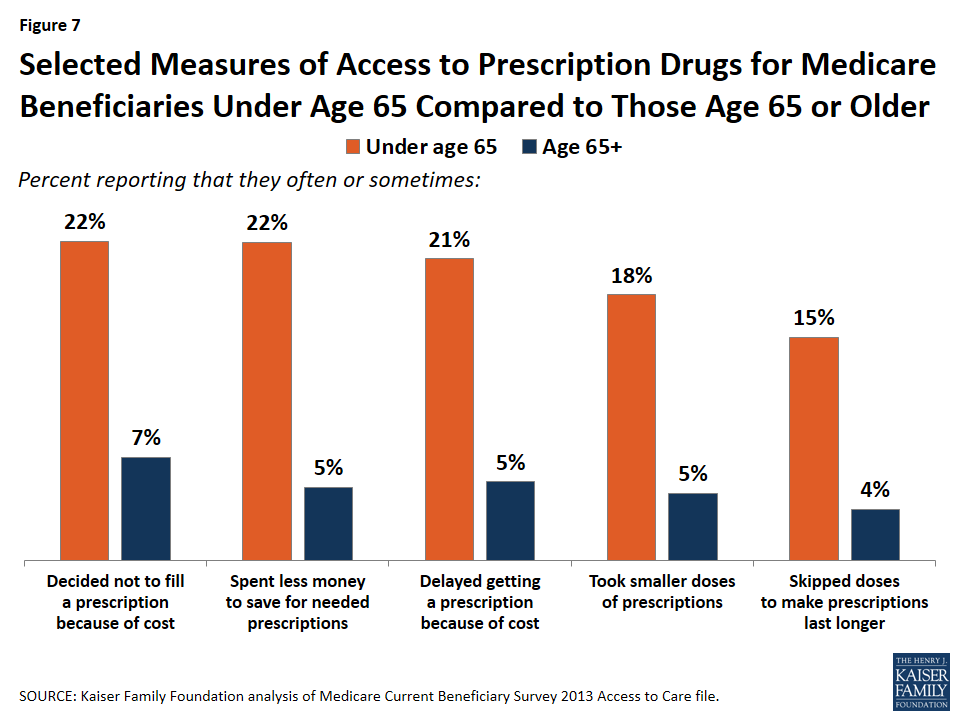
The fact that a majority of both younger Medicare beneficiaries with disabilities and older beneficiaries have some source of drug coverage does not mean that the two groups are alike in the shares facing access and cost-related problems in obtaining medications. A larger share of beneficiaries under age 65 than older beneficiaries report that they often or sometimes: decided not to fill a prescription because of cost (22% and 7%, respectively); spent less money to save for needed prescriptions (22% and 5%, respectively); delayed getting a prescription because of cost (21% and 5%, respectively); took smaller doses of prescriptions (18% and 5%, respectively); and skipped doses to make prescriptions last longer (15% and 4%, respectively) (Figure 7).

Figure 7: Selected Measures of Access to Prescription Drugs for Medicare Beneficiaries Under Age 65 Compared to Those Age 65 or Older

Perhaps related to their higher likelihood of experiencing cost-related access problems, a much larger share of beneficiaries with disabilities than older beneficiaries report worrying about their health more than others their age (63% and 18%, respectively), trying to keep their illnesses to themselves when they get sick (50% and 35%, respectively), and doing almost anything to avoid going to the doctor (38% and 27%, respectively).

Discussion

Since 1973, Medicare has been an important source of health insurance for people with disabilities who are under age 65. More recently, the Affordable Care Act (ACA) of 2010 improved access to health insurance and coverage of benefits under Medicare, improvements which could be especially helpful for people with disabilities. Specifically, the law expanded access to health insurance coverage through expansion Medicaid or Marketplace plans, which could be especially helpful for SSDI recipients in the 24-month Medicare waiting period. Prior to the ACA, many people with disabilities in the waiting period for Medicare faced difficulties obtaining or affording health insurance in the private market.17 

For all people on Medicare, including those under age 65 with disabilities and older beneficiaries, the ACA also has helped to alleviate out-of-pocket spending burdens by phasing out the Part D coverage gap and by eliminating cost sharing for certain preventive services. Filling the coverage gap could be especially helpful for younger beneficiaries with disabilities due to their higher prescription drug costs than older beneficiaries. And for those beneficiaries who are dually eligible for Medicare and Medicaid, which includes a disproportionate share of younger beneficiaries with disabilities, the law expanded coverage of home- and community-based care, and created a new federal office to help coordinate benefits and coverage under the two programs.

Yet despite broader access to public and private coverage and improvements in Medicare benefits brought about by the ACA, people with disabilities are likely to face ongoing challenges if their coverage, including Medicare, does not provide the services and supports they need to live as independently and productively as possible. Evidence points to a consistent pattern of differences in the health care experiences of younger beneficiaries with disabilities and those of older Medicare beneficiaries, with younger beneficiaries encountering significantly more cost-related barriers to care than older beneficiaries. Given high rates of health problems and relatively low incomes among Medicare’s beneficiaries under age 65 with disabilities, the needs of this relatively vulnerable population require careful attention in ongoing Medicare policy discussions.

Juliette Cubanski and Tricia Neuman are with the Kaiser Family Foundation.Anthony Damico is an independent consultant.

Tables

Table 1: Amount and Distribution of Medicare Per Capita Spending Overall and By Type of Service for Traditional Medicare Beneficiaries Under Age 65 and Over Age 65, 2014
Type of servicePart of Medicare  covering serviceUnder age 65Over age 651
AmountPercent of totalAmountPercent of total
Total  $13,098 100.0% $9,972 100.0%
Part D drugsD3,81729.1%1,15911.6%
Acute inpatient hospitalA3,14124.0%2,72227.3%
Outpatient hospitalA2,20316.8%1,44814.5%
Other inpatient hospitalA6404.9%3693.7%
Evaluation & managementB5033.8%4594.6%
Other Part B proceduresB3702.8%5245.3%
Skilled nursing facilityA3662.8%8268.3%
Physician office servicesB3652.8%4164.2%
Home healthA or B23242.5%4995.0%
Part B drugsB2872.2%3603.6%
TestsB2712.1%2392.4%
Durable medical equipmentB2251.7%1321.3%
Other Part B servicesB2111.6%1641.6%
ImagingB1301.0%1711.7%
HospiceA850.6%3333.3%
DialysisB590.5%130.1%
AnesthesiaB520.4%530.5%
Ambulatory surgery centerB500.4%860.9%
NOTE: Analysis excludes beneficiaries in Medicare Advantage. 165-year olds are excluded because these beneficiaries are enrolled for less than a full year. 2Home health services can be covered under Part A or Part B depending on whether or not the services follow a hospital stay.SOURCE: Kaiser Family Foundation analysis of a five percent sample of Medicare claims from the CMS Chronic Conditions Data Warehouse, 2014.
Table 2: Amount and Distribution of Out-of-Pocket Spending Overall and By Type of Service for Traditional Medicare BeneficiariesUnder Age 65 and Age 65 or Older, 2012
TypeUnder age 65Age 65 or older
AmountPercent of totalPercent ofnon-premiumspendingAmountPercent of totalPercent ofnon-premiumspending
Total out-of-pocket spending $3,706 100%n/a$6,146100%n/a
  Premium out-of-pocket spending11,38337%n/a2,97948%n/a
  Non-premium out-of-pocket spending2,32463%100%3,16752%100%
     Medical providers67118%29%76712%24%
     Prescription drugs60516%26%5489%17%
     Long-term care facility46413%20%99516%31%
     Dental2035%9%3596%11%
     Inpatient1494%6%1032%3%
     Outpatient1404%6%1563%5%
     Skilled nursing facility872%4%1102%3%
     Home health4<1%<1%1292%4%
NOTE: Analysis excludes beneficiaries in Medicare Advantage. 1Missing out of pocket premium amounts were imputed following a hotdecking approach, stratified by categories of supplemental coverage.SOURCE: Kaiser Family Foundation analysis of Medicare Current Beneficiary Survey 2012 Cost & Use file.
Table 3: Utilization of Service by Traditional Medicare BeneficiariesUnder Age 65 and Age 65 or Older, 2012
Type of serviceUnder age 65Age 65 or older
Percent using servicePercent using service
Prescription drugs88%90%
Office visit66%77%
Outpatient visit64%64%
Dental35%49%
Emergency department (ED) visit19%14%
  2+ ED visits7%3%
Any inpatient stay18%18%
  2+ inpatient stay7%6%
Home health visit5%10%
Skilled nursing facility (SNF) stay2%6%
  2+ SNF stays<1%2%
Hospice1%3%
NOTE: Analysis excludes beneficiaries in Medicare Advantage.SOURCE: Kaiser Family Foundation analysis of Medicare Current Beneficiary Survey 2012 Cost & Use file.


Endnotes

  1. This provision was included in the Social Security Amendments of 1972, with Medicare coverage effective July 1, 1973. ↩︎
  2. Centers for Medicare & Medicaid Services (CMS), Office of Enterprise Data and Analysis, Office of the Actuary, CMS Fact Facts, available at https://www.cms.gov/fastfacts/. ↩︎
  3. CMS, 2013 Medicare & Medicaid Statistical Supplement, Table 2.1 Medicare Enrollment: Hospital Insurance and/or Supplementary Medical Insurance Programs for Total, Fee-for-Service and Managed Care Enrollees as of July 1, 2012: Selected Calendar Years 1966-2012. ↩︎
  4. In 2014, 4.5 million people on Medicare age 65 or older (10% of all beneficiaries age 65 or older) initially qualified for Medicare due to receiving disability insurance benefits, having end-stage renal disease, or both prior to turning age 65; based on Kaiser Family Foundation analysis of a five percent sample of 2014 Medicare claims from the CMS Chronic Conditions Data Warehouse. ↩︎
  5. In 2014 0.3 million people on Medicare under age 65 (3% of all beneficiaries under age 65) qualified for Medicare due to having ESRD (separate estimates for ALS are not available); based on Kaiser Family Foundation analysis of a five percent sample of 2014 Medicare claims from the CMS Chronic Conditions Data Warehouse. ↩︎
  6. U.S. Social Security Administration, Office of Retirement and Disability Policy, Office of Research, Evaluation, and Statistics, Annual Statistical Report on the Social Security Disability Insurance Program, 2014, November 2015, Table 6: Beneficiaries in Current-Payment Status, Distribution, by sex and diagnostic group, December 2014, available at: http://www.socialsecurity.gov/policy/docs/statcomps/di_asr/2014/. ↩︎
  7. We scaled respondents’ income estimates reported in the Medicare Current Beneficiary Survey to match income distribution estimates from The Urban Institute’s 2012 Dynamic Simulation of Income Model (DYNASIM). ↩︎
  8. This applies to Medicare beneficiaries residing in the community; for facility residents, the definition of cognitive/mental impairment also includes ability to recall names and faces, current season, location of nursing home, and room. ↩︎
  9. We assign supplemental coverage in the following order: Medicare Advantage, Medicaid, employer, Medigap, other, none. Beneficiaries with multiple sources of coverage are assigned to the highest category in the ordering. ↩︎
  10. Our methodology of assigning supplemental coverage in a hierarchical manner understates the share of beneficiaries with Medicaid, since those who also have Medicare Advantage are included in that coverage group. In 2012, a total of 45% of beneficiaries under age 65 with disabilities and 14% of beneficiaries age 65 or older were dually-eligible for Medicare and Medicaid. ↩︎
  11. See https://www.medicare.gov/supplement-other-insurance/when-can-i-buy-medigap/when-can-i-buy-medigap.html; see also Kaiser Family Foundation, “Medigap: Spotlight on Enrollment, Premiums, and Recent Trends,” April 2013, available at https://modern.kff.org/medicare/report/medigap-enrollment-premiums-and-recent-trends/. ↩︎
  12. Kaiser Family Foundation analysis of the Medicare Current Beneficiary Survey 2013 Access to Care file. ↩︎
  13. Analysis of per capita Medicare and out-of-pocket spending among beneficiaries enrolled in Medicare Advantage plans is not possible due to lack of or insufficient data. ↩︎
  14. Juliette Cubanski, Tricia Neuman, and Anthony Damico, “Similar But Not the Same: How Medicare Per Capita Spending and Service Use Compares for Younger and Older Beneficiaries,” Kaiser Family Foundation, August 2016, available at https://modern.kff.org/medicare/issue-brief/similar-but-not-the-same-how-medicare-per-capita-spending-compares-for-younger-and-older-beneficiaries. ↩︎
  15. Analysis of service use among beneficiaries enrolled in Medicare Advantage plans is not possible due to lack of data. ↩︎
  16. Irrespective of the supplemental coverage hierarchy, these estimates are 45% and 14%, respectively. See endnotes 9 and 10. ↩︎
  17. Juliette Cubanski and Tricia Neuman, “Medicare Doesn’t Work As Well for Younger, Disabled Beneficiaries As It Does for Older Enrollees,” Health Affairs, September 2010, vol. 29 no. 9 1725-1733. ↩︎

The 2015-2016 Zika Outbreak

Published: Aug 11, 2016

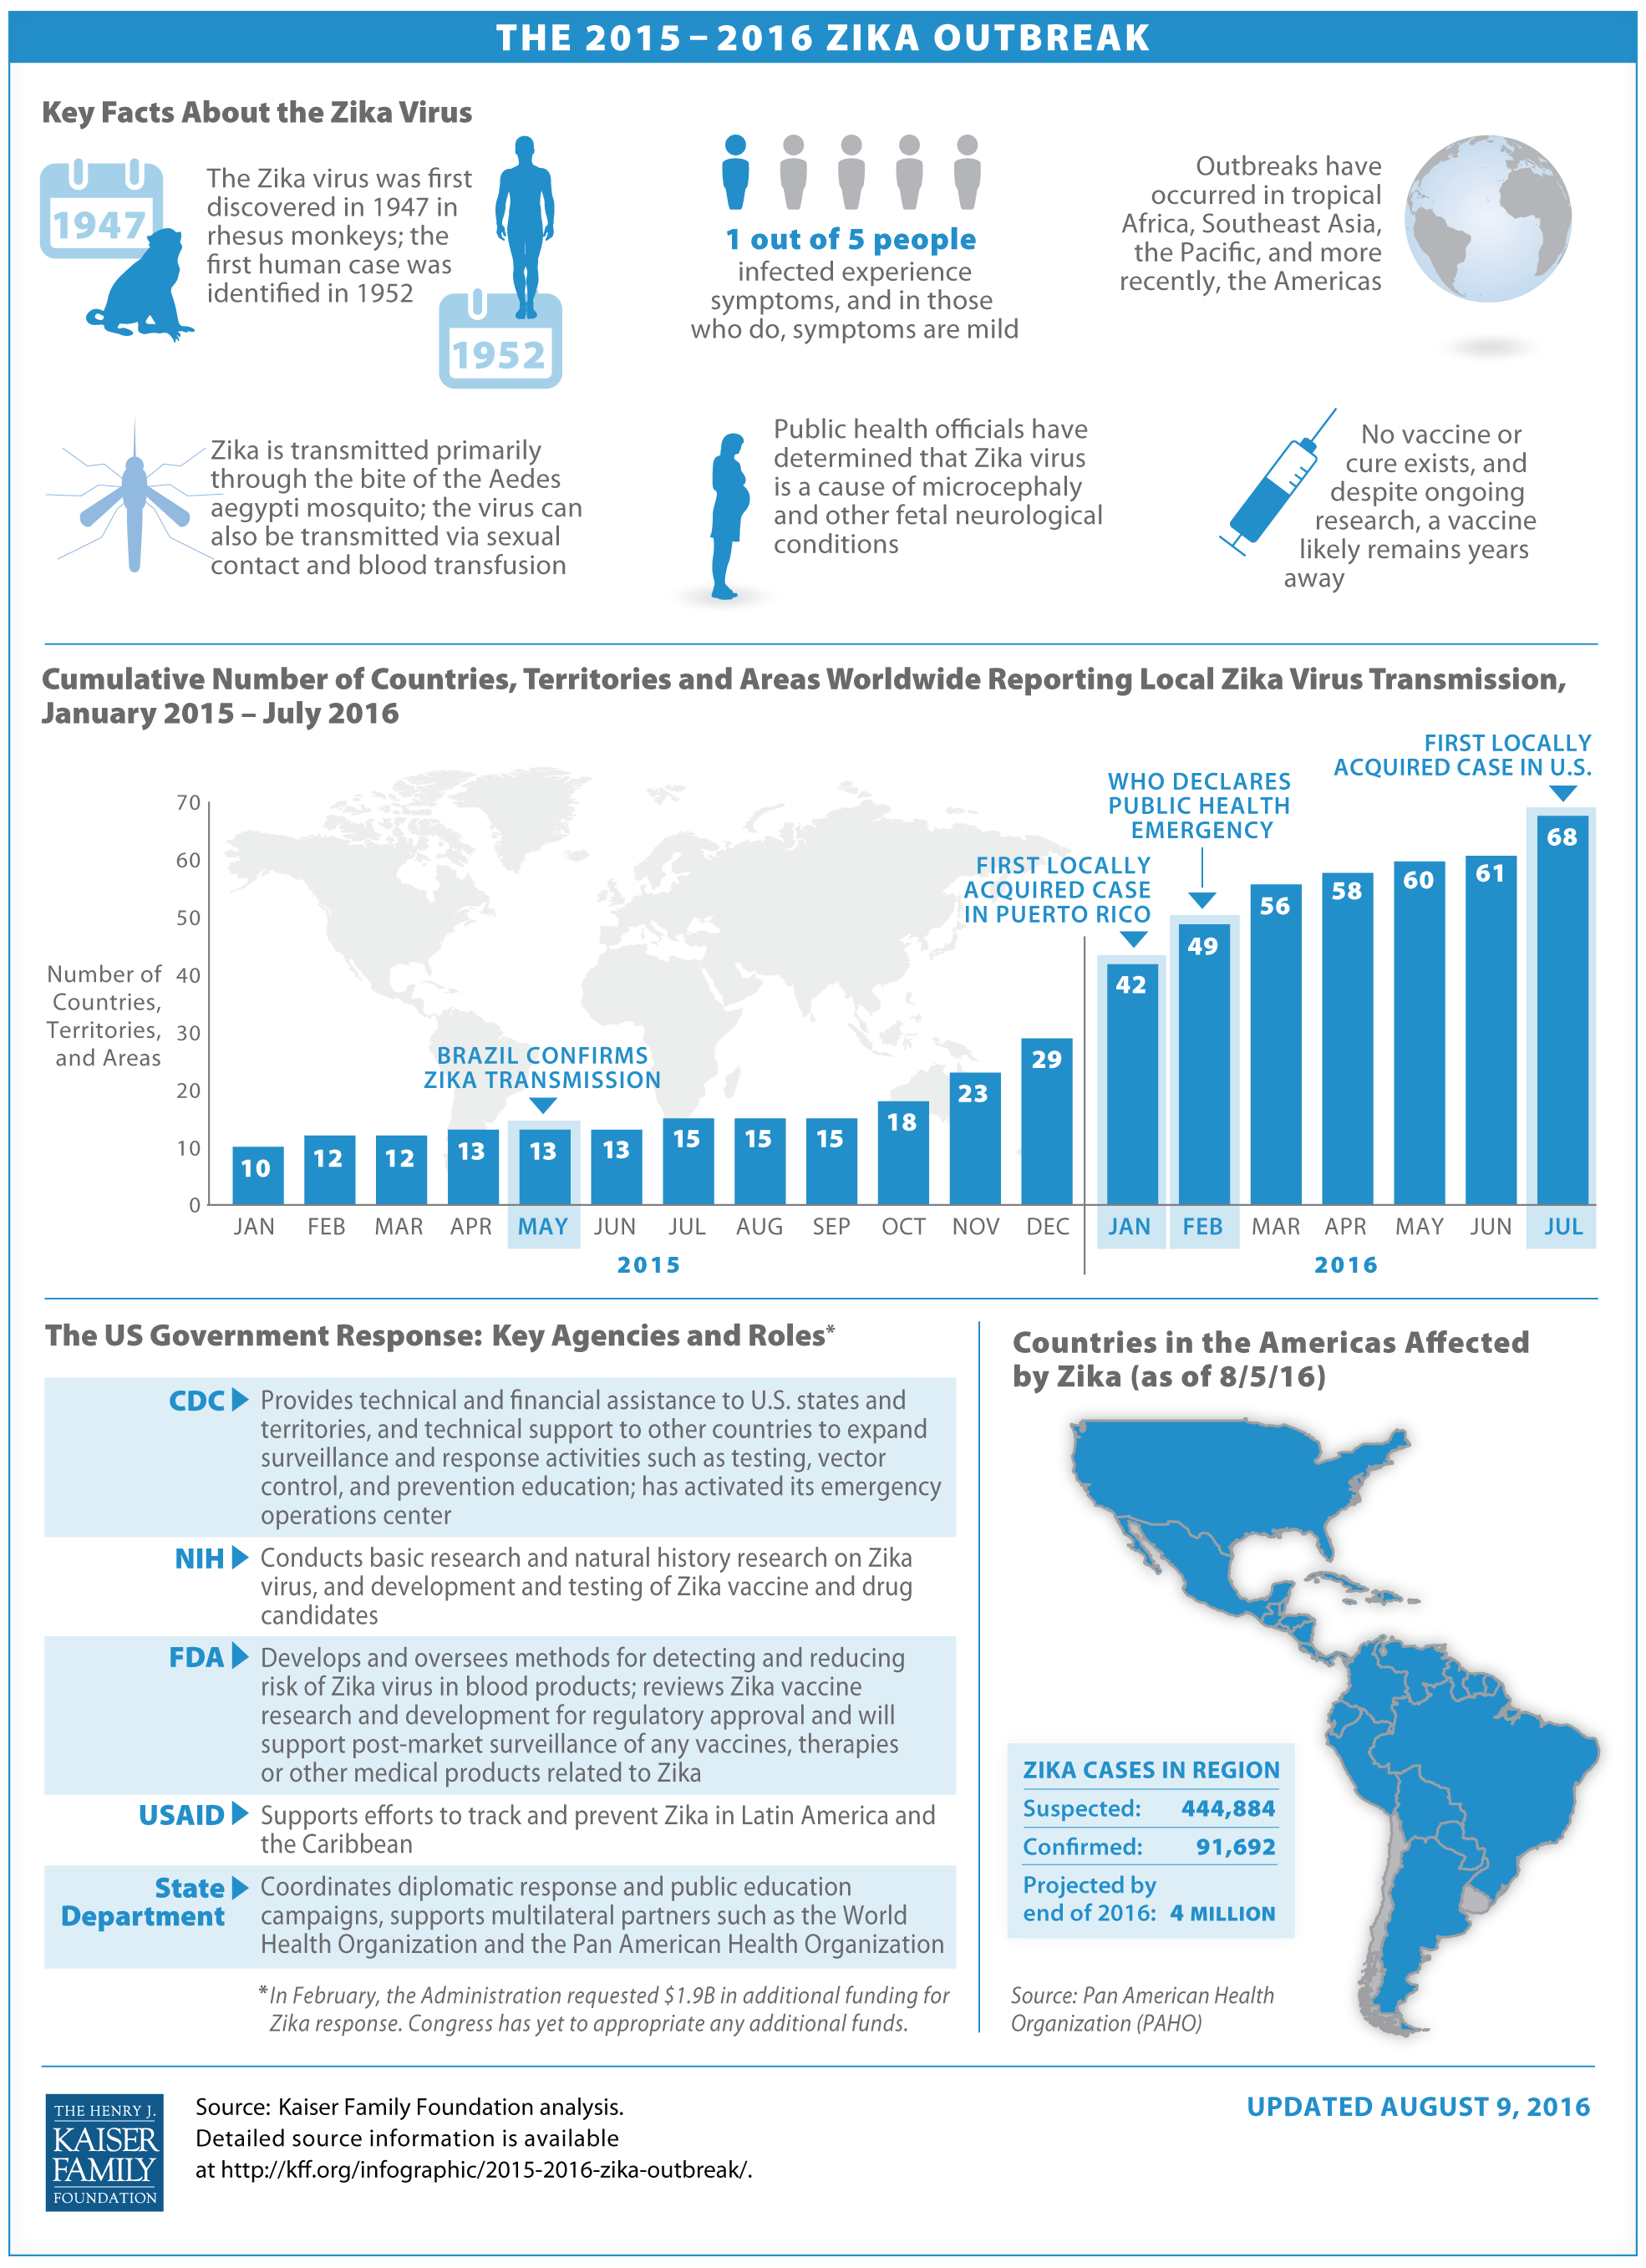
This infographic offers key facts about the Zika virus, tracks the increasing number of countries reporting local transmission over the past year, and breaks down how key U.S. government agencies are responding to Zika.

Download PDF: The 2015-2016 Zika Outbreak (Updated August 11, 2016)


The 2015-2016 Zika Outbreak Infographic Updated August 11 2016

Sources:

• WHO. Fact Sheet: Zika virus; June 2016, available at: http://www.who.int/mediacentre/factsheets/zika/en/.• CDC. Zika; August 2016, available at: http://www.cdc.gov/zika/.• WHO. Situation Report: Zika Virus, Microcephaly, and Guillain-Barré Syndrome; August 2016, available at: http://www.who.int/emergencies/zika-virus/situation-report/4-august-2016/en/ .• PAHO. Zika Virus Infection; August 2016, available at: http://www.paho.org/hq/index.php?option=com_content&view=article&id=11585&Itemid=41688&lang=en .


Medicaid’s Role in Meeting Seniors’ Long-Term Services and Supports Needs

Published: Aug 2, 2016

Although nearly all of the nation’s 46 million seniors have health insurance through Medicare, that program does not cover the long-term services and supports (LTSS) that many seniors need. Nearly half of seniors residing in the community have an LTSS need1  due to a cognitive or physical limitation. For example, people with dementia,2  mobility or coordination problems due to stroke, severe vision loss, or significant pain that prevents movement may require LTSS. LTSS provide assistance with routine self-care tasks, such as eating, bathing, and dressing, and household activities, such as preparing meals, managing medication, and doing laundry. LTSS are expensive, with a median annual cost of over $90,000 for nursing facility care, more than $40,000 for homemaker or home health services, and nearly $20,000 for adult day health care in 2015.3  At the same time, many seniors are living in poverty (10%) or near poverty (22%)4  and unlikely to be able to afford paid help, and few have private long-term care insurance to meet their needs. People over age 85 are most likely to need LTSS,5  and the number of individuals in this age group is expected to increase by almost 70 percent over the next two decades.6  The need for LTSS varies by state (Table 1), but all states have a substantial share of their population that currently or may soon need LTSS. Medicaid plays a key role in financing LTSS for many low-income seniors, and its role will grow as the population ages. This fact sheet describes how seniors become eligible for Medicaid LTSS, what LTSS Medicaid covers, and how much Medicaid spends for those services, and highlights key policy issues in Medicaid and LTSS.

How Do Seniors Qualify for Medicaid LTSS?

Not all seniors who need LTSS qualify for Medicaid; they must have low incomes and limited assets. States generally must provide Medicaid to seniors who receive federal Supplemental Security Income (SSI) benefits and may extend Medicaid eligibility to seniors with relatively higher incomes (up to 300% of SSI, or $2,199 per month for an individual in 2016).  At state option, seniors who incur health care expenses may “spend down” to the state’s financial eligibility threshold. After qualifying for Medicaid, often after entering a nursing facility and exhausting their savings, seniors must allocate all of their income except for a small personal needs allowance toward the cost of their health and long-term care services. In 2015, the median monthly personal needs allowance is $50 for those receiving institutional care and $1,962 for community-based care, reflecting that those living in the community face additional costs to maintain housing.7   Seniors also generally must meet asset limits to qualify for Medicaid, typically at SSI levels ($2,000 for an individual and $3,000 for a couple).

In addition to meeting financial eligibility criteria, seniors also must qualify for Medicaid LTSS based on their functional needs.  Functional eligibility for LTSS is commonly assessed by determining a person’s need for assistance with one or more self-care or household activities. Other functional eligibility criteria may include the presence of certain medical conditions or evidence of cognitive impairment. Traditionally, beneficiaries have been required to have functional limitations that would otherwise meet an institutional level of care to qualify for Medicaid home and community-based services (HCBS). However, the Deficit Reduction Act of 2005 gives states the option, expanded by the Affordable Care Act (ACA), to provide Medicaid HCBS to people with functional limitations that do not yet rise to an institutional level of care,8  and states are increasingly offering HCBS to this population to prevent or delay the need for more intensive and costly future care.

Which LTSS Does Medicaid Cover?

States have considerable flexibility in designing their Medicaid benefit packages but generally must provide nursing facility and home health services to adult beneficiaries.  All other LTSS, particularly most HCBS, are optional for states. Examples of Medicaid HCBS include homemaker/home health aide services, personal care or attendant services, adult day health services, case management, habilitation, respite care, home modifications, and home delivered meals.

LTSS may be provided in the community or in an institution such as a nursing facility. Over the last thirty years, there has been a shift toward serving more people in the community rather than institutions due in large part to the growth in beneficiary preferences for HCBS and states’ obligations under the Supreme Court’s Olmstead decision, which found that the unjustified institutionalization of persons with disabilities violates the Americans with Disabilities Act.9  Still, some people with extensive medical and LTSS needs may require around-the-clock care that is provided in an institutional setting such as a nursing facility. Almost all states (46 states in both fiscal year (FY) 2015 and 2016) continue to focus on expanding beneficiary access to Medicaid HCBS.10 

How Much Does Medicaid Spend to Cover Seniors’ LTSS Needs?

Most Medicaid spending on behalf of seniors is for LTSS. Of the $80.4 billion11  Medicaid spent on care for full-benefit12  seniors in FY 2011, over two-thirds ($55.8 billion, or 69%) was devoted to LTSS (Figure 1). LTSS spending for seniors as a share of all Medicaid spending for seniors varies by state, with some states spending a little over half of their total Medicaid expenditures for this population on LTSS, and others spending more than 90% (Table 2). This variation reflects differences in both the needs of states’ elderly beneficiaries and the structure of state Medicaid programs. For example, some states may provide a broader scope of acute care (e.g., dental) services to seniors, while others may provide a broader scope of LTSS. In addition, some states rely on comprehensive risk-based managed care organizations to deliver LTSS, with LTSS spending combined with acute care spending under a single capitation rate.

Figure 1: LTSS account for the majority of Medicaid expenditures for seniors with full benefits.

Nationally, Medicaid spent more than $12,000 per full-benefit senior enrollee on LTSS in FY 2011. Medicaid LTSS spending per senior enrollee varied across states, from $6,427 in California to $28,130 in North Dakota (Figure 2 and Table 2). This variation was due in part to differences in the mix of LTSS services used across states and variation in provider reimbursement rates.

Figure 2: Medicaid LTSS spending per full-benefit senior enrollee varies by state.

Nearly three-quarters (73%) of national Medicaid LTSS spending for seniors funds institutional services, with just over one-quarter (27%) going toward community-based services as of  FY 2011 (Figure 1).  The split between community-based and institutional Medicaid LTSS spending for seniors in Medicaid varies at the state level, ranging from 7 percent (Florida) to 60 percent (Alaska) in FY 2011 (Figure 3 and Table 2). While all states provide some Medicaid HCBS to seniors, the size and scope of these programs varies, and because many of these services are offered through waivers, enrollment can be capped.  In 2014, there were 78 Medicaid HCBS waivers in 46 states targeted to seniors or seniors and non-elderly people with physical disabilities, with nearly 156,000 individuals on a waiting list for waiver services.13   Waiting list enrollment also varies by state.

Figure 3: The share of Medicaid LTSS spending for full-benefit seniors devoted to HCBS varies by state.

What are the Current Policy Issues in LTSS for Seniors?

Given that an estimated 70 percent of Americans turning 65 today will use some form of LTSS in their lifetime,14  ensuring adequate access to affordable LTSS for seniors is likely to remain a topic of discussion among policymakers and other stakeholders in the coming decades. While the majority of Americans age 40 and older anticipate needing LTSS as they age and have done some planning, 38 percent expect that Medicare will cover their LTSS expenses; however, while Medicare covers acute and post-acute services, it does not cover LTSS.  Just 20 percent of those surveyed identified Medicaid as a potential source of LTSS coverage, suggesting there are opportunities to educate the public about current LTSS financing options.15  With Medicaid likely to continue to play a primary role in financing LTSS, policymakers have begun discussing how to streamline the existing Medicaid HCBS authorities, which can be complex for states to administer and difficult for seniors who need LTSS to navigate.16 

Policymakers also continue to focus on ways to increase access to community-based services as opposed to institutional care. The vast majority of Americans age 40 and over would prefer to receive LTSS in a home or community-based setting rather than in an institution.17  Over the last several decades, total Medicaid LTSS spending (for both seniors and people with disabilities) has been increasingly devoted to HCBS instead of institutional care, surpassing 50% in FY 2013, and reaching 53% in FY 2014.18   However, disparities in access to community-based services remain:  among Medicaid beneficiaries receiving LTSS, only half of seniors lived in the community in 2011, compared to 80% of non-elderly people with disabilities.19   To support seniors’ desire to “age in place,” policymakers will continue to draw on the Medicaid options to provide HCBS, including those added and expanded by the ACA, while also considering how to increase the supply of community-based providers and affordable housing.

LTSS delivery system reforms are another area of recent policy focus, with an increasing number of states pursuing models that seek to integrate LTSS with physical and behavioral health services.  Some states are implementing risk-based capitated managed care models, while others are pursuing managed fee-for-service options, such as Medicaid health homes for beneficiaries with chronic conditions.  Some states are focused on Medicaid LTSS delivery system reforms, while others also are examining how to better coordinate Medicare and Medicaid services for beneficiaries who are eligible for both programs.  As evaluation results and data from these models become available, policymakers may be able to identify promising practices to improve health outcomes and increase access to community-based care while preventing or delaying unnecessary institutional care.

Looking Ahead

Many of the nation’s 76 million baby boomers will develop chronic health conditions or experience functional impairments with advancing age, leading to a need for LTSS. Improving access to LTSS for seniors is likely to remain a major public health issue as federal and state policymakers, seniors and their families, and other stakeholders consider cost-effective options to best meet the needs of this growing population.  Medicaid is the nation’s primary payer for LTSS for people with low incomes and is likely to continue to play a key role as LTSS financing reforms are considered. In the years ahead, policymakers will be challenged to meet the growing need for LTSS for our nation’s seniors in a manner that promotes community integration and autonomy, supports caregivers, and provides adequate access to needed care while managing costs.

Table 1: Senior Population (Age 65+), by State
StateNumber of Residents Age 65+, 2014aShare of State Population Age 65+, 2014aShare of Senior Population <200% of Poverty, 2014aShare of Senior Population Age 85+, 2014aShare of Senior Population with an ADL Difficulty, 2012b
United States45,994,00015%32%12%9%
Alabama716,00015%43%7%11%
Alaska66,70010%28%N/A10%
Arizona965,70015%36%10%7%
Arkansas462,10016%37%7%10%
California4,888,10013%32%13%11%
Colorado736,60014%24%16%7%
Connecticut495,20014%30%15%7%
Delaware153,40017%24%7%7%
District of Columbia75,80012%36%9%8%
Florida3,524,90018%38%12%8%
Georgia1,269,50013%36%9%10%
Hawaii223,20016%27%14%8%
Idaho210,20013%28%13%8%
Illinois1,886,90015%32%16%8%
Indiana973,30015%26%13%8%
Iowa484,60016%32%17%7%
Kansas390,70014%28%17%7%
Kentucky682,30016%39%11%10%
Louisiana556,60012%53%8%11%
Maine241,60019%29%11%6%
Maryland798,30013%27%12%8%
Massachusetts1,040,20016%36%16%8%
Michigan1,482,10015%30%10%9%
Minnesota818,90015%21%12%7%
Mississippi391,60013%49%11%12%
Missouri935,30016%28%12%8%
Montana158,50016%32%10%7%
Nebraska262,70014%31%14%6%
Nevada402,10014%33%11%7%
New Hampshire205,00016%24%9%6%
New Jersey1,280,30014%21%12%8%
New Mexico331,30016%39%N/A10%
New York3,044,40015%36%14%9%
North Carolina1,441,40015%35%9%9%
North Dakota95,30013%32%16%6%
Ohio1,852,00016%31%13%8%
Oklahoma539,80014%31%9%9%
Oregon717,40018%24%13%9%
Pennsylvania2,152,00017%28%14%8%
Rhode Island152,90015%34%14%6%
South Carolina744,90016%39%9%9%
South Dakota134,00016%32%15%6%
Tennessee1,027,40016%41%12%10%
Texas3,162,80012%32%11%10%
Utah317,10011%27%6%7%
Vermont101,50016%24%10%7%
Virginia1,109,50013%26%12%9%
Washington1,014,60014%30%10%8%
West Virginia320,90018%44%10%11%
Wisconsin882,40015%27%11%7%
Wyoming73,90013%25%9%6%
NOTES: N/A: Sample size too small for reliable estimate. In 2014, 200% of poverty was $22,708 for an individual and $28,618 for a couple.

SOURCES: a Kaiser Family Foundation analysis of Census Bureau Current Population Survey, Annual Social and Economic Supplement, 2015; b Susan C. Reinhard, Enid Kassner, Ari Houser, Kathleen Ujvari, Robert Mollica, and Leslie Henderickson, Raising Expectations: A State Scorecard on Long-Term Services and Supports for Older Adults, People with Physical Disabilities, and Family Caregivers 92, Exhibit A22 (Washington, DC: AARP Public Policy Institute and The Commonwealth Fund and Long Beach, CA: The SCAN Foundation), http://www.aarp.org/content/dam/aarp/research/public_policy_institute/ltc/2014/raising-expectations-2014-AARP-ppi-ltc.pdf.

Table 2: Medicaid Enrollment and Expenditures for Full-Benefit Enrollees Age ≥65, FY2011
StateTotal Number of Full-Benefit Medicaid Enrollees Age 65+Total Medicaid Spending for Full-Benefit Enrollees Age 65+ (Millions)Medicaid LTSS Spending for Full-Benefit Enrollees Age 65+Share of LTSS Spending for Full-Benefit Enrollees Age 65+ that is for HCBS
Total LTSS Spending (Millions)LTSS Spending as a Share of Total Spending (%)Spending Per Enrollee
United States4,568,680$80,433$55,77569%$12,83627%
Alabama50,040$924$80387%$16,05011%
Alaska9,065$220$17680%$19,38060%
Arizona65,702$1,061N/AN/AN/AN/A
Arkansas42,536$871$66276%$15,57121%
California978,708$11,763$6,29053%$6,42748%
Colorado46,962$868$60970%$12,96529%
Connecticut50,259$1,536$1,36989%$27,23022%
Delaware7,000$194$16183%$23,05013%
District of Columbia13,493$369$30482%$22,49944%
Florida267,634$3,929$2,61567%$9,6427%
Georgia92,530$1,309$1,12786%$12,18020%
Hawaii22,773$420N/AN/AN/AN/A
Idaho12,308$191$16084%$13,00654%
Illinois193,215$2,209$1,56471%$8,09632%
Indiana62,199$1,323$1,10584%$17,77013%
Iowa32,521$688$58385%$17,93222%
Kansas27,607$563$47184%$15,31127%
Kentucky57,398$904$76985%$13,3908%
Louisiana60,558$938$76682%$12,65024%
Maine28,387$546$30957%$11,6439%
Maryland52,423$1,282$1,04782%$19,39819%
Massachusetts118,782$3,232$1,95360%$16,44015%
Michigan121,615$2,140$1,77083%$14,55014%
Minnesota65,902$1,650N/AN/AN/AN/A
Mississippi46,484$864$70582%$15,17612%
Missouri80,807$1,375$96170%$11,89719%
Montana9,275$255$23291%$24,23319%
Nebraska24,268$364$29080%$11,94221%
Nevada15,950$211$16980%$10,59027%
New Hampshire10,763$288$26391%$24,46521%
New Jersey115,038$2,256$1,63673%$14,26213%
New Mexico24,347N/AN/AN/AN/AN/A
New York458,594$12,995$9,69075%$21,12938%
North Carolina123,764$1,302$1,04780%$8,45938%
North Dakota7,162$223$20190%$28,1309%
Ohio124,501$3,423$2,83883%$22,79622%
Oklahoma53,893$655$52680%$10,05425%
Oregon39,497$958$84188%$21,28145%
Pennsylvania190,599$4,073$3,56287%$18,68916%
Rhode Island16,221$276$15155%$9,30913%
South Carolina71,978$882$70780%$9,82417%
South Dakota8,273$135$11685%$13,99811%
Tennessee77,730$1,224N/AN/AN/AN/A
Texas263,460$4,005$2,37959%$8,96419%
Utah14,835$177$11968%$8,14110%
Vermont9,305$133N/AN/AN/AN/A
Virginia73,709$1,206$97681%$13,24226%
Washington68,338$1,106$98989%$14,46858%
West Virginia25,596$595$54291%$21,17517%
Wisconsin131,047$2,142N/AN/AN/AN/A
Wyoming3,629$117$9178%$25,13919%
NOTES:  Enrollees were identified as having full benefits if for each month they were enrolled in Medicaid they also received full benefits or received Medicaid benefits through an alternative package of benchmark equivalent coverage. Data include full-benefit enrollees who participated in Medicaid for any length of time during the federal fiscal year. MLTSS programs for seniors were in place in AZ, HI, MN, TN, VT, and WI. Because of the way the MLTSS data are categorized, we were unable to calculate reliable LTSS numbers for these states, as represented with “N/A.” We were also unable to report spending for New Mexico, due to a spending data reliability issue for senior enrollees in the New Mexico CoLTS program.

SOURCE: Kaiser Commission on Medicaid and the Uninsured and Urban Institute estimates based on data from FY 2011 MSIS and CMS-64 reports. Because 2011 data were unavailable, 2010 data was used for Florida, Kansas, Maine, Maryland, Montana, New Mexico, New Jersey, Oklahoma, Texas, and Utah. For total spending in these states, it was then adjusted to 2011 CMS-64 spending levels. For spending per enrollee in these states it was adjusted to 2010 CMS-64 spending levels.

  1. Rachel Garfield, Katherine Young, MaryBeth Musumeci, Erica L. Reaves, and Judy Kasper, Serving Low-Income Seniors Where They Live: Medicaid’s Role in Providing Community-Based Long-Term Services and Supports (Washington, DC: KCMU, September 2015), https://modern.kff.org/medicaid/issue-brief/serving-low-income-seniors-where-they-live-medicaids-role-in-providing-community-based-long-term-services-and-supports/. ↩︎
  2. Rachel Garfield, MaryBeth Musumeci, Erica L. Reaves, and Anthony Damico. Medicaid’s Role for People with Dementia. (Washington, DC: KCMU, October 2015), https://modern.kff.org/medicaid/issue-brief/medicaids-role-for-people-with-dementia/. ↩︎
  3. Genworth, Cost of Care Survey 2016, Summary of 2016 Survey Findings (Richmond, VA: Genworth Financial, Inc., May 2016), https://www.genworth.com/dam/Americas/US/PDFs/Consumer/corporate/131168_050516.pdf. ↩︎
  4. Kaiser Commission of Medicaid and the Uninsured analysis of Current Population Survey, Annual Social and Economic Supplement, 2015. ↩︎
  5. Rachel Garfield, Katherine Young, MaryBeth Musumeci, Erica L. Reaves, and Judy Kasper, Serving Low-Income Seniors Where They Live: Medicaid’s Role in Providing Community-Based Long-Term Services and Supports (Washington, DC: KCMU, September 2015), https://modern.kff.org/medicaid/issue-brief/serving-low-income-seniors-where-they-live-medicaids-role-in-providing-community-based-long-term-services-and-supports/. ↩︎
  6. Ari Houser, Wendy Fox-Grage, and Kathleen Ujvari, Across the States 2012: Profiles of Long-Term Services and Supports (Washington, DC: AARP Public Policy Institute, September 2012), http://www.aarp.org/home-garden/livable-communities/info-09-2012/across-the-states-2012-profiles-of-long-term-services-supports-AARP-ppi-ltc.html. ↩︎
  7. Molly O’Malley Watts, Elizabeth Cornachione, and MaryBeth Musumeci, Medicaid Financial Eligibility for Seniors and People with Disabilities in 2015 (Washington, DC: Kaiser Commission on Medicaid and the Uninsured, March 2016), https://modern.kff.org/report-section/medicaid-financial-eligibility-for-seniors-and-people-with-disabilities-in-2015-report/. ↩︎
  8. 42 U.S.C. § 1396n(i). ↩︎
  9. Olmstead v. L.C. 527 U.S. 581 (1999), http://www.law.cornell.edu/supct/html/98-536.ZS.html. ↩︎
  10. Vernon K. Smith, Kathleen Gifford and Eileen Ellis, Health Management Associates, Robin Rudowitz, Laura Snyder, and Elizabeth Hinton, Medicaid Reforms to Expand Coverage, Control Costs and Improve Care: Results from a 50-State Medicaid Budget Survey for State Fiscal Years 2015 and 2016 (Washington, DC: Kaiser Commission on Medicaid and the Uninsured, October 2015), https://modern.kff.org/medicaid/report/medicaid-reforms-to-expand-coverage-control-costs-and-improve-care-results-from-a-50-state-medicaid-budget-survey-for-state-fiscal-years-2015-and-2016/. ↩︎
  11. This is likely lower than the actual amount that Medicaid spent on LTSS in FY 2011, because we are unable to capture all spending on managed long-term services and supports (MLTSS) programs. At this time, we are unable to parse out MLTSS from acute care managed care spending. ↩︎
  12. We restricted analysis to full-benefit Medicaid enrollees because Medicaid does not cover LTSS for enrollees receiving limited or partial benefits. Enrollees were identified as having full benefits if for each month they were enrolled in Medicaid they also received full benefits or received Medicaid benefits through an alternative package of benchmark equivalent coverage. Data include full-benefit enrollees who participated in Medicaid for any length of time during the federal fiscal year. ↩︎
  13. Terence Ng, Charlene Harrington, MaryBeth Musumeci, and Erica L. Reaves, Medicaid Home and Community-Based Services Programs: 2012 Data Update (Washington, DC: Kaiser Commission on Medicaid and the Uninsured, November 2015), https://modern.kff.org/medicaid/report/medicaid-home-and-community-based-services-programs-2012-data-update/. Five other states (AZ, HI, RI, TN, and VT) offer Medicaid HCBS to seniors through Section 1115 waiver authority; information about waiting lists in those states is unavailable. ↩︎
  14. “Who Needs Care?” U.S. Department of Health and Human Services, accessed June 10, 2016, http://longtermcare.gov/the-basics/who-needs-care/. ↩︎
  15. The Associate Press-NORC Center for Public Affairs Research, Long-Term Care in America: Expectations and Preferences for Care and Caregiving (New York, NY: The Associated Press and Chicago, IL: NORC, May 2016), http://www.longtermcarepoll.org/Pages/Polls/long-term-care-in-america-expectations-and-preferences-for-care-and-caregiving.aspx. ↩︎
  16. Mary Sowers, Henry Claypool, and MaryBeth Musumeci, Streamlining Medicaid Home and Community-Based Services: Key Policy Questions (Washington, DC: Kaiser Commission on Medicaid and the Uninsured, March 2016), https://modern.kff.org/report-section/streamlining-medicaid-home-and-community-based-services-key-policy-questions-issue-brief/. ↩︎
  17. The Associate Press-NORC Center for Public Affairs Research, Long-Term Care in America: Expectations and Preferences for Care and Caregiving (New York, NY: The Associated Press and Chicago, IL: NORC, May 2016), http://www.longtermcarepoll.org/Pages/Polls/long-term-care-in-america-expectations-and-preferences-for-care-and-caregiving.aspx. ↩︎
  18. Steven Eiken, Kate Sredl, Brian Burwell and Paul Saucier, Medicaid Expenditures for Long-Term Services and Supports in FY 2014:  Managed LTSS Reached 15 Percent of LTSS Spending (Truven Health Analytics, April 15, 2016), https://www.medicaid.gov/medicaid-chip-program-information/by-topics/long-term-services-and-supports/downloads/ltss-expenditures-2014.pdf. ↩︎
  19. Mary Sowers, Henry Claypool, and MaryBeth Musumeci, Streamlining Medicaid Home and Community-Based Services: Key Policy Questions (Washington, DC: Kaiser Commission on Medicaid and the Uninsured, March 2016), https://modern.kff.org/report-section/streamlining-medicaid-home-and-community-based-services-key-policy-questions-issue-brief/. ↩︎

How ACA Marketplace Premiums Measure Up to Expectations

Published: Aug 1, 2016

Premium increases in the health insurance marketplaces created under the Affordable Care Act (ACA) will likely be higher in 2017 than in recent years. While premiums generally go up every year as the underlying cost of care rises, there are a number of reasons to expect faster growth this coming year, including the expiration of the ACA’s temporary reinsurance program at the end of 2016 and miscalculations by many insurers about how much health care enrollees would use.

Kaiser Family Foundation analysis of proposed rates in states that make the information publicly-available shows an average premium increase in the benchmark second-lowest-cost Silver plan in 17 major cities of 9% in 2017, compared to an average increase of 2% in these cities in 2016. The second-lowest-cost Silver plan is a popular choice in this market, and is particularly significant because it is the benchmark for federal subsidies provided to low- and middle-income enrollees. It therefore helps determine how much these subsidies cost the government.

Actual ACA Benchmark Premiums in 2016 vs. CBO Projections

Bigger rate hikes coming in 2017 raise the question of how premiums compare to what was expected when the ACA was considered by Congress. At the time, the Congressional Budget Office (CBO) projected that the law would modestly reduce the budget deficit over a ten-year period, taking into account new expenses, new taxes, and savings in existing government health programs. How actual marketplace premiums compare to what CBO expected in doing those budget projections is an important factor in determining whether the ACA continues to be on track to reducing the deficit.

In late 2009, as the debate over the ACA began before the U.S. Senate, CBO (along with the Joint Committee on Taxation) released an analysis of how premiums in the individual insurance market would change under the law. CBO projected that the average nationwide premium for a benchmark plan (i.e., the second-lowest-cost Silver plan) would be about $5,200 for single coverage in 2016 (the only year for which CBO provided projections).

We estimate that the actual average benchmark premium in the ACA marketplaces in 2016 is $4,583, or 12% below what CBO originally projected. Even if benchmark premiums rise by 9% in 2017, as suggested by our analysis of major metropolitan areas, they would on average remain below what CBO estimated in its projections of the cost of expanding coverage under the ACA.

There are a variety of factors that may explain why premiums are lower than projected, including the persistent slowdown in health cost growth and strong competition in the marketplaces in much of the country. Even in areas with a handful of plans, insurers face competitive pressure to offer low-cost options as the ACA’s market rules allow enrollees to more easily shop for coverage and the subsidy calculation adds financial incentive to do so. These incentives have led some insurers participating in the marketplaces to narrow their provider networks to enable lower premiums.

Lower-than-expected premiums are also the result of underpricing by many insurers, which led to them taking larger premium increases in 2016 and 2017. There are good reasons to believe that these bigger premium increases are a one-time market correction rather than a trend, as insurers are now able to make use of better data on the claims experience of their enrollees to adjust their premiums to the proper level and as the temporary reinsurance program sunsets. However, there is no guarantee that insurers currently losing money on marketplace business will be able to stem those losses with premium increases. Also, recent exits from the marketplaces and the individual insurance market by some insurers could diminish competition.

While subsidies cushion premium increases for the 82% of marketplace enrollees who receive them, consumers may have to switch plans to obtain the full extent of that protection. During open enrollment for 2016, 43% of returning enrollees switched plans. If that high degree of plan switching does not persist, though, premium increases could lead healthier enrollees – including those who are not eligible for subsidies – to drop coverage, in turn leading to the need for additional premium increases in coming years. Since insurance pools operate at the state level, experience could vary from state to state.

So far, however, the fact that premiums are coming in lower than expected when the ACA passed suggests some cause for optimism.

Methods

To estimate the average benchmark premium in 2016, we did the following:

  • Determined the premium for the second-lowest-cost Silver plan for a 40 year-old in each county nationwide using the QHP landscape dataset for the federal marketplace and in each rating area using rate filings or shopping tools for state-based marketplaces.
  • Calculated a national average benchmark premium for a 40 year-old weighted by core-based statistical area (CBSA) population.
  • Estimated the average benchmark premium across all ages using the standard factors for how premiums vary by age and the national distribution of marketplace plan selections by designated age categories (including the small number of enrollees under age 18). We assumed that enrollees were distributed equally within age categories. Six states do not use the standard age factors, but that should not materially affect the national average premium calculation.

The Office of the Assistant Secretary for Planning and Evaluation within U.S. Department of Health and Human Services reported that the average benchmark premium in 2016 for a 27 year-old in states participating in the federal marketplace is $240 per month. Our method produces a similar estimate for the average benchmark premium for a 27 year-old nationwide (including state-based marketplaces) at $245 per month. A recent blog post in Health Affairs by researchers at the Brookings Institution also examined how CBO’s premium estimates have been lowered since 2009.

JAMA Forum: The Partisan Divide on Health Care

Author: Larry Levitt
Published: Jul 27, 2016

In this post for The JAMA Forum, the Kaiser Family Foundation’s Larry Levitt outlines the health care platforms of the Republican and Democratic parties, noting their fundamentally different aims and differing ideas about, among other things, the Affordable Care Act and Medicare.

News Release

Kaiser Family Foundation Names Elisabeth “Libby” Rosenthal Editor-In-Chief of Kaiser Health News

Published: Jul 26, 2016

MENLO PARK, Calif., – Today Drew Altman, president and CEO of the Henry J. Kaiser Family Foundation (KFF), announced the appointment of longtime, highly regarded New York Times health journalist Elisabeth “Libby” Rosenthal M.D., as the new editor-in-chief of Kaiser Health News (KHN), the Kaiser Family Foundation’s nonprofit news service. KHN is a leading source for in-depth news on health care policy, providing explanatory and enterprise journalism and breaking news to the American people through a broad range of national and regional distribution partners and its website KHN.org. KHN is based in the Foundation’s Washington, D.C., facilities, and (like KFF overall which is based in Menlo Park, CA) is bicoastal, recently establishing a California Bureau. Rosenthal will start in early September.

“Throughout her career, Libby has been a leader in finding and reporting great health policy stories and explaining their impact on people,” said Drew Altman. “That focus on what health policy issues mean for people is the hallmark of our organization. She is the ideal leader as we expand KHN and deepen its work with more enterprise and investigatory reporting, and I am thrilled to make this appointment.”

An award-winning journalist and M.D., Rosenthal started at the Times as a health care reporter, but then took on a variety of postings, including European health and environment reporter and correspondent in the Beijing Bureau, where she produced groundbreaking coverage on issues including HIV, SARS and bird flu. She was named science editor in 2003, but instead took on an assignment covering the 2004 presidential campaign.

“I’m so excited to be joining KHN, which I’ve watched grow into one of the most respected news outlets for health care coverage over the last few years,” said Rosenthal. “At a time when nearly everyone agrees the American health care system is broken, smart path-breaking independent journalism is a must. With financial pressures forcing traditional media to shrink newsrooms, nonprofit news organizations like KHN can lead the way. I can’t wait to get started on KHN’s next phase:  delivering the news KHN readers already rely on, as well as expanding into new types of enterprise and investigative stories.”

Rosenthal’s coverage of health pricing issues in her 2013-2014 series, “Paying Till It Hurts,” set the bar for the way 21st century journalism can tackle complex health policy issues. It included 10 major installments and more than a dozen follow-up articles, videos, powerful photographs, and interactive graphics. It won prizes both for health reporting and its use of innovative use of new digital tools, and elicited comments from tens of thousands of readers.

Rosenthal succeeds John Fairhall who will be stepping down after nearly five years as editor-in-chief and taking on a part-time role in KHN’s new enterprise reporting group. “We owe John a great debt for his strong and smart stewardship of KHN during its formative period,” said KFF CEO Altman.

“Under John’s leadership, KHN has expanded its reporting capacity beyond the Capital Beltway through its partnerships with the nation’s leading national news organizations and more than a hundred other media partners who run KHN stories,” said KFF Vice President David Rousseau who oversees KHN and KFF’s other journalism initiatives. “Libby is the ideal person to continue this trajectory and to lead KHN’s growing team that includes many of the nation’s leading health policy journalists.” The staff has recently expanded to include a large California Bureau and is currently building a major enterprise team that will spur the next phase of KHN’s growth.

A graduate of Stanford University and Harvard Medical School, Rosenthal is currently finishing a book about the health care system that will be published in April 2017 by Penguin Random House. She will be based in the Kaiser Family Foundation’s offices in Washington, DC. Rosenthal will continue to write for the New York Times Sunday Review, and will help lead KHN’s ongoing geographic and enterprise reporting expansion.

What Do We Know about Cardiovascular Disease Spending and Outcomes in the United States?

Published: Jul 22, 2016

Although mortality rates for cardiovascular disease have fallen dramatically over the past three decades, heart disease remains the leading cause of death in the United States. This slideshow explores the prevalence, disease burden, disparities, outcomes, care, and costs of cardiovascular disease in the United States.

The slideshow is part of the Peterson-Kaiser Health System Tracker, an online information hub dedicated to monitoring and assessing the performance of the U.S. health system. More information about the analysis related to the slideshow is available through the tracker.


Financing the Response to HIV in Low- and Middle-Income Countries: International Assistance from Donor Governments in 2015

Authors: Jennifer Kates, Adam Wexler, and Eric Lief
Published: Jul 20, 2016

Executive Summary

In advance of the 21st International AIDS Conference (IAC), to be held in Durban, South Africa July 18-22, this report provides the latest data on donor government funding to address the HIV epidemic in low- and middle-income countries. It is part of a more than decade-long partnership between the Joint United Nations Programme on HIV/AIDS (UNAIDS) and the Kaiser Family Foundation (Kaiser) to track donor government funding on HIV, assessing both bilateral disbursements and multilateral contributions. The current report provides data for 2015, at the close of the Millennium Development Goals (MDG) era. It finds that funding from donor governments decreased in 2015, by more than US$1 billion, compared to 2014, with declines by 13 of 14 governments assessed. While some of this decrease is due to issues of timing and exchange rate fluctuations, including the significant appreciation of the U.S. dollar, overall spending in 2015 declined even after accounting for these factors. As such, it marks the first decline in donor government funding to address HIV in 5 years.1 

Key Findings Include:

  • Overall spending for HIV went down in 2015. Donor government spending to address HIV in low and middle-income countries declined by more than $1 billion (US$7.53 billion in 2015 compared to US$8.62 billion in 2014), a 13% decline (see Figure 1). Spending declined for 13 of 14 donor governments assessed in the analysis, and declined even after adjusting for inflation (see Figure 2).2 
  • The decline is due to a complex set of factors. These include the significant appreciation of the U.S. dollar, resulting in the depreciation of most other donor currencies. However, even in their currencies of origin, funding declined for 11 of 14 governments. Other factors include a delay in disbursements by the U.S. government and the front-loading of pledged contributions to the Global Fund to Fight AIDS, Tuberculosis and Malaria by some donors.  Still, even after accounting for these factors, funding went down in 2015.
  • Bilateral spending declined for all 14 governments. Bilateral spending declined by US$715 million, or 11%, between 2014 and 2015, declining for all 14 governments assessed (and 12 of 14 in currencies of origin). Funding from the U.S. government declined by US$411 million, accounting for 57% of the bilateral spending decline, but this was largely an issue of timing, as the U.S. implements new and expands existing programs and reallocates funding from several over-budgeted countries. Without counting the reduction in U.S. bilateral spending, most of which is expected to be disbursed in 2016, total funding (bilateral and multilateral) from donors declined by 8 percent.
  • Multilateral contributions were down for 12 of 14 governments. Contributions to the Global Fund were down by $305 million (after adjusting for an HIV share), declining for 11 of 14 governments assessed (and 8 in currencies of origin). Some of this decline was due to unique factors, including a subset of donors who front-loaded their contributions to the Global Fund in 2014 as part of a three-year, 2014-2016 pledge made during the Global Fund’s last replenishment period, and to the U.S. government’s pledge to match investments in the Global Fund by $1 for every $2 raised, resulting in a decline in 2015. Donor government contributions to UNITAID were also down.
  • Most HIV funding is bilateral. In 2015, three quarters of HIV funding (74%) was provided bilaterally, primarily driven by the size of U.S. bilateral disbursements. Seven donors provided most of their funding through bilateral channels — Australia, Denmark, Ireland, the Netherlands, Norway, the United Kingdom and the United States.  Seven donors — Canada, France, Germany, Italy, Japan, Sweden, and the European Commission — provide most of their HIV funding through the Global Fund.
  • The U.S. remains the largest donor to HIV. In 2015, the U.S. accounted for two-thirds (66.4%) of donor government disbursements for HIV. The U.K. was the second largest donor (13.0%) followed by France (3.5%), Germany (2.7%), and the Netherlands (2.3%).
  • In 2015, several donor governments provided a greater share of funding to HIV than their share of the world’s GDP. This includes the U.S., the U.K., Norway, and Denmark. However, when standardized by the size of their economies (GDP per US$1 million), Denmark ranks first followed by the U.K., the U.S., Norway, and the Netherlands.

  1. This analysis counts donor government contributions to multilateral organizations as part of donor government disbursements (in addition to their bilateral disbursements to countries).  But donor contributions to multilateral organizations are not necessarily disbursed to countries in the same year.  A separate analysis by UNAIDS (UNAIDS: PREVENTION GAP REPORT, Geneva, 2016.), which assesses funding disbursed to countries (including multilateral disbursements), finds that such funding fell for the second year in a row.  This is due to the fact that in 2014, the Global Fund showed a one-time decrease in disbursements to countries, attributable to the roll out of a new funding model and in 2015, funding fell due to decreases in bilateral disbursements by donor governments. ↩︎
  2. See, World Development Indicator database, http://data.worldbank.org/indicator/FP.CPI.TOTL.ZG. Inflation in 2015 in high-income countries was 0.3%. ↩︎