Linking Medicaid and Supportive Housing: Opportunities and On-the-Ground Examples

Authors: Julia Paradise and Donna Cohen Ross
Published: Jan 27, 2017

Introduction

Research suggests that a broad range of social factors affect individual and population health. Indeed, acknowledging the role of social factors in determining health, the U.S. Department of Health and Human Services’ Healthy People 2020 report included as one its four overarching goals for the 2010-2020 decade: “Create social and physical environments that promote good health for all.”1  Housing has been identified as one such social determinant of health, as individuals experiencing homelessness or unstable housing situations face significant challenges in obtaining care and managing chronic conditions, and lack of housing and poor housing conditions can themselves adversely affect health. There is growing evidence that supportive housing can contribute to improved health outcomes for individuals experiencing homelessness or at risk of homelessness.2  Supportive housing can also promote the goal of community integration of individuals with disabilities and elders who need long-term services and supports (LTSS).

Low income, poor health, and unstable housing are often intertwined. For that reason, opportunities to deploy supportive housing resources and Medicaid strategically to improve outcomes for individuals receiving services in both sectors are of policy interest. Federal law prohibits federal matching of state Medicaid spending for room and board (except for nursing facility services, which are a covered Medicaid benefit). However, Medicaid can cover and finance a wide range of housing-related services and activities for individuals enrolled in Medicaid. The Affordable Care Act (ACA)’s expansion of Medicaid to millions of uninsured adults with income up to 138 percent of the federal poverty level (FPL), including many with supportive housing needs, increased the potential impact of Medicaid-housing collaborations.

This issue brief outlines ways in which Medicaid can support integrated strategies and, based on telephone interviews with key informants, profiles three current initiatives that illustrate distinctly different approaches to linking Medicaid and supportive housing. The three initiatives include one launched by a city (Philadelphia), one by a state (Louisiana), and one by a Medicaid MCO (Mercy Maricopa Integrated Care in Phoenix, Arizona). They target special populations including homeless individuals, people with a wide range of disabilities, and adults with mental health and/or substance use problems.


Issue Brief

Setting the context

Research shows an association between supportive housing and improvements in residents’ health outcomes and costs.

Homelessness is a strong predictor of poor health outcomes.3  Homelessness and housing instability are also predictors of higher health care costs, due largely to high rates of potentially avoidable hospital admissions.4  Research on supportive housing suggests that it can have a positive impact on the health of formerly homeless individuals,5  many of whom are covered or could be covered by Medicaid. The findings from evaluations of various supportive housing programs across the country include improved health status, better mental health outcomes, and reduced substance use among those who gain housing. For example, two studies of housing programs serving individuals living with HIV/AIDS showed significantly higher survival rates among those who obtained supportive housing than among individuals in a control group who did not.6  Other research has shown reduced emergency department (ED) use and inpatient hospital admissions, as well as reduced Medicaid costs, associated with supportive housing.7  While these studies have generally been small in scale, they indicate that stable housing and housing-related services and supports for Medicaid beneficiaries may help to advance the “Triple Aim” of improving patient care and population health and lowering per capita health care costs.

Medicaid and supportive housing programs can be effective partners.

Although Medicaid and supportive housing programs serve many of the same people, they have historically operated in separate “silos,” with little if any interaction at the federal, state, or local levels. Medicaid and housing programs each have complex rules and structures and their institutional cultures differ. The federal government and states jointly finance Medicaid, and subject to federal minimum standards, states design and operate their own programs. As a result, Medicaid benefits, delivery and payment systems, and other aspects of program design vary widely by state. On the housing side, federal dollars often flow through local governments and public housing agencies to housing providers, adding to the complexity that Medicaid-Housing collaborations may face. Partnerships require the two sectors to gain understanding of each other’s operations and develop new relationships and systems to support coordination.

Besides providing housing for low-income and special needs populations, supportive housing programs provide housing-related services and activities. These include assistance with securing housing and transition support services for individuals being discharged from institutional settings to the community, and health-related services, such as helping residents obtain and maintain Medicaid coverage, coordinating their care, and providing health education and wellness programs. Staff who provide these services are typically onsite and know their residents, so they are well-positioned to participate in residents’ care management.

Historically, housing programs have financed the housing- and health-related services they provide with a combination of rental income and private foundation grants, or with funding provided by the federal Department of Housing and Urban Development (HUD) for this purpose. However, state Medicaid programs also have substantial flexibility to cover certain housing-related services and activities for Medicaid enrollees. Because many residents of supportive housing are covered or could be covered by Medicaid, Medicaid and housing programs can be effective partners. Further, in states that have implemented the ACA Medicaid expansion, millions of previously uninsured low-income adults, including homeless adults and others able to live in the community with appropriate supports, now have Medicaid coverage. Thus, the case for and potential benefits of coordination between Medicaid and supportive housing programs merit increased consideration.

Medicaid-housing linkages may help optimize resources and advance community integration.

In cross-sector initiatives that integrate Medicaid and housing, the whole that results may be greater than the sum of the parts. Providing Medicaid coverage and payment for health- and housing-related services otherwise financed with housing dollars can augment housing programs’ capacity to address housing needs; in addition, state Medicaid spending for these services and activities increases the funds available for assistance for supportive housing clients and residents. Integration of Medicaid and housing may also foster the mutually reinforcing positive effects of safe, stable housing and access to health care for the vulnerable populations who need both. Examples of such effects may include improved medication adherence, reductions in avoidable emergency department use and hospital admissions, housing retention, and increased household income. Medicaid-housing collaborations may also advance community integration of seniors and people with disabilities who need long-term services and supports (LTSS). As “whole person” delivery models that seek to knit together physical and behavioral health care, acute and long-term care, institutional and community-based services, and social supports gain more traction in Medicaid, and as Medicaid and housing programs gain experience interacting with each other and assess the impact of their joint initiatives, interest in coordinated efforts is growing.

On June 26, 2015, the Centers for Medicare and Medicaid Services (CMS) issued an Informational Bulletin to “assist states in designing Medicaid benefits, and to clarify the circumstances under which Medicaid reimburses for certain housing-related activities, with the goal of promoting community integration for individuals with disabilities, older adults needing long-term services and supports, and those experiencing chronic homelessness.”8  Beyond providing concrete guidance about what state Medicaid programs can pay for and how, the Informational Bulletin was significant because it recognized the importance of addressing housing needs to meet Medicaid programmatic goals. The Informational Bulletin outlines three types of housing-related activities and services that Medicaid can cover, as summarized below. Many of the Medicaid-reimbursable services are ones typically provided by housing organizations for residents.

  • Individual housing transition services help individuals transition from institutions to community-based housing. These services include, among others, tenant screening and housing assessments that identify enrollees’ preferences and barriers to successful tenancy; development of a housing support plan; assistance with the housing application and search process; assistance with one-time move-in expenses, such as security deposit; arranging for details of the move; and development of a crisis plan that includes prevention and early intervention services when housing is jeopardized.
  • Individual housing and tenancy sustaining services help individuals maintain tenancy after housing is secured. Tenancy support services include education and training on tenants’ and landlords’ role, rights, and responsibilities; assistance in resolving disputes with landlords and neighbors to reduce the risk of eviction; assistance with housing recertification; and others.
  • State-level housing services are “strategic, collaborative” activities to assist in identifying and securing housing resources. Among the activities for which Medicaid financing is available are development of agreements with local housing and community development agencies to facilitate access to housing resources, and participation in these agencies’ planning processes.

The Informational Bulletin also discusses the Medicaid options and waiver authorities that states can use to cover housing-related services and activities. The mechanisms available to states include:  home and community-based services under section 1915(c) waivers or the Medicaid state plan; targeted case management services; managed care under section 1915(b) waivers, the optional Community First Choice benefit and Money Follows the Person demonstration established by the ACA; and section 1115 demonstration waivers. A summary of these opportunities is provided in the Appendix to this brief.

Other Medicaid mechanisms for linking with supportive housing

In addition to the state plan and waiver authorities that states can use to integrate Medicaid and supportive housing, a variety of delivery system and payment models also offer opportunities and, in some cases, incentives, to build such linkages. Growing evidence on the connections between social and health disadvantages; the focus on the “Triple Aim” of improving the patient care experience and population health while reducing the per capita cost of health care; and the ACA’s large investment in innovative and accountable health care delivery have all enhanced the environment for more integrated approaches to providing care for Medicaid beneficiaries. The following mechanisms are particularly relevant in this regard.

Managed care plan initiatives

Most state Medicaid programs rely heavily on risk-based managed care organizations (MCOs) to serve Medicaid enrollees. Many states are expanding their managed care programs beyond children and parents to include beneficiaries with more complex needs, including individuals with behavioral health conditions, seniors, and persons with physical disabilities; a growing number of states are also providing long-term services and supports through managed care. Medicaid managed care plans, which are paid on a capitation basis by states, have both incentives and some flexibility to invest in measures to improve care and reduce costs. MCOs may use their capitated funding to pay for care management and housing-related services and activities to the extent they are covered under the Medicaid state plan. Some states may permit plans to use part of their savings for “reinvestment strategies” that may cover some of the costs of innovative models if they can achieve offsetting savings. MCOs may invest some of their own profits in services and activities not specifically defined as Medicaid benefits, but they must generally get state approval to use their capitated funding this way.9  Plans can also take the initiative to partner with housing agencies or organizations, foundation programs, or other entities to support integration of health services and housing-related activities for their Medicaid members.

Health homes

The ACA established a new Medicaid state plan option for “health homes” for Medicaid beneficiaries with multiple chronic conditions or a serious mental illness. Health homes integrate physical and behavioral health (both mental health and substance abuse) services and long-term services and supports for high-need, high-cost Medicaid populations. Health homes operate under a “whole person” philosophy that involves not just better coordinating care for an individual’s physical conditions, but also linking the person to needed long-term services and supports in the community, social services, and family services. The model is designed to improve health care quality and reduce costs.10  States that implement the health home option receive a 90-percent federal match for eight quarters for health home services provided by state-designated health homes to their enrolled beneficiaries. Services eligible for the enhanced match include, among others, comprehensive transitional care and referral to community and support services.

State Innovation Models

Through the State Innovation Models (SIM) initiative, the CMS Innovation Center has awarded close to $1 billion in grants to over half the states to design, test, and evaluate multi-payer delivery system and payment reforms designed to improve health system performance, increase the quality of care, and reduce costs for Medicaid, CHIP, and Medicare beneficiaries and all residents of the state. In general, the cornerstone of the state innovation models is comprehensive, patient-centered primary care, and the models envision more highly integrated systems of care and payment tied to value. Notably, most SIM states, in devising new models of care and care linkages, have explicitly addressed social determinants of health. All 11 states most recently awarded model testing grants link or plan to link primary care and community-based organizations and social services. Most SIM states also incorporate accountable care organizations, described next.

Accountable care organizations

A number of states are reorganizing part or all of their Medicaid delivery system into accountable care organizations (ACOs) – provider-led, integrated care delivery systems that are financially accountable and responsible for the care, health care quality, outcomes, and costs of a defined beneficiary population. In some states, the providers in an ACO share in Medicaid savings achieved by the ACO; in other states, ACOs operate on the basis of a global budget. ACOs, like MCOs, have incentives and flexibility to work with housing organizations if they determine that providing supportive housing and/or housing-related services would promote their health outcome and cost goals. To illustrate, Oregon’s 1115 waiver permits the state’s coordinated care organizations, in which most Medicaid beneficiaries are enrolled, to use Medicaid dollars for non-medical “flexible services” for Medicaid enrollees that can result in better health at lower costs, including housing supports such as critical repairs, ramps, and move-in expenses.

Models of integration: Three case examples

City of Philadelphia: Combining Housing and Health Care Resources to Reduce Chronic Homelessness

Background

A “recovery-oriented system of care” is central to the City of Philadelphia’s effort to end chronic homelessness. This approach involves providing the clinical care that individuals need to address their mental health or substance use challenges, and also ensuring that they have the social and other supports they need to participate in school or work and be part of their communities. Integrating physical and behavioral health care is also key to the model. The success of Philadelphia’s approach depends, in significant measure, on the availability of Medicaid-covered services and payment.

Medicaid’s role

A key feature of the relationship between Pennsylvania’s Medicaid agency and the counties in the state has been instrumental to Philadelphia’s progress in reducing homelessness. Specifically, while the Medicaid agency contracts with managed care plans to provide physical health services for Medicaid beneficiaries, the state gives counties the opportunity to manage behavioral health services for its residents. The City of Philadelphia, which is also a county, established a single-payer system for public behavioral health care in its jurisdiction. The City’s Department of Behavioral Health and Intellectual DisAbility Services (DBHIDS) receives capitation payments totaling about $800 million from the Medicaid agency and is at full financial risk for the administration of the Medicaid behavioral health benefit for approximately 600,000 Medicaid enrollees.

The vast majority of people served by DBHIDS – roughly 85 percent – are Medicaid-eligible. The City of Philadelphia also receives state and federal block grant funds to cover people who are not eligible for Medicaid and services that are not covered by Medicaid. The City is able to tailor behavioral health services to meet individual needs and manages these multiple funding streams behind the scenes. Through implementation of evidence-based practices, early intervention, and an emphasis on long-term recovery, DBHIDS has been able to achieve Medicaid savings and reinvest them in system improvements, including an initiative to house individuals experiencing homelessness, as described below.

Pathways to reducing homelessness

A core component of Philadelphia’s strategy to end homelessness is its Permanent Supportive Housing (PSH) initiative, which involves DBHIDS and the City’s Office of Homeless Services. Importantly, most individuals housed under the PSH initiative are eligible for Medicaid coverage, which provides a source of payment for the health services they receive. There are three different pathways to housing:

  • Housing First serves more than 500 individuals facing chronic homelessness and severe psychiatric and/or substance use disorders. The premise of the Housing First model is that people need to be stably housed to benefit optimally from other services and supports; thus, participants do not have to comply with conditions like agreeing to psychiatric treatment before they move in. Once individuals are housed, the City provides them with clinical care, targeted case management, mobile psychiatric services, peer-to-peer services, and other services. Medicaid pays for these services for residents who are Medicaid beneficiaries.
  • Journey of Hope is a residential substance use disorder treatment program for people with a history of chronic homelessness and long-term serious addiction. It was launched in 2007 after the City’s Homeless Death Review found that drug intoxication/alcoholism was the leading cause of death among people experiencing homelessness. By 2014, Journey of Hope had helped 443 persons achieve a variety of desirable outcomes, such as reuniting with family, obtaining treatment for other health or mental health problems, and moving into PSH.
  • Safe Haven is a City program that brings people indoors during inclement weather and uses the opportunity to engage them in treating their substance use problems and move them to PSH quickly. Nearly 220 people have moved into PSH through this program.
Results

Data on Philadelphia’s PSH initiative show that, of the roughly 1,200 chronically homeless participants brought into PSH over the last eight years, 89 percent remain in stable housing and are not using crisis services. DBHIDS’ costs rose initially when the programs got underway because the use of behavioral health services increased among the individuals served. However, costs dropped substantially after people were housed. For example, the City’s behavioral health costs were $85 per day per person for individuals in the Safe Haven program two years prior to their entry into the program. These costs rose to $112 during the engagement period, then fell to $18 once the person was housed. Similar cost-saving patterns were seen in the other two programs.

Lessons learned

DBHIDS officials identified lessons from their experience that may be relevant to planning for other Medicaid-housing partnerships. Most importantly, a clinical framework based on pursuing long-term recovery is key for persons with addiction disorders. Dr. Arthur Evans, DBHIDS Commissioner, observed that addressing housing and other social determinants of health has helped to achieve annual savings averaging about $15 million in the behavioral health care system. “If you factor in physical health outcomes, such as improvements in the management of chronic conditions like diabetes, hypertension, asthma and others,” he said, “the savings can be even more robust.” In addition, health care financing strategies are essential to operate the range of services needed; intentionally capturing Medicaid payment for services provided to eligible individuals in PSH is both appropriate and feasible, and can enable resources available for housing to go further.

Louisiana: As Part Of Disaster Recovery, Health And Housing Agencies Partner To Launch Permanent Supportive Housing

Background

In the wake of Hurricanes Katrina and Rita in 2005, disaster recovery resources poured into Louisiana to support community rebuilding. Recognizing the significant overlap between the population experiencing homelessness and individuals with disabilities, a broad coalition of advocates came together to push for the creation of a supportive housing program. The Louisiana Department of Health and the Louisiana Housing Authority (LHA) formed a partnership to help secure a portion of the increased resources to establish a Permanent Supportive Housing (PSH) program with the dual policy goals of preventing and reducing both homelessness and unnecessary institutionalization among people with disabilities

Permanent Supportive Housing

Planning for the PSH program began in 2005, with the goal of building 3,000 housing units. Federal Low-Income Housing Tax Credits (LIHTC) and disaster recovery funding under the Community Development Block Grant (CDBG) were used to finance the housing. The tax credit program, which continues to finance the production of housing units, offers housing developers incentives to set aside five percent to 25 percent of their units for PSH, but additional rental subsidies were needed to make the units affordable for the very low-income target population. In 2008, the first year that housing units were occupied, Congress allocated additional rental subsidy vouchers that limited out-of-pocket rental costs to 30 percent of household income. Occupation of the new units accelerated in 2010 – the LIHTC projects awarded after Katrina took some years to build – and, thanks to additional rental subsidies, the state is now on track to house 3,545 households.

Louisiana’s program has some distinctive features. First, the Louisiana Housing Authority (LHA), a unique state-level housing authority, operates within the Louisiana Housing Corporation. The Corporation administers the LIHTC program and works with LHA to identify and recruit PSH providers, and the LHA administers the rental subsidies. The centralization of these activities at the state level allows Louisiana to implement a statewide program without having to seek rental subsidies from multiple local housing authorities, streamlining the process of setting up PSH units.

Medicaid’s role

From the outset, the state realized that the CDBG funds authorized for disaster recovery were limited and that the PSH program had to be designed so that Medicaid funding could help sustain it over the long term. Louisiana accomplished this by using Medicaid state plan authority to cover tenancy support services. This action had a large impact because, since the PSH program targets very low-income individuals with disabilities, the vast majority of those in housing or receiving “pre-tenancy supports” (described below) were Medicaid beneficiaries, even prior to the state’s implementation of the ACA Medicaid expansion in June 2016. For the most part, PSH participants are single adults who typically have high needs and high service use. The program also serves families, and a household may be eligible for PSH based on having a child with a disability. Seventy percent of PSH tenants have more than one disability; 40 percent have three or more disabling conditions.

In addition to supporting services for the majority of PSH participants, Medicaid payments also contribute to achieving the state’s goals for promoting housing stability and averting unnecessary institutionalization of people with disabilities. Individuals transitioning from institutions to the community under Louisiana’s Money Follows the Person grant receive preference points for PSH.

Louisiana’s Medicaid program covers three phases of tenancy support services for Medicaid beneficiaries in PSH, as follows (Louisiana uses funds from other sources, including Ryan White, the Veterans Administration, and CDBG, to provide services for PSH tenants who do not qualify for Medicaid):

One tenancy supports provider, Crescent Care, is also a federally qualified health center. In addition to providing coaching and other assistance with maintaining a home, CrescentCare also helps participants connect with primary care, OBGYN, and dental services. “This is a big draw,” according to Bethney Whittington, PSH Supervisor. CrescentCare also helps sign children up for Medicaid and LACHIP, Louisiana’s Children’s Health Insurance Program. Whittington reflected on how the program has changed over time. “There was a time when people just couldn’t maintain their vouchers, but now they learn coping skills and get other supports,” she said. “Now, housing is sustainable and our patients’ recovery is sustainable.”

  • Pre-tenancy services include assistance completing the housing application and understanding tenant rights and responsibilities, beneficiary engagement and planning for housing support needs, and assistance conducting the housing search and choosing a unit.
  • Move-in services include arranging the actual move, ensuring the unit and individual are ready for move-in, and helping beneficiaries adjust to the new home and neighborhood.
  • Ongoing tenancy services include supporting the beneficiary in achieving sustained, successful tenancy and personal satisfaction, and identifying the type, intensity, frequency, and duration of ongoing services, based on the beneficiary’s needs and preferences.

Louisiana provides these services under its section 1915(c) home and community-based services (HCBS) waivers for persons with disabilities and the mental health rehabilitation (MHR) benefit in the Medicaid state plan. Under the 1915(c) waivers, DHH defines “tenancy supports” as a distinct covered service, rather than a component of case management services. According to Robin Wagner, Deputy Assistant Secretary of DHH’s Office of Aging and Adult Services, this is because providing tenancy support services requires a special set of skills and activities, such as negotiating reasonable accommodations for people with disabilities and working with tenants and landlords when crises that threaten continued tenancy arise, that are outside what most care managers are prepared to do.

Louisiana made some strategic decisions with respect to providing Medicaid reimbursement for tenancy supports, especially for activities that do not involve face-to-face interaction with the Medicaid beneficiary. The state determined that covering these so-called “collateral contacts” was essential because tenancy support providers often spend considerable time working with others on the beneficiary’s behalf. Louisiana included these activities in its definition of tenancy supports under its section 1915(c) waivers. Tenancy support services also have their own billing codes under the waivers and PSH providers are reimbursed for time spent on collateral contacts as well as time spent working directly with tenants. Louisiana covers tenancy supports as part of its MHR benefit, too, but they are not defined as a distinct service, and MHR rules do not permit providers to bill for time not spent face-to-face with clients. PSH providers operating within the MHR program are instead allowed to use a billing modifier that pays a slightly higher “complex care” rate for work with beneficiaries in PSH.

Louisiana established criteria that organizations must meet to become PSH tenancy support providers. They must be accredited to provide MHR services, enroll as providers in the state’s 1915(c) waivers, and contract with the state’s Medicaid MCOs. Providers also receive rigorous training related to tenancy support services before being approved to enroll and contract as PSH providers. Currently, 14 organizations provide tenancy support services in the state, and two more are seeking to become providers.

Results

Louisiana reports a 94 percent housing retention rate among the households that have entered the PSH program since it began housing tenants in 2008. “Retention” is defined as remaining in a PSH unit or moving on to another stable housing situation. A preliminary analysis by the Louisiana Department of Health shows statistically significant reductions in hospitalizations and emergency department utilization after the PSH intervention. And, an early independent analysis of the PSH program’s impact on Medicaid spending, based on 2011-2012 data, found a 24 percent reduction in Medicaid acute care costs after a person was housed. The state also tracks the impact of PSH on household income, as tenants often receive assistance with finding employment or pursuing Social Security Disability benefits. In a study of PSH households in the New Orleans region, where the program is most mature, nearly 55 percent of households reported an increase in income following entry into the program.

Lessons learned

Louisiana officials consider having the “right” the number of PSH providers a key factor in running a high-quality program. Wagner explained, “The nature of the work and the population requires a focused and committed effort on the part of the provider, so each provider needs a sufficient pool of PSH clients to make that effort worthwhile.” Louisiana does not limit the number of providers, but rigorous criteria for participation have kept the number at the right level to assure model fidelity.

The state found it helpful to employ, in addition to program management staff, personnel who work directly with clients as Tenancy Services Managers (TSM). TSMs are available to work with tenants who temporarily lose Medicaid, and they also can trouble-shoot and assist providers with the most difficult-to-serve clients.  Because Louisiana’s is a “housing first” program, in which tenancy is not contingent on continuing or cooperating with services, TSMs also work to re-engage program participants who refuse services.  TSM positions are funded using CDBG.

Mercy Maricopa Integrated Care: A Medicaid Health Plan-Initiated Supportive Housing Program

Background

Mercy Maricopa Integrated Care (Mercy Maricopa) is a nonprofit health care plan in Phoenix, Arizona, that manages behavioral health care for Medicaid-eligible adults and children, and some non-Medicaid members; Medicaid beneficiaries make up a large majority of the plan’s total enrollment. For adult Medicaid beneficiaries with serious mental illness (SMI), the plan provides integrated physical and behavioral health care. Adults who are Medicaid-eligible and are not seriously mentally ill receive mental health and substance abuse services from Mercy Maricopa and choose from several other plans for their physical health services.

Mercy Maricopa has long had a supportive housing program for its adult members with SMI, who make up 5 to 10 percent of the total adult membership. More recently, in 2014, a community crisis – the closure of the Men’s Overflow Shelter in Phoenix – put the health plan at the center of an effort to assist hundreds of additional adults experiencing homelessness. Responding to the crisis, Mercy Maricopa advanced the idea that, in addition to adults with SMI, adults with less serious mental health and substance use problems, who comprise about 40 percent of the plan’s total enrollment, also need supportive housing. “We wanted to be part of the solution,” recalled Tad Gary, the plan’s Chief Clinical Officer. “There’s a spectrum of assistance and not everyone needs all the intensive services. The key is to ‘right-size’ the interventions.” A partnership that Mercy Maricopa forged with the City of Phoenix Housing Department and Valley of the Sun United Way led to the creation of a program that now serves 275 individuals.

Housing programs

For its members with SMI, Mercy Maricopa provides permanent supportive housing services in a total of 3,400 housing units, including 907 subsidies for “scattered site” units funded by the state and 1,800 subsidies funded by federal McKinney Vento Homeless Assistance Grants through a partnership with a Housing and Urban Development (HUD) funded agency. Another 707 site-based units are subsidized by the state to provide housing in small apartment complexes and shared housing throughout Maricopa County. Eligibility is based, in part, on an individual’s diagnosis of a SMI, homeless status, and defined vulnerability.

The Comprehensive Community Health Program (CCHP) is the new program Mercy Maricopa established for adult plan members with mental health and substance use problems that do not meet the SMI threshold. CCHP is an integrated health home that addresses the housing needs of members by providing supportive services to assist them in obtaining and maintaining the housing of their choice through the Section 8 housing program. CCHP is built upon contributions from three partners: The City of Phoenix Housing Department contributes 275 federally funded Section 8 housing vouchers; United Way funds items and services, such as move-in kits, repair costs, and furniture; and Mercy Maricopa Integrated Care provides Medicaid-covered permanent supportive housing-related services and supportive employment services.

Medicaid’s role

By bringing Medicaid to the table, Mercy Maricopa was not only able to provide supportive housing-related services, but also helped the larger effort by fulfilling the “HUD service match.” That is, the value of Medicaid-covered housing-related services provided by Mercy Maricopa to support Medicaid members with mental health and substance disorders in their homes serves as the match required for HUD housing vouchers; in addition, some state-only Medicaid funds are used to acquire and/or subsidize housing for these individuals. In combination, these resources allow Medicaid members to receive individualized services in the community of their choice, ensuring that HUD funds are focused on expanding housing opportunities.

Mercy Maricopa provides a wide array of Medicaid-covered housing-related services through its housing programs, including housing navigation services and case management, that enrich the assistance available to individuals with different levels of need and in different types of housing arrangements. Covered services range from assistance with communication skills, financial management, budgeting, and securing benefits, to help developing meal preparation skills and public transportation skills, new tenant orientation and tenant’s rights education (in conjunction with the Housing Provider), supportive counseling targeted toward housing permanency, and recreational/socialization opportunities and health and wellness activities.

Mercy Maricopa is pursuing additional partnerships with local housing authorities and is collaborating with Low-Income Housing Tax Credit developers. Its efforts to strengthen collaboration and data-sharing with community housing and homeless service providers are ongoing.

Results

While no outcome data are yet available for CCHP, preliminary findings from Mercy Maricopa’s permanent supportive housing program for individuals with SMI show that admissions to psychiatric hospitals decreased by almost half (46 percent) between November 2014 and October 2015, and utilization of crisis services declined by one-third over the same period. In addition, during the same time period, housing retention increased by 3 percent and the number of members contributing to their rent increased by 4.2 percent.

Lessons learned

  • Partnerships among strangers. Mercy Maricopa staff found that navigating and bridging the Medicaid and housing worlds can be challenging, but it can be done. When Mercy Maricopa first approached the City of Phoenix Housing Department, the notion of a partnership with Medicaid was foreign. For the joint project to work, developing relationships with city, state, and federal housing programs was an essential first step. Health and housing partners had to learn each other’s unfamiliar “language” and understand how the program and policy frameworks and financing structures of Medicaid and housing programs differ. Appropriate roles had to be identified. CCHP partners had to find compatible approaches to providing member education and other services to CCHP-eligible individuals residing in permanent supportive housing.
  • Data challenges. Data collection and sharing necessary for the design and effective implementation of services posed important challenges. While Mercy Maricopa had the Medicaid ID numbers and electronic

health records of its members, matching data to the HUD Homeless Management Information System proved challenging because that system collected different information. Further, HIPAA requirements prevent Mercy Maricopa from sharing health data with some of the housing service providers. Fortunately, the shuttered overflow shelter had the ability to generate and share data with Mercy Maricopa, which used the information to determine the needs of the population the shelter had been serving. These data helped Mercy Maricopa recognize that people with mental health and substance use disorders who are not classified as SMI need supportive housing services. In addition, a tool used in the housing community, called the Vulnerability Index – Services Prioritization Decision Assistance Tool, or VI-SPDAT, provided the health plan with an at-a-glance assessment of self-reported vulnerabilities, which includes hospitalizations, particular health conditions, and other issues, helping the plan ascertain which types of support individuals need most to avoid housing instability.

Discussion

The three initiatives profiled here –one launched by a city, one by a state, and one by a Medicaid MCO – provide examples of the collaborations possible between Medicaid and supportive housing programs that serve many of the same people. Looking at the implementation experience across the initiatives, a number of themes emerge.

Medicaid-housing integration efforts can be tailored to align with specific policy goals. The three integration efforts profiled in this brief were designed to advance their particular policy goals – to reduce chronic homelessness, reduce unnecessary institutionalization of people with disabilities, and provide appropriate supportive housing services for individuals with different degrees of mental illness. Strategies elsewhere have been designed to further other policy priorities, such as successful re-integration of justice-involved individuals into the community.

Partnerships entail operational challenges. Initiatives aimed at integrating Medicaid and housing face a number of challenges: fragmentation in the housing system, a complex health care system, differences in the Medicaid and housing administrative structures, and multiple funding streams with different rules. Medicaid programs may have to contract with multiple housing agencies and providers. Housing programs do not typically have a way to bill for health services, as is necessary to obtain Medicaid fee-for-service payment, and the cost and effort of developing the new systems may be significant. In addition, Medicaid may require credentialing of housing providers as a condition of enrollment in and payment by the program. Housing programs may also have concerns about whether Medicaid requirements would constrain the way they operate. Data issues, too, including limited availability of person-level data from housing programs and HIPAA prohibitions against sharing health data, among others, can impede efforts to target interventions. And clearly defining the roles of housing and health partners while also allowing for blending can be a delicate balancing act.

Early evidence suggests that Medicaid and housing programs working in concert can improve patterns of health care use and reduce Medicaid costs. Data from the three initiatives examined in this study showed Medicaid savings or reduced utilization of high-cost institutional care, in addition to gains in housing stability, income, and/or other outcomes. Interviewees pointed out that Medicaid returns on investment are affected by how programs are designed; by definition, there is greater potential for Medicaid savings in initiatives targeted to high-risk populations with high costs. With regard to MCO-initiated partnerships, small scale is an issue in the return-on-investment calculus. Supportive housing residents are a small fraction of the Medicaid population and, in a local area, Medicaid enrollees who reside in supportive housing may be distributed across numerous MCOs. Therefore, the number of an MCO’s Medicaid enrollees who might benefit from the plan’s investment in housing-related services, and the associated savings potential, may be small in plans that are not Medicaid-focused.

Leadership and committed partnerships are essential. For many in the Medicaid and health care sphere, financing housing-related services as an investment in health is a new idea, and interviewees said that it was necessary to convince some in their institution’s leadership to pursue this path. Both the health and housing officials we interviewed emphasized that figuring out who to approach and finding committed partners were critical to the success of their efforts. Citing the lack of familiarity and history between Medicaid and housing programs, interviewees commented on the importance of developing relationships. Uniformly, they stressed that “translation” was needed to bridge cultural, language, and bureaucratic differences between the two “worlds” to facilitate conversation and understanding before collaboration could proceed.

Conclusion

The growing emphasis on integrated care models that address not only health but also the social determinants of health, including housing, is spurring widespread innovation in state Medicaid programs and the delivery systems they rely on. In addition, states continue to rebalance their Medicaid long-term care programs, shifting away from institutional care in favor of community integration of seniors and people with disabilities. At the same time, millions of previously uninsured adults have gained Medicaid coverage, including many experiencing chronic homelessness or housing instability and many with mental illness and/or substance use disorders. The expansion of Medicaid coverage has increased both interest in Medicaid-housing integration and the potential impact of collaborations on both housing and health outcomes. Data from the recent annual 50-state Medicaid budget survey conducted by the Kaiser Commission on Medicaid and the Uninsured show that, in addition to 44 states that operate Money Follows the Person programs, 16 states implemented or expanded housing-related services outlined in the CMS Informational Bulletin in FY 2016 and/or plan to do so in FY 2017.11  The sharpened focus in Medicaid on accountable systems of care that link payment to outcomes also augurs increasing activity in this area. The limited supply of affordable housing constrains the scale of Medicaid-housing initiatives, and the ability to expand these efforts will depend on increased availability of resources like LIHTC, housing vouchers, and other strategies to increase housing affordability.

Forging Medicaid-housing linkages will require new dialogues between agencies and programs with different administrative structures, financing systems, cultures, and operations, and with little previous interaction at the federal, state, or local level. Integrating Medicaid and supportive housing appears to have particular potential to improve health and housing outcomes and reduce avoidable costs for people with complex needs. Building the necessary bridges presents challenges, but partnerships on the ground today demonstrate that Medicaid and housing policy and program officials with shared purposes can devise strategies to meet them.

The authors wish to acknowledge Mike Nardone, formerly at HMA, for his significant contributions to this issue brief. They also wish to thank the interviewees and their staff, who made this project possible.


Appendix

The Centers for Medicare and Medicaid Services (CMS) issued an Informational Bulletin on June 26, 2015 that identifies and discusses the Medicaid options and waiver authorities that states can use to cover housing-related services and activities, and the extent of these authorities. The opportunities for states are summarized below, drawing directly from the CMS guidance. For more detailed information, readers should consult the Informational Bulletin directly.

Section 1915(c) home and community-based services waivers

Section 1915(c) home and community-based services (HCBS) waivers permit states to provide community-based LTSS for beneficiaries who meet an institutional level of care criterion. States can cover certain housing-related services under these Medicaid program waivers. Housing transition and tenancy sustaining services can be paid for as part of case management services under 1915(c) waivers. Environmental modifications to make community-based residential settings accessible can also be covered. In addition, the CMS guidance clarifies that, subject to specified criteria, states can receive federal Medicaid matching funds for the costs of certain Community Transition Services necessary for an individual leaving an institution to establish a basic household. These costs include, among others, security deposits required to obtain a lease, set-up fees for utilities, essential household furnishings, moving expenses, and services like pest eradication or preoccupancy cleaning necessary for the beneficiary’s health and safety. Federal matching funds are available for these costs only if they are reasonable and necessary and only if the individual cannot meet the expenses and the services cannot be obtained from other sources.

Section 1915(i) HCBS state plan optional benefit

States have a regular state plan option (i.e., no waiver is required) under section 1915(i) to cover the same kinds of housing transition and tenancy sustaining services, environmental modifications, and Community Transition Services that can be covered under section 1915(c) HCBS waivers. However, because beneficiaries do not have to meet an institutional level of care to receive services under 1915(i), states can use this option to serve adults with behavioral health conditions and others who cannot qualify for services under a 1915(c) waiver. The ACA amended section 1915(i) to expand financial eligibility for services under this option, allow states to target 1915(i) services to specific populations, and expand the array of services states can cover under this state plan option. States that use this option must provide services statewide and cannot limit the number of people served.

Section 1915(k) Community First Choice (CFC) state plan optional benefit

Under this optional benefit, states can reimburse for person-centered home and community-based attendant services and supports in a home or community-based setting. Transition costs for individuals transitioning from an institution to the community and expenditures that increase an individual’s independence or substitute for human assistance that would otherwise be necessary can be covered. These costs could also include security deposits for an apartment or utilities, bedding and basic kitchen supplies, first month’s rent, and other one-time transition-related expenses.

Targeted case management (TCM) services

State plan TCM services are services furnished to “assist individuals in gaining access to needed medical, social, educational, and other services.” TCM is a specific service that is targeted to specific populations defined by the state. The Informational Bulletin clarifies that, as part of identifying a beneficiary’s total needs, TCM can include linking the person to needed housing resources, assistance with housing search, and assistance with identifying resources to support the participant in maintaining housing during a housing crisis.

Section 1915(b) managed care waivers

Most states have section 1915(b) waivers that permit them to provide and pay for state plan-covered services, including housing-related services, through managed care programs. The authority at section 1915(b)(3) permits states to use savings achieved under its 1915(b) waiver to provide additional services to beneficiaries enrolled in its managed care program. These savings may be used for housing-related services for enrollees to identify, transition to, and sustain their housing. The Informational Bulletin addresses state authorities to cover housing-related services in their managed care programs.

Money follows the person (MFP) rebalancing demonstration

The MFP grant program provides states with enhanced federal Medicaid matching funds for 12 months for each Medicaid beneficiary who transitions from an institution to the community, and states can use MFP grant dollars for offer housing-related services to support transitions. Most of the 44 states with MFP programs are providing an array of housing-related services and activities, directly or through contracts with housing specialists, transition coordinators, case managers, and other providers. These services include state-level housing-related collaborative activities as well as individual housing transition services and tenancy sustaining services. Funding for MFP is set to expire in 2016, but any unused grant funds awarded in 2016 can be used through fiscal year 2020. Reauthorization of the program is uncertain.

Section 1115 demonstration waivers

Under section 1115 demonstration waivers, which must further the objectives of the Medicaid program and be approved by the Secretary of HHS, states are permitted additional flexibility in the design and operations of their Medicaid program. Section 1115 demonstrations can, and some do, include housing-related services described in the Informational Bulletin.12  Demonstration waivers are generally approved for a five-year period and can be renewed for three more years. Federal spending under section 1115 demonstrations must not exceed expected federal spending in the absence of the demonstration.

Endnotes

  1. Healthy People 2020 Topics and Objectives: Social Determinants of Health, Office of Disease Prevention and Health Promotion, https://www.healthypeople.gov/2020/topics-objectives/topic/social-determinants-of-health. Also, Healthy People 2020: An Opportunity to Address the Societal Determinants of Health in the United States, Secretary’s Advisory Committee on Health Promotion and Disease Prevention Objectives for 2020, U.S. Department of Health and Human Services, July 26, 2010, http://www.healthypeople.gov/2010/hp2020/advisory/SocietalDeterminantsHealth.htm ↩︎
  2. What Housing-Related Services and Supports Improve Health Outcomes among Chronically Homeless Individuals? Rapid Evidence Review, 2016, AcademyHealth, http://www.academyhealth.org/files/publications/files/publications/RER%255FHomelessness%255FHousing%255F2016%255FFinal.pdf ↩︎
  3. Buchanan D et al., “The Health Impact of Supportive Housing for HIV-Positive Homeless Patients: A Randomized Controlled Trial,” American Journal of Public Health 99 (Supplement 3), November 2009, https://www.ncbi.nlm.nih.gov/pmc/articles/PMC2774195/; and Reid K et al., “Association between the Level of Housing Instability, Economic Standing and Health Care Access: A Meta-Regression,” Journal of Health Care for the Poor and Underserved 19.4, November 2008, http://search.proquest.com/docview/220586779/fulltextPDF/874CBF1D7D4F4CC0PQ/1?accountid=39486 ↩︎
  4. Raven M et al., “Medicaid Patients at High Risk for Frequent Hospital Admission: Real-Time Identification and Remediable Risks,” Journal of Urban Health 86(2), March 2009, https://www.ncbi.nlm.nih.gov/pmc/articles/PMC2648879/ ↩︎
  5. Maqbool N et al., The Impacts of Affordable Housing on Health: A Research Summary, Center for Housing Policy, April 2015, http://www2.nhc.org/HSGandHealthLitRev_2015_final.pdf ↩︎
  6. Op. cit., Buchanan et al. Wollitski R et al., “Randomized Trial of The Effects of Housing Assistance on the Health and Risk Behaviors of Homeless and Unstably Housed People Living With HIV,” AIDS Behavior 14(3), June 2010, https://www.ncbi.nlm.nih.gov/pubmed/19949848 ↩︎
  7.  Martinez T and M Burt, “Impact of Permanent Supportive Housing on the Use of Acute Care Health Services by Homeless Adults,” Psychiatric Services 57(7), July 2006, https://www.ncbi.nlm.nih.gov/pubmed/16816284; Sadowski L et al., “Effect of a Housing and Case Management Program on Emergency Department Visits and Hospitalizations among Chronically Ill Homeless Adults,” Journal of the American Medical Association 301(17), May 6, 2009, https://www.ncbi.nlm.nih.gov/pubmed/19417194; and Home &Healthy for Good – Permanent Supportive Housing: A Solution-Driven Model, January 2016 Progress Report, Massachusetts Housing and Shelter Alliance, http://archives.lib.state.ma.us/bitstream/handle/2452/393621/ocn887735103-2016.pdf?sequence=1&isAllowed=y ↩︎
  8. CMCS Informational Bulletin: Coverage of Housing-Related Activities and Services for Individuals with Disabilities, Centers for Medicare and Medicaid Services (CMS), June 26, 2015,  http://www.medicaid.gov/federal-policy-guidance/downloads/CIB-06-26-2015.pdf. ↩︎
  9. Medicaid and Permanent Supportive Housing for Chronically Homeless Individuals: Emerging Practices from the Field, August 2014, Office of the Assistant Secretary for Planning and Evaluation, U.S. Department of Health and Human Services, https://aspe.hhs.gov/sites/default/files/pdf/77116/EmergPrac.pdf ↩︎
  10. Medicaid Health Homes: An Overview, Fact Sheet, CMS, September 2016, https://www.medicaid.gov/state-resource-center/medicaid-state-technical-assistance/health-homes-technical-assistance/downloads/hh-overview-fact-sheet-sep-2016.pdf ↩︎
  11. Smith V et al.,  Implementing Coverage and Payment Initiatives: Results from a 50-State Medicaid Budget Survey for State Fiscal Years 2016 and 2017, October 13, 2016, https://modern.kff.org/medicaid/report/implementing-coverage-and-payment-initiatives-results-from-a-50-state-medicaid-budget-survey-for-state-fiscal-years-2016-and-2017/ ↩︎
  12. See, for example, the Whole Person Care Pilots included in California’s “Medi-Cal 2020” section 1115 demonstration waiver, available at http://www.dhcs.ca.gov/services/Pages/WholePersonCarePilots.aspx. These pilot target particularly vulnerable groups of Medi-Cal beneficiaries who have been identified as high users of multiple systems and continue to have poor health outcomes. They involve collaborative leadership and systematic coordination among public and private entities, which may include housing entities, with the goal of providing comprehensive coordinated care for the beneficiary resulting in better health outcomes. ↩︎
Data Note: Estimated Medicaid Savings in the House Budget Resolution from March 2016

Author: Robin Rudowitz
Published: Jan 24, 2017

As the 115th Congress starts the session, GOP members of Congress are moving to repeal the Affordable Care Act (ACA) and are likely to consider proposals to restrict and fundamentally restructure Medicaid financing.  While the current Budget Resolution under consideration will set the framework for a repeal of the ACA, the Budget Resolution that passed in March 2016 provides insight into other Medicaid cuts that could be considered by Congress later this year.  This Data Note examines proposed reductions in federal Medicaid funding under the March 2016 House Budget Resolution.

March 2016 House Budget Resolution

The House Budget Resolution passed in March 2016 called for the repeal of the ACA and other reductions in federal spending for Medicaid.  The Budget Resolution called for a transition to State Flexibility Funds, or a block grant for Medicaid.  However, subsequent language in the Budget Report indicated that states could choose between a single lump sum (block grant) or a per capita-cap methodology.  The report language suggests that both options (block grant and per-capita cap) would be tied to additional state flexibility to administer their programs, but the block grant option would grant states sole discretion over eligibility requirements, benefits, and provider reimbursement rates while there would be some minimum eligibility requirements under the per-capita option (with additional flexibility to set benefits or coverage type).

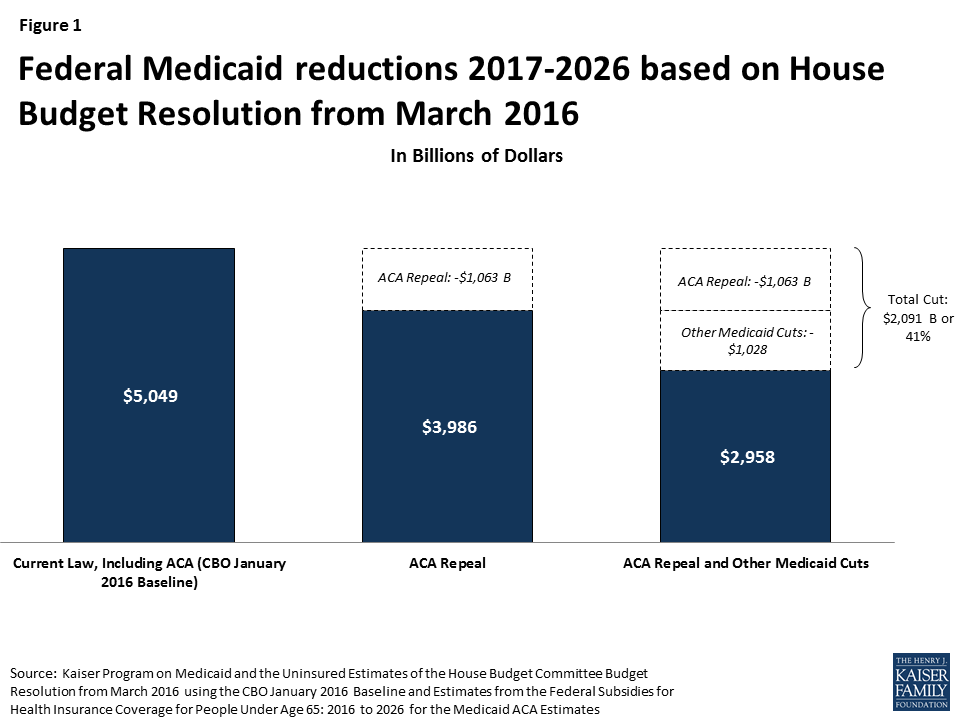
Analysis of the budget implications show that the combination of the ACA repeal and the spending caps could result in reductions in federal funding for Medicaid of $2.1 trillion over the 2017-2026 period or 41% compared to CBO projections for current law from the January 2016 baseline.  These estimates use the reductions in Medicaid and Other Health figures specified in the House Budget Resolution Summary Tables that total $1.028 trillion over the 10 year period.  In addition to Medicaid cuts, the Budget Resolution also called for a repeal of the ACA.  The summary tables do not allocate the Medicaid share of the cuts tied to the ACA repeal.  For these estimates, we use the Medicaid estimates from the March 2016 CBO Estimates from the Federal Subsidies for Health Insurance Coverage for People Under Age 65: 2016 to 2026. This report estimates direct Medicaid spending of $1.063 trillion from the coverage provisions of the ACA over the 2017-2026 period which could be eliminated under repeal. (Table 1 and Figure 1)

Figure 1: Federal Medicaid reductions 2017-2026 based on House Budget Resolution from March 2016

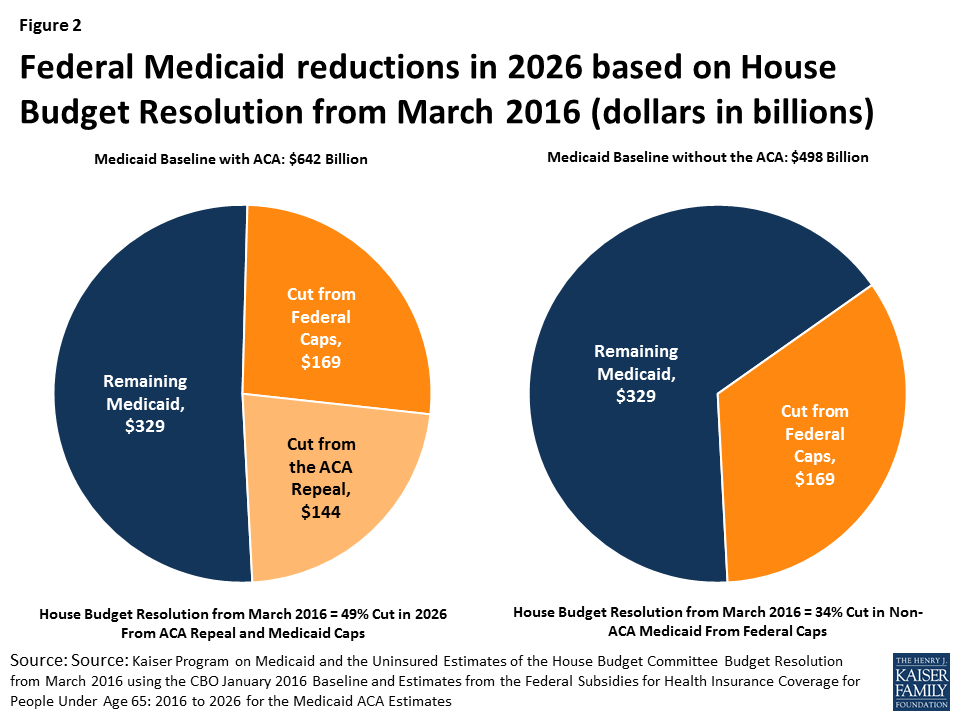
When fully implemented in 2026, cuts from the ACA repeal together with the Medicaid caps could result in a reduction of nearly 50% from projected federal Medicaid spending in that year.  If the ACA expansion is not considered, the caps alone would reduce federal Medicaid funding by $169 billion or one-third from projected non-ACA Medicaid spending in 2026.  (Table 1 and Figure 2)

Figure 2: Federal Medicaid reductions in 2026 based on House Budget Resolution from March 2016 (dollars in billions)
Table 1:  House Budget Resolution March 2016:  Implications for Medicaid (in billions of dollars)
2017201820192020202120222023202420252026 10 Year:2017-2026
 CBO Baseline January 20164014204394604845095365645936425,049
 CBO March 2016 ACA Baseline788185911001081161251341441,063
 Traditional Medicaid (Non-ACA) Baseline3233393543693844014204394594983,986
 ACA Repeal(78)(81)(85)(91)(100)(108)(116)(125)(134)(144)(1,063)
 Medicaid/Other Health Reductions(7)(67)(82)(88)(97)(109)(121)(135)(151)(169)(1,028)
 Total Reductions(85)(148)(167)(179)(197)(217)(237)(260)(285)(313)(2,091)
                       –
% Non ACA Reduction-2%-20%-23%-24%-25%-27%-29%-31%-33%-34%-26%
% Total Reduction-21%-35%-38%-39%-41%-43%-44%-46%-48%-49%-41%
SOURCE: Kaiser Program on Medicaid and the Uninsured Estimates of the House Budget Committee Budget Resolution from March 2016 using the CBO January 2016 Baseline and Estimates from the Federal Subsidies for Health Insurance Coverage for People Under Age 65: 2016 to 2026 for the Medicaid ACA Estimates

KFF analysis of the House Republican Budget Plan in 2012 showed that reductions of a similar magnitude could result in enrollment reductions of 42 to 50% and could have significant implications for provider payments. These estimates assume that states would not increase state spending to offset the federal spending cuts. In the upcoming debate, the implications for Medicaid enrollees, states and providers will depend on the details of an ACA replacement plan, if states are able to maintain ACA Medicaid expansion funding (like in A Better Way Proposal), the targeted level of savings tied to Medicaid cap proposals and what changes are included in federal program rules and options for the states.

JAMA Forum: What Might an ACA Replacement Plan Look Like?

Author: Larry Levitt
Published: Jan 24, 2017

Larry Levitt’s January 2017 post explains the logistics of a “repeal and delay” approach to the Affordable Care Act, and outlines key elements of a proposed replacement plan from Rep. Tom Price, who is President Trump’s nominee for Secretary of Health and Human Services. The post is now available at The JAMA Forum.

Other contributions to The JAMA Forum are also available.

News Release

Private Contracts Between Doctors and Their Medicare Patients:  Current Law, Proposed Changes and Implications for Beneficiaries

Published: Jan 23, 2017

Under current law, physicians may choose to privately contract with their Medicare patients, though very few do.  Under such arrangements, doctors can charge their Medicare patients any amount they determine is appropriate for their services rather than be bound to Medicare’s set fees and balance billing limits, so long as the patients agree, and the contract complies with requirements in current law designed to protect consumers.

Some Republicans in Congress have proposed to ease restrictions on private contracting in Medicare, which could broaden its practice. A new issue brief from the Kaiser Family Foundation explains how private contracting works under current law as well as existing protections for Medicare patients.  It describes how legislative proposals would expand opportunities for physicians to privately contract with their Medicare patients, and explores the potential implications of these proposals for people on Medicare.

Supporters say that making it easier for doctors to enter into private contracts could boost the number of doctors willing to accept Medicare patients because it would allow doctors to charge more for Medicare services, increase physicians’ revenues from their patients on Medicare, and provide more autonomy for physicians than allowed under current law.  However, critics of easing restrictions say that if private contracting becomes more common, a growing number of seniors could face higher fees for physician services, and have greater difficulty finding affordable care.

News Release

New Resource Explains the Impact of the Mexico City Policy

Published: Jan 23, 2017

On January 23, President Donald Trump reinstated the Mexico City Policy, which stipulates that in order to receive U.S. global health funding, foreign non-governmental organizations (NGOs) must certify that they will not perform or actively promote abortion as a method of family planning using funds from any source. A new explainer from the Kaiser Family Foundation looks at the history of the policy and its impact.

Since it was announced by the Reagan administration in 1984, the Mexico City Policy has usually been applied under Republican presidents and rescinded under Democratic presidents. It has been in place for 17 of the past 32 years.

Private Contracts Between Doctors and Medicare Patients: Key Questions and Implications of Proposed Policy Changes

Authors: Cristina Boccuti and Tricia Neuman
Published: Jan 23, 2017

Issue Brief

Today, when most people with Medicare see their doctors, they are generally responsible for paying Medicare’s standard coinsurance, but do not face additional or surprise out-of-pocket charges. This is a result of longstanding laws and regulations that were put into place to address unexpected and confusing charges that were previously more prevalent for Medicare patients.  Under current law, physicians are paid under a fee schedule in Medicare, with limits on the amount they can balance bill beneficiaries per service, unless they choose to “opt out” of Medicare and “privately contract” with all of their Medicare patients.  In recent years, some lawmakers have proposed to broaden the conditions under which doctors and other practitioners can privately contract with Medicare patients for the price of their services.

Legislation has been introduced in the House and Senate to make it easier for physicians and other practitioners to enter into private contracts with their Medicare patients and charge higher fees than are generally allowed under Medicare, including H.R. 1650 introduced by Representative Tom Price (now Health and Human Services Secretary nominee) and a companion bill, S. 1849, introduced by Senator Murkowski. Private contracting provisions are also included in broader bills to repeal the Affordable Care Act (ACA), such as H.R. 2300 introduced by Representative Tom Price and S. 1851 introduced by Senator McCain.  Additionally, Speaker Paul Ryan and House Republicans proposed changes to private contracting through a demonstration project to be implemented by the Administration, as part of their plan, A Better Way.

Changes in Medicare’s private contracting laws could have significant implications for Medicare patients, doctors, and the Medicare program. Given recent interest in private contracting in Medicare, this brief:

  • Summarizes the three options that physicians and practitioners currently have for charging Medicare patients for services they provide;
  • Explains how the private contracting option works in Medicare under current law, including the patient protections, and the implications for beneficiaries’ out of pocket costs;
  • Reviews current proposals on changes to private contracting in Medicare, and discusses the implications for Medicare patients, physicians, and the Medicare program.

Proposals to broaden private contracting in Medicare could create stronger financial incentives for physicians to see Medicare patients, but also expose a rising number of Medicare beneficiaries to unlimited physician charges—a key consideration for seniors and people with disabilities living on modest incomes.

Background: Current Provider Options for Charging Medicare Patients

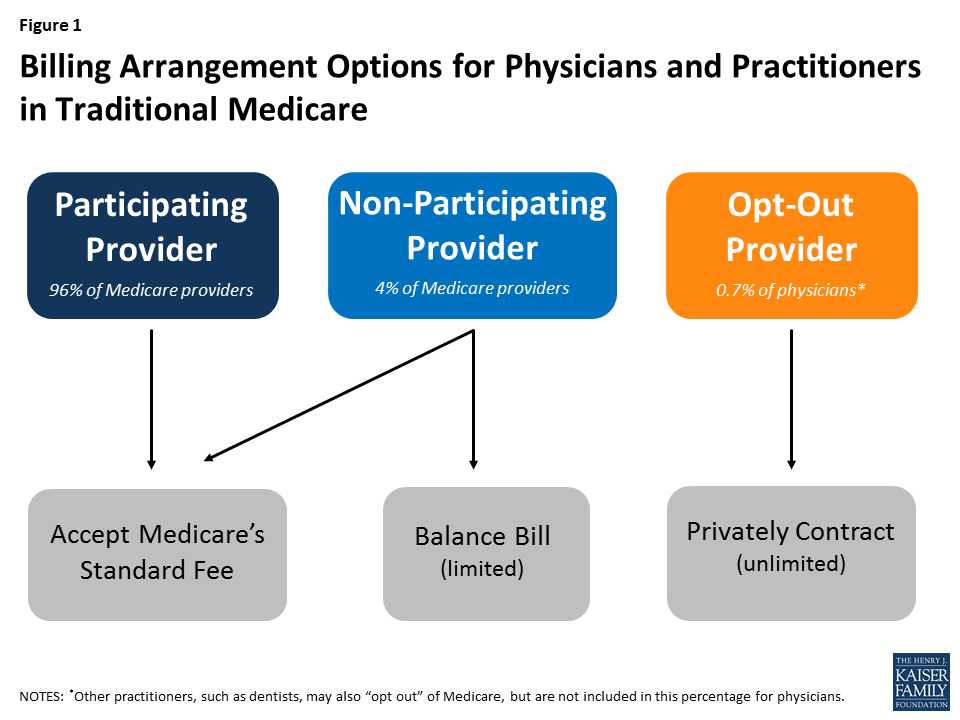
Under current law, physicians and practitioners have three options for charging their patients in traditional Medicare.  They may register with Medicare as (1) a participating provider, (2) a non-participating provider, or (3) an opt-out provider who privately contracts with all of his or her Medicare patients for payment (Figure 1).  These provider options have direct implications on the charges and out-of-pocket liabilities that beneficiaries face when they receive physician services.

Figure 1: Billing Arrangement Options for Physicians and Practitioners in Traditional Medicare
  • Participating providers agree to accept Medicare’s fee-schedule amount as payment-in-full for all Medicare covered services. When Medicare patients see participating physicians and practitioners, they are charged Medicare’s standard amounts and do not face higher out-of-pocket liability than the regular 20-percent coinsurance on most services. Participating providers may collect their applicable fees directly from Medicare. The vast majority (96%) of physicians and practitioners registered with Medicare are participating providers.
  • Non-participating providers may choose—on a service-by-service basis—to charge Medicare patients higher fees than participating providers, up to a maximum limit—115 percent of a reduced fee-schedule amount. When doing so, Medicare patients are fully responsible for this added amount (balance billing) in addition to applicable coinsurance.  When balance billing, non-participating providers bill their Medicare patients directly, rather than Medicare, for the full charge; their patient may then seek reimbursement from Medicare for its portion.1  A small share (4%) of physicians and practitioners registered with Medicare are non-participating providers.
  • Opt-out providers with private contracts may charge their Medicare patients any fee they determine is appropriate for their services, as agreed upon in their contract.2  When doctors and Medicare patients enter into these private contracts, Medicare does not cover or reimburse the doctor or patient for any services provided by opt-out providers, which means that Medicare patients are responsible for the entire cost of any services they receive from them. An extremely small portion of physicians (less than 1% of physicians in clinical practice) have chosen to “opt-out” of Medicare for 2016 (Appendix Table 1). Psychiatrists comprise the greatest share of physicians who have opted out (almost 40 percent) and dental providers comprise the largest share among other types of practitioners. Doctors in concierge practice models (which typically charge an annual membership fee) are not required to opt-out of Medicare, but if they do not, they are subject to Medicare’s coverage and billing requirements.3 

Effects of Private Contracting on Medicare Beneficiaries’ Out-of-Pocket Costs

Under current law, when a patient sees a physician who is a “participating provider” and accepts assignment, as most do, Medicare pays 80 percent of the fee schedule amount and the patient is responsible for the remaining 20 percent.  For example, for a colonoscopy with biopsy, which is about $500 on Medicare’s fee schedule, Medicare pays $400 and the patient is responsible for the remaining $100.  If the physician is a “non-participating provider,” he or she is permitted to balance bill Medicare patients up to a maximum of 115 percent of a reduced fee schedule amount.  In this example, the beneficiary’s liability would rise to $166, rather than $100 (Appendix Table 2).

However, if a physician opts out of Medicare and privately contracts with his or her Medicare patients, the amount that physician may charge is not limited by Medicare; the patient is responsible for whatever the physician charges for a given service, as specified in their contract.  If, in the example above, that physician charges the average out-of-network charge among private insurers, about $1,200, rather than $500, the patient is responsible for the full $1,200—a substantially higher amount than otherwise required.4    It is important to note, however, that this example is illustrative and there is no cap on the amount physicians can charge their patients under private contracts.

Current Patient Protections for Private Contracting in Medicare

The Balanced Budget Act of 1997 (BBA) established a number of patient protections that doctors and practitioners must follow to be able to privately contract with Medicare patients. For example, prior to providing any service to Medicare patients, doctors must inform their Medicare patients in writing that they have “opted out” of Medicare and that Medicare will not reimburse for their services. Their Medicare patients must sign this document to signify their understanding and their right to seek care from a doctor or other practitioner who has not opted-out of Medicare.  Also, doctors are prohibited from entering into private contracts with beneficiaries who are in the midst of experiencing an urgent or emergent health care event or who qualify for Medicaid benefits, generally due to very low incomes.5 

Another statutory condition of current private contract arrangements requires doctors who have decided to opt out of Medicare to do so for all of their Medicare patients and for all of the services they provide to them; they cannot pick and choose which patients and which services apply.  This requirement was intended to prevent confusion among patients as to whether or not each visit would be covered by Medicare and how much patients could expect to pay out-of-pocket, as well as address concerns about Medicare’s ability to protect beneficiaries from fraudulent billing.  A two-year minimum time period for opting out was also established to ensure that beneficiaries can make knowledgeable choices when selecting their physicians, rather than be subject to frequent changes.6 

How Would Recent Proposals Change Private Contracting in Medicare?

Members of Congress and physician organizations, such as the American Medical Association, have proposed eliminating certain conditions under which physicians and other providers are allowed to engage in private contracts with their Medicare patients.  Introduced in several legislative bills, including ones to repeal the ACA, these proposals essentially seek two main changes in Medicare.  First, they would allow physicians to contract more selectively, on a patient-by-patient and service-by-service basis, rather than be required to privately contract with all of their Medicare patients for all services.  Second, they would allow Medicare patients and physicians to seek reimbursement from Medicare for an amount equal to what Medicare would normally pay for that service under the physician fee schedule.

Patients and physicians would also be eligible to seek some coverage for their expenses from supplemental insurance (such as individually purchased Medigap policies and employer-sponsored retiree coverage), under these private contracting proposals, but it is unclear whether these insurers would be required to pay such claims.7  Also, physicians would continue to not be able to private contract with beneficiaries who receive low-income assistance through Medicaid, it is unclear what the impact would be on these beneficiaries if other changes to the Medicaid program were also implemented.8 

Also included in these private contracting proposals are specific provisions to preempt any state laws that limit the amount that doctors and other practitioners may charge their patients.  Some states have put into place consumer protections that limit high charges from out-of-network providers through balance billing and unpredictable “surprise medical bills.”9   These problems have been more common in the commercial insurance market than in Medicare, due to the current program incentives for physicians to be “participating providers,” financial protections on balance billing, and low shares of doctors and other practitioners opting out of Medicare.

What Are the Implications of these Proposals for beneficiaries and physicians?

There are three major arguments put forward in support of these proposals.  First, lifting restrictions on private contracting would provide a way for physicians to receive higher payments for the services they provide, compensating them for what some say are relatively low fees allowed by Medicare which, they say, have failed to keep pace with the rising costs of running their practices.10   This ability would offer greater autonomy to physicians and practitioners, which some say has been eroded though Medicare’s fee regulations and coverage rules, an issue physicians have raised with commercial insurers, as well.11 

A second point often made in favor of these proposals is that they could potentially increase the overall number of doctors and other providers willing to accept Medicare patients because they could charge higher fees to some of their Medicare patients, without having to opt-out of Medicare and turn away all other Medicare patients.  It is possible, for example, that some psychiatrists and oral surgeons—specialties with comparably high opt-out rates (Appendix Table 1)—could start taking more Medicare patients, if they are allowed to privately contract with some but not all others.

A third argument raised in support of these proposals is their potential to reduce beneficiary out-of-pocket costs because patients entering into private contracts would be able to seek reimbursement from Medicare for at least a portion of their doctor’s charges (or allow their doctors to collect this portion directly from Medicare), whereas under current law, Medicare is prohibited from reimbursing patients or doctors for services provided under private contract. Returning to the aforementioned example for a colonoscopy with biopsy, a beneficiary could pay less than $1,200 for the service if they seek and receive reimbursement from Medicare and/or Medigap, although the patient would still pay substantially more than if his or her physician accepted Medicare fees.

But a number of concerns have been raised about the potential implications of these proposals for beneficiaries and the Medicare program.  For example, liberalizing private contracting rules in Medicare could lead to higher costs for more Medicare beneficiaries—a concern for many people who are living on limited incomes and modest savings.  Today, half of all people on Medicare live on incomes of about $24,000 or less.12    If substantially greater numbers of physicians and practitioners begin to privately contract with their Medicare patients for higher fees, then more beneficiaries could be exposed to higher costs for more of the services they receive.  Under these proposals, there would continue to be no limit to the amount a doctor could charge a patient for a Medicare-covered service, if that patient agrees to the charges in the private contract with that physician.

Additionally, there is the concern that with the expansion of private contracting, some beneficiaries could lose access to affordable services, rather than gain it, particularly for less common physician specialties, such as oncology or certain surgical specialties, and in certain areas of the country, including rural communities, where patients may already have relatively few doctors available.  In these cases, Medicare patients may feel that they have no choice but to agree to the terms of physicians’ contracts, even if the higher fees are unaffordable. This could be an issue for patients looking for new doctors as well as for patients wanting to keep their current doctors.  Along those lines, a potential risk arises for patients in having doctors and other practitioners make a judgment as to which of their Medicare patients can afford higher (privately contracted) fees, and by how much. While proponents suggest that doctors have a sense of their patients’ ability to pay higher fees, and will privately contract only with their higher income patients, critics have noted concern that physicians are not well positioned to assess their patients’ financial situation, putting their patients in a difficult position of having to disclose their finances or discontinue care with that doctor.

What Are the Potential Effects of these Proposals on Medicare Spending?

The Congressional Budget Office has not estimated the effects of these proposals on Medicare spending, but more extensive private contracting in Medicare could potentially increase Medicare spending in a couple of ways.  For instance, Medicare does not currently cover any services that are provided under private contract, so proposals that allow Medicare beneficiaries or their doctors to seek reimbursement for any portion of such services would increase Medicare spending.  In addition, Medicare spending could rise if “non-participating” providers decide to switch to private contracting with their Medicare patients, rather than be subject to Medicare’s balance billing limits. This is because Medicare reimbursements for services provided under a private contract would be based on the standard fee schedule rate, which is about 5-percent higher than the rate for non-participating providers.

Discussion

As the 115th Congress gets underway, policymakers may consider proposals to ease private contracting rules under Medicare for physicians.  Proponents say such proposals would increase physician autonomy, and create stronger financial incentives for physicians to treat Medicare patients by allowing them to charge higher fees to at least some of them.  Additionally, these proposals could provide some financial relief to Medicare patients who enter into private contracts with their physicians, by allowing Medicare to cover a portion of the costs for services provided under these private contracts.

However, opponents caution that efforts to ease private contracting rules could lead to an unraveling of the financial protections that have been in place under Medicare for many years, and subject a growing number of beneficiaries to potentially unexpected and unaffordable charges.  Further, such proposals could make it more difficult for some patients to keep their doctors, or find others with affordable fees—a particular issue for people on Medicare with modest incomes and significant health care needs.  Additionally, critics of these proposals caution that beneficiaries living in areas with a limited choice of physicians might find it harder to find a doctor who accepts Medicare’s standard fees if a growing number of providers in their areas choose to require private contracts with their Medicare patients.  And, if these proposals result in a growing number of doctors choosing to privately contract with their patients, they could result in an increase in Medicare spending which would have an impact on the federal budget and beneficiary premiums.

The key issue for Medicare and policymakers is to strike a balance between assuring that doctors and practitioners receive fair payments from Medicare while also preserving financial protections and incentives that help beneficiaries face predictable and affordable costs when they seek medical care.

This issue brief was funded in part by The Retirement Research Foundation.

Appendix

Appendix Table 1: Less than 1% of physicians have “opted out” of Medicare, with psychiatrists making up the largest share
SpecialtyNumber of physicians in patient care, 20151Percent of  all physicians in patient care, 2015Number of Medicare opt-out providers, 20162Percent of Medicare opt-out providers, 2016Percent of all opt-out providers, 2016
PHYSICIANS
Addiction MedicineNA300.6%
Allergy/Immunology4,0190.5%370.9%0.7%
Anesthesiology38,7495.1%140.0%0.3%
Cardiovascular Disease/Cardiology23,2423.1%310.1%0.6%
Critical Care88491.2%40.0%0.1%
Dermatology11,0621.5%1010.9%1.9%
Emergency Medicine36,6074.8%370.1%0.7%
Endocrinology5,6820.7%841.5%1.5%
Family Medicine/General  Practice103,23513.6%8590.8%15.8%
Gastroenterology13,0141.7%200.2%0.4%
General Surgery22,0432.9%610.3%1.1%
Geriatric Medicine4,4220.6%200.5%0.4%
Hand SurgeryNA80.1%
Hematology/Oncology12,2341.6%120.1%0.2%
Infectious Disease6,5480.9%120.2%0.2%
Internal Medicine101,28113.3%5370.5%9.9%
Oral/Maxillofacial SurgeryNA871.6%
Nephrology8,8851.2%50.1%0.1%
Neurological Surgery4,9200.6%320.7%0.6%
Neurology11,5011.5%600.5%1.1%
Neuromusculoskel, Osteo Manip, Sports MedicineNA1272.3%
Obstetrics/Gynecology38,6905.1%3280.8%6.0%
Ophthalmology17,4132.3%380.2%0.7%
Orthopedic Surgery18,2922.4%1210.7%2.2%
Otolaryngology8,8941.2%190.2%0.3%
Pain Mgt/Interventional Pain Mgt4,3280.6%651.5%1.2%
Pathology9,6881.3%50.1%0.1%
Pediatric specialties72,6679.6%3040.4%5.6%
Physical Medicine and Rehabilitation8,3521.1%530.6%1.0%
Plastic and Reconstructive Surgery6,7270.9%1131.7%2.1%
Preventative Medicine4,0910.5%451.1%0.8%
Psychiatry, Geriatric Psychiatry, Neuropsychiatry33,0514.4%20766.3%38.1%
Pulmonary Disease4,8300.6%150.3%0.3%
Radiation Oncology4,4990.6%10.0%0.0%
Radiology, Nuclear Medicine30,2634.0%260.1%0.5%
Rheumatology4,8310.6%200.4%0.4%
Thoracic Surgery4,1530.5%10.0%0.0%
Urology9,3251.2%240.3%0.4%
Vascular Surgery3,0860.4%50.2%0.1%
Other*59,9487.9%100.0%0.2%
Total, all physician specialties759,421100%5,4470.7%100%
OTHER PRACTITIONERS
Behavioral Health, Counseling, Social Work3,25727.9%
Optometry, Eye/Vision services830.7%
Dentistry, dental-oral surgery, oral health7,25262.2%
Podiatry370.3%
Other1,0378.9%
Total, Other Practitioners  11,666 100%
NOTES: Physician counts include active allopathic and osteopathic medicine physicians. NA (not available) indicates that the specialty category is not supplied in the applicable data source. *Physicians in specialties with fewer than 2,500 total physicians are not categorized by specialty in AAMC analysis of AMA data; included as “Other.”SOURCES: Kaiser Family Foundation analysis of: 1Physician counts from Association of American Medical Colleges (AAMC) 2015 Physician Specialty Data Book, using American Medical Association (AMA) Physician Masterfile (December 2015); 2 CMS, Opt Out Affidavits https://data.cms.gov/dataset/Opt-Out-Affidavits/7yuw-754z/data (January 2016).
Appendix Table 2: Examples of Medicare reimbursement and beneficiary cost-sharing for a $500 service on Medicare’s fee-schedule
Provider’s arrangement with MedicarePayment arrangementMedicare’s usual reimbursementBeneficiaries’ usual liability*Total net payment to provider
Participating providerAssigned claim: Medicare pays its portion directly to provider; patient is liable for applicable cost-sharing80% of fee-schedule amount= 0.8 x $500= $40020% of fee-schedule amount= 0.2 x $500= $100100% of fee-schedule amount= $500
Non-participating providerAssigned claim: Medicare pays its portion directly to provider; patient is liable for applicable cost-sharing80% of reduced (by 5%) fee-schedule amount= 0.8 x (0.95 x $500)= $38020% of reduced (by 5%) fee-schedule amount= 0.2 x (0.95 x $500)= $95Reduced (by 5%) fee-schedule amount= 0.95 x $500= $475
Unassigned claim: Patient pays provider’s full charge and seeks reimbursement from Medicare for its portion. On net, patient is liable for applicable cost-sharing PLUS the amount the provider charged above Medicare’s fee-schedule rate80% of reduced (by 5%) fee-schedule amount= 0.8 x (0.95 x $500)= $38020% of reduced (by 5%) fee-schedule amount plus balance-billed amount= $95 + (≤ $71.25)= up to $166.25Up to 115% of reduced (by 5%) fee-schedule amount, known as the “limiting charge”= up to 1.15 x (0.95 x $500)= up to $546.25
Opt-out providerPrivate contract: Provider sets fee with Medicare patient; Medicare does not reimburse provider or patient for any portion of the service= $0UnlimitedUnlimited
NOTES: *These calculations are for traditional Medicare and assume that the beneficiary has already met the annual Medicare deductible. Beneficiaries with supplemental insurance may have coverage for out-of-pocket liabilities.

Endnotes

  1. Non-participating providers must submit claims to Medicare on behalf of their Medicare patients, but Medicare reimburses the patient, rather than the nonparticipating provider, for its portion of the covered charges. Providers are prohibited from balance billing Medicare beneficiaries who have full Medicaid coverage or those who receive Medicaid coverage through the Qualified Medicare Beneficiary program. ↩︎
  2. Private contracting was authorized in the Balanced Budget Act of 1997 (BBA) under limited circumstances as a way for physicians and practitioners to “opt out” of Medicare and charge their Medicare patients fees that are not limited by Medicare’s set amounts and balance billing rules. ↩︎
  3. Annual membership fees may only apply to non-Medicare-covered services, though some controversy exists about concierge practices applying annual fees paid by Medicare beneficiaries to enhanced appointment access and extra time with patients. Pasquale, F. “The Three Faces of Retainer Care: Crafting a Tailored Regulatory Response,” Yale Journal of Health Policy, Law, and Ethics Vol.7: Iss. 1, Article 2. 2007. ↩︎
  4. Approximate fees are drawn from 2014 claims analysis presented in Table 1 of: America’s Health Insurance Plans, “Charges Billed by Out-of-Network Providers: Implications for Affordability” (September 2015).  https://www.ahip.org/wp-content/uploads/2015/09/OON_Report_11.3.16.pdf. ↩︎
  5. Specifically, providers are prohibited from entering into private contracts with Medicare beneficiaries who have full Medicaid coverage (dual eligible) or those who receive Medicaid coverage through the Qualified Medicare Beneficiary (QMB) program. ↩︎
  6. Once a physician or practitioner opts out of Medicare, this status lasts for a two-year period and is automatically renewed unless the physician or practitioner actively cancels it. Automatic renewal provisions were included in 2015 legislation, The Medicare Access and CHIP Reauthorization Act of 2015 (MACRA), Pub.L. 114-10, 114th Congress (2015-2016). ↩︎
  7. Other supplemental insurance, such as employer-sponsored health plans, have the discretion to determine whether or not they will cover services provided under contract with Medicare beneficiaries, so it is not clear how proposed changes to private contracting would affect retiree coverage for these services. ↩︎
  8. Currently, private contracting is prohibited between physicians and Medicare beneficiaries who receive low-income assistance through Medicaid—either from full Medicaid coverage or partial Medicaid coverage through the Qualified Medicare Beneficiary (QMB) program. ↩︎
  9. Pollitz, K., “Surprise Medical Bills,” Kaiser Family Foundation, March, 2016. https://modern.kff.org/private-insurance/issue-brief/surprise-medical-bills/; Hoadley, J. and S. Ahn, and K. Lucia, “Balance Billing: How Are States Protecting Consumers from Unexpected Charges? How seven states (California, Colorado, Florida, Maryland, New Mexico, New York, and Texas) have approached protecting consumers from certain types of balance billing,” Georgetown University Health Policy Institute, June 2015. http://www.rwjf.org/en/library/research/2015/06/balance-billing–how-are-states-protecting-consumers-from-unexpe.html. ↩︎
  10. See letter to the Honorable Tom Price from the American Medical Association: https://searchlf.ama-assn.org/letter/documentDownload?uri=%2Funstructured%2Fbinary%2Fletter%2FLETTERS%2Fmedicare-patient-empowerment-act-28april2015.pdf. ↩︎
  11. In addition to letter cited above, see also: Rabin, Roni C., “When Doctors Stop Taking Insurance,” New York Times, October 1 2012. ↩︎
  12. Jacobson, G. et al, “Income and Assets of Medicare Beneficiaries, 2014 – 2030,” Kaiser Family Foundation, Sep 10, 2015.   https://modern.kff.org/medicare/issue-brief/income-and-assets-of-medicare-beneficiaries-2014-2030/. ↩︎

Community Health Centers: Recent Growth and the Role of the ACA

Authors: Julia Paradise, Sara Rosenbaum, Anne Markus, Jessica Sharac, Chi Tran, David Reynolds, and Peter Shin
Published: Jan 18, 2017

Executive Summary

Community health centers are the nation’s largest source of comprehensive primary care for medically underserved communities and populations. Under the Affordable Care Act (ACA), increased patient revenues due to the expansion of Medicaid and private health insurance, along with substantially increased direct federal investment in the program, have led to growth in the number of health centers and their capacity to provide services. This brief draws on 2015 federal data on health centers and our 2016 Survey of Health Centers’ Experiences and Activities under the Affordable Care Act to provide a snapshot of health centers and their patients, analyze recent changes, and compare the experience of health centers in Medicaid expansion and non-expansion states. This information is germane to the impending debate on the ACA and the potential impact of changes on coverage and access to care for low-income Americans and financing for safety-net providers. Key findings include:

  • Health centers are a core source of primary care in the U.S., particularly for Medicaid beneficiaries and uninsured people. In 2015, 1,375 health centers provided care to 24.3 million patients, including 1 in 12 U.S. residents and nearly 1 in 6 Medicaid enrollees. Almost three-quarters of all health center patients had income below the poverty level.
  • Health center patients are increasingly insured, primarily due to the ACA Medicaid expansion. In 2015, 76% of health center patients were insured (49% through Medicaid), up from 65% in 2013, the year before the ACA coverage expansions took effect. State Medicaid expansion decisions made a large difference in coverage. Over half of health center patients in expansion states had Medicaid, compared to one-third in non-expansion states. About 1 in 5 health center patients in Medicaid expansion states remained uninsured, compared to 1 in 3 in non-expansion states.
  • The Medicaid expansion strengthened health center finances and capacity. Health centers in Medicaid expansion states reported higher total operating revenues than those in non-expansion states, and Medicaid provided a larger share of their revenues. On average, health centers in expansion states served 40% more patients than those in non-expansion states, reported higher staffing ratios for oral and behavioral health care, and were more likely to report increased capacity to provide services. Workforce recruitment and retention are leading challenges for health centers, especially in Medicaid expansion states.
  • Health centers report increased numbers of insured patients who are unable to pay their deductibles and cost-sharing. Nearly two-thirds of health centers in non-expansion states reported an increase in insured patients who could not afford their deductibles and cost-sharing, and over half reported an increase in the share of their privately insured patients who pay sliding fees. The share of health centers in expansion states reporting these trends, though significantly smaller, was also substantial.
  • Federal grant funding remains essential to support health centers. In 2015, federal grants provided close to 20% of health center revenues. This funding enables health centers to finance care for uninsured patients, subsidize insured patients unable to afford their deductibles and copays, and finance services not covered by insurance. Over 70% of federal health center grant funding is from the health center trust fund set up by the ACA.
  • If the ACA were repealed, ending the Medicaid expansion and the health center trust fund, health centers would be challenged to sustain their operations. Increased numbers of uninsured patients, together with both the loss of Medicaid revenues associated with the Medicaid expansion and most federal grant funding, would be a severe financial shock to health centers and likely leave them unable to sustain their operations and capacity at current levels. The contraction of health centers would likely leave the most medically underserved urban and rural communities in the nation – for which the health center program was created – with reduced access to comprehensive primary health care.

Issue Brief

Introduction

Community health centers are an integral component of our nation’s health care system, representing the largest source of comprehensive primary health care for medically underserved rural and urban communities and populations. The health center program, which enjoys broad bipartisan support, has grown significantly over time due primarily to expanded Medicaid eligibility and substantial increases in federal grant funding, most recently under the Affordable Care Act (ACA), which expanded Medicaid to nonelderly adults with income up to 138% of the federal poverty level (FPL) and established new private insurance marketplaces and subsidies for people with incomes between 100% and 400% FPL. The ACA also created a special trust fund for health centers, extended in 2015 for two additional years (through September 30, 2017). The 2012 Supreme Court decision on the ACA effectively made the Medicaid expansion optional for states; as of January 1, 2017, 32 states (including the District of Columbia (DC)) had adopted the expansion and 19 states had not.1 

This issue brief provides a 2015 snapshot of health centers and their patients. In addition, it compares the characteristics and experience of health centers in Medicaid expansion and non-expansion states, including the coverage profile of their patients, their revenue sources, their service capacity, and changes in these factors relative to January 1, 2015. The analysis relies on data from the federal Uniform Data System (UDS), into which all community health centers must report on an annual basis, as well as data from the 2016 round of the Survey of Health Centers’ Experiences and Activities under the Affordable Care Act, designed jointly by the Geiger Gibson/RCHN Community Health Foundation Research Collaborative at the George Washington University’s Milken Institute School of Public Health and the Kaiser Family Foundation. Previous rounds of the survey were conducted in 2013 and 2014.2 

Data and Methods

We analyzed data from the 2015 UDS to develop a current profile of community health centers and their patients, and also to compare health centers in Medicaid expansion and non-expansion states. To assess changes in selected health center variables since the ACA coverage expansions took effect in 2014, we compared 2013 and 2015 UDS data. We also analyzed data from our health center survey to compare the recent experience of health centers in Medicaid expansion and non-expansion states in terms of revenue, service capacity, and access to care.

We emailed the survey during May-July 2016 to all 1,278 federally-funded community health centers identified in the 2014 UDS.3  A total of 640 health centers responded, yielding a response rate of 50%. We received survey responses from health centers in all 50 states and DC and four U.S. territories. Excluding health center respondents in the territories (n=11), 61% of the survey respondents were located in Medicaid expansion states and 39% were located in non-expansion states. To adjust for observed differences between respondents and non-respondents, we weighted the survey data by total health center patients, the percentage of their patients reported as racial/ethnic minorities, and total revenues per patient, using 2015 UDS data. After weighting the data, we conducted bivariate analyses (Chi-squared and t-tests) to determine whether responses differed based on health centers’ location in Medicaid expansion versus non-expansion states.

In the UDS analysis, all states that expanded Medicaid by the end of 2015 were counted as expansion states (30 states including DC) and the others were counted as non-expansion state (21 states).4  In the survey analysis, Montana, which expanded Medicaid in early 2016, was also counted as an expansion state on the assumption that its health centers would have felt effects of the expansion by survey time, but we counted Louisiana, which expanded Medicaid in July 2016, as a non-expansion state. Thus, the survey analysis counts 31 states including DC as Medicaid expansion states and 20 non-expansion states. Health centers in the territories were excluded from all analyses comparing health centers in Medicaid expansion and non-expansion states.

Findings

National Profile of Health Centers, 2015

Health centers serve a large and diverse low-income population.

In 2015, 1,375 community health centers in more than 9,750 communities served 24.3 million patients (Figure 1) – nearly 1 in 12 U.S. residents. This patient caseload is more than 10% greater than the caseload just two years ago, in 2013. Health centers serve a diverse, low-income population. Over half (55%) of health centers are located in rural areas and 45% are located in urban areas. In 2015, the vast majority (92%) of health center patients had income at or below 200% FPL ($40,180 for a family of 3 in 20155 ), including 71% who had income below 100% FPL (Figure 2). Nearly 6 in 10 patients were female. The large majority of health center patients were non-elderly adults (61%) and children (31%), but almost 1 in 10 were elderly. The patient population was also racially and ethnically diverse, with non-Hispanic Whites, Hispanics, and African Americans each making up a sizable share of the total.

Figure 1: Trend in Health Center Patient Volume, by Health Insurance Type, 2000-2015
Figure 2: Demographic Profile of Health Center Patients, 2015
The health center patient population is increasingly insured, primarily due to Medicaid.

In 2013, 65% of health center patients were insured (Figure 3) – 41% by Medicaid, 14% by private insurance, 8% by Medicare, and 2% by other public insurance. By 2015, 76% of health center patients had coverage – an increase of 11 percentage points. About half were covered by Medicaid, 17% by private insurance, 9% by Medicare, and 1% by other public insurance. These increases in coverage coincided with implementation of the ACA insurance expansions, which began January 1, 2014. The increased share of patients with Medicaid reflects the low-income communities served by health centers. The potential for gains in private insurance in these communities is more limited because of the high concentration of poverty and the fact that individuals with income below 100% FPL are not eligible for subsidies to purchase coverage in the ACA marketplaces.

Figure 3: Health Coverage of Health Center Patients, 2013 and 2015
Even with expanded coverage, 1 in 4 health center patients remains uninsured.

As health coverage rates rose from 2013 to 2015, the uninsured rate among health center patients fell. Notably, however, even with substantial gains in coverage, 24% of health center patients were uninsured in 2015, nearly triple the rate in the general population (9.1%).6 

Health centers are key Medicaid providers.

Health centers are a major source of comprehensive primary care for Medicaid beneficiaries. In 2015, close to 1 in 6 Medicaid enrollees received health center services (Figure 4). This statistic varies across the nation, but in almost half the states, more than 1 in 7 Medicaid enrollees received health center care, including seven states where at least 1 in 4 enrollees used health center services.

Figure 4: Proportion of Medicaid/CHIP Enrollees Receiving Care at Health Centers, 2015
Even with increasing patient revenues, grant funding provides essential support for health centers.

Health centers’ total revenues grew from $15.9 billion in 2013 to $21.0 billion in 2015 (Figure 5), due to increases in both patient revenues and federal grant funding under Section 330. As health insurance expanded under the ACA, so did the share of health center revenues derived from insurance payments. In 2013, the year prior to the ACA coverage expansions, patients from public and private insurance accounted for 56% of health centers’ total revenues, with 40% coming from Medicaid. In 2015, insurance payments provided 61% of health centers’ total revenues – up five percentage points from 2013 – with increased Medicaid revenues making the largest difference. Even with higher patient revenues, Section 330 grants (18%) and other grants (13%) provided one-third of health centers’ total revenues in 2015.

Figure 5: Sources of Health Center Revenue, 2013 and 2015

More than 70% of all Section 330 funding comes from the ACA health center trust fund, which Congress extended through September 30, 2017.7  Grant funding enables health centers to provide care for uninsured patients; provide services not covered by most insurance, such as adult dental care, transportation, translation services, and care management; and use sliding fees for privately insured patients who cannot afford their deductibles and cost-sharing.

Health Center Profile, by State Medicaid Expansion Status

coverage of health center patients

State Medicaid expansion decisions affect coverage of health center patients.

In 2015, half of all health center patients nationwide were covered by Medicaid, but those in Medicaid expansion states were more likely to be covered than those in non-expansion states – 55% compared to 34% (Figure 6). The difference largely reflects much broader Medicaid eligibility for adults in the expansion states. The rate of private insurance coverage was somewhat higher in health centers in non-expansion states than expansion states – 19% versus 16%. The higher private insurance rate in non-expansion states likely reflects, at least in part, subsidized marketplace coverage among patients with income between 100% and 138% FPL, who would have qualified for Medicaid instead in an expansion state. Analysis of average Medicaid and private coverage rates in health centers in expansion and non-expansion states show that differences are statistically significant (data not shown).

Figure 6: Health Coverage of Health Center Patients, by State Medicaid Expansion Status, 2015
Health center patients in Medicaid non-expansion states are more likely to be uninsured.

Between very limited Medicaid eligibility for adults in non-expansion states and the unavailability of marketplace subsidies for individuals with income below 100% FPL, health center patients in non-expansion states are much more likely to be uninsured than their counterparts in expansion states. In 2015, more than 1 in 3 health center patients in non-expansion states were uninsured, compared to fewer than 1 in 5 in expansion states; a comparison between mean uninsured rates for health centers in expansion and non-expansion states provides evidence that they differ significantly (data not shown).

Health center revenues

Health centers in Medicaid expansion states have higher total revenues, get more revenue from Medicaid, and rely less on grant funding than those in non-expansion states.

In 2015, health centers in Medicaid expansion states had total revenues of $15.4 billion, compared to $5.3 billion for those in non-expansion states (Figure 7). Health centers in expansion states received almost half their operating revenues from Medicaid. Federal Section 330 grants, the second-largest revenue source, provided 15%. In contrast, health centers in non-expansion states derived less than one-third (29%) of their revenues from Medicaid and depended on Section 330 grants for 25% of their revenues – almost as much as Medicaid provided. On average (Table 3), health centers in expansion states had significantly greater total revenues than those in non-expansion states – $18.4 million versus $10.4 million – as well as significantly higher revenue per patient ($586 versus $369) and Medicaid revenue per Medicaid patient ($800 versus $537).

Figure 7: Sources of Health Center Revenue, by State Medicaid Expansion Status, 2015
Health centers in Medicaid expansion and non-expansion states report different patterns of revenue growth.

Our survey asked health centers about changes in revenue sources since January 1, 2015. In both expansion and non-expansion states, about three-quarters of health centers reported increased federal grant funding and about one-quarter reported increased state and local grants (Table 1). Nearly 80% of health centers in expansion states also reported Medicaid revenue growth, compared to 44% of those in non-expansion states.

Table 1: Share of Health Centers Reporting Increased RevenuesSince January 1, 2015, by State Medicaid Expansion Status
Revenue sourceShare of health centers reporting increase in revenue
Medicaid expansion statesMedicaid non-expansion states
Private capital17%17%
Federal grants76%75%
State and local grants25%27%
Medicaid revenue*79%44%
Private insurance revenue*45%56%
Family planning funding*7%12%
*Difference by state Medicaid expansion status is significant at p<.05.NOTE: Statistically significant result indicates that the distribution of health center responses (increased, decreased, no change, not applicable) was different in Medicaid expansion versus non-expansion states; only the share reporting increased revenues are shown.

Fewer health centers (45%) in expansion states reported increased private insurance revenues, while 56% of   those in non-expansion states reported an increase in this source; the larger share reporting increased private insurance revenues in non-expansion states may be due, at least in part, to marketplace coverage among patients with income between 100% and 138% FPL in these states. Notably, the share of health centers reporting increased family planning grant funding was greater in non-expansion states.

Many health centers report increased coverage lapses and underinsurance among their insured patients, which put pressure on health center finances.

Due, at least in part, to the larger number of insured health center patients, many health centers also report increased numbers of patients with coverage lapses (Table 2). Health centers in non-expansion states were significantly more likely to report increased coverage lapses since January 1, 2015, compared to health centers in Medicaid expansion states (49% versus 45%). Coverage lapses translate into increases in uninsured patients, a relative reduction in patient revenues, and greater reliance on grant funding to sustain health center capacity and services.

Table 2: Share of Health Centers Reporting Increased Coverage Lapses and UnderinsuranceSince January 1, 2015, by State Medicaid Expansion Status
Coverage lapses and underinsuranceShare of health centers reporting an increase
Medicaid expansion statesMedicaid non-expansion states
Number of patients with a lapse or break in coverage*45%49%
Number of insured patients unable to pay their deductibles and cost-sharing55%64%
Proportion of privately insured patients who pay sliding scale fees*42%55%
*Difference by state Medicaid expansion status is significant at p<.05.NOTE: Statistically significant result indicates that the distribution of health center responses (increased, decreased, no change, not applicable) was different in Medicaid expansion versus non-expansion states; only the share reporting increased coverage lapses and underinsurance are shown.

More than half of health centers in both expansion and non-expansion states reported increased numbers of insured patients who are unable to pay their deductibles and cost-sharing amounts – a form of underinsurance. One likely cause of this increase is the growth in the sheer number of privately insured patients, many of whom may find these costs difficult to afford on their low incomes. More than half (55%) of health centers in non-expansion states also reported an increase in the proportion of their privately insured patients who pay sliding fees; the share of health centers in expansion states that reported an increase was substantial but significantly smaller, at 42%.

Health Center Capacity and Access

Health centers in Medicaid expansion states have larger-scale operations and greater service capacity.

In 2015, health centers in Medicaid expansion states were located about evenly in rural and urban areas; they were more likely to be located in rural areas in non-expansion states (Table 3). Health centers in expansion states had 7.6 service sites on average, compared to 6.5 sites in non-expansion states. They served close to 40% more patients and provided 60% more visits on average than health centers in non-expansion states. In addition, health centers in expansion states reported significantly higher dental, mental health, and substance use treatment provider-to-patient ratios compared to health centers in non-expansion states.

Table 3: Health Center Profile, by State Medicaid Expansion Status, 2015
Health center profileMedicaid expansion statesMedicaid non-expansion states
Health center characteristics
Location*
  Rural49%63%
  Urban51%37%
  Size (mean)
  Number of sites*7.66.5
  Patients*19,75114,426
  Clinic visits*82,50851,337
Health center staffing (mean)
  Medical FTEs per 10,000 patients36.127.6
  Dental FTEs per 10,000 patients*6.45.7
  Mental health FTEs per 10,000 patients*4.83.5
  Substance abuse FTEs per 10,000 patients*1.00.4
  Enabling services FTEs per 10,000 patients11.010.0
Health center revenues
  Total revenue*$18,401,772$10,442,549
  Total revenue per patient*$1,185$825
  Patient revenue per patient*$586$369
  Medicaid revenue per Medicaid patient*$800$537
*Difference between Medicaid expansion and non-expansion states is significant at p<.05.SOURCE: GW analysis of 2015 UDS.

Health centers in Medicaid expansion states were more likely than those in non-expansion states to report increases in certain staff and services capacity. Roughly 6 in 10 health centers in both Medicaid expansion and non-expansion states reported increased dental service capacity since January 1, 2015 (Table 4). A similar share in both groups of states also reported increased chronic care management capacity. Most health centers in expansion states had increased mental health services and staff since the start of 2015 (76% and 71%, respectively), and more than one-third (35%) had increased substance abuse treatment staff. The share of health centers in non-expansion states reporting increased capacity in these areas was significantly smaller – 66%, 55%, and 25%, respectively. Notably, however, health centers in non-expansion states were significantly more likely than those in expansion states to have increased family planning services (35% versus 25%).

Health centers have taken steps to expand access to care, but waits for appointments have increased, especially in Medicaid expansion states. Close to half of health centers in both expansion and non-expansion states reported an increased number of sites since January 1, 2015 (Table 5). A majority of health centers in expansion states also increased their hours of operation. Possibly reflecting increased demand for medical services as more patients gain coverage, about 40% of health centers in expansion states and 30% in non-expansion states reported increased waits for new patient appointments. Many health centers also reported longer wait times for follow-up appointments; this problem was significantly more prevalent in Medicaid expansion states than non-expansion states (34% versus 22%). Around 1 in 5 health centers in both expansion and non-expansion states reported an increase in other community providers serving the uninsured (data not shown), a factor that may mitigate demand for health center services.

Table 4: Share of Health Centers Reporting Increased Service CapacitySince January 1, 2015, by State Medicaid Expansion Status
Type of service/capacity Share of health centers reporting an increase
Medicaid expansion statesMedicaid non-expansion states
Dental services61%56%
Dental staff55%47%
Mental health services*76%66%
Mental health staff*71%54%
Substance use treatment services41%31%
Substance use treatment staff*35%25%
Chronic care management services60%58%
Vision care services19%15%
Vision care staff17%10%
Family planning services*25%35%
Family planning staff20%24%
Social services (e.g., housing, SNAP)34%35%
Increased use of telemedicine17%16%
*Difference by Medicaid expansion is significant at p<.05.NOTE: Statistical significance indicates that the distribution of possible responses (increased, decreased, no change, not applicable) was different between health centers in Medicaid expansion and non-expansion states. Only the percentages reporting “increased” are shown.
Table 5: Share of Health Centers Reporting Change in Selected Measures of AccessSince January 1, 2015, by State Medicaid Expansion Status
Measure of access Share of health centers reporting the change
Medicaid expansion statesMedicaid non-expansion states
Expanded access
   Increased number of sites47%44%
   Increased hours of operation*56%44%
   Increased days of operation/week25%24%
Increased pressure on access
   Increased waits for new patient   appointments38%29%
   Increased waits for follow-up appointments*34%22%
   Increased waits in the waiting room17%18%
*Difference by Medicaid expansion is significant at p<.05.NOTE: Statistical significance indicates that the distribution of possible responses (increased, decreased, no change, not applicable) was different between health centers in Medicaid expansion and non-expansion states. Only the percentages reporting “increased” are shown.

HEALTH CENTER CHALLENGES 

The survey provided respondents with a list of issues and asked them to identify and rank the three that are most challenging for their health center. Workforce recruitment is the challenge health centers most often included in their top-three lists, with a majority in both expansion and non-expansion states mentioning it; workforce retention also made the top-three for more than one-third of health centers (Table 6). Workforce recruitment and retention were significantly more likely to be among the top three challenges identified by health centers in Medicaid expansion states, compared to health centers in non-expansion states.

Table 6: Share of Health Centers Ranking Selected Factors Among Their Top Three Challenges,by State Medicaid Expansion Status
Factor Reported as Top-Three ChallengeMedicaid expansion statesMedicaid non-expansion states
Workforce recruitment*75%64%
Workforce retention*49%36%
Insufficient insurance reimbursement40%42%
Insufficient grant funding27%29%
High numbers of uninsured patients*21%58%
Competition from other providers26%26%
Integrating care provided by the health center with care provided by other providers*37%26%
*Difference by Medicaid expansion is significant at p<.05.

Perhaps not surprisingly, health centers in expansion and non-expansion states ranked having a high number of uninsured patients differently. Likely reflecting their patients’ much higher uninsured rates and their more limited patient revenues, well over half (58%) of health centers in non-expansion states identified high numbers of uninsured patients as a top-three challenge, compared to 1 in 5 in Medicaid expansion states.

Notwithstanding the very different health insurance environments in which they operate, about 40% of health centers in both expansion and non-expansion states cited insufficient insurance reimbursement as one of their top three challenges. Also, roughly one-quarter of health centers in both groups of states named insufficient grant funding as a top-three challenge.

Discussion

As the ACA enters a period of uncertainty, health centers offer a window into what the ACA has meant for many of the nation’s poorest communities. Increased access to affordable health insurance has led to marked gains in coverage among health center patients, particularly in Medicaid expansion states, and increased direct investment in health centers has led to expanded primary care capacity and access to services. Over a two-year period, health centers were able to add 2.6 million patients – an increase of more than 10% – and expand services such as oral health and mental health treatment, for which there is great need. Notably, even with the progress in coverage, 1 in 4 health center patients remains uninsured, and many insured patients need help with cost-sharing and non-covered services. Thus, grant funding for health centers has continued to be essential both to finance care for uninsured patients and to subsidize insured patients who face high out-of-pocket costs, limited benefits, or both.

The findings from this analysis document the growth in health center patient coverage and health center capacity to serve low-income communities following implementation of the ACA. By extension, the findings also suggest what would be at risk in these communities if the ACA were to be repealed. Increased numbers of uninsured patients, together with the loss of Medicaid revenues associated with the Medicaid expansion and most federal grant funding, would be a severe financial shock to health centers and likely leave them unable to sustain their operations and capacity at current levels. The contraction of health centers would likely leave the most medically underserved urban and rural communities in the nation – for which the health center program was created – with reduced access to comprehensive primary health care.

Additional funding support for this paper was provided to The George Washington University by the RCHN Community Health Foundation.

Endnotes

  1. Status of State Action on the Medicaid Expansion Decision, Kaiser State Health Facts, Kaiser Family Foundation, https://modern.kff.org/health-reform/state-indicator/state-activity-around-expanding-medicaid-under-the-affordable-care-act/?currentTimeframe=0 ↩︎
  2. Shin P et al., Assessing the Potential Impact of State Policies on Community Health Centers’ Outreach and Enrollment Activities, Policy Research Brief No. 35, Geiger Gibson/RCHN Community Health Foundation Research Collaborative, George Washington University, 2014, http://www.rchnfoundation.org/?p=3814; and Health Center Patient Trends, Activities, and Service Capacity: Recent Experience in Medicaid Expansion and Non-Expansion States, Kaiser Commission on Medicaid and the Uninsured, 2015, https://modern.kff.org/medicaid/issue-brief/health-center-patient-trends-enrollment-activities-and-service-capacity-recent-experience-in-medicaid-expansion-and-non-expansion-states/ ↩︎
  3. The total number of health centers reporting into the UDS in 2015 was 1,375, exceeding the total in 2014. ↩︎
  4. State Decisions on Health Insurance Marketplaces and the Medicaid Expansion, State Health Facts, Kaiser Family Foundation, https://modern.kff.org/health-reform/state-indicator/state-decisions-for-creating-health-insurance-exchanges-and-expanding-medicaid/?currentTimeframe=0 ↩︎
  5. 2015 Poverty Guidelines for the 48 Contiguous States and the District of Columbia, Office of The Assistant Secretary for Planning and Evaluation, U.S. Department of Health and Human Services, 2015, https://aspe.hhs.gov/2015-poverty-guidelines ↩︎
  6. Barnett J and M Vornovitsky, Health Insurance Coverage in the United States: 2015, U.S. Census Bureau, 2016, https://www.census.gov/content/dam/Census/library/publications/2016/demo/p60-257.pdf ↩︎
  7. Section 330 Health Center Grant Funds: Two Sources Combine to Form One Program, National Association of Community Health Centers, http://www.saveourchcs.org/client/CHC%20Mandatory%20Discretionary%20Explainer.pdf ↩︎

Medicaid Income Eligibility Levels for Childless Adults

Published: Jan 17, 2017

Source

Based on results from a national survey conducted by the Kaiser Commission on Medicaid and the Uninsured and the Georgetown University Center for Children and Families, 2017.

Medicaid Income Eligibility Levels for Parents

Published: Jan 17, 2017

Source

Based on  results from a national survey conducted by the Kaiser Commission on Medicaid and the Uninsured and the Georgetown University Center for Children and Families, 2017.