Insurance Coverage Changes for People with HIV Under the ACA

Published: Feb 14, 2017

New as of May 20, 2019: An Update on Insurance Coverage Among People with HIV

Prior to the Affordable Care Act (ACA), people with HIV faced limited access to insurance coverage due to several barriers, including pre-existing condition exclusions, high costs, Medicaid eligibility limitations, and other challenges. Several key provisions of the ACA removed these barriers. With discussion underway about the future of the ACA, including repealing it in full or in part, it is important to understand how the ACA has changed coverage for people with HIV.

This brief provides the first national estimates of changes in insurance coverage among people with HIV since the implementation of the ACA.1 ,2  It is based on analysis of data from the Centers for Disease Control and Prevention (CDC). We find that coverage increased significantly for people with HIV due to the ACA’s Medicaid expansion; indeed, increased Medicaid coverage in expansion states drove a nationwide increase in coverage for people with HIV. In addition, the share relying on the Ryan White HIV/AIDS Program also increased. To the extent that ACA repeal efforts include elimination of the Medicaid expansion option for states, most people with HIV who gained this type of insurance could be at risk for losing coverage.  In addition, elimination of private market protections- such as bans on preexisting condition exclusions and rate setting tied to health status- would also limit access for this population.

Background

Prior to the ACA, many people with HIV faced limited access to insurance coverage due primarily to three types of barriers:

  • Pre-existing conditions exclusions: Insurance issuers were able to deny individuals coverage based on pre-existing conditions (or perceived future conditions) including but not limited to being HIV positive, and HIV was generally considered an uninsurable condition.3  As a result, in most cases people with HIV were effectively barred from the individual market.
  • Cost barriers: Even if someone with HIV could obtain private insurance, it was often prohibitively expensive, as rates varied by health status and other factors. In addition, in both the individual and group markets, annual and lifetime limits on coverage posed a particular challenge for people with HIV given the high cost of HIV treatment.
  • Medicaid eligibility limitations: Prior to the ACA, to qualify for Medicaid in most states, an enrollee had to be both low income and “categorically eligible,” such as being disabled or pregnant, which excluded many low-income adults from coverage. This presented a “catch-22” for many low-income people with HIV who could not qualify for Medicaid until they were already quite sick and disabled, often as a result of advanced HIV and developing AIDS, despite the fact that early access to treatment could help stave off disability and prevent further transmission.4 

Several key provisions of the ACA removed these barriers. These include: eliminating pre-existing conditions exclusions; prohibiting private insurers from denying coverage or charging higher premiums to individuals based on their health status; eliminating annual and lifetime benefits limits; and providing subsidies to assist with purchasing private coverage through the Marketplaces for those between 100% and 400% of the federal poverty level (FPL). In addition, the law required states to expand their Medicaid programs to cover eligible individuals below 138% of FPL, basing eligibility on income and residency status alone and addressing the catch-22 described above. Although a June 2012 US Supreme Court decision effectively made Medicaid expansion a state option, to date, 32 states (including DC) have expanded their programs (where an estimated 60% of people with HIV live).5   Still, the ruling meant that individuals who live in non-expansion states and are below 100% FPL fall into what is known as the “coverage gap” – neither eligible for the Medicaid program nor subsidies to make purchasing coverage through the Marketplaces more affordable. It is estimated that there are over 2.5 million individuals in the coverage gap, including thousands with HIV.6 

To better understand how the ACA has affected coverage for people with HIV, we analyzed data from the CDC’s Medical Monitoring Project (MMP), a surveillance system that produces nationally representative information about people with HIV who are in care.7  Since the MMP currently surveys only individuals in care, data in this report is not representative of all people with HIV in the United States. We compared insurance coverage of people with HIV in care in 2012, before the implementation of major ACA expansion reforms, to 2014 (full methodology in Appendix B). In this analysis we looked at nationwide changes as well as changes within states that expanded Medicaid and those that did not expand.  We also looked at whether the role of the Ryan White Program changed over this period. Since the major coverage reforms under the ACA were implemented in 2014, this data note provides an early glimpse of the insurance changes that have taken place among people with HIV in the ACA era. As was seen across the nation as a whole, it is likely that coverage gains have been greater in the subsequent years.8 

Findings

Nationwide. Medicaid coverage of people with HIV in care increased significantly nationwide, rising from 36% in 2012 to 42% in 2014. The gains in Medicaid coverage were driven by those in Medicaid expansion states in the sample (where the uninsurance rate also dropped – see below).  A similar increase in Medicaid coverage was not seen in non-expansion states. The share who were uninsured or with private coverage did not change significantly overall.

There were also changes for some subgroups, including by income level, race/ethnicity, and gender (detail available in Appendix A). For example, those below 100% FPL saw Medicaid coverage rates rise from 53% in 2012 to 60% in 2014, a group that also saw a decrease in uninsurance rates (falling from 22% in 2012 to 15% in 2014).

Figure 1: Coverage Changes Among People with HIV in Care, Nationwide, 2012-2014

Medicaid Expansion States. In the Medicaid expansion states sampled, Medicaid coverage rose significantly, from 39% in 2012 to 51% in 2014 and the share uninsured decreased from 13% to 7%.9  Significant differences were also observed among subgroups (see Figure 2, additional detail available in Appendix A).
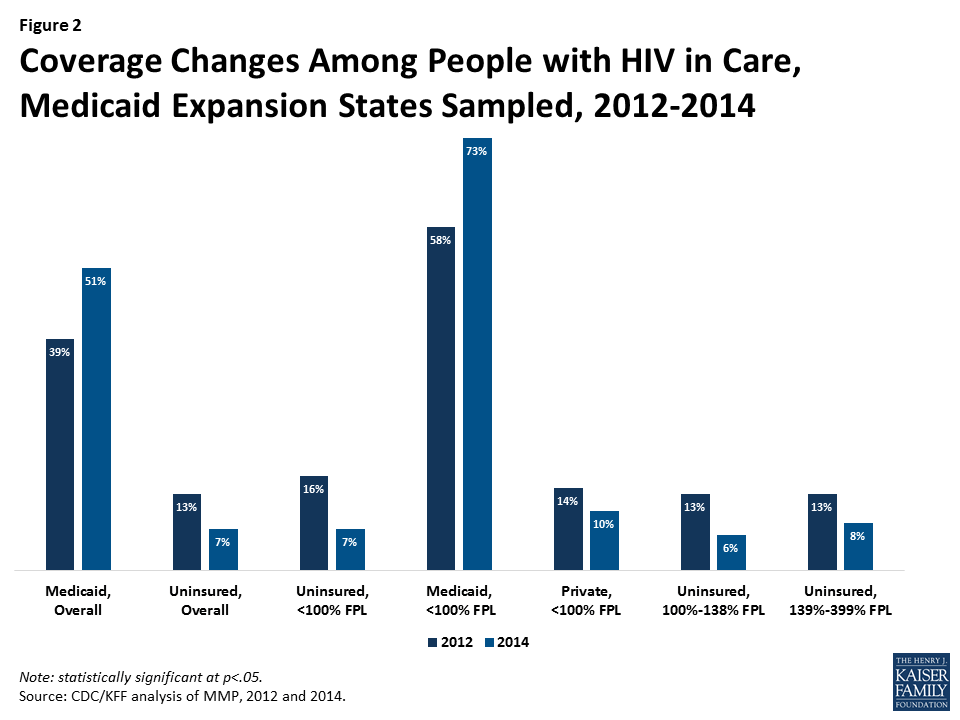
Figure 2: Coverage Changes Among People with HIV in Care, Medicaid Expansion States Sampled, 2012-2014

Non-expansion States. Among the non-expansion states sampled,10  no significant gains in coverage or drops in the share of the  uninsured occurred between 2012 and 2014, though those below 100% FPL saw gains in private insurance, rising from 5% in 2012 to 13% in 2014 (additional detail available in Appendix A).

Figure 3: Changes in Ryan White Reliance Among People with HIV in Care, Nationwide, 2012-2014

Ryan White. The role of the Ryan White Program has increased since implementation of the major coverage reforms under the ACA. Nationwide, the share of people with HIV in care relying on Ryan White rose from 42% in 2012 to 48% in 2014. In particular, the share of those with private insurance relying on the program rose from 23% in 2012 to 38% in 2014. Those with Medicaid also increased their reliance on Ryan White (from 31% in 2012 to 38% in 2014). While the uninsured did not see a significant change in reliance on Ryan White during this period, about 9 in 10 HIV positive uninsured individuals in care were already supported by the program in 2012. Additional coverage changes were observed among some subgroups (see Figure 3, additional detail available in Appendix A).

People with HIV in non-expansion also states saw a significant overall increase in reliance on Ryan White (rising from 42% in 2012 to 55% in 2014) and those with private insurance saw a particularly sharp increase in Ryan White support (rising from 17% to 38% over the same period). In the expansion states sampled, although there was no overall change in reliance on Ryan White, those with private insurance experienced increased reliance on Ryan White support, rising from 27% in 2012 to 39% in 2014.

Discussion

The ACA has played a significant role in increasing insurance coverage for people with HIV through Medicaid expansion. Even though not all states have expanded Medicaid, coverage increases for people with HIV in expansion states drove a nationwide increase. At the same time, there was no significant decrease overall in the share who were uninsured, although this drop was significant in expansion states. This is likely due to the fact that in 2014 53% of people with HIV in non-expansion states had incomes below 100% FPL and fell into the coverage gap11 . Of note, the share relying on Ryan White with Medicaid and private coverage increased, reflecting the program’s significant and growing role in assisting people with HIV who have insurance afford that coverage and providing services that may not be covered such as case management, transportation assistance, and longer more complex provider visits.12 

Overall, this analysis suggests that the ACA has had a significant impact on coverage for people with HIV in the U.S., due to Medicaid expansion. To the extent that ACA repeal efforts include elimination of the Medicaid expansion option for states, most people with HIV who gained coverage would likely lose it unless states adopt alternative approaches to retaining the newly covered population in the program.

Appendix A: Tables

Table 1. Insurance Coverage Changes Among People with HIV, 2012-2014
 Coverage TypeNationwideMedicaid Expansion Non-Medicaid Expansion
201220142012201420122014
Coverage Type, Overall
Uninsured18%14%13%*7%*26%23%
Private31%30%34%29%26%32%
Medicaid36%*42%*39%*51%*31%28%
Coverage Type, by Gender
MaleUninsured19%14%14%*7%*27%24%
Private35%34%37%32%31%36%
Medicaid30%*37%*34%*47%*24%23%
FemaleUninsured 17%* 12%* 11%* 6%* 23% 17%
Private19%20%23%18%15%*23%*
Medicaid52%54%57%65%47%41%
Coverage Type, by Income
<100% FPLUninsured22%*15%*16%*7%*30%26%
Private10%11%14%*10%*5%*13%*
Medicaid53%*60%*58%*72%*47%43%
100-138% FPLUninsured 17% 13% 13%* 6%* 23% 24%
Private17%22%18%18%16%26%
Medicaid45%43%51%56%37%*24%*
139-399% FPLUninsured17%13%13%*8%*23%20%
Private46%48%48%46%43%51%
Medicaid19%21%22%28%15%11%
400%+ FPLUninsured4%7%
Private87%90%87%91%86%89%
Medicaid4%5%
Coverage Type, by Race/Ethnicity
 WhiteUninsured12%*7%*8%*2%*19%16%
Private47%44%49%45%44%44%
Medicaid25%*34%*26%*39%*22%24%
 BlackUninsured21%*14%*13%*5%*29%*22%*
Private21%25%24%19%18%*29%*
Medicaid47%48%52%*63%*42%35%
HispanicUninsured25%22%24%*17%*26%30%
Private22%21%23%19%20%24%
Medicaid32%39%41%*52%*17%17%
* Indicates coverage changes statistically significant at p<.05

Note: Medicaid expansion and non-Medicaid expansion data only representative of states sampled and are not generalizable to all states with that expansion decision. Medicaid expansion states sampled are DE, IL, IN, MI, NJ, NY, OR, PA, WA, and CA. The non-expansion states sampled are FL, GA, MS, NC, VA, and TX.

Table 2. Ryan White Coverage Changes Among People with HIV, 2012-2014
Coverage TypeNationwideMedicaid ExpansionNon-Medicaid Expansion
201220142012201420122014
Coverage Type, Overall
Uninsured88%91%90%88%87%92%
Private23%*38%*27%*39%*17%*38%*
Medicaid31%*38%*32%36%30%42%
Total42%*48%*42%43%42%*55%*
Coverage Type, by Gender
MaleUninsured89%90%91%88%87%91%
Private23%*38%*28%*38%*15%*38%*
Medicaid36%*43%*37%42%33%47%
FemaleUninsured89%91%85%86%91%93%
Private23%*39%*23%*46%*23%34%
Medicaid24%27%23%23%25%34%
Coverage Type, by Income
<100% FPLUninsured88%92%88%87%89%93%
Private33%*56%*31%*52%*40%*60%*
Medicaid28%34%29%31%26%*42%*
100-138% FPLUninsured87%87%86%84%87%88%
Private44%61%45%*75%*43%47%
Medicaid36%*49%*36%*51%*35%41%
139-399% FPLUninsured92%89%94%88%89%90%
Private31%*45%*37%*49%*21%*41%*
Medicaid44%50%46%53%42%
400%+ FPLUninsured83%100%100%100%73%100%
Private8%9%12%11%
Medicaid44%50%
Coverage Type, by Race/Ethnicity
 WhiteUninsured91%90%91%*70%*91%*96%*
Private21%*35%*26%*36%*33%
Medicaid40%*54%*41%53%58%
 BlackUninsured87%87%87%79%88%89%
Private25%*41%*28%*40%*21%*42%*
Medicaid29%33%30%29%27%39%
HispanicUninsured87%*95%*93%94%79%*95%*
Private24%*40%*25%*45%*23%34%
Medicaid27%30%26%29%38%
* Indicates coverage changes statistically significant at p<.05Note: Medicaid expansion and non-Medicaid expansion data only representative of states sampled and are not generalizable to all states with that expansion decision. Medicaid expansion and non-Medicaid expansion data only representative of states sampled and are not generalizable to all states with that expansion decision. Medicaid expansion states sampled are DE, IL, IN, MI, NJ, NY, OR, PA, WA, and CA. The non-expansion states sampled are FL, GA, MS, NC, VA, and TX. 

Appendix B: Methods

DATA SOURCE:

This analysis relies on data from the Medical Monitoring Project (MMP), a CDC surveillance system designed to produce nationally representative estimates of behavioral and clinical characteristics of HIV-infected adults (those aged 18 and older) in the United States.13  During 2009–2014, MMP employed a three-stage, complex sampling design in which US states and territories were sampled, followed by facilities providing outpatient HIV clinical care in those jurisdictions, and then HIV-infected adults (aged 18 years and older) receiving care in those facilities. We used MMP data collected from adults with at least one HIV clinical care visit to participating facilities during January to April of 2013 and 2014. Findings describe adults receiving HIV clinical care during these time periods.

Data used in this analysis were collected via face-to-face interviews and medical record abstractions between June 1, 2012 and May 31, 2013 for the 2012 cycle and June 1, 2014 and May 31, 2015 for the 2014 cycle. All sampled states and territories participated in MMP. In 2012, of 548 sampled facilities within these states or territories, 467 participated in MMP (facility response rate 85%), and of 9,394 sampled persons, 4,901 completed both an interview and a linked medical record abstraction (adjusted patient-level response rate 53%)%.14  In 2014, of 561 sampled facilities within these states or territories, 485 participated in MMP (facility response rate 86%), and of 9,400 sampled persons, 5,154 completed both an interview and a linked medical record abstraction (adjusted patient-level response rate 56%).15   Data were weighted based on known probabilities of selection at state or territory, facility, and patient levels. In addition, data were weighted to adjust for non-response using predictors of patient-level response. Although characteristics associated with nonresponse varied over time, the following characteristics were generally associated with nonresponse and informed weighting classes: facility size, private practice, younger age, black and Hispanic race, and shorter time since HIV diagnosis. This analysis includes information on 4,901 participants in 2012 and 5,154 in 2014 who represent all HIV positive individuals receiving care in the United States and Puerto Rico during the time in which they were sampled.

ANALYSIS:

For all respondents in MMP, we examined self-reported insurance coverage as well as payment source for antiretroviral medicines using responses to the following questions “During the past 12 months, what were all the kinds of health insurance or health coverage you had?” and “During the past 12 months, what were the ways your antiretroviral medicines were paid for?”  Response options included insurance programs (Medicaid, Medicare, private insurance, Veteran’s Administration, Tricare or CHAMPUS coverage, other public insurance, and other unspecified insurance) as well as medical care, medications and other services paid for by the Ryan White HIV/AIDS Program (Ryan White or the AIDS Drug Assistance Program). “Other specify” responses were extensively recoded to reflect the most accurate coverage type when possible. It is important to note that patients may not be aware of all the services they receive that are paid for by the Ryan White HIV/AIDS Program (the program provides funding directly to service organizations in many cases) and therefore, the estimates of the number of individuals who receive Ryan White HIV/AIDS Program services is likely an underestimate.

We estimated weighted percentages of individuals with the following types of health care coverage: no coverage (uninsured), private insurance, Medicaid, Medicare, and other (specified). Because respondents in MMP may indicate more than one type of coverage, we relied on a hierarchy to group people into mutually-exclusive coverage categories. Specifically, the hierarchy groups people into coverage types in the following order:

  • Private coverage
  • Medicaid coverage, including those dually eligible for Medicare
  • Medicare coverage only
  • Other public coverage, including Tricare/CHAMPUS, Veteran’s Administration, or city/county coverage

In most cases, this hierarchy classifies individuals according to the coverage source that serves as their primary payer. People who do not report any of the sources of insurance coverage above are classified as uninsured.  As noted above, we separately assess weighted percentages of persons receiving assistance through the Ryan White HIV/AIDS Program by health coverage type. This analysis depicts coverage for those who are uninsured, covered by private insurance, or covered by Medicaid. Findings related to those with other coverage or Medicare were excluded from this analysis given that insurance changes within those categories would not have been impacted by the ACA provisions examined for this work.

We assessed distributions of health coverage type in 2012 compared to 2014, overall and by whether the participant lived in a Medicaid expansion or non-Medicaid expansion state (as of 2014). We further stratified the analysis to examine health coverage types by income, race/ethnicity, and gender. Income is presented as a share of the federal poverty level (FPL); race/ethnicity, and gender was self-reported. Statistical comparisons between the percentage of the population with a particular health coverage type and the percentage receiving Ryan White HIV/AIDS Program assistance in 2012 compared to 2014 were made using chi-square tests.

LIMITATIONS:

MMP is nationally representative only of those with HIV who are in care and does not include those who are diagnosed but not in care or those not yet diagnosed. (MMP is now including those who are diagnosed but not in care in the sample and that data will be available in the future).

MMP only allows for extrapolation to the national level when using the full sample. However, similar extrapolation is not possible when examining coverage changes in and contrasting Medicaid expansion states and non-expansion states. The Medicaid expansion and non-expansion coverage data presented here are representative only of the subset of states sampled that fell into each group.16 

It is also important to note that these data reflect only the first two open enrollment periods of the ACA and therefore it is possible that coverage has continued to increase (as it has for the U.S. population overall).

The MMP categorized gender as male, female, or transgender based on self-identification. Participants are also classified as transgender if reported sex at birth and current reported gender differ. Findings by gender are presented only by male and female categories in this analysis due to the limited sample size of transgender individuals and the fact that no coverage changes among this population met statistical significance.

  1. CDC, special data request, October 16, 2013 and Bradley H, Prejean J, Dawson L, Kates, J, Shouse RL. Health care coverage and viral suppression pre- and post-ACA implementation. Poster (#1012) presented at: the Conference on Retroviruses and Opportunistic Infections (CROI) 2017; February 14, 2017; Seattle, WA. ↩︎
  2. A subset of the data presented here was also released at the 2017 annual Conference on Retroviruses and Opportunistic Infections (CROI) in February 2017. ↩︎
  3. Claxton, G., et al. Kaiser Family Foundation. Pre-existing Conditions and Medical Underwriting in the Individual Insurance Market Prior to the ACA. December 2016. Available at: https://modern.kff.org/health-reform/issue-brief/pre-existing-conditions-and-medical-underwriting-in-the-individual-insurance-market-prior-to-the-aca/ ↩︎
  4. Department of Health and Human Services, Panel on Antiretroviral Guidelines for Adults and Adolescents (2013). Guidelines for the use of antiretroviral agents in HIV-1-infected adults and adolescents, July 14, 2016. Available at: http://aidsinfo.nih.gov/guidelines/html/1/adult-and-adolescent-treatment-guidelines/0/. ↩︎
  5. Kaiser Family Foundation analysis of CDC surveillance data. ↩︎
  6. Kaiser Family foundation. State Health Facts. Characteristics of Poor Uninsured Nonelderly Adults in the ACA Coverage Gap. Available at: https://modern.kff.org/health-reform/state-indicator/characteristics-of-poor-uninsured-nonelderly-adults-in-the-aca-coverage-gap/?currentTimeframe=0 and Dept. of Health and Human Service. ASPE Issue Brief. Health Insurance Marketplace Enrollment Projections for 2017. October 2016. Available at: https://aspe.hhs.gov/sites/default/files/pdf/211056/EnrollmentProjections.pdf ↩︎
  7. For the 2014 data, MMP only collected information on those in care. The MMP is now including those who are diagnosed but not in care in the sample and that data will be available in the future ↩︎
  8. See for example: Kaiser Family Foundation. State Health Facts. Health Insurance Coverage of the Total Population, 2013-2015. https://modern.kff.org/other/state-indicator/total-population/?currentTimeframe=0 ↩︎
  9. The Medicaid expansion states sampled by the MMP are Delaware, Illinois, Indiana, Michigan, New Jersey, New York, Oregon, Pennsylvania, Washington and California. ↩︎
  10. The non-expansion states sampled by the MMP are Florida, Georgia, Mississippi, North Carolina, Virginia and Texas. ↩︎
  11. Kates, J., et al. Kaiser Family Foundation. Assessing the Impact of the Affordable Care Act on Health Insurance Coverage of People with HIV. January 2014. https://modern.kff.org/hivaids/issue-brief/assessing-the-impact-of-the-affordable-care-act-on-health-insurance-coverage-of-people-with-hiv/view/footnotes/#footnote-97557-6 ↩︎
  12. See for example: Dawson, L. and Kates, J. Kaiser Family Foundation. The Ryan White Program and Insurance Purchasing in the ACA Era: An Early Look at Five States. April 2015. Available at: https://modern.kff.org/hivaids/issue-brief/the-ryan-white-program-and-insurance-purchasing-in-the-aca-era/ ↩︎
  13. An Institute of Medicine report commissioned by the White House recommended MMP to help identify data sources for monitoring the effects of the Affordable Care Act (ACA) on HIV care and coverage in the United States. See: IOM (Institute of Medicine). 2012. Monitoring HIV care in the United States: A strategy for generating national estimates of HIV care and coverage. Washington, DC: The National Academies Press. ↩︎
  14. Centers for Disease Control and Prevention. Behavioral and Clinical Characteristics of Persons Receiving Medical Care for HIV Infection—Medical Monitoring Project, United States, 2014 Cycle (June 2014–May 2015). HIV Surveillance Special Report 17. December 2016. Available at: https://www.cdc.gov/hiv/pdf/library/reports/surveillance/cdc-hiv-hssr-mmp-2014.pdf. ↩︎
  15. Centers for Disease Control and Prevention. Behavioral and Clinical Characteristics of Persons Receiving Medical Care for HIV Infection—Medical Monitoring Project, United States, 2012. HIV Surveillance Special Report 12. August 2015. Available at: https://www.cdc.gov/hiv/pdf/library/reports/surveillance/cdc-hiv-hssr-mmp-2014.pdf ↩︎
  16. The Medicaid expansion states sampled by the MMP are Delaware, Illinois, Indiana, Michigan, New Jersey, New York, Oregon, Pennsylvania, Washington and California. The non-expansion states sampled by the MMP are Florida, Georgia, Mississippi, North Carolina, Virginia and Texas. ↩︎
News Release

ACA Medicaid Expansion Drove Nationwide Increase in Health Coverage for People with HIV, First National Analysis Finds

Published: Feb 14, 2017

As Congress moves to repeal the Affordable Care Act, a new analysis from the Kaiser Family Foundation provides the first national estimates of changes in health coverage for people with HIV since the law was implemented. It finds that rolling back the law’s Medicaid expansion could significantly impact coverage for people with HIV.

Nationwide, Medicaid coverage for people with HIV in care rose six percentage points between 2012 to 2014, when ACA coverage expansions took effect, the analysis finds. That increase was largely driven by states that expanded Medicaid, where Medicaid coverage rose by 12 percentage points over the same period. Those in Medicaid expansion states also saw the share of people with HIV who are uninsured drop from 13 percent to 7 percent. States that did not expand Medicaid saw no significant changes in coverage for people with HIV during this time.

The analysis also finds that an increasing share of people with HIV in care rely on the Ryan White HIV/AIDS Program, rising from 42 percent in 2012 to 48 percent in 2014. Ryan White reliance for those with private insurance increased by 15 percentage points, and by 7 percentage points for those with Medicaid, demonstrating the ongoing role of the program in the ACA era

News Release

Do You Have the Facts About Medicare’s Financial Outlook for the Future?

Published: Feb 2, 2017

Medicare is likely to be back on the federal policy agenda this year as Congress and President Trump pursue repealing and replacing the Affordable Care Act, and potentially consider options to reduce federal spending. When talking about Medicare, the nation’s federal health insurance program for 57 million people age 65 and over and younger people with disabilities, some policymakers often express concern that the program will soon be “bankrupt” and that rising spending is unsustainable.

A new issue brief from the Kaiser Family Foundation looks at 10 essential facts about Medicare’s financial outlook that can help provide context for ongoing policy debates about Medicare’s future. Medicare’s financial status has improved since the enactment of the Affordable Care Act in 2010, though the program faces long-term financial pressures associated with higher health care costs and an aging population. Key highlights from the new brief include:

  • Medicare is not “going broke” even though it does face long-term financial challenges.
  •  The ACA helped to reduce Medicare spending growth and a full repeal of the law would increase Medicare spending by more than $800 billion over 10 years.
  • Net Medicare spending was $588 billion in 2016, about 15 percent of the federal budget, and is expected to rise to nearly 18 percent of the budget in a decade.
  • Spending on Part D prescription drug coverage is expected to grow faster than spending on any other Medicare-covered benefits over the next decade

10 Essential Facts About Medicare’s Financial Outlook

Published: Feb 2, 2017

Medicare, the nation’s federal health insurance program for 57 million people age 65 and over and younger people with disabilities, often plays a major role in federal health policy and budget discussions. This was the case in discussions leading up to enactment of the Affordable Care Act (ACA), which, in addition to expanding health insurance coverage, included changes to Medicare that reduced program spending. Medicare is likely to be back on the federal policy agenda as Congress debates repealing and replacing the ACA, and also if policymakers turn their attention to reducing entitlement spending as part of efforts to reduce the growing federal budget deficit and debt.

By many measures, Medicare’s financial status has improved since the ACA passed in 2010, and repealing the ACA’s provisions related to Medicare would increase program spending and worsen the financial outlook for the program. But even if the Medicare savings and revenue provisions in the ACA are retained, Medicare faces long-term financial pressures associated with higher health care costs and an aging population. To sustain Medicare for the long run, policymakers may need to consider additional program changes to modify program revenues, benefits, spending, and financing.

This brief presents 10 facts and figures about Medicare’s financial status today and the outlook for the future.

1. Medicare isn’t “going broke” even though it does face financial challenges.

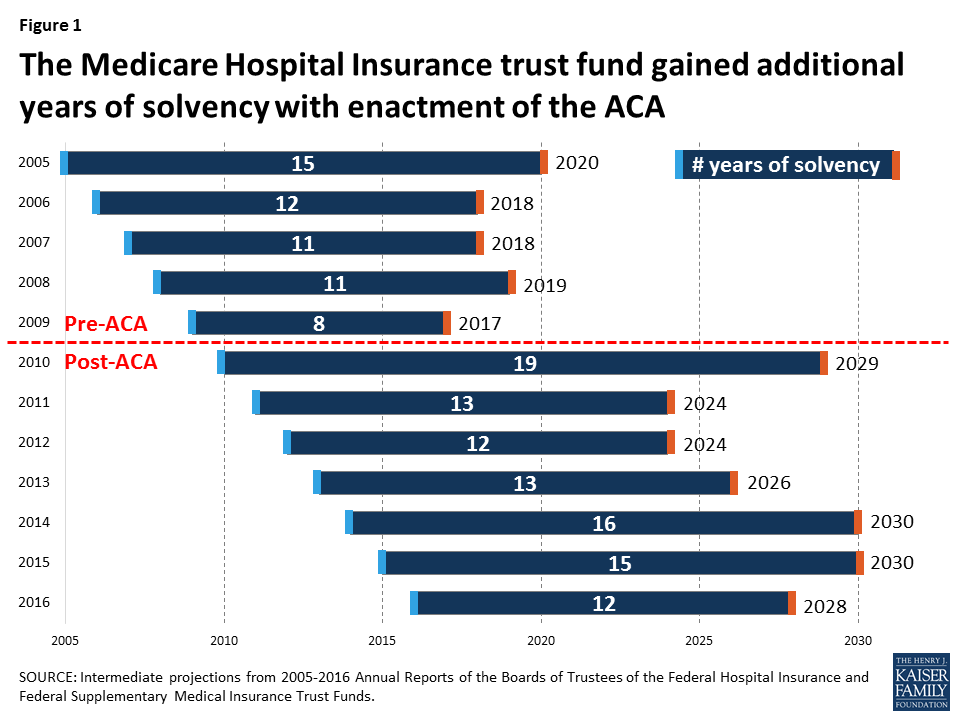
When some policymakers talk about Medicare as being “bankrupt” or “going broke” they are referring to the status (or “solvency”) of Medicare’s Hospital Insurance (Part A) trust fund, out of which beneficiaries’ hospital bills are paid. When spending on benefits exceeds revenues (primarily payroll taxes), and assets in the trust fund account are fully depleted, Medicare will not have sufficient funds to pay all Part A benefits. Currently, Medicare’s actuaries estimate that there will be sufficient funds available to pay for hospital insurance benefits in full until 2028 (Figure 1). At that point, Medicare will be able to cover 87% of costs covered under Part A through payroll tax revenues—but the Medicare program will not cease to operate.

Figure 1: The Medicare Hospital Insurance trust fund gained additional years of solvency with enactment of the ACA

2. The aging of the U.S. population, along with higher health care costs, are contributing to the growth in Medicare spending over time.

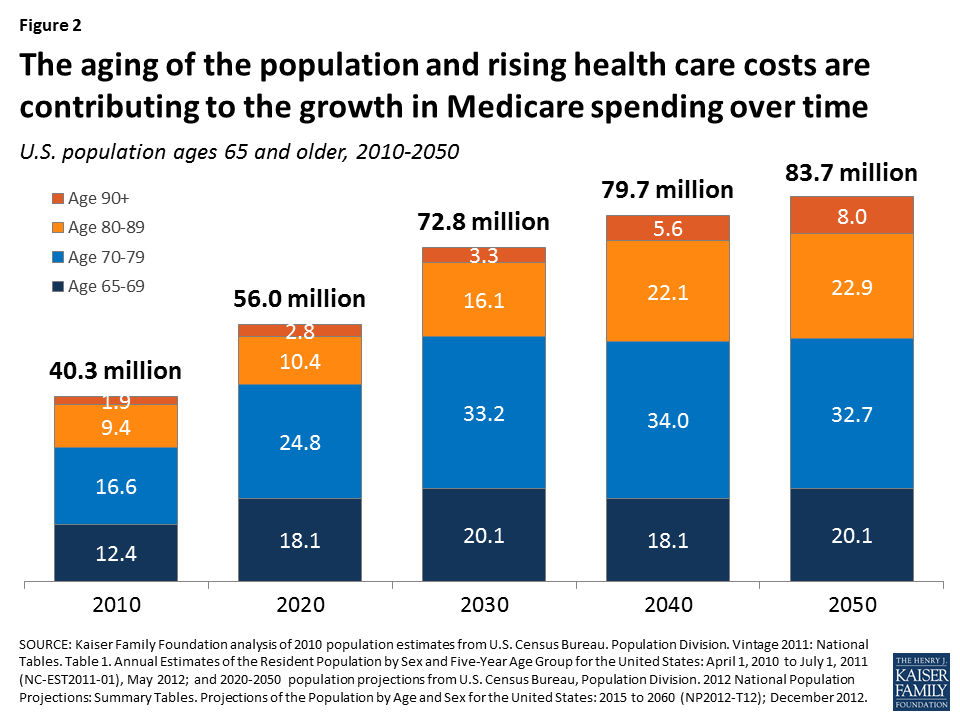
Between 2010 and 2050, the population ages 65 and older will double, from about 40 million to 84 million people. The number of people ages 80 and older will nearly triple over these years from about 11 million to about 31 million, while the number of people in their 90s and 100s is projected to quadruple from 2 million to 8 million by 2050 (Figure 2). Because Medicare per capita spending rises with age and people age 80 and over account for a disproportionate share of Medicare spending, their higher numbers will place upward pressure on both total and per capita Medicare spending.

Figure 2: The aging of the population and rising health care costs are contributing to the growth in Medicare spending over time

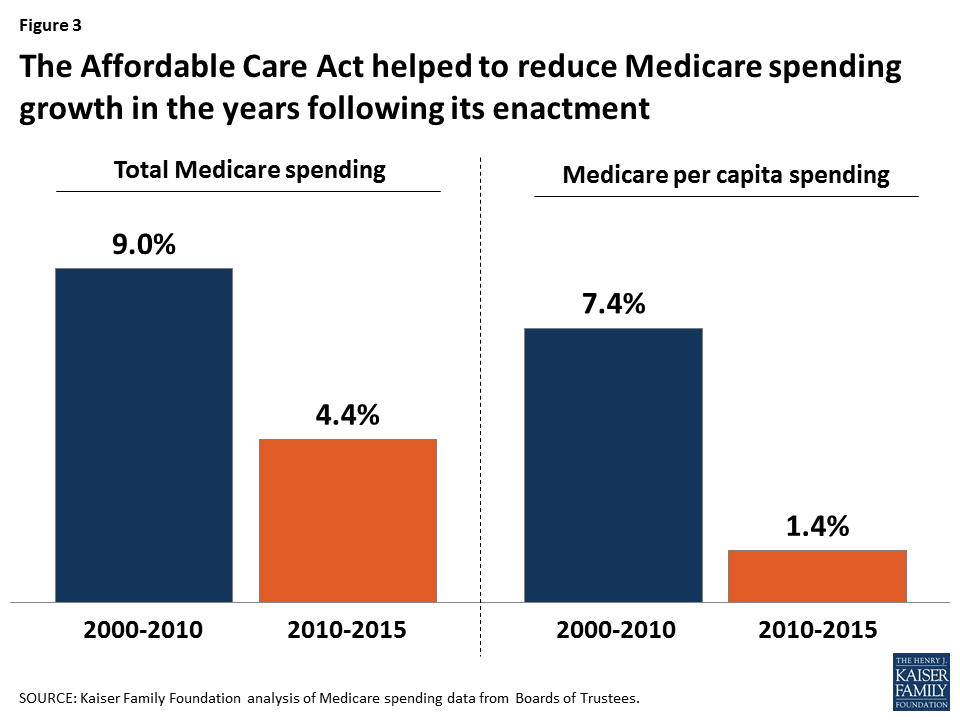
3. The ACA helped to reduce Medicare spending growth in the years following its enactment.

With provisions in the ACA to reduce Medicare payments to providers and Medicare Advantage plans and bring in additional revenues, Medicare total and per capita spending growth rate has been lower in recent years than in the decade prior to ACA. The overall program spending growth rate fell from 9.0% between 2000 and 2010 to 4.4% between 2010 and 2015, even as the baby boom generation started aging onto Medicare beginning in 2011. Average annual growth in spending per beneficiary averaged 1.4% between 2010 and 2015, down from 7.4% between 2000 and 2010 (Figure 3).

Figure 3: The Affordable Care Act helped to reduce Medicare spending growth in the years following its enactment

4. Repealing the ACA, including all Medicare provisions, would increase Medicare spending.

According to CBO, repealing the ACA in its entirely would add $802 billion to Medicare spending over 10 years (Figure 4). Medicare spending would rise primarily as a result of repealing the ACA’s reductions to payments to providers and Medicare Advantage plans. An increase in Medicare spending would likely lead to higher premiums, deductibles, and cost sharing for beneficiaries, and would accelerate the projected insolvency date of the Medicare Hospital Insurance trust fund.

Figure 4: Repealing the ACA would increase Medicare spending by more than $800 billion over 10 years

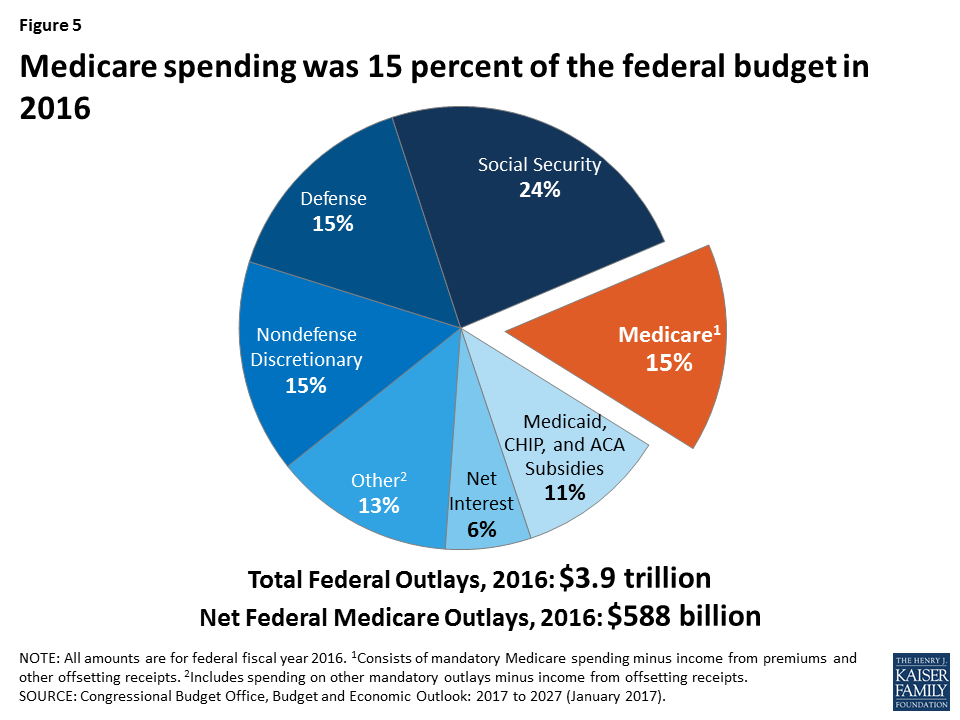
5. Medicare spending was 15 percent of the federal budget in 2016.

Net Medicare spending in 2016 (that is, spending on benefits minus premiums from beneficiaries and other receipts) was $588 billion. This represents 15% of the $3.9 trillion federal budget that year, or $1 out of every $7 in federal spending (Figure 5).

Figure 5: Medicare spending was 15 percent of the federal budget in 2016

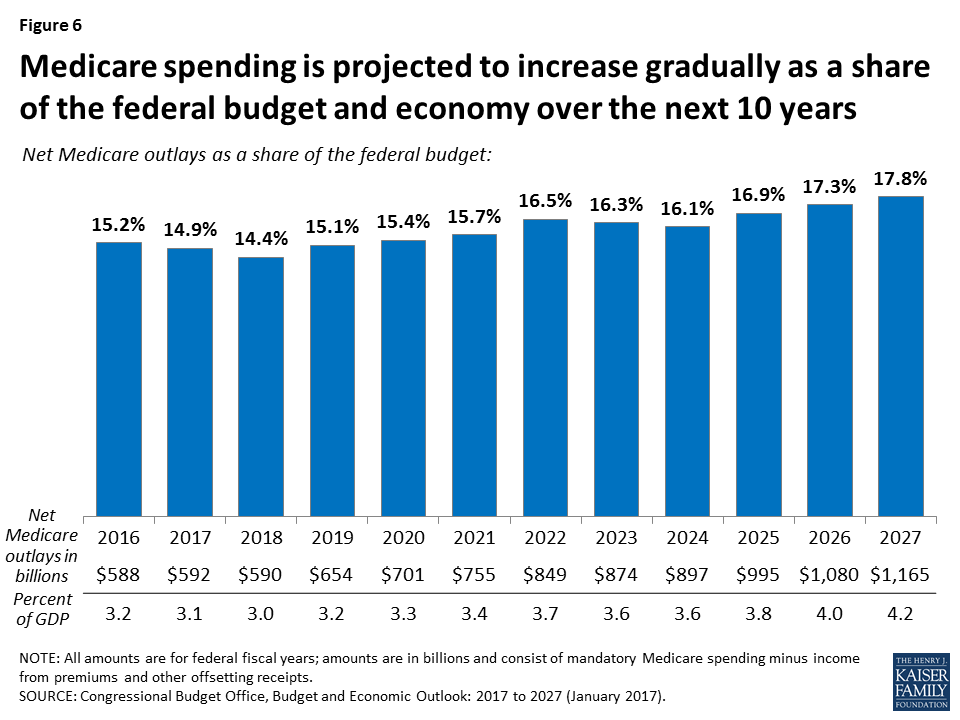
6. Medicare spending is projected to increase gradually as a share of the federal budget and the nation’s economy over the next 10 years.

In 2027, Medicare spending will account for 18% of the federal budget—or $1 out of every $6 in federal spending—and 4.2% of the economy (Figure 6). Between 2017 and 2027, net Medicare spending will nearly double, from $592 billion to $1.2 trillion.

Figure 6: Medicare spending is projected to increase gradually as a share of the federal budget and economy over the next 10 years

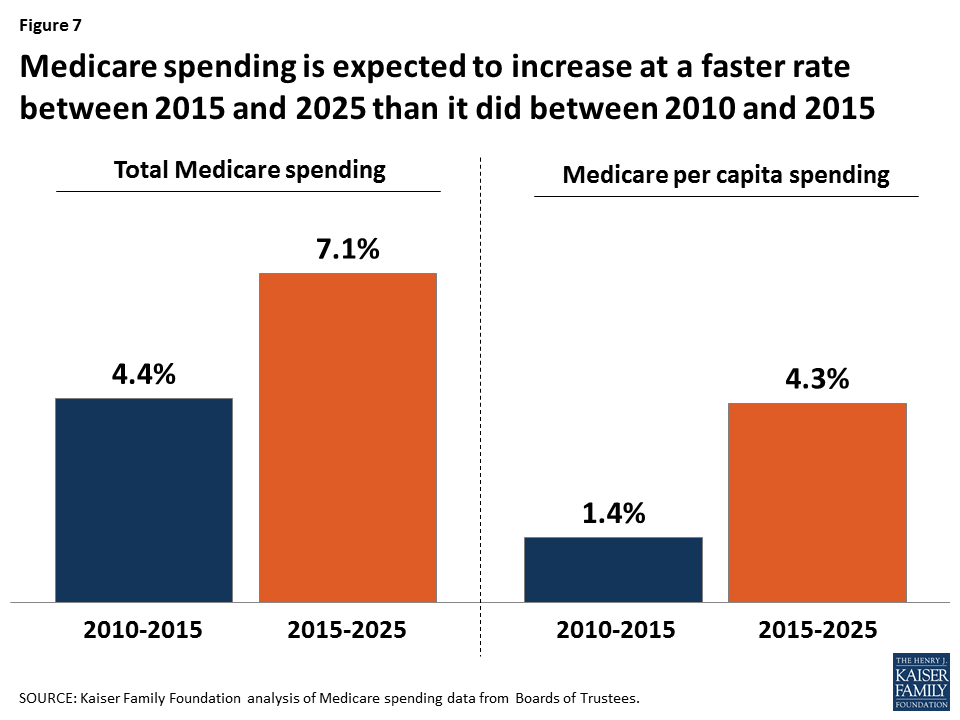
7. Medicare spending is projected to increase at a faster rate in the coming years than in the five years following enactment of the ACA.

Average annual growth in total Medicare spending is projected to be 7.1% between 2015 and 2025, faster than the 4.4% average annual growth rate between 2010 and 2015 (Figure 7). On a per capita basis, Medicare spending is expected to grow at an average annual rate of 4.3% between 2015 and 2025, faster than the 1.4% growth rate between 2010 and 2015.

Figure 7: Medicare spending is expected to increase at a faster rate between 2015 and 2025 than it did between 2010 and 2015

8. Spending on Part D prescription drug coverage is expected to grow faster than spending on other Medicare-covered benefits over the next 10 years.

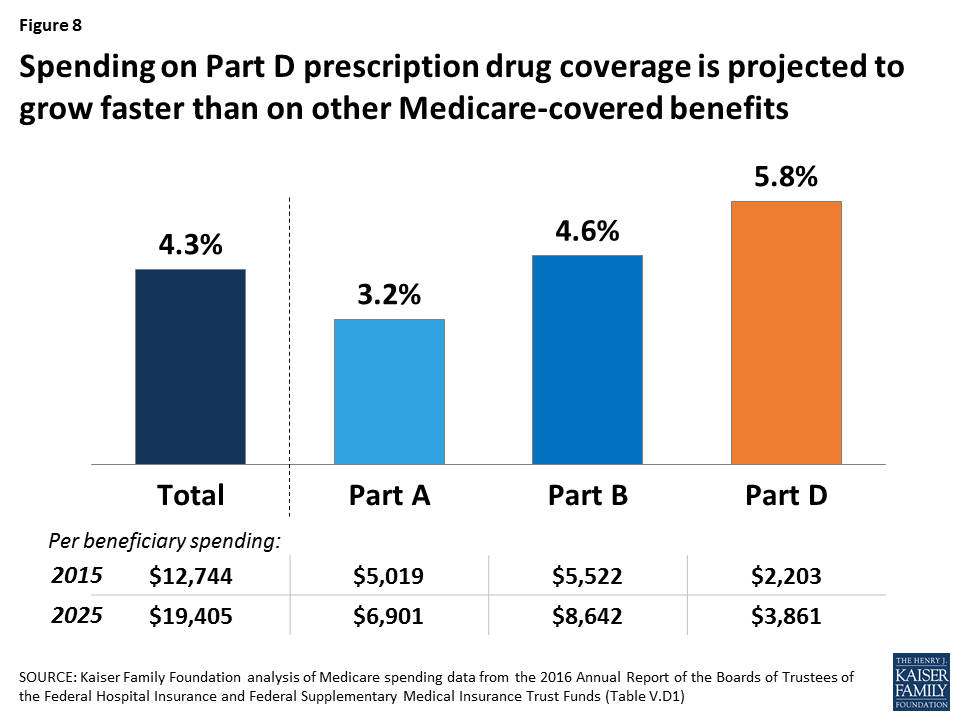
Rising spending on prescription drugs poses a challenge for Medicare. Medicare’s actuaries project a comparatively higher per capita growth rate in the coming years for Part D than for the other parts of the program. Between 2015 and 2025, per capita spending growth is projected to be 5.8% for Part D, compared to 3.2% for Part A, which covers hospital benefits, and 4.6% for Part B, which covers physician and outpatient services (Figure 8). The faster growth rate expected for Part D spending is primarily due to higher costs associated with expensive specialty drugs.

Figure 8: Spending on Part D prescription drug coverage is projected to grow faster than on other Medicare-covered benefits

9. Medicare spending is projected to increase as a share of the economy over the long run, but the ACA helped to moderate the long-range projections.

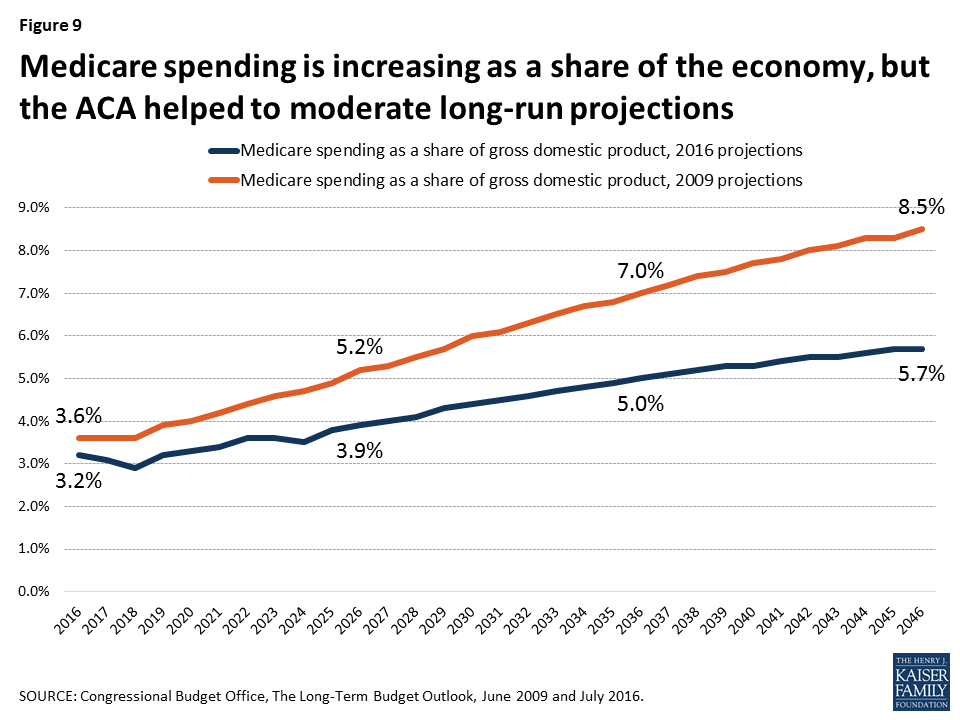
According to CBO’s most recent long-term projections, net Medicare spending will grow from 3.2% of GDP in 2016 to 5.7% in 2046 (Figure 9). Prior to the ACA, Medicare spending was projected to grow more rapidly as a share of the nation’s economy, reaching 8.5% by 2046.

Figure 9: Medicare spending is increasing as a share of the economy, but the ACA helped to moderate long-run projections

10. Medicare benefits are funded mainly by a combination of general revenues, payroll taxes, and premiums paid by beneficiaries.

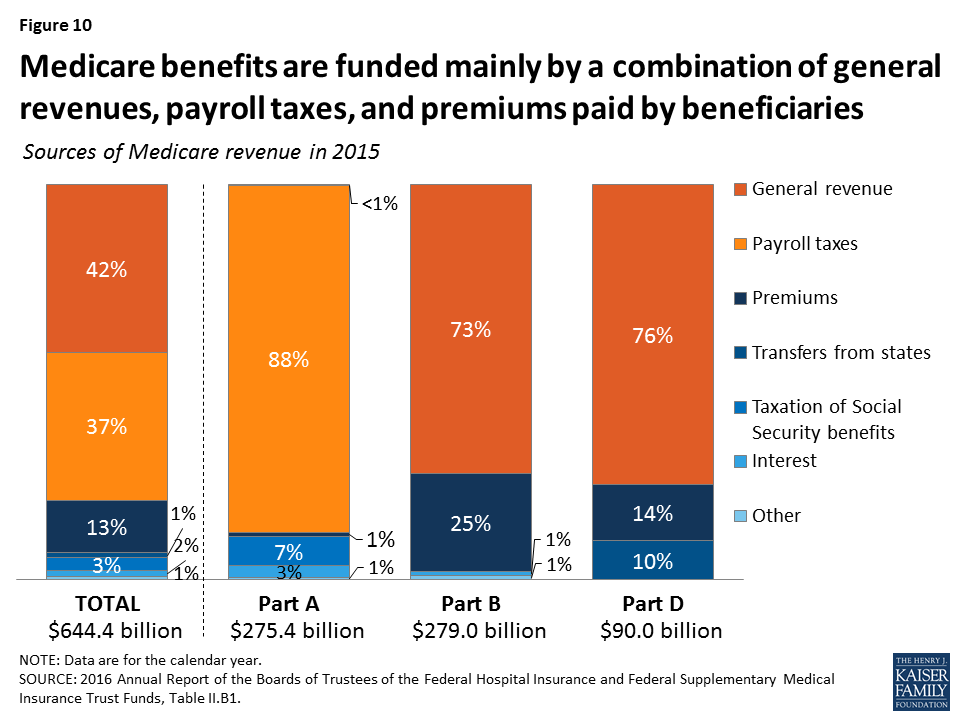
The Hospital Insurance (Part A) trust fund is only one part of Medicare, and therefore only one part of Medicare’s financial picture. While Part A is funded primarily by payroll taxes, benefits for Part B physician services and Part D prescription drugs are paid for separately through a combination of general revenues and beneficiary premiums (Figure 10). Because the revenues needed to fund Part B and Part D program costs are set each year in advance, the trust fund for these parts of Medicare does not face a funding shortfall at any point in the future. But higher projected spending for benefits covered under Part B and Part D will increase the amount of general revenue funding and beneficiary premiums required to cover costs for these parts of the program in the future.

Figure 10: Medicare benefits are funded mainly by a combination of general revenues, payroll taxes, and premiums paid by beneficiaries
News Release

Early Implementation Experience of Medicaid Expansion Waivers in Michigan and Indiana Can Help Inform Future Medicaid Waivers

Published: Jan 31, 2017

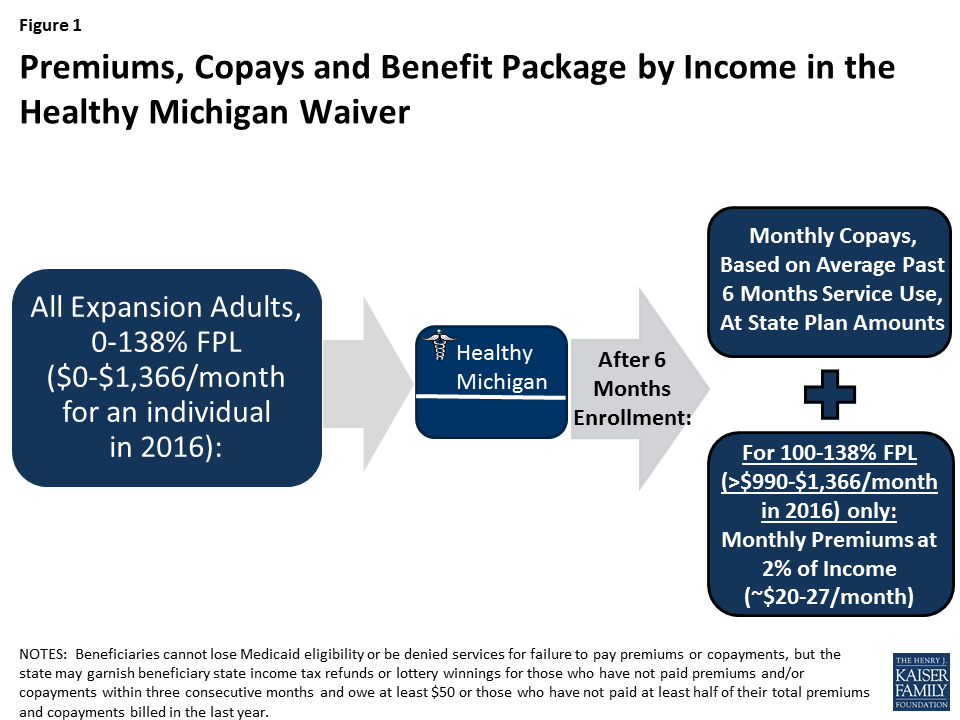
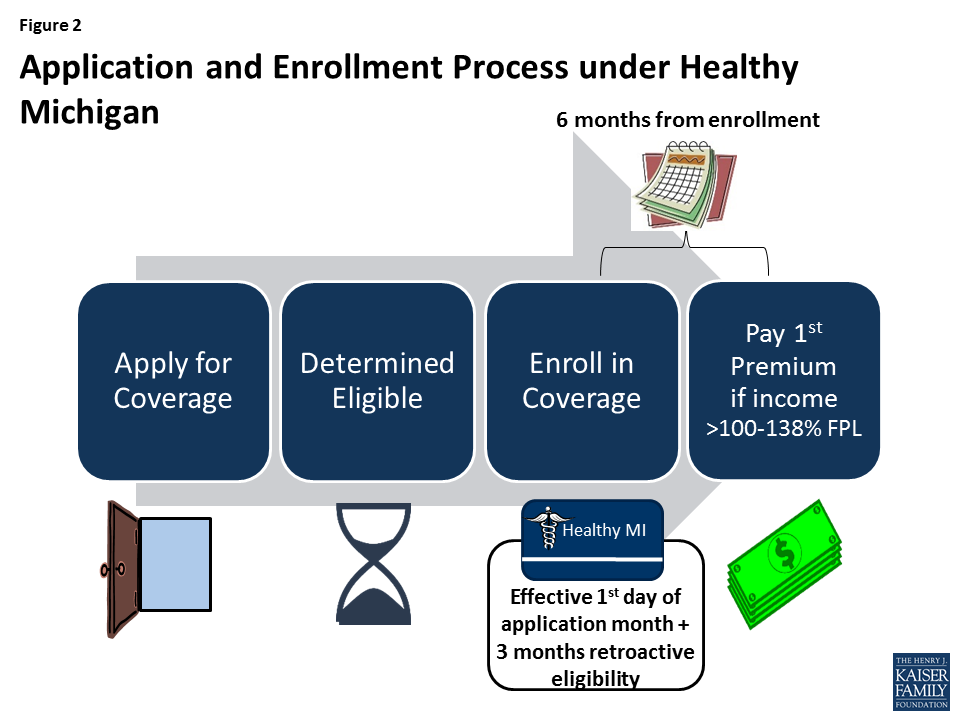
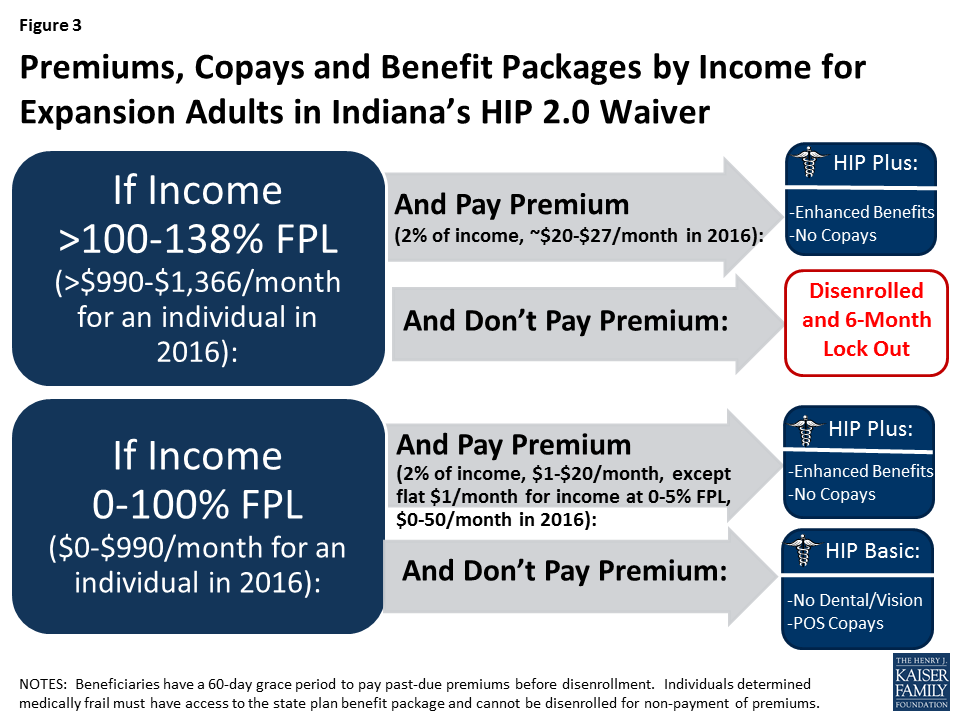
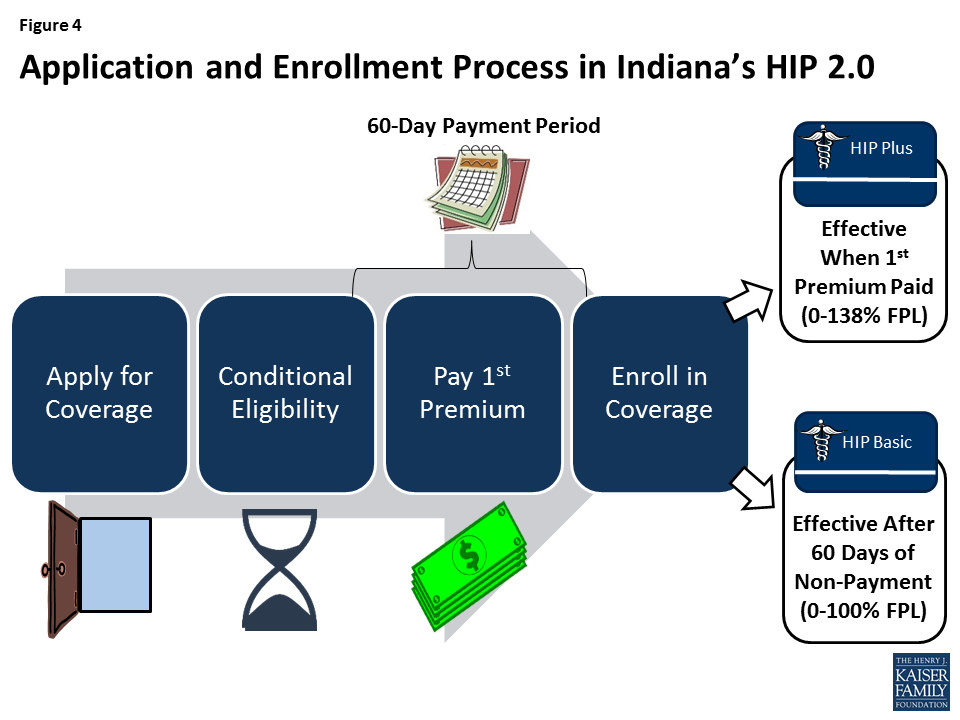
Michigan and Indiana, led by Republican governors, each obtained a waiver from the Obama Administration to expand Medicaid in ways that differ from the terms of the Affordable Care Act. Notably, both states’ expansions include provisions related to charging enrollees premiums, requiring them to contribute to health accounts and providing incentives to participate in healthy behavior programs, though the details and implementation vary considerably between the two states.

A new analysis from the Kaiser Family Foundation explains the key components of Michigan and Indiana’s waivers and presents insights based on their early implementation experiences. Although the future of the ACA and the role of Section 1115 Demonstration waivers is unclear, the Medicaid expansion experience in Indiana and Michigan may provide information for other states that want to consider similar concepts.

Key insights from the new analysis include:

  • Medicaid expansion design, whether through state plan authority or waivers, is highly dependent on the features of a state’s underlying Medicaid program.
  • Implementation of complex programs involves collaboration with a variety of stakeholders, sophisticated IT systems, and administrative costs.
  • Premium costs and complex enrollment policies can deter eligible people from enrolling in Medicaid coverage.
  • Health accounts can be confusing for beneficiaries.
  • Beneficiary and provider education and tangible incentives appear central to implementing healthy behavior incentive programs.

The analysis also notes that it’s too early to determine whether health accounts and healthy behavior incentives can change beneficiaries’ behavior, lead to more efficient use of health care services and improve health outcomes.

The findings are based on 22 in person and telephone interviews with state officials, providers, health plans, beneficiary advocates and enrollment assisters in Michigan and Indiana, as well as four focus groups (two in each states) with beneficiaries enrolled in Medicaid waiver coverage. The analysis also incorporates data and reports from the states’ Medicaid agencies and other publicly available sources.

News Release

Key Questions About Medicaid Block Grants

Published: Jan 31, 2017

As policymakers in Washington discuss Affordable Care Act repeal and a possible block grant for Medicaid, a new issue brief from the Kaiser Family Foundation lays out key questions to consider in restructuring federal financing of the nation’s health insurance program for low-income Americans.

Capping federal funding for Medicaid through a block grant or a per capita cap financing system would make federal spending more predictable and achieve federal budget savings. It also could be structured to give states greater flexibility in how they operate their Medicaid programs, eliminate the entitlement to coverage, reduce federal Medicaid spending and shift costs to states, which would also affect beneficiaries and providers. A cap on federal spending would render state Medicaid programs less responsive to changes in demand, economic circumstances and medical costs.

The new brief explains how a per capita cap or block grant system would work as well as the details needed to evaluate any policy proposals and implications of restructuring Medicaid’s financing. It also examines the implications of shifting to such a system.

Also available is a new brief that provides an understanding of current federal standards for Medicaid eligibility and benefits as well as options for state flexibility in how the program is run today, which provides important context for ongoing policy debates in Washington.

Medicaid Section 1115 Managed Long-Term Services and Supports Waivers: A Survey of Enrollment, Spending, and Program Policies

Authors: Molly O'Malley Watts, MaryBeth Musumeci, and Petry Ubri
Published: Jan 31, 2017

Executive Summary

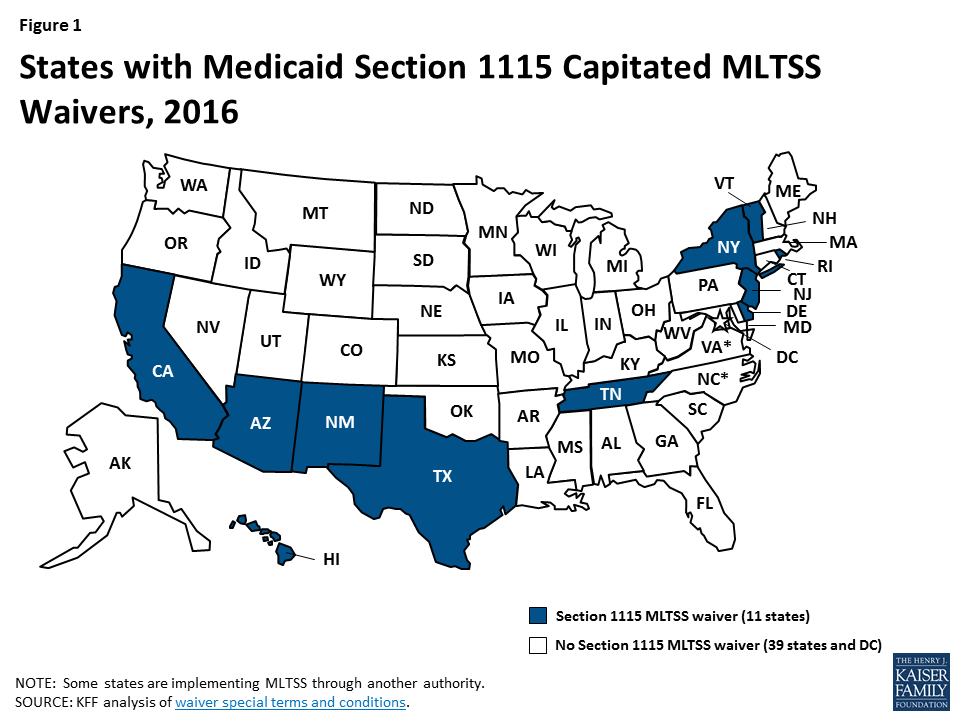
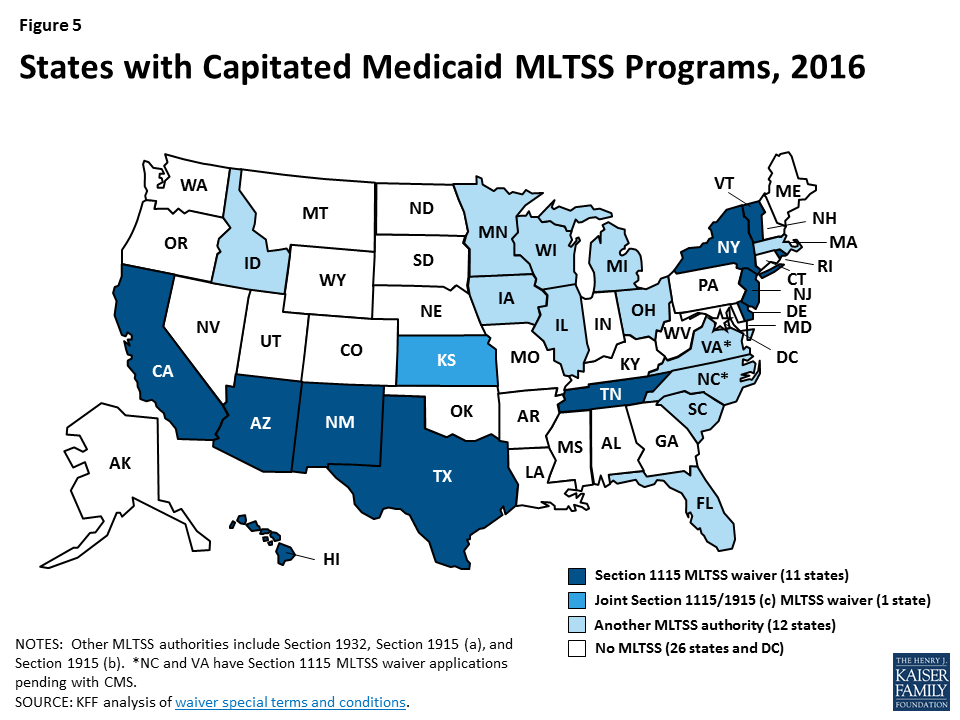
Medicaid fills a gap by covering long-term services and supports that are largely unavailable through private insurance or Medicare. These services play an important role in helping seniors and people with a variety of physical, cognitive, and behavioral health disabilities meet their daily self-care and household activity needs.  While these services traditionally have been financed on a fee-for-service basis, more states are adopting capitated Medicaid managed long-term services and supports (MLTSS) programs. Currently, 11 states are using § 1115 waivers to provide capitated MLTSS (Figure 1), with most of these waivers first approved in the last five years. Although the Medicaid program may change under the Trump Administration and new Congress, state delivery system choices in favor of MLTSS are likely to remain.  This report presents findings from a Kaiser Family Foundation survey about § 1115 MLTSS waiver enrollment, spending, and program policies in 2015.

Figure 1: States with Medicaid Section 1115 Capitated MLTSS Waivers, 2016

Key Findings

States are using § 1115 MLTSS waivers in efforts to streamline program administration, improve care coordination, and expand beneficiary access to home and community-based services (HCBS). These waivers authorize HCBS for multiple populations under a single authority and often include other Medicaid initiatives unrelated to MLTSS.  Less than half of states with § 1115 MLTSS waivers cited the expectation that costs would be predictable as prompting their decision to pursue a waiver.

Most § 1115 MLTSS waivers include provisions designed to expand HCBS financial eligibility.  Seven of 11 states equalize income limits for HCBS and institutional care, two states offer higher asset limits for HCBS than institutional care, and one state simplifies the application process to expedite access to HCBS.

Over half (6 of 11) of states with § 1115 MLTSS waivers expand HCBS eligibility to people with functional needs who are “at risk” of institutionalization. These initiatives seek to maintain beneficiaries in their homes and prevent the need for costlier, more intensive future services.

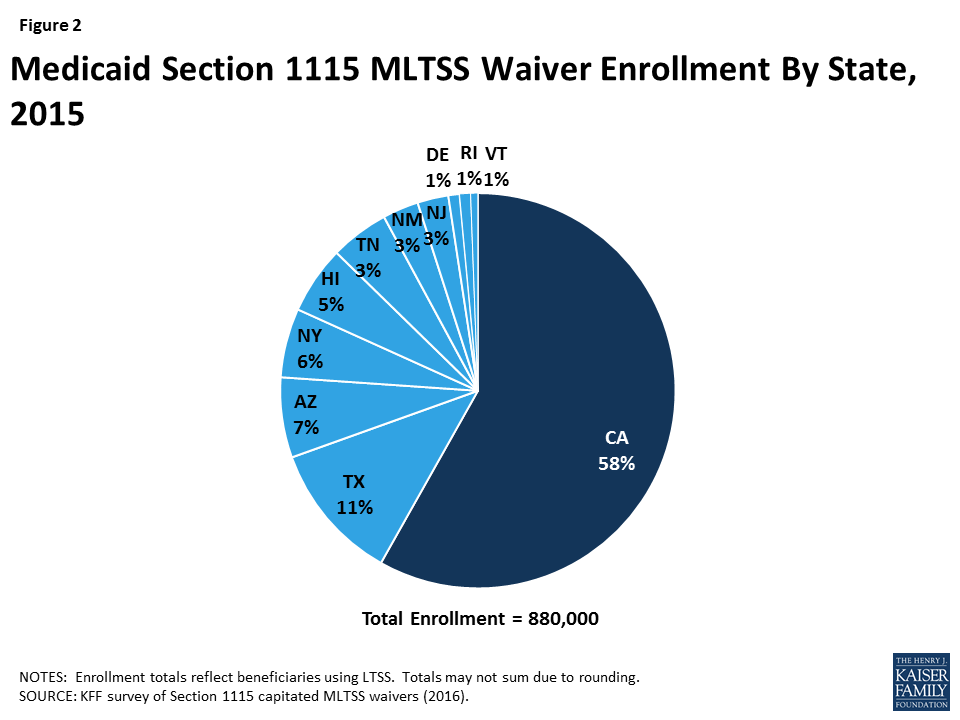
Nearly 900,000 beneficiaries were enrolled in the 11 states with § 1115 MLTSS waivers in 2015 (Figure 2). All 11 states enrolled seniors and people with physical disabilities.  Three states enrolled people with intellectual or developmental disabilities in MLTSS in 2015, and two more states did so in 2016. All except one of the 11 states using § 1115 MLTSS waivers in 2015 require beneficiaries to enroll.

Figure 2: Medicaid Section 1115 MLTSS Waiver Enrollment By State, 2015

Four insurers offered health plans in more than one § 1115 MLTSS waiver state in 2015.  United Healthcare had the highest market penetration, with contracts in eight of the 10 § 1115 waiver states that use private insurers to deliver MLTSS.  Amerigroup and Molina each had contracts in three states, and Centene had contracts in two states.

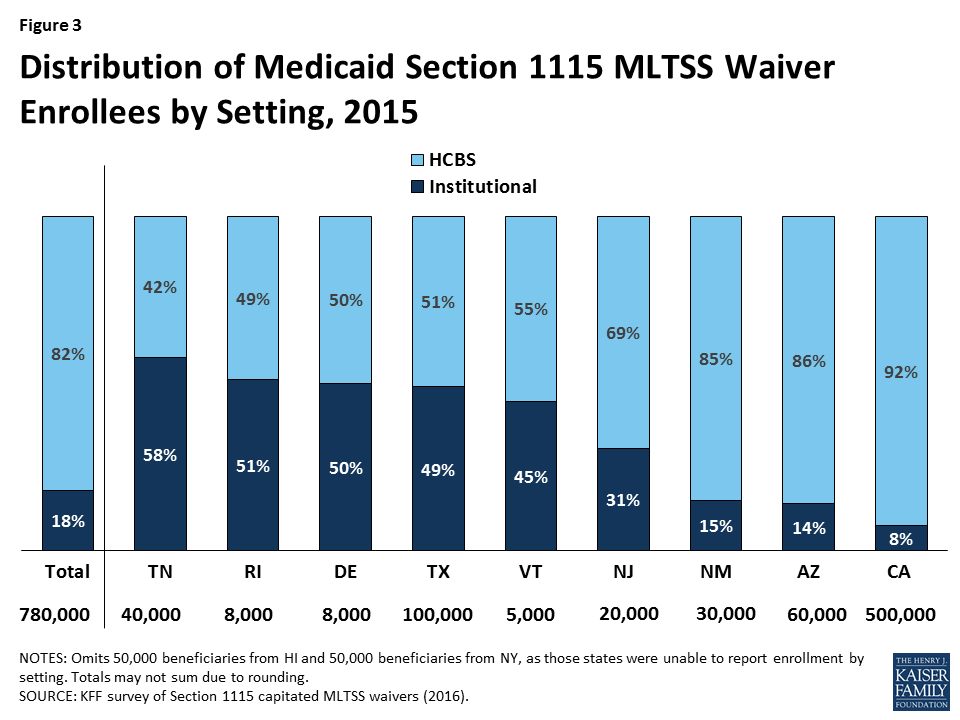
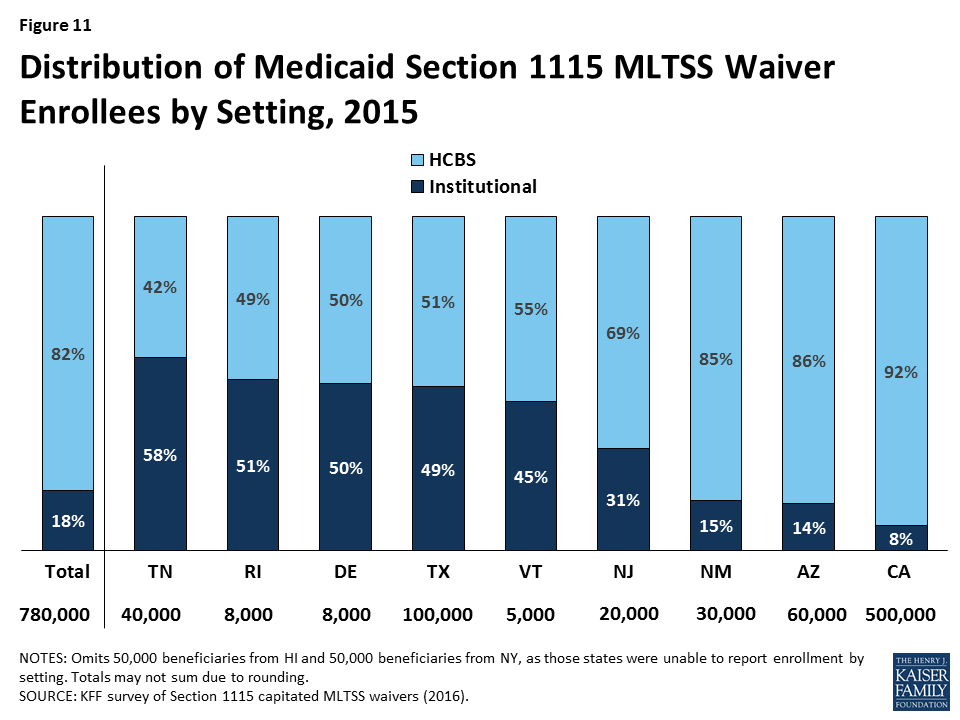
The vast majority of § 1115 MLTSS waiver beneficiaries were served in the community in the 9 states reporting 2015 enrollment by setting (Figure 3).  However, there is variation in the HCBS vs. institutional split among states.  Only 3 of 11 § 1115 MLTSS waiver states reported an HCBS waiting list in 2015.

Figure 3: Distribution of Medicaid Section 1115 MLTSS Waiver Enrollees by Setting, 2015

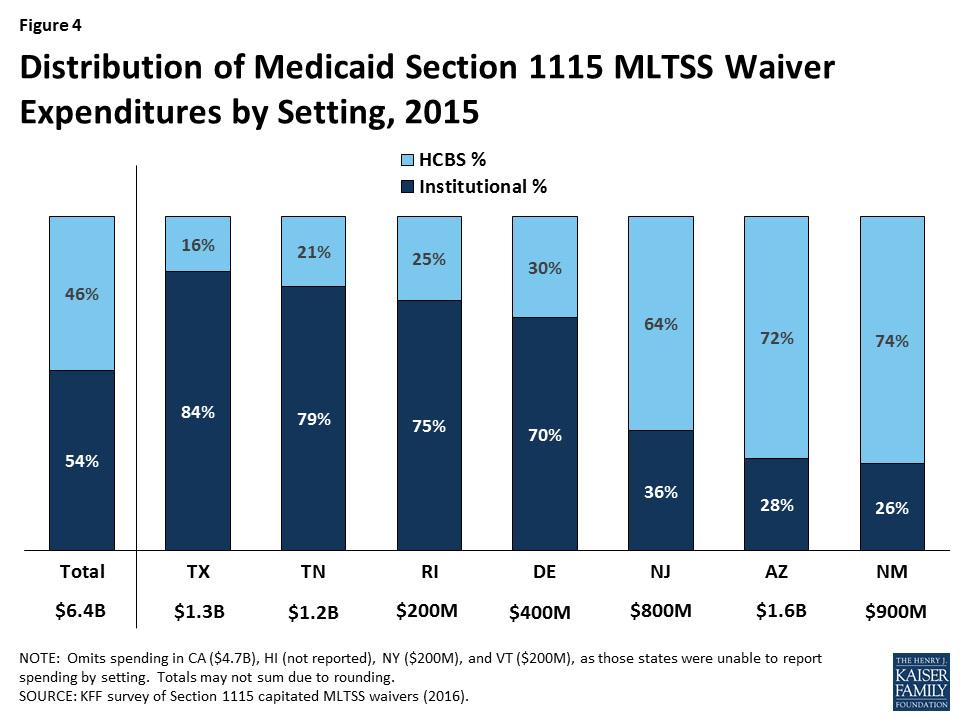
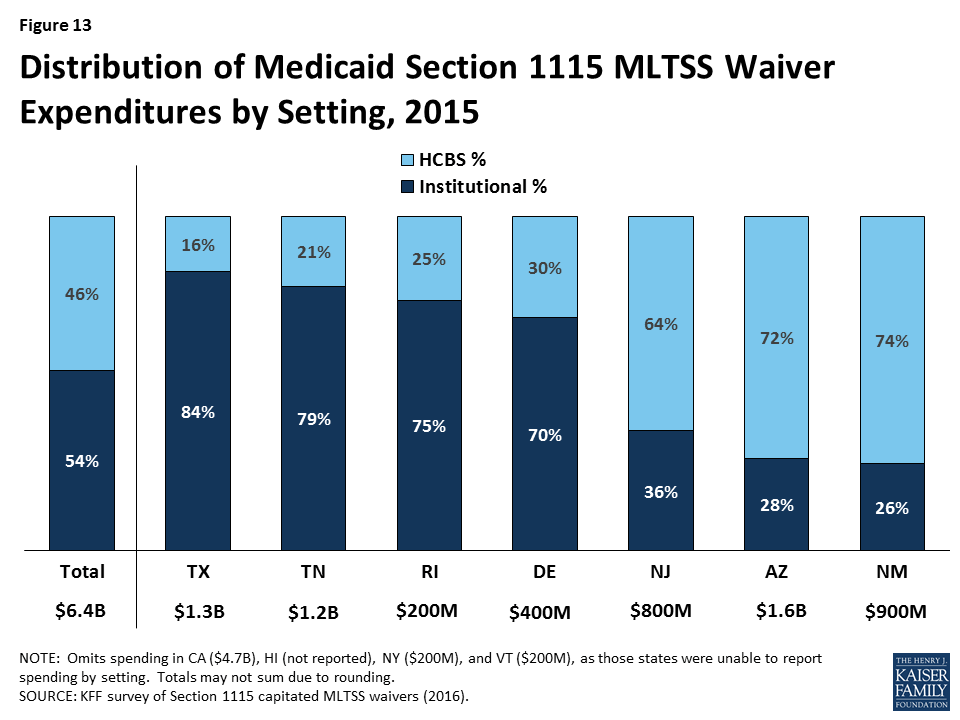
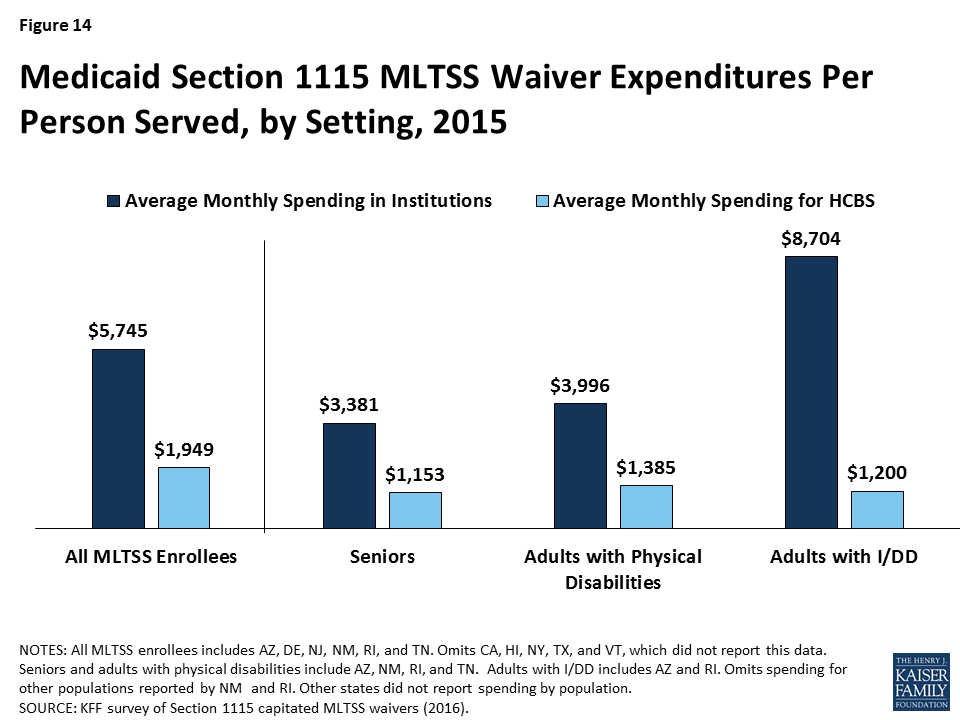
Just under half (46%) of § 1115 MLTSS waiver funds went to HCBS as opposed to institutional care in the 7 states reporting 2015 spending by setting (Figure 4).  As with enrollment, there is variation in the community vs. institutional spending split among states. Section 1115 MLTSS waiver spending in 2015 totaled $11.4 billion across 10 states, with average spending per participant nearly three times higher for those receiving institutional services ($5,745 per month) than for those receiving HCBS ($1,949 per month) in the 6 states reporting that data.  Most states offer financial incentives to encourage health plans to use HCBS as an alternative to institutional services.

Figure 4: Distribution of Medicaid Section 1115 MLTSS Waiver Expenditures by Setting, 2015

Nearly all § 1115 MLTSS waiver states require their health plans to cover a comprehensive set of benefits including nursing facilities, HCBS, acute and primary care, and behavioral health services.  All states provide the option to self-direct services, although the number of beneficiaries who do so is small and varies by state.  Six states applied a maximum cost for HCBS per beneficiary, and 2 applied a maximum number of hours. Nearly all states incorporate nursing facility transition and/or diversion programs.

Conclusion

Capitated § 1115 MLTSS waivers contain a number of provisions designed to increase beneficiary access to HCBS.  Some of these initiatives require waiver authority, while others can be implemented without waiver authority.  States are setting financial eligibility limits to eliminate bias for institutional care over HCBS when individuals apply for Medicaid services.  They also are expanding Medicaid HCBS eligibility by offering services to people who are at risk of institutionalization in efforts to prevent the need for costlier and more intensive services in the future.  Within the context of capitated managed care financing, states are offering financial incentives to health plans that increase HCBS enrollment and spending.  States also are including a comprehensive benefit package, with both institutional and HCBS, in their MLTSS programs to help avoid disincentives for HCBS.  Other MLTSS benefit package elements that support community integration and beneficiary access to HCBS include self-direction and nursing facility diversion and/or transition programs.  Finally, states are increasingly adopting quality measures related to LTSS rebalancing and quality of life and providing opportunities for stakeholder input into the design and oversight of MLTSS programs.

At the time of our survey, states were focused on implementing recent federal regulations, such as the MLTSS provisions in the 2016 Medicaid managed care rule and the home and community-based settings rule.  Several states expressed concern about their ability to keep pace with the increasing need for LTSS given the growing number of seniors and people with disabilities and the LTSS workforce shortage.  Although it is unclear how the Medicaid program may change under the Trump Administration and new Congress, state delivery system choices in favor of MLTSS are likely to remain, and the need for LTSS will only continue with the aging of the population.  Given the continued state interest in capitated MLTSS programs and Medicaid’s central role in meeting the long-term care needs of seniors and people with disabilities, lessons from states’ experience with § 1115 MLTSS waivers may inform policymakers who are considering implementing or changing these programs.

Key Findings

Introduction

Medicaid fills a gap by covering long-term services and supports (LTSS) that are largely unavailable through private insurance or Medicare.1   These services play an important role in helping seniors and people with a variety of physical, cognitive, and behavioral health disabilities meet their daily self-care and household activity needs.  LTSS include institutional care, such as nursing facility services, and home and community-based services (HCBS), such as personal care services, adult day health care programs, habilitative services, assistive technology, and case management.

Traditionally, LTSS have been financed on a fee-for-service basis.  However, in recent years, state interest in capitated Medicaid managed long-term services and supports (MLTSS) programs has increased.  In these programs, states contract with private health plans to provide Medicaid-covered services for a per member per month rate.2   As more states implement MLTSS programs, spending on MLTSS as a percentage of all Medicaid LTSS spending has grown, increasing from 5% in FY 2009 to 15% in FY 2014.3   Acknowledging these trends, the Centers for Medicare and Medicaid Services (CMS) for the first time included provisions governing MLTSS in its 2016 revision of the Medicaid managed care regulations.4  Although the Medicaid program may change under the Trump Administration and new Congress,5  state delivery system choices in favor of MLTSS are likely to remain.

MLTSS delivery systems seek to better coordinate and integrate LTSS with physical, behavioral health, and other services for seniors and people with disabilities who have some of the most intensive and chronic care needs. At the same time, MLTSS implementation comes with the potential risk of disrupting long-standing care arrangements on which beneficiaries rely for their most basic daily activities.6  Additionally, the delivery of LTSS involves concepts, such as person-centered planning, self-direction, and independent living, that health plans may not have encountered if their previous enrollment has been limited to relatively healthy populations, such as parents and children without disabilities.7 

As of 2106, nearly half of states deliver Medicaid LTSS through capitated managed care for at least some populations (Figure 5).8  States can use various Medicaid authorities to implement capitated MLTSS programs.  Eleven states presently are using § 1115 waivers, with most of these waivers first approved in the last five years (Appendix Table 1).9   Traditionally, states have used § 1915 (c) waivers to offer home and community-based services (HCBS) to seniors and people with disabilities who need LTSS and would otherwise be institutionalized;10  these services historically have been fee-for-service. Three states (AZ, RI, & VT) deliver all Medicaid HCBS through § 1115 capitated MLTSS waivers and do not administer any § 1915 (c) waivers.  Another eight states (CA, DE, HI, NJ, NM, NY, TN, & TX) deliver Medicaid HCBS to some populations through § 1115 capitated MLTSS waivers and also administer at least one § 1915 (c) waiver to provide HCBS to other populations outside of managed care.

Figure 5: States with Capitated Medicaid MLTSS Programs, 2016

For the last 15 years, the Kaiser Family Foundation has surveyed states about enrollment, spending, and program policies in § 1915 (c) HCBS waivers.11  As more § 1915 (c) waivers are replaced by § 1115 MLTSS waivers, in 2016, we surveyed the 11 states using § 1115 capitated MLTSS waivers.12  This report presents our survey findings about MLTSS waiver enrollment, spending, and program policies in these states as of 2015, supplemented by our review of the waiver terms and conditions and other publicly available reports.13   Tables comparing key elements of these waivers are in the Appendix.

Key Findings

State Motivation to Implement § 1115 MLTSS Waivers

States use § 1115 waivers to authorize both Medicaid managed care and HCBS.  States generally need waiver authority to require beneficiaries to enroll in MLTSS, which is available under § 1115 or § 1915 (b).  Because § 1915 (b) is limited to Medicaid managed care and cannot be used to authorize HCBS, states with § 1915 (b) MLTSS waivers also operate § 1915 (c) waivers that authorize HCBS.14  By contrast, nearly all states with § 1115 MLTSS waivers use § 1115 to authorize both managed care and HCBS.15 

States with § 1115 MLTSS waivers provide HCBS to multiple populations under a single authority.  Section 1915 (c) HCBS waivers can be targeted to a particular population, such as seniors, people with physical disabilities, or people with intellectual or developmental disabilities (I/DD).  Under § 1115, states can consolidate multiple § 1915 (c) waivers into one authority to streamline reporting and oversight while continuing to offer the same services to the same populations.16  For example, New Jersey’s § 1115 MLTSS waiver includes populations previously served under four separate § 1915 (c) waivers:  seniors and people with physical disabilities who otherwise would require nursing facility care, adults with physical disabilities who need assistance with three activities of daily living, adults with traumatic brain injuries, and adults with AIDS.

States use § 1115 waivers to implement other Medicaid initiatives in addition to MLTSS.  Unlike § 1915 (b) waivers, which are limited to managed care, § 1115 waivers can authorize other programs, such as delivery system reform incentive payments, that may not be directly related to capitated MLTSS.  For example, New Mexico’s § 1115 waiver allows it to administer a capitated managed care program for beneficiaries without LTSS needs, a healthy behavior rewards program, and a safety net care pool, in addition to MLTSS.  Some states, such as New Mexico and Texas, originally implemented MLTSS through joint § 1915 (b)/(c) waivers and later transitioned their MLTSS programs to a § 1115 waiver to consolidate various Medicaid program elements under a single authority.

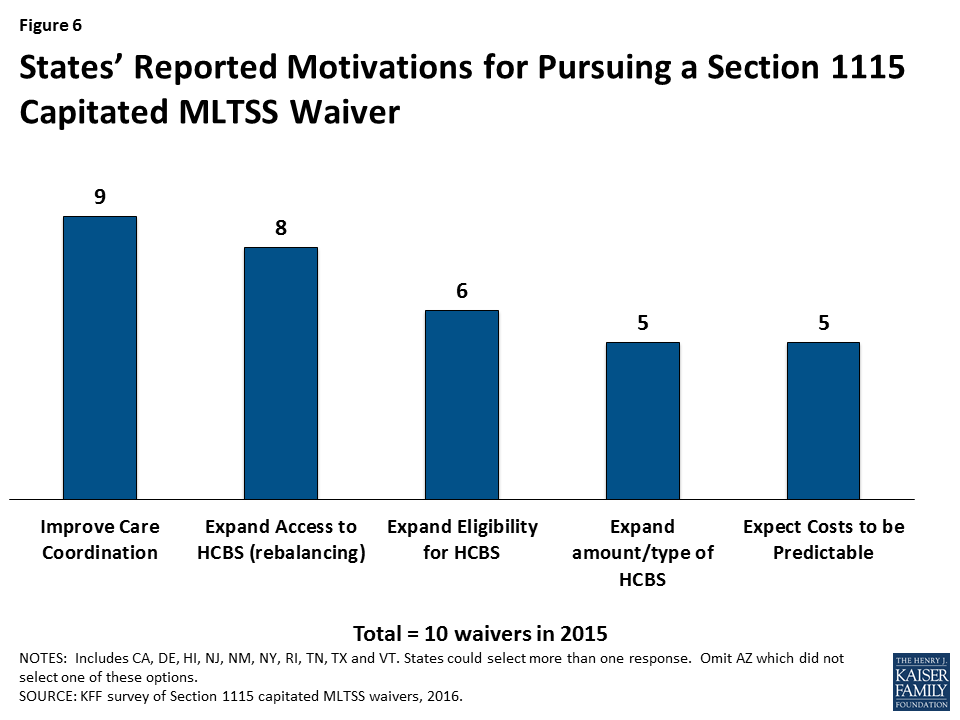
Most states report that their decision to implement a § 1115 capitated MLTSS waiver is motivated by a desire to improve care coordination and expand access to HCBS as an alternative to institutional care (Figure 6).17  Less than half of states with § 1115 MLTSS waivers cited the expectation that costs would be predictable as prompting their decision to pursue a capitated MLTSS waiver. Other less frequently cited reasons for pursing § 1115 MLTSS waivers included expanding eligibility for HCBS and expanding the amount or type of services offered.

Figure 6: States’ Reported Motivations for Pursuing a Section 1115 Capitated MLTSS Waiver

Financial Eligibility in § 1115 MLTSS Waivers

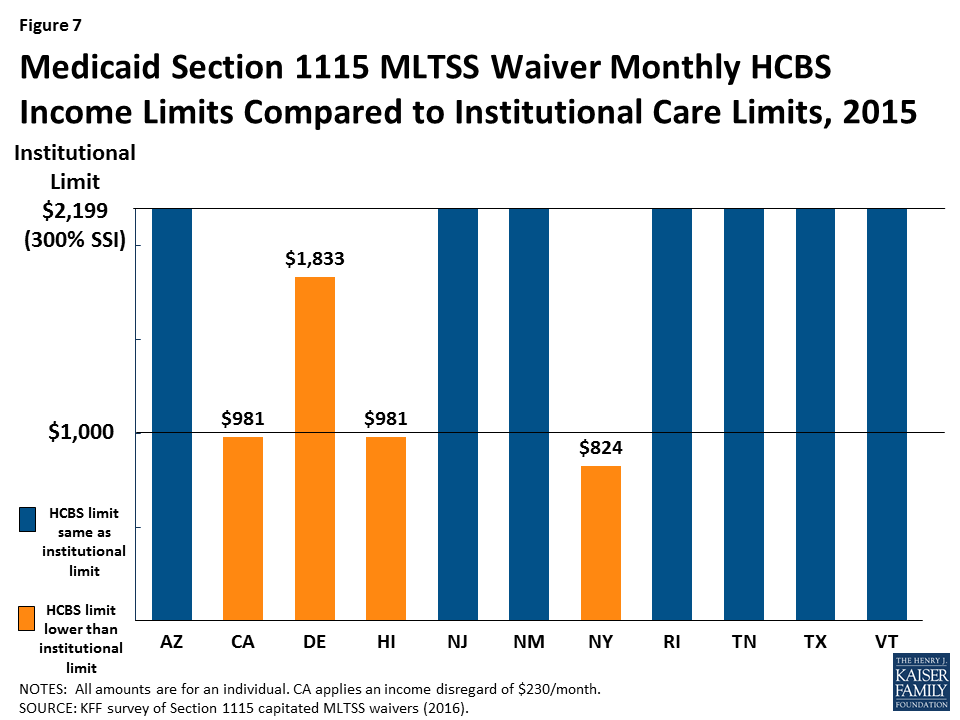
Most (7 of 11) states with § 1115 MLTSS waivers use the same income limit for HCBS and institutional services (Figure 7). The federal maximum income for Medicaid LTSS is 300% of the Supplemental Security Income (SSI) benefit, or $2,199 per month for an individual in 2015. All 11 § 1115 MLTSS waiver states adopt the federal maximum for institutional care.18  Establishing the same income limit for HCBS removes any potential bias toward institutional care, which may occur if people who need LTSS can receive institutional care at higher incomes than the limit for HCBS.  Four states (CA, DE, HI, & NY) have HCBS income limits that are more restrictive than 300% of SSI. Delaware sets the maximum income for HCBS at 250% of SSI, or $1,833 per month for an individual in 2015.  California and Hawaii use 100% of the federal poverty level (FPL), or $981 per month for an individual in 2015, with California also applying a $230 per month income disregard. New York’s HCBS income limit is 84% FPL, or $824 per month for an individual in 2015.19 

Figure 7: Medicaid Section 1115 MLTSS Waiver Monthly HCBS Income Limits Compared to Institutional Care Limits, 2015

Two states (RI & VT) use a higher asset limit for HCBS than for institutional care.  The other nine § 1115 MLTSS waiver states apply the SSI asset limit of $2,000 for an individual to both HCBS and institutional care.20  Authorizing a higher asset limit for HCBS recognizes that people who live in the community may incur additional expenses to maintain their housing. Rhode Island sets its HCBS asset limit at $4,000 per individual.21  Vermont uses a $10,000 per individual limit for people who own and reside in their own homes, receive HCBS and would otherwise require institutionalization. Additionally, New Jersey’s waiver eliminates the five-year asset transfer look-back period for LTSS applicants with income at or below 100% FPL.

Rhode Island’s waiver includes a provision that offers faster access to HCBS by allowing applicants to self-attest to financial eligibility.  In general, states have up to 90 days to determine Medicaid LTSS eligibility.  The delay can make it difficult for people who need services to remain in the community and lead them to enter a nursing facility that agrees to provide care pending their Medicaid eligibility determination. Returning to the community becomes more difficult once a person enters a nursing facility and loses their community housing and other supports.  To address this issue, Rhode Island allows new Medicaid applicants who are functionally eligible for LTSS to self-attest to financial eligibility and receive a limited benefit package of HCBS for three months while their full financial eligibility determination is pending. Benefits include up to 20 hours per week of personal care and homemaker services, three days per week of adult day care services, and limited skilled nursing facility services.

Functional Eligibility in § 1115 MLTSS Waivers

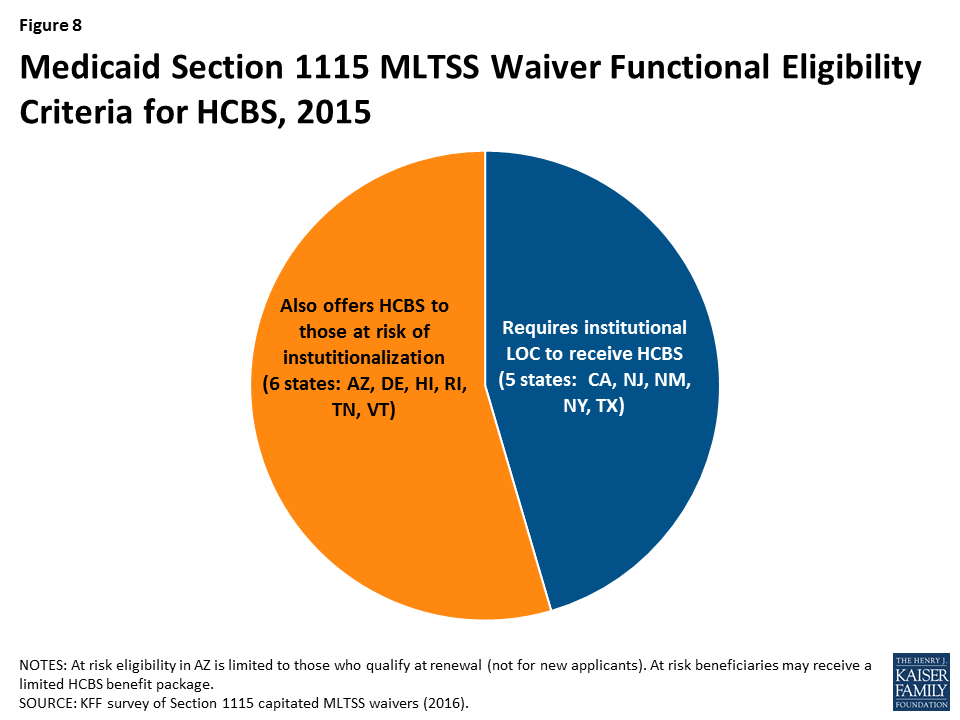
More than half (6 of 11) of § 1115 MLTSS waiver states extend HCBS eligibility to people with functional needs that do not yet rise to an institutional level of care (Figure 8).22  These beneficiaries are considered “at risk” of future institutionalization.  States provide HCBS to at risk populations in an effort to maintain beneficiaries in their homes and prevent their needs from deteriorating to the point where they would require costlier and more intensive services in the future.  HCBS eligibility for at risk beneficiaries in Arizona is limited to non-elderly adults who qualify based on mental illness or I/DD at renewal.  The other five states allow new Medicaid applicants who are at risk of institutionalization to receive HCBS as follows:

  • Delaware offers HCBS to at risk adults and children with disabilities up to 250% FPL.23  Both the financial eligibility criteria and the benefit package are the same as for beneficiaries who already meet an institutional level of care.
  • Hawaii offers a limited HCBS benefit package to at risk beneficiaries. Benefits include adult day care, adult day health, home delivered meals, personal assistance, personal emergency response systems, and skilled nursing services.
  • Rhode Island offers a limited HCBS benefit package to at risk seniors and adults with dementia up to 250% FPL and adults with disabilities up to 300% SSI. Benefits include homemaker, personal care, and respite services; minor environmental modifications; and physical therapy evaluation and services.
  • Tennessee offers HCBS capped at $15,000 per year24  to at risk seniors and non-elderly people with disabilities who qualify as SSI beneficiaries.25  Additionally, Tennessee began offering services to at risk adults and children with I/DD, in 2016. Adults with I/DD have a soft cap of $30,000 per year, which can be increased by an additional $6,000 in emergencies. These adults instead may choose to receive services capped at $15,000 per year but with the option to pay family caregivers.  Services for all at risk children with I/DD are capped at $15,000 per year with the option to pay family caregivers.
  • Vermont offers a limited HCBS benefit package to at risk beneficiaries using the same financial eligibility criteria as for those who meet an institutional level of care (300% SSI). Benefits include adult day, case management, and homemaker services.
Figure 8: Medicaid Section 1115 MLTSS Waiver Functional Eligibility Criteria for HCBS, 2015

Rhode Island’s waiver also expands eligibility for HCBS by covering young adults ages 19 to 21 with significant disabilities and income below 250% FPL who have aged out of the Katie Beckett coverage group, need medical, behavioral health, or DD services, and are otherwise ineligible for Medicaid.26  The Katie Beckett pathway covers children up to age 19 with significant disabilities receiving HCBS who would otherwise be institutionalized.

Enrollment in § 1115 MLTSS Waivers

Total Enrollment

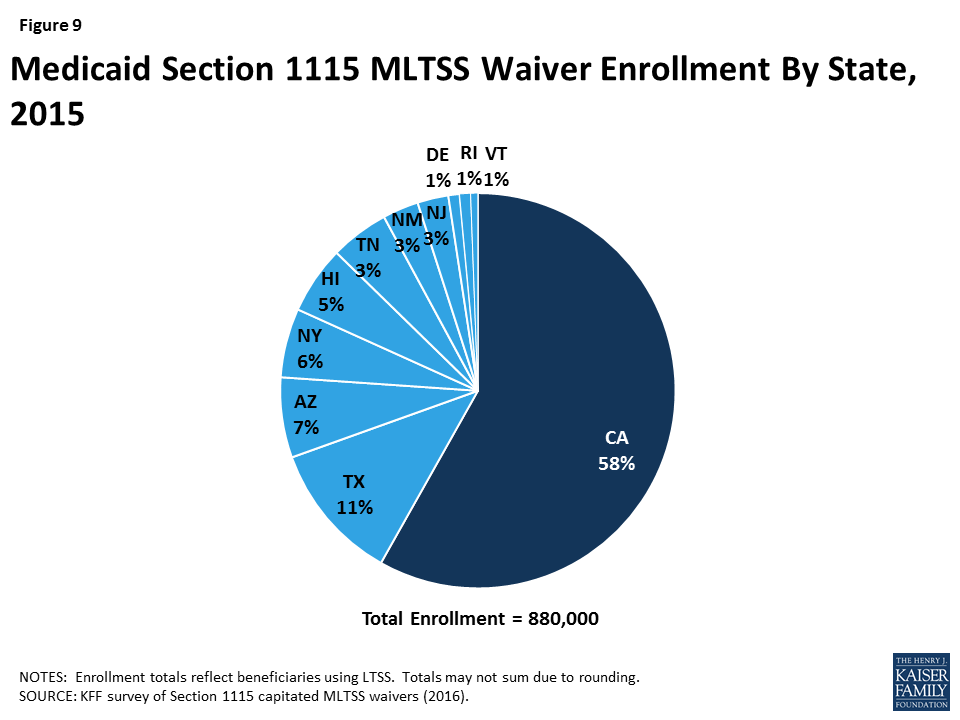
Nearly 900,000 beneficiaries in 11 states were enrolled in a § 1115 waiver for MLTSS in 2015 (Figure 9).27  Enrollment varied widely across the states.  California had the largest number of people receiving MLTSS under its waiver, with 500,000 enrollees.  The state with the next highest enrollment was Texas, with 100,000 enrollees receiving MLTSS. The state with the smallest number of MLTSS enrollees was Vermont, with 5,000 beneficiaries. Nearly all § 1115 MLTSS waiver states enroll beneficiaries statewide; the exception is California, where enrollment is limited to certain counties.

Figure 9: Medicaid Section 1115 MLTSS Waiver Enrollment By State, 2015

Enrollment by Population

All states enrolled seniors and non-elderly adults with physical disabilities in their § 1115 MLTSS waivers in 2015 (Figure 10).  Three states (AZ, RI, & VT) enrolled people with I/DD in MLTSS, although Arizona and Vermont both use a state entity instead of private health plans to provide services to this population. Two states (NY & VT) enrolled adults with behavioral health needs.

The number of states enrolling people with I/DD in § 1115 MLTSS waivers is growing (Figure 10).  In addition to the three states (AZ, RI, & VT) enrolling this population in 2015, two more states (NY & TN) began enrolling beneficiaries with I/DD in MLTSS in 2016.28  Five other states (DE, HI, NJ, NM, & TX) enroll people with I/DD in managed care under their waivers for acute care but not for LTSS.

All 11 states with § 1115 MLTSS waivers include beneficiaries who are dually eligible for Medicare and Medicaid.  These beneficiaries receive their Medicaid benefits through MLTSS.  Seven states (AZ, CA, DE, NJ, RI, TN, & TX) require their MLTSS health plans to coordinate with Medicare-covered services for dual eligible beneficiaries. For example, Tennessee requires its MLTSS health plans to set up companion Medicare D-SNPs to allow dual eligible beneficiaries to receive both Medicare and Medicaid services from the same entity.  Four states (CA, NY, RI & TX) have concurrent § 1115A authority for financial alignment demonstrations that integrate Medicare and Medicaid benefits for dual eligible beneficiaries in a single health plan.29 

Figure 10: Populations Enrolled in Medicaid Section 1115 MLTSS Waivers, 2015 and 2016

Enrollment by Setting

Over 80% of § 1115 MLTSS waiver enrollees received services in the community instead of institutions, across the 9 states that reported 2015 enrollment by setting (Figure 11).  Only one state reporting this data (TN) served a clear majority of MLTSS beneficiaries (58%) in institutions in 2015.  However, Tennessee has made substantial progress in increasing the number of beneficiaries receiving HCBS, as 83% of its LTSS beneficiaries were served in institutions in 2010.30   Additionally, Tennessee reports that more than half of its new LTSS beneficiaries selected HCBS upon enrollment in each of the past two years.31   Four states (DE, RI, TX, & VT) had about a 50/50 split between beneficiaries in the community versus institutions.  The other four states (NJ, NM, AZ & CA) served a majority of beneficiaries in the community.  Hawaii and New York did not report enrollment by setting, but Hawaii’s reports to CMS indicate that nearly 2/3 of its MLTSS enrollees received HCBS in the quarter ending March 2015.32 

Figure 11: Distribution of Medicaid Section 1115 MLTSS Waiver Enrollees by Setting, 2015

HCBS Waiting Lists

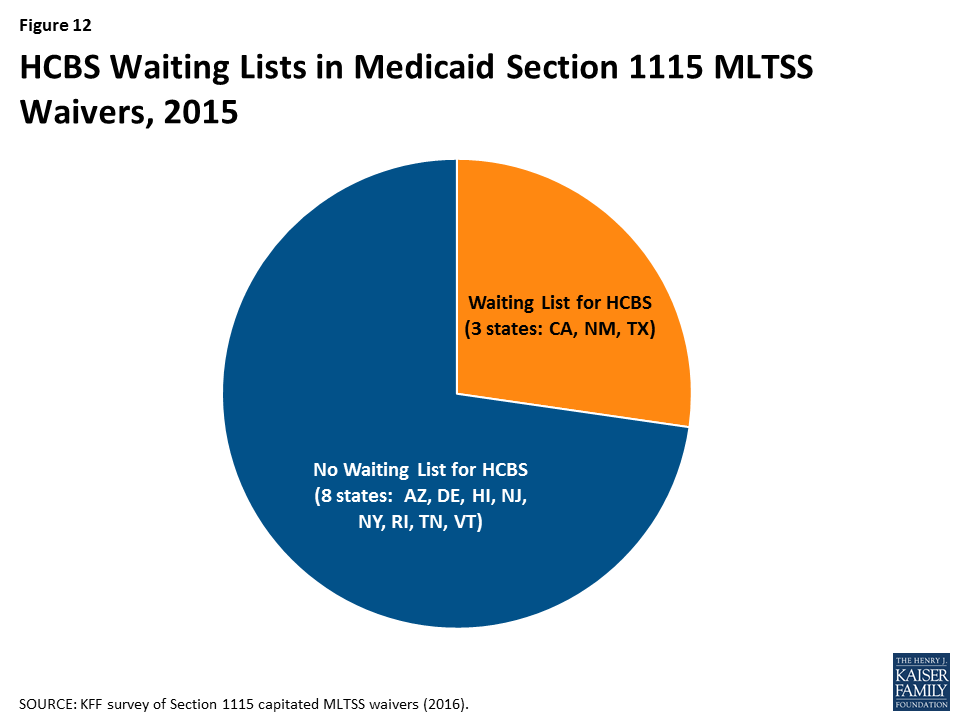
Nearly three-quarters (8 of 11) of § 1115 MLTSS waiver states did not have an HCBS waiting list in 2015 (Figure 12).  States can cap HCBS enrollment under § 1115 MLTSS waivers just as they can under § 1915 (c) waivers.33  Three § 1115 MLTSS waiver states (CA, NM, & TX) reported an HCBS waiting list in 2015. New Mexico had 16,370 people waiting, with a four-month average wait time before receiving services. Nearly 1,700 people on the waiting list were offered services in New Mexico in 2015. Texas had 15,712 people waiting, with a six month average wait time.34  Over 1,800 people on the waiting list were offered services in Texas between September, 2015 and March, 2016.  California was unable to report waiting list data.

Figure 12: HCBS Waiting Lists in Medicaid Section 1115 MLTSS Waivers, 2015

MLTSS Health Plans

Four insurers offered health plans in more than one § 1115 MLTSS waiver state in 2015 (Table 1).  United Healthcare had the highest market penetration, with contracts in eight of the 10 § 1115 waiver states that use private insurers to deliver MLTSS.35   Amerigroup and Molina each had contracts in three states, and Centene had contracts in two states. States contract with a range of insurer types, including primarily small local insurers (CA), large national insurers (TX, NM, & NJ), or a mix of both (AZ, TN, & NY).

Table 1: Health Plans Participating in Multiple § 1115 MLTSS Waiver States, 2015
StateUnited HealthcareAmerigroup MolinaCentene
ArizonaXX
CaliforniaX
DelawareX
HawaiiX
New JerseyXX
New MexicoXX
New YorkX
Rhode Island
TennesseeXX
TexasXXXX
TOTAL:8 states3 states3 states2 states
NOTES:  Omits Vermont, which uses a state entity to deliver MLTSS.SOURCE:  KFF survey of § 1115 Medicaid MLTSS waivers (2016).

Enrollment Policies

Nearly all § 1115 MLTSS waiver states (except RI) require beneficiaries to enroll in managed care. Enrollment in specialized health plans for beneficiaries with behavioral health needs is voluntary in New York.36   States typically use passive enrollment processes in which beneficiaries are automatically assigned to a health plan if they do not affirmatively select one. For example, if a beneficiary does not choose a health plan within a certain amount of time, such as 30 days, of their Medicaid eligibility determination, the state or its enrollment broker will select a health plan for them, and beneficiaries then have a period of time, such as 90 days, to change health plans.

Nearly all § 1115 MLTSS waiver states (except AZ) offer independent enrollment options counseling to assist beneficiaries with choosing a health plan. States use different types of entities to provide this service, with about half of states using an enrollment broker, and others relying on local Aging and Disability Resource Centers (ADRCs) or ombudsman programs (Table 2). Options counseling seeks to help LTSS enrollees select a health plan; this population may not be familiar with that process because they traditionally have been enrolled in the fee-for-service delivery system.  LTSS enrollees also may seek assistance with choosing a health plan to find a provider network that best meets their various needs – which may go beyond primary care to include specialists, behavioral health providers, durable medical equipment suppliers, and personal care attendants — and preserves their existing provider relationships to the extent possible.  CMS’s 2016 Medicaid managed care regulations require all states to offer enrollee choice counseling through the independent beneficiary support system required in health plan contracts beginning on or after July 1, 2018.37 

Table 2: Type of Entity Providing Independent Enrollment Options Counseling in § 1115 MLTSS Waiver States, 2015
StateEnrollment BrokerAging & Disability Resource CenterOmbudsmanNo Enrollment Counseling
ArizonaX
CaliforniaX
DelawareX
HawaiiX
New JerseyXX
New MexicoX
New YorkXX
Rhode IslandX
TennesseeX
TexasXX
TOTAL:6 states3 states3 states1 state
NOTE:  Omits VT which does not use health plans because a state entity delivers services.SOURCE:  KFF survey of § 1115 Medicaid MLTSS waivers (2016).

Disenrollment Policies

Over three-quarters (7 of 9) of the § 1115 MLTSS waiver states with mandatory health plan enrollment allow beneficiaries to switch health plans outside of the annual open enrollment period if their LTSS provider leaves the plan’s network. These states include CA, DE, HI, NJ, NM, NY, and TX.38  The two other states with mandatory MLTSS health plan enrollment (TN & AZ) permit beneficiaries to change plans based on circumstances that would create a hardship as defined by the state or when the change helps to ensure continuity of care. CMS’s 2016 Medicaid managed care rule requires states to allow beneficiaries to disenroll from their health plan outside of open enrollment if their residence or employment would be disrupted as a result of their residential or employment supports provider leaving their plan’s network in health plan contracts beginning on or after July 1, 2017.39 

Spending in § 1115 MLTSS Waivers

Ten § 1115 waiver states reported total MLTSS spending of $11.4 billion in 2015.40   These states include AZ, CA, DE, NJ, NM, NY, RI, TN, TX, and VT.  Hawaii did not report spending data.

Spending by Setting

Just under half (46%) of § 1115 MLTSS waiver spending went to HCBS in 2015, across the seven states that were able to break out spending by setting (Figure 13).  The split between HCBS and institutional spending varied by state.  Three states (AZ, NJ, & NM) spent over 60% of their MLTSS dollars on HCBS, while four states (DE, RI, TN, & TX) spent 70% or more of their MLTSS dollars on institutional services.

Figure 13: Distribution of Medicaid Section 1115 MLTSS Waiver Expenditures by Setting, 2015

Average spending per participant receiving institutional services ($5,745 per month) was nearly three times higher than average spending per participant receiving HCBS ($1,949 per month) in the six § 1115 MLTSS waiver states reporting this data for 2015 (Figure 14).  The states include AZ, DE, NJ, NM, RI, and TN.  This disparity also is evident when comparing per participant spending for institutional services versus HCBS by population.  States spent nearly three times the amount per participant on institutional care for both seniors and adults with physical disabilities than for their counterparts living in the community in the four states (AZ, NM, RI, & TN) reporting this data by population and setting (Figure 14 ).41   Spending on services for adults with I/DD in institutions cost nearly seven times more than for their counterparts who were served in the community in the two states (AZ & RI) reporting this data. Part of the reason that institutional spending exceeds the cost of HCBS is that Medicaid does not pay for community-based housing, whereas institutional services necessarily come with room and board.42 

Figure 14: Medicaid Section 1115 MLTSS Waiver Expenditures Per Person Served, by Setting, 2015

Health Plan Financial Incentives for Increased HCBS Utilization

Most § 1115 MLTSS waiver states build financial incentives into their capitated rates to encourage health plans to use HCBS as an alternative to institutional services. These arrangements typically involve a blended rate that pays the same amount regardless of whether a beneficiary receives nursing facility services or HCBS.  Because HCBS usually are less expensive than institutional care, higher HCBS utilization increases health plans’ operating margins under a blended rate. For example, California’s blended rate for MLTSS beneficiaries under its waiver assumes a certain proportion of enrollees in institutions versus in the community. If health plans actually serve more enrollees in the community, they are still paid at the rate based on the lower assumption. This rate structure disincentivizes health plans from shifting enrollment from HCBS to institutional services.

Some § 1115 MLTSS waiver states offer bonus payments to health plans that increase HCBS utilization. New Jersey’s nursing facility transition incentive payment program provides financial bonuses to health plans that successfully transition beneficiaries from nursing facilities to the community for 120 days.  Tennessee offers incentive payments to health plans that achieve specified benchmarks, such as the number of enrollees who receive HCBS and the proportion of LTSS spending on HCBS vs. institutional care.  Hawaii’s waiver allows the state to offer financial incentives to health plans that expand HCBS capacity beyond annual state-established thresholds and penalties for plans that fail to do so at a state-determined appropriate pace.  Hawaii health plans receiving these financial incentives must share a portion with providers but cannot pass penalties on to providers.

Services in § 1115 MLTSS Waivers

Benefit Packages

Most § 1115 MLTSS waiver states require their health plans to cover a comprehensive set of benefits including nursing facilities, HCBS, acute and primary care, and behavioral health services.  An exception is New York, where health plans provide limited Medicaid state plan benefits, including LTSS, with the remaining services provided fee-for-service.  The MLTSS health plan benefit package in New York includes home health, medical social, adult day health, personal care, durable medical equipment, non-emergency medical transportation, podiatry, dental, optometry, outpatient rehabilitation, audiology, respiratory therapy, private duty nursing, nutrition, skilled nursing facility, social day care, home delivered meals, social and environmental supports, and personal emergency response system services.43   Additionally, two states (DE & HI) limit the number or type of behavioral health visits in the health plan benefit package, with more intensive services provided through a carve-out. Texas added nursing facility services to its MLTSS benefit package in March 2015; previously, those services were carved out.  Including both institutional and HCBS in the health plan benefit package can incentivize the use of HCBS, which are typically less expensive than comparable institutional care.

Self-direction

All of the § 1115 MLTSS waiver states require their health plans to offer beneficiaries the option to self-direct HCBS, although the number of beneficiaries who do so is relatively small and varies by state. Self-direction can include the ability to allocate service budgets and/or select, train, and dismiss service providers. The median self-direction participation rate in 2015 was seven percent across all § 1115 MLTSS waiver states.  Self-direction participation rates ranged from 100% in California, where all beneficiaries receiving in-home supportive services under the waiver direct their personal care and attendant services, to less than five percent in New Mexico, Rhode Island, and Texas.

Three § 1115 MLTSS waiver states have provisions that authorize payments to family caregivers.  Arizona and Vermont allow spouses to be paid for providing personal care services (up to 40 hours per week in AZ).  As of 2016, Tennessee’s waiver provides an option for a family caregiver stipend up to $500 for children and $1,000 for adults with I/DD who either meet or are at risk of meeting an institutional level of care, in lieu of receiving supportive home care services.

HCBS Utilization controls

Six of the § 1115 MLTSS waiver states applied a maximum HCBS cost per beneficiary (AZ, CA, NJ, NM, TN, & TX), and two applied a maximum number of hours (AZ & CA). States typically set the maximum HCBS cost at the same amount as the cost of nursing facility services or a percentage of the nursing facility cost. With its § 1115 MLTSS waiver expansion to people with I/DD in 2016, Tennessee offers up to $45,000 per year of services for adults with I/DD with low to moderate needs who meet an institutional level of care and up to $60,000 per year of services for adults with I/DD with high needs who meet an institutional level of care.  These amounts can be exceeded up to the average cost of institutional services for people with intellectual disabilities and exceptional medical or behavioral needs. Three other states noted policies that provide exceptions to the maximum cost:  Texas allows beneficiaries to exceed the maximum cost, which is set at 202% of the cost of nursing facility services, when general revenue funds are used to pay for services,44  New Mexico exempts beneficiaries who self-direct services from its cost cap, and Arizona allows the maximum cost to be exceeded based on a cost effectiveness study.  Among states that apply maximum hour limits, Arizona applies service specific guidelines, and California limits in-home supportive services to 283 hours per month.

Nursing Facility Transition and Diversion Programs

Eight § 1115 MLTSS waiver states involve health plans in their Money Follows the Person (MFP) programs (CA, DE, HI, NJ, NM, RI, TN, & TX).45  Two states (AZ & NM) do not participate in MFP; Vermont participates in MFP but does not use private health plans in its capitated managed care model. The MFP demonstration provided states with enhanced federal Medicaid matching funds for 12 months for each Medicaid beneficiary who transitions from an institution to the community.46  Health plan involvement with MFP in § 1115 MLTSS waiver states includes coordinating transitions (8 states), providing services (8 states), and referring candidates for transition to the state (6 states).

Five § 1115 MLTSS waiver states require their health plans to have nursing facility diversion programs (AZ, HI, NJ, RI, & TN).  For example, health plans providing services under New Jersey’s waiver must have a nursing facility diversion plan approved by the state and CMS for beneficiaries who receive HCBS and those at risk of NF placement, including short-term stays.  Plans must monitor hospitalizations and short stay nursing facility services for at risk beneficiaries.

Quality Measures in § 1115 MLTSS Waivers

Nine of the 11 § 1115 MLTSS waiver states used quality measures to assess progress in LTSS rebalancing in 2015.47   These states include AZ, CA, HI, NJ, NM, RI, TN, TX and VT. In addition, New York noted that quality measures related to LTSS rebalancing are included in its § 1115A financial alignment demonstration for dual eligible beneficiaries, although not currently in its § 1115 MLTSS waiver. Examples of quality measures related to LTSS rebalancing are listed in Table 3.

Table 3: Examples of Quality Measures Related to LTSS Rebalancing in § 1115 MLTSS Waiver States
StateSelected Measures
Rhode Island
  • Transition assessments completed
  • Number of assessments with opportunity for community discharge
  • Number of assessments without opportunity for community discharge (by reason)
  • Utilization and cost of HCBS and transition services (by service type)
  • Number of community transitions
  • HCBS caseload
  • Changes in service hours
  • HCBS discharges
Tennessee
  • Number of enrollees receiving NF or HCBS at a point in time and over 12 months
  • HCBS and NF expenditures for 12 months and as % of total LTSS spending
  • Average annual per person HCBS and NF expenditures
  • Average annual length of stay in NF and HCBS
  • Percent of new LTSS beneficiaries admitted to NF annually
  • Annual number of NF to HCBS transitions
Texas
  • Community to NF admission rates pre and post NF carve-in to MLTSS
  • Hospital to NF admission rates pre and post NF carve-in to MLTSS
  • Number of people who moved from community to hospital to NF and remained in NF
  • Number of people who moved from NF to community and were readmitted to NF
SOURCE: KFF survey of § 1115 Medicaid MLTSS waivers (2016) and review of waiver terms and conditions.

Seven states reported using measures that assess beneficiary quality of life in 2015. These states include AZ, NJ, NM, NY, RI, TN, and TX. Three of these states (NJ, TN, & TX) indicated that they participate in the National Association of States United for Aging and Disabilities’ National Core Indicators – Aging and Disability survey, which assesses quality of life and outcomes for seniors, people with physical disabilities, and caregivers.48   Examples of quality measures related to beneficiary quality of life are listed in Table 4.  CMS’s 2016 Medicaid managed care rule requires states that provide MLTSS to identify standard performance measures related to quality of life, rebalancing, and community integration for health plan contracts starting on or after July 1, 2017.49 

Table 4: Examples of Quality Measures Related to Beneficiary Quality of Life in § 1115 MLTSS Waiver States
StateSelected Measures
NCI Aging and Disability survey (used by NJ, TN, & TX)
  • Proportion of people who are able to participate in preferred activities outside of home when and with whom they want
  • Proportion of people who are involved in making decisions about their everyday lives (where they live, what they do during the day, staff that supports them, with whom they spend time)
  • Proportion of people who are able to see or talk to friends and families when they want
  • Proportion of people who are not lonely
  • Proportion of people who are satisfied with where they live
  • Proportion of people who are satisfied with what they do during the day
  • Proportion of people who are satisfied with staff who work with them
  • Proportion of people who feel in control of their lives
Texas
  • Number and percent of enrollees with service plans that address assessed needs
  • Number and percent of enrollees with service plans that address enrollee goals
  • Number and percent of enrollees reporting that service coordinators asked about their preferences
  • Number of health plans with approved manuals that include training on abuse, neglect, and exploitation
  • Number and percent of complaints relating to unauthorized use of restraint or seclusion
NOTE:  DE is listed as a NCI-AD participant at http://nci-ad.org/ but did not indicate this in its survey response.SOURCE: KFF survey of § 1115 Medicaid MLTSS waivers (2016); National Core Indicators – Aging and Disability Adult Consumer Survey 2015-2016 Mid-Year Results at 192, http://nci-ad.org/upload/reports/NCI-AD_2015-2016_Six_State_Mid-Year_Report_FINAL.pdf.

Stakeholder Engagement and Oversight in § 1115 MLTSS Waivers

MLTSS Advisory Groups

Five of the 11 § 1115 MLTSS waiver states require health plans to have an advisory committee that includes beneficiaries receiving LTSS as of 2015.  These states include AZ, NJ, NM, TN, and TX.  Under the 2016 Medicaid managed care rule, MLTSS plans must have a member advisory committee that includes a reasonably representative sample of the populations receiving LTSS covered by the plan or other individuals representing those enrollees, effective for plan contracts starting on or after July 1, 2017.50 

Five states must have a state advisory committee that allows stakeholders to provide input about MLTSS implementation according to their § 1115 waiver terms and conditions.  These states include DE, NJ, NM, NY, and TX.  The 2016 Medicaid managed care rule requires all states to have a stakeholder group to solicit and address the opinions of beneficiaries, individuals representing beneficiaries, providers, and other stakeholders in the design, implementation, and oversight of a state’s MLTSS program, effective for plan contracts beginning on or after July 1, 2017.51 

Ombudsman programs

Eight of 11 § 1115 MLTSS waiver states operated an LTSS ombudsman program in 2015 (Table 5).  Four of these states locate their ombudsman program entirely outside state government (HI, NY, TN, & VT), while three operate entirely within state government (CA, DE, & TX). New Mexico divides the functions of its ombudsman program among the state government long-term care ombudsman and community-based organizations, such as ADRCs, Area Agencies on Aging (AAA), and Centers for Independent Living.  All ombudsman programs are independent of the MLTSS health plans.  Ombudsman programs may provide enrollment options counseling, assist beneficiaries with health plan appeals, offer information about state fair hearings, track beneficiary complaints, train health plans and providers about community-based services and supports that can be linked with MLTSS-covered services, and report data and systemic issues to states.  In addition, waivers in two states (NJ & RI) that do not provide for an ombudsman program instead require beneficiaries to have access to an independent advocate within the state, such as the state protection and advocacy agency for people with disabilities, a legal services agency, or AAA.  The 2016 Medicaid managed care rule requires states to offer an independent beneficiary support system, in plan contracts beginning on or after July 1, 2018, that provides the following services for people who use or wish to use LTSS:  (1) an access point for complaints and concerns; (2) education on enrollee rights and responsibilities; (3) assistance in navigating the grievance and appeals process; and (4) review and oversight of data to guide the state in identifying and resolving systemic LTSS issues.52 

Table 5: Type of Entity Providing Ombudsman Services in § 1115 MLTSS Waiver States, 2015
StateState GovernmentOutside of State GovernmentFunctions Divided Among State Government and Outside Entities No Program
ArizonaX
CaliforniaX
DelawareX
HawaiiX
New JerseyX
New MexicoX
New YorkX
Rhode IslandX
TennesseeX
TexasX
VermontX
TOTAL:4 states3 states1 state3 states
NOTES:  NJ and RI’s waivers do not provide for an ombudsman program but do require beneficiaries to have access to an independent advocate within the state.SOURCE:  KFF survey of § 1115 Medicaid MLTSS waivers (2016).

Conclusion

As of 2015, 11 states are using § 1115 waivers to provide capitated MLTSS, and all except one require beneficiaries to enroll.  Nearly 900,000 beneficiaries were enrolled in these programs. All states enrolled seniors and non-elderly people with physical disabilities.  Three states enrolled people with I/DD in 2015, although the number of states enrolling this population increased to five states in 2016. The vast majority of MLTSS beneficiaries in the 9 states reporting 2015 enrollment by setting were served in the community, although there is variation in the community vs. institutional split among states. Only 3 of 11 § 1115 MLTSS waiver states reported an HCBS waiting list in 2015.

Section 1115 MLTSS waiver spending in 2015 totaled $11.4 billion across the 10 states reporting this data.  Average spending per participant was nearly three times higher for those receiving institutional services ($5,745 per month) than for those receiving HCBS ($1,949 per month) in the six states reporting this data.  Among the seven states reporting MLTSS spending by setting, just under half (46%) of § 1115 MLTSS waiver funds went to HCBS as opposed to institutional care, with variation in the community vs. institutional split among states.

States are using § 1115 waivers to implement capitated MLTSS programs in an effort to streamline administration.  Section 1115 allows states to provide HCBS to multiple populations and implement other provisions, such as delivery system reforms unrelated to MLTSS, under a single authority.  States also report adopting capitated MLTSS programs through § 1115 waivers in efforts to increase care coordination across physical, behavioral health, and LTSS.

Capitated § 1115 MLTSS waivers contain a number of provisions designed to increase beneficiary access to HCBS.  Some of these initiatives require waiver authority, while others can be implemented without waiver authority.  States are setting financial eligibility limits to eliminate bias for institutional care over HCBS when individuals apply for Medicaid services.  They also are expanding Medicaid HCBS eligibility by offering services to people who are at risk of institutionalization in efforts to prevent the need for costlier and more intensive services in the future.  Within the context of capitated managed care financing, states are offering financial incentives to health plans that increase HCBS enrollment and spending.  States also are including a comprehensive benefit package, with both institutional and HCBS, in their MLTSS programs to help avoid disincentives for HCBS.  Other MLTSS benefit package elements that support community integration and beneficiary access to HCBS include self-direction and nursing facility diversion and/or transition programs.  Finally, states are increasingly adopting quality measures related to LTSS rebalancing and quality of life and providing opportunities for stakeholder input into the design and oversight of MLTSS programs.

At the time of our survey, states were focused on implementing recent federal regulations, such as the MLTSS provisions in the 2016 Medicaid managed care rule and the home and community-based settings rule.  Several states expressed concern about their ability to keep pace with the increasing need for LTSS given the growing number of seniors and people with disabilities and the LTSS workforce shortage.  Although it is unclear how the Medicaid program may change under the Trump Administration and new Congress, state delivery system choices in favor of MLTSS are likely to remain, and the need for LTSS will only continue with the aging of the population.  Given the continued state interest in capitated MLTSS programs and Medicaid’s central role in meeting the long-term care needs of seniors and people with disabilities, lessons from states’ experience with § 1115 MLTSS waivers may inform policymakers who are considering implementing or changing these programs.

Appendices

Appendix Table 1:Key Provisions in § 1115  Capitated MLTSS Waivers, as of December, 2016
StateInitial § 1115MLTSS ApprovalCurrent Waiver ExpiresPopulations CoveredDualsIncludedLevel of CareStatewideMandatory EnrollmentServices Included
SeniorsPhys. Dis. I/DDSerious Mental IllnessInstit.At Risk of Instit.Instit.HCBSPhysical healthBehav. health
AZ19899/30/21XXXYesXXYesYesXXXX
CA201412/31/20XXYesXNoYesXXXX
DE201212/31/18XXYesXXYesYesXXXsome
HI200812/31/18XXYesXXYesYesXXXsome
NJ2012(enrollment effectiveJuly 2014)6/30/17XXYesXYesYesXXXX
NM201412/31/18XXYesXYesYesXXXX
NY201211/15/16XXXXYesXYesSomeXXsomesome
RI201312/31/18XXXYesXXYesNoXXXX
TN2009(enrollment effectiveMarch 2010)11/30/16XXXYesXXYesYesXXXX
TX201112/31/17XXYesXYesYesXXXX
VT200512/31/21XXXXYesXXYesYesXXXX
NOTES:  Table omits KS, which has joint § 1115/1915 (c) waivers, and NC and VA, which have capitated MLTSS § 1115 applications pending with CMS.AZ: limits at-risk services to those who no longer meet institutional level of care at renewal; uses state entity to serve people with I/DD.CA: includes Medicaid state plan HCBS, in-home supportive services, community-based adult services, multipurpose senior services, and NF services but not other § 1915 (c) waiver HCBS.DE: also includes those with HIV/AIDS, TEFRA children, and working people with disabilities buy-in; limited number of MCO behavioral health visits with remainder FFS.HI: MCOs provide standard behavioral health services, with separate managed care carve out for specialized behavioral health services.NJ:  also includes people with TBI and AIDS; MLTSS enrollment for those in NFs limited to those eligible for Medicaid after July 1, 2014.NM: also includes working people with disabilities buy-in, people with HIV/AIDS and those who are medically fragile; previously offered MLTSS to duals and those requiring NF LOC through a § 1915 (b)/(c) waiver that was converted to § 1115; § 1115 waiver also phased in HCBS from § 1915 (c) waivers for self-direction, AIDS, and medically fragile populationsBShCB over 6 months, beginning Jan. 2016.NY: managed LTC plans provide limited Medicaid state plan benefits including institutional and HCBS for beneficiaries who need more than 120 days of LTSS, with other services provided FFS; people with SMI included as of Aug. 2015, and may enroll in specialized MCOs providing mainstream Medicaid managed care benefits and BH HCBS, which are non-risk for 1st 2 years; people with I/DD enrolled as of 2016; seeking waiver extension through Dec. 2019.RI:  also includes adults ages 19 to 21 with significant disabilities below 250% FPL who aged out of TEFRA coverage, need services, and are otherwise ineligible.TN:  MLTSS enrollment was statewide as of Aug. 2010; MLTSS enrollment for people with I/DD receiving HCBS is as of 2016 and limited to new Medicaid applicants – those receiving HCBS through § 1915 (c) I/DD waivers remain there, but those waivers are closed to new enrollment; ICF/DD services are FFS; seeking 5-year waiver extension.TX:  MLTSS began in 1998 under a § 1915(b)/(c) waiver, which was converted to § 1115; MLTSS expanded statewide as of Sept. 2014; all NF services added to MCO benefit package as of March 2015; mandatory MLTSS enrollment for children with disabilities in STAR KIDS as of Nov. 1, 2016; seeking 5-year waiver extension.VT: state entity operates as a non-risk-bearing PIHP; I/DD population included as of 2015; also includes people with TBI.SOURCE: KFF analysis of waiver special terms and conditions.
Appendix Table 2: Provisions That May Affect Access to HCBS in § 1115 Capitated MLTSS Waivers, 2015
StateSame Income Limit for HCBS and NFHigher Asset Limit for HCBS than NFProvide HCBS to Those At Risk of Instit.Financial Incentives to Encourage Health Plan Use of HCBSBenefit Package Includes HCBS and NFOffers Self-Direction Allows Payments to Family CaregiversHCBS Utilization ControlsRequires Health Plan Nursing Facility Diversion Program
AZXXXXXXXX
CAXXXX
DEXXXX
HIXXXXX
NJXXXXXX
NMXXXX
NYXXX
RIXXXXXX
TNXXXXXXX
TXXXXX
VTXXXXXX
TOTAL7 statesstates 6 states 7 states 11 states11 statesstatesstatesstates
NOTES: NJ eliminates the 5-year asset transfer look-back period for LTSS applicants at or below 100% FPL. RI allows access to a limited HCBS benefit package for 90 days via self-attestation of financial eligibility. NY’s health plan benefit package has limited Medicaid state plan benefits, including LTSS. TN allows payments to family caregivers for beneficiaries with I/DD as of 2016. Utilization controls include maximum cost and/or maximum hours per beneficiary. VT does not use private health plans and instead delivers MLTSS through a state entity.SOURCE: KFF survey of § 1115 Medicaid MLTSS waivers (2016).
Appendix Table 3: Beneficiary Protections in § 1115 Capitated MLTSS Waivers, 2015
StateIndependent Enrollment Options CounselingChange Plans Outside Open EnrollmentLTSS Quality MeasuresHealth Plan Advisory CommitteeState-Level Advisory CommitteeOmbudsman Program
AZXXX
CAXXXX
DEXXXX
HIXXXX
NJXXXXX
NMXXXXXX
NYXXXXX
RIXX
TNXXXXX
TXXXXXXX
VTN/AXX
TOTAL9 states9 states10 states5 states5 states8 states
NOTES: TN and AZ allow plan changes outside open enrollment based on hardship or to ensure continuity of care; other states allow changes if an LTSS provider leaves the plan network. LTSS quality measures include those related to rebalancing and/or quality of life.SOURCE: KFF survey of § 1115 Medicaid MLTSS waivers (2016).

Endnotes

  1. E. Reaves & M. Musumeci, Medicaid and Long-Term Services and Supports:  A Primer (Dec. 2015), https://modern.kff.org/medicaid/report/medicaid-and-long-term-services-and-supports-a-primer/. ↩︎
  2. An exception is Vermont, which uses a state entity to deliver Medicaid MLTSS on an at-risk basis. In addition, Arizona uses a state entity to delivery Medicaid MLTSS to beneficiaries with intellectual and developmental disabilities. ↩︎
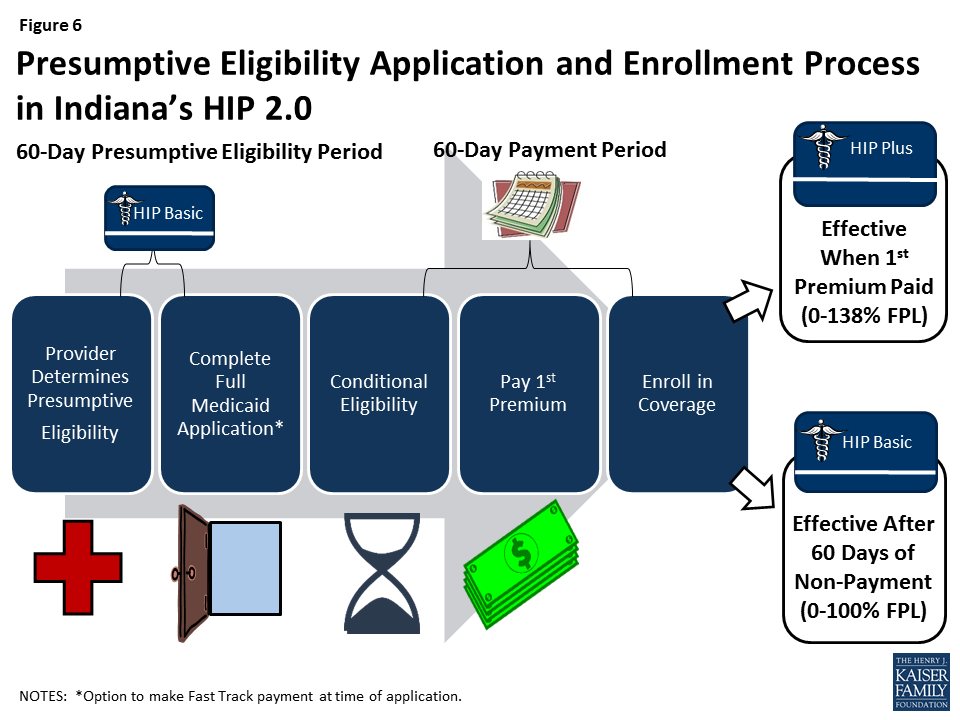
  3. S. Eiken, K. Sredl, B. Burwell, & P. Saucier, Medicaid Expenditures for Long-Term Services and Supports (LTSS) in FY 2014: Managed LTSS Reached 15 Percent of LTSS Spending, Truven Health Analytics (April 15, 2016), available at https://www.medicaid.gov/medicaid/ltss/downloads/ltss-expenditures-2014.pdf. ↩︎
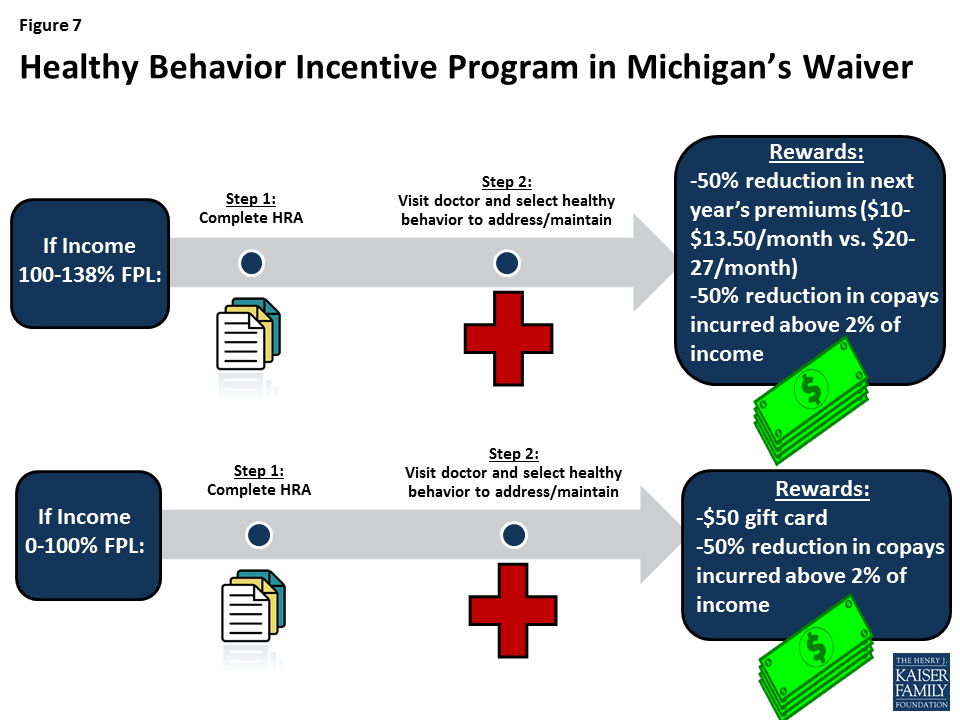
  4. J. Paradise and M. Musumeci, CMS’s Final Rule on Medicaid Managed Care:  A Summary of Major Provisions (June 2016), https://modern.kff.org/medicaid/issue-brief/cmss-final-rule-on-medicaid-managed-care-a-summary-of-major-provisions/.  In 2013, CMS issued guidance to states about best practices in MLTSS waivers, which contained many provisions that are now codified in the 2016 regulations.  CMS, Guidance to States Using 1115 Demonstrations or 1915(b) Waivers for Managed Long-Term Services and Supports Programs (May 2013), http://www.medicaid.gov/Medicaid-CHIP-Program-Information/By-Topics/DeliverySystems/Downloads/1115-and-1915b-MLTSS-guidance.pdf. ↩︎
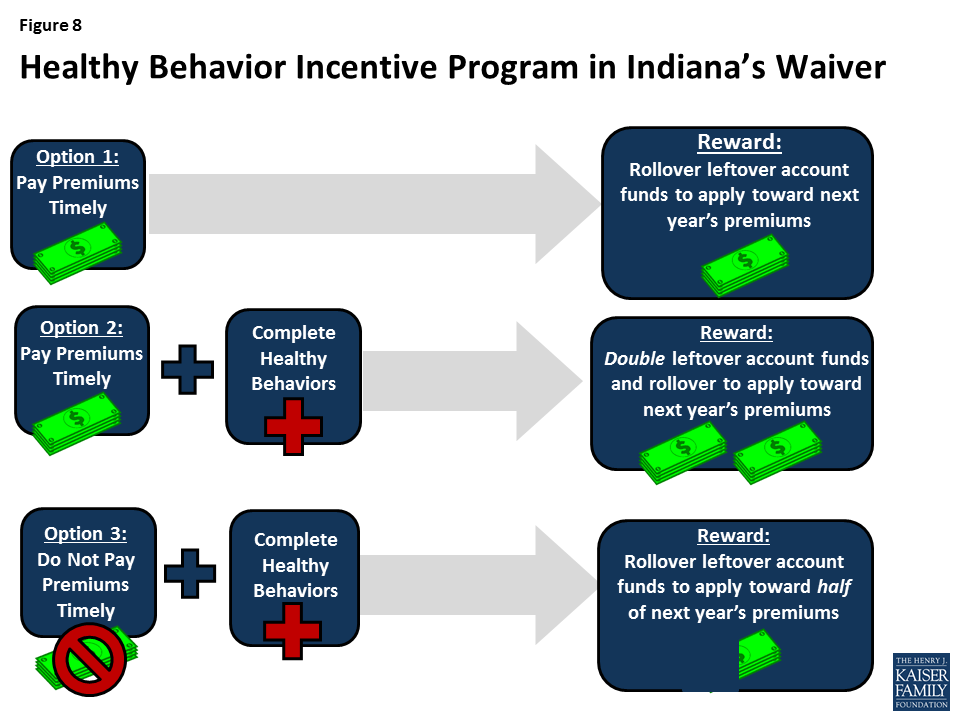
  5. Kaiser Family Foundation, Key Medicaid Questions Post-Election (Nov. 2016), https://modern.kff.org/medicaid/fact-sheet/key-medicaid-questions-post-election/. ↩︎
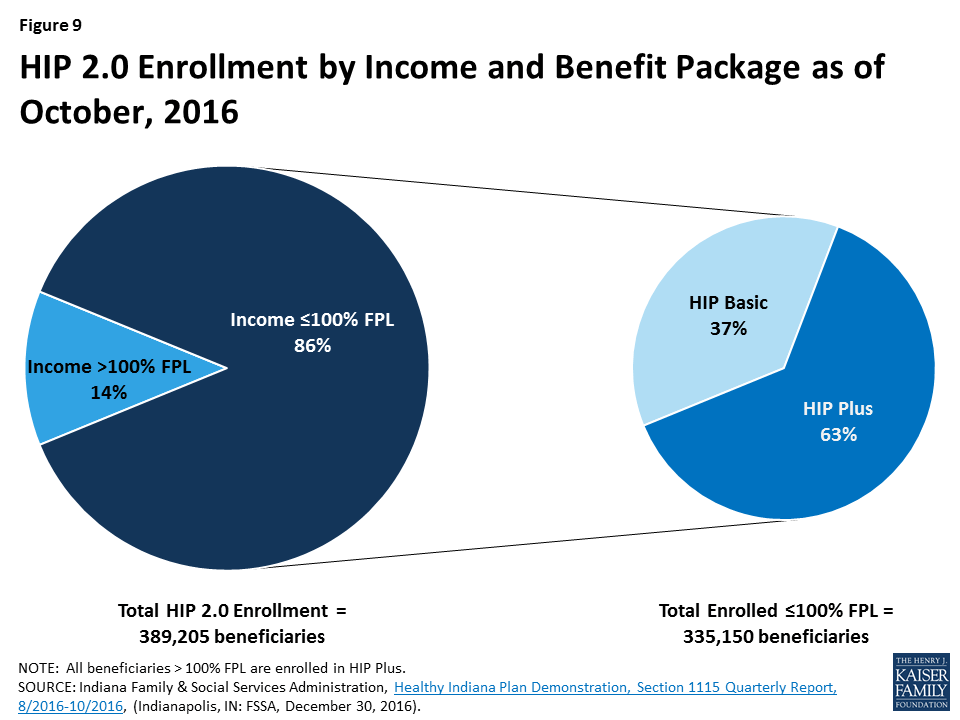
  6. See generally M. Musumeci & E. Reaves, Medicaid Beneficiaries Who Need Home and Community-Based Services:  Supporting Independent Living and Community Integration (March, 2014), https://modern.kff.org/medicaid/report/medicaid-beneficiaries-who-need-home-and-community-based-services-supporting-independent-living-and-community-integration/. ↩︎
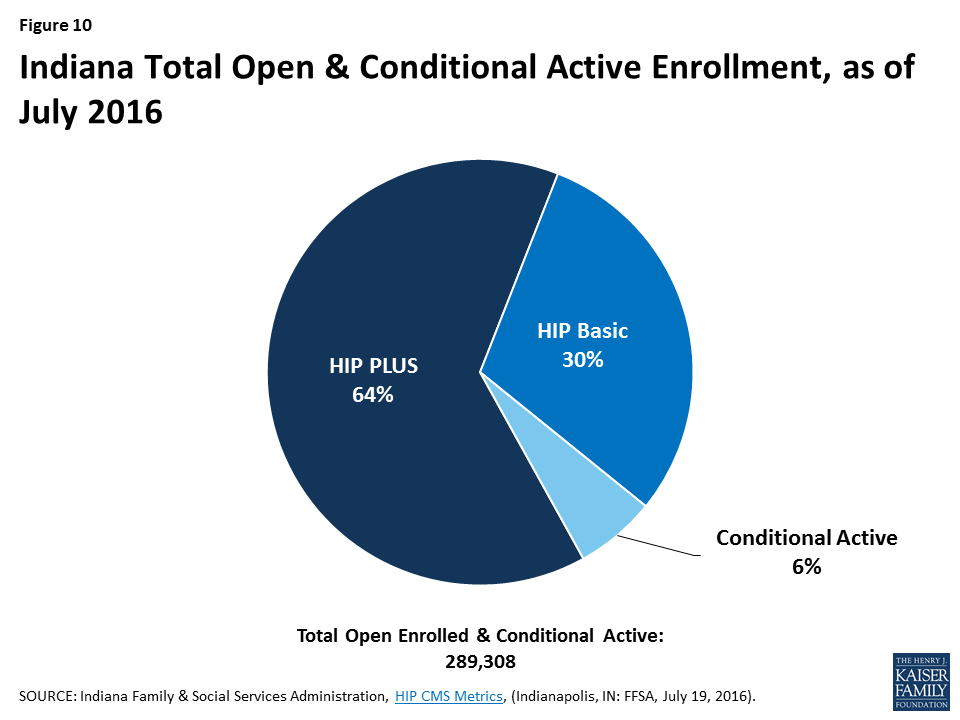
  7. See generally Kaiser Commission on Medicaid and the Uninsured, Medicaid Long-Term Services and Supports: Key Considerations for Successful Transitions from Fee-for-Service to Capitated Managed Care Programs (April 2013), https://modern.kff.org/medicaid/issue-brief/medicaid-long-term-services-and-supports-key-considerations-for-successful-transitions-fromfee-for-service-to-capitated-managed-care-programs/; Kaiser Commission on Medicaid and the Uninsured, People with Disabilities and Medicaid Managed Care: Key Issues to Consider (Feb. 2012), https://modern.kff.org/medicaid/issue-brief/people-withdisabilities-and-medicaid-managed-care/; Kaiser Commission on Medicaid and the Uninsured, Examining Medicaid Managed Long-Term Service and Support Programs: Key Issues to Consider (Oct. 2011), https://modern.kff.org/medicaid/issue-brief/examiningmedicaid-managed-long-term-service-and/; see also National Council on Disability, Medicaid Managed Care for People with Disabilities: Policy and Implementation Considerations for State and Federal Policymakers (March 2013), http://www.ncd.gov/publications/2013/20130315/. ↩︎
  8. V. Smith et al., Implementing Coverage and Payment Initiatives:  Results from a 50-State Medicaid Budget Survey for State Fiscal Years 2016 and 2017 at 47 (Oct. 2016) (citing 23 states using private health plans to deliver LTSS), available at https://modern.kff.org/medicaid/report/implementing-coverage-and-payment-initiatives-results-from-a-50-state-medicaid-budget-survey-for-state-fiscal-years-2016-and-2017/.  We also include a 24th state, Vermont, in which a state entity acting as a prepaid health plan delivers MLTSS on an at-risk basis. ↩︎
  9. Section 1115 demonstration waivers authorize “experimental, pilot, or demonstration projects” that, in the view of the Health and Human Services Secretary, “promote the objectives” of the Medicaid program. Section 1115 allows CMS to waive state compliance with certain provisions of federal Medicaid law and also may include expenditure authority through which states can receive federal matching funds for costs that otherwise would not qualify for Medicaid funding. Kaiser Commission on Medicaid and the Uninsured, Five Key Questions and Answers About Section 1115 Medicaid Waivers (June 2011), https://modern.kff.org/health-reform/issue-brief/five-key-questions-and-answers-about-section/. ↩︎
  10. There were 289 individual § 1915 (c) waivers in 47 states and DC in 2013.  T. Ng et al., Medicaid Home and Community-Based Services Programs:  2013 Data Update (Oct. 2016), https://modern.kff.org/medicaid/report/medicaid-home-and-community-based-services-programs-2013-data-update/.  For background about HCBS, see CMS/Mathematica Policy Research, The HCBS Taxonomy: A New Language for Classifying Home and Community-Based Services 4 MEDICARE & MEDICAID RESEARCH REVIEW E1-E17 (2014),  http://dx.doi.org/10.5600/mmrr.004.03.b01. ↩︎
  11. These surveys have been conducted with researchers at the University of California San Francisco.  See, e.g., T. Ng et al., Medicaid Home and Community-Based Services Programs:  2013 Data Update (Oct. 2016), https://modern.kff.org/medicaid/report/medicaid-home-and-community-based-services-programs-2013-data-update/. ↩︎
  12. We exclude Kansas, which administers MLTSS through concurrent § 1115/1915 (c) waivers. ↩︎
  13. CMS, Medicaid Section 1115 Demonstrations, State Waivers List, https://www.medicaid.gov/medicaid/section-1115-demo/demonstration-and-waiver-list/waivers_faceted.html. ↩︎
  14. Section 1915 (b) allows allow CMS to waive state compliance with certain provisions of federal Medicaid law, such as those that otherwise require benefits to be provided statewide, comparability of benefits among different Medicaid populations, and beneficiaries’ free choice of provider.  Examples of states with joint § 1915 (b)/(c) capitated MLTSS waivers include Florida, Illinois, Iowa, Michigan, Minnesota, Ohio, and Wisconsin. ↩︎
  15. An exception is Kansas, which administers capitated MLTSS under concurrent § 1115/1915 (c) waivers.  See generally Kaiser Family Foundation, Medicaid Long-Term Services and Supports:  An Overview of Funding Authorities (Sept. 2013), https://modern.kff.org/medicaid/fact-sheet/medicaid-long-term-services-and-supports-an-overview-of-funding-authorities/. ↩︎
  16. Section 1115 MLTSS waivers also usually include HCBS authorized under Medicaid state plan authority.  Medicaid state plan HCBS include home health, personal care, private duty nursing, physical therapy and related services, prosthetic devices, other rehabilitative services, case management, § 1915 (i) services (which are the same as those available under § 1915 (c) waivers), the § 1915 (j) self-direction option, and Community First Choice attendant care services and supports.  All of these services except home health are provided at state option.  Section 1915 (c) waiver services may include case management, homemaker/home health aide and personal care, adult day health, habilitation, respite care, other services approved by the HHS Secretary, and day treatment/partial hospitalization, psychosocial rehabilitation, and clinic services for individuals with chronic mental illness. ↩︎
  17. Other states are using § 1115 waivers to accomplish similar goals through fee-for-service delivery systems instead of capitated MLTSS.  For example, Minnesota’s § 1115 waiver expands access to HCBS in an effort to prevent beneficiaries from requiring future institutional care, and Washington has an agreement in principle with CMS to implement a § 1115 waiver that would expand HCBS while limiting access to nursing facility services. ↩︎
  18. States can set institutional and HCBS financial eligibility at 300% of SSI without waiver authority. ↩︎
  19. New York’s waiver also applies a special income standard when determining financial eligibility for people who are discharged from a nursing facility and would be eligible for HCBS via a spend down but for the spousal impoverishment rules. Specifically, New York determines financial eligibility for this population based on the HUD average fair market rent for the geographic region, reduced by 30% of the Medicaid income limit for an individual (which is considered to be available for housing costs). ↩︎
  20. The SSI asset limit for a couple is $3,000. ↩︎
  21. Rhode Island’s waiver also increases the personal needs allowance by $400 for beneficiaries in nursing facilities for 90 days who are transitioning to the community and who would be unable to afford a community placement without the increased funds. ↩︎
  22. States also can provide HCBS to beneficiaries who meet functional criteria that are less strict than those required to meet an institutional level of care under § 1915 (i) state plan authority. ↩︎
  23. With the implementation of its § 1115 MLTSS waiver, Delaware changed its NF LOC criteria to needing assistance with 2 ADLs, instead of the previous standard of 1 ADL, and established functional eligibility for HCBS for those at risk of institutionalization at 1 ADL. ↩︎
  24. All caps exclude the cost of minor home modifications. ↩︎
  25. Tennessee’s demonstration also grandfathers in other beneficiaries who were determined to be at risk of institutionalization under the state’s prior institutional level of care criteria.  A 2012 waiver amendment restricted the nursing facility level of care criteria and created an at risk group, which subsequently closed to new enrollment in 2015.  The institutional level of care criteria were revised again in 2014, and a new at risk group was defined. ↩︎
  26. For background on the Katie Beckett group, see M. O’Malley Watts, E. Cornachione, and M. Musumeci, Medicaid Financial Eligibility for Seniors and People with Disabilities in 2015 (March 2016), https://modern.kff.org/medicaid/report/medicaid-financial-eligibility-for-seniors-and-people-with-disabilities-in-2015/. ↩︎
  27. Some states also use their § 1115 waivers to enroll beneficiaries without LTSS needs in managed care.  We report enrollment totals only for beneficiaries receiving MLTSS. ↩︎
  28. Enrollment in TN is limited to new Medicaid applicants.  For a profile of a TN man with I/DD waiting for HCBS, see M. Musumeci & E. Reaves, Medicaid Beneficiaries Who Need Home and Community-Based Services:  Supporting Independent Living and Community Integration (March, 2014), https://modern.kff.org/report-section/medicaid-beneficiaries-who-need-home-and-community-based-services-beneficiary-profile_mark/. ↩︎
  29. See, e.g., Kaiser Family Foundation, Health Plan Enrollment in the Capitated Financial Alignment Demonstrations for Dual Eligible Beneficiaries (Aug. 2016), https://modern.kff.org/medicaid/fact-sheet/health-plan-enrollment-in-the-capitated-financial-alignment-demonstrations-for-dual-eligible-beneficiaries/. ↩︎
  30. Tenn. Div. of Health Care Finance & Admin., TennCare II Extension Request at 7 (Dec. 22, 2015), https://www.medicaid.gov/Medicaid-CHIP-Program-Information/By-Topics/Waivers/1115/downloads/tn/ta-tenncare-ii-pa-12222015.pdf. ↩︎
  31. Id. at 38. ↩︎
  32. Hawaii QUEST Integration Section 1115 Quarterly Report at 6 (June 29, 2015), https://www.medicaid.gov/Medicaid-CHIP-Program-Information/By-Topics/Waivers/1115/downloads/hi/QUEST-Expanded/hi-quest-expanded-qtrly-rpt-jan-mar-2015.pdf. ↩︎
  33. In 2015, there were nearly 641,000 people waiting for § 1915 (c) waiver services in 35 states.  T. Ng et al., Medicaid Home and Community-Based Services Programs:  2013 Data Update (Oct. 2016), https://modern.kff.org/medicaid/report/medicaid-home-and-community-based-services-programs-2013-data-update/.   ↩︎
  34. Texas notes that everyone on its waiting list may not be eligible for services as eligibility is not determined until services are available. ↩︎
  35. Vermont uses a state entity to deliver Medicaid MLTSS instead of private health plans. ↩︎
  36. These beneficiaries may be required to enroll in “mainstream” Medicaid managed care plans if they opt out of the specialized behavioral health plans. ↩︎
  37.   J. Paradise & M. Musumeci, CMS’s Final Rule on Medicaid Managed Care: A Summary of Major Provisions, Kaiser Commission on Medicaid and the Uninsured (June 2016), https://modern.kff.org/medicaid/issue-brief/cmss-final-rule-on-medicaid-managed-care-a-summary-of-major-provisions/. ↩︎
  38. Managed care enrollment is voluntary in Rhode Island, which offers only one health plan.  Health plan disenrollment is not applicable in Vermont, where a state entity delivers MLTSS. ↩︎
  39.   J. Paradise & M. Musumeci, CMS’s Final Rule on Medicaid Managed Care: A Summary of Major Provisions, Kaiser Commission on Medicaid and the Uninsured (June 2016), available at https://modern.kff.org/medicaid/issue-brief/cmss-final-rule-on-medicaid-managed-care-a-summary-of-major-provisions/. ↩︎
  40. Spending totals include institutional services and HCBS but exclude administrative costs. ↩︎
  41. More detailed expenditure data are expected across states as of FY 2016, because CMS has begun requiring states to report Medicaid managed care spending in three categories: acute care, institutional LTSS, and non-institutional LTSS. S. Eiken, K. Sredl, B. Burwell, & P. Saucier, Medicaid Expenditures for Long-Term Services and Supports (LTSS) in FY 2014: Managed LTSS Reached 15 Percent of LTSS Spending, Truven Health Analytics (April 15, 2016), available at https://www.medicaid.gov/medicaid-chip-program-information/by-topics/long-term-services-and-supports/downloads/ltss-expenditures-2014.pdf. ↩︎
  42. The lack of affordable and accessible community-based housing is a major barrier to transitioning Medicaid beneficiaries from institutions to the community.  M. Musumeci and M. Watts, Lessons Learned from Eight Years of Supporting Institutional to Community Transitions Through Medicaid’s Money Follows the Person Demonstration, Kaiser Commission on Medicaid and the Uninsured (October 2015), available at https://modern.kff.org/medicaid/perspective/lessons-learned-from-eight-years-of-supporting-institutional-to-community-transitions-through-medicaids-money-follows-the-person-demonstration/.    Medicaid can fund housing-related services, such as housing transition and tenancy sustaining services and collaborative activities to identify and secure housing resources.  CMS, Coverage of Housing-Related Activities and Services for Individuals with Disabilities (June 26, 2015), https://www.medicaid.gov/federal-policy-guidance/downloads/cib-06-26-2015.pdf. ↩︎
  43. New York also offers Medicaid expansion HCBS, for which eligibility is similar to benefits provided under a § 1915 (c) HCBS wavier.  These services include assistive technology, community integration counseling and services, community transition services, congregate/home delivered meals, environmental modifications, home and community support services, home maintenance, home visits by medical personnel, independent living skills training, intensive behavioral programs, medical social services, moving assistance, nutritional counseling/education, peer mentoring, positive behavioral interventions, respiratory therapy, respite care, service coordination, social day care, structured day programs, substance abuse programs, transportation, and wellness counseling services. ↩︎
  44. For initial eligibility, Texas beneficiaries must have a service plan that meets the cost limit. ↩︎
  45. For more information about Tennessee, see M. Watts, E. Reaves, & M. Musumeci, Tennessee’s Money Follows the Person Demonstration:  Supporting Rebalancing in a Managed Long-Term Services and Supports Model (April 2014), https://modern.kff.org/medicaid/issue-brief/tennessees-money-follows-the-person-demonstration-supporting-rebalancing-in-a-managed-long-term-services-and-supports-model/; M. Watts, E. Reaves, & M. Musumeci, Money Follows the Person Demonstration Program:  Helping Medicaid Beneficiaries Move Back Home (April 2014) (profiles two TN MFP beneficiaries), https://modern.kff.org/medicaid/issue-brief/money-follows-the-person-demonstration-program-helping-medicaid-beneficiaries-move-back-home/. ↩︎
  46. MFP funding expired in September 2016, although states have until 2020 to spend their remaining funds. See generally M. Musumeci and M. Watts, Lessons Learned from Eight Years of Supporting Institutional to Community Transitions Through Medicaid’s Money Follows the Person Demonstration, Kaiser Commission on Medicaid and the Uninsured (October 2015), available at https://modern.kff.org/medicaid/perspective/lessons-learned-from-eight-years-of-supporting-institutional-to-community-transitions-through-medicaids-money-follows-the-person-demonstration/. ↩︎
  47. See generally M. Musumeci, Measuring Long-Term Services and Supports Rebalancing (Feb. 2, 2015), https://modern.kff.org/medicaid/fact-sheet/measuring-long-term-services-and-supports-rebalancing/; M. Musumeci, Rebalancing in Capitated Medicaid Managed Long-Term Services and Supports Programs:  Key Issues from a Roundtable Discussion on Measuring Performance (Feb. 2015), https://modern.kff.org/medicaid/issue-brief/rebalancing-in-capitated-medicaid-managed-long-term-services-and-supports-programs-key-issues-from-a-roundtable-discussion-on-measuring-performance/.  In September, 2016, the National Quality Forum issued a final report on performance measure gaps in HCBS, including a list of characteristics describing high quality HCBS and a measurement framework.  National Quality Forum, Measuring HCBS Quality, http://www.qualityforum.org/Measuring_HCBS_Quality.aspx↩︎
  48. Delaware also is listed as participating on http://nci-ad.org/ but did not indicate this in its survey response. ↩︎
  49. J. Paradise & M. Musumeci, CMS’s Final Rule on Medicaid Managed Care: A Summary of Major Provisions, Kaiser Commission on Medicaid and the Uninsured (June 2016), https://modern.kff.org/medicaid/issue-brief/cmss-final-rule-on-medicaid-managed-care-a-summary-of-major-provisions/. ↩︎
  50. Id.  ↩︎
  51. Id.  ↩︎
  52. Id.  ↩︎

5 Key Questions: Medicaid Block Grants & Per Capita Caps

Author: Robin Rudowitz
Published: Jan 31, 2017

Medicaid provides health and long-term care coverage to more than 70 million low-income children, pregnant women, adults, seniors, and people with disabilities in the United States. The program represents $1 out of every $6 spent on health care in the US and is the major source of financing for states to provide coverage to meet the health and long-term needs of their low-income residents. Medicaid is administered by states within broad federal rules and jointly funded by states and the federal government. President Trump and other GOP leaders have called for fundamental changes in the structure and financing of Medicaid. The basics of Medicaid financing as well as core program requirements and flexibility are discussed in these companion briefs. This brief outlines five key questions to consider as the debate moves forward as well as some potential implications of these changes for states, beneficiaries and providers.

1.  What Medicaid Financing Changes are currently being considered?

President Trump and other GOP leaders have called for fundamental changes in Medicaid financing that could limit federal financing for Medicaid through a block grant or a per capita cap.  Unlike current law where eligible individuals have an entitlement to coverage and states are guaranteed federal matching dollars with no pre-set limit, the proposals under consideration could eliminate both the entitlement and the guaranteed match to achieve budget savings and to make federal funding more predictable. To achieve budget savings, federal funding limits would be set at levels below expected levels if current law were to stay in place.  In exchange for these federal caps, proposals could allow states to eliminate the entitlement to coverage and impose enrollment caps or waiting lists or reduce eligibility levels or offer states other increased flexibility to design and administer their programs.  Many proposals do not specify the rules for state matching payments or what core federal eligibility and coverage standards would be changed.  (Figure 1)

Figure 1: A block grant or per capita cap would be a fundamental change to Medicaid financing.

2.  How would a block grant work?

Under a block grant, states would receive a pre-set amount of funding for Medicaid.  Typically, a base year of Medicaid spending would be established and then the cap would increase by a specified amount each year, typically tied to inflation or inflation plus some percentage.  To generate federal savings, the total amount of federal spending would be less than what is expected under current law.  Under current law, federal Medicaid spending matches states spending for eligible beneficiaries and services without a pre-set limit.  If state spending increases due to increased enrollment or program costs, then federal spending increases as well.  Under a block grant, if program costs exceed the federal spending cap due to increased enrollment during a recession or rise in health costs for example, states would have to increase state spending or reduce enrollment or services.  (Figure 2)

Figure 2: Under a block grant, reductions in federal spending are obtained by setting caps below expected spending.

3.  How would a per capita cap work?

Under a per capita cap, federal funding per enrollee would be capped.  A base year of per enrollee spending would be determined and then that amount would increase over time by a pre-set amount (i.e. inflation or inflation plus a percentage).  These per enrollee caps could be determined for all enrollees or separate caps could be calculated based on broad Medicaid coverage groups (children, adults, elderly and people with disabilities).  States would receive the sum of the per enrollee amounts multiplied by the number of enrollees in each group.  To achieve federal savings, per enrollee spending would be set to increase slower than expected under current law. Although this approach adjusts for enrollment it would still not address increases in health costs or changes in technology that increase per enrollee spending.  (Figure 3)

Figure 3: Under a per capita cap, reductions in federal spending are obtained by setting caps below expected spending.

4.  What Details Do You Need to Know to Understand these proposals?

What happens with the ACA Medicaid expansion?  Proposals to change Medicaid financing are occurring at the same time as policy makers are also considering options to repeal and potentially replace the ACA.  For states that have adopted the Medicaid expansion, Medicaid coverage and financing are at risk with repeal. From January 2014 through September 2015 states have claimed $93 billion in federal dollars tied expansion group enrollees that in the first quarter of 2016 covered 14.4 million adults of which 11.2 million were newly eligible.  Enhanced federal dollars and gains in coverage are at risk with repeal.  The magnitude of the effects will largely depend on what may replace the ACA and if any savings from repeal can be maintained by the state.  For states that have not adopted the expansion the question is whether they are locked into that decision thereby resulting in a lower spending base than expansion states.

What are the federal savings targets?  One key issue for either a block grant or per capita cap approach is understanding how much in federal savings are anticipated from the proposal. While states may gain additional flexibility to administer their programs, these new options are not likely to make up for significant cuts in federal spending and maintain coverage.  Medicaid accounts for over half of all federal funds spent by states.  Some proposals dating back to the House Budgets in 2011 and 2012 and the House Budget from 2016 included cuts of about 40% (including the ACA repeal and Medicaid caps in federal spending) over a ten year period (Figure 4).  Analysis of the 2011 and 2012 proposals showed federal cuts of this magnitude could result in enrollment cuts of 25% to 35% due to just the Medicaid caps and up to 50% including the repeal of the ACA if states did not offset the federal reductions.  The Congressional Budget Office estimates of the 2011 plan said the cuts would likely require states to reduce payments to providers, curtail eligibility for Medicaid, provide less extensive coverage to beneficiaries, or pay more themselves than would be the case under “current law.”

Figure 4: The budget resolution from March 2016 would have reduced federal Medicaid spending by 41% over the 2017-2026 period.

How would policy makers set the base year or starting point?  A block grant or per capita cap model would set a base year of Medicaid financing for states. Policy makers would need to consider what payments or populations to include or exclude (such as disproportionate share hospital payments (DSH), Medicare premium amounts, enrollees eligible for limited benefits such as family planning, duals or home and community-based services only).  If the base year is set based on actual spending from a prior year, this would lock-in historic spending and policy decisions. Decisions around the base year would need to address whether to include or exclude the ACA Medicaid expansion funding and whether the base would lock-in those choices around the ACA.  Lack of administrative data could make determining a base year difficult.

Would states need to contribute state dollars for Medicaid?  Whether states would still need to use state funds to access federal funds and whether there would be limits in the sources of state funds (such as limits to provider taxes) are critical to overall Medicaid funding.  All states except Alaska use provider taxes (the majority of states have more than three provider taxes). Some proposals could require state matching dollars up to the cap, but others could provide states with a lump sum of federal money without state matching requirements. Reductions in state spending could compound the impact of federal spending reductions and have larger effects for enrollees and providers.

What new flexibility would states be granted?  Medicaid financing reform proposals are often tied to promises of additional flexibility for states.  Under current law, Medicaid balances core requirements and standards with state flexibility, accountability for federal dollars and beneficiary protections. Currently, all states offer additional coverage for children and additional benefits that are not required by the law. States have considerable flexibility to determine how to pay for and deliver services to beneficiaries, and most states impose nominal copayments for some populations or services.  Some proposals have called for new flexibility to increase premiums and cost sharing, reduce benefits and impose work requirements but have not addressed eligibility or benefit requirements. These new flexibilities would primarily apply to adults and not the elderly and disabled populations that account for the majority of Medicaid spending. Proposals have not been specific about federal oversight and how states would be accountable for federal Medicaid dollars.

5.  What are the implications of a block grant or a per capita cap?

These financing designs could lock in historic spending patterns and variation in Medicaid spending across states. There is significant variation in Medicaid spending across states due to a number of factors including state policy decisions, but also state revenues, health care markets, and the demographics and demand for Medicaid services. Determining a base year and allowing for a fixed amount of growth would lock-in these historic variations in spending; however, alternatives to move to more uniform spending could result in redistributions of federal spending across states. Either option can result in states deemed “winners” or “losers”.  (Figure 5) The magnitude of state variation will also be shaped by how the ACA Medicaid expansion is treated.

Figure 5: A per capita cap could lock in historical state differences or redistribute federal funds across states.

Limiting federal financing could save federal dollars but would be less responsive to state decisions and changing program needs. Under the current financing structure federal funds are tied to actual costs, program needs and state policy decisions. If medical costs rise, more individuals enroll due to an economic downturn or there is an epidemic (such as HIV/AIDS) or a natural disaster (like Hurricane Katrina), or new treatments (like drugs for hepatitis C), Medicaid can rapidly respond and federal payments automatically adjust to reflect the added costs of the program.

Capping and reducing federal financing for Medicaid could shift costs to states, beneficiaries, and providers. To respond to reductions in federal funding states could increase state spending to maintain current programs, which would put pressure on other state spending like education.  States could also look for program efficiencies, but most Medicaid programs have few options for easy ways to trim spending. Many efficiencies were adopted by states during the last two major recessions when revenues dropped and budgets were constrained. Medicaid already grows at slower rates compared to private health insurance premiums. Most states currently operate programs with low administrative costs and provider reimbursement levels below other payers. Facing federal reductions, states would likely turn to Medicaid program cuts to eligibility, benefits, and reimbursement to providers. These cuts would put populations and providers that disproportionately rely on Medicaid at risk including poor children, the elderly and individuals with disabilities, nursing home and community-based long-term care providers and safety-net hospitals and clinics.

An Early Look at Medicaid Expansion Waiver Implementation in Michigan and Indiana

Authors: MaryBeth Musumeci, Robin Rudowitz, Petry Ubri, and Elizabeth Hinton
Published: Jan 31, 2017

Executive Summary

Michigan and Indiana are among the seven states using a Section 1115 demonstration waiver to implement Medicaid expansions in ways that differ from the terms of the Affordable Care Act (ACA).  While each waiver is unique, Michigan and Indiana’s waivers include some similar provisions.  Some of these features are not found in other waivers approved to date, although additional states have expressed interest in pursuing similar models.

This issue brief explains some of the key components in Michigan and Indiana’s waivers and presents insights based on their early implementation experiences.  The findings are based on 22 in-person and telephone interviews conducted in July and August, 2016 with state officials, providers, health plans, beneficiary advocates, and enrollment assistors in Michigan and Indiana, and incorporate data and reports from the state Medicaid agencies and other publicly available sources. We also conducted four focus groups (two in each state) with beneficiaries enrolled in waiver coverage to learn about their firsthand experiences.

Key Provisions in Michigan and Indiana’s Expansion Waivers

Michigan and Indian’s expansion waivers both include provisions related to premiums, health accounts and healthy behavior incentive programs.  However, the populations subject to premiums, the consequences for failure to pay, the process to effectuate coverage, and the administration of the health accounts and healthy behavior incentive programs vary considerably between the two states. The waiver in Indiana includes some additional provisions including a waiver of non-emergency medical transportation (NEMT) and those that alter the effective coverage date. Both Michigan and Indiana had used Section 1115 demonstration waivers to provide limited benefit coverage to some adults prior to the ACA.  Michigan provided a limited benefit package to childless adults up to 35% FPL, and Indiana provided a limited benefit package with a high deductible health account to parents and a capped number of childless adults up to 100% FPL, called HIP 1.0. Box 1 provides a description of the key provisions in the current ACA expansion waivers.

Box 1:  Description of Key Provisions in Healthy Michigan and HIP 2.0 Waivers

Healthy Michigan was implemented in April 2014.  Expansion adults in Michigan include working parents from 64-138% FPL, jobless parents from 37-138% FPL, and childless adults from 0-138% FPL. Additional changes for those from 100-138% will take effect in April, 2018.

  • Premiums. Expansion adults with income from 100-138% FPL ($990-$1,366 per month for an individual in 2016) pay monthly premiums of 2% of income (about $20 to $27/month) into health accounts. Failure to pay premiums does not result in a loss of Medicaid eligibility, but past due premiums can be recouped from state income tax refunds or lottery winnings. Premium payments are due until after six months of enrollment.
  • Copayments.  Expansion adults make monthly payments into health accounts based on their average copayments, at state plan amounts, for services used in the previous six months. Failure to pay copayments does not result in a loss of Medicaid eligibility, but past due copayments can be recouped from state income tax refunds or lottery winnings.
  • Health Accounts and Healthy Behavior Incentives. Care is provided by health plans in exchange for capitation payments.  In Michigan, compliance with specified healthy behaviors results in a 50% reduction in future premiums for those above poverty and a $50 gift card for those below poverty.

Indiana’s HIP 2.0 was modeled on Indiana’s pre-ACA coverage expansion, HIP 1.0, and implemented in February, 2015.  The waiver applies to expansion adults as well as some traditional Medicaid enrollees including parents. Expansion adults include working parents from 24-138% FPL, jobless parents from 18-138% FPL, and childless adults from 0-138% FPL.

  • Premiums and Effective Coverage Date. Premiums are 2% of income for all waiver beneficiaries (including some traditional Medicaid enrollees such as parents). Those with income from 0-5% FPL (up to $50/month in 2016) pay a flat $1.00/month. Premiums are paid into a Personal Wellness and Responsibility (POWER) health account.  Non-medically frail expansion adults with income from 100-138% FPL must pay a premium to effectuate coverage; those who fail to pay premiums within 60 days are dis-enrolled and locked out of coverage for six months.  Coverage for expansion adults from 0-100% FPL does not begin until payment of a premium or the expiration of the 60-day premium payment period.  Expansion adults from 0-100% FPL who fail to pay premiums within 60 days are moved to a more limited benefit package (HIP Basic, without dental and vision benefits and with more limited prescription drug coverage) and incur point-of-service copayments. Traditional Medicaid enrollees who do not pay premiums are guaranteed state plan benefits. Policies including the Fast Track premium pre-payment option and an expanded presumptive eligibility program are intended to help reduce delays in effectuating coverage.
  • Copayments.  Expansion adults with incomes below poverty who fail to pay premiums receive the more limited benefit package and must make point of service copayments.  HIP 2.0 authorizes a two-year demonstration to test whether graduated copayments ($8 for first visit and $25 for subsequent visits in the same year) discourage non-emergency use of the ER.
  • Health Accounts and Healthy Behavior Incentives. In Indiana, health plans provide care after exhausting the $2,500 POWER account deductible (funded by the state and beneficiary premiums). Beneficiaries who pay premiums and / or receive preventive services can rollover a portion of their share of the unused POWER account balance at the end of the year to apply to the next year’s premiums.
  • Non-Emergency Medical Transportation (NEMT). Indiana received a time-limited waiver of the responsibility to provide NEMT to non-medically frail expansion adults, which CMS extended through the end of the demonstration.1 
  • Gateway to Work.  Indiana offers a voluntary state-funded work referral program, which is not part of the HIP 2.0 waiver terms and conditions.

Key Insights From Early Implementation of Michigan and Indiana Waivers

Five key insights emerge from an early look at Michigan and Indiana’s Medicaid expansion waivers.

  1. Medicaid expansion design, whether through state plan authority or waivers, is highly dependent on the features of a state’s underlying Medicaid program. Michigan and Indiana both had implemented limited adult coverage expansions through waivers prior to the ACA, and these expansions along with the states’ pre-existing Medicaid delivery systems influenced the structure and design of their post-ACA waivers. Michigan incorporated its pre-existing capitated managed care delivery system into Healthy Michigan, while Indiana modified its pre-existing high deductible health account model under HIP 2.0.  Regardless of whether a state adopts a traditional expansion or uses a waiver, expanding Medicaid can result in substantial reductions in the uninsured and increased access to needed health care.2 
  2. Implementation of complex programs involves collaboration with a variety of stakeholders, sophisticated IT systems, and administrative costs. Both states’ waivers apply different rules based on differences in beneficiary income, health status, or other characteristics, which require time and resources to track.  Challenges with information exchange between the state, health plans, and providers have created some confusion and delays in effectuating coverage in Indiana.  Timely and accurate data about various beneficiary characteristics, such as income level, medical frailty, and healthy behavior status, will trigger different policies and delivery systems under the 2018 changes for those from 100-138% FPL in Michigan’s waiver, thus taking on increasing importance for the state and beneficiaries there.
  3. Premium costs and complex enrollment policies can deter eligible people from enrolling in coverage. Particularly for very low-income populations, even very low premiums may be unaffordable, and the cost of making payments (i.e., purchasing a money order) may add increased financial strain as well as a barrier.  Policies in Indiana that tie the start of the coverage period to making a payment can be a further impediment, deterring some eligible people from enrolling.  In addition, assessing the affordability of premiums in Indiana is challenging because it is difficult to track and adjust premium payment amounts for populations with frequent changes in income and to track how many individuals receive help from third parties to pay premiums.
  4. Health accounts can be confusing for beneficiaries. Beneficiaries in our focus groups as well as advocates and providers in both states did not demonstrate a clear understanding of the policies associated with these models. This feedback shows that these models are hard to understand even in Indiana, a state with long-standing experience with health accounts.
  5. Beneficiary and provider education and tangible incentives appear central to implementing healthy behavior incentive programs. Beneficiaries in both states indicated that gift cards that could be used immediately to purchase needed items were more appealing rewards than decreased cost-sharing amounts in the future, which is understandable, given the low incomes and precarious financial situation of many beneficiaries and the complicated formulas to calculate future cost-sharing reductions.  To date, it is too early to determine if health accounts and healthy behavior incentives can change behavior, lead to more efficient use of health care services, and improve health outcomes, but these items hopefully will be assessed in the formal waiver evaluations.

Looking ahead from a national perspective, it is not yet clear what role Section 1115 Medicaid expansion waivers will play as the new Administration and Congress move to repeal the ACA and debate possible broader changes to Medicaid financing such as a block grant or per capita cap.3   Repeal of the ACA would remove the statutory authority to cover expansion adults and the associated federal financing.  However, given that some other states have expressed interest in pursuing Medicaid expansion waivers with components similar to those in Michigan and Indiana, it is important to understand the administrative framework and early implementation challenges and successes of the models being tested in Michigan and Indiana as more formal evaluations are conducted.

Key Provisions

Introduction

Michigan and Indiana are among the seven states using a Section 1115 demonstration waiver to implement Medicaid expansions in ways that differ from the terms of the Affordable Care Act (ACA).4  The ACA expands Medicaid to nearly all non-elderly adults with income up to 138% of the federal poverty level (FPL, $16,394 per year for an individual in 2016), as of January, 2014, although the Supreme Court’s ruling on the ACA’s constitutionality effectively made the expansion optional for states.  The law also provides 100% federal funding for the expansion through 2016, declining gradually to 90% in 2020 and thereafter.5  Twenty-five of the 32 states adopting the Medicaid expansion as of December, 2016 have done so through traditional state plan authority, as envisioned by the ACA, with the Obama Administration approving waivers in the remaining seven states.

While each waiver is unique, Michigan and Indiana’s waivers include some similar provisions.  Appendix Table 1 lists the specific waiver authorities granted in each state.  Some of these features are not found in other waivers approved to date, although additional states have expressed interest in pursuing similar models. This issue brief explains key components of Michigan and Indiana’s waivers and presents findings based on the two states’ early implementation experiences.  The findings are based on 22 in-person and telephone interviews conducted in July and August, 2016 with state officials, providers, health plans, beneficiary advocates, and enrollment assistors in Michigan and Indiana, and incorporate data and reports from the state Medicaid agencies and other publicly available sources. We also conducted four focus groups (two in each state) with beneficiaries enrolled in waiver coverage to learn about their firsthand experiences.

What are the Key Provisions in Michigan and Indiana’s Medicaid Expansion Waivers?

Michigan and Indiana’s waivers both include provisions related to premiums, health accounts, and healthy behavior incentive programs.  However, the populations subject to premiums, the consequences for failure to pay, the process to effectuate coverage, and the administration of the health accounts and healthy behavior incentive programs vary considerably between the two states.

Programs in Place Prior to Medicaid Expansion

To understand Michigan and Indiana’s waivers, it is important to also understand the scope of Medicaid coverage in these states before they implemented the ACA’s Medicaid expansion.  Under federal law before the ACA, adults without dependent children only could be covered through Section 1115 demonstrations, which required states to achieve savings in other areas so that federal Medicaid matching funds could be used to expand coverage.  The ACA creates a new eligibility pathway and authorizes federal matching funds for these adults, eliminating the need for waiver authority and budget savings to provide coverage.  Prior to 2014, Michigan and Indiana both had established limited coverage expansions through Section 11115 waivers:  Michigan provided a limited benefit package to childless adults up to 35% FPL, and Indiana provided a limited benefit package with a high deductible health account to parents and a capped number of childless adults up to 100% FPL, called HIP 1.0.

Premiums and Effective Coverage Date

Under federal law, Medicaid beneficiaries with income below 150% FPL cannot be charged premiums, and premium payments cannot be required to effectuate coverage.  Instead, coverage is effective as of the application date with retroactive coverage for medical bills incurred up to 90 days prior to application.  Michigan and Indiana both obtained waiver authority to impose premiums on beneficiaries with income from 100-138% FPL, and Indiana obtained additional waiver authorities to alter the effective date of coverage.

Michigan

In Michigan, expansion adults with income from 100-138% FPL ($990-$1,366 per month for an individual in 2016) pay monthly premiums of 2% of income (about $20 to $27/month) into health accounts (Figure 1).  Failure to pay premiums does not result in a loss of Medicaid eligibility, but past due premiums can be recouped from state income tax refunds or lottery winnings. Michigan’s application and enrollment process was not changed by its waiver. Beneficiaries can enroll in coverage after being determined eligible, and no premium payments are due until after six months of enrollment (Figure 2).  Additionally, Michigan applies the federal rule that provides for coverage of medical bills incurred up to 90 days prior to Medicaid eligibility.

Figure 1: Premiums, Copays and Benefit Package by Income in the Healthy Michigan Waiver
Figure 2: Application and Enrollment Process under Healthy Michigan
Indiana

In Indiana, premiums are 2% of income for all beneficiaries under the waiver, except that those with incomes from 0-5% FPL (up to $50/month in 2016) pay a flat $1.00/month (which is greater than 2% of income for those below 5% FPL) (Figure 3).  Premiums are paid into a Personal Wellness and Responsibility (POWER) health account.6 

Non-medically frail expansion adults with incomes from 100-138% FPL must pay a premium to effectuate coverage, and those who fail to pay premiums within 60 days are disenrolled and locked out of coverage for six months.  Coverage for expansion adults from 0-100% FPL does not begin until payment of a premium or the expiration of the 60-day premium payment period.  Expansion adults from 0-100% FPL who fail to pay premiums within 60 days are moved to a more limited benefit package (HIP Basic, without dental and vision benefits and with more limited prescription drug coverage) and incur point-of-service copayments. Unlike in traditional Medicaid, there is no retroactive coverage for expansion adults.

Unlike Michigan, some traditional Medicaid populations also are covered under Indiana’s waiver.  These include mandatory parents (whose eligibility is based on income thresholds associated with the former AFDC cash assistance program under Section 1931), 19 and 20 year olds, and those who are moving from welfare to work and eligible for Transitional Medical Assistance).  These groups can choose whether to pay monthly premiums or point-of-service copayments; in either case, they receive the traditional Medicaid state plan benefit package (with vision and dental) instead of the more limited HIP Basic benefit package for expansion adults from 0-100% FPL who do not pay premiums.  Coverage for these groups begins with payment of a premium or after the expiration of the 60-day premium payment period (Figure 4).

Figure 3: Premiums, Copays and Benefit Packages by Income for Expansion Adults in Indiana’s HIP 2.0 Waiver
Figure 4: Application and Enrollment Process in Indiana’s HIP 2.0

There are policies in Indiana’s waiver intended to help reduce delays in effectuating coverage, including the Fast Track premium pre-payment option (Figure 5) and an expanded presumptive eligibility program (Figure 6).  In addition, the prior claims payment program seeks to control the impact of the elimination of retroactive eligibility on traditional adults who are subject to the waiver and have incurred medical bills within the three months prior to application.

Figure 5: Application and Enrollment Process in Indiana’s HIP 2.0 with Fast Track
Figure 6: Presumptive Eligibility Application and Enrollment Process in Indiana’s HIP 2.0

Copayments

Federal law allows states to charge nominal copayments for certain services, including up to $8 per visit for non-emergency ER use, and all Medicaid cost-sharing is subject to a cap of 5% of family income.  In Michigan, all expansion adults make monthly payments into health accounts based on their average copayments, at state plan amounts, for services used in the previous six months. Failure to pay copayments does not result in a loss of Medicaid eligibility, but past due copayments can be recouped from state income tax refunds or lottery winnings.  In Indiana, those who pay premiums only have copayments for non-emergency use of the ER.  Expansion adults with incomes from 0-100% FPL who fail to pay premiums receive the more limited benefit package and must make point of service copayments.  HIP 2.0 also includes a two-year demonstration to test whether graduated copayments ($8 for first visit and $25 for subsequent visits in the same year) discourage non-emergency use of the ER.

Health Accounts and Healthy Behavior Incentive Programs

Both Indiana and Michigan have provisions in their waivers related to health accounts. Traditional health savings accounts are linked with high deductible health plans and allow individuals to contribute tax-free funds that can be used to cover medical expenses. The health accounts in Indiana and Michigan’s waivers do not have all of these features.  For example, beneficiary contributions are not pre-tax, and beneficiaries receive medically necessary care from capitated Medicaid health plans without regard to a traditional deductible.  In Michigan, all care is provided by health plans in exchange for capitation payments.  In Indiana, health plans provide care in exchange for capitation payments once the deductible funds are exhausted,7  and most of the $2,500 deductible is funded by the state with the remainder funded by beneficiary premiums.  Michigan requires its health plans to contract with a single third party vendor to administer the accounts, while the accounts are administered directly by the health plans in Indiana.

Both Michigan and Indiana also have healthy behavior incentive programs.  In Michigan, compliance with specified healthy behaviors results in a 50% reduction in future premiums for those above poverty and a $50 gift card for those below poverty.  All beneficiaries who comply with healthy behaviors have future monthly copayments in excess of 2% of income reduced (Figure 7). In Indiana, beneficiaries who pay premiums timely can rollover their share of the unused POWER account balance at the end of the year to apply to the next year’s premiums. The rollover balance is doubled by the state for those who receive certain preventive services as a healthy behavior reward. Those who have not paid premiums but receive preventive services can rollover account funds to apply to 50% of the amount of the next year’s premiums (Figure 8).

Figure 7: Healthy Behavior Incentive Program in Michigan’s Waiver
Figure 8: Healthy Behavior Incentive Program in Indiana’s Waiver

Other Key Provisions in Indiana’s Waiver

Non-Emergency Medical Transportation (NEMT). Indiana received a time-limited waiver of the responsibility to provide NEMT to non-medically frail expansion adults, which CMS subsequently extended through the end of the demonstration.8   Medically frail expansion adults and mandatory parents, 19 and 20 year olds, and those eligible for Transitional Medicaid Assistance receive NEMT.

Medically Frail Beneficiaries. Under federal law, beneficiaries who are determined to be medically frail must have access to the traditional Medicaid state plan benefit package and cannot be required to enroll in an alternative benefit plan (ABP).  An ABP allows states to design a benefit package based on the contents of certain private health plans, which may vary from the traditional Medicaid benefit package.  Expansion adults receive an ABP, although states must provide medically frail beneficiaries with access to traditional Medicaid benefits to the extent they differ from the ABP.  In Indiana, medically frail beneficiaries also are exempt from the lock-out for failure to pay premiums, and they must receive NEMT.  Michigan currently does not vary program rules based on medical frailty status but will do so when waiver amendments applicable to beneficiaries from 100-138% FPL take effect in April, 2018.

Gateway to Work.  Indiana offers a voluntary state-funded work referral program, which is not part of the HIP 2.0 waiver terms and conditions.  To date, HHS has not approved waiver requests that would require work as a condition of Medicaid eligibility.

Key Findings

What are the Implications for Coverage and Access under Michigan and Indiana’s Waivers?

Like other states that have expanded Medicaid, Michigan and Indiana experienced reductions in the number of uninsured residents and large gains in Medicaid enrollment.  Between 2013 and 2015, the uninsured rate fell by 7.7 percentage points in Michigan, and 7.2 percentage points in Indiana, both larger than the national average decrease of 6.1 percentage points and the 6.7 percentage point decrease in all Medicaid expansion states.9  Along with reductions in the uninsured, Michigan and Indiana both experienced large increases in Medicaid enrollment, as expected by the coverage expansion. There are over 650,000 beneficiaries enrolled in Healthy Michigan as of December 2016,10  and nearly 390,000 beneficiaries enrolled in HIP 2.0 in Indiana as of October, 2016.11   Indiana and Michigan both reported that they reached or exceeded enrollment targets shortly after implementation. Michigan and Indiana each transferred about 60,000 beneficiaries from their pre-ACA expansions to waiver coverage.12   Indiana also transferred nearly 70,000 non-expansion adults, including mandatory parents, 19 and 20 year olds, and those receiving Transitional Medicaid Assistance as they transition from welfare to work, to HIP 2.0 waiver coverage.13 

Both states are experiencing some issues with the streamlined enrollment processes and renewals required by the ACA, which are not unique to their waivers. In Michigan, eligibility determinations can be processed within one day; however, individuals with more complex income situations, such as self-employed or seasonal workers, can experience waits.  In Indiana, those who were enrolled in the state’s pre-ACA expansion seemed to transition smoothly to HIP 2.0, but new Medicaid applicants often appeared to experience a harder time with HIP 2.0 enrollment.  Many Indiana beneficiaries, advocates, and enrollment assisters reported waiting 30 to 45 days to receive an eligibility determination, and some reported waits of 8 to 10 months.  In both states, renewal notices were described as confusing, leading some eligible beneficiaries to lose coverage at renewal. To help retain eligible beneficiaries in coverage, Michigan is working to implement a passive renewal process, and Indiana began its passive renewal process in June, 2015.14 

Beneficiaries were able to access needed health care services with their new Medicaid coverage, although challenges remain in certain areas.  Many people who gained coverage in both states previously had been uninsured or had sporadic periods of coverage, leaving them without reliable access to primary care. Others previously had employer-sponsored coverage that they found unaffordable.  Participants in our focus groups reported that obtaining Medicaid gave them peace of mind along with the ability to address health problems and access needed services, including primary, preventive and specialist care, mental health services, dental care, and prescription drugs.  These observations are supported by Michigan state data showing that beneficiaries could get appointments and access care.15  There were some reports of beneficiaries in both states encountering challenges accessing certain services, including dental and behavioral health, similar to other states and at least partially attributed to pent-up demand by those who were previously uninsured. These access issues were reported as more pronounced in rural areas.

What is the Effect of Premiums in Michigan and Indiana?

Michigan

Although Michigan beneficiaries cannot be disenrolled from coverage or denied services for failure to pay premiums, some have had their state income tax refunds garnished. The state began charging premiums in October, 2014.  From October, 2014 through July, 2016, about 38% of beneficiaries who owed premiums had paid them, resulting in collection of 31% of premiums owed (about $4.7 million out of $15.5 million).16  A Michigan state report to CMS noted that some beneficiaries calling the help line about their quarterly health account statements reported an inability to pay amounts owed.17  As of July, 2016, over 112,000 Michigan beneficiaries owed past due premiums or copayments, but only about 44,200 (less than 40%) of these were in “consistent failure to pay” status, subjecting them to garnishment.18   Beneficiaries reach “consistent failure to pay” status when they have not paid premiums and/or copayments within three consecutive months and owe at least $50 or when they have not paid at least half of their total premiums and copayments billed in the last year. The state recovered over $207,000 from about 2,150 tax refund intercepts and an additional $380 from six lottery winners from October 2014 through October 2016.19 

Beneficiary advocates and enrollment assisters in Michigan noted that money order fees could sometimes equal or exceed the amount of premiums or copayments owed. Money orders are a common form of payment for those without bank accounts or credit cards.  Of those making payments in Michigan, 71% are sending payments through the mail as of July 2016.20  Unlike Indiana, credit cards are not accepted as a form of payment in Michigan, although some beneficiary advocates preferred this policy as they saw it as preventing beneficiaries from accumulating consumer debt for health care costs that they could not afford.  Other payment challenges reported by Michigan beneficiaries included lack of money or competing demands due to family caregiving responsibilities, joblessness, disability, and hospitalization.21 

Indiana

More than one-third (37%) of HIP 2.0 enrollees with incomes below poverty were not paying monthly premiums and therefore were enrolled in HIP Basic, the more limited benefit package with point-of-service copayments, as of October, 2016 (Figure 9). The consequences for failing to pay premiums vary by income in Indiana (Figure 2). The large majority (86%) of HIP 2.0 beneficiaries have incomes below poverty, and as of October, 2016, 63% of these beneficiaries were paying monthly premiums to enroll in HIP Plus, the expanded benefit package with dental and vision benefits and without point-of-service copayments.22 

Figure 9: HIP 2.0 Enrollment by Income and Benefit Package as of October, 2016

To date, a limited number of Indiana beneficiaries with income above poverty have been locked out of coverage for failure to pay monthly premiums. Approximately 14% of HIP 2.0 enrollees have income above poverty and therefore are subject to disenrollment and a 6-month coverage lock-out for failure to pay monthly premiums after a 60-day grace period. Between August and October, 2016, 4,621 HIP 2.0 beneficiaries were disenrolled and locked out of coverage for six months for failing to pay premiums.23   Based on the state’s enrollment data, this represents about 8.5% of beneficiaries with incomes above poverty.

“…You have to sit out for six months and pray you don’t get sick for six months.” – Indiana Medicaid Enrollee

However, individuals at all income levels in Indiana thought the lock-out applied to them.  This belief was reported by beneficiaries in our focus groups as well as advocates and providers interviewed in Indiana, and may be due to the fact that under Indiana’s pre-ACA waiver (HIP 1.0), beneficiaries at all income levels were subject to disenrollment and a 12-month lock-out for failure to pay premiums.24 

More than half of HIP 2.0 beneficiaries are assessed the flat minimum premium of $1.00 per month. Those with income from 0-5% FPL pay flat $1.00 monthly premiums to access HIP Plus benefits, instead of paying premiums at 2% of income.  A large share of HIP 2.0 enrollees (51.5%) are reported by the state as having income between 0-5% FPL (up to about $50 per month for an individual in 2016) as of July, 2016.25  The high share of individuals in this group may be due to the administrative challenges of having to track and re-adjust premium amounts based on changes in income in a population that experiences frequent income fluctuations.

Data may be understating the number of HIP 2.0 beneficiaries receiving financial assistance to pay premiums. As of January 2016, 124 employers and 75 non-profit organization are recognized by the state as third parties making premium payments on behalf of 131 and 1,244 beneficiaries, respectively (less than 1% of beneficiaries).26   However, beneficiary advocates, health center staff, and enrollment assistors report that many more beneficiaries receive financial assistance than are reflected in the data and observed that family, friends, churches, and community-based organizations often are paying premiums for beneficiaries through informal arrangements that are not reflected in the state data. The state acknowledges that its data are limited to entities that have a formal arrangement with health plans as a third party payer.  A 2015 state survey of HIP 2.0 beneficiaries found that 30% of those paying premiums to receive the enhanced HIP Plus benefit package reported receiving help with premiums as opposed to paying on their own.27  Among those who reported receiving help, 86% said they had help from a family member, and 25% said they had help from a friend (respondents could report more than one source of help).28 

Indiana health centers, enrollment assisters, and beneficiary advocates reported that premiums presented affordability barriers, especially for those with the lowest income.  These interviewees reported affordability issues especially for people with no or very low income and those who are homeless.  Previous research has shown that premiums act as barriers to obtaining and maintaining coverage for those with low incomes.29 

What is the Effect of Changes in the Effective Coverage Date in Indiana?

Under Indiana’s waiver, the requirement that individuals pay an initial premium before HIP Plus coverage is effective means that some people above poverty who are otherwise eligible for coverage do not enroll, and some applicants below poverty may experience waits of up to 60 days in effectuating coverage.  Under HIP 2.0, there are two steps in the enrollment process that may postpone coverage (Figure 4). There is a period of time between the application and the conditional eligibility determination, and then an additional period from conditional eligibility to enrollment in coverage. Beneficiaries who have been determined otherwise eligible for HIP 2.0 but have not made their first premium payment are considered “conditionally eligible” for 60 days.

In July, 2016, 6% of those determined otherwise eligible for HIP 2.0 were considered conditionally eligible and need to pay their premium or for those at or below 100% FPL, wait for the 60-day payment period to expire to obtain coverage.  The remaining individuals were enrolled in HIP Plus or HIP Basic coverage30  (Figure 10).  The interim waiver evaluation prepared for the state noted that the number of conditionally eligible people may be as high as 30,000 during any given month31  and estimated that approximately two-thirds of conditionally eligible applicants eventually enroll in coverage by the end of the 60-day payment period,32  either by paying a premium to enroll, or for those from 0-100% FPL, defaulting to the Basic benefit package due to non-payment after 60 days, leaving approximately one-third eligible but unenrolled.

Figure 10: Indiana Total Open & Conditional Active Enrollment, as of July 2016

The “Fast Track” premium pre-payment option and expanded presumptive eligibility policies were adopted to safeguard against lengthy delays in effectuating coverage in Indiana, but beneficiaries, advocates, and enrollment assisters reported administrative complexity and confusion with these options. HIP 2.0 applicants could make the $10 Fast Track pre-payment by mail beginning in March 2015 (after they received an invoice from their selected health plan) and online by credit or debit card at the time of application beginning in June 2015.33   According to state data, 18% of total HIP 2.0 ever-enrolled members made Fast Track payments as of January 2016.34  However, some enrollment assisters and beneficiaries reported that Fast Track payments were lost or not showing up in the health plans’ IT systems leading to lags in effectuating coverage.35  Health plans do not process online Fast Track payments until the Medicaid eligibility determination is received from the state, and there have been issues with that information transfer process, generating confusion for providers, plans, and beneficiaries about coverage status.  Some beneficiaries reported receiving Fast Track invoices from multiple health plans and difficulty having a payment they had made applied to their selected plan.

Between August and October, 2016, nearly 25,000 people were determined presumptively eligible for HIP 2.0,36  although some beneficiary advocates and providers reported that beneficiaries may encounter difficulty accessing care during that period. Beneficiary advocates and providers noted particular challenges with presumptively eligible beneficiaries attempting to fill prescriptions, which they attributed to IT system issues that can take 24 hours to transfer a beneficiary’s coverage status to health plans.37   To date, not all eligible providers are enrolled in the presumptive eligibility program, and not all enrolled providers are submitting presumptive eligibility applications.38  In addition, just under 42% of presumptively eligible beneficiaries were approved for full Medicaid between August and October 2016; while this rate has improved, it remains unclear whether the denials are due to procedural reasons, such as missing documentation to verify eligibility, or because the applicants are in fact ineligible.39  One study of a small sample of individuals suggests that procedural denials accounted for the large majority of those who did not move from presumptive eligibility to full coverage.40 

Some HIP 2.0 beneficiaries are incurring medical bills that are eligible for Indiana’s prior claims reimbursement program. This program was implemented in August, 2015, as a condition of the waiver of three months of retroactive coverage.  The prior claims payment program applies to mandatory parents, 19 and 20 year olds, and those who receive Transitional Medicaid Assistance who have incurred medical bills within the 90 days prior to their Medicaid application date.  Indiana reported that over 10% of beneficiaries eligible for the prior claims payment program as of October, 2015, had incurred retroactive bills (628 out of 5,950 beneficiaries).41   Indiana proposed discontinuing the prior claims payment program, but CMS denied this request in July 2016, noting that 13.9% of beneficiaries eligible for the program incurred costs averaging $1,561 per person based on the latest data available.42   CMS will allow the state to discontinue the prior claims payment program when 5% of beneficiaries qualify.43 

What are the Effects of Copayment Policies in Michigan and Indiana?

Beneficiaries in our focus groups did not understand the design of Michigan’s waiver that replaces point of service copayments with monthly payments based on past service use.  Some beneficiaries in our focus groups reported that they preferred the predictability of having a set monthly payment amount, while others preferred paying the amount due at the point-of-service.  The state implemented the monthly copayments in October 2014.  Between October, 2014 and July, 2016, about 37% (about 180,000 out of 486,000) of those who owed co-payments had paid, resulting in collection of 36% (about $1.3 million out of $3.5 million) of co-payments owed.44   This may indicate the need for further beneficiary education about what the payments are and how they are determined.

Having a predictable and affordable monthly cost was seen by Indiana beneficiaries in our focus groups as preferable to incurring copayments for individual services, which can be burdensome for those who have multiple prescriptions or doctor visits in a month. For those with the lowest incomes who are assessed flat $1.00 monthly premiums and who have multiple medical appointments and/or prescriptions, it is often less expensive to pay the $12 annual premiums instead of point-of-service copayments in Indiana.  Because point-of-service copayments are $4 for outpatient visits for non-preventive care and preferred prescription drugs and $8 for non-prescription drugs, a beneficiary with more than a couple of office visits and/or prescriptions can incur $12 or more in copayments in a month as opposed to paying $12 for an entire year of HIP Plus premiums at $1.00 per month.  Advocates and enrollment assisters reported that beneficiaries appeared to be more motivated to pay monthly premiums based on the opportunity to avoid point-of-service copayments than by the ability to obtain additional benefits like vision and dental available in HIP Plus, although those services were cited as valued by beneficiaries as well.

Because it has not yet been fully implemented, it is too early to assess the impact of Indiana’s separate waiver authority to impose graduated copayments for non-emergency use of the ER. Indiana was approved to implement graduated ER copayments in February, 2016,45  and as of April, 2016, health plans were identifying beneficiaries to enroll in the ER copay demonstration.46   Between July and September 2016, about 23% of emergency room visits among all HIP 2.0 beneficiaries were deemed non-emergent by the health plans (nearly 33,000 out of just over 141,000 total ER visits).47   Even without the graduated ER copayments, Indiana reports that HIP beneficiaries historically have used the emergency room for non-emergent uses less often than traditional Medicaid beneficiaries in Indiana.48   At least one interviewee noted that there were some long-term benefits that could result from a non-emergent ER visit in terms of connecting people to coverage because some people who are eligible for HIP 2.0 enrolled in coverage via a presumptive eligibility determination in an emergency department.

What has been the effect of Health Accounts in Michigan and Indiana?

Beneficiaries, their advocates, and providers interviewed for this report in both states expressed confusion about the purpose and use of health accounts and the associated account statements.  Beneficiaries described the account statements as long and complicated. Enrollment assisters and providers (especially community health centers) reported that beneficiaries had a lot of questions about their health accounts.  This is consistent with findings from a state evaluation of Healthy Michigan beneficiaries showing that many did not understand how premiums and copayments are calculated, and most did not see any relationship between the account statement and their health-related behaviors including service costs.49  Michigan is revising its account statements based on stakeholder recommendations to use consistent terminology, define key terms such as health risk assessment and healthy behavior reward, refer to the dollar amount maximum instead of the 5% of income cap on out-of-pocket costs, use the term “discount” to describe healthy behavior incentives, and shorten and simplify language.50 

In Indiana, beneficiaries were confused about the purpose of the POWER accounts, and many do not understand that their POWER account debit card was intended to be used at the point of service so that the provider could be reimbursed by the state.  Some thought that the $2,500 deductible in the POWER account represented a cap on services, which could inhibit, rather than encourage the receipt of necessary preventive services.

Some health plan interviewees in both states reported administrative burdens associated with the health accounts.  In Michigan, health plans noted high administrative costs to collect payments and differentiate payment requirements by beneficiary income.  The plans also expressed interest in more flexibility around administering the accounts; for example, they would prefer to have a choice of vendor rather than being required to use the single vendor selected by the state.  In addition, health plans would rather devote more resources and attention to achieving cost savings through providing care management to high utilizers instead of the state-required healthy behavior program.

In Indiana, the POWER account debit card was seen as an administrative burden by some provider interviewees.  Not all providers have the technology to use it, and some that can may choose not to do so and instead use the traditional billing and reimbursement process.51   Although the POWER account debit card provides faster reimbursement, providers noted that those payments are at a discounted rate, and they would prefer to receive the full reimbursement rate even if that means waiting longer for payment.  Additionally, providers explained that they may not know all of the services to be received and the associated billing codes before the appointment begins so they cannot correctly process the POWER account debit card at patient check-in.

 “They send me a little credit card. . . I don’t know how that works.” – Indiana Medicaid Enrollee

When I get those statements…I’m not really understanding what it’s all about… I mean you’re seeing all your services, but I really don’t understand the POWER account, what it’s all about and so on. It’s hard to understand.” Indiana Medicaid Enrollee

What Effect Have Healthy Behavior Incentives had in Michigan and Indiana?

Few beneficiaries to date have completed the health risk assessment (HRA) process that is required for Michigan’s healthy behavior program, but those that do go on to select a healthy behavior to maintain or address to earn a reward.   As of September, 2016, just over 16% of Healthy Michigan beneficiaries enrolled in a health plan for at least six months had completed an HRA.52   There is some concern that beneficiaries who are auto-assigned to a health plan may not be aware of or participate in the HRA process because most beneficiaries complete the initial HRA questions with the enrollment broker when they choose a plan.  As of September 2016, 42% of Healthy Michigan beneficiaries were auto-assigned to a health plan.53  Between October and December 2015, none of the Healthy Michigan plans met or exceeded the state performance measure (20%) for timely completion of an HRA within 150 days of enrollment.54   However, a state survey of primary care providers found that 79% had completed at least one HRA with a patient, with most completing more than 10, and most providers thought that financial incentives for patients and practices had at least a little influence on HRA completion, although just over half thought that patients’ interest in addressing health risks had at least as much influence.55 

Of the over 121,000 beneficiaries who have been enrolled in a health plan for at least six months and completed an HRA in Michigan as of September, 2016, 99% agreed to address or maintain a healthy behavior, and 60% agreed to address more than one healthy behavior.56   The largest share of beneficiaries selecting a healthy behavior through September, 2016 chose weight loss (66%) either alone or in combination with another healthy behavior, followed by chronic condition follow-up (43%), immunizations (40%), and tobacco cessation (37%) (Figure 11).   Compliance with healthy behavior incentives in Michigan will become more important beginning in April 2018, when failure to comply will result in enrollment in a Marketplace Qualified Health Plan with Medicaid premium assistance, instead of Medicaid managed care, for beneficiaries from 100-138% FPL under the terms of Michigan’s amended waiver.

Figure 11: Healthy Michigan Selected Healthy Behaviors, as of September 2016

“I mean… everybody wants to be healthy… and if you have some kind of incentive like oh, at the end… I’m getting $50, you know you can always use $50. So yeah, I think it’s a good incentive.” – Michigan Medicaid Enrollee

“I got a $50 gift card because I got my blood pressure down and my cholesterol down. And that… made everybody happy…but other than that I think it’s just about… going to see the doctor, getting your blood[work] done… It’s just like putting oil in your car, you know you’ve got to do something.” – Michigan Medicaid Enrollee

As of July, 2016, data were not yet available about health account rollover funds in Indiana.  Beneficiaries need to be enrolled for a year before they are eligible to receive the HIP 2.0 healthy behavior reward.57   As a result, few Indiana beneficiaries, advocates, or providers in our focus groups and interviews were aware of how the HIP 2.0 healthy behavior incentive program works.

In both states it is unclear if a deferred benefit is an adequate incentive to participate in a healthy behavior program.  As of July, 2016, nearly 86,000 Healthy Michigan beneficiaries have received gift cards, just over 39,000 have received a 50% reduction in premiums, and just under 23,000 have received a 50% reduction in copayments.58   A survey of Healthy Michigan beneficiaries found that nearly 40% “agreed that information about healthy behavior rewards helped them do something they might not have done otherwise.”59   In our focus groups, many participants had received gift cards, and one participant was aware of receiving a reduction in his cost-sharing amount.  Beneficiaries noted that the more immediate receipt of the gift card, as opposed to a future reduction in cost-sharing amounts, was a greater incentive to complete the healthy behavior program requirements.  While not offered by the state, some HIP 2.0 health plans offer gift cards as an incentive for complying with the plan’s own healthy behavior program, and beneficiaries in our focus groups reported liking and being motivated by those more immediate and tangible rewards.  The future premium and cost-sharing reductions in Michigan and the roll-over of the POWER account funds in Indiana appeared to be less of an incentive compared to the gift card.

What effect have Other waiver Provisions had in Indiana?

“Medically frail” status in Indiana is viewed as an important beneficiary protection by beneficiary advocates and providers, but the current process may not identify all who qualify.  As of July, 2016, just over 12% of beneficiaries enrolled in HIP 2.0 were identified as medically frail.60   There were some reports of lags in processing medical frailty determinations and concerns that the software does not recognize those who qualify based on substance use disorder because those services previously were not covered by Medicaid and therefore do not show up in claims history data.  Beneficiary advocates and providers emphasized the importance of allowing providers to bring a beneficiary’s treatment history to the health plan’s attention, and at least one plan allows its caseworkers to identify beneficiaries as medically frail based on health issues that are not yet showing up in the claims history. Michigan currently does not vary program rules based on medical frailty status but will have to come up with a process to do so when its waiver changes for those from 100-138% FPL take effect in April, 2018.

While Indiana’s evaluation found that the availability of NEMT did not affect whether beneficiaries miss medical appointments due to a lack of transportation,61  community health centers and beneficiary advocates shared anecdotal concerns about negative impacts of Indiana’s NEMT waiver on access to care.  The state’s evaluation asked beneficiaries if they had missed an appointment only if they first reported that they had scheduled an appointment; it did not ask whether beneficiaries had not scheduled a needed appointment due to a lack of transportation.62   The evaluation also found that those with income at or below 100% FPL were more likely to cite transportation as a reason for missing an appointment, compared to those with higher incomes.63   This also was true for those with higher risk scores, reflecting more severe health needs, compared to those with lower risk scores.64  Health centers and other community-based organizations reported helping beneficiaries with transportation to medical appointments by providing bus tokens and taxi vouchers.

To date, there has not been significant participation in the Gateway to Work referral program.  As of January, 2016, 551 individuals had attended program orientations,65  and the state attributed low participation to the fact that the program is still relatively new.  Beneficiary advocates attributed the low participation to the fact that many HIP 2.0 beneficiaries already are working (although many have jobs that do not offer health insurance), and others already participate in a similar program based on their receipt of food stamps or through the state vocational rehabilitation agency.  Because the work referral program is voluntary, beneficiary advocates did not view it as a barrier to accessing Medicaid.

What Insights Have Emerged from Michigan and Indiana?

Five key insights emerge from an early look at Michigan and Indiana’s Medicaid expansion waivers.

  1. Medicaid expansion design, whether through traditional state plan authority or waivers, is highly dependent on the features of a state’s underlying Medicaid program. Michigan and Indiana both had implemented limited adult coverage expansions through waivers prior to the ACA, and those expansions along with the states’ pre-existing Medicaid delivery systems influenced the structure and design of their post-ACA waivers. Michigan incorporated its pre-existing capitated managed care delivery system into Healthy Michigan, while Indiana modified its pre-existing high deductible health account model under HIP 2.0.  Regardless of whether a state adopts a traditional expansion or uses a waiver, expanding Medicaid can result in substantial reductions in the uninsured and increased access to needed health care.66 
  2. Implementation of complex programs involves collaboration with a variety of stakeholders, sophisticated IT systems, and administrative costs. Both states’ waivers apply different rules based on differences in beneficiary income, health status, or other characteristics, which require time and resources to track.  Challenges with information exchange between the state, health plans, and providers have created some confusion and delays in effectuating coverage in Indiana.  Timely and accurate data about various beneficiary characteristics, such as income level, medical frailty, and healthy behavior status, will trigger different policies and delivery systems under the 2018 changes for those from 100-138% FPL in Michigan’s waiver, thus taking on increasing importance for the state and beneficiaries there.
  3. Premium costs and complex enrollment policies can deter eligible people from enrolling in coverage. Particularly for very low-income populations, even very low premiums may be unaffordable, and the cost of making payments (i.e., purchasing a money order) may add increased financial strain as well as a barrier.  Policies in Indiana that tie the start of the coverage period to making a payment can be a further impediment, deterring some eligible people from enrolling.  In addition, assessing the affordability of premiums in Indiana is challenging because it is difficult to track and adjust premium payment amounts for populations who experience frequent changes in income and to track how many individuals receive help with paying premiums.
  4. Health accounts can be confusing for beneficiaries. Beneficiaries in our focus groups as well as advocates and providers in both states did not demonstrate a clear understanding of the policies associated with these models. This feedback shows that these models are hard to understand even in Indiana, a state with long-standing experience with health accounts.
  5. Beneficiary and provider education and tangible incentives appear central to implementing healthy behavior incentive programs. Beneficiaries in both states indicated that gift cards that could be used immediately to purchase needed items were more appealing rewards than decreased cost-sharing amounts in the future, which is understandable, given the low incomes and precarious financial situation of many beneficiaries and the complicated formulas to calculate future cost-sharing reductions.  To date, it is too early to determine if health accounts and healthy behavior incentives can change behavior, lead to more efficient use of health care services, and improve health outcomes, but these items hopefully will be assessed in the formal waiver evaluations.

At the time of our interviews for this study in summer 2016, both Michigan and Indiana were looking ahead to continued implementation of their waivers.  Michigan reported plans to focus on its healthy behavior incentive program and simplify the health account statements under the waiver.  At the same time, the state was working on issues that are related but not specific to the waiver, such as modernizing the eligibility determination system, streamlining the renewal process, overseeing health plan contracts, and integrating physical and behavioral health services.  Michigan also was planning to prepare to implement the new waiver authorities approved by CMS that will affect beneficiaries between 100-138% FPL starting in April, 2018.

Indiana was planning additional outreach efforts targeted to eligible but uninsured residents. The state also planned to work on implementation of some waiver provisions, including the graduated copayments for non-emergency use of the ER and the POWER account roll-over healthy behavior rewards, that had not yet been fully implemented.  In addition, enrollment assisters, health centers, and advocates pointed to needed improvements in the enrollment and renewal processes and noted the need for continued beneficiary education as well as IT system improvements related to the POWER accounts.

Looking ahead from a national perspective, it is not yet clear what role Section 1115 Medicaid expansion waivers will play as the new Administration and Congress move to repeal the ACA and debate possible broader changes to Medicaid financing such as a block grant or per capita cap.67   Repeal of the ACA would remove the statutory authority to cover expansion adults and the associated federal financing.  However, given that some other states have expressed interest in pursuing Medicaid expansion waivers with components similar to those in Michigan and Indiana, it is important to understand the administrative framework and early implementation challenges and successes of the models being tested in Michigan and Indiana as more formal evaluations are conducted.

The authors gratefully acknowledge Michael Perry, Sean Dryden, and Naomi Mulligan Kolb with PerryUndem Research/Communication for their work managing the fieldwork logistics, conducting the interviews, and moderating the focus groups. We also extend our deep appreciation to all the participants for sharing their perspectives and experiences to inform this project.

Appendix

Appendix Table 1:Waiver and Expenditure Authorities Related to Medicaid Expansion in Michigan and Indiana
AuthorityMichiganIndiana
PremiumsAllows state to charge monthly premiums of 2% of income for beneficiaries from 100-138% FPL.Allows state to require monthly premiums of 2% of income as a condition of eligibility for non-medically frail beneficiaries from 100-138% FPL.

Allows state to charge monthly premiums of 2% of income for beneficiaries from 0-100% FPL to access an enhanced benefit package.

Waives 5% cap on out-of-pocket costs so that beneficiaries from 0-5% FPL are charged $1.00/month to access enhanced benefits.

ComparabilityAllows state to vary premiums, copayments and healthy behavior reductions by population.Allows state to vary cost-sharing from state plan requirements so that beneficiaries who pay premiums only have non-emergency ER use copays and those not paying premiums have copays for other services at state plan amounts.
Expenditures for Healthy Behavior IncentivesAuthorizes federal matching funds for healthy behavior incentives that offset beneficiary cost-sharing liability.N/A
Reasonable PromptnessN/AAllows state to begin coverage on 1st day of month in which premium is paid or 1st day of the month in which 60-day payment period expires for those under 100% FPL.

Allows disenrollment and 6 month lock-out for those from 100-138% FPL who do not pay premiums.

RetroactivityN/AAllows state to not provide coverage prior to 1st day of month in which beneficiary pays 1st premium.

Allows state not to provide coverage until 1st day of month in which the 60-day payment period expires for those from 0-100% FPL.

Cost-Sharing for Non-Emergency Use of ERN/AAllows state to test graduated co-payment up to $25 for 2 years.*
Methods of AdministrationN/AAllows state to not provide NEMT to non-medically frail expansion adults.**


Cost-EffectivenessAllows state-developed cost-effectiveness tests for Medicaid premium assistance to purchase Marketplace QHP coverage (effective April 2018).N/A
Provider PaymentAllows state to limit provider payments for beneficiaries enrolled in Marketplace QHPs to QHP market rates (effective April 2018).N/A
Prior AuthorizationAllows prescription drug prior authorizations for Marketplace QHP enrollees to be addressed in 72 hours instead of 24 hours, with a 72-hour supply provided in emergencies (effective April 2018).N/A
Expenditures for QHP Premiums and Cost-Sharing ReductionsAuthorizes federal matching funds for QHP premium assistance costs that do not meet federal cost-effectiveness test or that include benefits not covered under Medicaid state plan.N/A
NOTES: MI received other waiver authorities related to Medicaid managed care, and IN received other waiver authorities related to Medicaid premium assistance for employer-sponsored insurance.  *ER copay waiver authority is under § 1916 (f). **IN’s initial NEMT waiver was through Jan. 1, 2016, and was extended through Jan. 2018.SOURCE:  CMS Expenditure Authority and Waiver List, Healthy Michigan Demonstration, Dec. 30, 2013-Dec. 31, 2018, amended Dec. 17, 2015; CMS Waiver List, Healthy Indiana Plan 2.0, Feb. 1, 2015-Jan. 31, 2108.

Endnotes

  1. CMS Letter to Joseph Moser, Medicaid Director, Indiana Family and Social Services Administration, November 25, 2016. https://www.medicaid.gov/Medicaid-CHIP-Program-Information/By-Topics/Waivers/1115/downloads/in/Healthy-Indiana-Plan-2/in-healthy-indiana-plan-support-20-nemt-temp-ext-ltr-11252016.pdf ↩︎
  2. See, e.g.,  Robin Cohen, Michael Martinez, and Emily Zammitti, Health Insurance Coverage: Early Release of Estimates from the National Health Interview Survey, 2015, (Hyattsville, MD: National Center for Health Statistics, May 2016), http://www.cdc.gov/nchs/data/nhis/earlyrelease/insur201605.pdf, (noting significant difference in non-elderly adult uninsured rate from 2013 to 2015 in the following states that had traditional Medicaid expansions:  AZ (-9.6%), CA (-12.6%), CO (-9.8), IL (-7.9), KY (-15.7%), MD (-7.1%), NH (-7.8%), NV (-14.2%), NJ (-7.3%), NY (-6.6%), OH (-7.0%), OR, (-8.7%), PA (-5.5%), RI (-6.8%), WA (-12.3%), and WV (-19.9%)); Benjamin D. Sommers et al., Changes in Self-reported Insurance Coverage, Access to Care, and Health Under the Affordable Care Act, 314 JAMA 366  (July 28, 2015), http://jama.jamanetwork.com/article.aspx?articleid=2411283 (finding that lacking a personal physician and limited access to medications both declined significantly more in expansion states than in non-expansion states). ↩︎
  3. Kaiser Family Foundation, Key Medicaid Questions Post-Election (Nov. 2016), https://modern.kff.org/medicaid/fact-sheet/key-medicaid-questions-post-election/. ↩︎
  4. The other five states using waivers are Arizona, Arkansas, Iowa, Montana, and New Hampshire. ↩︎
  5. The enhanced federal match for expansion adults in 2017 is 95%. ↩︎
  6. Technically, Indiana considers these payments to be contributions to the health account deductible and not premiums. ↩︎
  7. Deductible funds are not applied to preventive services. ↩︎
  8. CMS Letter to Joseph Moser, Medicaid Director, Indiana Family and Social Services Administration, November 25, 2016. https://www.medicaid.gov/Medicaid-CHIP-Program-Information/By-Topics/Waivers/1115/downloads/in/Healthy-Indiana-Plan-2/in-healthy-indiana-plan-support-20-nemt-temp-ext-ltr-11252016.pdf ↩︎
  9. Robin Cohen, Michael Martinez, and Emily Zammitti, Health Insurance Coverage: Early Release of Estimates from the National Health Interview Survey, 2015, (Hyattsville, MD: National Center for Health Statistics, May 2016), http://www.cdc.gov/nchs/data/nhis/earlyrelease/insur201605.pdf. ↩︎
  10. Michigan Department of Health and Human Services (MDHHS), Healthy Michigan Plan Waiver Enrollees, (December, 2016), https://www.medicaid.gov/Medicaid-CHIP-Program-Information/By-Topics/Waivers/1115/downloads/mi/Healthy-Michigan/mi-healthy-michigan-dec-mnthly-enrllmnt-rpt-1172017.pdf. ↩︎
  11. FSSA, Healthy Indiana Plan Demonstration, Section 1115 Quarterly Report, 8/2016-10/2016, (Indianapolis, IN: FSSA, December 30, 2016), https://www.medicaid.gov/Medicaid-CHIP-Program-Information/By-Topics/Waivers/1115/downloads/in/Healthy-Indiana-Plan-2/in-healthy-indiana-plan-support-20-qtrly-rpt-aug-oct-12302016.pdf. ↩︎
  12. State of Michigan, Healthy Michigan Open Enrollment to Begin April 1, Press Release, (Lansing, MI: State of Michigan Executive Office, March 20, 2014), https://drive.google.com/file/d/0Bx4lt2rIHSK0N1BKaGJHby1EWGM/edit; The Lewin Group, Indiana Healthy Indiana Plan 2.0: Interim Evaluation Report, Prepared for FSSA, (Falls Church, VA: Lewin Group, July 6, 2016), https://www.medicaid.gov/Medicaid-CHIP-Program-Information/By-Topics/Waivers/1115/downloads/in/Healthy-Indiana-Plan-2/in-healthy-indiana-plan-support-20-interim-evl-rpt-07062016.pdf. ↩︎
  13. A total of nearly 130,000 beneficiaries initially transferred into HIP 2.0, including traditional and expansion populations. Indiana Family & Social Services Administration, Healthy Indiana Plan Demonstration, Section 1115 Quarterly Report, 11/2015-1/2016, (Indianapolis, IN: FSSA, March 31, 2016), https://www.medicaid.gov/Medicaid-CHIP-Program-Information/By-Topics/Waivers/1115/downloads/in/Healthy-Indiana-Plan-2/in-healthy-indiana-plan-support-20-qtrly-rpt-nov-jan-2016-03312016.pdf. ↩︎
  14. FSSA, Healthy Indiana Plan, Passive Verification Report, (Indianapolis, IN: FSSA, August 31, 2015), https://www.medicaid.gov/Medicaid-CHIP-Program-Information/By-Topics/Waivers/1115/downloads/in/Healthy-Indiana-Plan-2/in-healthy-indiana-plan-support-20-passive-verification-rpt-08312015.pdf. ↩︎
  15. University of Michigan, Institute for Healthcare Policy and Innovation, Healthy Michigan Voices Beneficiary Survey Interim Report at 5, 13 (Sept. 15, 2016), https://www.medicaid.gov/Medicaid-CHIP-Program-Information/By-Topics/Waivers/1115/downloads/mi/Healthy-Michigan/mi-healthy-michigan-benef-survey-interim-report-09212016.pdf.; University of Michigan, Michigan Institute for Healthcare Policy and Innovation, Primary Care Practitioners’ Views of the Impact of the Healthy Michigan Plan Final Report at iii, iv, v (April 27, 2016), https://www.medicaid.gov/Medicaid-CHIP-Program-Information/By-Topics/Waivers/1115/downloads/mi/Healthy-Michigan/mi-healthy-michigan-impact-final-rpt-08022016.pdf. ↩︎
  16. Michigan Adult Coverage Demonstration, Section 1115 Quarterly Report (7/1/16-9/30/16) at 11, https://www.medicaid.gov/Medicaid-CHIP-Program-Information/By-Topics/Waivers/1115/downloads/mi/Healthy-Michigan/mi-healthy-michigan-qtrly-rpt-09202016.pdf. ↩︎
  17. Enrollees calling about account statements also asked about amounts owed and for clarification about the statement contents.  Id. at 9.  ↩︎
  18. MDHHS, MI Health Account Executive Summary Report , (Lansing, MI: MDHHS, October 2016), https://www.medicaid.gov/Medicaid-CHIP-Program-Information/By-Topics/Waivers/1115/downloads/mi/Healthy-Michigan/mi-healthy-michigan-qtrly-rpt-jul-sep-2016.pdf. ↩︎
  19. Id. ↩︎
  20. MDHHS, Michigan Adult Coverage Demonstration Section 1115 Quarterly Report, 7/1/16-9/30/16, (Lansing, MI: MDHHS, January 17, 2017), https://www.medicaid.gov/Medicaid-CHIP-Program-Information/By-Topics/Waivers/1115/downloads/mi/Healthy-Michigan/mi-healthy-michigan-qtrly-rpt-jul-sep-2016.pdf. ↩︎
  21. University of Michigan Institute for Healthcare Policy and Innovation, MI Health Account Statements:  Early Experiences of Beneficiaries Report Summary (Ann Arbor, MI: University of Michigan Institute for Healthcare Policy and Innovation, September 14, 2015), https://www.medicaid.gov/Medicaid-CHIP-Program-Information/By-Topics/Waivers/1115/downloads/mi/Healthy-Michigan/mi-healthy-michigan-annual-report-DY6.pdf. ↩︎
  22. FSSA, Healthy Indiana Plan Demonstration, Section 1115 Quarterly Report, 8/2016-10/2016, (Indianapolis, IN: FSSA, December 30, 2016), https://www.medicaid.gov/Medicaid-CHIP-Program-Information/By-Topics/Waivers/1115/downloads/in/Healthy-Indiana-Plan-2/in-healthy-indiana-plan-support-20-qtrly-rpt-aug-oct-12302016.pdf. ↩︎
  23. Id. ↩︎
  24. CMS denied Indiana’s request to lock beneficiaries at all income levels out of coverage for six months for failure to complete the eligibility renewal process timely noting that this is inconsistent with Medicaid’s objective of ensuring access to coverage and does not account for challenges that people with low incomes may face in complying with renewals, such as language access issues, difficulties obtaining mail, disabilities, and homelessness.   CMS, State Demonstrations Group, (Baltimore, MD: CMS, July 29, 2016), https://www.medicaid.gov/Medicaid-CHIP-Program-Information/By-Topics/Waivers/1115/downloads/in/Healthy-Indiana-Plan-2/in-healthy-indiana-plan-support-20-lockouts-redetermination-07292016.pdf. ↩︎
  25. FSSA, HIP CMS Metrics, (Indianapolis, IN: FSSA, July 20, 2016), https://www.medicaid.gov/Medicaid-CHIP-Program-Information/By-Topics/Waivers/1115/downloads/in/Healthy-Indiana-Plan-2/in-healthy-indiana-plan-support-20-monthly-rpt-july-2016-07202016.pdf. ↩︎
  26. FSSA, Healthy Indiana Plan Demonstration Annual Report, 1/1/15-1/31/16, (Indianapolis, IN: FSSA, April 29, 2016), https://www.medicaid.gov/Medicaid-CHIP-Program-Information/By-Topics/Waivers/1115/downloads/in/Healthy-Indiana-Plan-2/in-healthy-indiana-plan-support-20-annl-rpt-feb-jan-2016-04292016.pdf. ↩︎
  27. The Lewin Group, Indiana Healthy Indiana Plan 2.0: Interim Evaluation Report, Prepared for FSSA, (Falls Church, VA: Lewin Group, July 6, 2016), https://www.medicaid.gov/Medicaid-CHIP-Program-Information/By-Topics/Waivers/1115/downloads/in/Healthy-Indiana-Plan-2/in-healthy-indiana-plan-support-20-interim-evl-rpt-07062016.pdf. ↩︎
  28. Id. at 40. ↩︎
  29. Kaiser Family Foundation, Premiums and Cost-Sharing in Medicaid:  A Review of Research Findings (Feb. 2013), https://modern.kff.org/medicaid/issue-brief/premiums-and-cost-sharing-in-medicaid-a-review-of-research-findings/. ↩︎
  30. FSSA, HIP CMS Metrics, (Indianapolis, IN: FSSA, July 20, 2016), https://www.medicaid.gov/Medicaid-CHIP-Program-Information/By-Topics/Waivers/1115/downloads/in/Healthy-Indiana-Plan-2/in-healthy-indiana-plan-support-20-monthly-rpt-july-2016-07202016.pdf. ↩︎
  31. The Lewin Group, Indiana Healthy Indiana Plan 2.0: Interim Evaluation Report, Prepared for the Indiana Family and Social Services Administration (FSSA) at 20 (Falls Church, VA: Lewin Group, July 6, 2016), https://www.medicaid.gov/Medicaid-CHIP-Program-Information/By-Topics/Waivers/1115/downloads/in/Healthy-Indiana-Plan-2/in-healthy-indiana-plan-support-20-interim-evl-rpt-07062016.pdf. ↩︎
  32. Id. ↩︎
  33. FSSA, Healthy Indiana Plan, Section 1115 Quarterly Report, 5/15-7/15, (Indianapolis, IN: FSSA, October 8, 2015, https://www.medicaid.gov/Medicaid-CHIP-Program-Information/By-Topics/Waivers/1115/downloads/in/Healthy-Indiana-Plan-2/in-healthy-indiana-plan-support-20-qtrly-rpt-may-july-10082015.pdf. ↩︎
  34. The Lewin Group, Indiana Healthy Indiana Plan 2.0: Interim Evaluation Report, Prepared for FSSA, (Falls Church, VA: Lewin Group, July 6, 2016), https://www.medicaid.gov/Medicaid-CHIP-Program-Information/By-Topics/Waivers/1115/downloads/in/Healthy-Indiana-Plan-2/in-healthy-indiana-plan-support-20-interim-evl-rpt-07062016.pdf. ↩︎
  35. These issues appeared to be more pronounced for those sending money orders by mail as opposed to using a credit or debit card online at the time of application. ↩︎
  36. FSSA, Healthy Indiana Plan Demonstration, Section 1115 Quarterly Report, 8/2016-10/2016, (Indianapolis, IN: FSSA, December 30, 2016), https://www.medicaid.gov/Medicaid-CHIP-Program-Information/By-Topics/Waivers/1115/downloads/in/Healthy-Indiana-Plan-2/in-healthy-indiana-plan-support-20-qtrly-rpt-aug-oct-12302016.pdf. ↩︎
  37. See also FSSA, Healthy Indiana Plan Demonstration, Section 1115 Quarterly Report, 2/15-4/15, (Indianapolis, IN: FSSA, August 5, 2015), https://www.medicaid.gov/Medicaid-CHIP-Program-Information/By-Topics/Waivers/1115/downloads/in/Healthy-Indiana-Plan-2/in-healthy-indiana-plan-support-20-qtrly-rpt-feb-apr-2015.pdf. ↩︎
  38. FSSA, Healthy Indiana Plan Demonstration, Section 1115 Quarterly Report, 8/2016-10/2016, (Indianapolis, IN: FSSA, December 30, 2016), https://www.medicaid.gov/Medicaid-CHIP-Program-Information/By-Topics/Waivers/1115/downloads/in/Healthy-Indiana-Plan-2/in-healthy-indiana-plan-support-20-qtrly-rpt-aug-oct-12302016.pdf.; FSSA, Healthy Indiana Plan Demonstration, Section 1115 Quarterly Report, 2/2016-4/2016, (Indianapolis, IN: FSSA, June 30, 2016), https://www.medicaid.gov/Medicaid-CHIP-Program-Information/By-Topics/Waivers/1115/downloads/in/Healthy-Indiana-Plan-2/in-healthy-indiana-plan-support-20-qtrly-rpt-feb-apr-06302016.pdf; FSSA, Healthy Indiana Plan, Section 1115 Quarterly Report, 5/15-7/15, (Indianapolis, IN: FSSA, October 8, 2015, https://www.medicaid.gov/Medicaid-CHIP-Program-Information/By-Topics/Waivers/1115/downloads/in/Healthy-Indiana-Plan-2/in-healthy-indiana-plan-support-20-qtrly-rpt-may-july-10082015.pdf. ↩︎
  39. FSSA, Healthy Indiana Plan Demonstration, Section 1115 Quarterly Report, 8/2016-10/2016, (Indianapolis, IN: FSSA, December 30, 2016), https://www.medicaid.gov/Medicaid-CHIP-Program-Information/By-Topics/Waivers/1115/downloads/in/Healthy-Indiana-Plan-2/in-healthy-indiana-plan-support-20-qtrly-rpt-aug-oct-12302016.pdf. ↩︎
  40. FSSA, Healthy Indiana Plan Demonstration, Section 1115 Quarterly Report, 2/2016-4/2016, (Indianapolis, IN: FSSA, June 30, 2016) at 26, https://www.medicaid.gov/Medicaid-CHIP-Program-Information/By-Topics/Waivers/1115/downloads/in/Healthy-Indiana-Plan-2/in-healthy-indiana-plan-support-20-qtrly-rpt-feb-apr-06302016.pdf. ↩︎
  41. FSSA, Healthy Indiana Plan, Prior Claims Payment Program Report at 4 (Indianapolis, IN: FSSA, October 27, 2015), https://www.medicaid.gov/Medicaid-CHIP-Program-Information/By-Topics/Waivers/1115/downloads/in/Healthy-Indiana-Plan-2/in-healthy-indiana-plan-support-20-prior-claims-pymt-rpt-10272015.pdf. ↩︎
  42. Centers for Medicare & Medicaid Services (CMS), State Demonstrations Group, (Baltimore, MD: CMS, July 29, 2016), https://www.medicaid.gov/Medicaid-CHIP-Program-Information/By-Topics/Waivers/1115/downloads/in/Healthy-Indiana-Plan-2/in-healthy-indiana-plan-support-20-lockouts-redetermination-07292016.pdf. ↩︎
  43. Id. ↩︎
  44. Michigan Adult Coverage Demonstration, Section 1115 Quarterly Report (7/1/16-9/30/16) at 10, https://www.medicaid.gov/Medicaid-CHIP-Program-Information/By-Topics/Waivers/1115/downloads/mi/Healthy-Michigan/mi-healthy-michigan-qtrly-rpt-jul-sep-2016.pdf. ↩︎
  45. This waiver authority lasts for two years, from February 2016 through January 2018.  Letter from Eliot Fishman, CMS to Joseph Moser, Indiana Medicaid Director (September 16, 2016). ↩︎
  46. FSSA, Healthy Indiana Plan Demonstration, Section 1115 Quarterly Report, 2/2016-4/2016, (Indianapolis, IN: FSSA, June 30, 2016), https://www.medicaid.gov/Medicaid-CHIP-Program-Information/By-Topics/Waivers/1115/downloads/in/Healthy-Indiana-Plan-2/in-healthy-indiana-plan-support-20-qtrly-rpt-feb-apr-06302016.pdf. ↩︎
  47. FSSA, Healthy Indiana Plan Demonstration, Section 1115 Quarterly Report, 8/2016-10/2016, (Indianapolis, IN: FSSA, December 30, 2016), https://www.medicaid.gov/Medicaid-CHIP-Program-Information/By-Topics/Waivers/1115/downloads/in/Healthy-Indiana-Plan-2/in-healthy-indiana-plan-support-20-qtrly-rpt-aug-oct-12302016.pdf. ↩︎
  48. FSSA, Healthy Indiana Plan Demonstration, Annual Report, 2/1/15-1/31/16, (Indianapolis, IN: FSSA, April 29, 2016), (citing Oct. 2014 annual report and interim evaluation based on HIP 1.0), https://www.medicaid.gov/Medicaid-CHIP-Program-Information/By-Topics/Waivers/1115/downloads/in/Healthy-Indiana-Plan-2/in-healthy-indiana-plan-support-20-qtrly-rpt-feb-apr-06302016.pdf. ↩︎
  49. University of Michigan Institute for Healthcare Policy and Innovation, MI Health Account Statements:  Early Experiences of Beneficiaries Report Summary at 2, 5 (Sept. 14, 2015), https://www.medicaid.gov/Medicaid-CHIP-Program-Information/By-Topics/Waivers/1115/downloads/mi/Healthy-Michigan/mi-healthy-michigan-annual-report-DY6.pdf. ↩︎
  50. Id. ↩︎
  51. Indiana has allowed providers to scan beneficiaries’ POWER account cards for reimbursement since October, 2015.  FSSA, Healthy Indiana Plan, Section 1115 Quarterly Report, 8/15-10/31/15, (Indianapolis, IN: FSSA, December 29, 2015), https://www.medicaid.gov/Medicaid-CHIP-Program-Information/By-Topics/Waivers/1115/downloads/in/Healthy-Indiana-Plan-2/in-healthy-indiana-plan-support-20-qtrly-rpt-aug-oct-12292015.pdf. ↩︎
  52. MDHHS, Healthy Michigan Plan – Health Risk Assessment Report, (Lansing, MI: MDHSS, September, 2016), at 13, https://www.medicaid.gov/Medicaid-CHIP-Program-Information/By-Topics/Waivers/1115/downloads/mi/Healthy-Michigan/mi-healthy-michigan-qtrly-rpt-jul-sep-2016.pdf. ↩︎
  53. MDHHS, Healthy Michigan Plan Progress Report, (Lansing, MI: MDHHS, September 6, 2016), http://www.michigan.gov/documents/mdch/Website_Healthy_Michigan_Plan_Progress_Report_12-01-2014_475355_7.pdf ↩︎
  54. MDHHS, Performance Monitoring Report, Medicaid Managed Care Healthy Michigan Plan Adult Core Set Measures, Composite – All Plans (Lansing, MI: MDHHS, October 2016, revised November 2016), at 25,  https://www.medicaid.gov/Medicaid-CHIP-Program-Information/By-Topics/Waivers/1115/downloads/mi/Healthy-Michigan/mi-healthy-michigan-annual-report-DY6.pdf. ↩︎
  55. University of Michigan, Michigan Institute for Healthcare Policy and Innovation, Primary Care Practitioners’ Views of the Impact of the Healthy Michigan Plan Final Report at v (April 27, 2016), https://www.medicaid.gov/Medicaid-CHIP-Program-Information/By-Topics/Waivers/1115/downloads/mi/Healthy-Michigan/mi-healthy-michigan-impact-final-rpt-08022016.pdf. ↩︎
  56. MDHHS, Healthy Michigan Plan – Health Risk Assessment Report, (Lansing, MI: MDHSS, September, 2016), at 13, https://www.medicaid.gov/Medicaid-CHIP-Program-Information/By-Topics/Waivers/1115/downloads/mi/Healthy-Michigan/mi-healthy-michigan-qtrly-rpt-jul-sep-2016.pdf. ↩︎
  57. The Lewin Group, Indiana Healthy Indiana Plan 2.0: Interim Evaluation Report, Prepared for FSSA, (Falls Church, VA: Lewin Group, July 6, 2016), https://www.medicaid.gov/Medicaid-CHIP-Program-Information/By-Topics/Waivers/1115/downloads/in/Healthy-Indiana-Plan-2/in-healthy-indiana-plan-support-20-interim-evl-rpt-07062016.pdf. ↩︎
  58. Michigan Adult Coverage Demonstration, Section 1115 Quarterly Report, 7/1/2016-9/30/16 at 16 (Jan. 17, 2017), https://www.medicaid.gov/Medicaid-CHIP-Program-Information/By-Topics/Waivers/1115/downloads/mi/Healthy-Michigan/mi-healthy-michigan-qtrly-rpt-jul-sep-2016.pdf. ↩︎
  59. Susan Dorr Goold et. al., Healthy Michigan Voices Beneficiary Survey Interim Report, (Ann Arbor, MI: University of Michigan Institute for Healthcare Policy & Innovation, September 15, 2016), https://www.medicaid.gov/Medicaid-CHIP-Program-Information/By-Topics/Waivers/1115/downloads/mi/Healthy-Michigan/mi-healthy-michigan-benef-survey-interim-report-09212016.pdf. ↩︎
  60. FSSA, HIP CMS Metrics, (Indianapolis, IN: FSSA, July 20, 2016), https://www.medicaid.gov/Medicaid-CHIP-Program-Information/By-Topics/Waivers/1115/downloads/in/Healthy-Indiana-Plan-2/in-healthy-indiana-plan-support-20-monthly-rpt-july-2016-07202016.pdf. ↩︎
  61. The state’s NEMT waiver evaluation found “no evidence” that HIP 2.0 beneficiaries without NEMT were more likely to miss appointments due to transportation or other reasons compared to HIP 2.0 beneficiaries enrolled in the one health plan that does offer NEMT as a value-added benefit. Even with the NEMT waiver, about two-thirds of the HIP 2.0 population does receive NEMT, either because they are exempt from the NEMT waiver (pregnant, medically frail, and mandatory parents, 19 and 20 year olds, and those receiving Transitional Medical Assistance) or because they belong to the one health plan that separately offers the benefit as a managed care value-added service to its enrollees. The Lewin Group, Indiana HIP 2.0: Evaluation of Non-Emergency Medical Transportation (NEMT) Waiver, at ES-2, ES-1, Prepared for FSSA, (Fairfax, VA: November 2, 2016),  https://www.medicaid.gov/Medicaid-CHIP-Program-Information/By-Topics/Waivers/1115/downloads/in/Healthy-Indiana-Plan-2/in-healthy-indiana-plan-support-20-nemt-final-evl-rpt-11022016.pdf. ↩︎
  62. Id. at ES-2. ↩︎
  63. Id. at ES-3. ↩︎
  64. Id. at ES-3, ES-4. ↩︎
  65. The Gateway to Work call center opened in May, 2015, and as of January 2016, had received 3,227 calls.   FSSA, Healthy Indiana Plan Demonstration Annual Report, (Indianapolis, IN: FSSA, April 29, 2016). https://www.medicaid.gov/Medicaid-CHIP-Program-Information/By-Topics/Waivers/1115/downloads/in/Healthy-Indiana-Plan-2/in-healthy-indiana-plan-support-20-qtrly-rpt-feb-apr-06302016.pdf. ↩︎
  66. See, e.g.,  Robin Cohen, Michael Martinez, and Emily Zammitti, Health Insurance Coverage: Early Release of Estimates from the National Health Interview Survey, 2015, (Hyattsville, MD: National Center for Health Statistics, May 2016), http://www.cdc.gov/nchs/data/nhis/earlyrelease/insur201605.pdf, (noting significant difference in non-elderly adult uninsured rate from 2013 to 2015 in the following states that had traditional Medicaid expansions:  AZ (-9.6%), CA (-12.6%), CO (-9.8), IL (-7.9), KY (-15.7%), MD (-7.1%), NH (-7.8%), NV (-14.2%), NJ (-7.3%), NY (-6.6%), OH (-7.0%), OR, (-8.7%), PA (-5.5%), RI (-6.8%), WA (-12.3%), and WV (-19.9%)); Benjamin D. Sommers et al., Changes in Self-reported Insurance Coverage, Access to Care, and Health Under the Affordable Care Act, 314 JAMA 366  (July 28, 2015), http://jama.jamanetwork.com/article.aspx?articleid=2411283 (finding that lacking a personal physician and limited access to medications both declined significantly more in expansion states than in non-expansion states). ↩︎
  67. Kaiser Family Foundation, Key Medicaid Questions Post-Election (Nov. 2016), https://modern.kff.org/medicaid/fact-sheet/key-medicaid-questions-post-election/. ↩︎

Current Flexibility in Medicaid: An Overview of Federal Standards and State Options

Authors: Samantha Artiga, Elizabeth Hinton, Robin Rudowitz, and MaryBeth Musumeci
Published: Jan 31, 2017

Executive Summary

Key Takeaways

This brief provides an overview of current federal standards and state options in Medicaid to help inform upcoming debates about increasing state flexibility in the program as part of efforts to restructure Medicaid financing.

  • Today, states operate their Medicaid programs within federal standards and a wide range of state options in exchange for federal matching funds that are provided with no limit.
  • Each state Medicaid program is unique, reflecting states’ use of existing flexibility and waiver authority to design their programs to meet their specific needs and priorities.
  • As proposals to restructure Medicaid financing develop, it will be important to examine what additional flexibilities they would provide to states and what standards, accountability and enrollee protections would remain for states to access federal funds.

Executive Summary

The Trump Administration and Republican leaders in Congress have called for fundamental changes in Medicaid financing that would limit federal financing for Medicaid through a block grant or per capita cap. Such changes may be tied to offers of increased flexibility to states to manage their programs within a more limited financing structure. Which federal standards would remain in place and what increased flexibility might be provided to states would have significant implications. To help inform discussion around increased flexibility, this brief provides an overview of current federal standards and state options in Medicaid and how states have responded to these options in four key areas: eligibility, benefits, premiums and cost sharing, and provider payments and delivery systems.

Today, states operate their program within federal standards and a wide range of state options in exchange for federal matching funds that are provided with no limit. Medicaid is jointly financed by the federal government and states, with the federal government providing federal matching funds for allowable state Medicaid spending on an open-ended basis. In exchange for the federal funds, states must meet federal standards that reflect the program’s role covering a low-income population with limited resources and often complex health needs. The federal standards largely focus on requiring states to cover certain core groups, such as poor children and pregnant women, as well as certain core benefits. However, states can choose to cover additional groups and benefits and have wide latitude over many aspects of the program, particularly how they pay providers and structure their delivery systems. Moreover, states can use Section 1115 waiver authority to vary from the federal standards and state options to address different priorities and emerging issues.

Each state Medicaid program is unique, reflecting states’ use of existing program flexibility and waiver authority to design their programs to meet their specific needs and priorities. The programs vary widely in terms of who is eligible, what benefits are covered, what premiums and cost sharing are charged, and how providers are paid and care is delivered (Figure 1). Over time, many states have expanded Medicaid to reach a greater share of their low-income population through both targeted and broad expansions. States also have used program flexibility to continually evolve and transform how they pay for and deliver care. Further, during economic downturns, states have used options to cut provider rates and restrict benefits to control Medicaid spending.

Figure 1: State Responses to Program Options in Medicaid

As proposals to restructure federal Medicaid financing develop, it will be important to examine what additional flexibilities they would provide to states and what standards, accountability and enrollee protections would remain for states to access federal funds. As noted, states have broad flexibility over many aspects of their programs and can gain increased flexibility under Section 1115 waiver authority. What additional flexibilities would be provided beyond these options under such proposals would have implications for states, enrollees, and providers. What federal standards would remain in place will affect the extent of accountability for the federal investment in the program and the scope of nationwide protections available for enrollees. Additionally, how such proposals would address existing program variation in establishing base levels for the caps will be key, including variation as a result of 32 states, including DC, adopting the ACA expansion. Setting the caps based on current spending could lock historical state choices and program variation in place potentially rewarding states with higher historic spending and creating “winners” or “losers” across states.

Issue Brief

Introduction

Medicaid is jointly financed by the federal government and states. The federal government provides matching dollars to states for allowable spending on Medicaid on an open-ended basis.1  In exchange for the significant federal investment in the program, states design and administer their programs within a set of federal standards and broad state options defined by law that reflects the program’s role covering a low-income population with limited resources and often complex health needs. Beyond these options, federal law also authorizes the Secretary of Health and Human Services (HHS) to waive certain Medicaid requirements and to provide federal Medicaid funding for options not otherwise allowed under law for approaches the Secretary determines promote the objectives of the program.

The Trump Administration and Republican leaders in Congress have called for fundamental changes in Medicaid financing that would limit federal financing for Medicaid through a block grant or per capita cap. Such changes may be tied to offers of increased flexibility to states to manage their programs within a more limited financing structure. Which federal standards would remain in place and what increased flexibility might be provided to states would have significant implications. To help inform discussion around increased flexibility, this brief presents an overview of current federal standards and state options within Medicaid in four areas: eligibility, benefits, premiums and cost sharing, and provider payments and delivery systems.

The Upcoming Debate around Flexibility

President Trump and other Republican leaders have called for providing states with increased flexibility in how they operate their Medicaid programs. In December, Republican Leaders in the House of Representatives and Republican Members of the Senate Finance Committee sent letters to Governors and Insurance Commissioners to request information about health care reforms including a focus on Medicaid. In January, Republican Chairmen from the Senate Finance Committee and House Energy and Commerce Committee sent a letter to the Medicaid and CHIP Payment and Access Commission (MACPAC) requesting detailed information on Medicaid optional benefits and populations covered in each state to inform debate around controlling Medicaid spending. Previous analysis conducted prior to the ACA showed that 60% of total Medicaid spending is for optional eligibility groups and optional services for all groups and that some of the sickest enrollees fall into optional groups and many optional benefits, such as prescription drugs, are integral to comprehensive coverage. The share of spending that goes toward optional groups and benefits has likely increased since this analysis was completed, as states have gained additional program options since that time.

Calls for increased Medicaid flexibility are not new, and the minimum standards and options have evolved over time through federal legislation. For example, the Deficit Reduction Act of 2005 added more options for states to charge premiums and cost-sharing as well as increased flexibility around benefits. More recently, the Affordable Care Act (ACA) and the Supreme Court ruling on its constitutionality in 2012 provided new program flexibility around eligibility as well as for delivery system reform and new options for states to deliver community-based long-term care. Moreover, before the most recent Congressional letters, there were earlier efforts to expand state flexibility including the plan offered by Senator Hatch and Representative Upton in 2013 and the Republican Governors Public Policy Committee report in 2011 as part of block grant proposal debates. At the state level, trends over time show that states have used flexibility with the Medicaid program to different degrees. However, many states have used options to cover a greater share of their low-income population through targeted and broad expansions. States have also used available flexibility to continually evolve and transform how they how they pay for and deliver care. Further, during economic downturns, states have used options to cut provider rates and restrict benefits to control Medicaid spending.

Upcoming proposals for increased flexibility are anticipated to emerge within the context of reducing and capping federal spending by restructuring Medicaid financing to a block grant or per capita cap. However, previous analysis suggests that increased flexibility may only provide limited gains in program efficiencies, and that states would need to reduce enrollment or benefits to achieve large reductions in federal spending. For example, prior analyses examining block grant proposals released by House Republicans in 2011 and 2012 showed that even if states were able to limit per enrollee spending growth, the magnitude of the federal spending reductions would result in enrollment cuts of 42% to 50% accounting for the repeal of the ACA or 25% to 35% due to the block grant cuts; the analysis also showed reductions in reimbursement for providers including hospitals and nursing homes. Congressional Budget Office analysis from 2011 also noted that the large reduction in federal payments under the House Budget Plan would likely require states to reduce payments to providers, curtail eligibility for Medicaid, provide less extensive coverage to beneficiaries, or pay more in state funds than would be the case under current law. Moreover, the wide variation in spending across state programs resulting from current flexibility in the program creates challenges to establishing a block grant or per capita cap. Setting the caps based on current spending could lock historical state choices and program variation in place potentially rewarding states with higher historic spending creating “winners” or “losers” across states.

Minimum Standards and State Options

Eligibility

Minimum Standards

Minimum eligibility standards for pregnant women and children have expanded over time. At the Medicaid program’s outset in 1965, the minimum coverage groups were closely tied to welfare and included low-income families, seniors, and individuals with disabilities who were receiving cash assistance. Over time, the minimum coverage standards have expanded, particularly for children and pregnant women, largely following state adoption of options to expand coverage for these groups. Reflecting these expansions, prior to the ACA, states were required to cover children under age six and pregnant women with family incomes up to 133% FPL and older children with family incomes up to 100% FPL. The ACA built on these previous expansions by extending the 133% FPL minimum to older children. It also includes a five percentage point of income disregard that effectively raises the minimum to 138% FPL (Figure 2).2  As a result of this change, some states moved older children from separate CHIP programs to Medicaid. The ACA also established a maintenance of effort provision under which states must keep eligibility levels for children at least as high as they were when the ACA was enacted in 2010, until 2019.

Figure 2: Minimum Eligibility Standards by Group

Prior to the ACA, many low-income adults were excluded from Medicaid. Prior to the ACA, minimum eligibility standards for parents remained very low and there was no minimum or option to cover other low-income adults without dependent children. The ACA also expanded the 138% FPL minimum to adults, making many parents and other adults newly eligible for coverage.3  Although this expansion was enacted as a nationwide standard, the 2012 Supreme Court ruling on the ACA’s constitutionality effectively made the expansion to adults a state option.

The ACA did not change minimum eligibility standards for seniors and people with disabilities. States generally must cover seniors and people with disabilities receiving Supplemental Security Income (SSI)4  benefits (equivalent to 74% FPL, or about $8,800 per year for an individual, in 2017).5  States also must offer Medicare Savings Programs through which low-income Medicare beneficiaries with incomes generally below 135% FPL (or about $16,000 per year for an individual in 2016) receive Medicaid assistance with some or all of their Medicare premiums, deductibles, and other cost-sharing requirements (these “partial dual eligible” beneficiaries do not receive Medicaid benefits). Medicare has high out-of-pocket costs, and through the Medicare Savings Programs, Medicaid helps make Medicare affordable for those with the lowest incomes.6 

State Options

Before the ACA, states could expand eligibility beyond the minimum levels for children, pregnant women, parents, seniors, and individuals with disabilities and receive federal Medicaid matching funds. The creation of the Children’s Health Insurance Program (CHIP) in 1997 provided states additional options and enhanced federal funding to expand coverage for children. However, prior to the ACA, there was no option for states to cover low-income adults who did not fit into one of these categories, regardless of their income. As such, states could not receive federal funds to cover these adults, unless they received a waiver of federal rules and found offsetting savings to fund their coverage. As a result of the ACA expansion, states can now cover low-income adults up to 138% FPL and receive enhanced federal matching funds for this coverage. States also can choose to cover children, pregnant women, and other adults beyond the ACA’s 138% FPL minimum and receive federal funds for this coverage at their regular matching rate.

All states have taken up options to expand eligibility for children and many have expanded eligibility for pregnant women and other adults. As of January 2017, all states expanded eligibility for children above the 138% FPL minimum with 49 states setting eligibility for children at 200% FPL or higher through Medicaid and CHIP. Forty-nine states cover pregnant women above the federal minimum with 32 states setting eligibility at 200% FPL or higher (Figure 3). A total of 32 states, including DC, have taken up the ACA option to expand Medicaid to low-income adults with incomes up to 138% FPL, and three states extend coverage to parents and/or other adults at higher incomes. However, in the 19 states that have not expanded, eligibility limits for parents remain very low, with a median of 44% FPL, and other adults are not eligible regardless of income in all but one of these states.

Figure 3: State Take up of Options to Expand Eligibility

All states have expanded coverage for seniors and people with disabilities, with most states electing multiple coverage options. As of 2015, 21 states have increased eligibility for seniors and individuals with disabilities above the SSI level up to a federal maximum of 100% FPL; states also may apply an asset limit to this pathway, and all but one do. Nearly all states offer an eligibility pathway for children with significant disabilities living at home without regard to parental income who would be Medicaid-eligible if institutionalized.7  Thirty-three states chose to offer medically needy coverage, which enables people with high medical bills to spend down to a state-set eligibility standard.8  Forty-four states allow working individuals with disabilities with income above eligibility limits to buy into Medicaid, and five states offer a buy-in for children with significant disabilities with household income up to 300% FPL ($60,480 per year for a family of 3 in 2016).

States also can expand access to coverage for individuals with long-term care needs. In addition to the age and disability-related eligibility pathways above, states can offer Medicaid to people who need institutional or community-based long-term care with incomes up to 300% of SSI ($26,388 per year for an individual in 2016). States also set the asset limits to qualify for long-term care services. As of 2015, 44 states allowed people in need of nursing facility care to qualify for Medicaid with income up to 300% of SSI, and nearly all of these states use the same expanded financial eligibility standard for people receiving long-term care in the community. Moreover, states can expand Medicaid functional eligibility criteria to cover people with functional needs that do not yet meet an institutional level of care through the Section 1915 (i) state plan option. This option allows enrollees to remain in their homes and helps prevent the need for more intensive and costly services in the future. As of 2015, 17 states elected the Section 1915 (i) option to provide home and community based services (HCBS) to people at risk of future institutionalization.9  States have most frequently targeted this option to adults and children with significant mental health needs and people with intellectual or developmental disabilities.

Benefits

Minimum Standards

Federal standards outline minimum benefits for states to cover through their state Medicaid benefit package (Figure 4). For children, the minimum Medicaid benefit package offers access to all necessary services through the Early and Periodic Screening, Diagnostic, and Treatment (EPSDT) benefit, which includes regular screenings, vision, dental, and hearing services and any other medically necessary care. For adults, minimum benefits include services such as those provided by physicians and hospitals. The ACA added some new minimum benefits including smoking cessation services for pregnant women and free-standing birth center services. Although states must cover these minimum benefits, they determine the amount, duration, and scope of this coverage. Other services that are important for comprehensive care, such as prescription drugs, are not included in the minimum benefit package for adults.

Figure 4: Minimum and Optional Medicaid Benefits

Federal minimum long-term care benefits include nursing facility services and home health services for those who qualify for nursing facility services. There is no minimum standard for states to provide coverage for home and community-based care beyond the home health benefit in the Medicaid program. However, under the 1999 Supreme Court decision, Olmstead v. L.C., the Justices ruled that, under the Americans with Disabilities Act (ADA), institutionalizing a person with a disability who can benefit from and wants to live in the community is illegal discrimination.

State Options

Reflecting the diverse health needs of enrollees, there is a broad range of optional benefits that states may choose to cover and for which they may receive federal matching funds. Many of these optional benefits include long-term care services and supports that are not typically included in private insurance plans. For both minimum and optional benefits, states determine the amount, duration, and scope of covered benefits (e.g., the number of covered visits), subject to the requirement that coverage of the benefit be sufficient to achieve its purpose. All states offer at least some optional benefits, including prescription drugs, but how many and which optional benefits are offered vary across states as do the limits on covered benefits. The ACA created a new optional health home benefit to provide coordinated care to individuals with chronic conditions; states can receive a 90% federal match for the first two years that they offer this benefit.10  In 2016, 21 states (including DC) had at least one Medicaid health home program in place.

States can choose to provide a range of optional HCBS.11  Some of these include personal care services, offered by 32 states in 2013, and Community First Choice (CFC) attendant care services and supports, offered by eight states as of 2016. CFC is a new option added by the ACA that offers enhanced federal matching funds. In recent years, states also have been adding services such as supportive housing and supported employment to help people with disabilities function independently in the community. States also have the option to allow beneficiaries to self-direct their services by selecting and dismissing workers and/or allocating dollars within their service budgets. States have used the Medicaid HCBS options to shift the balance of long-term care spending away from institutions and toward community-based care. The share of Medicaid LTSS spending devoted to HCBS increased from 18% in 1995 to 53% in 2014.12  These options have also helped states  meet their Olmstead obligations under the ADA by providing services that help people with disabilities live independently in the community.

States may provide some groups with “alternative benefit plans” (formerly called “benchmark benefit packages”) instead of the traditional state Medicaid benefit package. This option was established in the Deficit Reduction Act of 2005 (DRA), which also newly allowed states to vary the benefits provided by coverage group or geographic area within the state.13  States can choose to base their alternative benefit plans on the standard Blue Cross Blue Shield (BCBS) preferred provider plan under the Federal Employees Health Benefits Plan (FEHBP), a state employee plan, the state’s largest commercial health maintenance organization (HMO), or other Secretary-approved coverage.14  Very few states have used this DRA option for benefits. The ACA requires that states provide expansion adults with an alternative benefit plan, but nearly all states have aligned their expansion adult benefit package with the benefit package provided to other enrollees for ease of administration and to provide equitable coverage across populations.

States also may use Medicaid funds as premium assistance to purchase private insurance rather than providing direct coverage. Medicaid premium assistance programs must be cost-effective and provide wraparound coverage so that enrollees have access to the same benefits and cost sharing protections as they would under traditional Medicaid coverage. Most states operate a premium assistance program, but enrollment in these programs is relatively low.15  This low enrollment reflects the limited availability of employer-sponsored coverage among the low-income population. More recently, Arkansas and New Hampshire are using the Medicaid premium assistance option to purchase Marketplace coverage for their ACA expansion adults.16 

Premiums and Cost Sharing

Minimum Standards

Federal standards exempt certain groups and services from premium and cost sharing charges to prevent cost barriers to coverage and care for the lowest income Medicaid enrollees. States may not charge premiums to Medicaid enrollees with incomes below 150% FPL. States cannot charge cost-sharing for emergency, family planning, pregnancy-related services, preventive services for children, or preventive services defined as essential health benefits in alternative benefit plans in Medicaid. In addition, children with incomes below the minimum eligibility standard generally cannot be charged cost-sharing.

State Options

States may charge premiums and cost sharing for certain Medicaid enrollees within established limits. The DRA gave states new options to charge premiums and cost sharing, which vary by group, income, and service.17  States may charge premiums for enrollees with incomes above 150% FPL. States also may charge cost sharing, but allowable charges vary by income (Table 1). Regardless of income, aggregate out-of-pocket costs for an individual may not exceed 5% of family income. The DRA also allowed states to make premiums and cost sharing enforceable for certain enrollees, meaning that individuals over 150% FPL can be disenrolled from coverage due to unpaid premiums, and a state can allow providers to deny care (other than emergency services) to those above poverty, unless an individual makes a required copayment at the point of service.18 


Table 1: Maximum Allowable Cost Sharing Amounts in Medicaid by Income
<100% FPL100% – 150% FPL>150% FPL
Outpatient Services$410% of state cost20% of state cost
Non-Emergency use of ER$8$8No limit (subject to overall 5% of household income limit)
Prescription Drugs

Preferred

Non-Preferred


$4

$8


$4

$8


$4

20% of state cost

Inpatient Services$75 per stay10% of state cost20% of state cost
NOTES: Some groups and services are exempt from cost sharing, including children enrolled through mandatory eligibility pathways, emergency services, family planning services, pregnancy-related services, and preventive services for children. Maximum allowable amounts are as of FY2014. Beginning Oct. 1, 2015, maximum allowable amounts increase annually by the percentage increase in the medical care component of the Consumer Price Index for All Urban Consumers (CPI-U).

Premium and cost sharing charges in Medicaid vary across states and eligibility groups. As of January 2017, four states charge premiums and three states charge cost sharing for children in Medicaid. (A larger number of states charge children premiums or enrollment fees and cost sharing in CHIP because the program covers children with relatively higher incomes and has different premium and cost sharing rules.) Among adults, 39 states charge parents cost-sharing in Medicaid, and 23 of the 32 states that have expanded Medicaid charge cost-sharing for expansion adults. Cost sharing amounts for adults are generally nominal, reflecting the low incomes of adults covered by Medicaid. Similarly, because eligibility levels for parents and other adults are generally at or below 138% FPL, most states do not charge premiums for adults. However, six states (Arizona, Arkansas, Indiana, Iowa, Michigan, and Montana) have received Section 1115 waiver approval to charge premiums or monthly contributions that are not otherwise allowed for their Medicaid expansion adults; these amounts are generally 2% of income, equivalent to what beneficiaries from 100-138% FPL would incur if they enrolled in Marketplace coverage.

Provider Payments and Delivery Systems

Minimum Standards

States have latitude to determine provider payments so long as the payments are consistent with efficiency, economy, quality and access and safeguard against unnecessary utilization. Within these broad guidelines, provider payments must be sufficient to ensure Medicaid beneficiaries with access to care that is equal to others in the same geographic area, and payments to managed care organizations must be actuarially sound.19  There are additional requirements that vary by provider type. For institutional providers such as hospitals and nursing facilities, states must publish payment methodologies for public review and comment and payments are subject to upper payment limits. States must pay federally qualified health centers and rural health clinics based on a prospective payment system that relies on costs in a base year, which are trended forward. Federal law requires that drug manufacturers enter into rebate agreements with the federal government to provide their drugs through Medicaid. Lastly, federal law requires that state Medicaid programs make Disproportionate Share Hospital (DSH) payments to qualifying hospitals that serve a large number of Medicaid and uninsured individuals. Within the annual DSH allotments to states and hospital specific limits, states have considerable flexibility on how to distribute DSH funds.

Federal standards do not address how states structure the delivery system used to provide services to Medicaid enrollees. However, if a state uses managed care, it must meet certain standards related to plan choice and provide certain consumer protections.

State Options

Given the broad authority available to states to set provider payments, there is significant variation across states in how provider rates are determined as well as in payment levels. States use a variety of payment methodologies for hospitals, including diagnosis related groups (DRGs) similar to Medicare, per diem amounts, or costs. Fee-for-service payments for physicians also vary significantly across states. For example, rates for office visits in California are 19% below the national Medicaid average while Oklahoma pays 29% above the average.20  On average, states pay fee-for-service providers about 66% of what Medicare pays, although this ratio differs across states (Figure 5). For managed care, some states set rates based on fee-for-service claims while others base rates on risk adjustments for different populations. Information is limited regarding the rates paid to providers in managed care.

Figure 5: Medicaid Provider Payment Levels Relative to Medicare Payments by State, 2014

States choose what type of delivery system to use to serve Medicaid enrollees. They can choose to serve enrollees through a fee-for-service system, a primary care case management model, or through capitated managed care plans. As of July 2016, 48 states had some form of managed care in place, including primary care case management and/or comprehensive risk-based managed care organizations (MCOs). Among the 39 states that contract with MCOs, 28 states reported that at least 75% of their enrollees were in MCOs, including four of the five states (California, New York, Texas, and Florida) with the largest total Medicaid enrollment across the country (Figure 6).

Figure 6: Percentage of Medicaid Beneficiaries Enrolled in Managed Care Organizations (MCOs), as of July 2016

An increasing number of states are adopting capitated managed care models that integrate physical, behavioral health, and long-term services and supports. As of 2016, nearly half (24) states operate a capitated managed long-term care program for at least some seniors and people with disabilities.21  Other states are providing access to HCBS in fee-for-service delivery systems.

State Medicaid programs have been expanding their use of payment and delivery system reform models including patient-centered medical homes, health homes, ACOs, and episode of care payments. These initiatives may be implemented through fee-for-service or managed care. State innovation in delivery and payment systems has been influenced and catalyzed by new demonstration and pilot programs and state plan authorities provided by the ACA. The ACA established the Center for Medicare and Medicaid Innovation (CMMI) to test, evaluate, and expand innovative care and payment models to foster patient-centered care, improve quality, and slow cost growth in Medicare, Medicaid and CHIP. CMMI launched the State Innovation Models (SIM) initiative which has awarded nearly $950 million in grants to states to design, implement, and evaluate multi-payer health care delivery and payment reforms aimed at improving the quality of care and health system performance while decreasing costs for Medicaid, CHIP, and Medicare beneficiaries.22  Many state Medicaid programs report adopting and promoting alternative provider payment models as part of their SIM projects.23  Additionally, 8 states’ Medicaid programs are participating in the CMMI Comprehensive Primary Care Plus (CPC+) initiative, a multi-payer advanced primary care medical home model.24 

DEMONSTRATION AUTHORITY

State Options

Federal law also provides Section 1115 waiver authority, which allows the Secretary of HHS to waive certain requirements in Medicaid and to allow federal Medicaid matching funds for purposes not otherwise allowed under federal rules. This provision authorizes the Secretary to allow approaches that do not meet federal rules, as long as the Secretary determines that the initiative is a “research and demonstration project” that “furthers the purposes” of the program. While the Secretary’s waiver authority is very broad, there are some elements of the program that the Secretary does not have authority to waive, such as the federal matching payment system for states. As of January 2017, 37 states have 50 approved Section 1115 waivers.25  States have used Section 1115 waivers for many purposes, including to expand eligibility, change delivery systems, alter benefits and cost-sharing, modify provider payments, and quickly extend coverage during an emergency.

The ACA created an additional Section 1115A waiver authority. Using Section 1115A authority, CMS along with 13 states launched financial and administrative alignment demonstrations that seek to improve care and control costs for people who are dually eligible for Medicare and Medicaid.

Looking Ahead

Debate around increased flexibility within Medicaid will likely emerge within the context of proposals to fundamentally restructure financing of the program to a block grant or per capita cap and reduce federal financing. Calls for increased Medicaid flexibility are not new, and the balance of standards and options has shifted over time. Today, states have broad flexibility over many aspects of their programs and can gain increased flexibility under Section 1115 waiver authority. What additional flexibilities would be provided beyond these options under such proposals would have implications for states, enrollees, and providers. What federal standards would remain in place will affect the extent of accountability for the federal investment in the program and the scope of nationwide protections available for enrollees. Additionally, how such proposals would address existing program variation in establishing base levels for the caps will be key, including variation as a result of 32 states, including DC, adopting the ACA expansion. Setting the caps based on current spending could lock historical state choices and program variation in place potentially rewarding states with higher historic spending and creating “winners” or “losers” across states.

Endnotes

  1. The federal medical assistance percentage (FMAP) is determined by a statutory formula based on state per capita income, which varies across states and adjusts over time. The federal government has temporarily increased the matching rate to provide fiscal relief to states during economic downturns and established an enhanced matching rate for some purposes, including the Affordable Care Act (ACA) Medicaid expansion to low-income adults. ↩︎
  2. The minimum is 133% of poverty, but the law includes a standard income disregard of five percentage points of the federal poverty level, which effectively raises this limit to 138% FPL. ↩︎
  3. Ibid. ↩︎
  4. To be eligible for SSI, beneficiaries must have low incomes, limited assets, and an impaired ability to work at a substantial gainful level as a result of old age or significant disability. ↩︎
  5. As of 2015, 10 states elect the § 209(b) option to use disability or financial eligibility standards that are more restrictive than the federal SSI rules, so long as the state’s rules are not more restrictive than those in effect in January 1972. Section 209(b) states must allow SSI beneficiaries to establish Medicaid eligibility through a spend-down by deducting unreimbursed out-of-pocket medical expenses from their countable income. Section 209(b) states also must provide Medicaid to children who receive SSI and who meet the state’s financial eligibility rules for the AFDC program as of July 16, 1996. ↩︎
  6. There are 3 Medicare Savings Programs: Medicaid pays Medicare premiums and cost-sharing for Qualified Medicare Beneficiaries (up to 100% FPL). Medicaid pays Medicare premiums for Specified Low-Income Medicare Beneficiaries (100-120% FPL) and Qualified Individuals (up to 135% FPL). There also are asset limits for these programs. ↩︎
  7. States can cover “Katie Beckett” children through a state plan option or HCBS waiver; waiver coverage allows enrollment to be capped. ↩︎
  8. States electing the medically needy coverage option must cover certain groups of people, such as pregnant women and children, and also can choose to extend medically needy coverage to other groups, such as seniors and people with disabilities. ↩︎
  9. Additionally, as of 2016, six states are offering HCBS to people at risk of institutionalization through Section 1115 managed long-term care waivers. ↩︎
  10. Kaiser Commission on Medicaid and the Uninsured, Medicaid’s New ‘Health Home’ Option (Washington, DC: Kaiser Commission on Medicaid and the Uninsured, January 2011), https://modern.kff.org/health-reform/issue-brief/medicaids-new-health-home-option/. ↩︎
  11. States can offer HCBS through their traditional Medicaid state plan benefit package or through a waiver; waivers allow enrollment to be capped. ↩︎
  12. Steve Eiken, Kate Sredl, Brian Burwell, and Paul Saucier, Medicaid Expenditures for Long Term Services and Supports (LTSS) in FY 2014, (Bethesda, MD: Truven Health Analytics, April 2016), https://www.medicaid.gov/medicaid-chip-program-information/by-topics/long-term-services-and-supports/downloads/ltss-expenditures-2014.pdf. ↩︎
  13. Certain groups are exempt from mandatory enrollment in an alternative benefit plan and instead must have access to the traditional state plan benefit package. These include mandatory pregnant women, mandatory parents, and those who are medically frail (including individuals with disabilities or special medical needs, dual eligible beneficiaries, and people with long-term care needs). MaryBeth Musumeci, The Affordable Care Act’s Impact on Medicaid, Eligibility, Enrollment, and Benefits for People with Disabilities (Washington, DC: Kaiser Commission on Medicaid and the Uninsured, April 2014), https://modern.kff.org/health-reform/issue-brief/the-affordable-care-acts-impact-on-medicaid-eligibility-enrollment-and-benefits-for-people-with-disabilities/. ↩︎
  14. 42 C.F.R. § 440.330. ↩︎
  15. Joan Alker, Sean Miskell, MaryBeth Musumeci, and Robin Rudowitz, Medicaid Premium Assistance Programs: What Information is Available About Benefit and Cost-Sharing Wrap-Around Coverage? (Washington, DC: Kaiser Commission on Medicaid and the Uninsured, December 2015), https://modern.kff.org/report-section/medicaid-premium-assistance-programs-what-information-is-available-about-benefit-and-cost-sharing-wrap-around-coverage-introduction/ (citing United States Government Accountability Office, Medicaid and CHIP: Enrollment, Benefits, Expenditures, and Other Characteristics of State Premium Assistance Programs (Washington, DC: United States Government Accountability Office, Jan. 19, 2010), http://www.gao.gov/new.items/d10258r.pdf). ↩︎
  16. Iowa had waiver approval for and implemented a premium assistance program for some Medicaid expansion enrollees, but the program was discontinued by the state. ↩︎
  17. Kaiser Commission on Medicaid and the Uninsured, Deficit Reduction Act of 2005, (Washington, DC: Kaiser Commission on Medicaid and the Uninsured, February 2006), https://modern.kff.org/medicaid/issue-brief/deficit-reduction-act-of-2005-implications-for/. ↩︎
  18. Ibid. ↩︎
  19. Institutional providers (hospitals) and nursing facilities: States are required to publish payment methodologies for public review and comment and payments are subject to upper payment limits for these providers based on what Medicare would have paid in aggregate. Physicians, other providers and managed care organizations: States are required to pay rates that are sufficient to ensure access equal to the rest of the area population. For MCOs, payment mush be actuarially sound. Federally Qualified Health Centers (FQHCs): Under legislation enacted in 2001, states are required to pay these health centers and clinics based on a prospective payment system that relies on costs in a base year and trended forward. Prescription Drugs: Federal law requires that drug manufacturers enter into rebate agreements with HHS to provide their drugs through Medicaid. ↩︎
  20. Stephen Zuckerman, Laura Skopec, and Kristen McCormack, Reversing the Medicaid Fee Bump: How Much Could Medicaid Physician Fees for Primary Care Fall in 2015? (Washington, DC: Urban Institute, December 2014), http://www.urban.org/research/publication/reversing-medicaid-fee-bump-how-much-could-medicaid-physician-fees-primary-care-fall-2015. ↩︎
  21. Vernon K. Smith et al., Implementing Coverage and Payment Initiatives: Results from a 50-State Medicaid Budget Survey for State Fiscal Years 2016 and 2017 at 47 (Washington, DC: Kaiser Commission on Medicaid and the Uninsured, October 2016) (citing 23 states using private health plans to deliver LTSS), https://modern.kff.org/medicaid/report/implementing-coverage-and-payment-initiatives-results-from-a-50-state-medicaid-budget-survey-for-state-fiscal-years-2016-and-2017/. In addition, Vermont uses a state entity acting as a prepaid health plan to deliver MLTSS on an at-risk basis. ↩︎
  22. Kaiser Commission on Medicaid and the Uninsured, The State Innovation Models (SIM) Program: A Look at Round 2 Grantees (Washington, DC: Kaiser Commission on Medicaid and the Uninsured, September 2015), https://modern.kff.org/medicaid/fact-sheet/the-state-innovation-models-sim-program-a-look-at-round-2-grantees/. ↩︎
  23. Vernon K. Smith et al., Implementing Coverage and Payment Initiatives: Results from a 50-State Medicaid Budget Survey for State Fiscal Years 2016 and 2017 (Washington, DC: Kaiser Commission on Medicaid and the Uninsured, October 2016), https://modern.kff.org/medicaid/report/implementing-coverage-and-payment-initiatives-results-from-a-50-state-medicaid-budget-survey-for-state-fiscal-years-2016-and-2017/. ↩︎
  24. Centers for Medicare and Medicaid Services, Medicaid & CHIP Strengthening Coverage, Improving Health (Baltimore, MD: Centers for Medicare and Medicaid Services, January 2017), https://www.medicaid.gov/medicaid/program-information/downloads/accomplishments-report.pdf. ↩︎
  25. Centers for Medicare and Medicaid Services, Medicaid & CHIP Strengthening Coverage, Improving Health (Baltimore, MD: Centers for Medicare and Medicaid Services, January 2017), https://www.medicaid.gov/medicaid/program-information/downloads/accomplishments-report.pdf. ↩︎