Most Americans Believe Chronic Illnesses Usually Result from Circumstances Beyond a Person’s Control

The independent source for health policy research, polling, and news.
As a number of states pursue Medicaid waivers to require certain beneficiaries to work in order to receive benefits, the House Budget Committee passed a budget resolution this month calling for the enactment of Medicaid work requirements in all states, a goal also advanced in proposed legislation in the Senate by Sen. John Kennedy of Louisiana.
Although details are scant at this point, a new analysis from the Kaiser Family Foundation provides illustrative scenarios of potential Medicaid coverage reductions if all states had work requirements similar to those already approved by the Centers for Medicare and Medicaid Services for Kentucky, Indiana, Arkansas and New Hampshire, and sought by several other states. It finds that a majority of people who would lose Medicaid coverage are likely to be working or able to qualify for an exemption; they would lose coverage due to administrative difficulty reporting their status. Between 1.4 million and 4 million adults could lose Medicaid coverage nationally, the analysis finds.
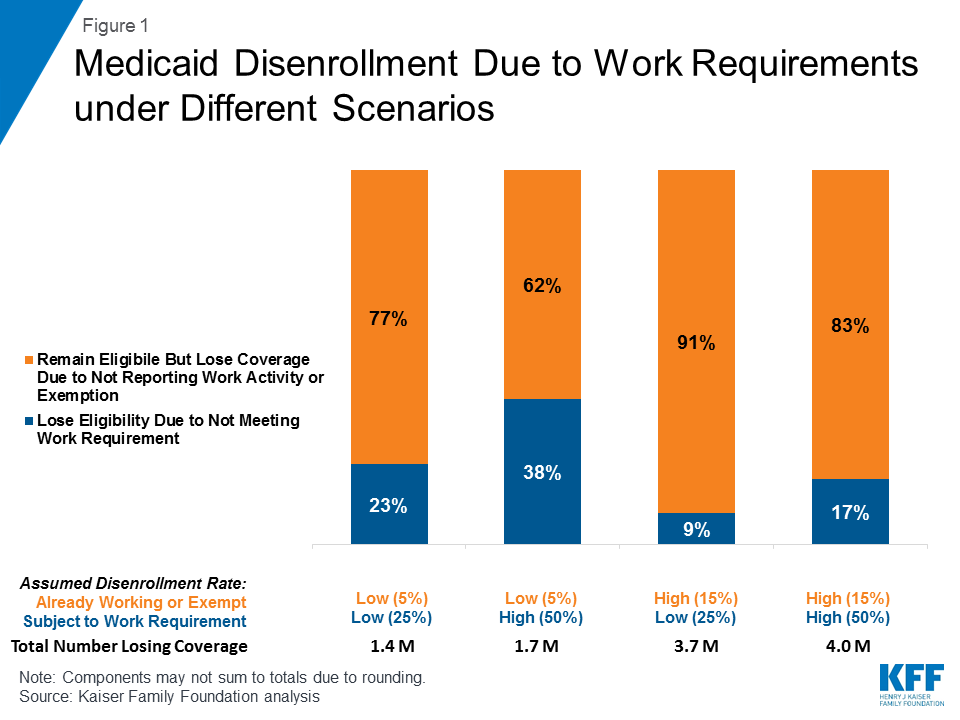
The scenarios assume low and high disenrollment rates tied to compliance with the work requirements and related problems with reporting, based on disenrollment rates reported in existing studies of the effect of Medicaid reporting requirements and state estimates of enrollment under proposed waivers. Under all scenarios, most disenrollment could be among individuals who would remain eligible for Medicaid, but would lose coverage due to new administrative burdens or red tape.
Earlier this month, the Trump Administration proposed new regulations for the Federal Title X family planning program that could significantly impact the network of providers currently available to low-income women and restrict what participating providers can discuss with women as part of their family planning care. A new Kaiser Family Foundation issue brief reviews the proposed regulations and their implications for low-income women and the providers who serve them.
A key proposed change would essentially disqualify family planning organizations that also offer abortions, like Planned Parenthood, from receiving Title X support to provide family planning services to low-income women. In addition, the proposed regulations would:
The public can comment on the proposed Title X regulations through July 31st, and a final regulation may be published as soon as September of this year.
Starting in Spring 2018, the Trump Administration implemented a new zero tolerance policy for individuals entering the U.S. without authorization. This policy resulted in the separation of children from their parents because the parents were criminally prosecuted for illegal entry into the country. On June 20, 2018, President Trump signed an Executive Order to generally detain immigrant families together while their criminal and immigration cases are being processed. However, a court ruling limits the length of time the federal government can hold children in detention to 20 days and the Executive Order did not address reunification of separated families. On June 26, 2017, a court issued a preliminary injunction to prohibit family separation except when a parent is determined to be unfit or presents a danger to a child and require reunification of families who have been separated. This fact sheet highlights key health implications of family separation and detention.
According to media reports, DHS separated over 2,342 children from parents under its zero tolerance policy between May 5 and June 9, 2018, an average of 65 children each day.1 In early May 2018, after an initial pilot period in Texas, the Trump Administration implemented a new zero tolerance policy for individuals entering into the U.S. without authorization. Under this policy, the federal government criminally prosecutes any individual apprehended while crossing the border, which results in them being placed into criminal custody. When the federal government took adults into criminal custody, they separated them from their children since children cannot be held in jail or prison. The Department of Homeland Security (DHS) applied this zero tolerance policy broadly to individuals crossing the border without authorization, including those seeking asylum after entering the U.S. outside a port of entry. However, reports suggest it has become increasingly difficult for individuals to seek asylum through ports of entry,2 and there have been reports that some children were separated from parents who entered through a port of entry to seek asylum.3
DHS designated children separated from their parents as “unaccompanied alien children” and transferred their care to the Office of Refugee Resettlement (ORR), which is within the Department of Health and Human Services (HHS). Historically, this program primarily cared for children who entered into the U.S. without an adult, who are a different group from the children separated from their parents.4 Children separated from their parents generally were placed in an ORR-funded facility, which includes over 100 shelters in 17 states. ORR facilities are responsible for providing children they house with education, health services, case management, and socialization and recreation. Some separated children were also placed into foster care; ORR may also place children with relatives residing in the U.S. DHS indicated that children could be reunited with their parent after the parent is released from custody by the Department of Justice (DOJ) to be deported or begin the process of seeking asylum.5 However, reports suggest that there were no clearly established policies for reuniting families and that some parents were deported without their children or unable to reunite with their children after being released from custody.6
On June 20, 2018, President Trump signed an Executive Order that maintains the zero tolerance policy but directs DHS to detain families together where appropriate and consistent with law and available resources for the duration of their criminal and immigration case proceedings.7 Because immigrant cases can take months or longer to process, under this order, families could be facing extended time in detention. However, under a previous court ruling, known as the Flores settlement agreement, the federal government cannot detain children in secure facilities for more than 20 days (Box 1).8 Flores also establishes minimum standards for facilities holding children, including requiring that they be state-licensed. As such, the Executive Order also directs the Attorney General to file a request with the court to modify the Flores settlement agreement. As directed by the Executive Order, on June 21, 2018, the DOJ filed a request that asked the court to modify Flores by allowing the government to detain children with their families for the duration of their criminal and immigration proceedings, beyond the 20-day limit, and to relieve the government of the obligation to hold children in state-licensed facilities.9
Box 1: What are key requirements for children under the Flores settlement agreement?
The Flores settlement agreement establishes nationwide policy for the treatment of minor children detained in federal custody.
Least restrictive setting and 20-day limit on detention. Flores requires that the federal government release children as soon as possible to a relative or other guardian and that those kept in custody should be placed in the least restrictive and appropriate setting possible, such as a non-secure licensed facility. Under Flores, the federal government should move children out of detention within several days of apprehension, although an exception allows that it may hold children in detention up to 20 days if there is an emergency or major influx of children into the U.S. This 20-day limit does not apply to parents. However, following a court ruling specifying that Flores applied to accompanied children, the previous administration generally complied with the 20-day limit for children by releasing the whole family under a bond, an order of supervision, or other alternatives to detention such as community-based case management and monitoring programs.
Health standards for facilities holding children. Flores establishes safety and sanitation standards for government detention facilities holding children and minimum standards for non-secure facilities where minors may be placed. For example, non-secure facilities must offer health care, dental care, family planning services, prescribed medications, special diets, mental health interventions, daily recreation activities, and weekly individual counseling. In addition, facilities must be state licensed to provide residential, group, or foster care services for dependent children.
Family separation or detention often compounds existing trauma and stress that children and families have already experienced in their home country or on their journey to the U.S. Many families seeking entry to the U.S. are fleeing dangerous environments where children may have witnessed or experienced violence or gone without basic needs.
Separating children from their parents exposes them to trauma and toxic stress that can have lifelong negative impacts on their mental and physical health. As noted by the American Academy of Pediatrics (AAP), exposing children to traumatic events and prolonged or toxic stress such as separation from a parent disrupts a child’s healthy development and can lead to physiologic changes that result in short- and long-term negative effects on physical, mental, and behavioral health (Box 2).10 11 Children in families in which a parent has been detained and deported experience significant behavior changes including changes in eating and sleeping, frequent crying, increased fear and anxiety, and/or withdrawal or anger.12 In addition, some children experience speech and developmental difficulties, including regression and reversal of developmental milestones.13
Detention, for even brief periods, has short- and long-term negative effects on the health of parents and children. Studies show high levels of psychiatric distress, including depression and post-traumatic stress, among detained asylum seekers, even after short detention periods, and that symptoms worsen over time.14 Global studies also show significant effects for children held in detention, including depression, post-traumatic stress, suicidal thoughts and behaviors, developmental delays, and behavioral issues.15 In a policy statement, the AAP notes that research documents negative physical and emotional symptoms among detained children and adults and also shows negative impacts on the parent-child relationship.16
Box 2: Short- and Long-Term Effects of Trauma and Toxic Stress on Children
In the short term, toxic stress can increase the risk and frequency of infections in children as high levels of stress hormones suppress the body’s immune system. It can also result in developmental issues due to reduced neural connections to important areas of the brain. Toxic stress is associated with damage to areas of the brain responsible for learning and memory.
Over the long term, toxic stress may manifest as poor coping skills and stress management, unhealthy lifestyles, adoption of risky health behaviors, and mental health issues, such as depression. Toxic stress is also associated with increased rates of physical conditions into adulthood, including chronic obstructive pulmonary disease, obesity, ischemic heart disease, diabetes, asthma, cancer, and post-traumatic stress disorder.
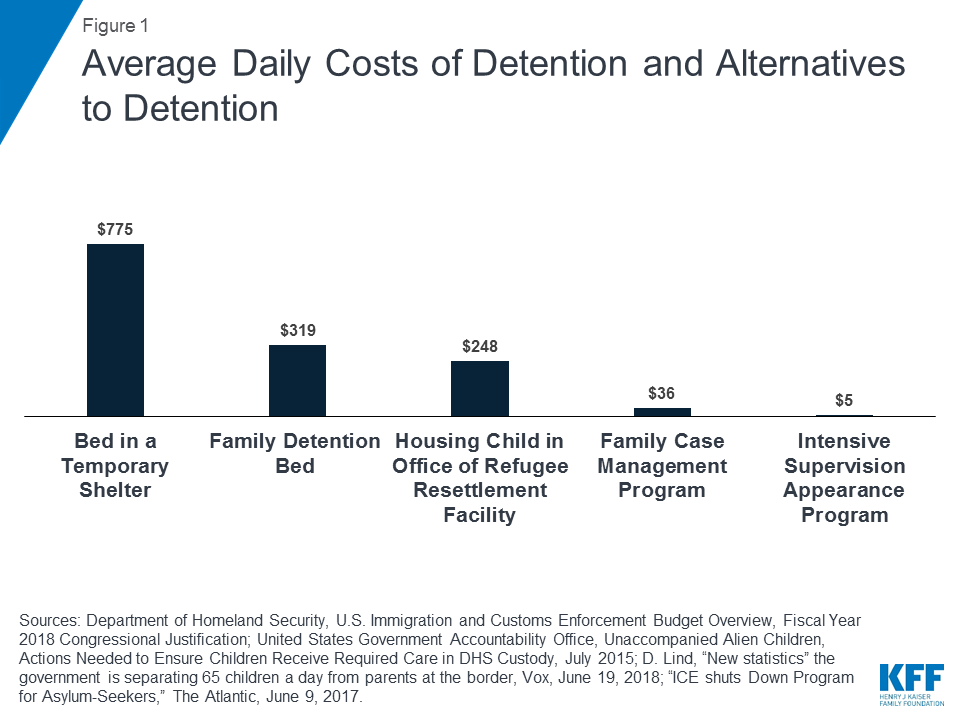
Detaining families and children is more expensive than alternative community-based supervision and monitoring programs (Figure 1). According to the 2018 budget request for U.S. Immigration and Customs Enforcement (ICE), the average daily rate for a family bed in a detention center is $319.17 Costs for housing a child separately in an ORR-funded facility were $248 on average per day in 2014.18 However, daily costs for recently constructed temporary or tent-based shelters are estimated to be substantially higher, at $775 per person per night.19 The cost of monitoring individuals in the community through alternatives to detention is much lower. Specifically, the 2018 ICE budget request notes that the daily cost of community supervision and monitoring is $4.50.20 The average daily cost was $36 for the Family Case Management Program, a community-based program for families seeking asylum, which the Trump Administration ended in 2017. 21
After President Trump signed his Executive Order, U.S. Customs and Border Protection issued a statement indicating that family unity will be maintained for families apprehended crossing the border without authorization.22 It remains unclear how the inconsistency between the Executive Order’s requirement for family detention for the duration of criminal and immigration proceedings and the Flores agreement, which establishes a 20 day limit on the length of time a child can be detained, will be resolved. As of June 26, 2018, the court has not yet ruled on the DOJ’s June 21 request for modifications to the Flores agreement that would allow for children to be detained for the duration of their parent’s criminal and immigration proceedings. On June 25, 2018, U.S. Customs and Border Protection indicated that, although the zero tolerance policy is still in effect, they have halted referrals of adult immigrants to criminal prosecution for crossing the border.23
DHS has released information on the process to reunify families separated under the zero tolerance policy, but did not specify how long it would take to reunify all separated children. DHS reports that it has established a process to “ensure that family members know the location of their children and have regular communication after separation to ensure that those adults who are subject to removal are reunited with their children for the purposes of removal.”24 DHS also notes that it knows the location of all children in custody and is working to reunite the children with their families, although it does not specify the timing and process for reuniting parents released from detention but seeking asylum to stay in the U.S. As of June 23, 2018, DHS reports that it has reunited 522 of the over 2,300 children who were separated from an adult under the zero tolerance policy. DHS did not provide an estimate of how long it will take to reunite the remaining families.
On June 26, 2018, a federal judge ordered a preliminary injunction to halt the separation of families and require reunification of separated families within designated timeframes.25 This injunction was in response to a class action suit filed on behalf of all adult parents who have been or will be detained in immigration custody and have a minor child who is or will be separated from them and detained in DHS or ORR custody. Specifically, the preliminary injunction bars the federal government from detaining parents separate from their children, requires that children be reunited with their parents when the parents are released from custody, and prohibits the removal of parents from the country without their children. The court allows for an exception from these requirements if there is a determination that the parent is unfit or presents a danger to the child or the parent voluntarily declines to be reunited with the child. The court further requires that the federal government reunite all children under age five with their parents within 14 days of the order and all children age five and older within 30 days of the order. Moreover, it requires the federal government to immediately take all steps necessary to facilitate regular communication between separated parents and their children and ensure all parents have telephone contact with their children within 10 days of the order. In a separate case, 17 states have filed suit against the Administration challenging family separation.
It remains unclear if Congress will act to address family separation or detention and broader immigration policy. Following implementation of the zero tolerance policy and prior to the President’s Executive Order, Congress introduced multiple bills to address family separation along with broader changes in immigration policy. Following the Executive Order, President Trump indicated that Congress should halt legislative efforts to address immigration policy. On June 21, 2018, a House vote on the proposed Goodlatte immigration bill failed. It remains unclear what action Congress will take on immigration policy moving forward.
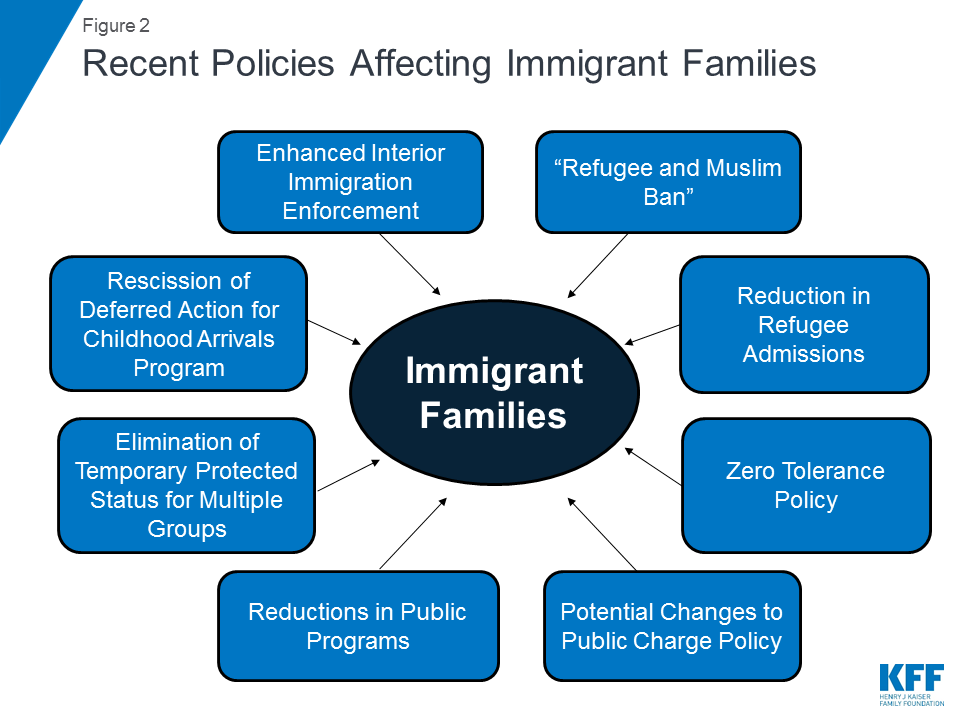
The zero tolerance policy at the border adds to a range of other recent policies negatively affecting the health and well-being of immigrant families, including families with U.S. born citizen children already residing in the U.S. Since President Trump has taken office, he has implemented a number of policies to enhance immigration enforcement and restrict legal immigration (Figure 2). Focus groups conducted in Fall 2017 found that these policies, along with rising anti-immigrant sentiment, are leading to resounding levels of fear and uncertainty among immigrant families, including those with lawful status. Further, this fear and uncertainty are having significant negative effects on the health and well-being of children in immigrant families already present in the U.S., who are largely U.S.-born citizens.
The Administration is considering other potential policy changes that would negatively affect the health and well-being of immigrant families, including their citizen children. Notably, the Administration is pursuing changes that, for the first time, would allow the federal government to take into account use of Medicaid, CHIP, subsidies for Marketplace coverage and other health, nutrition, and non-cash programs when making public charge determinations. Under these changes, use of these programs, including Medicaid, CHIP, and subsidies for Marketplace coverage, by an individual or family member, including a citizen child, could result in the federal government denying an individual a “green card” or adjustment to lawful permanent status or entry into the U.S. These changes would likely result in reduced participation in Medicaid, CHIP, Marketplace coverage, and other programs by immigrant families, including citizen children, even though they would remain eligible. Decreases in Medicaid and CHIP enrollment would increase the number of uninsured and reduce access to care, increase financial strains on families, and widen disparities in coverage.
On January 11, 2018, the Centers for Medicare and Medicaid Services (CMS) issued a State Medicaid Director Letter providing new guidance for Section 1115 waiver proposals that would impose work requirements (referred to as community engagement) in Medicaid as a condition of eligibility. As of June 2018, CMS has approved such work requirements in 4 states: Kentucky, Indiana, Arkansas and New Hampshire. A number of other states have waivers pending at CMS to impose work requirements or are considering such proposals. Not all states are interested in Medicaid work requirements, but Senate proposals and the House Budget Resolution passed by the House Budget Committee are calling for a federal requirement that all states implement work requirements in Medicaid.
This analysis provides illustrative scenarios of potential nationwide reductions in Medicaid coverage if all states implemented work requirements similar to those currently proposed. The scenarios assume low and high disenrollment rates tied to compliance with the work requirements and related problems with reporting, based on disenrollment rates reported in existing studies of the effect of Medicaid reporting requirements and state estimates of enrollment under proposed waivers. Overall, among the 23.5 million non-SSI, non-dual, nonelderly Medicaid adults, disenrollment ranges from 1.4 million to 4.0 million under the scenarios considered (Figure 1). Because the majority of Medicaid adults are already working or likely exempt from work requirements, they account for a large share of people losing coverage even if they may lose coverage at a lower rate than those who are not already working but subject to work requirements. Specifically, under all scenarios, most disenrollment would be among individuals who would remain eligible but lose coverage due to new administrative burdens or red tape versus those who would lose eligibility due to not meeting new work requirements.
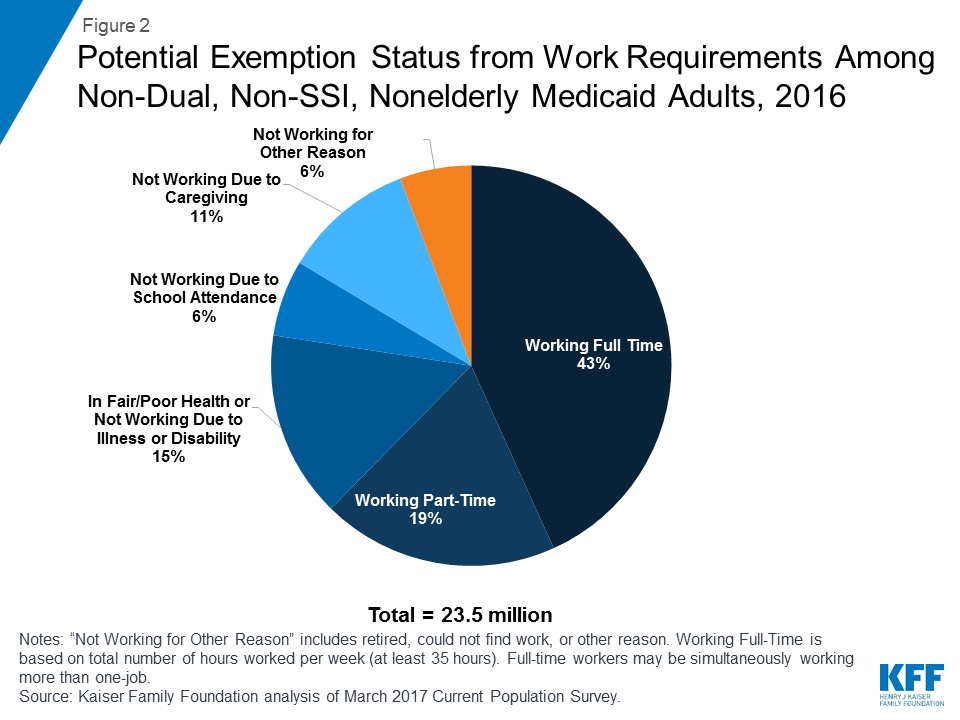
Earlier analysis shows that most nonelderly Medicaid adults already are working or face significant barriers to work, leaving a very small share of adults to whom these policies are directed. More than six in ten nonelderly, non-dual, non-SSI Medicaid adults are already working (Figure 2). Among those who are not working, most are in fair/poor health or report illness or disability, caregiving responsibilities, or going to school as reasons for not working. Many of these reasons would likely qualify as exemptions from work requirement policies. This would leave 6% of the population to whom work requirement policies could be directed. Some in this group report they are retired (2%), which often is related to ill health, and others in this group report that they are unable to find work (2%); just 1% are not working for another reason.
However, work requirements have implications for all populations covered under these demonstrations. Those who are already working still must successfully document and verify their compliance. Those who qualify for an exemption also must successfully document and verify their exempt status, as often as monthly.
States will need to develop reporting and verification systems to administer work requirements. In most cases, these systems will require enrollees to actively report participation in work or another qualifying activity or obtain an exemption from the requirement. For example, in Arkansas, enrollees must set up online accounts and log into their accounts by the 5th of each month to attest to participating in work or other qualifying activities.
To estimate potential coverage losses nationally if all states were to implement work requirements, we started with the analysis above of current work status and reasons for not working among the non-SSI, non-dual, nonelderly Medicaid adult population. We applied different assumptions about changes in coverage to three groups: those who are already working, those who are likely exempt, and those subject to new work requirements. Additional detail is available in the Methods appendix at the end of this brief.
Work requirements in Medicaid will primarily affect people already working or exempt non-workers by imposing new reporting requirements to document either their compliance or exemption with the rules regarding work. We classified as already meeting the work requirement but having to report their hours anyone who was working full-time (>35 hours/week) or part-time (<35 hours/week).1 We classified as likely exempt anyone who reported that they were in fair/poor health or reported that the reason they were not working was due to illness/disability, being in school, or being a caretaker. There is some variation in exemptions across the states that have approval to implement work requirements and some variation in pending state requests that could expand or limit the scope of who may qualify for an exemption beyond these broad categories.
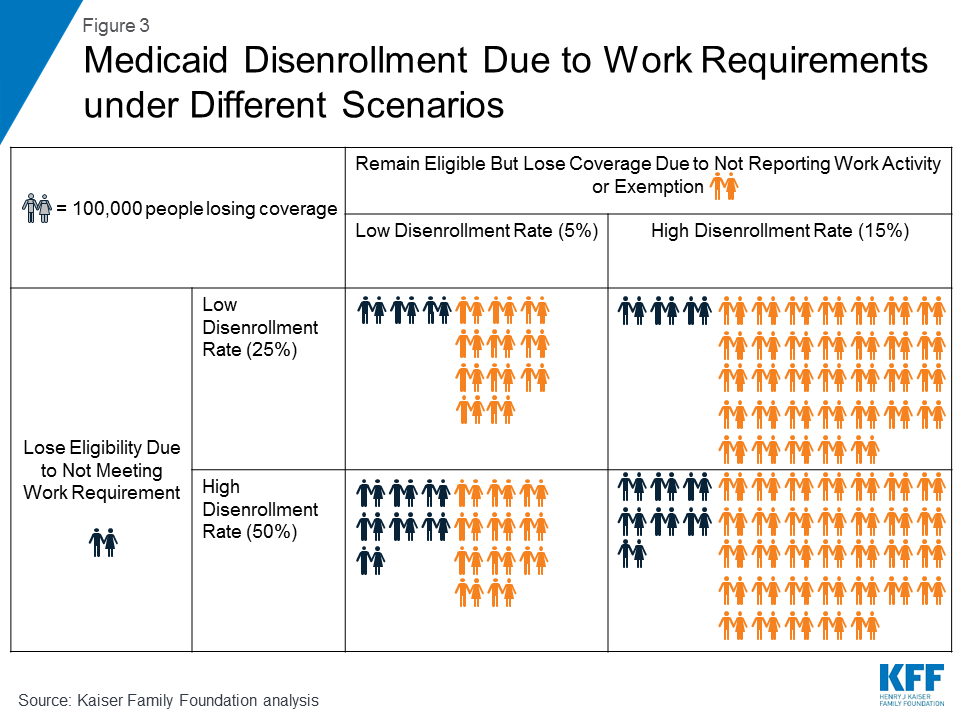
Disenrollment among those who may still be eligible but experience challenges in complying with administrative reporting requirements may be considered an “unintended” negative consequence of implementing a policy. Research shows that administrative requirements in Medicaid create barriers for individuals to enroll and stay enrolled in coverage. These studies broadly investigate how many and why Medicaid and/or CHIP enrollees lost coverage despite evidence that they remain eligible for the program or how certain enrollment policy changes (such as adding or dropping reporting requirements) affected enrollment. While some may move off Medicaid due to increases in income or obtaining other coverage, many who are eligible may lose coverage for failure to return or misdirected paperwork or other necessary documentation or for failure to pay premiums. These studies can be a good proxy for attempting to understand how new administrative requirements such as obtaining an exemption or verifying work status might affect enrollment. Based on our review of numerous studies, we applied a “low” disenrollment rate of 5% and a “high” of 15% among the population likely exempt from work requirements or already working.
We classified as likely subject to the work requirement anyone who reported the reason they were not working was that they were not able to find work, retired, or other reason. We reviewed state estimates of enrollment effects of imposing work requirements in Medicaid and research examining disenrollment due to the imposition of work requirements in TANF and SNAP to develop disenrollment rates among those subject to work requirement. The studies we reviewed estimated a broad range of disenrollment rates. Based on this information, we assumed a “low” disenrollment rate of 25% and a “high” rate of 50% among people likely not exempt from work requirements.
Overall, among the 23.5 million non-dual, non-SSI, nonelderly Medicaid adults, disenrollment ranges from 1.4 million to 4.0 million under the illustrative scenarios considered. These totals are highly subject to the assumed disenrollment rates. They represent a range of 6-17% enrollment loss among the non-SSI, non-dual, nonelderly Medicaid population and a range of 3-6% enrollment loss among the total Medicaid population.
In all scenarios, most people losing coverage are disenrolled due to lack of reporting rather than not complying with the work requirement (Figure 3). Because the majority of Medicaid adults are already working or exempt, they account for most people losing coverage even though they lose coverage at a lower rate than those not working and subject to the new requirement. Even in the scenario that uses a “low” disenrollment rate among the exempt/working population and a “high” disenrollment rate among those subject to the requirement, 62% of those losing coverage are in the exempt/working category.
The structure of state waiver requests typically targets so-called “able-bodied” adults for work requirements, exempting those who are parents, students, or medically frail. However, even those exempt from work requirements may still have to document their exemption status, creating new paperwork or reporting obligations for them, and adults who are already working also will have to document and report their hours. There is a risk of eligible people losing coverage due to their inability to navigate these processes, miscommunication, or other breakdowns in the administrative process. Drawing on literature showing disenrollment due to administrative requirements in Medicaid, this analysis shows that, under all scenarios considered, most people losing coverage would actually be exempt from or complying with work requirements, an outcome that may be considered an unintended negative consequence of these programs. Given limited availability of other coverage options for low-income individuals, most people losing Medicaid coverage are likely to become uninsured, which may be particularly problematic for the large share of Medicaid adults with health problems.
Potential loss of Medicaid among eligible enrollees highlights how work requirement programs might undo progress in helping eligible individuals access Medicaid coverage and could return Medicaid to welfare rules. In recent decades, as Medicaid has “de-linked” from cash assistance and developed into a health coverage program for low-income individuals without access to other coverage, states have implemented enrollment and renewal simplification measures to streamline Medicaid administration and make gaining and keeping coverage easier for eligible individuals. Increased documentation requirements stemming from work requirement waivers could reverse these changes and shift Medicaid from a health insurance program for low-income families back to one that operates under welfare rules.
New requirements will increase administrative costs, complexity and potential coverage losses among those who remain eligible. States implementing work requirements will likely have to design new systems to reflect changes in eligibility rules, to enable enrollees to report compliance, to interface with other programs (such as SNAP, TANF, or employment training), to implement coverage lock-out periods, and to exchange eligibility information among the state, enrollment broker, health plans, and providers. New staff may be required to conduct beneficiary education, develop notices, evaluate and process exemptions, and review more applications as churn increases and enrollees appeal coverage lockout periods. These fundamental changes to Medicaid administration may lead to even greater coverage losses than literature on past reporting requirements finds, as that literature is based on more incremental changes to Medicaid administration (e.g., changing the time frame required for renewal). In addition, how well states administratively operationalize these policy changes will affect the magnitude of the enrollment effect. States that face enrollment declines will face loss of federal matching funds for those enrollees (at enhanced federal matching rates for those eligible under the ACA), potentially creating a situation in which states are faced with either spending more on administration or losing federal Medicaid funds.
Because work requirement programs may disproportionately affect certain groups of enrollees, disenrollment could be concentrated among particularly vulnerable populations. Analyses show that older adults, people with disabilities, and women have lower rates of work than other groups and may face particular challenges in meeting exemptions or navigating exemption policies. In addition, analysis of proposed legislation in Michigan to impose work requirements—but exempt individuals in counties with unemployment exceeding 8.5 percent—showed that the policy would have disparate racial impact and would disproportionately exempt whites in more rural areas compared to blacks in more urban areas.2 This provision was not included in the legislation adopted in Michigan, but waivers approved in other states require states to assess and determine if exemptions or other program changes are needed for certain geographic areas (e.g., places with high unemployment, limited economic or educational opportunities, lack of public transportation) to prevent work requirement programs from being impossible or unreasonably burdensome to meet. Depending on how these exemptions are designed and implemented, they could have disproportionate effects on some groups of beneficiaries.
Restrictions on state use of Medicaid funds under waivers will limit how many non-workers may be able to comply with new requirements. The CMS guidance on work requirements is explicit that states will be required to describe strategies to assist beneficiaries in meeting work requirements but may not use federal Medicaid funds for supportive services to help people overcome barriers to work. It is unclear how states will come up with the additional funds needed to address successfully the multiple barriers (childcare, transportation, education, training, etc.) that interfere with the ability to work. As experience with TANF shows, without sufficient support systems and services, people subject to work requirements may face challenges in finding and retaining employment.
Our analysis of which enrollees are already working, likely exempt, or not working but subject to new work requirements is based on analysis of the 2017 Annual Social and Economic Supplement (ASEC) to the Current Population Survey. We restricted the analysis to non-elderly adult (age 19-64), non-dual eligible Medicaid enrollees who did not receive Supplemental Security Income. Within this population, we grouped people into the three groups based the following hierarchy:
While specific exemption policies vary across states with proposed or approved work requirements, this hierarchy allows us to group people into general categories of already working (groups 1 and 2); likely exempt due to medical frailty (group 3), age (group 4), school attendance (group 5) or parent caretaking duties (group 6); or not working and subject to work requirements (group 7).
For people already working or likely exempt from work requirements, we developed our “low” and “high” disenrollment rate based on studies examining the effect of administrative requirements in Medicaid on enrollment. Studies focus on a range of settings (e.g., nationwide or a particular state), populations (e.g., children or all enrollees), and time periods and are therefore difficult to summarize in one single estimate. This research generally groups into two categories.
First, some studies examine how many and why Medicaid and or CHIP enrollees lost coverage despite evidence that they remain eligible for the program. Studies that examine the share of beneficiaries who lose coverage despite continued eligibility (implying an administrative issue) or explicitly lose coverage due to not completing necessary paperwork/forms report between 5% (children in Utah3 ) and 36% (Commonwealth Care enrollees in Massachusetts4 ) disenrollment due to administrative barriers. The case study of Utah appears to be a low-end estimate, as other estimates are higher: 13% (children nationwide5 ), 18% (MassHealth enrollees6 ), and 29% (nonelderly adults nationwide7 ). Examples of studies that look at churn (people losing coverage and then re-enrolling shortly thereafter, implying loss of coverage is related to administrative re-enrollment barriers) find that between 10% (children in California8 ) and 18% (children in Massachusetts9 and children in South Carolina10 ) lose coverage and re-enroll. The average administrative burden disenrollment rate across these studies is 18%. Together, this research shows that paperwork or administrative requirements in Medicaid or CHIP lead to between 5% and 30% of people losing coverage.
A second category of studies examine how certain enrollment policy changes (such as adding or dropping reporting requirements) affected enrollment, generally using a pre-post research design. All of the studies we reviewed in this category focus on children and many on the effect of simplification measures implemented following the establishment of CHIP. Again, there is a broad range of estimates of the effect of administrative burden. A study of imposition of new reporting requirements for children’s coverage in Washington found that enrollment dropped 5% following the change, with about half due to incomplete paperwork.11 Several reports on the effect of enrollment and recertification simplification in Louisiana’s children’s coverage program report a 16 percentage point drop in loss of coverage due to not returning forms12 and a 12% drop in rates of churn.13 Similarly, Texas showed an 11% drop in cases closed for incomplete paperwork for children’s coverage.14 An analysis of the effect of a change in renewal procedures in Florida found that implementation of an active renewal process (from passive renewal) increased risk of disenrollment from the Florida Healthy Kids Program from 1.3% to 22%.15 Altogether, these studies indicate that changes in paperwork/reporting requirements in Medicaid/CHIP are associated with change in enrollment between 3 and 20%. Though not directly comparable to the studies outlined above, it is logical that these estimates are lower, as simplification measures in most states do not entirely eliminate reporting requirements. Notably, one study of SCHIP disenrollment found that passive re-enrollment (which requires no action/reporting for most enrollees) nearly eliminated the loss of enrollment that occurred at recertification in other states.16
Based on this review of literature, we use 5% as a “low” assumption of disenrollment due to paperwork or reporting requirements and 15% as a “high” assumption. These assumptions conservatively use the low-end estimate and mid-point estimate, rather than higher estimates that some studies find.
For people likely subject to work requirements, we developed our “low” and “high” disenrollment rate based on research examining disenrollment due to the imposition of work requirements in TANF and SNAP as well as state estimates of enrollment effects of imposing work or similar requirements in Medicaid. The studies we reviewed estimated a broad range of disenrollment rates.
For example, evaluations of work requirements in SNAP showed that enrollment dropped 50-85% among the population subject to the requirement,17 and CBO’s estimate of the Agriculture and Nutrition Act of 2018 (which would require certain SNAP recipients to be employed or in a state-government-sponsored training program unless they qualify for certain waivers) assumes that 24% of people potentially subject to the requirement would no longer receive benefits under the proposal.18 Preliminary evaluations of Medicaid Section 1115 waivers in Indiana, Iowa, and Michigan showed a range of participation in complex new programs such as payment of premiums or participation in healthy behavior programs. About half of HIP 2.0 enrollees in Indiana required to pay premiums did not do so, between 83 and 95% of enrollees in Iowa failed to complete all required healthy behavior actions, and between 60-70% of enrollees in Michigan were unaware of or misinformed about most cost-sharing and healthy behavior provisions19 (though retaining coverage in Iowa and Michigan was not contingent on completing these activities). Last, of states that have submitted Section 1115 waivers to use work requirements in Medicaid, Indiana’s provides the most detail on expected participation/enrollment changes. It assumes that 25% of people subject to the work requirement lose enrollment. Based on this information, we assumed a “low” disenrollment rate of 25% and a “high” rate of 50% among people likely not exempt from work requirements.
To estimate disenrollment, we applied our “low” and “high” disenrollment rates for each group, for a total of four possible scenarios. We estimate disenrollment in the aggregate and do not model a particular individual’s likelihood of remaining enrolled in Medicaid. Estimates are intended to provide illustrative examples of the potential scope of work requirements nationwide; actual experiences of a particular state will likely differ due to unique nature of each waiver, the characteristics of the state’s Medicaid population, and the local/state economy.
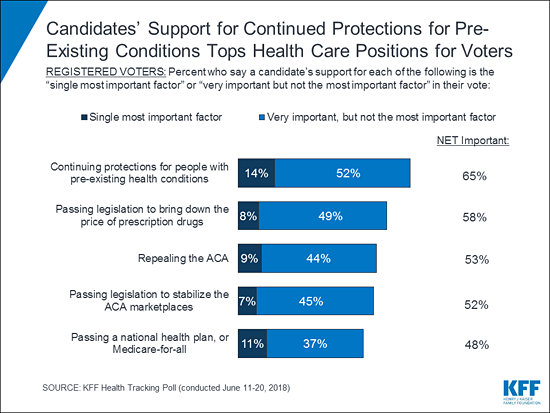
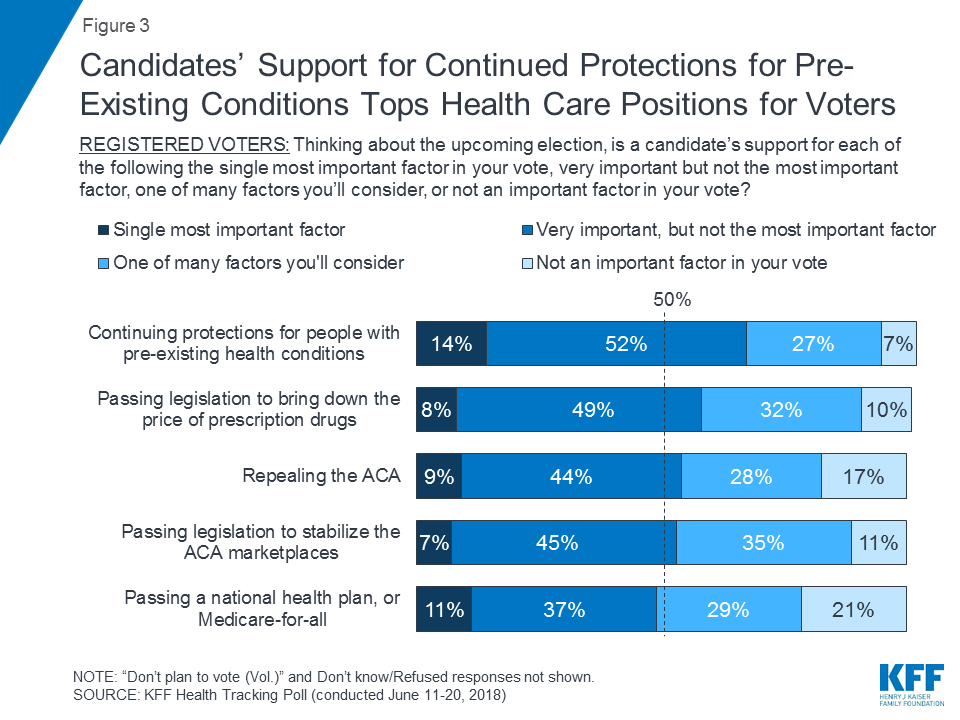
About two-thirds (65%) of voters say a candidate’s support for continued protections for people with pre-existing health conditions is either the “single most important factor” or “very important” to their vote in the upcoming midterms elections, finds the latest Kaiser Family Foundation tracking poll.
That’s a larger share than says the same about other health care issues, including bringing down prescription drug costs (58%), repealing the Affordable Care Act (53%), stabilizing the ACA marketplaces (52%), or passing a national health plan or Medicare-for-all (48%), the poll finds.
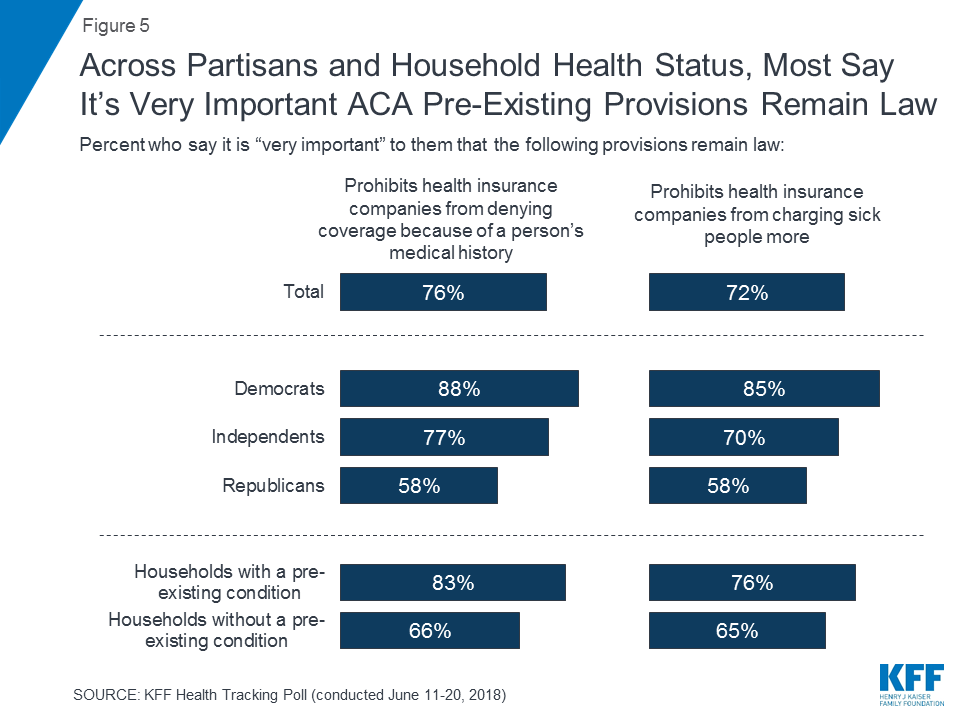
There are differences by partisan identification. Eight in 10 Democratic (81%) and nearly two-thirds (63%) of independent voters say the issue is at least “very important” to their vote – making it the top health care issue for both groups of voters. About half (51%) of Republican voters say the same, ranking the issue below repealing the ACA (58%) among Republicans.
The findings come as many Republican state attorneys general are suing to overturn the Affordable Care Act as unconstitutional. The Trump Administration this month opted not to defend the 2010 law and instead asked the courts to invalidate many key provisions, including its pre-existing condition protections.
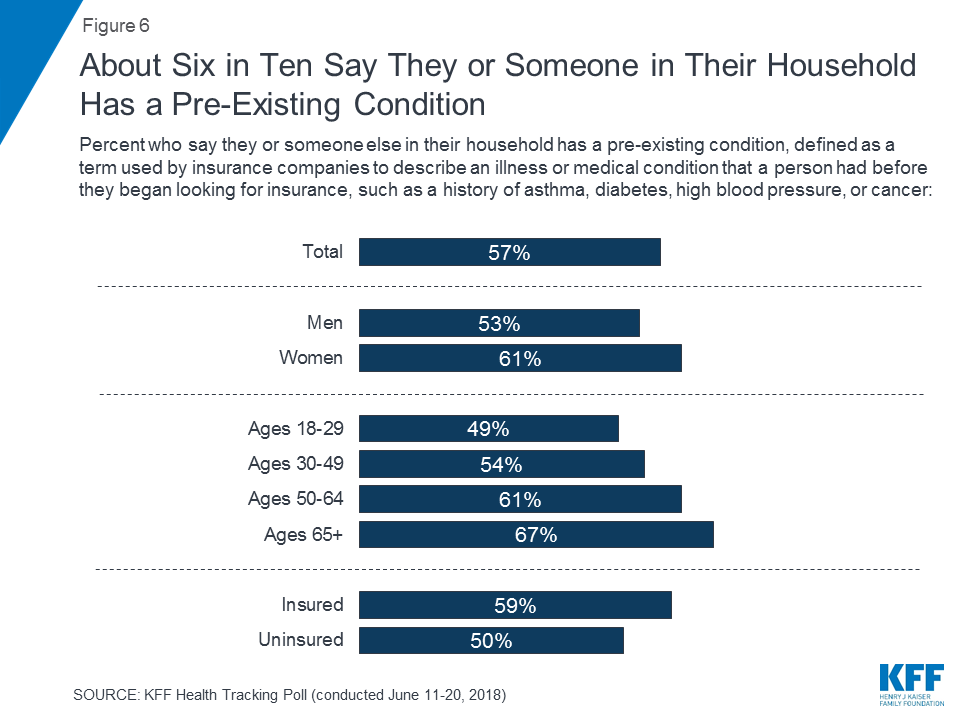
Almost six in 10 Americans (57%) say that they or someone in their household has a pre-existing condition of some sort, the poll finds. This includes majorities of men and women, and majorities in all age groups except those under 30.
Among the general public, large majorities say that the ACA’s provisions that bar insurers from discriminating against people with pre-existing conditions are “very important” to them, the poll finds.
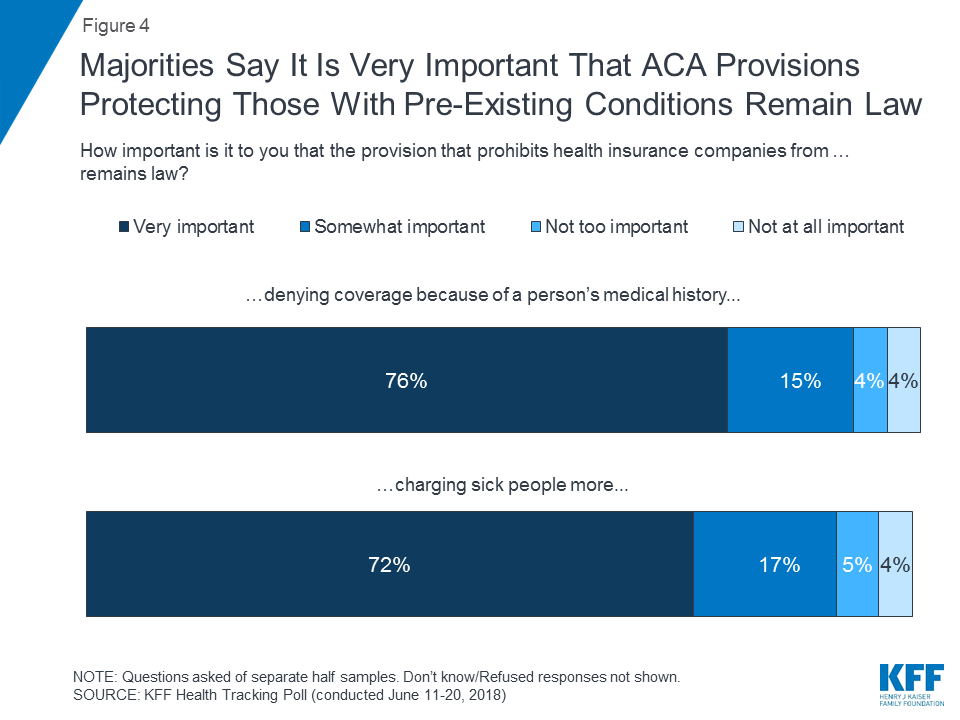
Three-quarters (76%) of the public say it is “very important” that the law continue to prohibit insurers from denying coverage because of a person’s medical history. Similarly, seven in 10 (72%) say it is “very important” that the law continue to keep insurers from charging sick people more for coverage. On each question, majorities across party identification view both protections as “very important.”
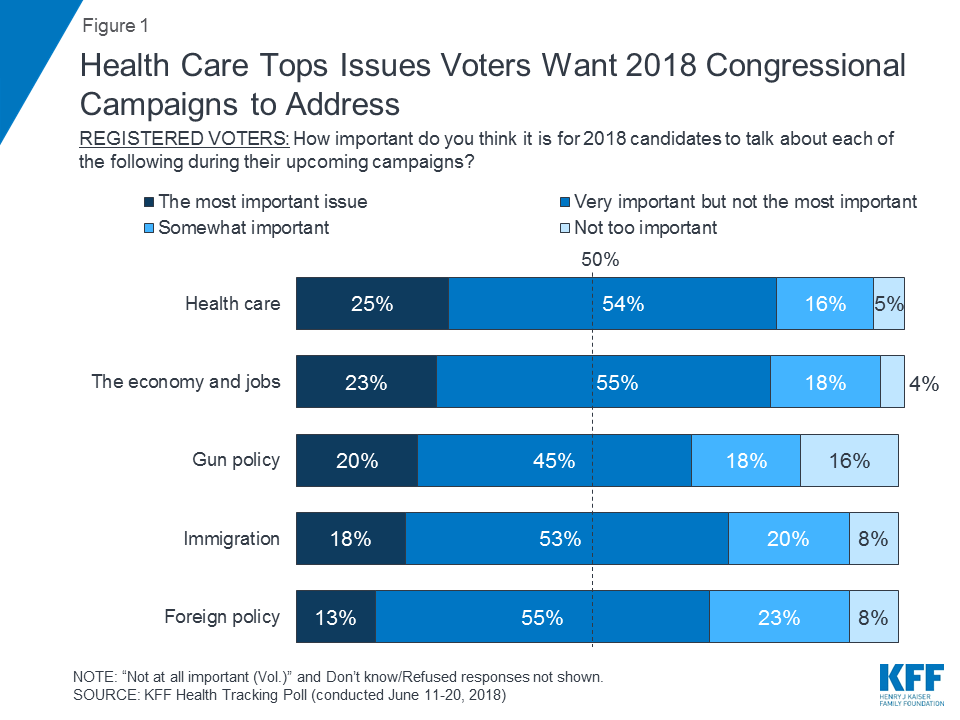
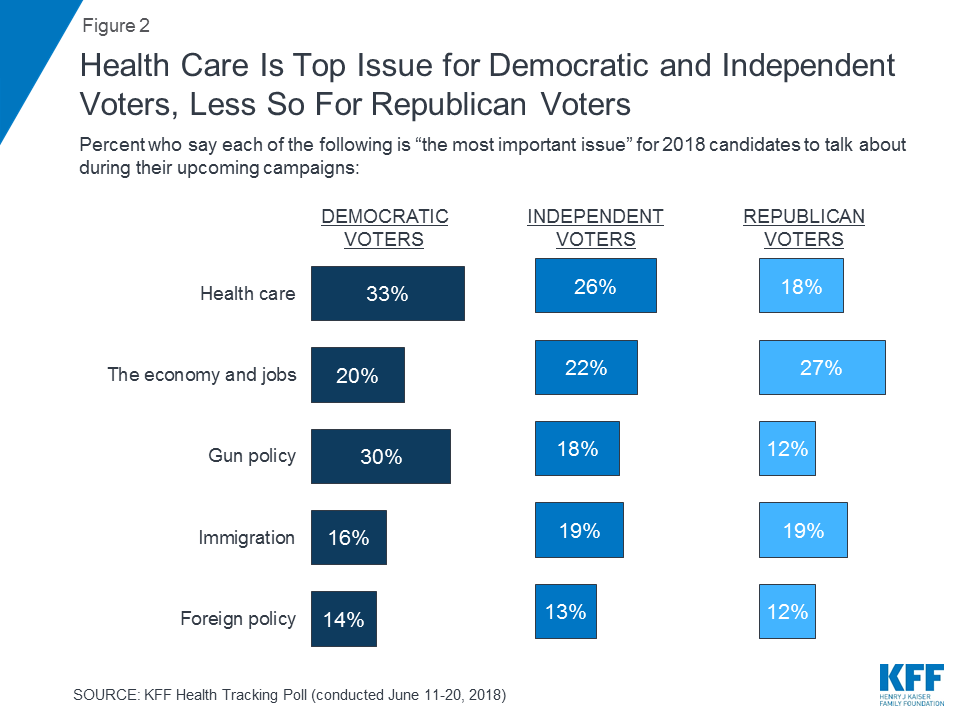
Health care overall remains one of voters’ top issues heading into the midterms, with a quarter (25%) of voters listing it as a “most important issue” for candidates to discuss during their campaigns. That’s similar to the share who says the same about the economy and jobs (23%) and somewhat larger than the share who says so about gun policy (20%), immigration (18%) and foreign policy (13%). Health care ranks first among issues for Democrats and independents, while Republicans rank the economy and jobs first.
One in Seven Americans Have Talked to their Doctor about a Drug Ad They Saw
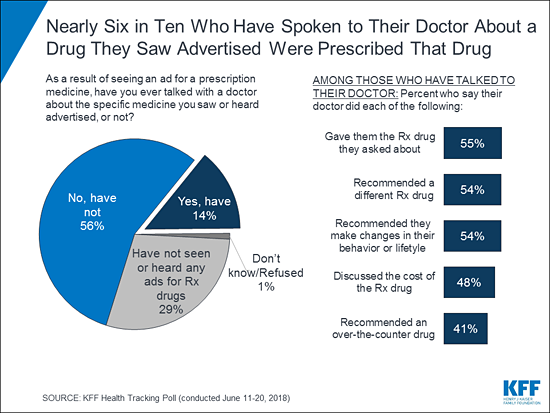
This month’s poll also probes the public’s views and experiences with prescription drug advertisements. Seven in 10 Americans (71%) say they have read or seen advertisements for prescription drugs, including about one in seven (14%) who say they talked to their doctor about an advertised drug.
Among those who spoke to their doctor about a drug, nearly six in 10 (55%) say the doctor gave them the drug they asked about, their doctor recommended a different prescription drug (54%), or their doctor recommended that they make changes in their behavior or lifestyle (54%). Half (48%) say their doctor discussed the cost of the drug, while four in 10 (41%) say their doctor recommended an over-the-counter product instead.
The poll also examines the public’s views on whether drug makers should be required to include information about a drug’s list price in television advertisements – an idea included in President Trump’s May 11 plan on drug costs.
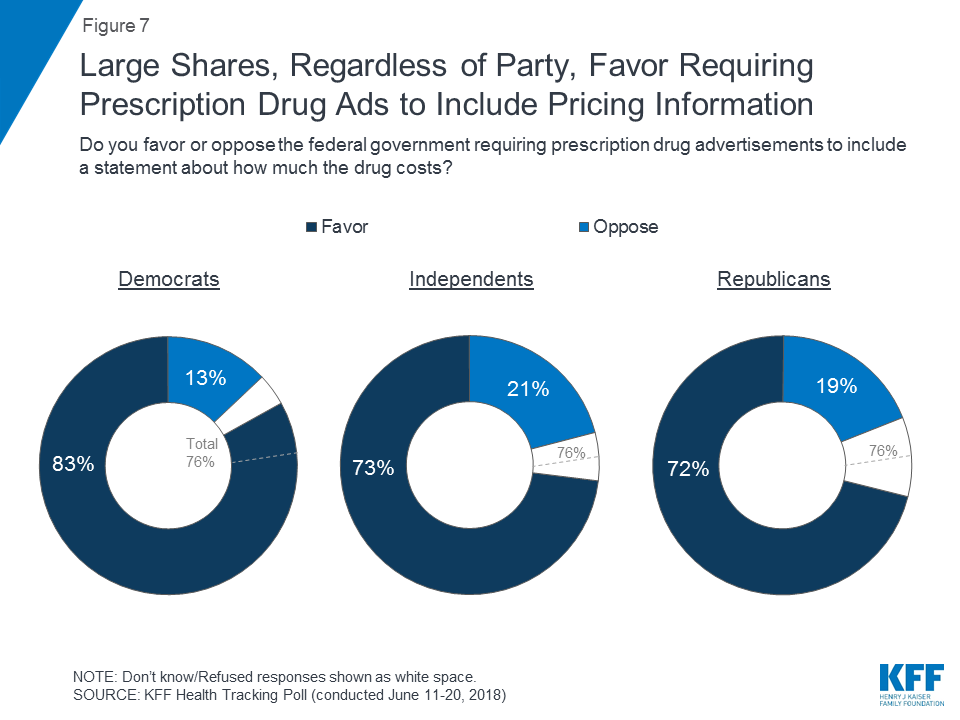
Three-quarters (76%) of the public say they favor the federal government requiring prescription drug ads to include a statement about how much the drug costs. This includes majorities of Democrats (83%), independents (73%) and Republicans (72%). Other KFF polls have found similar bi-partisan majorities in favor of a wide range of policy actions to address drug costs.
Designed and analyzed by public opinion researchers at the Kaiser Family Foundation, the poll was conducted from June 11-20, 2018 among a nationally representative random digit dial telephone sample of 1,492 adults. Interviews were conducted in English and Spanish by landline (319) and cell phone (1,173). The margin of sampling error is plus or minus 3 percentage points for the full sample. For results based on subgroups, the margin of sampling error may be higher.
Health care ranks as the top issue for Democratic and independent voters; the economy and jobs top the list for Republicans
Health care continues to be one of the top issues that voters want to hear candidates talk about during their 2018 congressional campaigns. One-fourth of voters say health care is the “most important issue” for 2018 candidates to discuss during their campaigns, which is similar to the share who say the same about the economy and jobs (23 percent). Slightly fewer say gun policy (20 percent), immigration (18 percent)1 , and foreign policy (13 percent) are the most important issues for 2018 candidates to talk about during their campaigns.
While health care is a top issue for Democratic and independent voters, it remains a second tier issue for Republican voters. One-fourth (27 percent) of Republican voters say the economy and jobs is the most important issue for candidates to talk about during their campaigns, followed by immigration (19 percent), and health care (18 percent). However, the share of Republican voters who say health care is the most important issue has risen slightly since January 2018 when one in ten (13 percent) Republican voters said it was the most important issue.
NEW: More voters say a candidate’s stance on protecting pre-existing conditions is important to their vote than say the same about drug prices, ACA repeal and other health care issues
Few voters (about one in ten) say a candidate’s support for a variety of different health care positions will be the “single most important factor” in their 2018 vote choice, but about two-thirds say a candidate’s support for continued protections for people with pre-existing health conditions is either the “single most important factor” or “very important, but not the most important factor.” Fewer – but still a majority – say a candidate’s support for passing legislation to bring down prescription drug costs (58 percent), support for repealing the Affordable Care Act (ACA) (53 percent), or passing legislation to stabilize the ACA marketplaces (52 percent) is either the single most important or a very important factor. Half (48 percent) say a candidate’s support for passing a national health plan, or Medicare-for-all is very or most important to their 2018 vote choice.
Partisan voters have different views on how a candidate’s support for various health care positions will affect their vote choice. For Democratic voters, a candidate’s support for continued protections for people with pre-existing conditions is at the top of the list with eight in ten (81 percent) Democratic voters saying it is the most important or very important factor to their 2018 vote choice. This is followed by a candidate’s support for stabilizing the ACA marketplaces (69 percent), support for passing a national health plan, or Medicare-for-all (68 percent), and support for passing legislation to bring down the price of prescription drugs (66 percent). Fewer (57 percent) say a candidate’s support for repealing the ACA will be very or most important to their vote.
Among Republican voters, nearly six in ten say a candidate’s support for repealing the ACA is very or most important to their 2018 vote choice. Half say the same about a candidate’s support passing legislation to bring down the price of prescription drugs (52 percent) and support for continued protections for people with pre-existing conditions (51 percent). Across all other issues, less than half of Republican voters say it will be very or most important to their 2018 vote.
| Table 1: How Important Is A Candidate’s Support on Health Care Issues To Voters? | ||||
| Percent who say a candidate’s support for each of the following will be the… in their vote: | DemocraticVoters | IndependentVoters | RepublicanVoters | |
| Continuing protections for people with pre-existing conditions | Single most important factor | 18% | 15% | 8% |
| Very important, but not most important factor | 63 | 48 | 43 | |
| Passing legislation to bring down the price of prescription drugs | Single most important factor | 9 | 8 | 9 |
| Very important, but not most important factor | 57 | 44 | 43 | |
| Repealing the 2010 Affordable Care Act | Single most important factor | 10 | 9 | 9 |
| Very important, but not most important factor | 47 | 37 | 49 | |
| Passing legislation to stabilize the ACA marketplaces | Single most important factor | 11 | 7 | 2 |
| Very important, but not most important factor | 57 | 45 | 35 | |
| Passing a national health plan, or Medicare-for-all | Single most important factor | 17 | 9 | 7 |
| Very important, but not most important factor | 51 | 36 | 24 | |
President Trump’s administration announced earlier this month that it will no longer defend the ACA’s protections for people with pre-existing medical conditions. These provisions prohibit insurance companies from denying coverage based on a person’s medical history (known as guaranteed issue), and prohibit insurance companies from charging those with pre-existing conditions more for coverage (known as community rating). The Trump administration argues that both of these protections are unconstitutional and should be deemed invalid once the individual mandate penalty goes away starting January 1, 2019. The majority of the public – including majorities of Republicans, Democrats, and independents – say it is “very important” to them that the ACA’s provisions protecting those with pre-existing conditions remain law.
Three-fourths of the public (76 percent) say it is “very important” to them that the provision that prohibits health insurance companies from denying coverage because of a person’s medical history remains law. An additional fifteen percent say it is “somewhat important” this provision remains law. Similarly, seven in ten (72 percent) say it is “very important” that the provision that prohibits health insurance companies from charging sick people more remains law, while an additional one in five (17 percent) say it is “somewhat important.”
Majorities, across party identification and household health status, say it is “very important” that these protections remain law. Nine in ten Democrats (88 percent), 77 percent of independents, and 58 percent of Republicans say it is “very important” that insurance companies cannot deny coverage because of a person’s medical history. Similarly, a majority (85 percent of Democrats, 70 percent of independents, and 58 percent of Republicans) – say it is “very important” that health insurance companies cannot charge sick people more. Even among those living in households without anyone with pre-existing conditions – therefore, unlikely to be affected negatively by this change in policy – a majority say it is “very important” these protections remain.
This most recent poll finding is similar to previous KFF polling on this issue. Public support for protections for individuals with pre-existing conditions had broad support prior to the passage of the 2010 health care law. A February 2010 Kaiser Health Tracking Poll found three-fourths (76 percent) of the public saying it is either “extremely important” or “very important” that reforming health insurance so that insurance companies can’t deny coverage based on pre-existing conditions is passed into law. Immediately after the election of President Trump, KFF polling found there was still majority support for the requirement that health insurance companies have to cover everyone regardless of medical history, with majorities of Democrats (75 percent), independents (65 percent), and Republicans (63 percent) saying they had a favorable opinion of this ACA provision.
Nearly six in ten (57 percent) say they or someone in their household suffers from pre-existing medical conditions such asthma, diabetes, or high blood pressure. Women (61 percent) are more likely to report someone in their household with a pre-existing condition than men (53 percent), as are older individuals (67 percent of those age 65 or older) compared to half (49 percent) of adults 18 to 29 years old.
POLL: Should drug ads be required to include price information as the Trump Administration has proposed? Three-quarters of the public say yes – including majorities of Democrats, Republicans and independents
On May 11, 2018, President Trump announced his plan titled, “American Patients First,” an effort aimed at lowering the price of prescription drugs. One key element of this plan is to require drug manufacturers to publish list prices for their prescription drugs in television advertisements. Three-fourths (76 percent) of the public favor the federal government requiring prescription drug advertisements to include a statement about how much the drug costs. In a rare instance of bipartisanship, this policy proposal is supported by a majority of Democrats (83 percent), independents (73 percent) and Republicans (72 percent).
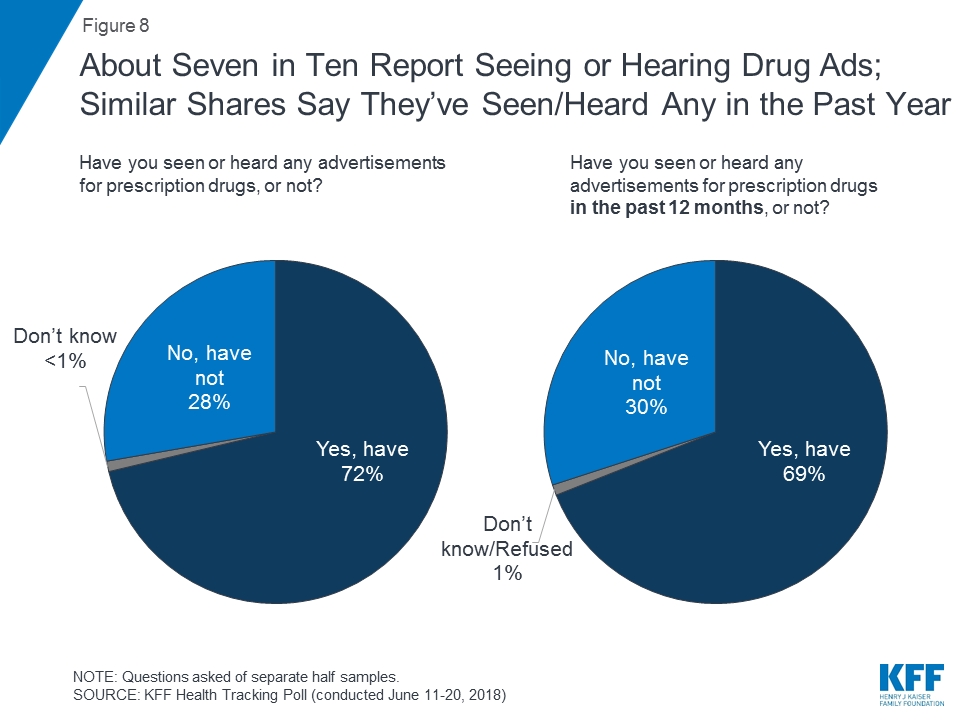
Seven in ten (72 percent) say they have ever seen or heard any advertisements for prescription drugs, which is similar to the share who say they saw or heard such an advertisement in the past 12 months (69 percent).
One in seven say they have talked to their doctor as a result of seeing an advertisement for a prescription drug while more than half (56 percent) say they have seen or heard advertisements for prescription drugs but have never spoken to their doctor about these ads.
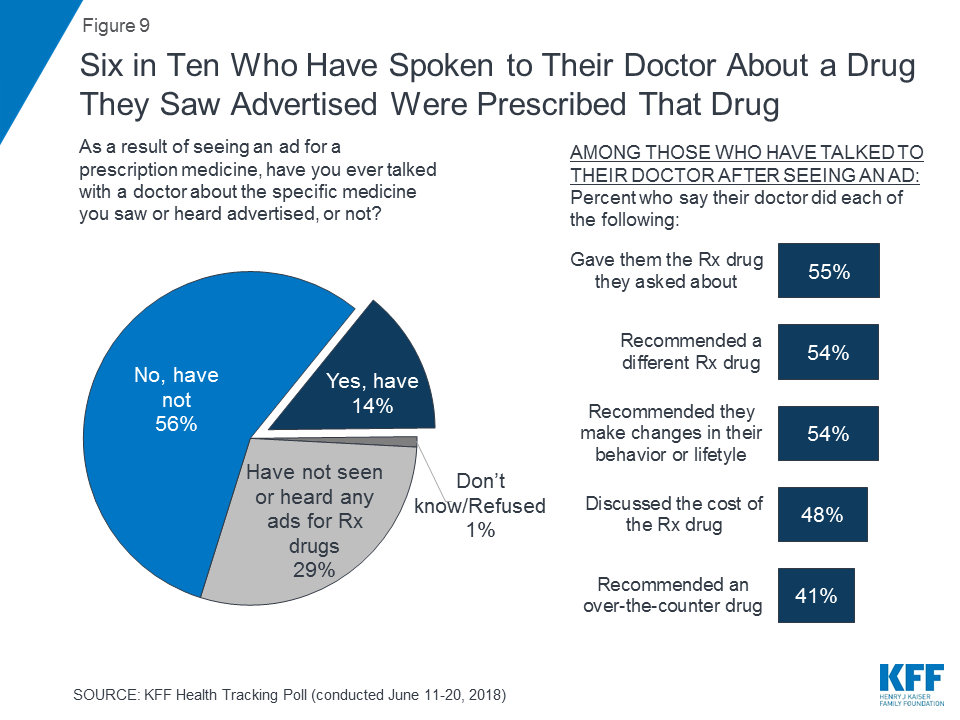
Among those who have spoken to their doctor about a specific medicine they saw advertised, nearly six in ten (55 percent) say the doctor gave them the drug they asked about, their doctor recommended a different prescription drug (54 percent), or their doctor recommended that they make changes in their behavior or lifestyle (54 percent). Half (48 percent) say their doctor discussed the cost of the drug while four in ten (41 percent) say their doctor recommended an over-the-counter drug instead.
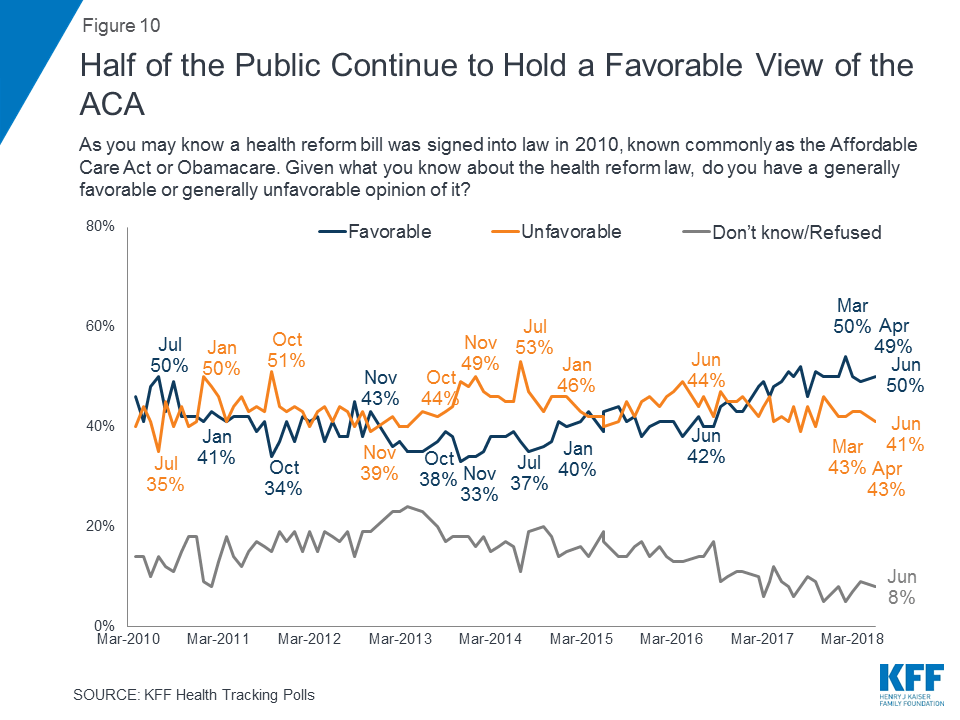
Half of the public continue to hold favorable views of the 2010 health care law, known as the Affordable Care Act. This continues the more than a year-long trend of a larger share of the public viewing the law favorably (50 percent) than unfavorably (41 percent).
POLL: More voters say a candidate’s stance on protecting pre-existing conditions is important to their vote than say the same about drug prices, ACA repeal and other health care issues
This Kaiser Health Tracking Poll was designed and analyzed by public opinion researchers at the Kaiser Family Foundation (KFF). The survey was conducted June 11th–20th 2018, among a nationally representative random digit dial telephone sample of 1,492 adults ages 18 and older, living in the United States, including Alaska and Hawaii (note: persons without a telephone could not be included in the random selection process). Computer-assisted telephone interviews conducted by landline (319) and cell phone (1,173, including 793 who had no landline telephone) were carried out in English and Spanish by SSRS of Glen Mills, PA. To efficiently obtain a sample of lower-income and non-White respondents, the sample also included an oversample of prepaid (pay-as-you-go) telephone numbers (25% of the cell phone sample consisted of prepaid numbers) as well as a subsample of respondents who had previously completed Spanish language interviews on the SSRS Omnibus poll (n=10). Both the random digit dial landline and cell phone samples were provided by Marketing Systems Group (MSG). For the landline sample, respondents were selected by asking for the youngest adult male or female currently at home based on a random rotation. If no one of that gender was available, interviewers asked to speak with the youngest adult of the opposite gender. For the cell phone sample, interviews were conducted with the adult who answered the phone. KFF paid for all costs associated with the survey.
This month’s poll also includes an analysis of young women under the age of 45 (n=402). To obtain a large enough sample, the sampling frame included an oversample of women using cell phones (n=59) as well as callbacks among women who fit the screening criteria using the SSRS Omnibus poll (n=182).
The combined landline and cell phone sample was weighted to balance the sample demographics to match estimates for the national population using data from the Census Bureau’s 2016 American Community Survey (ACS) on sex, age, education, race, Hispanic origin, and region along with data from the 2010 Census on population density. The sample was also weighted to match current patterns of telephone use using data from the July-December 2017 National Health Interview Survey. The weight takes into account the fact that respondents with both a landline and cell phone have a higher probability of selection in the combined sample and also adjusts for the household size for the landline sample, and design modifications, namely, the oversampling of prepaid cell phones and likelihood of non-response for the re-contacted sample. All statistical tests of significance account for the effect of weighting.
The margin of sampling error including the design effect for the full sample is plus or minus 3 percentage points. Numbers of respondents and margins of sampling error for key subgroups are shown in the table below. For results based on other subgroups, the margin of sampling error may be higher. Sample sizes and margins of sampling error for other subgroups are available by request. Note that sampling error is only one of many potential sources of error in this or any other public opinion poll. Kaiser Family Foundation public opinion and survey research is a charter member of the Transparency Initiative of the American Association for Public Opinion Research.
| Group | N (unweighted) | M.O.S.E. |
| Total | 1,492 | ±3 percentage points |
| Party Identification | ||
| Democrats | 495 | ±5 percentage points |
| Republicans | 376 | ±6 percentage points |
| Independents | 445 | ±5 percentage points |
| Voter registration | ||
| Registered voters | 1,177 | ±3 percentage points |
| Democratic voters | 411 | ±6 percentage points |
| Republican voters | 333 | ±6 percentage points |
| Independent voters | 329 | ±6 percentage points |
| Gender and Age | ||
| Men | 649 | ±4 percentage points |
| Women | 843 | ±4 percentage points |
| Women <45 years old | 402 | ±6 percentage points |
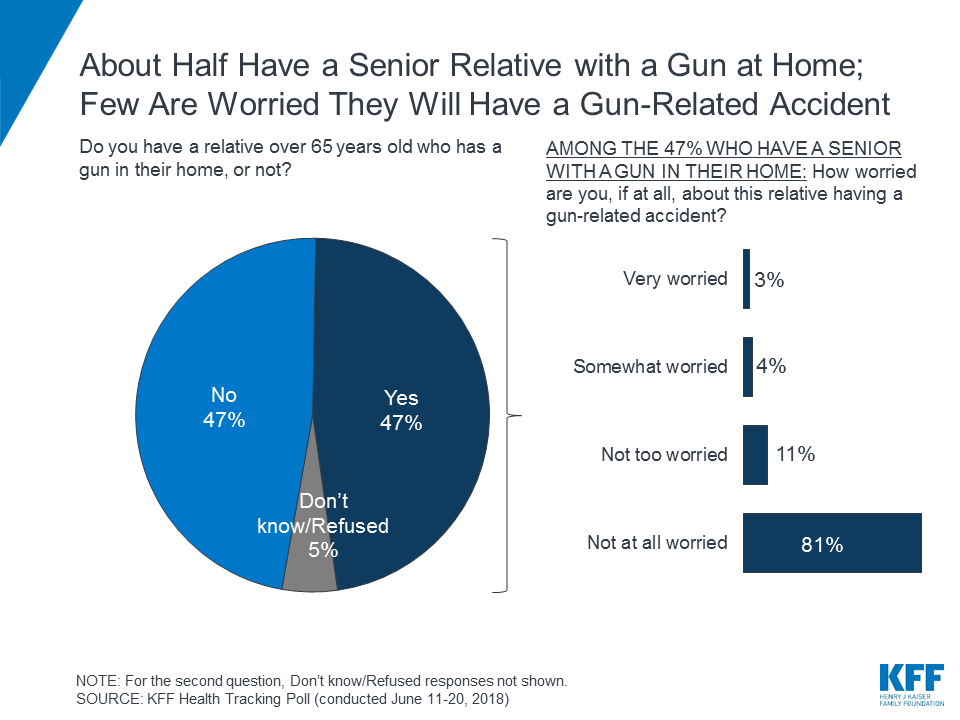
This month’s Kaiser Health Tracking Poll asked the public about access to guns among seniors. Nearly half (47 percent) say they have an older relative, over the age of 65, who has a gun in their home. Yet, few of these individuals report being worried that their relative will have a gun-related accident. Few (7 percent) say they are either “very worried” or “somewhat worried” that their senior relative will have a gun-related accident while the vast majority say they are “not at all worried” (81 percent) or “not too worried” (11 percent).
Methodology: Designed and analyzed by public opinion researchers at the Kaiser Family Foundation, the poll was conducted from June 11-20, 2018 among a nationally representative random digit dial telephone sample of 1,492 adults. Interviews were conducted in English and Spanish by landline (319) and cell phone (1,173). The margin of sampling error is plus or minus 3 percentage points for the full sample. For results based on subgroups, the margin of sampling error may be higher.
This Kaiser Health Tracking Poll was designed and analyzed by public opinion researchers at the Kaiser Family Foundation (KFF). The survey was conducted June 11th–20th 2018, among a nationally representative random digit dial telephone sample of 1,492 adults ages 18 and older, living in the United States, including Alaska and Hawaii (note: persons without a telephone could not be included in the random selection process). Computer-assisted telephone interviews conducted by landline (319) and cell phone (1,173, including 793 who had no landline telephone) were carried out in English and Spanish by SSRS of Glen Mills, PA. To efficiently obtain a sample of lower-income and non-White respondents, the sample also included an oversample of prepaid (pay-as-you-go) telephone numbers (25% of the cell phone sample consisted of prepaid numbers) as well as a subsample of respondents who had previously completed Spanish language interviews on the SSRS Omnibus poll (n=10). Both the random digit dial landline and cell phone samples were provided by Marketing Systems Group (MSG). For the landline sample, respondents were selected by asking for the youngest adult male or female currently at home based on a random rotation. If no one of that gender was available, interviewers asked to speak with the youngest adult of the opposite gender. For the cell phone sample, interviews were conducted with the adult who answered the phone. KFF paid for all costs associated with the survey.
This month’s poll also includes an analysis of young women under the age of 45 (n=402). To obtain a large enough sample, the sampling frame included an oversample of women using cell phones (n=59) as well as callbacks among women who fit the screening criteria using the SSRS Omnibus poll (n=182).
The combined landline and cell phone sample was weighted to balance the sample demographics to match estimates for the national population using data from the Census Bureau’s 2016 American Community Survey (ACS) on sex, age, education, race, Hispanic origin, and region along with data from the 2010 Census on population density. The sample was also weighted to match current patterns of telephone use using data from the July-December 2017 National Health Interview Survey. The weight takes into account the fact that respondents with both a landline and cell phone have a higher probability of selection in the combined sample and also adjusts for the household size for the landline sample, and design modifications, namely, the oversampling of prepaid cell phones and likelihood of non-response for the re-contacted sample. All statistical tests of significance account for the effect of weighting.
The margin of sampling error including the design effect for the full sample is plus or minus 3 percentage points. Numbers of respondents and margins of sampling error for key subgroups are shown in the table below. For results based on other subgroups, the margin of sampling error may be higher. Sample sizes and margins of sampling error for other subgroups are available by request. Note that sampling error is only one of many potential sources of error in this or any other public opinion poll. Kaiser Family Foundation public opinion and survey research is a charter member of the Transparency Initiative of the American Association for Public Opinion Research.
Group | N (unweighted) | M.O.S.E. |
| Total | 1,492 | ±3 percentage points |
| Party Identification | ||
| Democrats | 495 | ±5 percentage points |
| Republicans | 376 | ±6 percentage points |
| Independents | 445 | ±5 percentage points |
| Voter registration | ||
| Registered voters | 1,177 | ±3 percentage points |
Democratic voters | 411 | ±6 percentage points |
Republican voters | 333 | ±6 percentage points |
Independent voters | 329 | ±6 percentage points |
| Gender and Age | ||
| Men | 649 | ±4 percentage points |
| Women | 843 | ±4 percentage points |
Women <45 years old | 402 | ±6 percentage points |
If the latest legal challenge to the Affordable Care Act succeeds, there would no longer be a federal guarantee that people with preexisting conditions could get insurance on their own. That would have personal and political consequences, writes Larry Levitt in his June 2018 post for the JAMA Forum.
Other contributions to The JAMA Forum are also available.
According to the U.S. National Center for Health Statistics, chronic diseases are illnesses that last three or more months and cannot be prevented by vaccination, cured by medication, and do not disappear.1 Overall, the majority of the public are aware of the specific diseases that are categorized as “chronic,” but fewer are aware of the number of people affected by chronic diseases in the U.S. or the amount of resources spent treating these diseases.
The majority of the public are aware that heart disease (81 percent), diabetes (78 percent), asthma (75 percent), mental health illness (73 percent), cancer (72 percent), and arthritis (72 percent) are all illnesses that are considered “chronic diseases.”

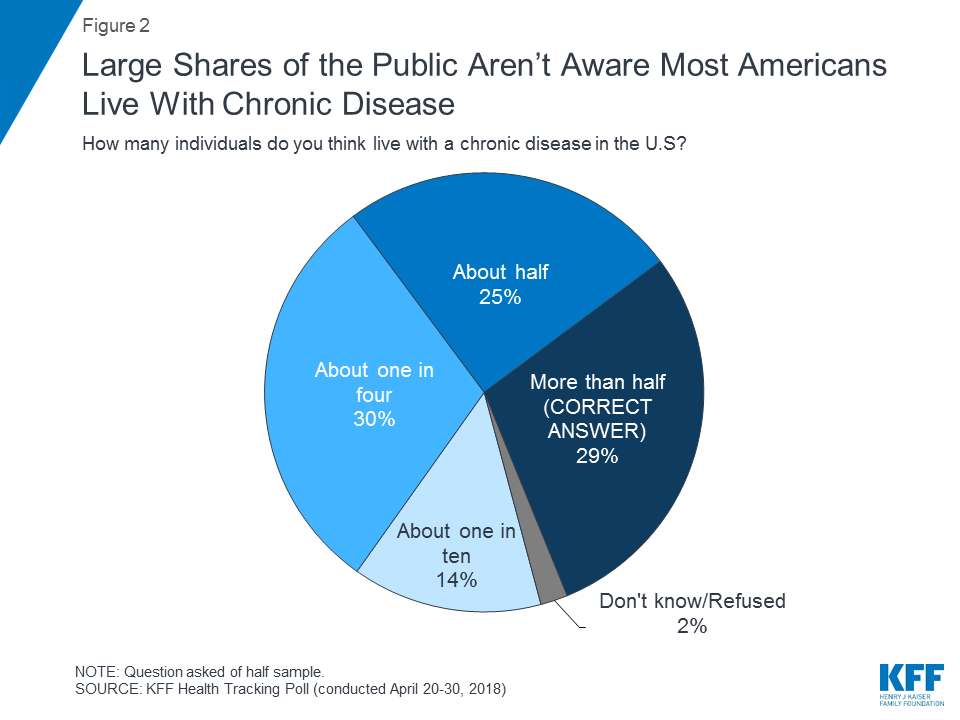
According to the U.S. Department of Health & Human Services’ Medical Expenditure Panel Survey, about two-thirds of adults living in the U.S. have at least one chronic condition.2 The April 2018 Kaiser Health Tracking Poll found that about three in ten of the public (29 percent) are aware of the prevalence of chronic disease in this country, while seven in ten thought that either about half (25 percent), about one in four (30 percent), or about one in ten (14 percent) of the individuals living in the U.S. have a chronic disease.
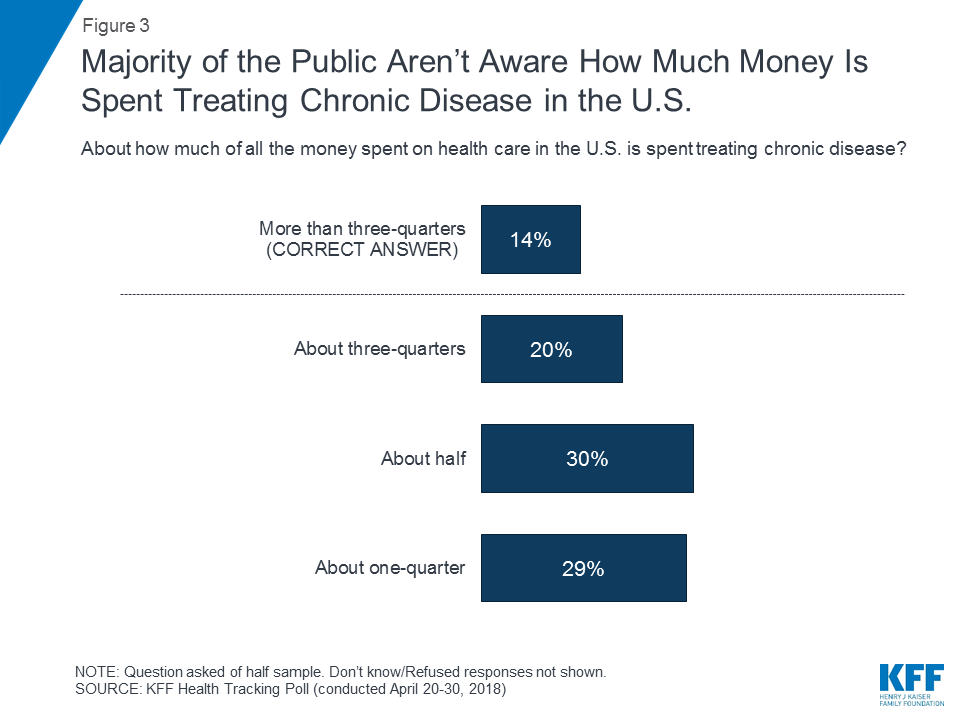
In addition, a majority of the public are unaware that more than three quarters of all of the money spent on health care in the U.S. is spent treating chronic diseases.
Seven in ten Americans say chronic diseases are usually due to factors and circumstances beyond a person’s control while one in ten (11 percent) say people who have chronic diseases mostly have themselves to blame for their condition. An additional two in ten (19 percent) say either that it is both of these, neither of these, or are unsure.
Despite this, half of the public (including half, 49 percent, of those dealing with a chronic illness) say individuals themselves should play the largest role in helping to prevent individuals in this country from getting chronic diseases. This is larger than the share who say the same about health care providers (22 percent), the government (15 percent), or employers and businesses (5 percent).
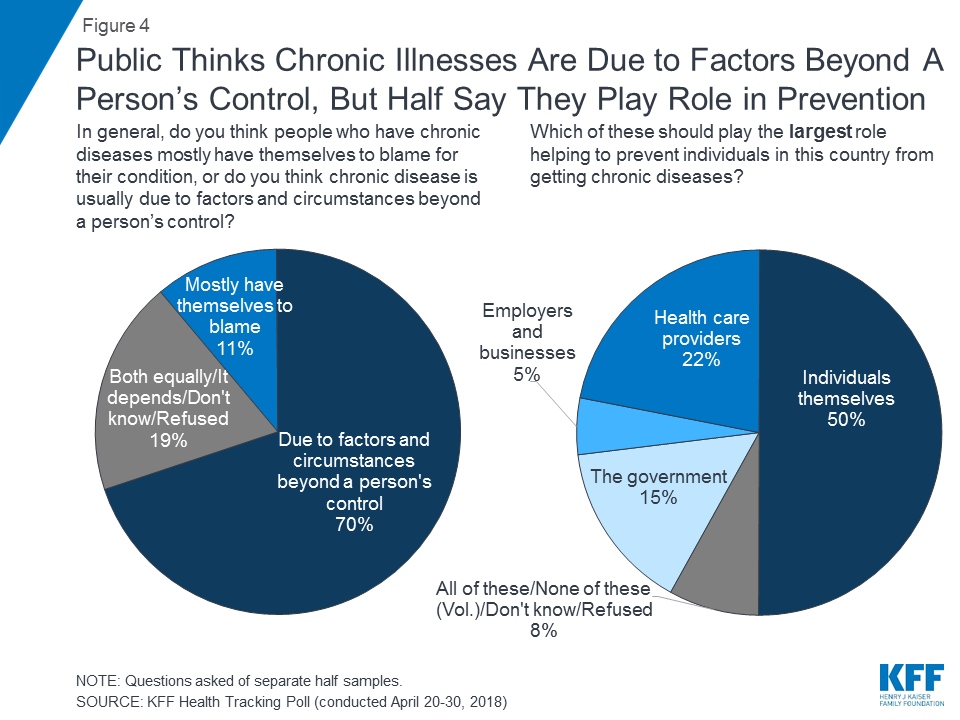
Six in ten (59 percent) say they or someone in their immediate family have a chronic health condition that requires ongoing medical treatment. Compared to those without chronic conditions, these individuals are more likely to report having a hard time paying medical bills. One-third (35 percent) of those dealing with a chronic condition requiring ongoing medical care say they or their household have had problems paying medical bills in the past 12 months, compared to one-fourth (27 percent) of the overall public. To see a complete demographic profile of this group, see the Appendix.
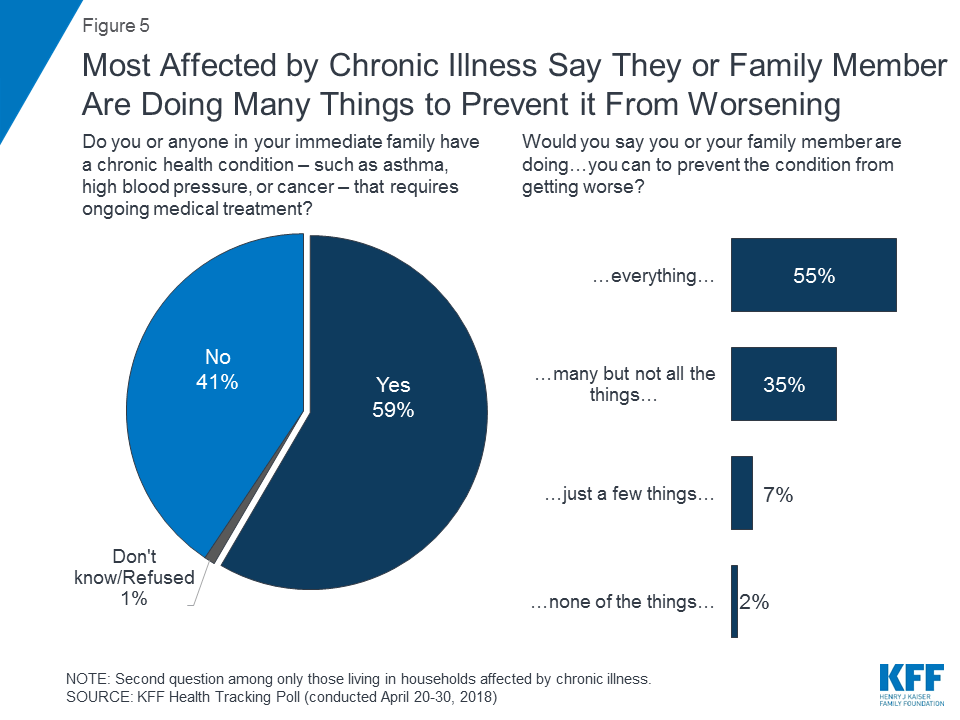
Among those dealing with a chronic health condition (either themselves or an immediate family member) the majority (55 percent) say they are or their family member are doing “everything” they can to prevent the condition from getting worse while an additional one-third (35 percent) say they are doing “many but not all the things” they could do to prevent the condition from getting worse. Fewer (9 percent of those dealing with a chronic health condition) say they are doing “just a few things” or “none of the things” to prevent the condition from getting worse.
When asked whether they favor or oppose various policy proposals aimed at preventing or managing chronic diseases, a majority of the public say they favor proposals aimed at promoting healthy behaviors but fewer than half say they favor other proposals that either ban or tax unhealthy choices. Eight in ten favor proposals such as requiring schools to educate children and promote healthy choices through physical activity and restricting unhealthy choices (81 percent) which is similar to the shares who favor increasing government funding to pay for early childhood health programs, housing programs, and employment assistance for lower-income individuals (76 percent), requiring restaurants and companies to promote healthy choices through menu labeling and posting calorie information (74 percent), and increasing government funding to pay for either healthy alternatives such as farmers’ markets (73 percent) or technology to help lower-income individuals better manage their chronic condition (72 percent).
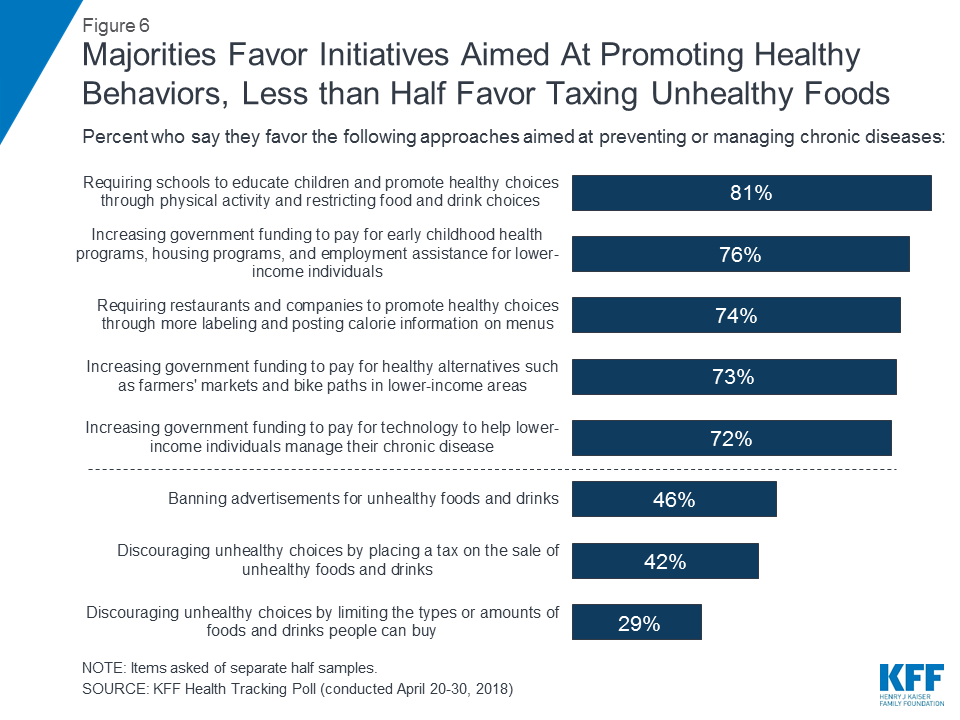
Fewer favor policy proposals banning advertisements for unhealthy foods and drinks (46 percent), or discouraging unhealthy choices by either placing a tax on the sale of unhealthy foods and drinks (42 percent) or limiting the types or amounts of these choices people can buy (29 percent).
There are some partisan differences with larger shares of Democrats and independents favoring all of the policy proposals compared to Republicans. Yet, majorities of Republicans still favor proposals aimed at promoting healthy behaviors.
| Table 1: Support for Policy Proposals by Party Identification | |||
| Democrats | Independents | Republicans | |
| Requiring schools to educate children and promote healthy choices through more physical activity and restricting food/drink choices. | 87% | 82% | 70% |
| Increasing government funding to pay for early childhood programs, housing programs, and employment assistance for low-income people. | 89 | 78 | 56 |
| Requiring restaurants/companies to promote healthy choices through more labeling and posting calorie info on menus. | 82 | 76 | 63 |
| Increasing government funding to pay for healthy alternatives like farmers’ markets and bike paths in low-income areas. | 84 | 75 | 55 |
| Increasing government funding to pay for technology to help lower-income people manage their chronic disease. | 88 | 73 | 55 |
| Banning advertisements for unhealthy foods and drinks. | 50 | 47 | 39 |
| Discouraging unhealthy choices by placing a tax on the sale of unhealthy foods and drinks. | 46 | 44 | 33 |
| Discouraging unhealthy choices by limiting the types and amounts of foods and drinks people can buy. | 38 | 29 | 17 |
This Kaiser Health Tracking Poll was designed and analyzed by public opinion researchers at the Kaiser Family Foundation (KFF). The survey was conducted April 20th–30th 2018, among a nationally representative random digit dial telephone sample of 2,000 adults ages 18 and older, living in the United States, including Alaska and Hawaii (note: persons without a telephone could not be included in the random selection process). Computer-assisted telephone interviews conducted by landline (699) and cell phone (1,301, including 864 who had no landline telephone) were carried out in English and Spanish by SSRS of Glen Mills, PA. To efficiently obtain a sample of lower-income and non-White respondents, the sample also included an oversample of prepaid (pay-as-you-go) telephone numbers (25% of the cell phone sample consisted of prepaid numbers) as well as a subsample of respondents who had previously completed Spanish language interviews on the SSRS Omnibus poll (n=14). Both the random digit dial landline and cell phone samples were provided by Marketing Systems Group (MSG). For the landline sample, respondents were selected by asking for the youngest adult male or female currently at home based on a random rotation. If no one of that gender was available, interviewers asked to speak with the youngest adult of the opposite gender. For the cell phone sample, interviews were conducted with the adult who answered the phone. KFF paid for all costs associated with the survey.
The combined landline and cell phone sample was weighted to balance the sample demographics to match estimates for the national population using data from the Census Bureau’s 2016 American Community Survey (ACS) on sex, age, education, race, Hispanic origin, and region along with data from the 2010 Census on population density. The sample was also weighted to match current patterns of telephone use using data from the January-June 2017 National Health Interview Survey. The weight takes into account the fact that respondents with both a landline and cell phone have a higher probability of selection in the combined sample and also adjusts for the household size for the landline sample, and design modifications, namely, the oversampling of prepaid cell phones. All statistical tests of significance account for the effect of weighting.
The margin of sampling error including the design effect for the full sample is plus or minus 3 percentage points. Numbers of respondents and margins of sampling error for key subgroups are shown in the table below. For results based on other subgroups, the margin of sampling error may be higher. Sample sizes and margins of sampling error for other subgroups are available by request. Note that sampling error is only one of many potential sources of error in this or any other public opinion poll. Kaiser Family Foundation public opinion and survey research is a charter member of the Transparency Initiative of the American Association for Public Opinion Research.
| Group | N (unweighted) | M.O.S.E. |
| Total | 2,000 | ±3 percentage points |
| Registered voters | 1,655 | ±3 percentage points |
| Democrats | 528 | ±5 percentage points |
| Republicans | 486 | ±5 percentage points |
| Independents | 506 | ±5 percentage points |
| Voters in competitive elections | 500 | ±5 percentage points |
| Health Care voters | 353 | ±6 percentage points |