Data Note: Changes in Enrollment in the Individual Health Insurance Market through Early 2019

Authors: Rachel Fehr, Cynthia Cox, and Larry Levitt
Published: Aug 21, 2019

Data Note

The individual health insurance market – where people go to buy their own coverage both through the exchange Marketplaces and off-exchange directly from insurers or brokers – grew rapidly following implementation of the Affordable Care Act’s (ACA) subsidies and prohibition of discrimination based on pre-existing conditions. However, these enrollment gains were partially offset by subsequent declines, particularly among people not receiving subsidies amid steep premium increases. Most recently, the ACA’s individual mandate penalty was effectively repealed going into 2019, raising questions over whether enrollment would continue to drop.

Enrollment in the individual market dips slightly in first quarter of 2019 after repeal of individual mandate penalty, though ACA Marketplace plan enrollment holds steady via @KFF

In this analysis, we use publicly-available federal enrollment data and administrative data insurers report to the National Association of Insurance Commissioners (as compiled by Mark Farrah Associates) to measure changes in enrollment in the individual market before and after the ACA’s coverage expansions and market rules went into effect in 2014 through the first quarter of 2019. Key findings include:

  • Total individual market enrollment, measured on an average monthly basis, increased from 10.6 million in 2013 to a peak of 17.4 million in 2015, before declining to 13.8 million in 2018.
    • Much of this decline was concentrated in the off-exchange market, where enrollees are not eligible for federal premium subsidies and therefore were not cushioned from the significant premium increases in 2017 and 2018.
  • Enrollment has continued to fall somewhat in early 2019, though may show signs of stabilizing, so long as premium growth continues to level off: First quarter enrollment has declined by 5% in 2019 compared to the first quarter of 2018.1  This is a smaller decline than had been seen in past years (11% in 2018 and 12% in 2017) amid steep premium increases.
    • There are 13.7 million people enrolled as of the first quarter of 2019, compared to 10.6 million people in 2013, before the ACA went into effect.

Annual Changes in Individual Market Enrollment through 2018

The individual market comprises coverage purchased by individuals and families through the ACA’s exchanges (Marketplaces) as well as coverage purchased off-exchange, which includes both plans complying with the ACA’s rules and non-compliant coverage (e.g., grandfathered policies purchased before the ACA went into effect and short-term plans). The individual market (sometimes also called the nongroup market) is relatively small as a share of the U.S. population, with about 10.6 million people enrolled in 2013 before the ACA went fully into effect2 .

As the ACA market rules and premium subsidies were implemented in 2014, there was significant growth in enrollment on the individual market. For the first time in nearly all states, people with pre-existing conditions could purchase coverage on an open marketplace and low-income people were eligible for tax credits to help pay their premiums and reductions in their cost sharing. In addition, many people who went without insurance coverage had to pay a tax penalty. As of 2014, health plans had to follow new rules that standardized benefits and guaranteed coverage for those with pre-existing conditions when selling coverage to new customers (known as “ACA-compliant” plans). Following these changes, individual market enrollment increased substantially, expanding from 10.6 million members on average per month in 2013 to 17.4 million members in 2015 (Figure 1)3 . This included an estimated 3 million people in non-ACA compliant plans including some short-term plans, grandfathered plans, and plans purchased before October 2013 that were allowed to continue under a federal transition policy at the discretion of states and insurers.

Figure 1: Annual Individual Market Enrollment, 2011 – 2018

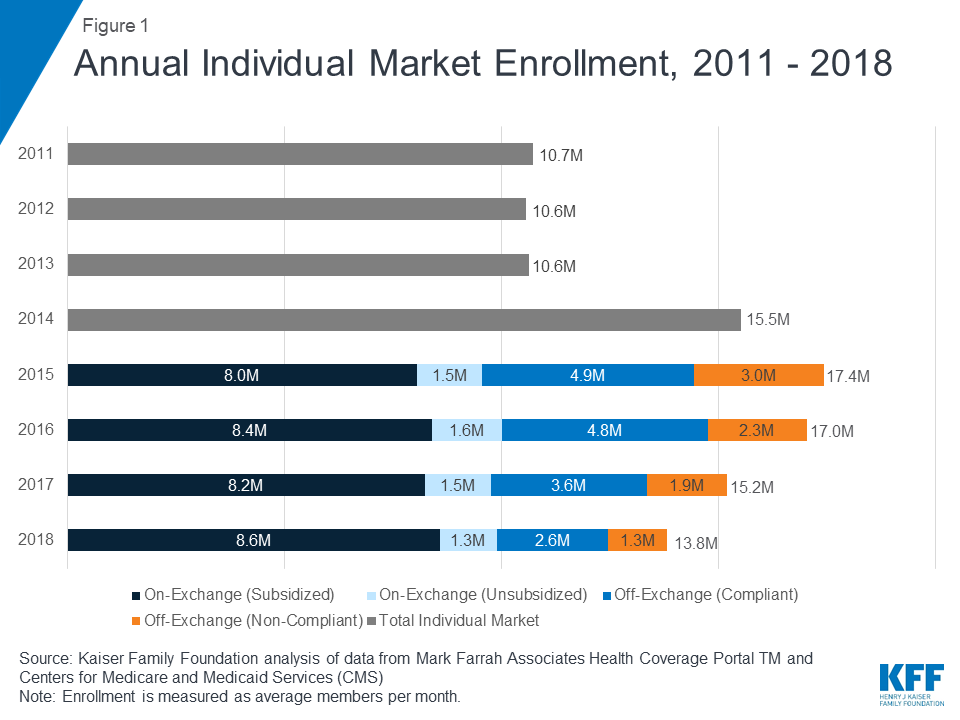
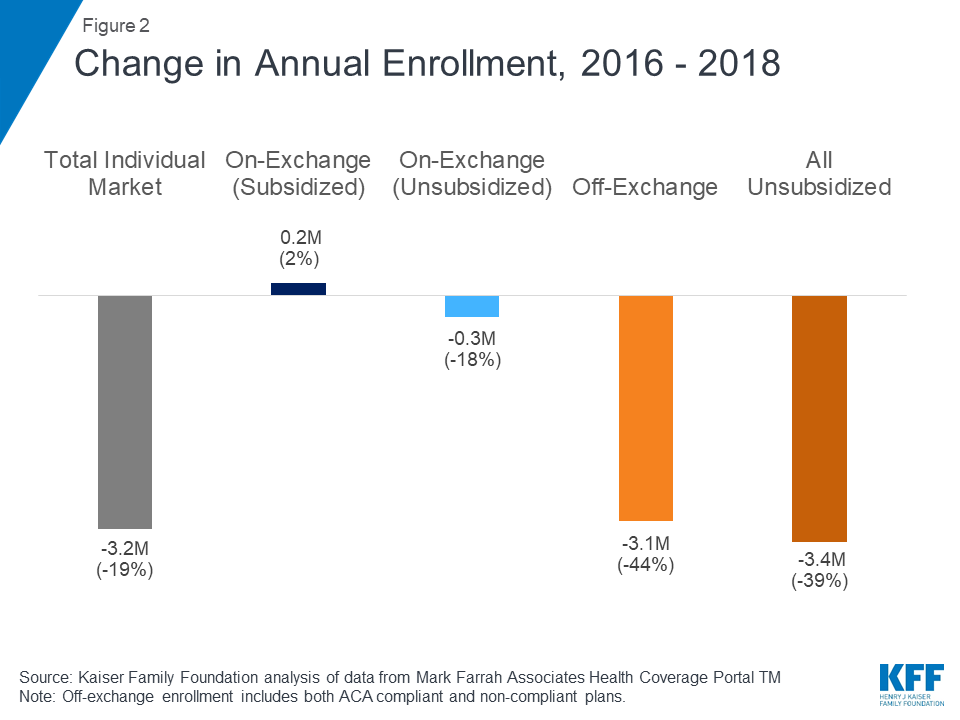
In 2016, total individual market enrollment was relatively unchanged from the previous year (at 17.0 million), though there was a shift from non-compliant to ACA-compliant plans. Enrollment in the total individual market began to decline in 2017 and continued through 2018 (Figure 2). Both compliant and non-compliant enrollment declined, suggesting that people ending transitional, non-compliant policies were not necessarily moving to the ACA-compliant market. In 2018, enrollment in compliant plans decreased further to 12.5 million and enrollment in non-compliant plans decreased to 1.3 million.

Figure 2: Change in Annual Enrollment, 2016 – 2018

Quarterly Changes in Individual Market Enrollment through Early 2019

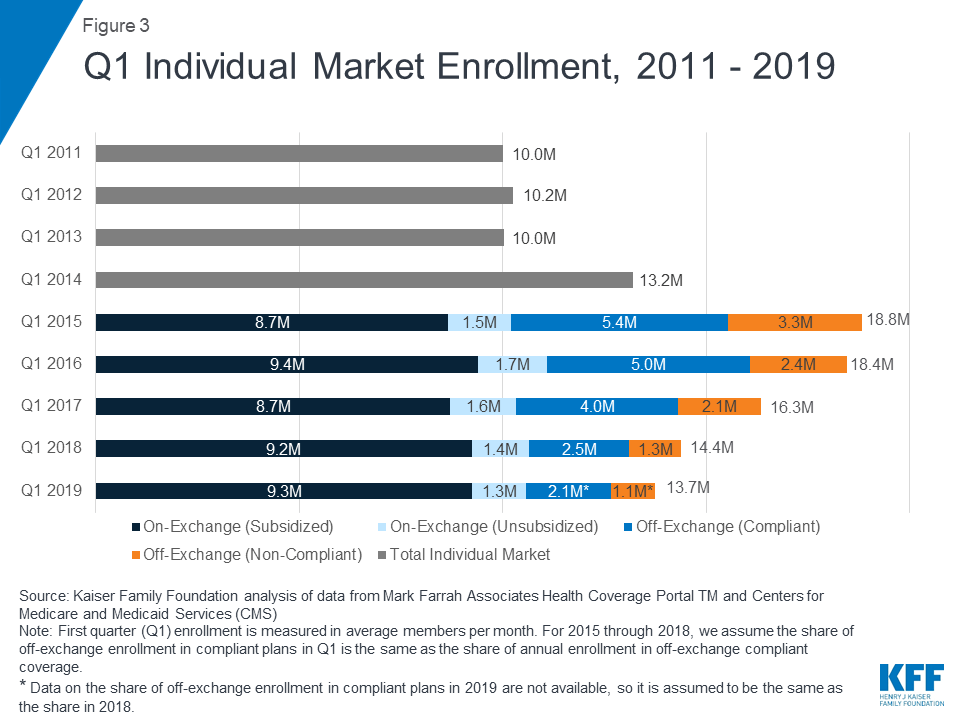
First quarter enrollment data from 2019 show total individual enrollment continuing to decline somewhat as premiums leveled off, even as enrollment on the ACA exchanges has remained relatively stable (Figure 3). 13.7 million people are enrolled in the individual market as of the first quarter of 2019, 5% lower than the first quarter of 2018 – a drop of about 651 thousand people.

Figure 3: Q1 Individual Market Enrollment, 2011 – 2019

Exchange Coverage

Exchange enrollment, particularly subsidized exchange enrollment, has largely remained stable since 2015. In the first quarter of 2019, 10.6 million people were covered on the ACA exchanges, including 9.3 million people receiving federal premium subsidies4 . Early 2019 exchange enrollment shows little change from the first quarter of 2018 when 10.6 million people were covered on-exchange, including 9.2 million receiving subsidies. As most people on the exchange receive subsidies that cap their premium payments at a certain share of their income, these enrollees are sheltered from the sticker price of premiums and would therefore be unlikely to drop their coverage due to changes in premiums.

Although exchange enrollment has held steady, according to CMS, the number of new consumers signing up for plans in 2019 dropped by 16% from 3.2 million to 2.7 million. This drop in new signups could be a result of a variety of factors, such as reductions in outreach and consumer assistance, repeal of the individual mandate penalty, or broader economic factors that may make people less likely to come into the market.

Off-Exchange Coverage

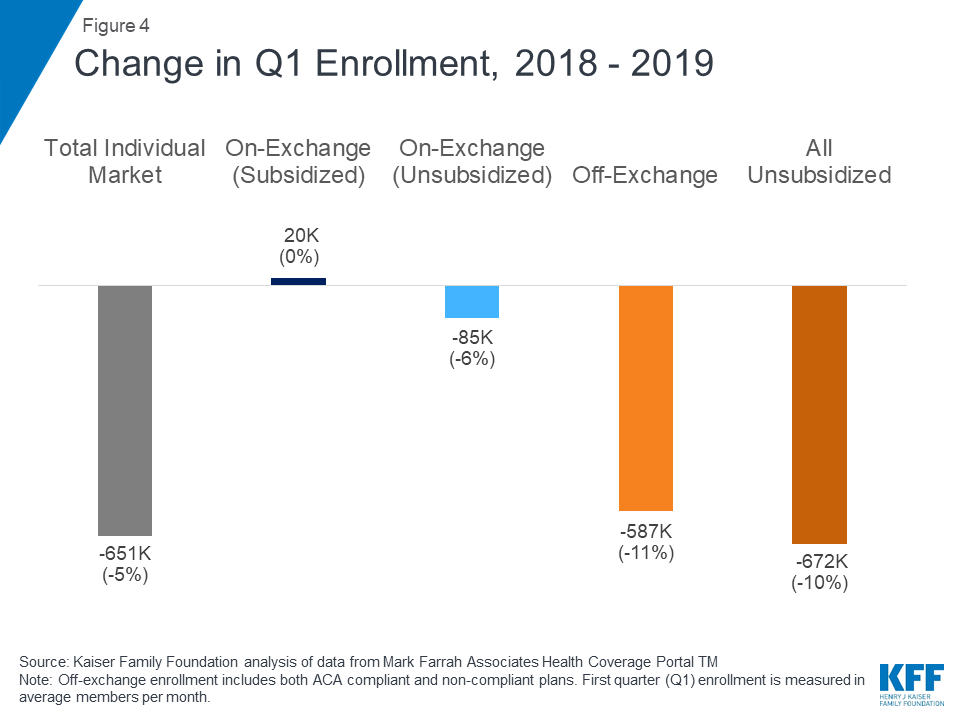
Declining off-exchange enrollment accounts for much of the drop in individual market enrollment since 2016. Total individual market enrollment began to decline in 2017 and has continued to fall through the first quarter of 2019 (Figure 4). Total individual market enrollment declined by 651 thousand people (5%) from the first quarter of 2018 to the first quarter of 2019. All of this decline was among unsubsidized enrollees, whose enrollment fell by 672 thousand (10%) from 2018 to 2019 (across unsubsidized ACA-compliant and non-compliant coverage).

Figure 4: Change in Q1 Enrollment, 2018 – 2019

Off-exchange enrollment includes ACA-compliant plans that are sold outside of the exchange but are part of the same risk pool as exchange plans, as well as non-compliant plans that do not meet ACA standards and have separate risk pools from the ACA-compliant plans. The primary distinction between on and off exchange ACA-compliant plans is that subsidies are only available through the exchange. To the extent that fewer healthy people buy off-exchange ACA-compliant plans, premiums in on-exchange plans are affected as well. Non-compliant plans (including grandfathered and some short-term plans) that are not part of the ACA risk pool are also included in off-exchange enrollment.

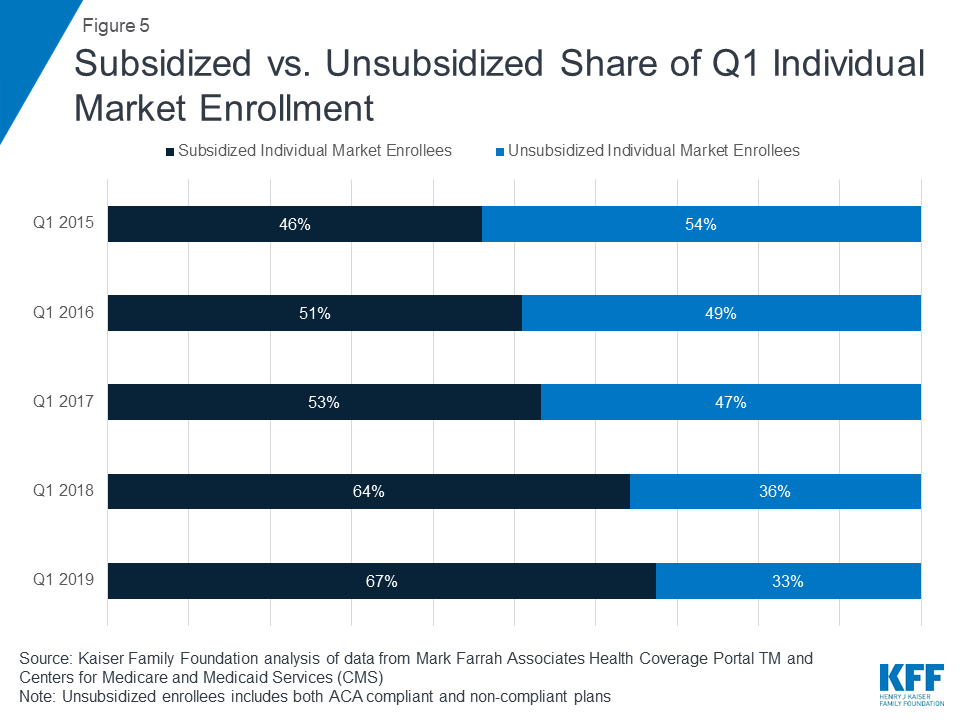
As unsubsidized enrollment has fallen over recent years, the individual market has increasingly become dominated by subsidized enrollees. In the first quarter of 2019, we estimate over two thirds of enrollees in the individual market are receiving a premium subsidy (Figure 5).

Figure 5: Subsidized vs. Unsubsidized Share of Q1 Individual Market Enrollment
Limitations of Q1 Non-Compliant Coverage Estimates

In the first quarter of 2019, we estimate 2.1 million people were covered by off-exchange ACA-compliant plans, and 1.1 million people had non-compliant plans.5  A limitation of this analysis is that precise data on the number of people in non-compliant plans in early 2019 are not yet available. Additionally, while there are some data from the National Association of Insurance Commissioners on enrollment in short-term plans, these data are only available annually (so do not include 2019) and do not account for all short-term coverage, as some plans are sold through associations and would not necessarily be considered individual market coverage. In Figure 3 above, we estimate the share of off-exchange individual market enrollees who are in ACA-compliant and non-compliant plans in early 2019 by assuming the same share as in 2018. In past years, this method has proven to be reliable, however, 2019 may differ from past years because this is the first year in which the individual mandate penalty has effectively been repealed and more loosely regulated plans may have proliferated.

Annual filings provide a more complete picture of the individual market and allow for more precise estimates of compliant vs non-compliant enrollment. Quarterly filings provide a sense of how enrollment is changing on a more current basis. First quarter enrollment tends to be higher than average annual enrollment because the number of people who drop coverage throughout the year exceeds the number who purchase coverage through special enrollment periods outside of annual open enrollment.

Possible Reasons for Individual Market Enrollment Declines

There are a variety of possible explanations for these declines in individual market enrollment in recent years, including: rising premiums for ACA-compliant coverage; the expansion of loosely regulated plans that may not be considered individual market coverage yet could attract customers away from the individual market; the effective repeal of the individual mandate; and broader economic trends, like gains in employment, which could lead to more people having job-based coverage. While we know that individual market enrollment has declined in 2019, we do not yet know whether people leaving the individual market have gained coverage through other sources.

The most significant declines in individual market enrollment coincided with significant premium increases in 2017 and 2018. In the early years of the ACA exchanges, insurers underestimated how sick the new risk pool would be and set premiums too low to cover their claims. A number of insurers then exited the market and the remaining insurers raised premiums substantially on average to match their costs. Our analysis of insurer financials showed the market was stabilizing by 2017 and insurers were starting to become profitable in the individual market for the first time under the ACA. Signs pointed toward the 2017 premium increases being a one-time market correction. However, premiums increased again in 2018, in large part compensating for uncertainty around the ACA repeal debates in Congress and the Trump Administration’s termination of cost sharing payments.

While the vast majority of exchange consumers receive subsidies that protect them from premium increases, off-exchange consumers in ACA-compliant plans bear the full cost of premium increases each year. In 2017 and 2018, states that had larger premium increases generally saw larger declines in unsubsidized ACA-compliant enrollment (Figure 6), suggesting a possible relationship between premium hikes and enrollment drops.

Figure 6

Going into 2019, premiums held mostly flat on average but the individual mandate penalty was reduced to $0, effectively doing away with the ACA’s requirement to purchase health insurance. Despite the lack of penalty, subsidized enrollment largely held steady. We estimate enrollment in unsubsidized off-exchange ACA-compliant plans declined by about 400 thousand from 2018 to 2019 (corresponding with the effective repeal of the individual mandate penalty but also relatively flat premium growth), which is smaller than previous declines in this part of the market that corresponded with steep increases in premiums.

Discussion

The effective repeal of the individual mandate penalty has raised concerns of enrollment declines in the individual market, particularly among people who are healthier than average. Expanded options to purchase loosely-regulated short-term health plans were also expected to siphon away healthy people, pushing premiums up a bit further for ACA-compliant plans on and off the exchange.

While the effective repeal of the individual mandate penalty and expanded access to loosely-regulated plans had an upward effect on 2019 premiums, other factors (like prior over-pricing) had a downward effect and resulted in average 2019 premiums being similar to 2018. We find that, while enrollment in the individual market has declined somewhat in early 2019, there are signs that enrollment may stabilize after a couple turbulent years.

There are many possible reasons for changes in enrollment, including the state of the economy and the number of people eligible for job-based coverage or public programs like Medicaid, and it is outside the scope of this analysis to determine which factors are driving these changes or whether they have any net effect on the overall insured rate. Nonetheless, given continued strong financial performance by individual market insurers and enrollment that remains higher than before the ACA, there do not appear to be any signs of market collapse so far in the absence of the individual mandate penalty.

The majority of people on the exchanges receive subsidies and are protected from premium increases, which in turn has a strong stabilizing effect on the individual market as a whole. As long as subsidies continue, the individual market will likely remain stable under current law. Nevertheless, middle-class people who do not qualify for subsidies will feel the brunt of any future premium increases. This is especially true of people with pre-existing conditions who likely would not qualify for short-term plans that base eligibility and premiums on people’s health. So while there may be no signs of the individual market collapsing, there remain concerns about affordability of coverage for people who do not qualify for a subsidy, many of whom have already left the individual market. The numbers also provide some perspective on the often hot debate over the ACA’s marketplaces. More than 150 million people are covered through the employer market, 11 times the number covered in the individual market overall and 14 times the number covered through the marketplaces.

Methods

We analyzed publicly-available federal enrollment data from the Centers for Medicare and Medicaid Services (CMS), and insurer-reported enrollment and financial data from Health Coverage Portal TM, a market database maintained by Mark Farrah Associates, which includes information from the National Association of Insurance Commissioners (NAIC) and the California Department of Managed HealthCare. All total enrollment figures in this data note are for the individual health insurance market as a whole, which includes major medical insurance plans sold both on and off exchange.

Exchange and compliant enrollment are from the Centers for Medicare and Medicaid Services (CMS). Total individual market enrollment is from administrative data insurers report to the National Association of Insurance Commissioners, and compiled by Mark Farrah Associates: annual enrollment is from the Supplemental Health Exhibit and first quarter enrollment is from the Exhibit of Premiums, Enrollment, and Utilization for health companies and rolled over from the prior year Supplemental Health Exhibit for life companies. Off-exchange enrollment is estimated by subtracting exchange enrollment from total enrollment in the individual market. Non-compliant enrollment is estimated by subtracting compliant enrollment from total enrollment in the individual market. CMS does not collect enrollment data for off-exchange ACA compliant plans in Massachusetts or Vermont; in these states, non-compliant enrollment was estimated by applying the national average share of non-compliant off-exchange members to statewide off-exchange enrollment.

Annual enrollment figures from 2011 – 2018 are average monthly enrollment. Quarterly enrollment figures in 2019 are effectuated enrollment (i.e., people who paid their first month’s premiums). For 2015 through 2018, we assume the share of off-exchange enrollment in compliant plans in Q1 is the same as the share of annual enrollment in off-exchange compliant coverage. Data on the share of off-exchange enrollment in compliant plans in 2019 are not available, so it is assumed to be the same as the share in 2018. As described above, this assumption may be inaccurate given changes in policy that took effect in 2019 and could change the distribution of people signed up in off-exchange ACA-compliant coverage as opposed to non-compliant coverage.

Endnotes

  1. First quarter enrollment is generally higher than average annual enrollment, because people drop coverage throughout the year after the annual open enrollment period. In this brief, we compare first quarter 2019 enrollment to first quarter enrollment in previous years to estimate how enrollment is changing over time. ↩︎
  2. Estimates of the size of the individual market vary between administrative and survey data; a more thorough discussion of methods for measuring the individual market size can be found here. ↩︎
  3. ACA changes came into effect in 2014, but 2014 average enrollment is not necessarily comparable because the first open enrollment lasted for 6 months. ↩︎
  4. Exchange enrollment is measured as the number of enrollees who selected a plan during open enrollment and paid their first month’s premium (effectuated enrollment). In 2014, open enrollment lasted for six months and CMS did not report effectuated enrollment in the first quarter. In 2015 and 2016, CMS reported effectuated enrollment as of March 31st. In 2017, 2018, and 2019, CMS reported effectuated enrollment as of March 15th, and did not include policies starting on March 1st. Open enrollment for 2017 continued through the end of January, but for the 2018 and 2019 plan years it ended on December 15. It is likely, therefore, that effectuated enrollment for 2017 was somewhat understated relative to 2018 and 2019. ↩︎
  5. For 2015 through 2018, we assume the share of off-exchange enrollment in compliant plans in Q1 is the same as the share of annual enrollment in off-exchange compliant coverage. Data on the share of off-exchange enrollment in compliant plans in 2019 are not available, so it is assumed to be the same as the share in 2018.   ↩︎
News Release

A Comprehensive Review of Research Finds That the ACA Medicaid Expansion Has Reduced the Uninsured Rate and Uncompensated Care Costs in Expansion States, While Increasing Affordability and Access to Care and Producing State Budget Savings   

Recent Research Finds an Association with Some Improved Health Outcomes

Published: Aug 15, 2019


Multiple studies over the last five years find that the Affordable Care Act’s Medicaid expansion has increased health coverage, affordability, and access to care while producing budget savings for states and reductions in uncompensated care costs for hospitals and clinics, according to a KFF review of more than 300 studies and policy reports. Thirty-six states and the District of Columbia have adopted the ACA Medicaid expansion. The literature review provides a useful reference on the effects of expansion at a time when more states are considering expansion, including some through waivers. At the same time, the Texas v. U.S. legal challenge to the ACA could roll back the Medicaid expansion as well as other provisions of the health law. The new analysis is the first significant update to KFF’s literature review of research on the effects of Medicaid expansion in more than a year. While significant expansions in coverage had been documented in the earlier review, recent studies were more focused on utilization, access, affordability and outcome metrics.  Other key findings include:

  • Some studies show that improved access to care and greater utilization of care is leading to increases in the diagnosis (and early diagnosis), of cancer and other conditions, and to increased prescriptions for medications used to treat opioid use disorder and opioid overdose.
  • A growing body of research finds an association between Medicaid expansion and certain measures of health outcomes, including improvements in self-reported health as well as improvements in cardiovascular mortality rates and cardiac patient surgery outcomes. Studies also show that Medicaid expansion improves affordability of health care and results in improvements in broader measures of financial stability.
  • Other studies did not find significant changes associated with expansion on certain measures of quality of care or health outcomes likely because the studies were narrow in scope or not enough time had elapsed to measure change.
  • Findings on the Medicaid expansion’s effect on provider capacity are mixed, with some studies showing increased availability of primary care appointments and others finding longer wait times or increased difficulty getting appointments with specialists.

While a number of studies document net budget savings and other fiscal benefits like increased revenue and jobs for states as a result of the expansion, this may in part be because the federal government covered 100 percent of the cost from 2014 to 2016. The federal share is phasing down and states will ultimately be required to cover 10 percent of the cost, which could influence the net effects over time (although some state reports project a net fiscal benefit even as the state share for the expansion increases). There is limited research examining the fiscal effects at the federal level from the additional expenditures for the Medicaid expansion or the revenues to support that spending. The literature review covers studies, analyses and reports published by government, research and policy organizations between January 2014 and June 2019, using data from 2014 or later.

News Release

New Analysis of Large Employer Health Coverage: The Cost to Families for Health Coverage and Care Has Risen More Than 2X Faster Than Wages and 3X Faster Than Inflation Over the Last Decade 

Published: Aug 15, 2019

A new KFF analysis that looked at both premiums and other out-of-pocket costs shows that families with coverage through a large employer paid 67 percent more for their health benefits and care in 2018 than a decade earlier. In 2018, a typical family of four with large employer coverage spent $4,706 on their share of health premiums and $3,020 on cost sharing (such as deductibles, copayments and coinsurance) for a combined cost to the family of $7,726, the analysis finds. That was up from $2,838 in premiums and $1,779 in cost sharing in 2008, for a combined cost to the family of $4,617 a decade ago. The rise in health costs borne directly by families outstripped the growth in wages (31%) and inflation (21%) over the 10-year period, according to the analysis. Over the same ten-year period, employers’ contributions toward their workers’ health insurance premiums increased 51 percent (from $10,008 to $15,159). The total cost of covering a family with large employer health insurance was $22,885 in 2018, up 56 percent from $14,625 in 2008. Researchers analyzed a sample of health benefit claims from the IBM MarketScan Commercial Claims and Encounters database, as well as KFF’s 2018 Employer Health Benefits Survey, to examine trends in actual employee spending on premiums, deductibles, copayments and coinsurance over time. The analysis is part of the Peterson-Kaiser Health System Tracker, an online information hub dedicated to monitoring and assessing the performance of the U.S. health system. Note: The 2019 KFF Employer Health Benefits Survey that tracks changes in employer health benefits and costs will be released this fall.

Tracking the Rise in Premium Contributions and Cost-Sharing for Families with Large Employer Coverage

Published: Aug 15, 2019

A new KFF analysis that looked at both premiums and other out-of-pocket costs shows that families with coverage through a large employer paid 67% more for their health benefits and care in 2018 than a decade earlier.

In 2018, a typical family of four with large employer coverage spent $4,706 on their share of health premiums and $3,020 on cost sharing (such as deductibles, copayments and coinsurance) for a combined cost to the family of $7,726, the analysis finds. That was up from $2,838 in premiums and $1,779 in cost sharing in 2008, for a combined cost to the family of $4,617 a decade ago.

The analysis of part of the Peterson-Kaiser Health System Tracker, an online information hub dedicated to monitoring and assessing the performance of the U.S. health system.

Changes to “Public Charge” Inadmissibility Rule: Implications for Health and Health Coverage

Published: Aug 12, 2019

Key Takeaways

In August 2019, the Trump Administration announced a final rule that changes the public charge policies used to determine whether an individual applying for admission or adjustment of status is inadmissible to the U.S. Under longstanding policy, the federal government can deny an individual entry into the U.S. or adjustment to legal permanent resident (LPR) status (i.e., a green card) if he or she is determined likely to become a public charge.

  • Under the rule, officials will newly consider use of certain previously excluded programs, including non-emergency Medicaid for non-pregnant adults, the Supplemental Nutrition Assistance Program (SNAP), and several housing programs, in public charge determinations.
  • The changes will create new barriers to getting a green card or immigrating to the U.S. and likely lead to decreases in participation in Medicaid and other programs among immigrant families and their primarily U.S.-born children beyond those directly affected by the new policy. Nationwide, over 13.5 million Medicaid and CHIP enrollees, including 7.6 million children, live in a household with at least one noncitizen or are noncitizens themselves and may be at risk for decreased enrollment a result of the rule.
  • Decreased participation in these programs would contribute to more uninsured individuals and negatively affect the health and financial stability of families and the growth and healthy development of their children.

Introduction

In August 2019, the Trump Administration announced a Department of Homeland Security (DHS) final rule to make changes to “public charge” policies that govern how the use of public benefits may affect individuals’ ability to enter the U.S. or adjust to legal permanent resident (LPR) status (i.e., obtain a “green card”). The final rule does not affect public charge deportability grounds, which are governed by the Department of Justice. The rule broadens the programs that the federal government will consider in public charge determinations to include previously excluded health, nutrition, and housing programs, and outlines the factors the federal government will consider in making a public charge consideration.1  The preamble to the rule indicates that its primary goal is to better ensure that individuals who apply for admission to the U.S., seek an extension of stay or change of status, or apply for adjustment of status, are self-sufficient. The preamble also identifies a range of consequences on the health and financial stability of families, as well as direct and indirect costs associated with the rule. This fact sheet provides an overview of the proposed rule and its implications for health and health coverage of immigrant families.

What Was Public Charge Policy Prior to This Rule?

Under longstanding policy, if authorities determine that an individual is “likely to become a public charge,” they may deny that person’s application for lawful permanent residence or their entry into the U.S.2  Certain immigrants, including refugees and asylees and other humanitarian immigrants, are exempt from public charge determinations under law.

Under previous policy clarified in 1999, the federal government specified that it would not consider use of Medicaid, the Children’s Health Insurance Program (CHIP), or other non-cash programs in public charge determinations. Previously, there was confusion about whether use of Medicaid, CHIP, or other non-cash programs applied in public charge determinations.3  In 1999, the Immigration and Naturalization Service (now part of the Department of Homeland Security (DHS)) issued guidance that defined a public charge as someone who has become or who is likely to become ‘‘primarily dependent on the government for subsistence, as demonstrated by either the receipt of public cash assistance for income maintenance or institutionalization for long-term care at government expense.”4  The guidance specified that the federal government would not consider use of Medicaid, CHIP, or other supportive programs in public charge determinations, with the exception of use of Medicaid for long-term institutional care.5  The guidance noted that this clarification was needed because confusion about policies “deterred eligible aliens and their families, including U.S. citizen children, from seeking important health and nutrition benefits that they are legally entitled to receive. This reluctance to access benefits has an adverse impact not just on the potential recipients, but on public health and the general welfare.”6 

What are the Key Changes in the Rule?

The rule broadens the programs that the federal government will consider in public charge determinations to include previously excluded health, nutrition, and housing programs. The rule redefines a public charge as an “alien who receives one or more public benefits for more than 12 months in the aggregate within any 36-month period (such that, for instance, receipt of two benefits in one month counts as two months),” and defines public benefits to include federal, state, or local cash benefit programs for income maintenance and certain health, nutrition, and housing programs that were previously excluded from public charge determinations, including non-emergency Medicaid for non-pregnant adults, the Supplemental Nutrition Assistance Program (SNAP), and several housing programs (see Appendix Table 1).7  The rule does not include CHIP or subsidies for Affordable Care Act Marketplace coverage as public benefits. Public charge determinations will only consider use of benefits by the individual and will not take into account benefits used by other family members, including children, of the person for whom officials are making the determination.8 

DHS will find an individual “inadmissible” if officials determine that he or she is more likely than not at any time in the future to become a public charge based on the totality of the person’s circumstances. At a minimum, officials must take into account an individual’s age; health; family status; assets, resources, and financial status; and education and skills when making this determination.

The rule identifies characteristics deemed as positive factors that reduce the likelihood of an individual becoming a public charge and negative factors that increase the likelihood of becoming a public charge. In general, being younger or older than working age, having health needs, lacking private health coverage, having limited income or resources, not being employed and not being a primary caregiver, having a lower education level, having limited English proficiency, and using or previously using public benefit programs would be considered negative factors. The rule establishes a new income standard of 125% of the federal poverty level (FPL) ($26,663 for a family of three as of 2019); family income below that standard will be considered to be a negative factor.9 

The rule also identifies heavily weighted negative or positive factors. One heavily weighted negative factor is having received or being approved to receive one or more public benefits for more than 12 months in the aggregate within the 36-month period prior to applying for admission or adjustment of status. Another health-related heavily weighted negative factor includes having a medical condition that is likely to require extensive treatment or institutionalization and being uninsured and lacking the financial resources to pay for the medical costs associated with the condition. Other heavily weighted negative factors include not being a full-time student or employed and having been previously found inadmissible or deportable on public charge grounds. Heavily weighted positive factors include having income above 250% of the FPL ($53,325 for a family of three in 2019) or having private health insurance that is not subsidized by Affordable Care Act tax credits.

The rule will become effective 60 days after it is officially published in the federal register. The rule specifies that DHS will not consider an individual’s use of the previously excluded health, nutrition, and housing programs prior to the effective date.

Who Do the Changes Affect?

The rule will affect individuals seeking to become LPRs or “green card” holders and individuals seeking to immigrate to the U.S. It also will affect certain people seeking to extend or adjust their non-immigrant status while in the U.S. Most individuals seeking to adjust to LPR status or to immigrate to the U.S. are immediate relatives of U.S. citizens or have a family-based sponsor. In 2016, 1.2 million individuals obtained LPR status, including over half a million who were already present in the U.S.10  Some immigrants, including refugees and asylees and other humanitarian immigrants, remain exempt from public charge determinations under law. Public charge policies do not apply to LPRs seeking to obtain citizenship. However, obtaining LPR status is a key step toward citizenship for immigrants seeking naturalization.

The rule will likely increase confusion and fear broadly across immigrant families about using public programs for themselves and their children, regardless of whether they are directly affected by the changes. In 2016, there were 22 million noncitizens residing in the U.S. About six in ten noncitizens were lawfully present immigrants, who include LPRs, refugees, asylees, and other individuals who are authorized to live in the U.S.11  Many individuals live in mixed immigration status families that may include lawfully present immigrants, undocumented immigrants, and/or citizens. Nearly 19 million, or 25% of children, had an immigrant parent as of 2017, and the large majority of these children were citizens. About 10 million, or 13%, were citizen children with a noncitizen parent. (Figure 1).12 

Figure 1: Immigrants and Children of Immigrants as a Share of the Total U.S. Population, 2017

What are the Implications for Health & Health Coverage?

Today, Medicaid fills gaps in private coverage for some lawfully present immigrants, providing them access to health care and financial protections that support their ability to work and care for their children. Medicaid provides families access to preventive and primary care, including prenatal care, as well as care for chronic conditions. In addition, the coverage provides families financial protection from high medical costs. By enabling families to meet their health care needs, Medicaid supports families’ ability to work and care for their children. The majority of lawfully present immigrants live in a family with at least one full-time worker (84%), a rate higher than that of citizens.13  However, lawfully present immigrants are more likely than citizens to live in low-income families and often work in jobs and industries that do not offer health coverage. Medicaid and CHIP coverage help fill this gap, but many lawfully present immigrants remain uninsured due to eligibility restrictions for immigrants that require many otherwise eligible lawfully present immigrants to wait five years after obtaining lawful status before they may enroll as well as barriers to enrollment for eligible immigrants, including fear.14 

The rule will likely lead to declines in participation in Medicaid and other programs broadly across immigrant families, including their primarily U.S.-born children. Previous experience and recent research suggest that the rule will lead individuals to forgo enrollment in or disenroll themselves and their children from public programs because they do not understand the rule’s details and fear their own or their children’s enrollment could negatively affect their or their family members’ immigration status.15  For example, prior to the final rule, there were growing anecdotal reports of individuals disenrolling or choosing not to enroll themselves or their children in Medicaid and CHIP due to growing fears and uncertainty.16  Providers also have reported increasing concerns among parents about enrolling their children in Medicaid and food assistance programs,17  and WIC agencies across a number of states have had enrollment drops that they attribute largely to fears about public charge.18  A survey conducted prior to the final rule found that one in seven adults in immigrant families reported avoiding public benefit programs for fear of risking future green card status, and more than one in five adults in low-income immigrant families reported this fear.19 

Nationwide, 13.5 million Medicaid/CHIP enrollees, including 7.6 million children, live in a household with a noncitizen or are noncitizens themselves and may be at risk for decreased enrollment as a result of the rule. Decreased participation in Medicaid/CHIP would increase the uninsured rate among immigrant families, reducing their access to care and contributing to worse health outcomes. Reduced participation in nutrition and other programs would likely compound these effects. Overall, reduced participation in Medicaid and other programs would negatively affect the health and financial stability of families and the growth and healthy development of their children. As noted in the preamble to the rule, decreased participation in Medicaid and other programs would also reduce federal and state program costs; at the same time, there will be declines in federal payments to states and revenues to health care providers, pharmacies, grocery retailers, agricultural producers, and landlords as well as increased costs for individuals and organizations serving immigrant families.

Outreach and education efforts could minimize chilling effects from the rule. As noted, chilling effects on program participation will likely extend broadly beyond individuals directly affected by the rule’s changes. Outreach and education to immigrant families and communities may help reduce fears and confusion stemming from the rule to reduce this chilling effect. However, overcoming fears and uncertainty in the current environment, particularly as immigration policies continue to evolve and change, may be challenging.

Appendix Table 1: Key Differences between Previous and New “Public Charge” Policies
 Policy Based on 1999 GuidanceUnpublished Final Rule Released August 12, 2019
Definition of Public ChargeAn alien who has become or who is likely to become ‘‘primarily dependent on the government for subsistence, as demonstrated by either the receipt of public cash assistance for income maintenance or institutionalization for long-term care at government expense.’’Public charge means an alien who receives one or more public benefits for more than 12 months in the aggregate within any 36-month period (such that, for instance, receipt of two public benefits in one month counts as two months).
Public Benefits that May Be Considered for Public Charge Purposes
  • SSI
  • TANF
  • State/local cash assistance programs
  • Public assistance for long-term care in an institution (including Medicaid)
  • SSI
  • TANF
  • Federal, state, or local cash benefit programs for income maintenance
  • Non-emergency Medicaid for non-pregnant adults over age 2120 
  • SNAP
  • Section 8 Housing Assistance under the Housing Choice Voucher Program
  • Section 8 Project-Based Rental Assistance
  • Subsidized public housing
Consideration of Use of Public Benefits in a Public Charge Determination
  • May take into consideration past and current receipt of cash public assistance for income maintenance or institutionalized long-term care
  • No weight should be placed on receipt of non-cash benefits or receipt of cash benefits for purposes other than income maintenance
  • Cash benefits received by children or other family members should not be attributed to the individual, unless the family member’s benefits are the family’s sole source of support
  • Will consider whether an individual has applied for, been approved for, or received public benefits
  • Will not consider benefits received by or applied for on behalf of other family members
  • Will not consider benefits received by active duty or reserve service members and their families
  • Will not consider benefits received by an individual during periods in which the individual was present in an immigration category that is exempt from a public charge determination
  • Will not consider benefits received by foreign-born children of U.S. citizen parents who will be automatically eligible to become citizens
Heavily Weighted Negative FactorsNot Specified
  • Has received one or more public benefits for more than 12 months in the aggregate within the prior 36 months
  • Not a full-time student and is authorized to work, but is unable to demonstrate employment, recent employment, or a reasonable prospect of future employment
  • Has a medical condition that requires extensive treatment or institutionalization and is uninsured and does not have sufficient resources to pay for medical costs related to the condition
  • Previously found inadmissible or deportable on public charge grounds
Heavily Weighted Positive FactorsNot Specified
  • Household has financial assets/resources of at least 250% of the FPL
  • Authorized to work or employed with an income of at least 250% of the FPL
  • Individual has private insurance that is not subsidized by Affordable Care Act tax credits
  1. The rule also makes changes related to use of public charge bonds. ↩︎
  2. Becoming a public charge may also be a basis for deportation in extremely limited circumstances. “Public Charge Fact Sheet,” U.S. Citizenship and Immigration Services, https://www.uscis.gov/news/fact-sheets/public-charge-fact-sheet, accessed February 12, 2018. ↩︎
  3. This confusion increased after new Medicaid and CHIP eligibility restrictions were imposed on immigrants in 1996. Those restrictions required many lawfully present immigrants to wait five years after obtaining lawful status before they could enroll in Medicaid or CHIP and made some lawfully present immigrants ineligible for coverage. However, they did not change public charge policy. ↩︎
  4. “Field Guidance on Deportability and Inadmissibility on Public Charge Grounds,” Immigration and Naturalization Service, Justice, 64 Fed. Reg. 28689-28693 (March 26, 1999), https://www.gpo.gov/fdsys/pkg/FR-1999-05-26/pdf/99-13202.pdf. ↩︎
  5. Ibid. ↩︎
  6. Ibid. ↩︎
  7. In the final rule, DHS removed the reference to long-term institutionalization within the definition of public benefit as this care would be provided through programs already included in the new public benefit definition (TANF, SSI, and Medicaid). ↩︎
  8. Public charge determinations will not consider receipt of benefits by active duty or reserve service members or their spouses or children, receipt of benefits during periods in which an individual was present in the U.S. with an immigration status that is exempt from public charge determinations, or receipt of public benefits by foreign-born children of U.S. citizen parents who will be automatically eligible to become citizens. ↩︎
  9. If an individual has income below this standard, DHS will assess whether the total value of the individual’s household assets and resources is at least five times the difference between the household’s annual income and the federal poverty guidelines for his or her household size. Income standards vary for individuals on active duty in the armed forces. ↩︎
  10. “Table 6. Persons Obtaining Lawful Permanent Resident Status by Type and Major Class of Admission: Fiscal Years 2014 to 2016,” 2016 Yearbook of Immigration Statistics, Department of Homeland Security, https://www.dhs.gov/immigration-statistics/yearbook/2016/table6, accessed February 12, 2018. ↩︎
  11. Kaiser Family Foundation analysis of the March 2017 Current Population Survey, Annual Social and Economic Supplement. ↩︎
  12. Kaiser Family Foundation analysis of the March 2017 Current Population Survey, Annual Social and Economic Supplement. ↩︎
  13. Kaiser Family Foundation analysis of the March 2017 Current Population Survey, Annual Social and Economic Supplement. ↩︎
  14. Ibid. ↩︎
  15. Findings show that recent immigration policy changes have increased fears and confusion among broad groups of immigrants beyond those directly affected by the changes. See Samantha Artiga and Petry Ubri, Living in an Immigrant Family in America: How Fear and Toxic Stress are Affecting Daily Life, Well-Being, & Health, (Washington, DC: Kaiser Family Foundation, December 2017), https://modern.kff.org/disparities-policy/issue-brief/living-in-an-immigrant-family-in-america-how-fear-and-toxic-stress-are-affecting-daily-life-well-being-health/ and Samantha Artiga and Barbara Lyons, Family Consequences of Detention/Deportation: Effects on Finances, Health, and Well-Being (Washington, DC: Kaiser Family Foundation, September 2018), https://modern.kff.org/disparities-policy/issue-brief/family-consequences-of-detention-deportation-effects-on-finances-health-and-well-being/. Similarly, earlier experiences show that welfare reform changes increased confusion and fear about enrolling in public benefits among immigrant families beyond those directly affected by the changes. See. Neeraj Kaushal and Robert Kaestner, “Welfare Reform and Health Insurance of Immigrants,” Health Services Research,40(3), (June 2005), https://www.ncbi.nlm.nih.gov/pmc/articles/PMC1361164/; Michael Fix and Jeffrey Passel, Trends in Noncitizens’ and Citizens’ Use of Public Benefits Following Welfare Reform 1994-97 (Washington, DC: The Urban Institute, March 1, 1999) https://www.urban.org/sites/default/files/publication/69781/408086-Trends-in-Noncitizens-and-Citizens-Use-of-Public-Benefits-Following-Welfare-Reform.pdf; Namratha R. Kandula, et. al, “The Unintended Impact of Welfare Reform on the Medicaid Enrollment of Eligible Immigrants, Health Services Research, 39(5), (October 2004), https://www.ncbi.nlm.nih.gov/pmc/articles/PMC1361081/; Rachel Benson Gold, Immigrants and Medicaid After Welfare Reform, (Washington, DC: The Guttmacher Institute, May 1, 2003), https://www.guttmacher.org/gpr/2003/05/immigrants-and-medicaid-after-welfare-reform. ↩︎
  16. Samantha Artiga and Petry Ubri, Living in an Immigrant Family in America: How Fear and Toxic Stress are Affecting Daily Life, Well-Being, & Health, (Washington, DC: Kaiser Family Foundation, December 2017), https://modern.kff.org/disparities-policy/issue-brief/living-in-an-immigrant-family-in-america-how-fear-and-toxic-stress-are-affecting-daily-life-well-being-health/; Samantha Artiga and Barbara Lyons, Family Consequences of Detention/Deportation: Effects on Finances, Health, and Well-Being (Washington, DC: Kaiser Family Foundation, September 2018),https://modern.kff.org/disparities-policy/issue-brief/family-consequences-of-detention-deportation-effects-on-finances-health-and-well-being/; and Hamutal Bernstein, Dulce Gonzalez, Michael Karpman, and Stephen Zuckerman, With Public Charge Rule Looming, One in Seven Adults in Immigrant Families Reported Avoiding Public Benefit Programs in 2018, (Washington, DC: Urban Institute, May 2019), https://www.urban.org/urban-wire/public-charge-rule-looming-one-seven-adults-immigrant-families-reported-avoiding-public-benefit-programs-2018 ↩︎
  17. The Children’s Partnership, “California Children in Immigrant Families: The Health Provider Perspective,” 2018, https://www.childrenspartnership.org/wp-content/uploads/2018/03/Provider-Survey-Inforgraphic-.pdf . ↩︎
  18. Bottemiller Evich, H., “Immigrants, fearing Trump crackdown, drop out of nutrition programs,” Politico (Washington, DC, September 4, 2018). Accessed July 18, 2019, https://www.politico.com/story/2018/09/03/immigrants-nutrition-food-trump-crackdown-806292  ↩︎
  19. Hamutal Bernstein, Dulce Gonzalez, Michael Karpman, and Stephen Zuckerman, With Public Charge Rule Looming, One in Seven Adults in Immigrant Families Reported Avoiding Public Benefit Programs in 2018, (Washington, DC: Urban Institute, May 2019), https://www.urban.org/urban-wire/public-charge-rule-looming-one-seven-adults-immigrant-families-reported-avoiding-public-benefit-programs-2018 ↩︎
  20. Services or benefits funded by Medicaid but provided under the Individuals with Disabilities Education Act and school-based services or benefits provided to individuals who are at or below the oldest age eligible for secondary education as determined under state or local law are not included as a public benefit. ↩︎

Data Note: Prescription Drugs and Older Adults

Published: Aug 9, 2019

Findings

With continued attention from policymakers on prescription drug costs, a 2019 KFF Health Tracking Poll took a deep dive into the views of Americans on a variety of topics related to prescription drugs with special attention paid to the experiences and attitudes of older adults, defined here as people ages 65 and older. Older adults’ experiences with prescription medications can vary significantly based on their health status, how many prescription drugs they are currently taking, and other demographic variables like household income. This data note explores the varied experiences of older adults across such different demographic groups. With most older adults (83%) reporting that they currently have insurance that helps them pay for prescription drugs1 , this data note also explores how older adults chose their prescription drug plans and what they prioritize in their coverage. In addition, it explores older adults’ views on several prescription drug policy options currently being discussed by policymakers.

Prescription Drug Use and Affordability Issues

Nearly nine in ten (89%) adults 65 and older report they are currently taking any prescription medicine. This compares to three-fourths of 50-64 year olds who report taking prescription drugs, half (51%) of 30-49 year olds, and four in ten (38%) 18-29 year olds. Older adults are also more likely than their younger counterparts to be taking multiple prescription medications. More than half of adults 65 and older (54%) report taking four or more prescription drugs compared to one-third of adults 50-64 years old (32%) and about one in ten adults 30-49 (13%) or 18-29 (7%).

Most seniors have prescription drug coverage through Medicare Part D, but majorities across party lines say drug costs are unreasonable. This @KFF data note examines this group’s experiences across a variety of demographics.

While a majority of older adults have prescription drug coverage through Medicare Part D, which is Medicare’s voluntary prescription drug benefit, most older adults (76%) think the cost of prescription drugs is unreasonable. This viewpoint is consistent across party identification, with majorities of Democrats (81%), independents (74%), and Republicans (70%) saying the cost of prescription drugs is unreasonable.

Figure 1: Most Older Adults Say The Cost Of Prescription Drugs Is Unreasonable

Nearly 1 in 4 older adults say it’s difficult to afford their prescription drugs. Who has the most trouble? Those in fair or poor health and those with low incomes. Read more @KFF

In addition, one-fourth of older adults (23%) who take prescription drugs say it is difficult to afford their prescription drugs, including about one in ten (8%) saying it is “very difficult.” As is true among the public as a whole, there are certain groups of older adults who are much more likely to report difficulty affording medications, including those who report being in either “only fair” or “poor” health (45%), whose household income is less than $30,000 annually (34%), and who take four or more prescriptions (28%). These factors are inter-related, as those who are in relatively poor health are also more likely to be taking four or more prescriptions and spending at least $25 a month on their medications.

Figure 2: Older Adults In Fair Or Poor Health More Likely To Report Difficulty Affording Their Prescription Drugs

About one in five older adults (21%) say they did not take their medicines as prescribed at some point in the past year because of the cost. This includes those who report that, due to costs, they haven’t filled a prescription (12% of total older adults), took an over-the counter drug instead (11% of total), or cut pills in half or skipped a dose (8% of total).

Figure 3: About One-Fifth Of Older Adults Report Not Taking Their Prescriptions As Prescribed Due To Cost

Notably, among those who report not taking their medicines as prescribed, slightly more than half (53%) say they didn’t tell their doctor or health care provider (11% of the total) and one-fifth (22%) of this group say their condition got worse as a result of not taking their prescription as recommended (5% of total).

Figure 4: One In Ten Older Adults Didn’t Tell Their Doctor They Did Not Take Their Prescription Medication, Some Say Condition Worsened

Less Than Half Of older adults report discussing the cost of Their prescriptions with their doctor or pharmacist

The KFF polling finds that older adults are more likely to report discussing safety concerns than cost issues with their doctors and pharmacists when getting a new prescription. Seven in ten older adults (72%) say they usually talk to their doctor about the safety and potential side effects of the drug when their doctor writes a prescription for a drug they haven’t taken before. In contrast, around four in ten older adults (43%) say they usually talk to their doctor about whether there is a less expensive alternative, and just over one-third (36%) talk about the cost they will have to pay for the new medication.

Similarly, while half of older adults say they usually talk to their pharmacist about the safety and potential side effects of a new prescription drug, fewer (32%) say they talk to their pharmacist about whether there is a less expensive alternative available. About four in ten (43%) say they talk their doctor about the same thing.

Figure 5: More Seniors Say They Talk About Safety, Side Effects Of a New Drug Than About The Cost Of The Drug

Older adults who report difficulty affording their prescriptions are no more likely to report talking to their doctor or their pharmacist about drug costs than those who report no difficulty affording their medications.

Experiences with Prescription Drug Coverage

People with prescription drug coverage under Medicare Part D are encouraged to compare plans each year to find coverage that best meets their individual needs, based on the specific drugs they take. For 2019, Medicare beneficiaries could choose from among 27 stand-alone Medicare Part D prescription drug plans, and 21 Medicare Advantage prescription drug plans, on average.

Less than four in ten older adults report comparing plan premiums (36%) or co-pays for prescription drugs they were currently taking (36%), and about three in ten (28%) say they compared which prescription drugs were covered by each of the different drug plans. Overall, about half (47%) of older adults who have prescription drug coverage say they did some comparison shopping when choosing their current prescription drug plan.

Figure 6: Half Of Older Adults With Prescription Drug Coverage Report Comparison Shopping When They Chose Their Current Plan

Some older adults report various problems accessing prescription drugs through their plan

Overall, nearly half (45%) of older adults with prescription drug coverage say they have experienced various problems accessing prescription drugs through their drug plan in the past 12 months. Nearly three in ten older adults (28%) report that their plan did not cover a drug prescribed by their doctor. Nearly one-fourth (23%) report that their plan required them to try a less expensive drug before they could get a more expensive drug initially prescribed by their doctor—a utilization management tool known as step therapy—and one in five (21%) report having to wait more than two days to get a prescription filled due to prior authorization requirements by their drug plan.

Figure 7: About Half Of Older Adults With Prescription Drug Coverage Say They’ve Experienced The Following In The Past Year

Certain groups of older adults were more likely than others to report experiencing difficulty with their prescription drug coverage in the past 12 months, including more than half of those with a household income of less than $30,000 a year and just over half of those taking four or more prescription drugs.

Figure 8: About Half Of Older Adults With Drug Coverage Say They’ve Experienced A Problem With Their Plan In The Past Year

Few older adults report using patient assistance programs or other types of discounts

One-fifth of older adults say they have received a discount on a prescription drug in the past year, either through a coupon, a co-pay card, drug company patient assistance program, or some other type of discount. Those who report difficulty affording their medications are no more likely than those who do not report difficulty affording their medications to say they have received a discount on a prescription drug in the past year (25% compared to 20%, respectively).

Figure 9: One-Fifth Of Older Adults Across Groups Say They Have Received A Discount On A Prescription Drug In The Past Year

When older adults with prescription drug coverage were asked what feature of their coverage is more important to them, a larger share say having a lower co-pay at the pharmacy is more important to them than paying a lower premium each month (51% versus 35%). This finding may reflect the greater frequency of payment for prescription drug co-pays versus monthly premiums. In addition, monthly Part D premiums have been relatively stable in recent years, which may help to lessen concerns about premium levels among older adults.

Figure 10: Among Older Adults With Drug Coverage, Most Say They Prioritize Lower Co-Pays Over Premiums

Majorities of Older Adults Support Various Actions Aimed at Keeping Costs Down

Unlike many other health policies that divide partisans, majorities of older adults across party identification favor many of the policy proposals included in the KFF poll, including recent Trump administration proposals like international reference pricing, Democratic proposals to allow the federal government to negotiate drug prices, and bipartisan proposals to add a cap on out-of-pocket spending to Part D. Each of these policy proposals is supported by large majorities of Democrats, independents, and Republicans.

Table 1: Majorities Of Older Adults Across Partisans Say They Favor Medicare Drug Negotiations, Reference Pricing, And Placing Limits On Spending To Lower Drug Costs
Percent of older adults who favor each of the following actions to keep prescription drug costs down:TotalDemocratsIndependentsRepublicans
Allowing the gov’t to negotiate with drug companies to get a lower price for people with Medicare82%88%79%81%
Placing an annual limit on out-of-pocket drug costs for people with Medicare68686773
Lowering what Medicare pays based on amounts in other countries60616158
Allowing Medicare drug plans to put more restrictions on use of certain drugs45484642
Allowing Medicare drug plans to exclude more drugs24282120

Fewer older adults favor allowing Medicare to restrict access to certain prescription medications such as allowing Medicare drug plans to put more restrictions on the use of certain drugs (45%) or allowing these plans to exclude more drugs (24%).

Methodology

This KFF Health Tracking Poll was designed and analyzed by public opinion researchers at the Kaiser Family Foundation (KFF). The survey was conducted February 14th–24th 2019, among a nationally representative random digit dial telephone sample of 1,440 adults ages 18 and older, living in the United States, including Alaska and Hawaii (note: persons without a telephone could not be included in the random selection process). The sample included 290 respondents reached by calling back respondents that had previously completed an interview on the KFF Tracking poll more than nine months ago. This month’s poll also includes an analysis of older Americans age 65 or older (n=606). To obtain a large enough sample, the sampling frame included an oversample of older adults using cell phones (n=26) and landlines (n=75) as well as callbacks to adults who fit the age criterion using the SSRS Omnibus poll (n=136). To efficiently obtain a sample of lower-income and non-White respondents, the sample also included an oversample of prepaid (pay-as-you-go) telephone numbers (25% of the cell phone sample consisted of prepaid numbers) as well as a subsample of respondents who had previously completed Spanish language interviews on the SSRS Omnibus poll (n=11). Both the random digit dial landline and cell phone samples were provided by Marketing Systems Group (MSG).

Computer-assisted telephone interviews conducted by landline (464) and cell phone (976, including 662 who had no landline telephone) were carried out in English and Spanish by SSRS of Glen Mills, PA. For the landline sample, respondents were selected by asking for the youngest adult male or female currently at home based on a random rotation. If no one of that gender was available, interviewers asked to speak with the youngest adult of the opposite gender. For the cell phone sample, interviews were conducted with the adult who answered the phone. KFF paid for all costs associated with the survey with additional funding for the over-sample provided by the John Hopkins’ Bloomberg School of Public Health.

The combined landline and cell phone sample was weighted to balance the sample demographics to match estimates for the national population using data from the Census Bureau’s 2017 American Community Survey (ACS) on sex, age, education, race, Hispanic origin, and region along with data from the 2010 Census on population density. The sample was also weighted to match current patterns of telephone use using data from the January-June 2018 National Health Interview Survey. The weight takes into account the fact that respondents with both a landline and cell phone have a higher probability of selection in the combined sample and also adjusts for the household size for the landline sample, and design modifications, namely, the oversampling of prepaid cell phones and likelihood of non-response for the re-contacted sample. To ensure accurate representation of the older population, the data were weighted separately for those younger than 65 and those 65 or older. All statistical tests of significance account for the effect of weighting.

The margin of sampling error including the design effect for the full sample is plus or minus 3 percentage points. Numbers of respondents and margins of sampling error for key subgroups are shown in the table below. For results based on other subgroups, the margin of sampling error may be higher. Sample sizes and margins of sampling error for other subgroups are available by request. Note that sampling error is only one of many potential sources of error in this or any other public opinion poll. Kaiser Family Foundation public opinion and survey research is a charter member of the Transparency Initiative of the American Association for Public Opinion Research.

GroupN (unweighted)M.O.S.E.
Total1,440±3 percentage points
Adults who currently take prescription medicine1030±4 percentage points
Adults with prescription drug plans1092±4 percentage points
Democrats473±6 percentage points
Republicans410±6 percentage points
Independents397±6 percentage points
Adults, 65 and older606±5 percentage points
Adults, 65 or older, with prescription drug plan513±5 percentage points


Endnotes

  1. Another analysis conducted by the Kaiser Family Foundation of Medicare Part D enrollment data finds about three-fourths of older adults are Part D enrollees (72%), but some older adults may have other sources of drug coverage, such as retiree health benefits or coverage through the Veterans Administration. ↩︎
News Release

As Policymakers Debate Medicare-for-All, Analysis Finds the Medicare Advantage, Individual and Group Health Insurance Markets Appear to Be Profitable, Especially Medicare Advantage

Published: Aug 5, 2019

Three key private health insurance markets — Medicare Advantage, the individual market and the fully-insured group market — appear to be financially healthy and attractive to insurers, according to a new KFF analysis. The private Medicare Advantage market generates significantly larger gross margins per person than the individual market or fully-insured market, the analysis finds. The future of these markets has become a focus for policymakers amid the debate over Medicare for All. Some proposals would essentially eliminate private health insurance, while others would retain a role for it but create a new public program to promote affordability and expanded coverage.  Some of these proposals would allow insurers to contract with the federal government’s public option to provide coverage, modeled on the Medicare Advantage program, in which plans are paid by the federal government. The analysis finds that private insurers achieved annual gross margins of $1,608 per person in Medicare Advantage, on average, between 2016 and 2018, about double the average gross margins in the individual market ($779) and group market ($855). The ACA-compliant individual market was marked by volatility in the early years of the exchanges, with insurers initially setting premiums too low before the market stabilized and insurers returned to pre-ACA profitability levels in 2018 following substantial premium increases. When aggregated across all plans in this analysis for 2016 to 2018, total gross margins averaged $23.9 billion per year for the Medicare Advantage market, $26.5 billion per year for the fully-insured group market and $10.6 billion per year for the much smaller individual market.

Medical loss ratios – medical expenses paid by insurers as a share of the total premiums collected – are similar across all three markets.  But gross margins are much higher for Medicare Advantage insurers because both medical expenses and premiums paid to Medicare Advantage plans are substantially higher, since Medicare enrollees tend to use more health care than people in the individual and group markets. Medicare Advantage plans cover 22 million beneficiaries. Plans purchased by individuals and families in the individual market, including the Affordable Care Act marketplaces in which subsidies are available to some, cover roughly 15 million people. The fully insured group market for employers and their employees, which gets tax-preferred treatment, serves over 30 million people (though most workers are covered through self-insured employer plans). For more analysis of Medicare, private insurance and Medicare for All proposals, visit kff.org.