
Key Facts About Health Care Affordability for People With Medicare
Health care costs and affordability recently topped the public’s list of economic anxieties in the U.S., according to KFF polling. Even people with insurance say they struggle to afford health care costs, including people with Medicare. While Medicare provides health insurance coverage to 70 million people age 65 or older and younger adults with long-term disabilities, having Medicare coverage does not insulate beneficiaries from health-related affordability challenges, such as not getting needed medical care due to costs or incurring medical debt. In a 2026 KFF Health Tracking Poll, half (49%) of all Medicare beneficiaries ages 65 and older say they expect their health care costs to become less affordable in the next year.
This brief presents key facts and analysis about affordability of health care costs among people with Medicare, including younger adults with long-term disabilities, drawing on data from various sources (see methods for additional information).
Many Medicare Beneficiaries Have Low Incomes and Modest Savings, Which Can Make It Hard To Afford Medical and Long-Term Care Services
- One in four Medicare beneficiaries (16.5 million people) had income below $24,600 per person in 2024, or about 160% of the federal poverty level that year (Figure 1). These estimates take into account income from Social Security, pensions, retirement account (IRA) withdrawals, and other sources. At the upper end of the income spectrum, the top 5% of Medicare beneficiaries (3.3 million people) had incomes above $169,700 per person. Many beneficiaries also have relatively low levels of savings, with one in four Medicare beneficiaries having savings below $18,950 per person in 2024. Financial resources are even lower among some subgroups of beneficiaries, including Black and Hispanic beneficiaries. For example, one in four Black beneficiaries had income below $20,150 per person in 2024, while one in four Hispanic beneficiaries had income below $14,150 per person.
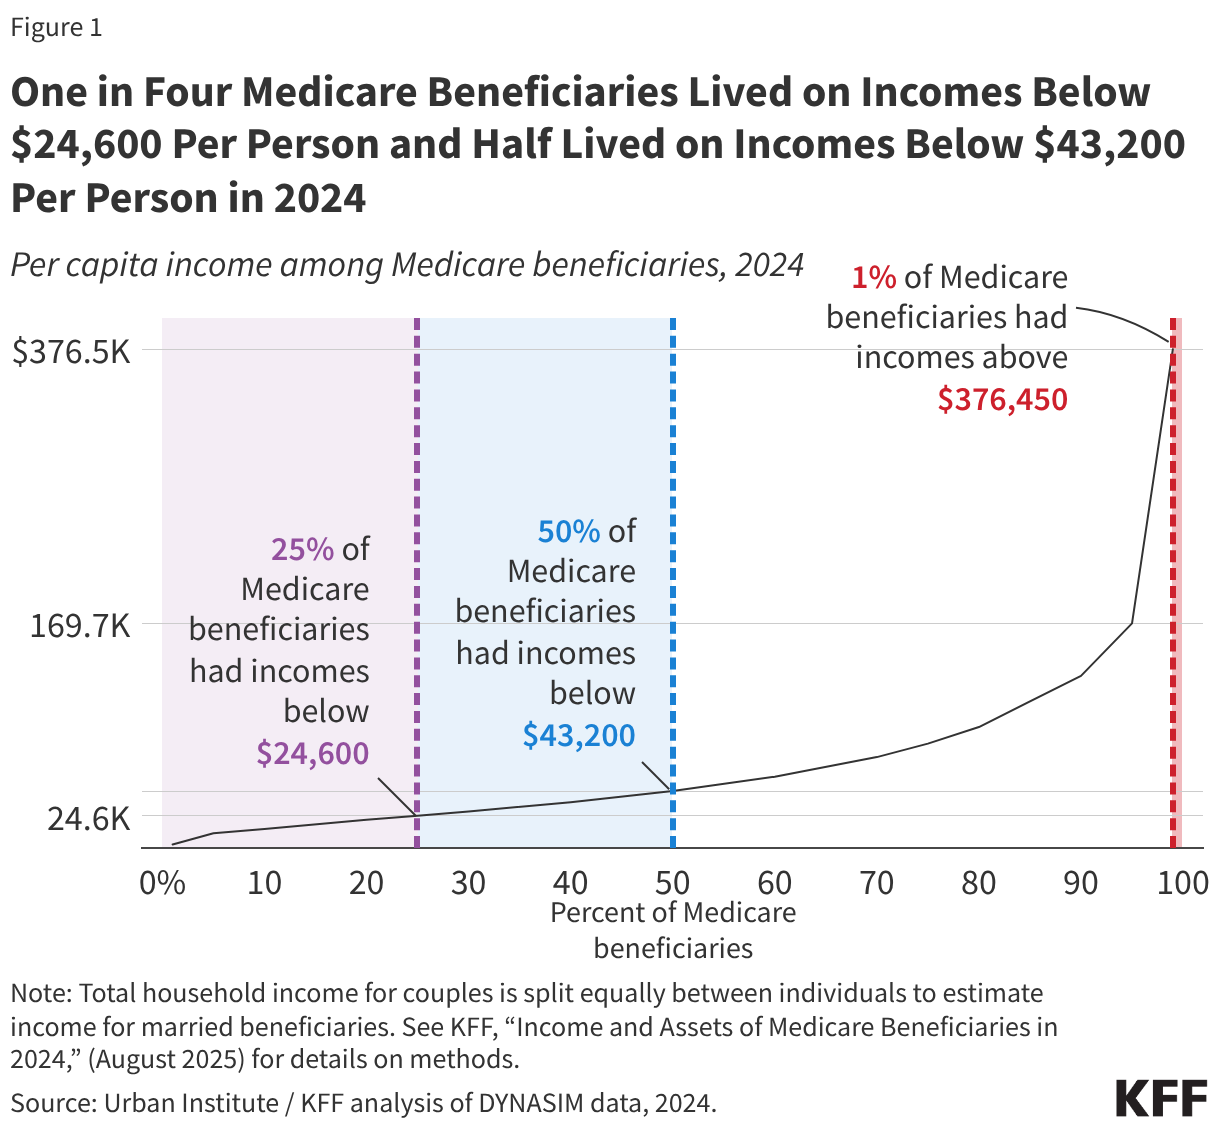
- About 6 million people ages 65 and older (10%) were living in poverty in 2024 under the official poverty measure, meaning they had income of $15,050 or less that year (if single), while 17.3 million (28%) had incomes below 200% of poverty. Poverty rates among older adults are higher under an alternative measure (the supplemental poverty measure, or SPM) that accounts for certain expenses that are higher among older people, including out-of-pocket medical expenses, with 15% of older adults living in poverty in 2024 under the SPM.
- In 2025, nearly a quarter (23%) of all Medicare beneficiaries who received Social Security benefits relied on Social Security income for 90% or more of their total per capita income, while about one-third (32%) relied on Social Security for at least 75% of their income (Figure 2). In 2025, the average per capita Social Security income was $20,168 among those who depended on Social Security for at least 90% of their income and $20,670 among those who depended on Social Security for at least 75% of their income.
Medicare Premiums and Other Health Expenses Consume a Sizeable Portion of Income and Household Budgets for People With Medicare
- Out-of-pocket health care spending for Medicare premiums and out-of-pocket costs for health care services accounted for 36% of Medicare beneficiaries’ average Social Security income per person in 2023 (Figure 3). In 2023, Medicare beneficiaries spent an average of $6,459 out of pocket on health care costs and had average Social Security income of $17,718 (though most older adults have other sources of income beyond Social Security that can be used to pay their out-of-pocket health care costs). Out-of-pocket spending includes premiums for Medicare supplemental coverage (Medigap) for those who enroll in traditional Medicare and buy private supplemental insurance.
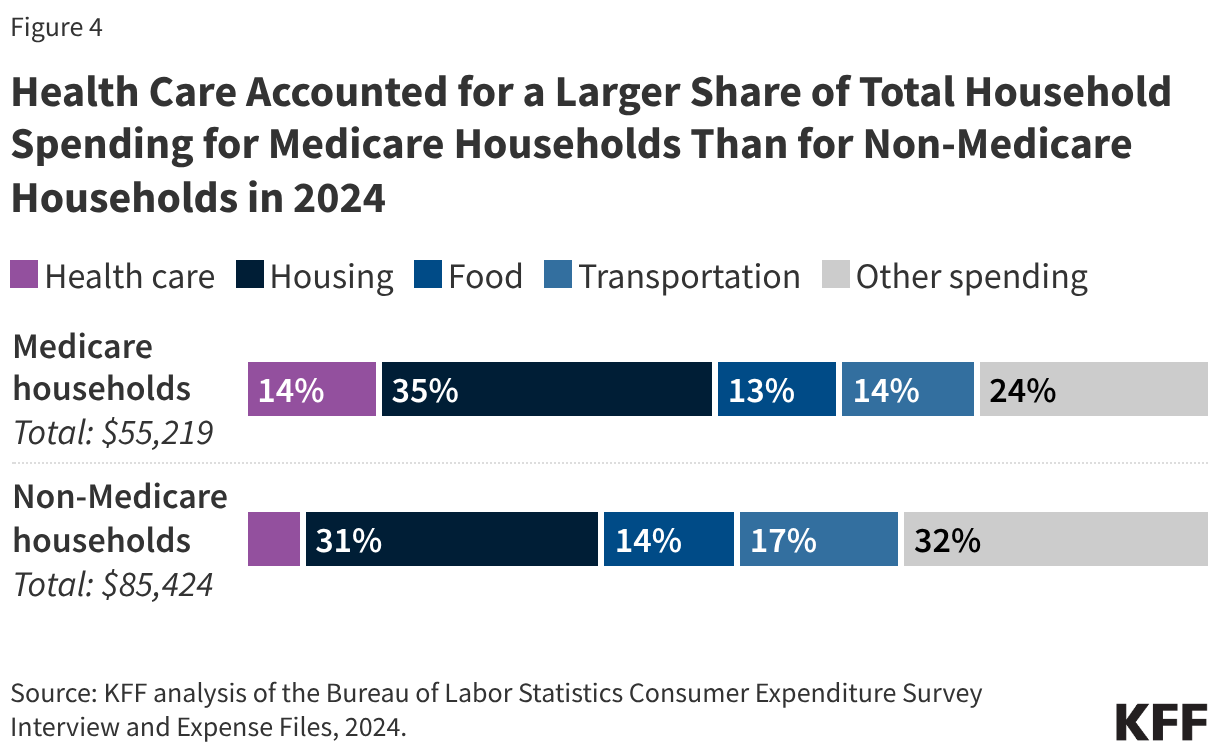
- Health care spending accounted for 14% of Medicare beneficiaries’ total household spending in 2024. Medicare households spent a larger share of their total household spending on health care than non-Medicare households in 2024 (6%) (Figure 4).
- More than 7 million Medicare beneficiaries enrolled in Medicare Part B in 2024 spent more than 10% of their annual per capita income on Part B premiums alone. The standard Part B premium is paid by beneficiaries in both traditional Medicare and Medicare Advantage and has roughly doubled in the last decade, from an annual amount of $1,259 in 2015 to $2,435 in 2026.
The Choice Between Traditional Medicare and Medicare Advantage Has Cost Implications for Beneficiaries
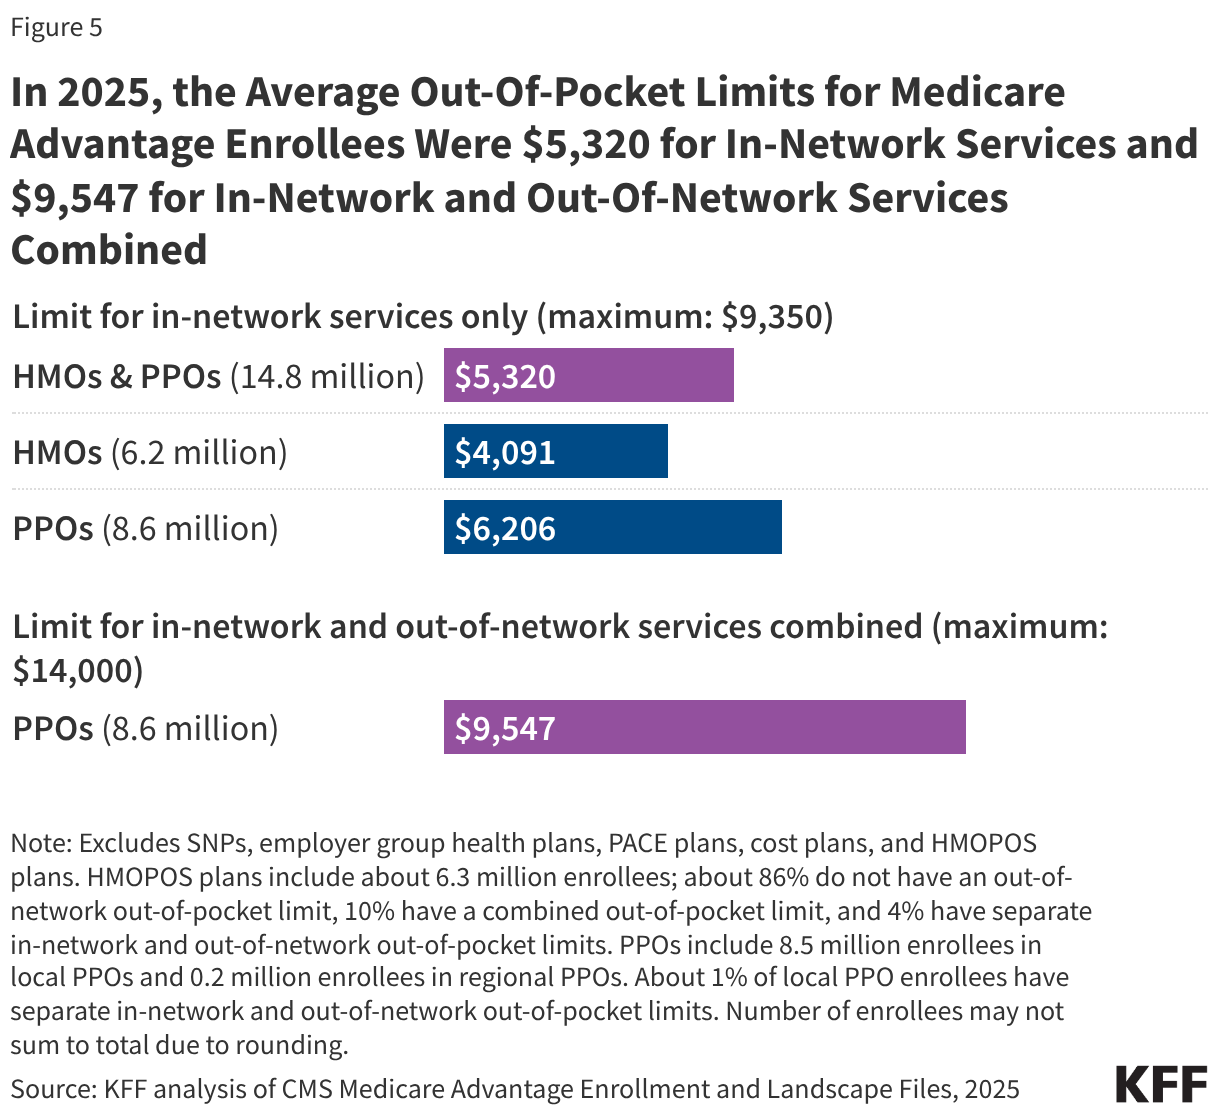
- Out-of-pocket spending for Medicare-covered hospital and physician services is not capped in traditional Medicare, while Medicare Advantage plans are required by law to provide an out-of-pocket limit for these services. In 2025, the average out-of-pocket limit for Medicare Advantage enrollees was $5,320 for in-network services and $9,547 for in-network and out-of-network services combined. The maximum allowed limits were $9,350 for in-network services and $14,000 for in-network and out-of-network services combined in 2025, and increased to $9,250 and $13,900, respectively, in 2026. (Figure 5). This cap protects Medicare Advantage enrollees from unlimited health care costs for Medicare-covered services, but cost-sharing requirements can lead to high out-of-pocket expenses before reaching a plan’s annual limit. People enrolled in Medicare Advantage plans typically pay no additional premium.
- Medicare Advantage plans can reduce cost sharing, offer benefits not covered under traditional Medicare (such as dental and vision services), and lower Part B and Part D premiums, using extra payments they receive from the federal government beyond the cost of providing Part A and Part B services. In 2026, these extra payments (known as rebates) amounted to about $2,660 per person on average in 2026. For Medicare-covered services under Part A and Part B, Medicare Advantage plans can charge different amounts than what someone in traditional Medicare would pay, though they often reduce cost sharing for Medicare-covered benefits, and they are prohibited from charging more for certain services, such as Skilled Nursing Facility (SNF) stays. Plans are required to provide coverage that is at least as generous overall as traditional Medicare, even though what enrollees pay out of pocket can vary depending on the type of plan, the type and quantity of services they use, and whether they see a provider that participates in the plan’s network.
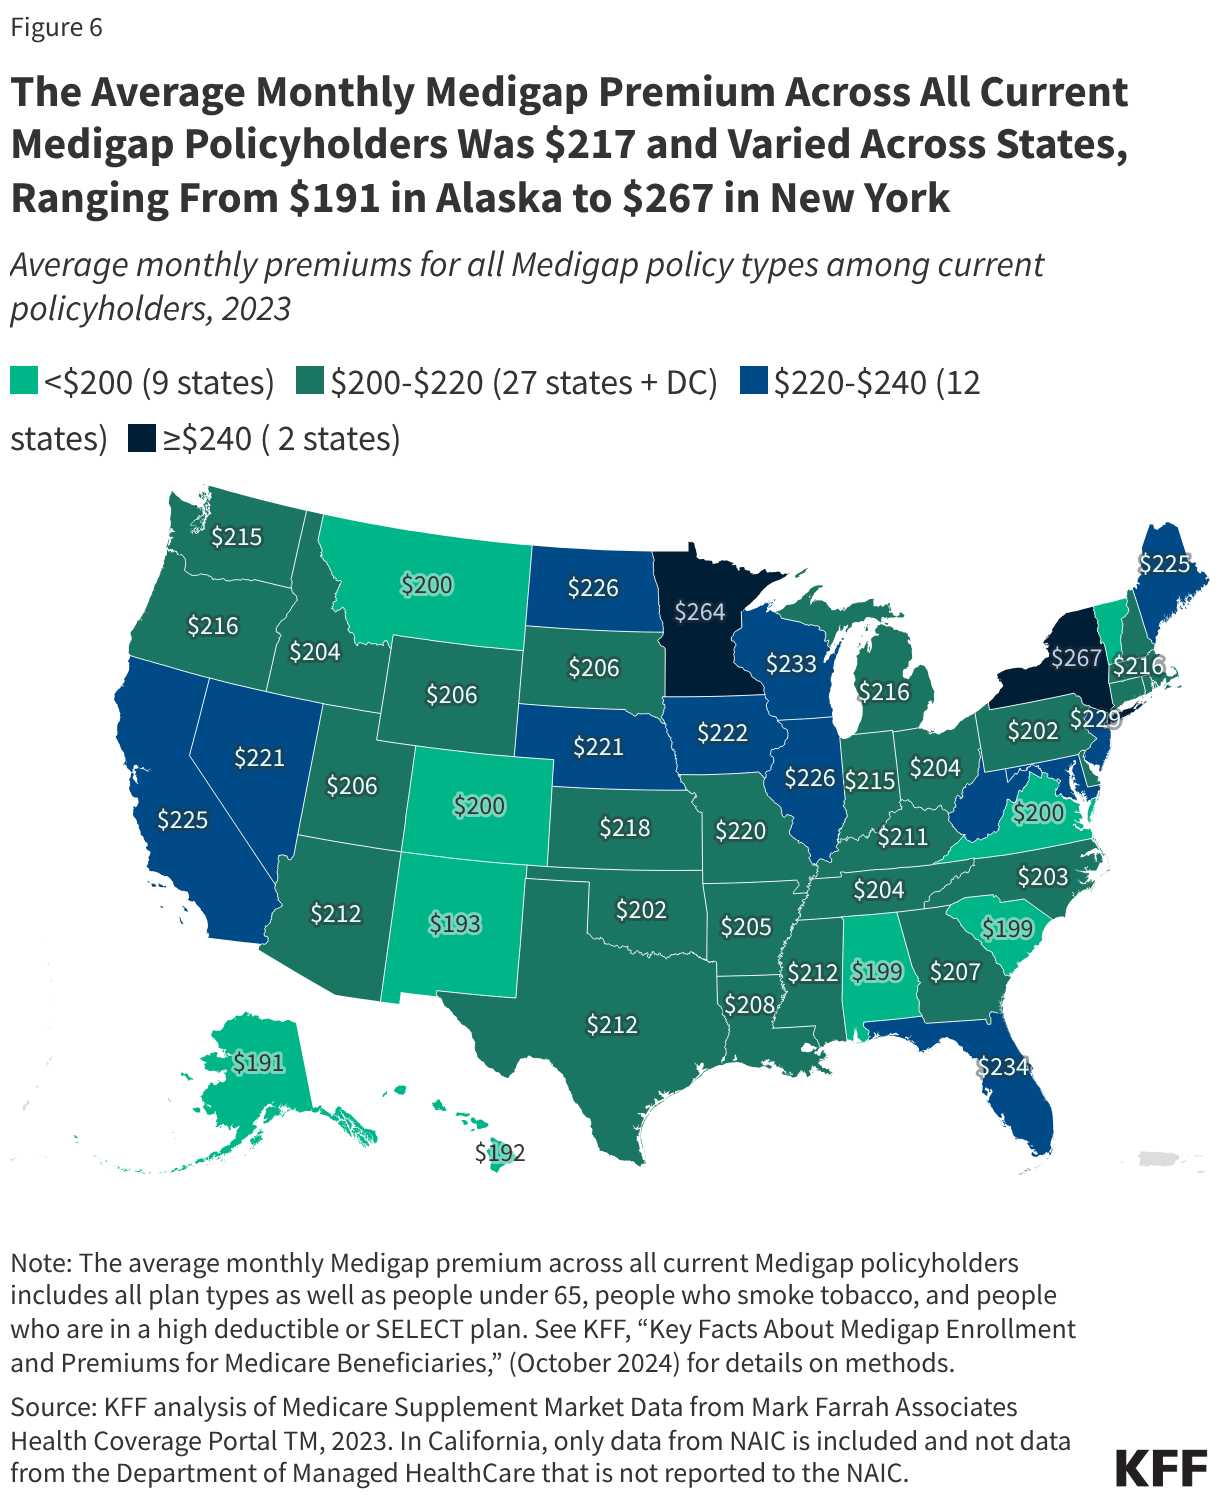
- Medigap limits traditional Medicare beneficiaries’ exposure to out-of-pocket medical costs, and the most popular Medigap policies cover virtually all cost sharing for Medicare-covered services. However, Medigap underwriting rules make these policies difficult, if not impossible, for beneficiaries with pre-existing conditions to obtain outside of limited enrollment opportunities. For beneficiaries with modest incomes, the monthly Medigap premium ($217 per month, on average, in 2023) could be unaffordable (Figure 6).
- More than 3 million Medicare beneficiaries in traditional Medicare have no additional coverage that helps with Medicare cost-sharing requirements, such as Medigap, employer coverage, or Medicaid. This leaves them at risk of facing high out-of-pocket costs if they need a lot of medical services, or high-cost services, because there is no limit on out-of-pocket spending for Parts A and B in traditional Medicare.
Paying for Health Care, Including for Services Not Covered by Medicare, Can Be a Financial Burden
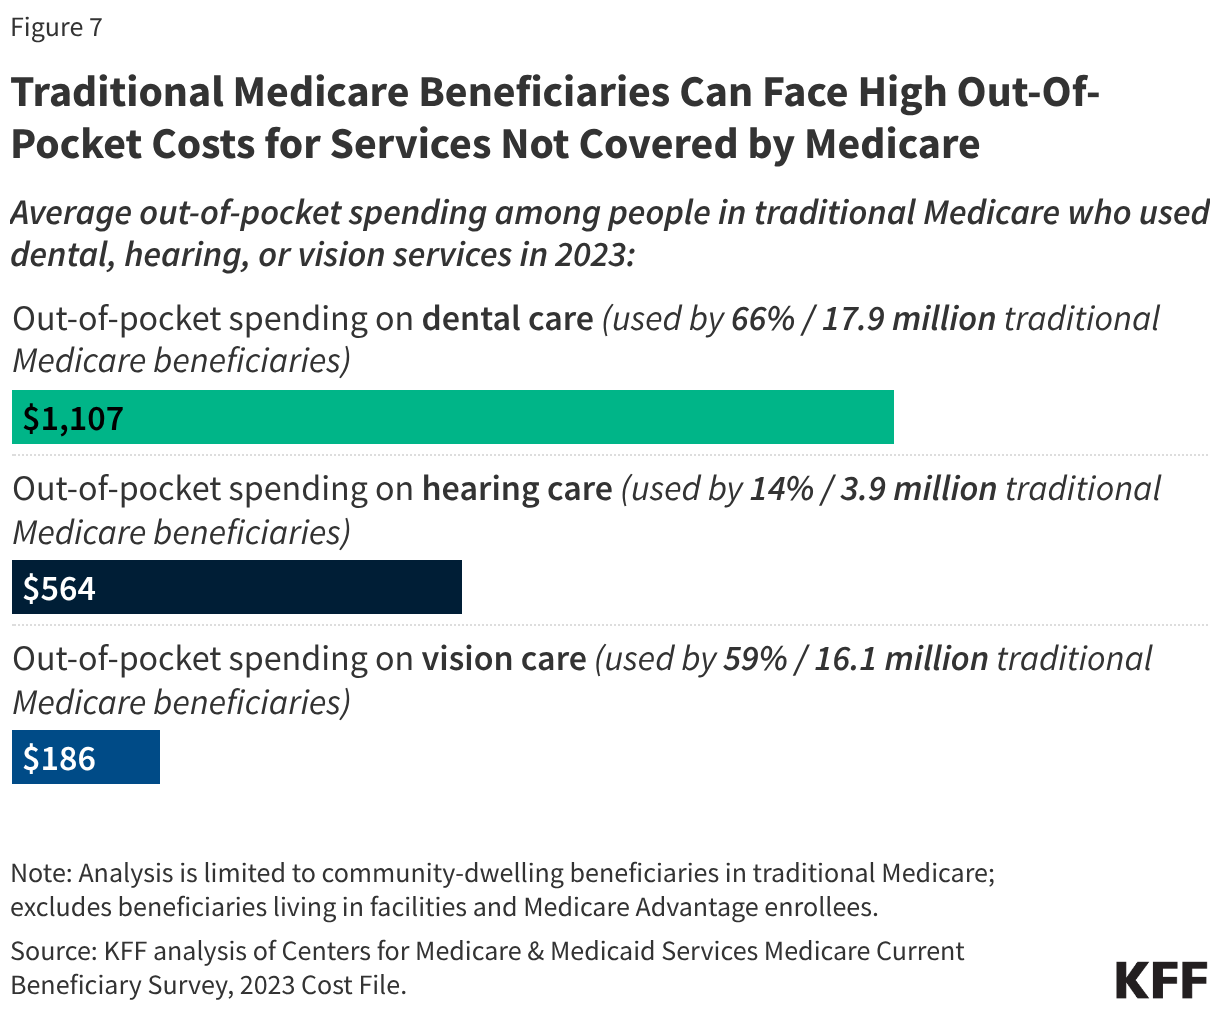
- Medicare beneficiaries can face high out-of-pocket costs for dental, hearing, and vision care services, which are not covered under traditional Medicare (Figure 7). In 2023, traditional Medicare beneficiaries spent $1,107 on dental services and $564 on hearing services, on average (Figure 7). While most Medicare Advantage plans cover dental, hearing, and vision benefits, Medicare Advantage enrollees also face out-of-pocket costs for these services, spending an average of $571 on dental services and $212 on hearing services.
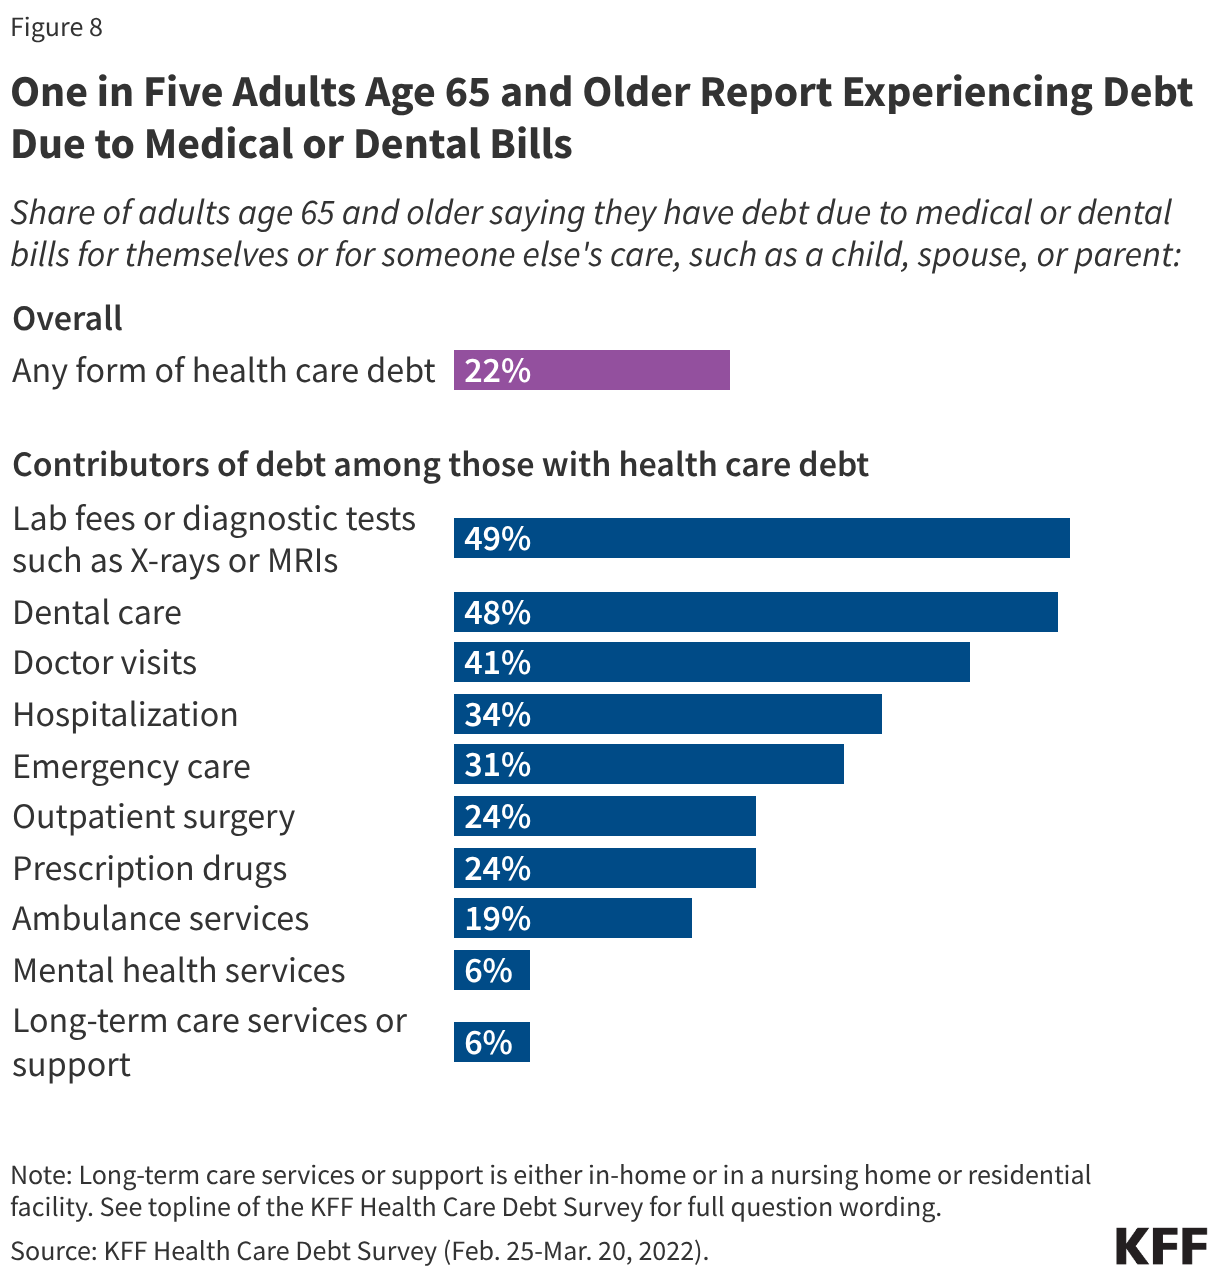
- About one in five (22%) Medicare-age adults reported having some type of debt as a result of medical or dental bills in 2022 (Figure 8). Among older adults with medical debt, about 4 in 10 say they cut back on other household spending and used up or all or most of their savings as a result of their health care debt.
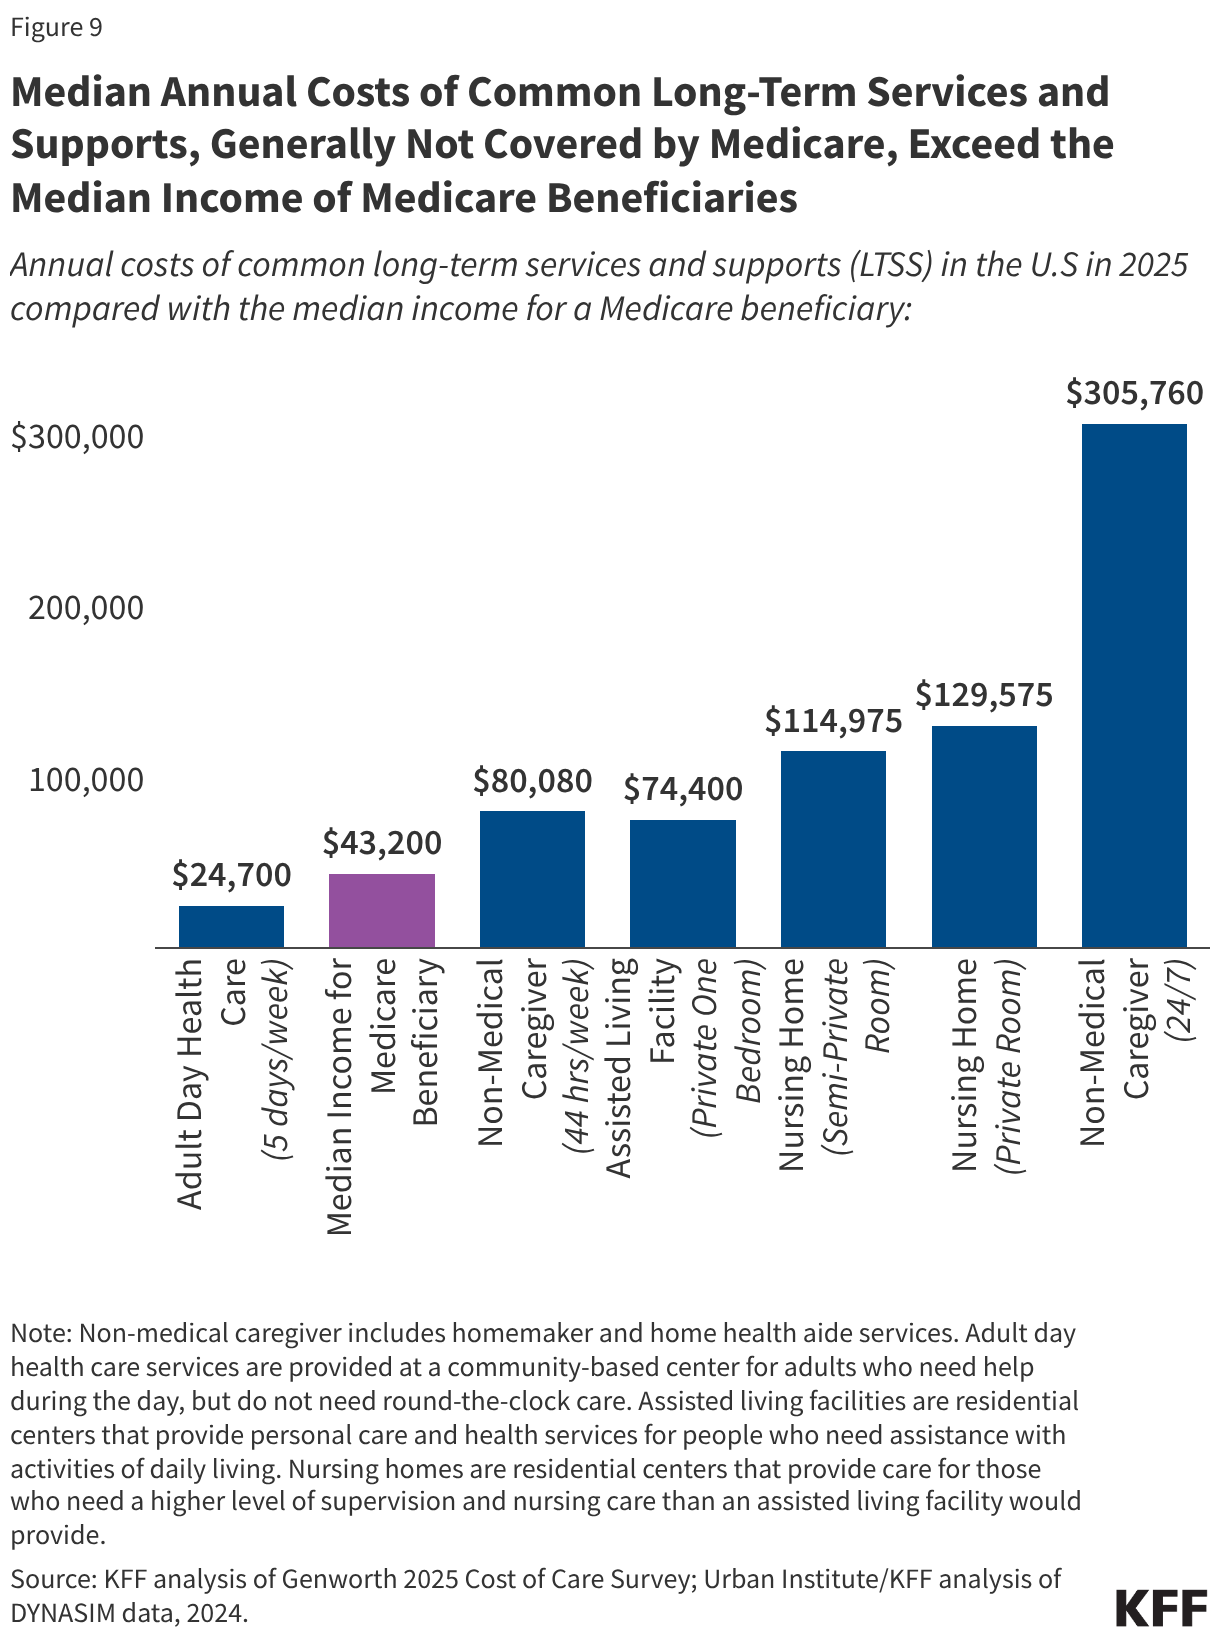
- Long-term services and supports, which are not covered by Medicare, are unaffordable for all but the highest-income Medicare beneficiaries. In 2025, the median annual costs of common long-term services and supports in the U.S were $80,080 for full-time non-medical caregiver services (including home health aide and homemaker services for people who need help with instrumental activities of daily living such as preparing meals and doing laundry), $129,575 for a private room in a nursing home, and $305,760 for round-the-clock home health aide services (Figure 9). These costs greatly surpass median income ($43,200) and savings ($110,100) among people with Medicare. Long-term care services are generally not covered by Medicare, regardless of whether a beneficiary is enrolled in traditional Medicare or Medicare Advantage.
Medicaid Helps Make Medicare Affordable for About 12 Million Low-Income Medicare Beneficiaries
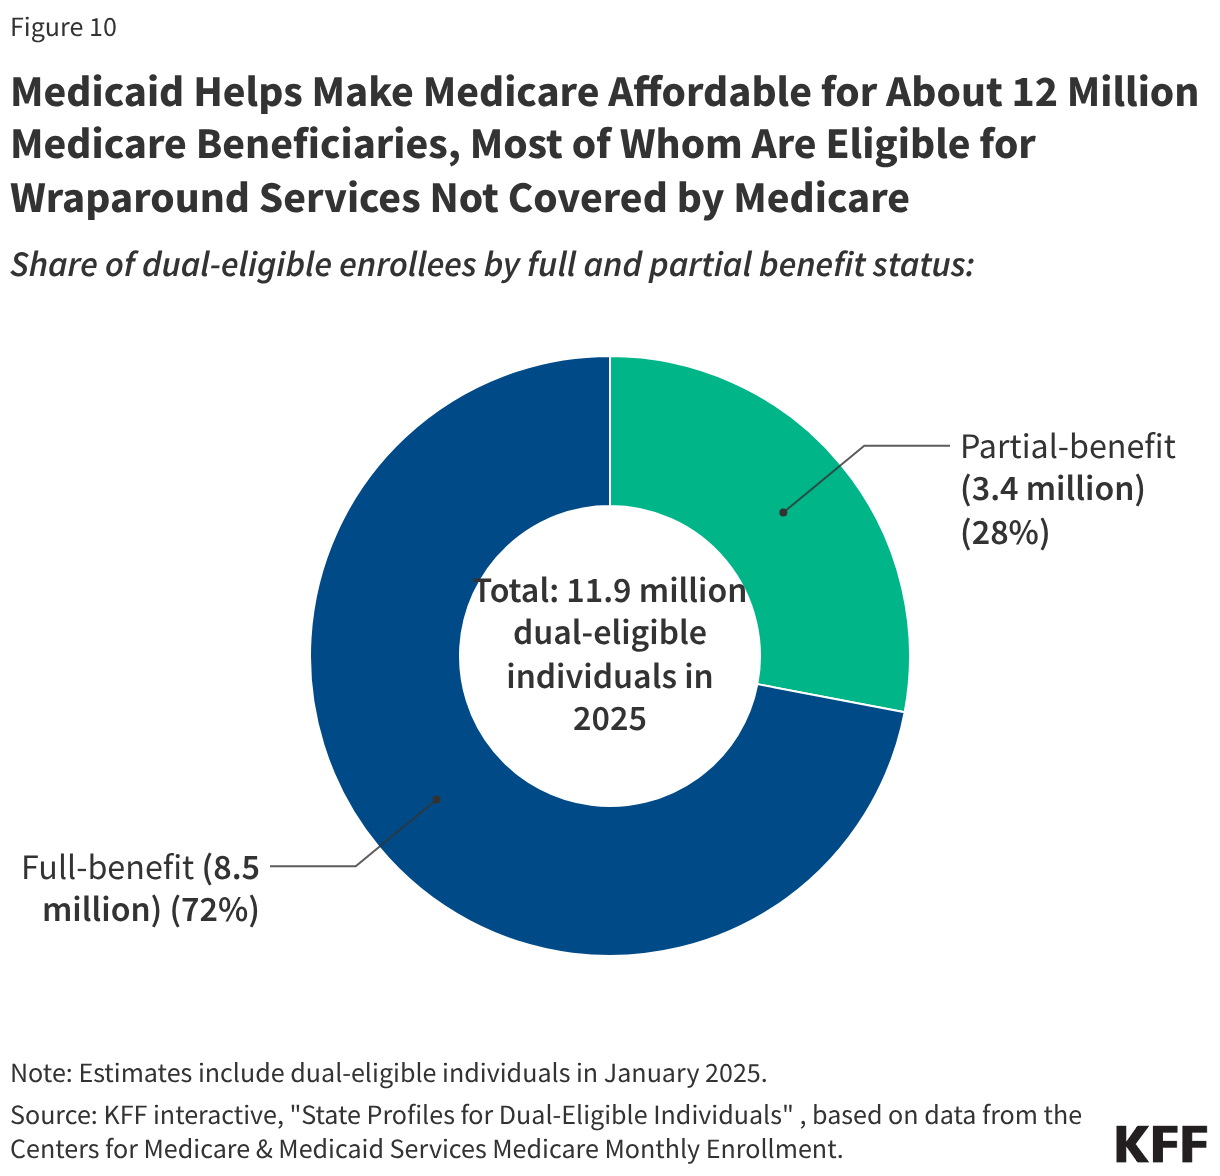
- In 2025, about 12 million people with Medicare also had Medicaid coverage (“dual-eligible individuals”).
- More than seven in ten (72%) dual-eligible individuals, or 8.5 million people, are eligible for the full range of Medicaid benefits not otherwise covered by Medicare, including long-term services and supports, vision and dental services, and non-emergency medical transportation (also known as wraparound services) (Figure 10).These “full-benefit” dual-eligible individuals also usually receive additional help through the Medicare Savings Programs (MSPs), which cover Medicare premiums, and in most cases, cost sharing for people with limited income and assets.
- The remaining 3.4 million dual-eligible individuals (“partial-benefit” individuals) do not receive coverage of the full range of Medicaid benefits, but do receive payments to cover Medicare premiums, and, in most cases, cost sharing through the Medicare Savings Programs. Under federal guidelines, Medicare beneficiaries with income up to 135% of the federal poverty line and assets below specified levels ($9,950 for an individual and $14,910 for a couple in 2026) qualify for financial assistance from their state Medicaid program through a Medicare Savings Program. States can choose to cover Medicare beneficiaries with income or assets above the federal limits, and in 2026, 18 states do so. Without financial support from Medicaid, the Part B premium alone would consume 15% of income for a dual-eligible individual with monthly income of $1,350, not including other out-of-pocket costs.
Medicare Part D Offers Protection Against High Out-of-Pocket Prescription Drug Costs, but Prescription Drug Costs Remain a Concern for Older Adults
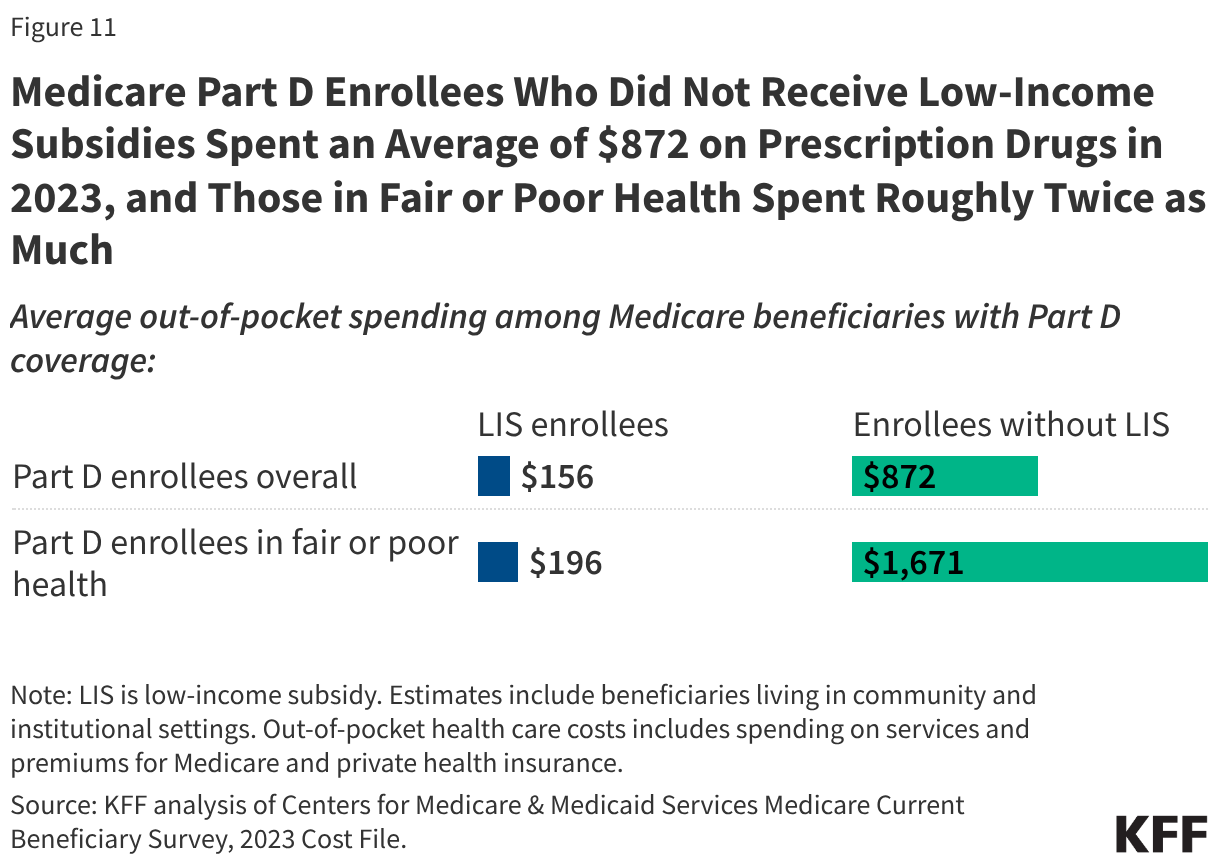
- Virtually all Medicare beneficiaries (96%) use prescription drugs and most are enrolled in Medicare Part D drug plans for prescription drug coverage. On average, Medicare Part D enrollees who did not receive low-income subsidies spent an average of $872 on prescription drugs in 2023, and people in fair or poor health spent roughly twice as much, on average ($1,671) (Figure 11). The Part D low-income subsidy (LIS) provides substantial financial support to income below 150% of poverty (under $23,940 for an individual in 2026) and limited assets (under $18,090 for an individual). Part D enrollees with LIS had average out of pocket drug costs of $156 in 2023, roughly one fifth the amount paid by those without these low-income subsidies.
- Under changes made by the Inflation Reduction Act, Part D enrollees have a cap on out-of-pocket drug spending equal to $2,100 in 2026. Prior to this change, enrollees could have faced several thousand dollars in out-of-pocket costs for expensive medications each year. The Inflation Reduction Act also includes other changes that make prescription drugs more affordable for people with Medicare, including a $35 monthly cap on insulin, expanded eligibility for full benefits under the Part D Low-Income Subsidy, and $0 cost sharing for adult vaccines under Medicare Part D. Additionally, the law requires the federal government to negotiate lower drug prices for some high-cost drugs covered under Medicare through the Medicare Drug Price Negotiation Program.
- Even with a cap on overall out-of-pocket costs, prescription drug costs are a concern for Medicare beneficiaries, with half (50%) of Medicare beneficiaries age 65 and older worried about being able to afford prescription drugs for themselves or their family in 2026, according to a March 2026 KFF health tracking poll.
The Growth in Medicare Spending Will Lead to Higher Medicare Premiums, Deductibles, and Copayments Over Time
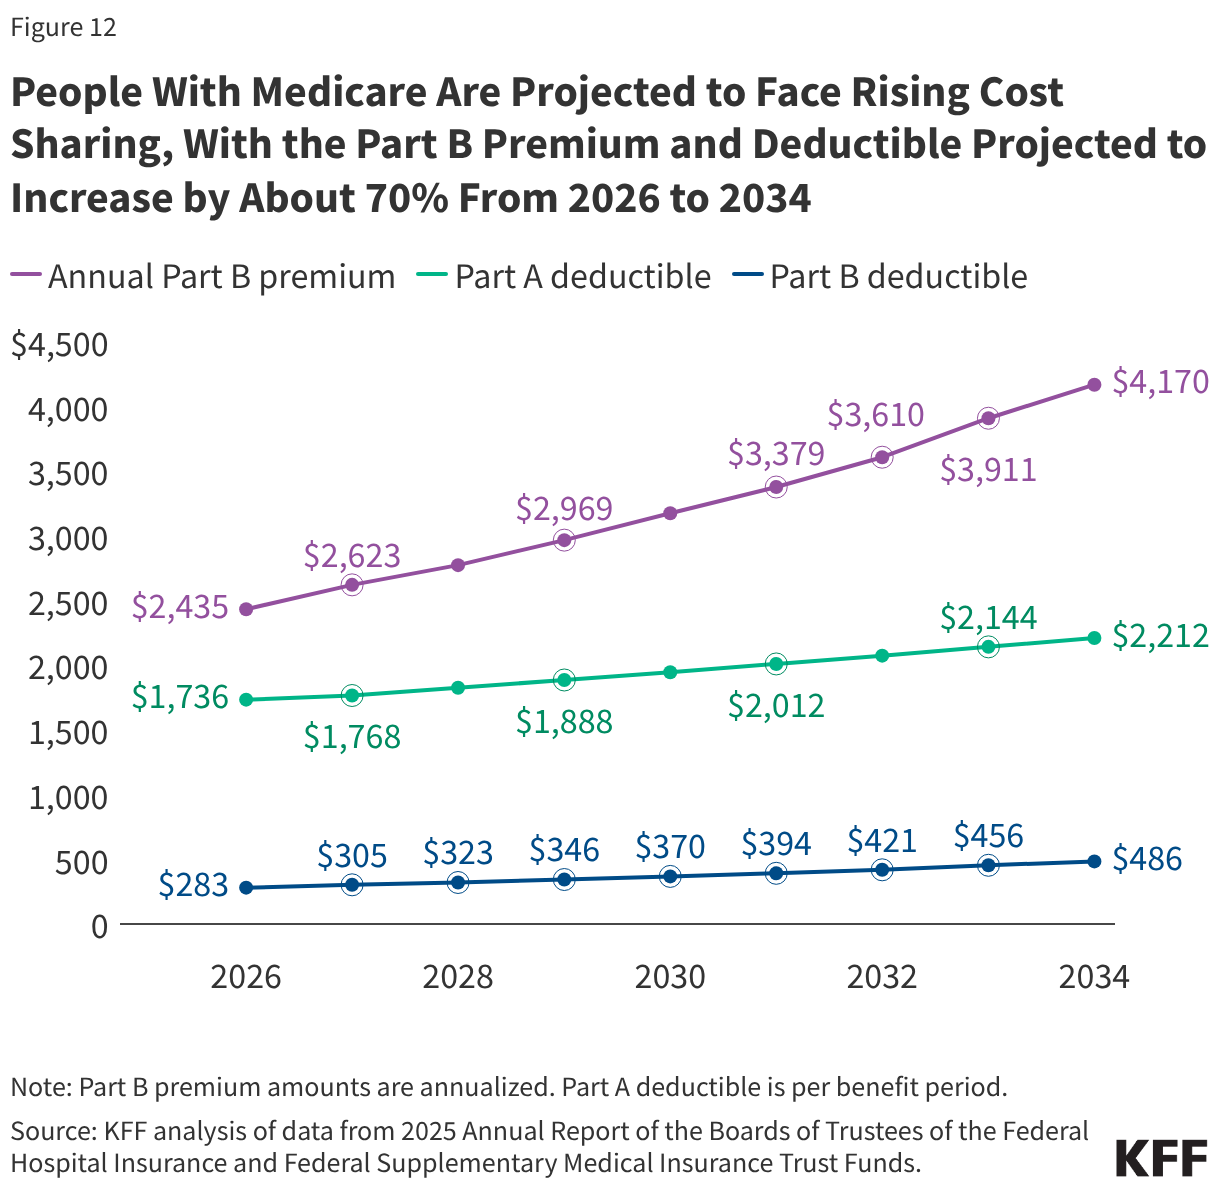
- People with Medicare will face higher premiums and other out-of-pocket costs for Medicare benefits over time since Medicare premiums and deductibles are directly tied to increases in spending on Medicare-covered services. Higher Medicare spending is driven in part by rising prices, higher utilization, and growth in spending on Medicare Advantage. Between 2026 and 2034, the Medicare Part B premium and deductible are projected to increase by roughly 70%—from $2,435 to $4,170 for the Part B premium (annualized) and from $283 to $486 for the Part B deductible, while the Part A deductible is projected to grow by about 30% (from $1,736 to $2,212) (Figure 12).
- Rising Medicare premiums and cost sharing will consume a growing portion of Medicare beneficiaries’ financial resources. On average, premiums and cost sharing for Medicare Part B and Part D accounted for 25% of the average Social Security benefit in 2025, and this share is projected to increase to 33% in 2040. Including other premium and cost-sharing amounts would increase these shares even further, though as noted earlier most older adults can tap other sources of income beyond Social Security to pay for health care expenses.
Methods
This brief draws on data from various sources. Data on income and savings of Medicare beneficiaries, including the share of beneficiaries who relied on Social Security for at 75% or 90% or more of their total per capita income and the number of Medicare beneficiaries who spent more than 10% of their annual per capita income on Part B premiums, are drawn from the Urban Institute’s Dynamic Simulation of Income Model (DYNASIM4). See Methods of KFF, “Income and Assets of Medicare Beneficiaries in 2024” (August 2025) for more details.
Data on out-of-pocket health care spending are from the Centers for Medicare & Medicaid Services (CMS) Medicare Current Beneficiary Survey, 2023 Cost Supplement File (the most recent year of data available). For the analysis on average out-of-pocket spending as a share of average per capita Social Security income, see the methods of KFF, “Health Costs Consume a Large Portion of Income for Millions of People with Medicare” (August 2025) for more details.
The 2024 Consumer Expenditure Survey (CE) by the Bureau of Labor Statistics is used to assess the financial burden of health care spending among households where all members are covered by Medicare (referred to as Medicare households) compared to households where no members are covered by Medicare (referred to as non-Medicare households). The CE is a survey of households (“consumer units”), excluding people residing in institutions such as long-term care facilities. The estimates presented in this analysis are averages for demographic groups of consumer units, not per capita estimates, and thus are not comparable to estimates based on other surveys that report per capita estimates, such as out-of-pocket health care spending reported in the Medicare Current Beneficiary Survey.
Estimates of Medigap premiums are based on KFF analysis of Medicare Supplement Market Data from Mark Farrah Associates Health Coverage Portal TM, 2023. See methods of KFF, “Key Facts About Medigap Enrollment and Premiums for Medicare Beneficiaries” (October 2024) for more details.
Data on annual Medicare premiums, deductibles, and other cost sharing over time are based on KFF analysis of the 2025 Annual Report of the Boards of Trustees of the Federal Hospital Insurance and Federal Supplementary Medical Insurance Trust Funds.
This work was supported in part by The John A. Hartford Foundation. KFF maintains full editorial control over all of its policy analysis, polling, and journalism activities.